An Open Standards Framework for Synoptic Evaluations of the Mohawk Watershed With examples in the Upper Schoharie Watershed Ricardo Lopez‐Torrijos Timothy Bondelid Fifth Mohawk Watershed Symposium Union College, April 22, 2013
An Open Standards Framework for Synoptic …minerva.union.edu/garverj/mws/2013/presentations/Lopez...Framework We then use the flowline ComID to assign a line color and thickness according
An Open Standards Framework for Synoptic Evaluations of the Mohawk
WatershedWith examples in the Upper Schoharie Watershed
Ricardo Lopez‐TorrijosTimothy Bondelid
Fifth Mohawk Watershed SymposiumUnion College, April 22, 2013
Presenter
Presentation Notes
See accompanying abstract in the Symposium proceedings: R. Lopez-Torrijos and T. Bondelid, An Open Standards Framework For Synoptic Evaluations Of The Mohawk Watershed: With Examples In The Upper Schoharie Watershed, in Cockburn, J.M.H. and Garver, J.I., Proceedings of the 2013 Mohawk Watershed Symposium, Union College, Schenectady, NY, March 22, 2013, pp. 35-39. Online at http://minerva.union.edu/garverj/mws/2013/MWS_2013_Abstract_Volume.pdf.
Context
NYCDEP funded project to develop lidar‐derived NHD, DEM, NHDPlus in the NYCW.
New baseline dataset, development of applications in modeling, land & stream management…
CasaAlbaConsulting 3/2013 2Mohawk Synoptic Evaluations ‐ A Framework
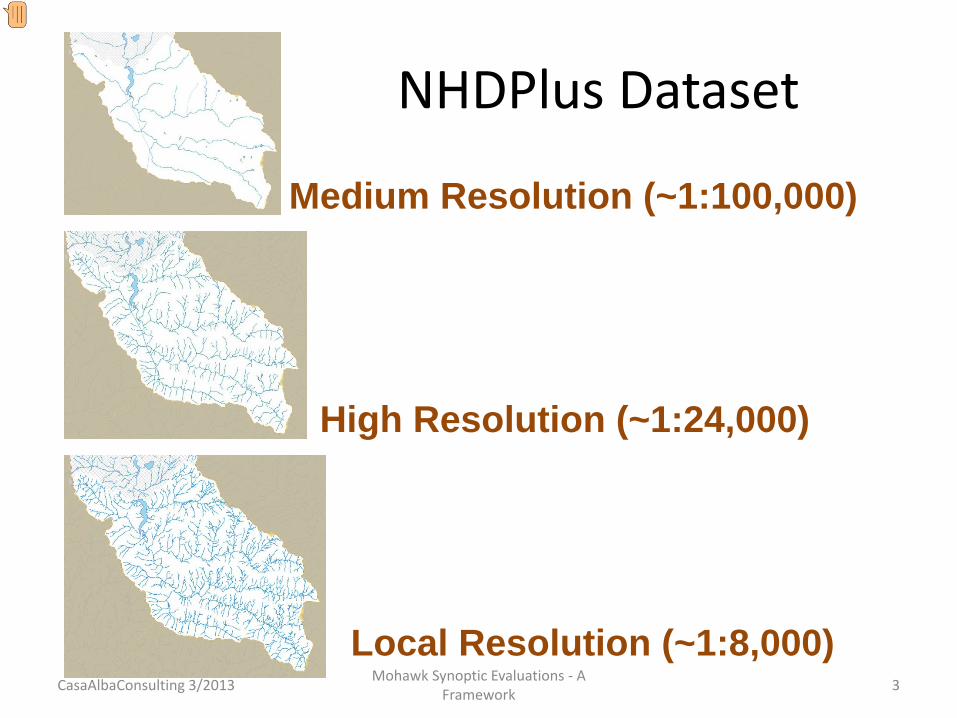
Medium Resolution (~1:100,000)
High Resolution (~1:24,000)
Local Resolution (~1:8,000)
NHDPlus Dataset
CasaAlbaConsulting 3/2013 3Mohawk Synoptic Evaluations ‐ A Framework
Presenter
Presentation Notes
A multi-resolution framework allows the simplification of the complexity according to the level of analysis. It also provides a framework to support consistency and detect inconsistencies!
Use flow attributes to select desired representation resolution.
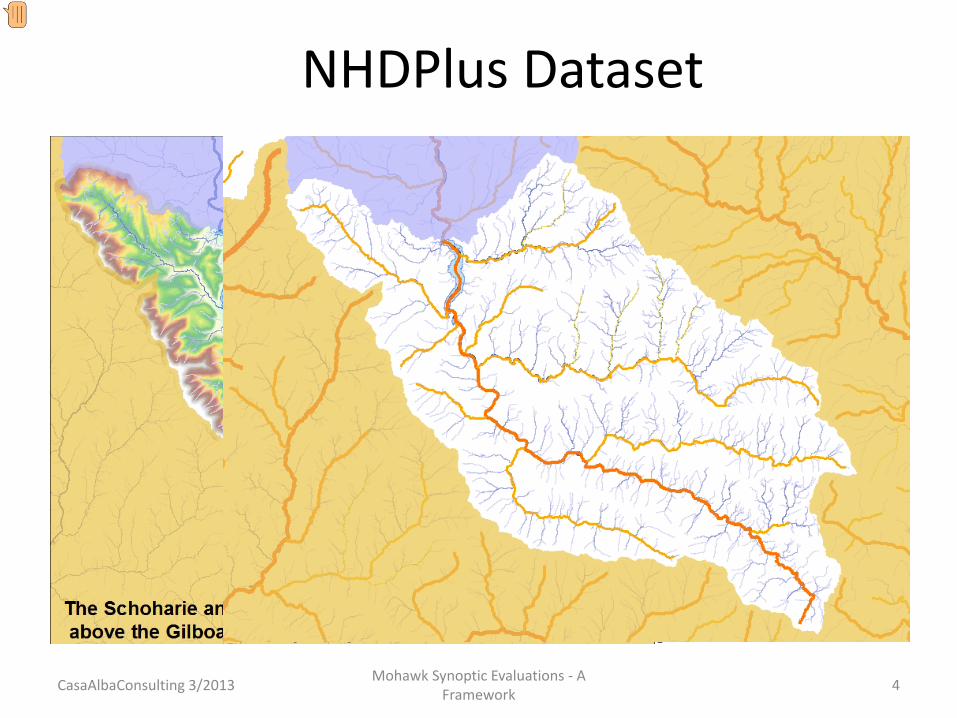
NHDPlus Dataset
CasaAlbaConsulting 3/2013 4Mohawk Synoptic Evaluations ‐ A Framework
Presenter
Presentation Notes
The degree of simplification for the particular model we want to develop in the area of interest, can be controlled by the hydrologic attributes of the dataset. So can the cartographic representation.
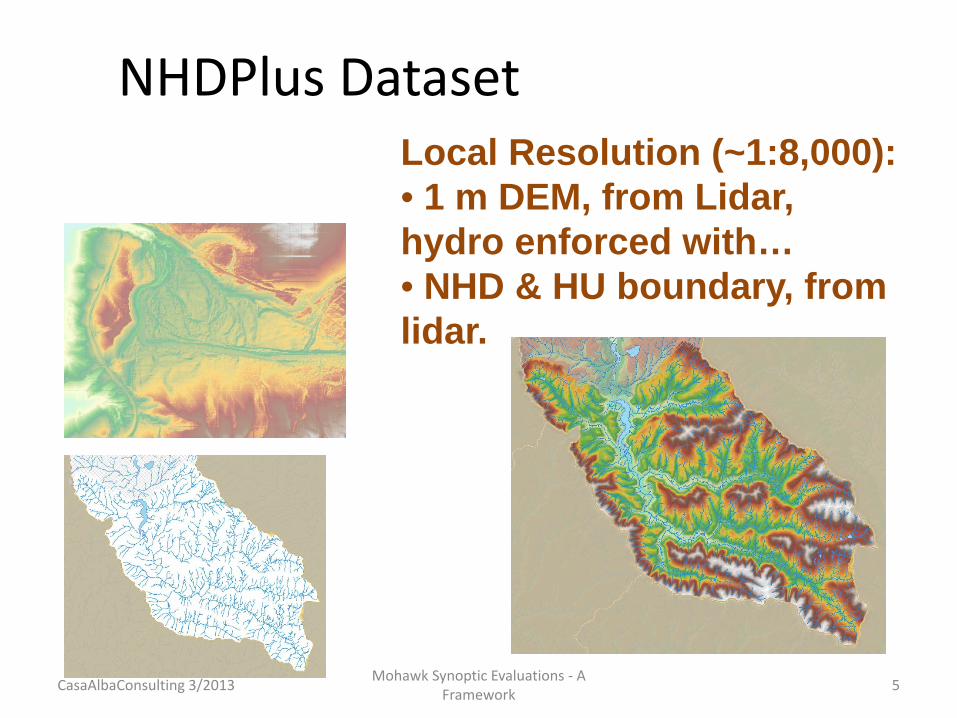
Local Resolution (~1:8,000):• 1 m DEM, from Lidar, hydro enforced with…• NHD & HU boundary, from lidar.
NHDPlus Dataset
CasaAlbaConsulting 3/2013 5Mohawk Synoptic Evaluations ‐ A Framework
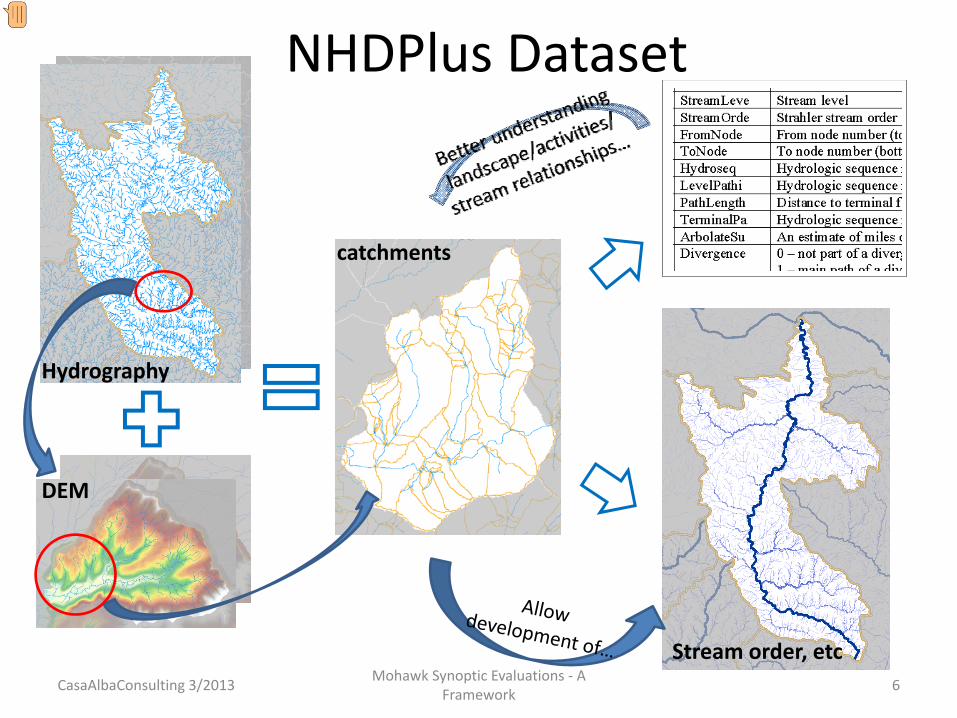
Hydrography
DEM
catchments
Stream order, etc
Streamelevation& slope, etc
NHDPlus Dataset
CasaAlbaConsulting 3/2013 6Mohawk Synoptic Evaluations ‐ A Framework
Presenter
Presentation Notes
For the purposes of this presentation, note that the only ‘GIS’ data of relevance is the catchments: the rest is contained in tables, like the Value Added Attributes, which can therefore be accessed with tools no more complex than a spreadsheet!
Framework? Open Standards?• Complexity• Consistency• Efficiency• Affordability
CasaAlbaConsulting 3/2013 7Mohawk Synoptic Evaluations ‐ A Framework
Presenter
Presentation Notes
Complexity of the landscape, processes, and impacts of our activities on the water resource. Need of consistency among our information, understanding, activity planning and implementation. Both the above are difficult to handle. The framework gives us a common architecture where we can hang representations of our information, understanding, activity planning, implementation and couple them into an adaptive feedback process. Further, to be able to insert the necessary pieces of information into the corresponding processes, the framework needs to be efficient, computationally (spreadsheet vs. GIS) and visually (tabular graphs and 3-D GIS).
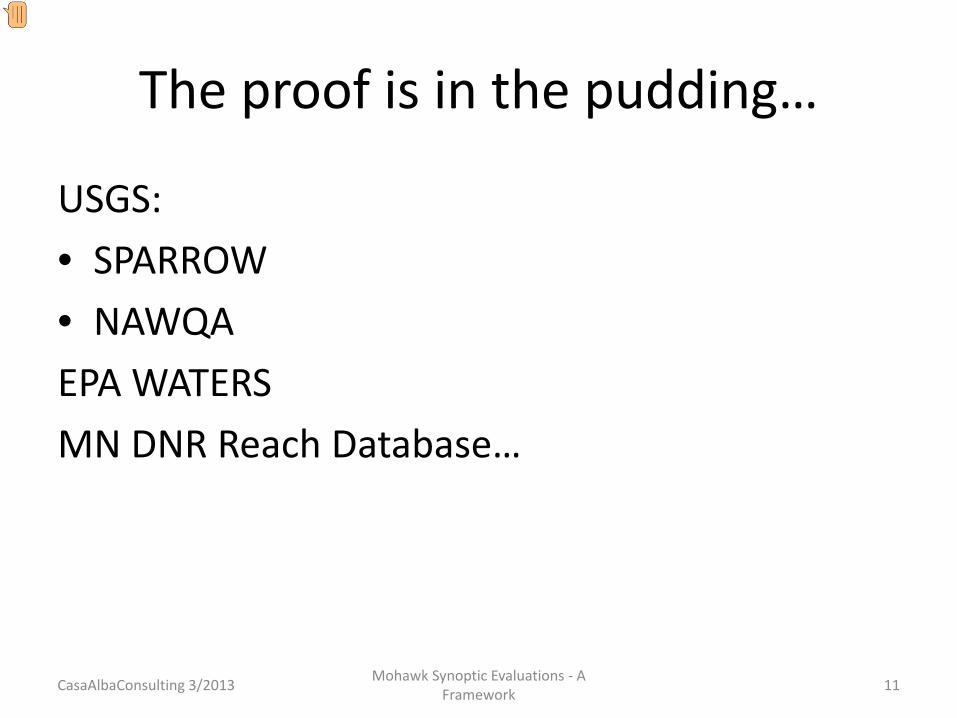
The proof is in the pudding…
CasaAlbaConsulting 3/2013 8Mohawk Synoptic Evaluations ‐ A Framework
National Hydrologic Model…
CasaAlbaConsulting 3/2013 9Mohawk Synoptic Evaluations ‐ A Framework
Presenter
Presentation Notes
…”partitioning of the US into Hydrologic Response Units (HRUs) based on an aggregation of the [MR] NHDPlus dataset”, R Vigier, USGS
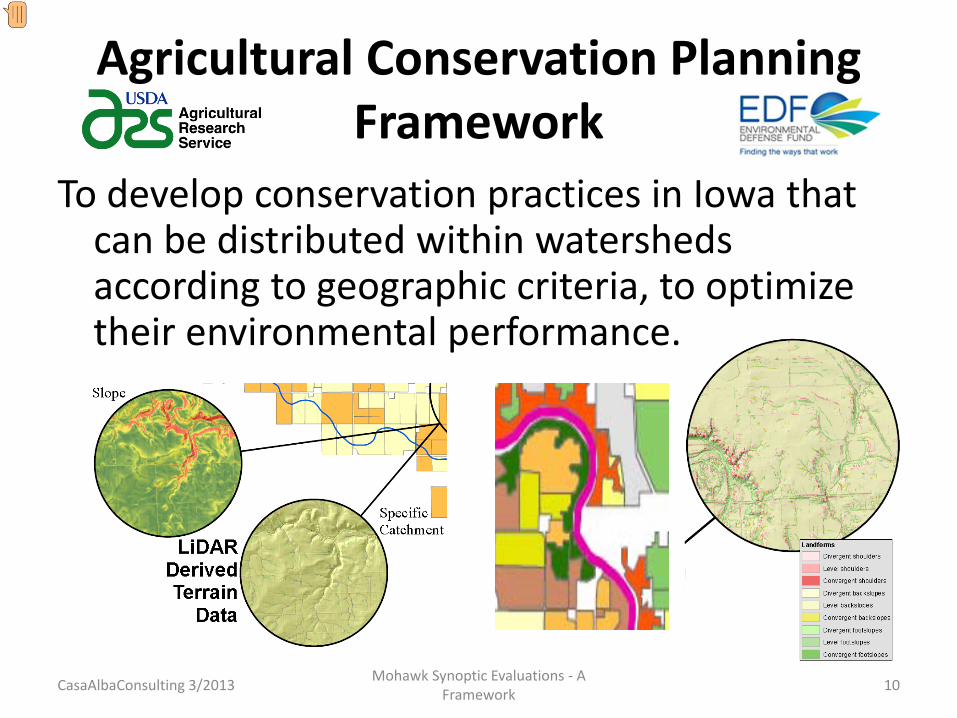
Agricultural Conservation Planning Framework
To develop conservation practices in Iowa that can be distributed within watersheds according to geographic criteria, to optimize their environmental performance.
10CasaAlbaConsulting 3/2013 Mohawk Synoptic Evaluations ‐ A Framework
Presenter
Presentation Notes
See L at ftp://lidar.dnr.state.mn.us/documentation/LAS_File_Processing_Using_LASTOOLS.pdf for detailed use examples. Free references: National Oceanic and Atmospheric Administration (NOAA) Coastal Services Center, 2012, Lidar 101: An Introduction to Lidar Technology, Data, and Applications, Revised Charleston, SC. Lewis Graham, 2012, Breaklines and Lidar Data, in PHOTOGRAMMETRIC ENGINEERING & REMOTE SENSING March 2012, 189-191.
CasaAlbaConsulting 3/2013 11Mohawk Synoptic Evaluations ‐ A Framework
Presenter
Presentation Notes
Just Google, many of these have web pages and there is documentation on how they used NHDPlus in their modeling. Each partitions the area of interest into hydrologic units that have the appropriate relationship to their goals.
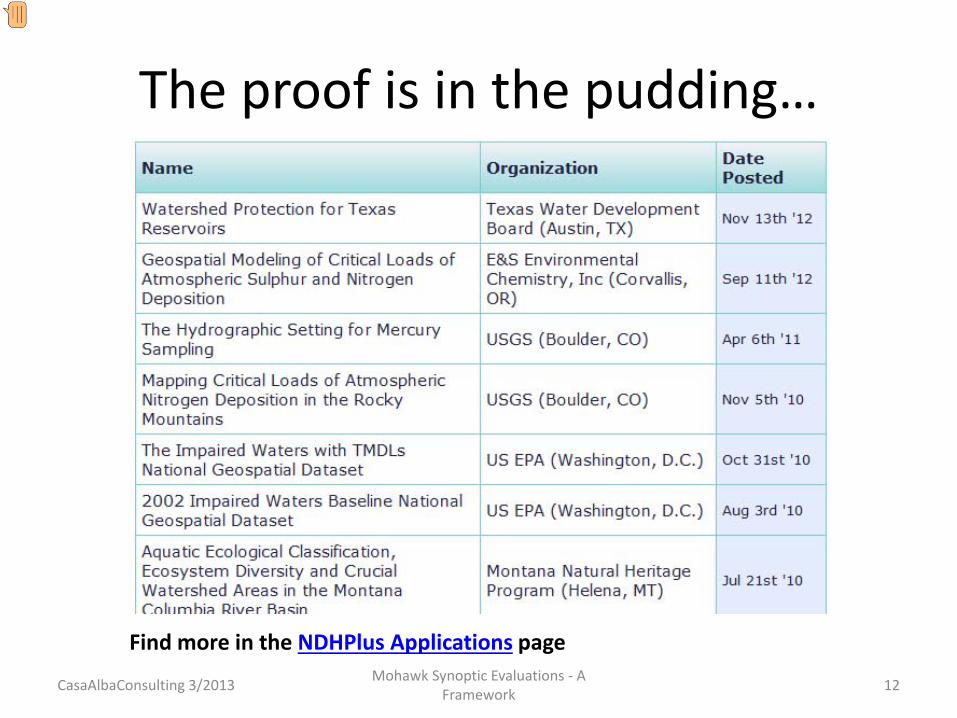
The proof is in the pudding…
Find more in the NDHPlus Applications page
CasaAlbaConsulting 3/2013 12Mohawk Synoptic Evaluations ‐ A Framework
CasaAlbaConsulting 3/2013 13Mohawk Synoptic Evaluations ‐ A Framework
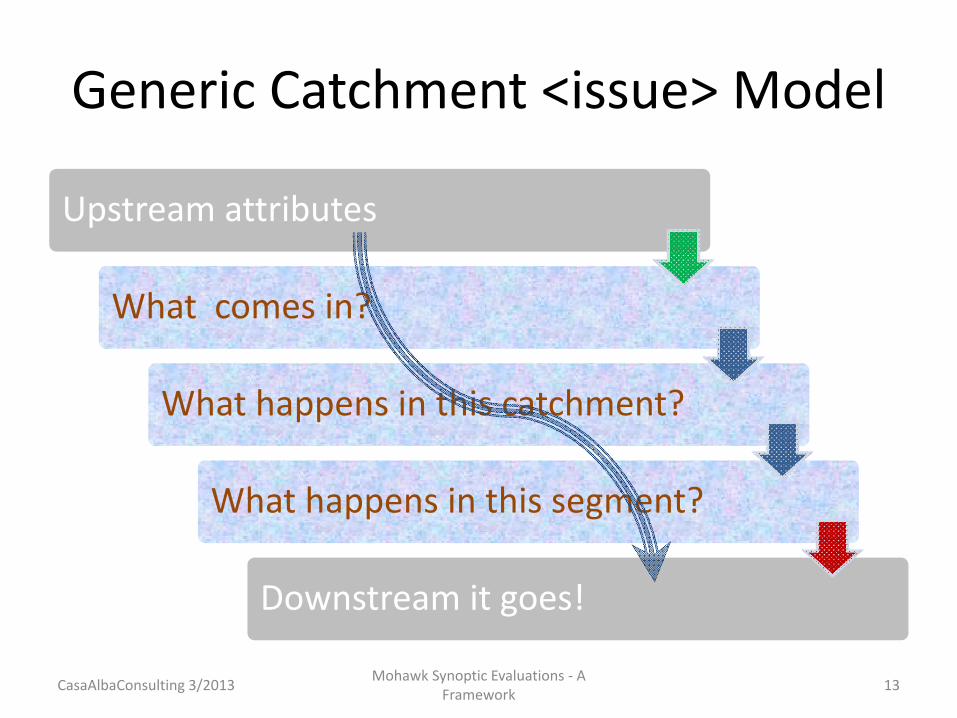
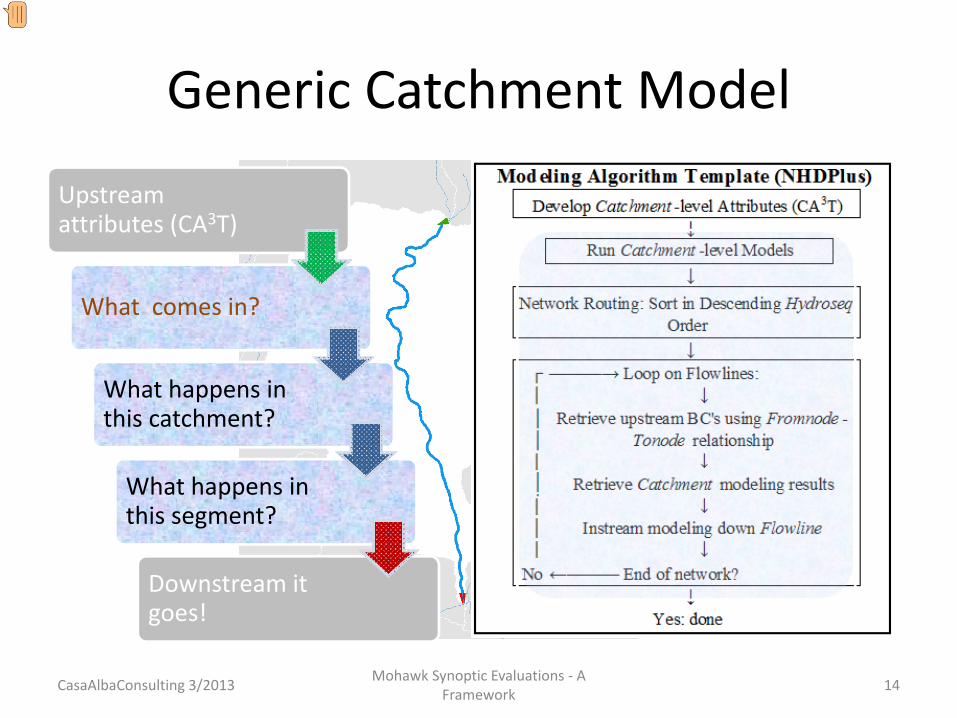
Generic Catchment Model
Upstream attributes (CA3T)
What comes in?
What happens in this catchment?
What happens in this segment?
Downstream it goes!
CasaAlbaConsulting 3/2013 14Mohawk Synoptic Evaluations ‐ A Framework
Presenter
Presentation Notes
Best if all of this models can be run from tables (think a spreadsheet), rather than application specific environments.
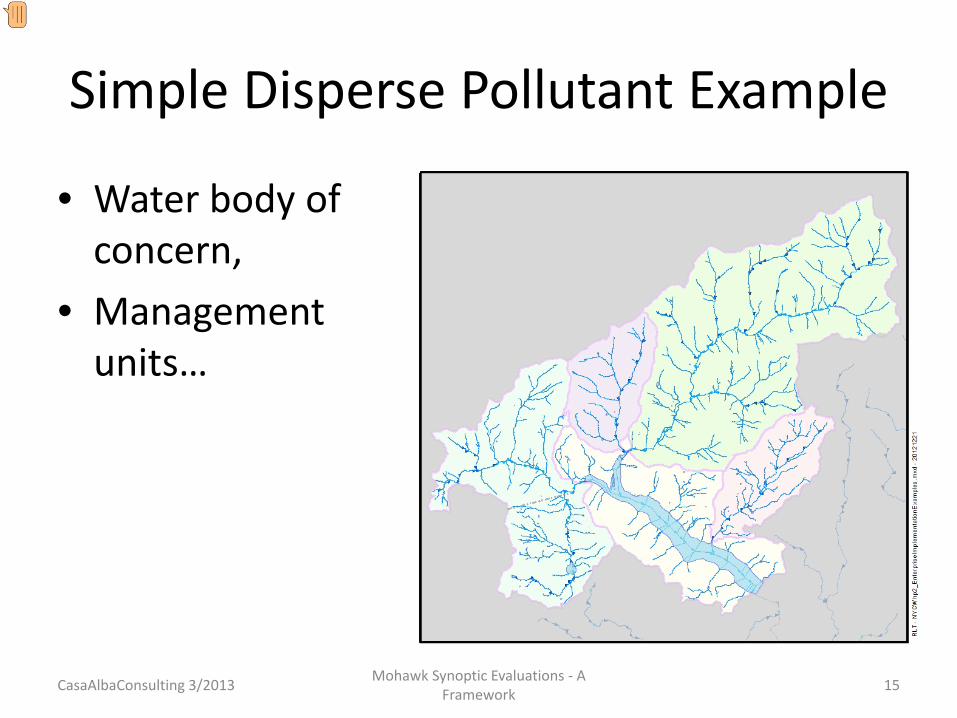
Simple Disperse Pollutant Example
• Water body of concern,
• Management units…
CasaAlbaConsulting 3/2013 15Mohawk Synoptic Evaluations ‐ A Framework
Presenter
Presentation Notes
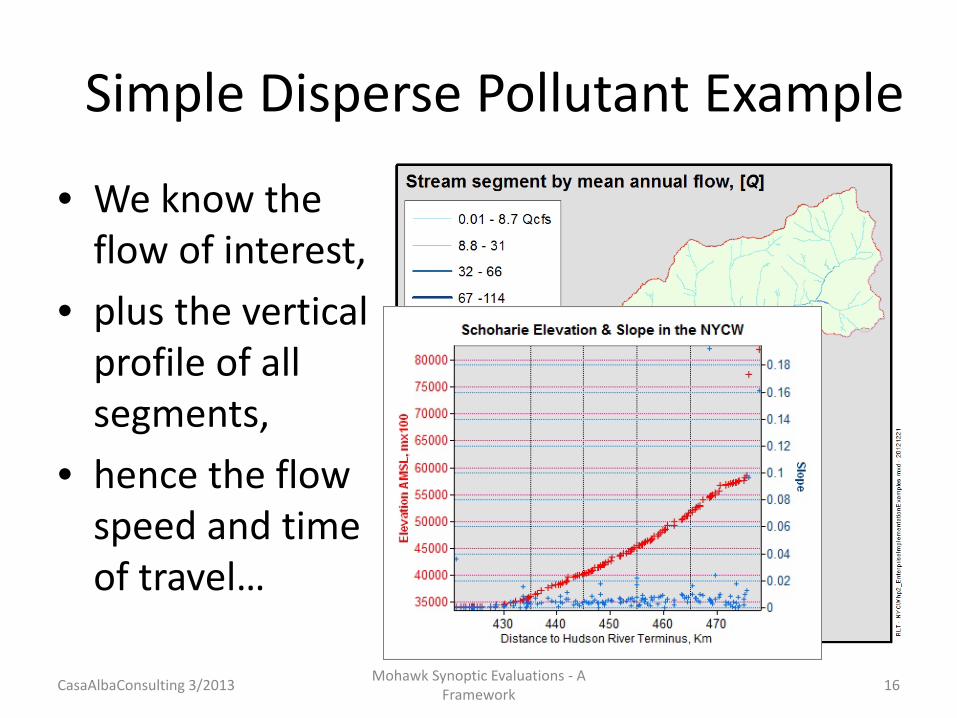
The illustrations use the Rondout Reservoir Basin, in the NYCW (Ooops! It’s out of the Mohawak!)
• We know the flow of interest,
• plus the vertical profile of all segments,
• hence the flow speed and time of travel…
Simple Disperse Pollutant Example
CasaAlbaConsulting 3/2013 16Mohawk Synoptic Evaluations ‐ A Framework
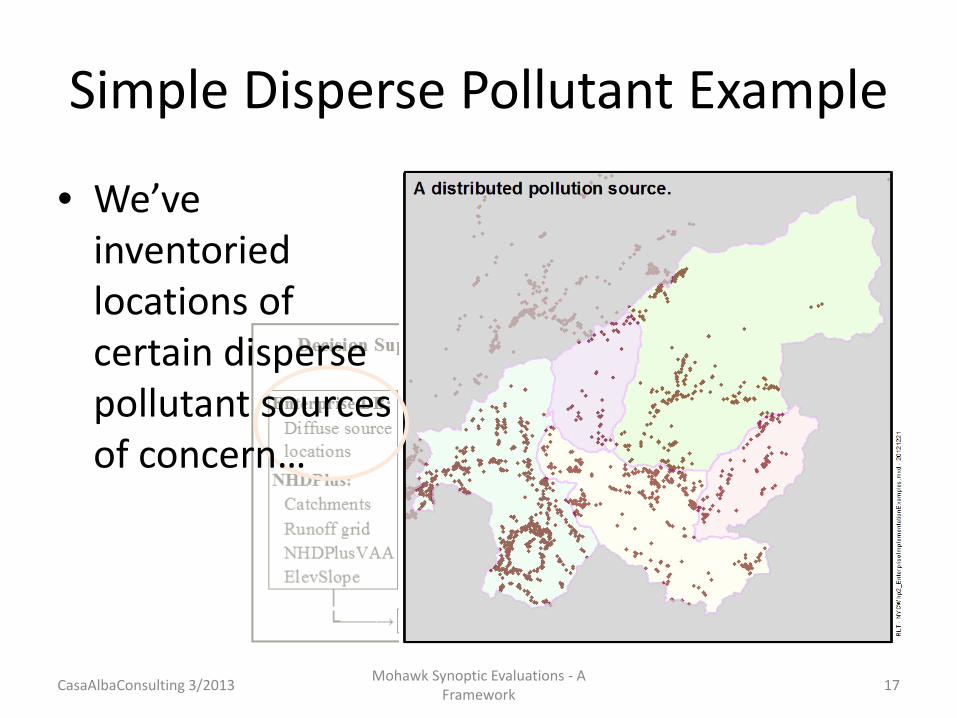
Simple Disperse Pollutant Example
• We’ve inventoried locations of certain disperse pollutant sources of concern…
CasaAlbaConsulting 3/2013 17Mohawk Synoptic Evaluations ‐ A Framework
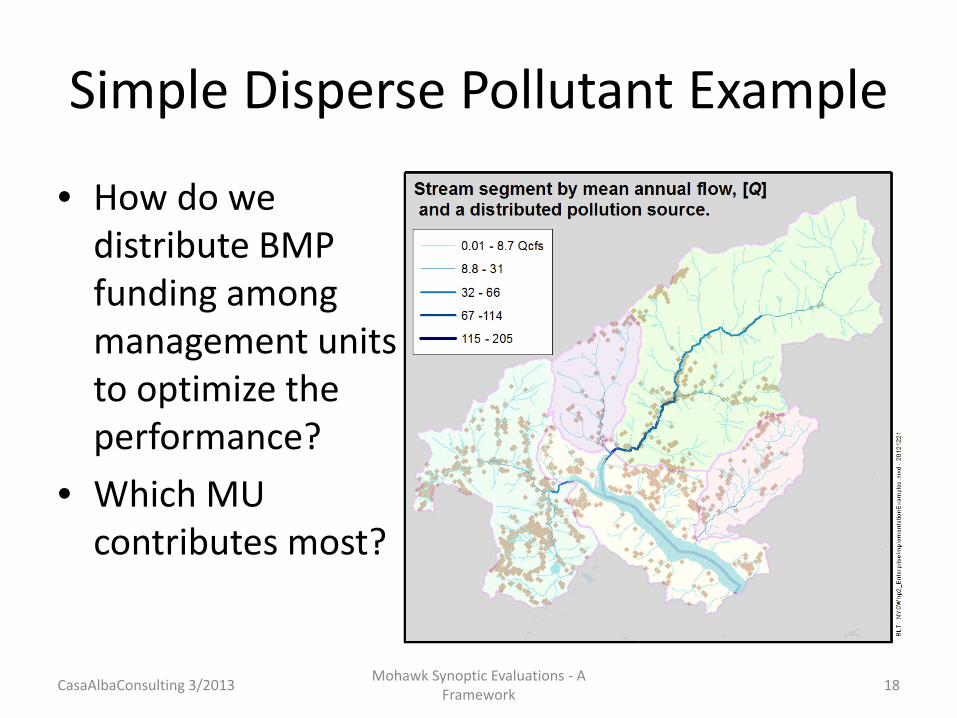
Simple Disperse Pollutant Example
• How do we distribute BMP funding among management units to optimize the performance?
• Which MU contributes most?
CasaAlbaConsulting 3/2013 18Mohawk Synoptic Evaluations ‐ A Framework
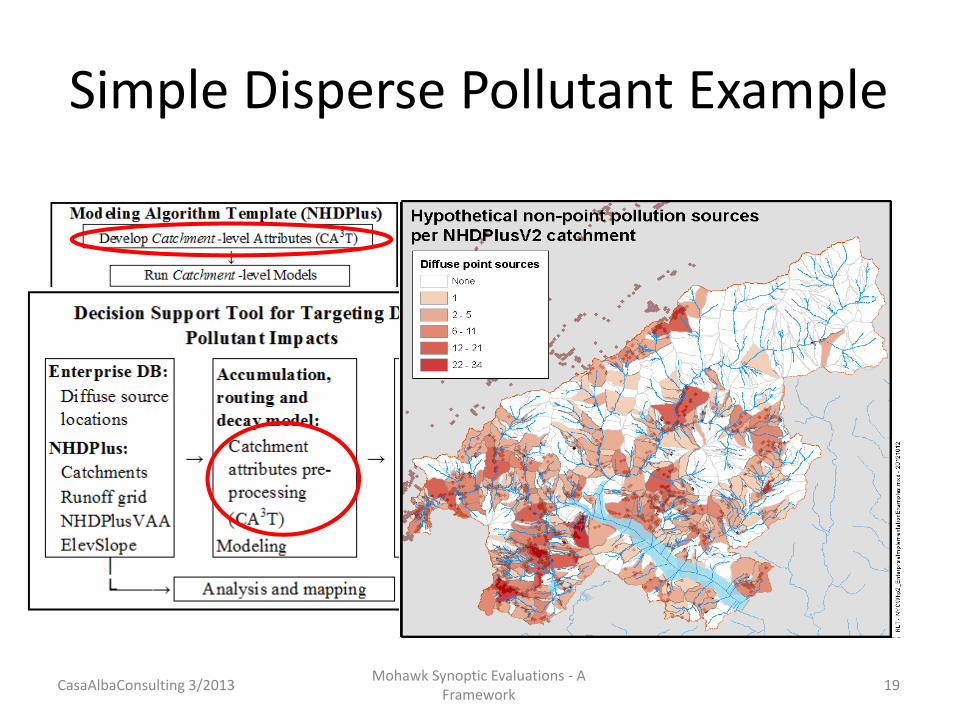
Simple Disperse Pollutant Example
CasaAlbaConsulting 3/2013 19Mohawk Synoptic Evaluations ‐ A Framework
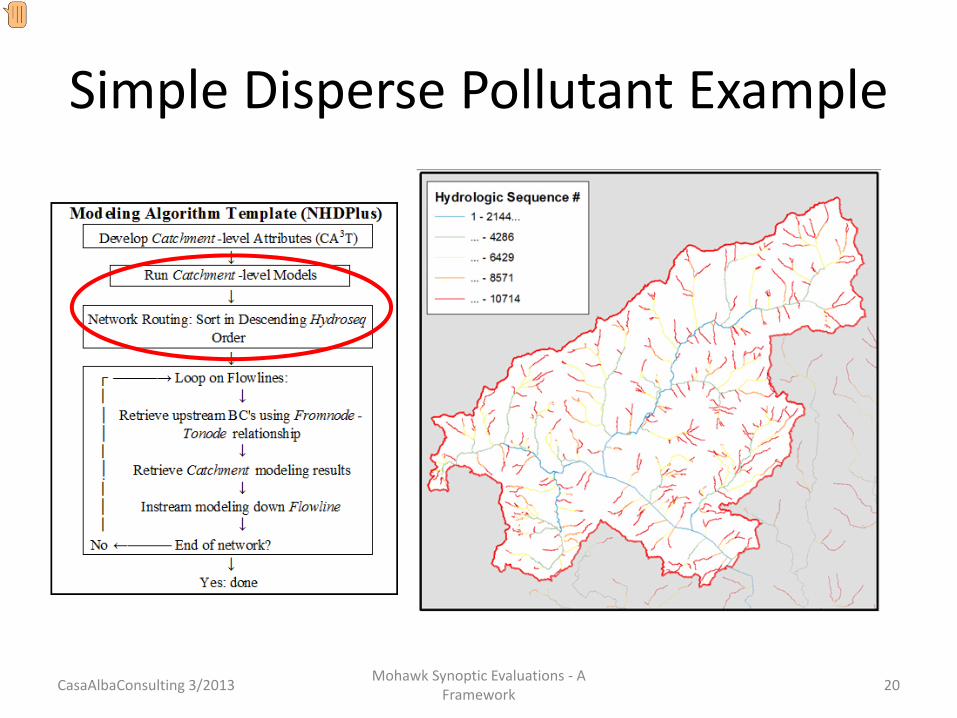
Simple Disperse Pollutant Example
CasaAlbaConsulting 3/2013 20Mohawk Synoptic Evaluations ‐ A Framework
Presenter
Presentation Notes
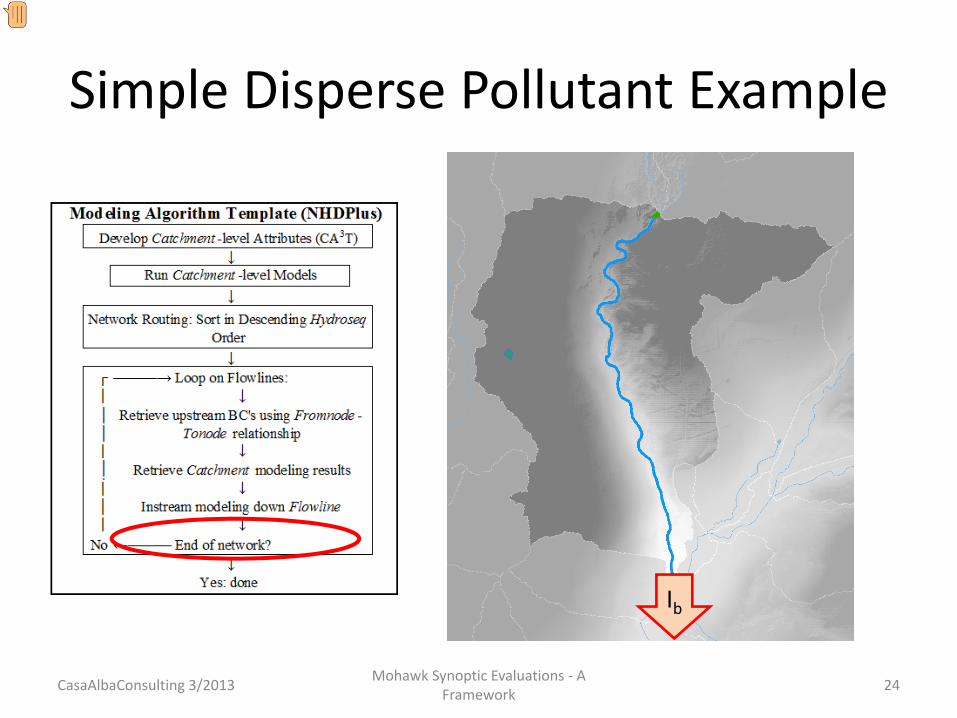
As we prepare to go into the stream network segment modeling, we want to ensure we model all the needed segments, 1st the upstream ones, then downstream. We use the Hydrologic Sequence Number (Hydroseq): by navigating the network in descending Hydroseq order it is ensured that the upstream flowlines will have been modeled before the immediate downstream flowline is modeled…
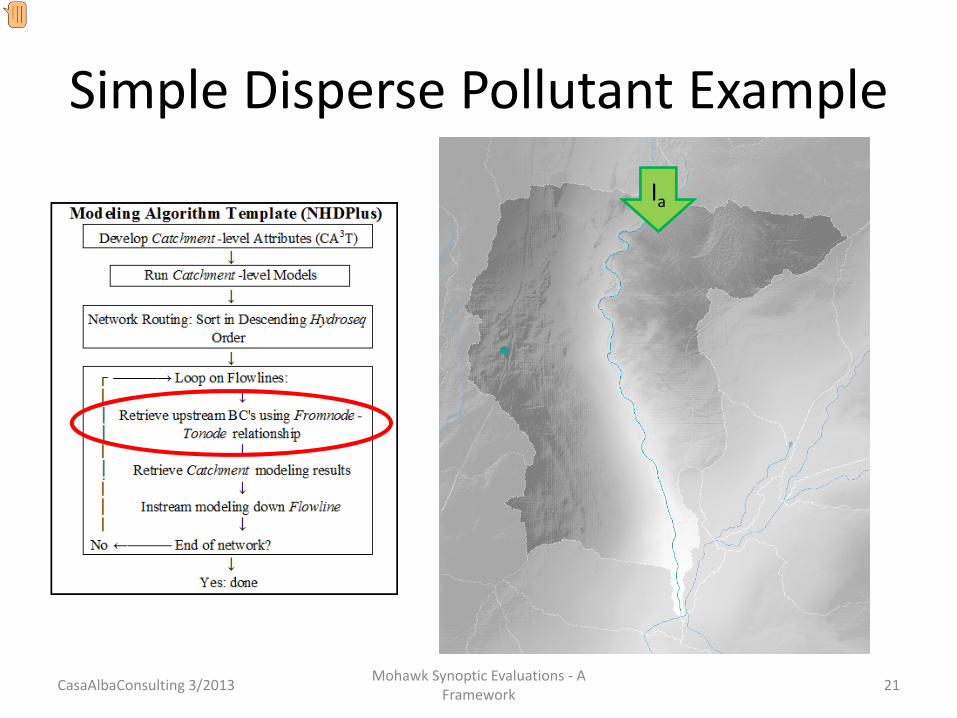
Simple Disperse Pollutant Example
Ia
CasaAlbaConsulting 3/2013 21Mohawk Synoptic Evaluations ‐ A Framework
Presenter
Presentation Notes
…” the upstream boundary conditions (BC) can be determined by selecting flowlines that have a ToNode equal to the current Flowline’s FromNode and then summing up the pollutant Index values for these Flowlines”, to obtain the amount arriving into our catchment…
Simple Disperse Pollutant Example
Ic
CasaAlbaConsulting 3/2013 22Mohawk Synoptic Evaluations ‐ A Framework
Presenter
Presentation Notes
In the example there is no overland process, each source contributes an unit value of the pollutant to the catchment stream segment, Ic is the sum of these.
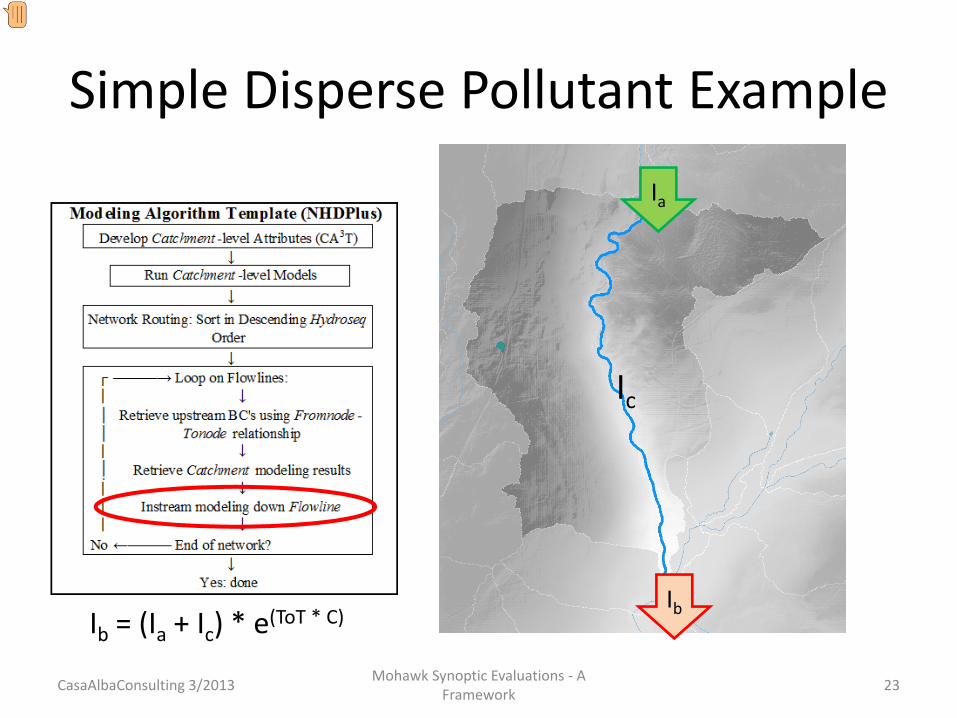
Simple Disperse Pollutant Example
Ib = (Ia + Ic) * e(ToT * C)
CasaAlbaConsulting 3/2013 23Mohawk Synoptic Evaluations ‐ A Framework
Ic
Ia
Ib
Presenter
Presentation Notes
A simple exponential decay controlled by the TimeofTravel and a decay coefficient that comes from experimental or chemical principles studies.
Simple Disperse Pollutant Example
Ib
CasaAlbaConsulting 3/2013 24Mohawk Synoptic Evaluations ‐ A Framework
Presenter
Presentation Notes
Bingo! We have the catchment output decayed pollutant index value.
Simple Disperse Pollutant Example
• Which Management Unit contributes most?
CasaAlbaConsulting 3/2013 25Mohawk Synoptic Evaluations ‐ A Framework
Presenter
Presentation Notes
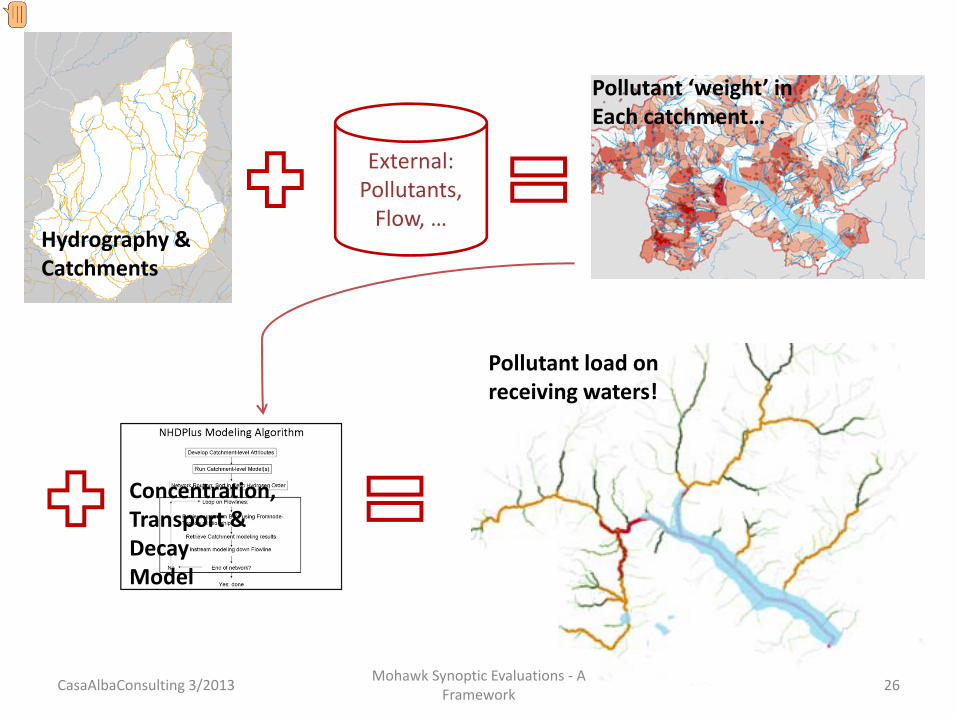
We then use the flowline ComID to assign a line color and thickness according to the values of all the individual catchment Ib pollutant load index values and we can see what management unit contributes most to the pollutant load, the answer we were looking for!
External: Pollutants,Flow, …
Hydrography &Catchments
Pollutant ‘weight’ in Each catchment…
Concentration,Transport &DecayModel
Pollutant load on receiving waters!
CasaAlbaConsulting 3/2013 26Mohawk Synoptic Evaluations ‐ A Framework
Presenter
Presentation Notes
Summary of how a generic model is related to the hydrographic and hydrologic data, and the capabilities for visualization and interpretation.
So…
Evaluations have the support to be:• As simple or complex as needed,• Built‐in consistency,• Computationally & visually efficient.
What about• Affordability?
CasaAlbaConsulting 3/2013 27Mohawk Synoptic Evaluations ‐ A Framework
Presenter
Presentation Notes
Complexity of the landscape, processes, and impacts of our activities on the water resource. Need of consistency among our information, understanding, activity planning and implementation. Both the above are difficult to handle. The framework gives us a common architecture where we can hang representations of our information, understanding, activity planning, implementation and couple them into an adaptive feedback process. Further, to be able to insert the necessary pieces of information into the corresponding processes, the framework needs to be efficient, computationally (spreadsheet vs. GIS) and visually (tabular graphs and 3-D GIS).
NHDPlus affordabilityElement Status Cost1st order approximation?
Done (NHDPlus Version2, MR) $0
2nd order inputs ready and available? Process?
Yes (NHD High Res, 10 m DEMs). None in NYS.
$0. ~$150K NYS‐wide?
3rd order inputs? Variable (Lidar DEM/Hydrography)
CasaAlbaConsulting 3/2013 28Mohawk Synoptic Evaluations ‐ A Framework
Presenter
Presentation Notes
Cost are only rough estimates –project cost depends, of course, on the details. The point is: There are several choices (timeliness, resolution, alignment between hydrography and elevation) of input data, which provide flexibility in the design and costing of the project. Once the data is available, developing the framework is an incredible good investment, returning multiple levels of value for an almost insignificant incremental investment.