Embed Size (px)
Citation preview

An Observational and Modeling Study of Characteristics of Urban Heat Island and
Boundary Layer Structures in Beijing
JOURNAL OF APPLIED METEOROLOGY AND CLIMATOLOGYJOURNAL OF APPLIED METEOROLOGY AND CLIMATOLOGY
SHIGUANG MIAOInstitute of Urban Meteorology, China Meteorological Administration, Beijing, China, and National Center for
Atmospheric Research, Boulder, Colorado
FEI CHEN, MARGARET A. LEMONE, AND MUKUL TEWARINational Center for Atmospheric Research,* Boulder, Colorado
QINGCHUN LI AND YINGCHUN WANGInstitute of Urban Meteorology, China Meteorological Administration, Beijing, China
8 July 2008
Reporter:Deli Qi

1. Introduction
• The well-recognized urban heat island (UHI) phenomenon, characterized by a
temperature contrast between a city and its surrounding rural areas, is one prominent
urban effect and can affect urban airflow, atmospheric boundary layer structures, and
transport and dispersion of pollutants.
• The Greater Beijing metropolitan area, China, one of the 10 largest megacities in the
world with a population of more than 10 million, has experienced a rapid urbanization world with a population of more than 10 million, has experienced a rapid urbanization
in the last 20 years.
• The single-layer UCM is in the middle of the spectrum of urban modeling methods,
and is a compromise between urban model complexity and computational resources
required to execute urban models.
• 1) describe the general characteristics of urban heat island and PBL structures in the
Beijing area
• 2) understand the degree to which the new-generation numerical weather prediction
(NWP) model, the WRF Model, can capture these physical mechanisms
• 3) understand the impacts of urbanization on PBL properties.

2. Observed PBL structures for a summer clear day in Beijing
FIG. 1. The distribution of terrain height (m) centered on Beijing.The dashed rectangle shows the location of Beijing city.
FIG. 2. The distribution of surface observation stations (numbered symbols) over different land uses (various symbols) and the location of the Baolian wind profiler. Terrain height is shown with shading (m). The black contours delineate, from inner to outer, the second, fourth, and fifth beltways; the transverse line is Chang’an Street; and the open circle represents the position of Tian’an Men.

FIG. 4. Diurnal variation of UHI intensity
(℃). The lines with open and closed
circles are monthly mean values of air
temperature differences between
urban and rural stations for 31 days
and 14 no-rain days in August 2005, and 14 no-rain days in August 2005,
respectively.The lines with open and
closed squares are for 18 Aug 2005
from observation and from WRF model,
respectively. The line with plus signs is
the observed UHI intensity between
station 203 and rural stations for 18
Aug 2005.

FIG. 5. Spatial distribution of 1-km MODIS land surface temperature departures (℃) from the domain mean valid at (a) 0445 UTC (1245 LST) 18 Aug 2005 and (b) 1825 UTC 18 Aug 2005 (0225 LST 19 Aug 2005). Shaded areas represent positive departures. The white squares represent water bodies.
Hence the noon UHI land surface temperature pattern is stronger than nighttime from this particular case. Note that this is different from the UHI of 2-m air temperature.

FIG. 6. The observed wind fields at 10 m AGL at 0000 UTC (0800 LST) in black, 0600 UTC (1400 LST) in red, 1200 UTC (2000 LST) in green, and 1800 UTC 18 Aug 2005 (0200 LST 19 Aug 2005) in blue.

3. WRF/Noah/UCM numerical simulations
FIG. 7. Configuration of the 5 two-
way nested domains for WRF/
Noah/UCM simulation. Noah/UCM simulation.
Shading is terrain height in
meters.
40.5 km (100 * 100), 13.5 km (100
*100), 4.5 km (100*100), 1.5
km (100* 100), and 0.5 km
(118 * 109), respectively.
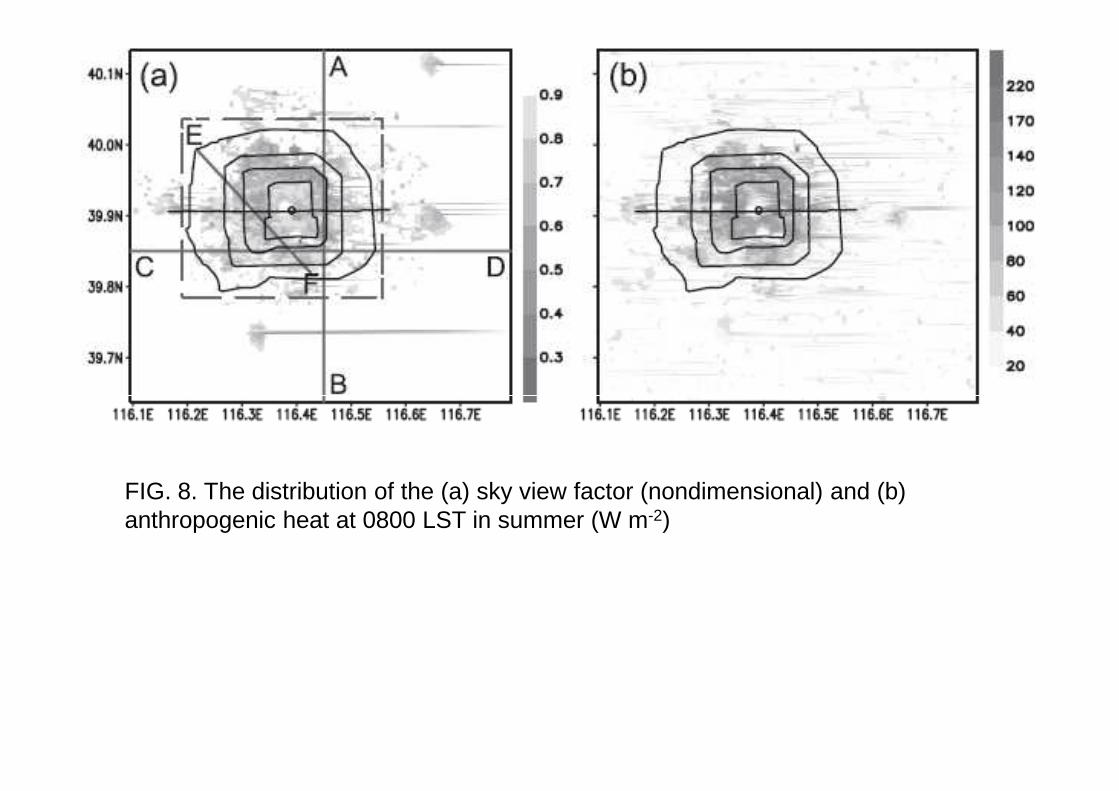
FIG. 8. The distribution of the (a) sky view factor (nondimensional) and (b) anthropogenic heat at 0800 LST in summer (W m-2)

TABLE 1. Comparison of the simulated and observed 2-m temperature (℃; the criterion for hit rate calculation is 2℃). N_stn: number of stations, mean: mean value, std dev: standard deviation, RMSE: root-mean-square error, IOA: index of agreement, HR: hit rate, Obs: Observation, T2: 2-m temperature, and TC: temperature in urban canopy.
TABLE 2. Comparison of the simulated and observed 10-m wind speed (m s-1; the criterion for hit rate calculation is 1 m s-1). U10: 10-m wind speed; UC: wind speed in urban canopy.
TABLE 3. Comparison of the simulated and observed 2-m specific humidity (g kg-1; the criterion for hit rate calculation is 2 g kg-1). Q2: 2-m specific humidity; QC: specific humidity in urban canopy.
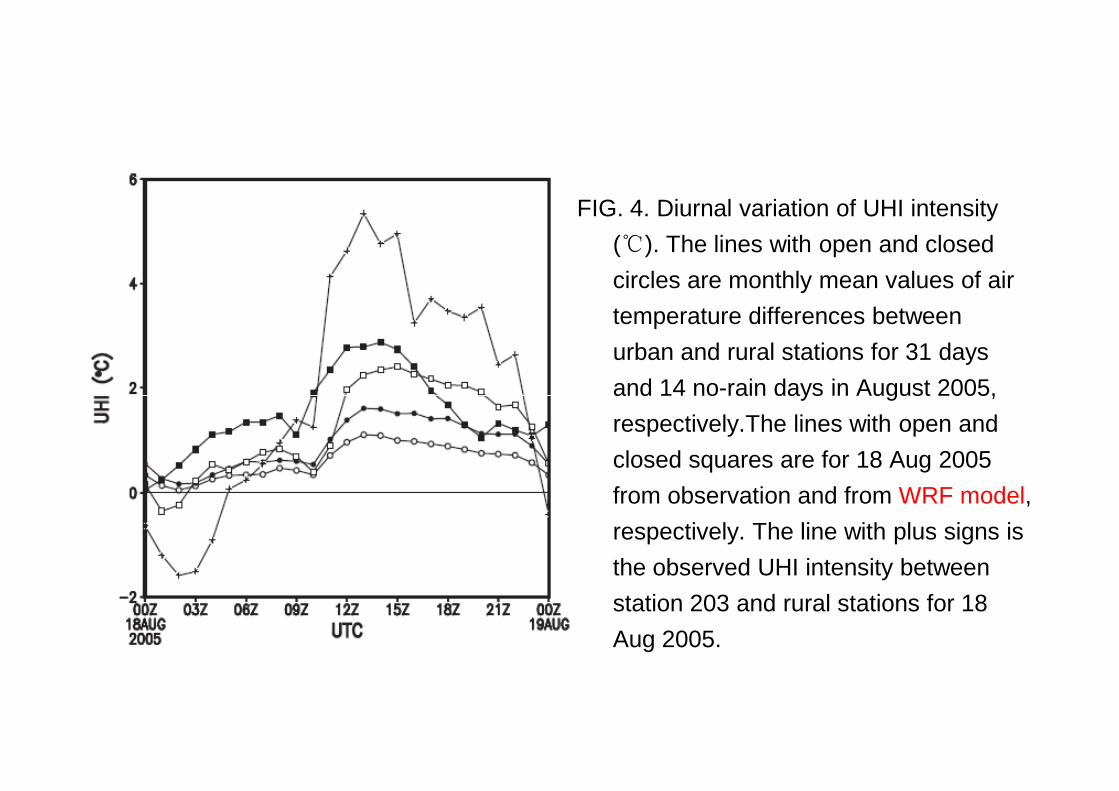
FIG. 4. Diurnal variation of UHI intensity
(℃). The lines with open and closed
circles are monthly mean values of air
temperature differences between
urban and rural stations for 31 days
and 14 no-rain days in August 2005, and 14 no-rain days in August 2005,
respectively.The lines with open and
closed squares are for 18 Aug 2005
from observation and from WRF model,
respectively. The line with plus signs is
the observed UHI intensity between
station 203 and rural stations for 18
Aug 2005.

FIG. 10. As in Fig. 5, but for WRF results.
FIG. 11. The simulated (blue vectors) and observed (red vectors) wind fields at the height of 10-m AGL in D05: (a) 0600 UTC (1400 LST), (b) 1200 UTC (2000 LST), (c) 1800 UTC 18 Aug 2005 (0200 LST), and (d) 0000 UTC (0800 LST) 19 Aug 2005.
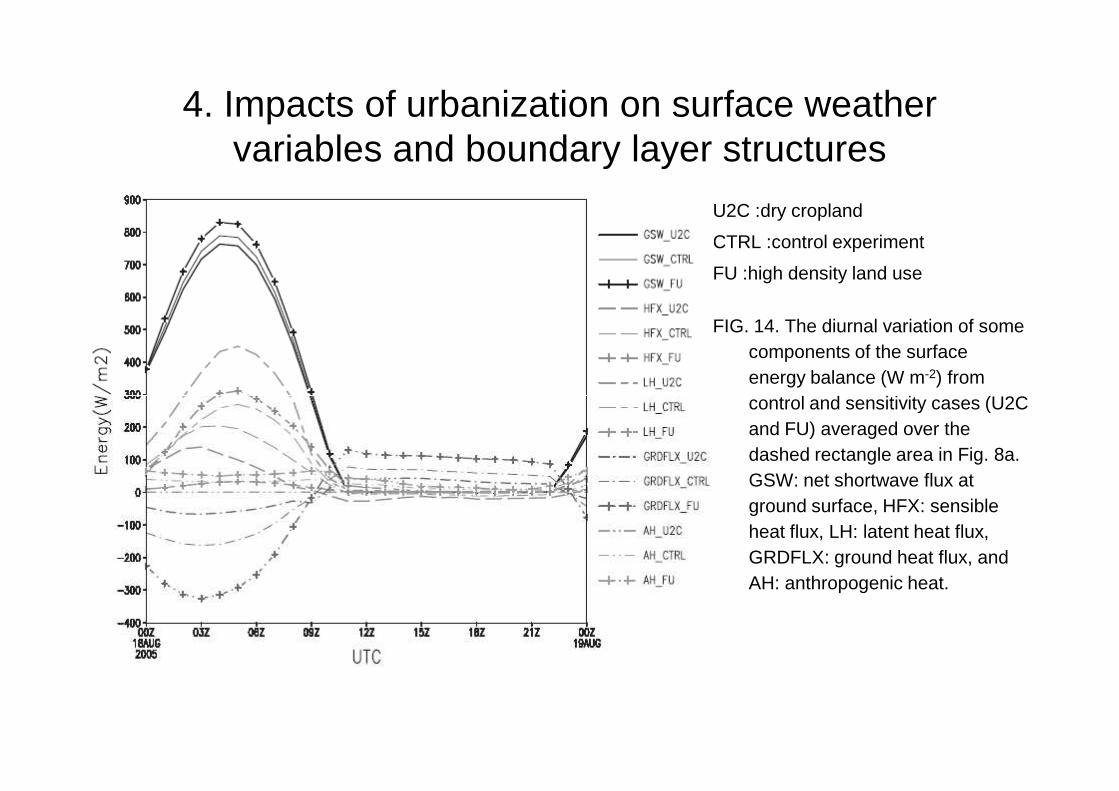
4. Impacts of urbanization on surface weathervariables and boundary layer structures
U2C :dry cropland
CTRL :control experiment
FU :high density land use
FIG. 14. The diurnal variation of some components of the surface energy balance (W m-2) from control and sensitivity cases (U2C control and sensitivity cases (U2C and FU) averaged over the dashed rectangle area in Fig. 8a. GSW: net shortwave flux at ground surface, HFX: sensible heat flux, LH: latent heat flux, GRDFLX: ground heat flux, and AH: anthropogenic heat.

FIG. 15. The diurnal variation of the difference between (left) the two sensitivity cases and (right) the control case averaged over the dashed rectangle area in Fig. 8a: (a),(b) temperature (℃), (c),(d) wind speed (m s-1), and (e),(f) specific humidity (g kg-1).

FIG. 18. Horizontal distribution of vertical velocity (shaded; m s-1) and horizontal wind vectors (m s-1) at 0600 UTC (1400 LST) 18 Aug 2005, about 384 m AGL. Case (a) half building heights and (b) double building heights. Red line EF indicates the position of the cross section shown in Fig. 19.

FIG. 19. Cross section of
vertical velocity (m s-1)
along line EF (shown
in Figs. 8a, 18) at
0600 UTC (1400 LST)
18 Aug 2005. Case (a)
half building heights,
(b) double building (b) double building
heights, (c) half
anthropogenic heat,
and (d) double
anthropogenic heat.

5. Summary and conclusions
• Synoptic weather patterns have more impact on UHI intensity in nighttime than in the daytime.Evaluation statistics indicate that urban canopy–level variables (e.g., temperature, wind speed) from WRF/Noah/UCM compare better with surface observations than traditional variables (e.g., 2-m temperature, 10-m wind speed).
• Local circulations for 18 August 2005 in the Beijing area are dominated by mountain–valley winds, which are modified by UHI circulations. The WRF/Noah/ UCM modeling system reproduces the timing of wind reversal reasonably well.
• Sensitivity tests for the present paper indicate that the increase of urban building height decreases the wavelength (spacing) of HCRs, while the increasing of anthropogenic heat increases the depth of HCRs. Hence the aspect ratio of HCRs in urban areas (~1.5) is smaller than the typical value over natural landscapes (2–15).
• Sensitivity tests with WRF/Noah/UCM show that the expansion of urbanized areas increases absorbed solar radiation, sensible heat flux, ground heat flux, and the anthropogenic heat source, while decreasing latent heat flux.

THANK YOU!