Embed Size (px)
Citation preview

AN INVESTIGATION OF THE USE OF COMPUTERS IN THE TEACHING AND
LEARNING OF HYPERBOLIC GRAPHS IN GRADES 10 TO 12 MATHEMATICS
by
Lavhelani Emily Mavhungu
Submitted in accordance with the requirements for the degree of
Master of Science in Mathematics, Science and Technology Education
in the subject
Mathematics Education
at the
University of South Africa
Supervisor: Professor Mogari D
November 2013

i
PROQUEST INFORMATION AND LEARNING
An Investigation of the Use of Computers in the Teaching and Learning of
Hyperbolic Graphs in Grades 10 to 12 Mathematics
by
Lavhelani Emily Mavhungu
Master of Science in Mathematics, Science and Technology Education
Supervisor: Professor L.D. Mogari
Abstract
In this investigation an attempt was made to determine how learners and teachers use
computers in the teaching and learning of hyperbolic graphs in Mathematics. A
comprehensive literature study showed that there are many benefits in using computers
to study Mathematics. The investigation was done in two phases. In the first phase, a
questionnaire was given to learners. The second phase involved interviewing learners
and teachers. Findings indicate that learners and teachers enjoy using computers in the
teaching and learning of Mathematics. Analysis of the results shows that the use of
computers in teaching and learning of Mathematics, in particular the teaching and
learning of hyperbolic graphs is beneficial.
Key words: Computer, graph, Hyperbola, Mathematics, technology

ii
DECLARATION
Student number: 3153804-5
I declare that ”An investigation of the use of computers in the teaching and Learning of
hyperbolic graphs in Grades 10 to 12 Mathematics’’ is my on work, and that all the
sources that I have used or quoted have been indicated and acknowledged by means of
complete references.
………………………………………………………………….. …………………………………………….
Signature Date

iii
ACKNOWLEDGEMENTS
I want to express my sincere gratitude to:
- My father, God the Almighty, for the ability and wisdom He gave me to complete
the research;
- Proverbs 4:7 ‘Wisdom is the principal thing, therefore get wisdom, and with all
thy getting get understanding;’
- Prof David Mogari, my supervisor, for his guidance and assistance throughout
the duration of the study; and
- My wonderful husband Dr Simon and our lovely children, Hope, Lutendo and
Blessing who supported me

iv
DEDICATION
I want to dedicate this research study to the following people:
- My supervisor, Professor L.D. Mogari for his advice and support;
- My family for their understanding when I spent much of my time on the
computer;
- My late father Andries Tshikovhele Raungedzani Makhavhu, who taught me
never to give up in education;
- My beautiful mother for bringing me to earth and her support throughout my
studies;
- My colleagues for their support; and
- Dr M.P. Mulaudzi for his support and encouragement.

v
TABLE OF CONTENT
Page
Proquest information and learning……………………………………………………………….. (i)
Declaration………………………………………………………………………………………………… (ii)
Acknowledgement………………………………………………………………………………………. (iii)
Dedication…………………………………………………………………………………………………. (iv)
Table of Contents………………………………………………………………………………………. (v)
List of Tables……………………………………………………………………………………………… (viii)
List of Figures…………………………………………………………………………………………….. (ix)
Chapter 1: Background and Overview of the Study
1.1 Background………………………………………………………………………………………. 1
1.2 Statement of the Problem …………………………………………………………………. 3
1.3 Purpose of the Study ………………………………………………………………………… 4
1.4 Significance of the Study …………………………………………………………………… 4
1.5 Definition of Key Terms ……………………………………………………………………… 5
1.6 Limitation of the Study ……………………………………………………………………… 7
1.7 Layout of the Dissertation …………………………………………………………………. 7
Chapter 2: Literature Review
2.1 Introduction ……………………………………………………………………………………. 8
2.2 The use of Computers in the Teaching and Learning of Mathematics ……. 8
2.3 Learning of Mathematics with Computers Versus the Traditional Paper
and Pencil Method ……………………………………………………………………………. 10
2.4 The Benefits of Learning Mathematics with Computers ……………………….. 11
2.5 The Effectiveness of Teaching Mathematics with Computers ………………… 12
2.6 Computers in Mathematics Classroom ………………………………………………… 16
vi
2.7 Impact of Computers in Teaching and Learning Mathematics ………………. 18
2.8 Using Graphing Software to Teach Mathematics …………………………………. 19
2.9 Learning Mathematics with Autograph and Heymath Softwares ……………. 20
2.10 Review of Related Literature ………………………………………………………………. 22
2.11 Conceptual Framework of the Study …………………………………………………… 27
Chapter 3: Research Design and Methodology
3.1 Introduction ……………………………………………………………………………………. 31
3.2 Research Design ………………………………………………………………………………. 31
3.3 Population ………………………………………………………………………………………. 32
3.4 Sampling Procedures ……………………………………………………………………….. 32
3.5 Data Gathering Instrumentation ……………………………………………………….. 32
3.5.1 Development of the Instruments …………………………………………….. 33
3.5 .1.1 Questionnaire Instruments……………………………………………………. 33
3.5.1.2 Interview ……………………………………………………………………………. 33
3.5.1.3 Learners’ Interview ………………………………………………………………. 34
3.5.1.4 Teachers’ Interview ………………………………………………………………. 34
3.6 Validity and Reliability of Instruments ……………………………………………….. 34
3.6.1 Validity …………………………………………………………………………………. 35
3.6.2 Reliability ……………………………………………………………………………… 35
3.7 Pilot Study ………………………………………………………………………………………. 35
3.8 Implications of the Pilot Study for the Main Study ………………………………. 35
3.9 Data Gathering Procedures ……………………………………………………………….. 36
3.10 Data Analysis Technique ……………………………………………………………………. 37
3.11 Ethical Considerations ………………………………………………………………………. 37
Chapter 4: Data Analysis and Interpretation
4.1 Introduction …………………………………………………………………………………….. 39
4.2 Data from the Learners’ Questionnaire ………………………………………………… 39
4.2.1 Analysis of the learners’ questionnaire response per item ………….. 47

vii
4.3 Representation and Analysis of the Learners’ Responses to Interview
Questions ………………………………………………………………………………………… 54
4.4 Representation and Analysis of the Teachers’ Responses to Interview
Questions …………………………………………………………………………………………. 63
4.5 Summary of the Data ………………………………………………………………………… 69
4.5.1 Summary of the data from learners ………………………………………….. 69
4.5.2 Summary of the data from the teachers ……………………………………. 70
4.6 Final Remarks …………………………………………………………………………………… 70
Chapter 5: Summary, Conclusion and Recommendations
5.1 Introduction …………………………………………………………………………………….. 71
5.2 Discussion of the Results…………………………………………………………………… 72
5.3 Implications of the Findings ………………………………………………………………. 76
5.4 Conclusion ……………………………………………………………………………………….. 77
5.5 Limitations of the study……………………………………………………………………… 78
5.6 Recommendations …………………………………………………………………………….. 78
References …………………………………………………………………………………………………. 80
Appendices
Appendix A: Learners’ Questionnaire ……………………………………………………………. 96
Appendix B: Interview Questions for Learners ………………………………………………. 101
Appendix C: Interview Questions for Teachers ……………………………………………… 102
Appendix D: Transcription of Learners’ Responses to Interviews in Pilot Study... 103
Appendix E: Representation and Analysis of the Teachers’ Interviews in Pilot
Study …………………………………………………………………………………….. 106
Appendix F: Transcription of Learners’ Responses of Learners who use
Computers at Home ………………………………………………………………… 110
Appendix G: Transcription of Learners’ Responses to Interviews in the Main
Study …………………………………………………………………………………….. 113
Appendix H: Transcription of Teachers’ Responses to Interview Question ……….. 118

viii
Appendix I: Presentation of Results from the Pilot Study ………………………………. 121
Appendix J: Request Permission Letters to the School …………………………………… 136
Appendix K: Consent form ……………………………………. 146
Appendix L: Report on Heymath programme ……………………………………….. 147

ix
LIST OF TABLES
Page
Table 4.1: Percentage average scores of learners’ responses to questionnaire
items ……………………………………………………………………………………………….. 41
Table 4.2: Percentage average scores of learners’ responses per item …………….. 45

x
LIST OF FIGURES
Page
Figure 4.1: The extent to which learners agreed or disagreed with items
in the questionnaire ………………………………………………………………………….. 40
Fig 4.2: The extent to which learners agreed or disagreed with items
in the questionnaire ………………………………………………………………………….. 44

CHAPTER 1
INTRODUCTION
1.1 BACKGROUND
Plotting a graph requires one to first draw the calibrated system of axes and then mark
out the points where on the graph will run. The procedure of plotting a hyperbolic
graph tends to be challenging for learners because it has two foci, two asymptotes
and two branches. All these have to be first determined before the graph can be
plotted.
I note with concern that the way learners go about plotting the hyperbolic graphs tends
to be laborious and time-consuming. Learners performed repeated algorithmic
computations and determined the points and then plotted the graph. Gebrekal (2006)
posits that the construction of graphs using paper and pencil has not only hindered
learners’ progress in understanding graphs, but also fostered in them negative attitudes
towards Mathematics in general and graphs in particular. A hyperbolic graph is defined
by Waski (2012) as a plane curve having two branches.
Learners generally find Mathematics, as a subject, difficult to learn (Centre for
Development and Enterprise (CDE), 2004). One possible reason for the difficulty is the
way Mathematics is taught. According to Tarmizi, Ayub, Bakar and Yunus (2010),
teachers teach Mathematics through the traditional paper and pencil approach. The
paper and pencil approach is the manual procedure used to plot graphs in Mathematics
(Waits, 1997), and, as noted above, it poses difficulties to learners. This contributes to
the difficulties learners have with Mathematics.
Learners need Mathematics as it is a key subject for admission, particularly in areas
such as engineering and medicine. Some of the learners even have a negative attitude

2
towards Mathematics because of the way it is taught (Mogari, Kriek, Stols &
Ogbonnaya, 2009). However, there is an increasing realisation that computers may help
secondary school learners to learn Mathematics and, thus, improve the teaching and
learning of Mathematics.
According to Dunham and Dick (1994), graphing technologies have the potential to
affect the teaching and learning of Mathematics, particularly in the area of graphs.
Some authors recommend the use of technology at all levels of Mathematics instruction
(Mehmet, 2002; Yushau & Wessels, 2003; Goos & Bennison, 2007; Naatanen, 2005;
Alper, 2009). There are researchers who have been striving for better methods to teach
Mathematics by, integrating new technological methods (e.g. Taylor, 1980; Fey, 1989;
Dessart, DeRidder & Ellington, 1999; De Villiers, 1999; NCTM, 2000; Battista, 2001;
Hannafin & Scott, 2001; Hennessy, Fung & Scanlon, 2001; Liu & Cummings, 2001;
Tooke, 2001; Wiest, 2001; Ibrahim, 2004; Berger, 2010).
Several researchers have placed great emphasis upon learners’ thinking, active
learning, discovery learning, and interest in Mathematics (e.g. Heid, 1989; Schroeder &
Lester, 1989; Andrew, 1995; Ahuja, Lim-Teo & Lee, 1998; Choike, 2000). Ahuja and
Jahangiri (2003) allude to the fact that the learner-centred Mathematics classrooms are
now considered more effective than teacher-centred traditional classrooms. According
to Raines and Clark (2011), research findings suggest that when learners are actively
involved in the learning process, there is an increase in learning and persistence, higher
grades and more thorough questioning.
There are studies (e.g. Ng & Gunstone, 2002; Dunham & Dick, 1994; Pomerantz, 1997;
Rowlett, 2013) that have found that computers motivate learners to learn Mathematics.
Difficult Mathematical problems can be solved by pressing a few keystrokes using a
computer. Computers are important in that they can help deal with much more
sophisticated mathematical problem-solving and graphing opportunities in the teaching
and learning of Mathematics. According to the National Council of Teachers of

3
Mathematics (NCTM) (2003), computers provide convenient, accurate and dynamic
drawings, graphing and computational tools. They also provide learners with
opportunities to explore applications and concepts that would be tedious and time-
consuming if the paper and pencil method was used. Computers can also assist learners
with both mathematical computations and also facilitate Mathematics learning. The
current study, therefore, is an attempt to gain more insight into the use of computers in
the teaching and learning of hyperbolic graphs.
1.2 STATEMENT OF THE PROBLEM
According to Mifflin (2000), the hyperbolic graph is composed of two curves that exhibit
symmetry on the system of axes. When using paper and pencil to plot such a graph on
the system of axis, learners have to, among others, determine the asymptotes and
ensure that the graph approaches the asymptotes without touching them. A great deal
of circumspection is required of the learners to do this.
The National Curriculum Statement (NCS) (2003) also states that after learners have
drawn hyperbola graphs, they should generalise the effects of the parameters on the
drawn graphs. Judging from what normally happens when learners plot the hyperbolic
graph, it would seem that the traditional paper and pencil method, which learners use
to plot the hyperbolic graph takes longer, and, thus, affords learners little time to check
the effects of the parameters. It is against this background that I intend to investigate
the use of computers in the teaching and learning of hyperbolic graphs in secondary
school Mathematics.

4
1.3 PURPOSE OF THE STUDY
The purpose of the study was to investigate the use of computers in the teaching and
learning of hyperbolic graphs in Grades 10 to 12. The study sought to address the
following questions:
• What views do learners have about the use of computers to learn hyperbolic
graphs in Mathematics?
• What views do teachers have about the use of computers to teach hyperbolic
graphs in Mathematics?
In addition, the study also addresses the following sub-questions:
• What are the advantages and disadvantages of using computers to teach and
learn hyperbolic graphs?
• How are computers used in the teaching and learning of hyperbolic graphs?
1.4 SIGNIFICANCE OF THE STUDY
This study undertakes to contribute to the good performance of learners in Mathematics
in the District of Vhembe. The Department of Education is trying by all means to
improve results in Mathematics but to no avail. Mathematics plays a pivotal role in a
learner’s future. According to Tarmizi, Ayub, Bakar and Yunus (2010), computers can
enhance understanding of abstract mathematical concepts. This study investigates the
use of computers in the teaching and learning of hyperbolic graphs in Mathematics.
In my capacity as a subject advisor, I realised that learners struggle with graphs. This,
in turn, results in them developing a negative attitude towards graphs in Mathematics.
This study aims to encourage many learners to love Mathematics. Tarmizi, Ayub, Bakar
and Yunus (2010), in their investigation on the use of Autograph software in the study
of calculus in secondary school level, observe that learners who integrate Mathematics
learning with computers enjoy their lessons.

5
There has been an advocacy for the use of computers in Mathematics education.
Despite the possible gains this move may bring about, the challenge remains the
teacher and learner’s readiness and preparedness to buy-in on this initiative. The study,
therefore provides, insight into the views of teachers and learners about the use of
computers in the teaching and learning of Mathematics. In particular, the study
illustrates the extent to which teachers and learners feel ready and confident to use
computers.
The study also provides further insight into the advantages and disadvantages of
integrating computers into the teaching and learning of Mathematics.
It is anticipated that the investigation into the use of computers in the teaching and
learning of hyperbolic graphs will help facilitate and, thus, improve Mathematics results.
The result of this research will be made available to schools so that they can improve
the understanding of learners in the area of graphs.
The following people will benefit from the study: Learners, teachers and parents.
Learners will learn graphs in a simplified manner, using computers. Teachers’ work will
be simplified as the teaching of graphs will be made easier. Parents will also benefit as
the success of learners would bring joy to them, and they, in turn, will give their
support to school programmes within their communities.
1.5 DEFINITION OF KEY TERMS
The section below discusses the working definitions in this study.
• Computer
This refers to an ordinary desktop or laptop which uses a software package.

6
• Software
My study will follow the definition developed by the Radmaste Centre (2008), which
states that software refers to programmes that make the computer perform
different tasks.
• Autograph
Autograph is a software package that can be used in Mathematics to draw graphs.
Butler (2008) indicates that it is a dynamic software which is effective and efficient.
It is also enjoyable and fun to use by both teachers and learners.
• Microsoft Excel
MS Excel is defined by Hallberg (1997) as a programme which makes extensive use
of the graphical user interface such as menus, buttons, icons, and many different
mouse pointers. This is a programme that uses spread sheets; one can draw
graphs and do calculations. This program can be used to draw graphs of all kinds.
• Heymath
This is a software package used in the teaching and learning of grades R-12
Mathematics in some schools in Vhembe District, Limpopo Province of South Africa.
• Hyperbolic function defined
Hyperbola is defined as the set of all points in a plane such that the absolute value
of the difference of the distances from any point on the hyperbola to two given
points, called foci, is constant (seehttp://www.mrperezonlinemathtutor.com
• Technology
Your Dctionary.com defines technology as the application of science or knowledge
to commerce and industry. The dictionary further indicates that the biggest
applications of this type are computers and the internet. In this study, technology
refers to desktop computers or calculators and laptops.

7
1.6 LIMITATIONS OF THE STUDY
The following was identified as a research limitation within the study:
• Some of the learners had poor computer skills and I had to teach them basic
computer skills.
1.7 LAYOUT OF THE DISSERTATION
The dissertation consists of 5 chapters that have been arranged as follows:
• Chapter One provides a general overview of the study. It introduces the problem
of the study, research questions, significance of the study and the definitions of
the terms used in the study.
• Chapter Two is a review of literature related to the research problem. It is based
on the research questions of the study.
• Chapter Three provides the research design and methodology employed in the
study.
• Chapter Four provides a detailed report of the results obtained during the
collection of data.
• Chapter Five gives a summary of the findings and analyses them. It also gives
the conclusions and recommendation of the study.

8
CHAPTER 2
REVIEW OF RELATED LITERATURE
2.1 INTRODUCTION
The review of related literature to this study is organised under the following sub-
headings:The use of computers in the teaching and learning of Mathematics; Learning
of Mathematics with computers versus the traditional paper and pencil method; The
benefits of learning Mathematics with computers; The effectiveness of teaching
Mathematics with computers; Computers in Mathematics classroom; Impact of
computers in teaching and learning Mathematics; Using graphing software to teach
Mathematics; Learning Mathematics with Autograph and Heymath Software; Review of
related empirical studies; and Conceptual framework of the study.
2.2 THE USE OF COMPUTERS IN THE TEACHING AND LEARNING OF
MATHEMATICS
There are studies that have investigated the use of computers in the teaching and
learning of Mathematics (Berger, 2010; Inan & Lowther, 2010; Liu, 2010). Berger
(2010) looked into the use of a computer algebra system (CAS) to solve Mathematics
tasks. Liu (2010) used a simulation-based computer-assisted learning (CAL) to correct
misconceptions about the concept of correlation in statistics. Inan and Lowther (2010)
examined factors affecting the integration of laptops into classroom instruction.
The effects of computer use on learners’ achievement in Mathematics and their
understanding of mathematical concepts have also been researched on (see, for
example, Goos & Bennison, 2007; Alper, 2009). Support for computer use in secondary
school Mathematics is also found in Australia, Brazil and Turkey to mention a few
(Alper, 2009; Goos & Bennison, 2007; Baldin, 2002).

9
Research on the use of computers to teach learners show improved achievement
(Alper, 2009). Meta-analyses give support to the use of computers to study
Mathematics (Kadiyala & Cranes, 1998). Jeffries (1989) noted that numerous meta-
analyses in the use of computer-aided learning (CAL) of Mathematics have resulted in
learners demonstrating a more favourable attitude towards learning with computers
than with direct instruction.
Experience has taught me that teachers in schools, especially in Vhembe District, often
complain about the amount of time they spend on lesson preparations. According to
Yushau, Mji and Wessels (2003), this challenge can be addressed as computers can be
utilised to organise Mathematics instruction. This, by itself, would make teachers spend
less time preparing presentable material for their classrooms.
Isikal and Askar (2005) and Suharwoto (2006) put forward that using computers as a
learning tool improves Mathematics achievement of learners. Computers stimulate
learners to be active in the Mathematics classroom. Raines and Clarke (2011) indicate
that learners are generally attracted to computers.
Teachers also enjoy using computers in the teaching of Mathematics. Cooper and
Norton (2001) point out that computer improve teaching and learning of content areas
by increasing motivation for collaborative participation by learners. The role of teachers
shifts into that of facilitators instead of being the source of all knowledge. Therefore,
computers seem to be beneficial in the teaching and learning of mathematics.
Even though there are many advantages associated with the teaching of Mathematics
using computers, there are however, also some disadvantages.
Lack of access to computers by most learners, make it difficult to use computers to
support learning. This is supported by Belland (2009), who argues that, barriers to

10
teaching with computers include lack of resources such as knowledge, skills and
availability of computers.
Tarmizi, Ayub, Bakar and Yunus (2010) point out that, learning to use computer
software, can also divert the focus of learners away from the content to be learned.
Teachers also need to be trained on how to use computers, in order to teach learners
successfully with computers. This is supported by Belland (2009), who points out that
greater training in computer skills can remove the barriers that can stand in the way of
successfully teaching Mathematics using computers. Teachers have an increased
responsibility of equipping themselves with skills of using computers in the classroom.
Agyei and Voogt (2012) confirm that it is a challenge for teachers to extend their
knowledge, beliefs and dispositions, in order to teach using computers. Persson (2011)
argues that the problem with computers is that less able learners learn less because
they still have to understand how to use computers.
The current study, however, investigates the use of computers in the plotting of
hyperbolic graphs.
2.3 LEARNING OF MATHEMATICS WITH COMPUTERS VERSUS THE
TRADITIONAL PAPER AND PENCIL METHOD
Traditionally, graphs in Mathematics were learnt through the paper and pencil method.
Teachers also employed this approach to teaching graphs. This method has proved to
be ineffective as learners do not perform well in graphs. This is supported by Lin (2008)
who pointed out that pre-service teachers expressed the desire to integrate the use of
computers in their classroom instruction. He further argues that using Mathematics
textbooks often creates a dull classroom. Involving learners in hands-on activities,
where they use computers as resources, will lead to learners understanding content.
Raines and Clarke (2011) support the use of computers over traditional methods of
teaching Mathematics when they insist that learners are generally attracted to

11
computers. They further point out that learners are eager to participate in classroom
activities in computer-intensive classes.
Just like any other method of teaching, challenges will always be there. However, many
benefits, as indicated by the studies cited above, surpass these challenges. Persson
(2011) found that when teaching a computer-intensive class there are learners who
may become proficient in the use of computers and mathematical software, without
grasping the mathematical concepts, in which are the main focus. Persson further
points out that learners who encounter difficulties in using computers may be
disadvantaged in learning Mathematics effectively. A major challenge is that, in
developing countries, there are very few classrooms with computers.
2.4 THE BENEFITS OF LEARNING MATHEMATICS WITH COMPUTERS
There are high expectations for the use of computers in learning Mathematics. In
England, USA, Singapore, Canada, Hong Kong and Korea where computers are made
use of in learning Mathematics, learners perform well (Ruthven & Hennessey, 2002).
Ruthven and Hennessey also indicate that for the majority of other countries where
there is minimal use of computers, performance in Mathematics is low.
Computers in Mathematics teaching have brought a change in the teaching and learning
of Mathematics. According to Goldenberg (2001), computers have made some topics
accessible and provided new ways of representing and handling mathematical
information. Computers can create an atmosphere where learners can construct
mathematical concepts (Gebrekal, 2006). In the computer classroom, the instruction
can change to concept development and problem-solving since these tools remove the
burden of lengthy calculations.
Computers enable learners to draw graphs much easier, quicker and more accurate.
They also help them to devote more time to analysing the graphs. Another benefit of

12
computers, as suggested by Fey (1989), is that they facilitate learners’ progression from
concrete thinking to abstract ideas.
Computers also provide a lot of information in the classroom that is useful in solving
complex problems. The problem of visualisation can be removed as the computer
provides pictures and graphs clearly. Yushau, Mji and Wessels (2003), in a study on
creativity and computers in the teaching and learning of Mathematics, found that
computers can give learners a more self-reliant role in their own education and make
learners become more active agents in their education, thus making them independent
learners. They further indicate that computers can simulate projects that teach learners
teamwork, problem-solving, and critical thinking, as well as increase enthusiasm for
learning. Computers provide learners with alternative modes of teaching for the same
subject.
Raines and Clarke (2011) indicate that learners working with the appropriate computer
software can work with more graphs in a short space of time. One other reason why
the study is conducted is to improve the performance of learners in Mathematics.
Computers seem to bring us hope. The studies cited above have presented numerous
benefits of using computers in Mathematics
However, it should be noted that even though computers have the potential to improve
the teaching and learning of Mathematics, the onus still lies with the teacher to ensure
proper use of computers, in order to optimise the resulting benefits. The current study,
therefore, investigates how computers are used in the teaching and learning of graphs
in Mathematics.
2.5 THE EFFECTIVENESS OF TEACHING MATHEMATICS WITH COMPUTERS
The use of computers in the Mathematics classroom by teachers is being promoted
worldwide. According to Berger (2010), various forms of technology may promote

13
learners understanding of Mathematics. This is supported by Kissane and Kemp (1998)
who indicate that nationally and internationally, education researchers have expressed
high expectations for the potential of computers to improve the teaching and learning
of Mathematics. According to Cooper and Norton (2001), computers play an
increasingly vital role in assisting teachers in the classroom.
Kim, Lee, Spector and De Meester (2013), in the study on Teacher beliefs and
technology integration, claim that there is an enormous contribution of computer
development to all facets of our lives. They further indicate that in the field of
education, teachers are concerned with how to integrate computers into instruction to
improve the quality of Mathematics instruction and also enhance learners’ performance.
A research finding on the use of computers in the teaching and learning of Mathematics
indicates tremendous potential to improve Mathematics education (Yushau, Mji &
Wessels, 2003).
Yushau, Mji and Wessels (2003) found that using computers in the teaching and
learning of Mathematics can empower and provide learners with tools necessary to
promote creativity. The current study will show how computers can assist teachers to
develop a classroom situation that stimulates learner creativity. Yushau et al, further
indicate that having access to a computer is the greatest advantage a teacher can have
because of its versatility.
Most teachers in the schools in Vhembe District complain about making lesson
preparations in Mathematics. This challenge can be addressed as the computer can
organise Mathematics instruction, resulting in teachers spending less time preparing
presentable materials for their classrooms. Learners like computers as they appeal to
the eye, ear, feeling and taste and therefore, can widen and enrich the content and
scope of the teachers and learners educational experiences. The sight or visualisation
barrier is overcome with computers.

14
Computers provide easier and clearer illustrations than those made by a teacher.
Computers, especially in the area of graphs, can be an accurate tool of drawing graphs.
According to Raines and Clarke (2011), working with appropriate computer software
can pack a large amount of graphing experience into a relatively short space of time.
Computers address the time factor in teaching Mathematics, enabling teachers to finish
the syllabus in time.
According to NCTM (2000), computers can help learners to learn Mathematics. They
further point out that, the graphic power of technological tools affords access to visual
models that are powerful, but that many learners are unable or unwilling to generate
independently.
Moila (2006) has also found the benefits of using Mathematics software to include the
following:
• Promoting learners’ higher order thinking skills. Mathematical games and
simulations help learners to apply mathematical ideas to problem situations;
• Developing and maintaining learners’ computation and communication skills;
• Introducing learners to the collection and analysis of data;
• Facilitating learners algebraic and geometric thinking; and
• Showing learners the role of Mathematics in an interdisciplinary setting.
Integrated Mathematics packages allow learners opportunities to explore
problem-based learning.
Moila further indicates that even though there are benefits in using computers in
teaching Mathematics there is need to check how teachers and learners use computers,
as well as the effect computers have in the Mathematics teaching and learning
environment.

15
Suharwoto (2006) explains that the benefits of using computers include increased
accuracy and speed in data collection and graphing, real-time visualisation, interactive
modeling of mathematical processes, ability to collect, compute, and analyse large
volumes of data, collaboration for data collection and interpretation, and more varied
presentations of results. According to Thomas, Bosley, Delos Santos, Gray, Hong & Loh
(2006), computers are used for both investigations and skill development.
It is worth noting that computers help those learners with a problem of sight. That is
why, in this study, software which will enable an investigation of the effects of
computers in the teaching of hyperbolic graphs in Mathematics will be considered.
Policy makers should start to take this issue seriously and design materials to teach
Mathematics using computers.
Isikal and Askar (2005) investigated the effect of spread sheet and dynamic geometry
software on Mathematics achievements and Mathematics self-efficiency. The results
indicate that using computers effectively as a learning tool improves Mathematics
achievement of the learners. Olkun, Altun, & Smith (2005), in the study on Computers
and 2D geometric learning of Turkish fourth and Fifth grades, found that learners
without computers at home initially had lower geometry scores. Olkun et al. (2005)
then suggests that in schools, it seems more effective to integrate mathematical
content and computers in a manner that would enable learners to do playful
mathematical discoveries.
Despite the benefits mentioned above, the study will also involve the observation of
teachers and learners in the classroom. This will provide ample information on what
actually transpires in the classroom when computers are used.

16
2.6 COMPUTERS IN MATHEMATICS CLASSROOM
Thomas, Bosley, Delos Santos, Gray, Hong and Loh (2006) found that when computers
are used in Mathematics classrooms they enable teachers to put more emphasis and
focus on mathematical ideas and concepts that learners have to learn rather than on
the facets and stages of the lessons given that the entire lesson is offered by a
computer. Teachers, therefore, have to know about a computer and how it works.
It is these computer skills that help teachers enhance their teaching, thus making them
effective. If a teacher cannot use a computer efficiently, expeditiously and
appropriately, the quality of learning tends to be adversely affected. In South African
schools, where computers are available, a teacher who plans to use computers and is
deficient in computer skills may not be able to plan and structure the lesson
accordingly. In particular, the activities, facets and stages of a lesson cannot be
properly organised and coordinated to yield a flowing and well-articulated lesson.
Doerr and Zangor (2000) and Godwin and Sutherland (2004) indicate that the teacher
plays a crucial part in lessons involving the use of computers because he has to
structure and shape the computer tasks and learning activities. They add that teachers
provide suitably pre-structured lesson tasks and help learners interpret the results
mathematically. Tarmizi, Ayub, Bakar & Yunus (2010) points out that when a teacher
uses a computer in his teaching, the way the lesson is presented tends to be different
from the usual teacher-centred way of teaching. Perhaps, it is for this reason that
Tarmizi et al. consider a computer to be a change agent because it prompts the teacher
to adopt new ways of teaching.
Of concern though, as Suharwoto (2006) points out, is whether introducing computers
in a classroom also improves learning and thus learner achievement. Probably it is this
concern that has led Rowlett (2013) to argue that the focus should not be on the
preference or otherwise of computers. Instead, it should be on the learning

17
opportunities and difficulties that tend to go with the use of computers in the teaching
of Mathematics.
Clements (2000) insists that computers in the classroom contribute to cognitive
development. He further explains the different ways in which computers can be
introduced in a classroom, and this is in agreement with the research conducted by
Means and Olson (1995), Taft (2000) on the application or uses of computers in the
classroom. According to them, technology takes the following form:
• Training tool: Learners can use technology in online, quizzes, drills and practice
software, or programs that guide learners through specific concepts or problems,
serving as a tutor.
• Research tool: Learners can use technology in exploring and accessing
information, from online resources, networked libraries, and CD-ROMS;
• Intellectual development tool: Learners can use the computer to construct and
produce a variety of information through engaging in interactive games and real
life simulations; and
• Communication tool: Learners can use the technology as a medium of
communication through the different network levels that are available.
Moila (2006) points out that teachers should prioritise the goals and purpose of their
lessons and make the selection of appropriate computer programmes to use in the
teaching secondary. She further states that it could eliminate the use of technology in
a wrong or less than successful manner in the classroom. The Department of Education
(2003) indicates that effective use of computers can enhance creativity, problem-
solving, high order thinking skills and reasoning. Capper (2003) adds that computers
can facilitate the achievement of educational goals. It is against this background that
the current study was being pursued.

18
2.7 IMPACT OF COMPUTERS ON THE TEACHING AND LEARNING OF
MATHEMATICS
According to Tarmizi, Ayub, Bakar & Yunus (2010), computers in education have a huge
impact on learners worldwide. They further allude to the fact that learners learn
differently, and that the computer is there to assist learners who have difficulties in
learning. Computers, therefore, can enhance learning when integrated properly in the
teaching and learning of Mathematics.
The use of computers as a tool facilitates communication among learners and
encourages them to play a more active role in a lesson (Tarmizi, Ayub, Bakar & Yunus,
2010). Tarmizi et al. further highlight that the role of learners in a computer-oriented
lesson is to actively generate, process, and manipulate knowledge. The use of
computers enables more learners to be active processors of knowledge, to appropriately
sort out the given knowledge and to be able to act accordingly on the knowledge being
considered than would be the case in typical teacher-led lessons. Learners are in a
position to define their goals, make design decisions and evaluate their progress
through the aid of computers (Tarmizi, Ayub, Bakar & Yunus, 2010).
The teachers roles change and they are no longer the centre of attention as dispensers
of information, but rather they play the role of facilitators. As learners work on their
computer-supported products, the teacher provides necessary assistance to learners
and guides them through the activities and stages of a lesson by monitoring what they
are doing during the lesson.
According to Prepelita-Raileanu (2008), teachers have to be provided with training that
is relevant and one which concurs with the latest types of computers and computer
software. Butler (2008) indicates that computers have changed the way classrooms
operate, from being teacher-centred to being more interactive and participatory. It is
for this reason that, Butler argues that computers have the potential to develop a better

19
understanding of abstract mathematical concepts because they provide visuals or
graphic representations of what is being taught. Abu Baka, Tarmizi, Ayub & Yunus
(2010) have found that learners learning Mathematics through the use of computers
enjoy their lessons more than their counterparts in traditional lessons where computers
are not used. Learners in South African schools nowadays are surrounded by computers
and, using computers in our schools hopefully, will give us the desired results.
2.8 USING GRAPHING SOFTWARE TO TEACH MATHEMATICS
The area on graphs in Mathematics is challenging to learners (Persson, 2011). The
current study, therefore, looks into the use of computers in the teaching and learning of
Mathematics. Ruthven, Hennessy and Deanery (2008) insist that graphing technology
can contribute to an effective working process and improve production by making it
easier to produce graphs accurately and rapidly. This can increase the efficiency and
pace with which related topics can be taught and learned. Ruthven et al. further
indicates that computers can help us to overcome learning difficulties and build
assurance, through making graphing tasks more accessible to learners who have
difficulties with organisation and presentation.
Computers play the role of supporting processes of checking, trialing and refinement,
through enabling lesson tasks based on trial and improvement, and supporting
mathematical speculation and experimentation within and beyond the lesson agenda
(Ruthven, Hennessy & Deaney, 2008).
The learners who use graphing software to draw graphs have the advantage of
checking the effects of parameters on the graph. This is supported by Ruthven,
Hennessy and Deanery (2008). According to Ruthven et al. computers can help with
overarching issues and accentuate important features, through helping to bring out the
effects of altering particular coefficients or parameters in an equation on the properties
of its graph, and through facilitating comparison of gradients and examination of

20
limiting trends. Thus, I argue that computers can help learners by reducing laborious
written work, and increase the immediacy and interactivity of classroom tasks.
The study by Ruthven, Hennessy and Deaney (2008) illustrates ways in which teachers,
in the course of appropriating graphing software, adapt their classroom practice and
develop their craft knowledge. Ruthven et al. specifically showed how teachers establish
a coherent resource system incorporating software-mediated lesson tasks aligned with
teaching goals, and supported by a common repertoire of suitable graphing techniques.
According to Persson (2011), teachers mentioned more risks of depending on
computers in studying graphs. Amongst the risks mentioned were the fact that learners
have less understanding compared to those using paper and pencil.
In the current study, the Autograph and Heymath software packages are considered as
resources to help learn how to make hyperbolic graphs.
2.9 LEARNING MATHEMATICS WITH AUTOGRAPH AND HEYMATH
SOFTWARES
Autograph environment has 2D and 3D graphing capabilities for topics such as
transformations, conic sections, vectors, slope, and derivatives (Abu-Baka, Tarmizi,
Ayub & Yunus, 2010). Autograph can animate and this enables the user to observe how
graphs, equations, and calculations are constructed. Abu-Baka et al. (2010) further
mention that autograph software evolved in the Mathematics classrooms of Oundle
School, in the United Kingdom. This 3rd version has come of age to embrace all the
possibilities, its use as a drawing resource of statistical graphs, and vectors, as well as
transforming shapes. Autograph software enables users to change and animate graphs,
shapes or vectors already plotted to encourage understanding of the concept. The
software programme also uses colour and animation. Thus the autograph software has
the potential to be an excellent teaching aid.

21
Integrating Autograph in Mathematics teaching and learning might increase the
effectiveness and improve the quality of teaching. I, therefore, assert that Autograph is
an extremely useful educational tool for both Mathematics teachers and learners
because it has the potential to play a much more facilitating role in lesson presentation,
and it can provide learners with visual demonstrations that can be very helpful when
learning a concept.
Another software package for teaching graphs in Mathematics is the Heymath. Stat
(2005) describes Heymath as the Web-based platform that enables learners and
teachers to learn from the best trained teacher in the world. Heymath materials are
accompanied by animated lessons that learners can do on their own.
According to a report by Mathematics Science and Technology (MST) (2011), Heymath
is a world class E-Learning programme that supports the work of teachers and helps
learners build a strong foundation in Mathematics. The MST report further states that
the Heymath is used by learners in over 55 countries, and that it has been a leading
programme in Singapore for the past ten years. It is also used by schools in India and
South Africa.
In the Limpopo Province, 120 secondary schools had the Heymath programme installed.
Subject advisors in Mathematics were trained in this programme so that they in turn
would be able to support schools with this programme (Report by Mathematics Science
and Technology (MST) 2011). (See Appendix L).
Thus the main focus of my study is on the use of computers using Autograph and
Heymath software programmes in the teaching and learning of hyperbolic graphs.

22
2.10 REVIEW OF RELATED LITERATURE
Thomas (2006), in a longitudinal study carried out in the secondary schools in the
Carribean on how Mathematics teachers use computers, found that computers were not
used effectively. In 2005, teachers in New Zealand Secondary Schools were asked
about the advantages and disadvantages of using computers in teaching Mathematics
and they came up with the following:
• Eight (8%) percent of the teachers believed that computers aided understanding
compared to 32% who thought it made working quicker or more efficient; and
• Sixteen point eight percent (16.8%) claimed that it impeded learning or
understanding. This is in agreement with Manoucherhri’s (1999) findings which
states that teachers are not convinced about the usefulness of computers in their
instruction.
Clarke (2007), in the study on exploring the use of computer technology in a Caribbean
context, concluded that the Caribbean setting faced many similar challenges to those in
developed and developing countries when newly qualified teachers attempted to apply
new technologies.
O’ Callaghan (1998) investigated how learners conceptual comprehension of graphs
differed because of the method they were taught. O’ Callaghan’s framework of study
was derived from the function model which consists of four components, namely
modeling, interpreting, translating and reifying. Three classes of algebra learners were
sampled. One of these three classes used a computer–intensive algebra programme
(CIA) and the other two were traditional teacher-instructed classes (TA). Results from
the quantitative analysis showed that the CIA learners demonstrated better overall
knowledge of graphs, components of modeling and interpretation.
Analysis of the interviews showed that learners from the CIA class reacted more
positively to their curriculum than the TA learners. The findings from both quantitative

23
and qualitative aspects of this study indicated that the CIA learners had a better
understanding of the function concept.
Hollar and Norwood (1999) examined the effects of a graphing approach intermediate
algebra curriculum on learners’ comprehension of the function concept. The purpose of
their study was to find out whether a curriculum using hand–held graphing calculators
facilitated reflection of knowledge concerning the function concept. O’Callaghan’s
function test was used to assess learners’ understanding of graphs. Hollar and
Norwood concluded that the learners who had access to graphing calculators had a
significantly better understanding of the function concept.
Porzio’s (1999) study looked at the effect of differing emphasis in the use of multiple
representations and technology on learners’ understanding of calculus concepts. This
study was conducted by examining three types of calculus classes, namely: traditional
calculus course, a calculus course that included the graphics calculator, and an
electronic course using computers. Porzio found that learners from the course that was
completely taught by a computer showed the best understanding of various calculus
concepts.
Monaghan (2004) investigated what high school teachers do when they use digital
technology in their lessons. Thirteen English Mathematics teachers from seven English
high schools took part in Monaghan’s study. Monaghan’s findings suggest that the
teacher in a technology-based lesson takes the mediator role rather than a facilitator.
According to Monaghan, a mediator is a teacher who plays an active role in learners’
learning.
Farrell (1996), when investigating teachers’ use of technology in a Mathematics
classroom, was able to compare the teacher’s role with and without the use of
technology. Farrell found that the roles that the teachers exhibited when using
computers differed from when computers were not used. The teachers displayed

24
managerial roles in both instances that is, when using computers and when not using
them. However, Farrell realised in her study that teachers assumed the role of
consultant, fellow investigator, and resource more often when using technology. Farrell
then concluded that when technology was used teachers held on to their roles as
managers and task setters, while taking on new roles of consultant and fellow
investigators.
Zhao (2007) investigated the perspectives and experiences of 17 social studies teachers
following technology integration training. Findings in this investigation showed that
teachers held a variety of views towards technology integration. The teachers’ views
influenced how they used technology in the classroom. Most teachers support the use
of technology in their classrooms.
Challoo and Marshall (2005) examined the levels of availability, effectiveness, and
utilisation of computer technology by secondary school Mathematics teachers. The
study was conducted among 74 Mathematics teachers. The results indicated that
teachers have problems accessing computers, and that a strong need for more
curricular–based software exists. Data showed that computer technology is helpful in
instructional procedures and in the student learning process.
Tarmizi, Ayub, Bakar and Yunus (2010), in their study on effects of technology-
enhanced teaching on performance and cognitive load in calculus, found that learners
are encouraged to learn using computer softwares. Tarmizi et al., in particular,
concluded that the autograph integrated learning strategy is instructionally more
efficient and thus superior to the conventional instruction strategy. The study by
Tarmizi et al. (2010) shows prominent implications for the potential use of autograph
software.
Raines and Clarke (2011) support the use of computers in the teaching and learning of
Mathematics when they insist that integrating and using computers in the teaching of

25
Mathematics can encourage learners to be active in classrooms. However they also
warn that teachers need to know that learners must not only master computer usage,
but that they should master content as well. They conclude by stating that computers,
as with any other teaching tool can be used effectively or poorly.
Agyei and Voogt (2012), in their study on developing technological content knowledge
in pre-service Mathematics teachers, found that there was need to develop
technological pedagogical content knowledge for pre-service teachers. They further
point out that even though pre-service teachers need integration of technology with
Mathematics that is not actually what is happening in the ground.
Rowlett (2013), in his study on developing a healthy skepticism about technology in
Mathematics teaching, agrees that computers when placed in proper context can be
useful in aiding learners to understand Mathematics. He further states that computers
may not provide benefit, but that benefits may be achieved by changing the approach
to one driven by the use of computers.
Although these research results are extremely encouraging, not all the results have
been positive. Hall (1993), Pankow (1994), Rich (1993), Ritz (1999) and Smith (1996)
reported that there were no significant differences in achievement between learners
who use computers and those who do not use computers. Dunham and Dick
(1994:442) also found that in a college pre-calculus course the use of graphing
technology did not show improvement in learners’ understanding of graphs. Giamati
(1991) reported that the use of graphic calculators affected learners’ performance
negatively. According to Giamati’s report the control group of learners which did not
use graphic technology understood graphical transformations and curve sketching
better than the experimental group which used graphic technology. The current study
intends to investigate the use of computers in the teaching and learning of hyperbolic
graphs.

26
Results from research on the use of computers to teach learners show improved learner
achievement (Alper, 2009). Alexander (1993), Chandler (1993), Durmus (2000),
Funkhouser (1993), Hollar and Norwood (1999), Kulik and Kulik (1991), Graham and
Thomas (2000), Quesda and Maxwell (1994) and the International Study Centre (1998)
reported that learners who use computers in Mathematics obtained higher scores than
those learners who did not use them. Thus the current study sought to establish how
computers are used to teach problem concepts such as hyperbolic graphs.
Yushau, Mji and Wessels (2003) identified the following benefits of using computers in
the teaching and learning of Mathematics:
• Computers can empower and provide learners with necessary tools for
promoting creativity;
• Having access to a computer is the greatest advantage a teacher can have
because of its versatility;
• Teachers can effectively address the challenge of organising Mathematics
instruction and will, therefore, not spend a lot of time preparing presentable
materials for their classrooms;
• With multimedia capabilities, computers, have the capabilities of appealing to the
eyes, ears, feelings and taste and, therefore, can widen and enrich the content
and scope of their educational experiences;
• With computers, learners can visualise mathematical concepts which are difficult
to comprehend without computers;
• Computers provide easier and clearer illustrations than those teachers could
make; and
• Working with appropriate computer software can pack a large amount of
graphing experience into a relatively short space of time.
Computers allow learners to draw graphs more easily, quickly and accurately, as well as
to manipulate the graphs, to develop and generalise about graphs (Gebrekal, 2006).

27
The literature shows that classrooms in which computers are used provide a conducive
environment for learning. Farrel (in Dunham & Dick, 1994:443) notes that learners
became more active in classrooms in which computers were used. In classrooms where
computers are used, learners have the opportunity to experiment and find out for
themselves, and their roles change from passive to becoming more involved in group
work, real problem-solving, investigating and consulting with computers (Pollak, 1986).
The current study investigated the issue of computers in Mathematics teaching and
learning further.
2.11 CONCEPTUAL FRAMEWORK OF THE STUDY
The study has been conceptualised, firstly, around the fact that schools in the Vhembe
District have been provided with computers to help in the teaching and learning of
Mathematics. Schools in the Vhembe District use Autograph and Heymath software
packages. The framework of this study emanates also from the fact that, historically,
classes in the Vhembe District have always been teacher-centred. This is the approach
where the teacher works one or two examples for the learners on the chalk board, and
then gives them exercises based on the worked examples. Tarmizi, Ayub, Bakar and
Yunus (2010) refer to the teacher- centred approach as an approach, where learners
are passive recipients to the teacher’s, delivery of complete information. The teacher in
this instance is the main source of information to be taught to learners. Mathematics is
a subject which by nature, demands active participation by learners. Computers require
learners to mainly work on their own. In other words, introducing computers in schools
brings about learner-centredness. This study intends to determine, in a way, teachers
and learners views about the extent to which learner-centredness prevails in their
schools that have incorporated computers in the teaching and learning. Introducing
computers in the schools in Vhembe District thus had challenges where teachers first
had to be taught about the computers and also how to use them in teaching. It was
hoped that the computers would help improve learner achievement, particularly in

28
subjects like Mathematics (cf Kimmis & Johannesen, 2007; Goos & Bennison, 2007;
Naatanen, 2007; Baldin, Weigand & Alper, 2009).
A similar view is advanced by Kyriazis and Korres (2001), who argued that by
introducing computers in the teaching and learning of Mathematics, the effects and
weaknesses of traditional teaching would be reduced and that this would improve
learner achievement. Given the potential a computer has as teaching and learning
resource (Ng & Gunstone, 2002; Abu-Baka, 2005; Kimmis, 1995; & Johannesen, 2007;
Goos & Bennison, 2007; Naatanen, 2007; Baldin, 2002; & Alper, 2009), the current
study investigated how computers are used to teach and learn problem concepts such
as hyperbolic graphs in Mathematics.
Secondly, there are trends emerging in literature on the use of computers in
Mathematics teaching and learning. For example, as Goos and Bennison (2007) point
out, a lot of attention has been given to examining the effects of computer use on
mathematical achievement, while little attention has been placed on how teachers use
computers in their teaching. As Cuban et al. (2002) explain, in some schools teachers
do not use computers because of the unconducive conditions in those schools. Some of
the unconducive conditions in the schools include unchanging school structures,
obsession to finish the prescribed syllabus timeously, which made teachers to rely
heavily on the teacher-centred instructional approach, and teachers not given sufficient
and suitable training on how to use computers in the teaching and learning of
Mathematics. The report by Smith-Gratto and Fischer (1999) that lack of appropriate
teacher training is often considered as the main problem in using computers in teaching
and learning corroborates the issue on teacher training. The issue of inadequate
teacher development programmes focusing on the use of computers in teaching and
learning was also noted by Moila (2006) and Marshall (2005).
Smith-Gratto and Fischer also pointed out that after training teachers on how to use
computers, there is no guarantee that they will be able to integrate computers in their

29
teaching. This argument is also supported by Raines and Clarke (2011) who insist that
teachers need to learn not only how computers are used, but also why the use of
computers is important. Moila (2006) also insists that there has to be a balance
between training teachers in computer use and creating awareness among teachers
about the benefits of using computers in Mathematics teaching and learning.
Norton and Cooper (2001), in their study on factors influencing computer use in
Mathematics teaching in secondary schools, found that teachers were reluctant to use
computers in their teaching largely due to their beliefs about Mathematics, pedagogical
knowledge, their knowledge of how to use computers, and the learning of Mathematics.
Norton and Cooper also found that one way of solving these problems could be to
develop programmes that would encourage teachers to move slowly away from their
existing practices.
Another factor that tends to impede teachers from using computers in their teaching is
the one that was found by Moila (2006). Moila found that there were no guidelines or
policies on the use of computers in schools. Thomas (2006) points out that few
secondary schools in the Caribbean had a policy on the use of computers in teaching
and learning. This policy stated that computers should be used wherever possible. In
this study, the issue of teaching educators to use computers was addressed.
Introducing computers in Mathematics teaching and learning calls for changes in the
respective roles played by teachers and learners. Teachers become facilitators of
learning while learners become active participants in the learning process. According to
Wheeler (2000), teachers should engage learners in more collaborative lesson activities
and encourage learners to actively participate in the learning process. The lesson
activities have to be cognitively demanding and thought-provoking so that critical and
creative thinking can be developed, and learners can simulate and visualise lesson
activities on computer monitors. As Jarret (1998) points out, such an instructional

30
approach tends to bridge concrete and abstract thinking. It is against this background
that the current study was pursued.

31
CHAPTER 3
RESEARCH DESIGN AND METHODOLOGY
3.1 INTRODUCTION
This chapter discusses the methodology applied in this study. In particular, the chapter
gives attention to the following aspects: research design, population, sampling and
sampling techniques, instrument for data collection, data collection procedures, and
data analysis.
3.2 RESEARCH DESIGN
The study followed a descriptive survey design as I was interested in determining the
extent to which computers are used in the teaching and learning of hyperbolic graphs.
It should be noted that the purpose of my study was to understand the phenomenon
on the ground, that is, the study’s focus was to get information on the use of
computers in Mathematics teaching and learning. The idea of adopting such a design is
also supported by Cohen and Manion (2007:207), who insist that ‘descriptive surveys
simply describe data on variables of interest’. In this study the variables of interest is
the use of computers in teaching and learning hyperbolic graphs in secondary school
Mathematics. Leedy (2005) asserts that the descriptive survey design is typically
concerned with determining the frequency with which something occurs. Hence a
descriptive survey design was chosen to attempt to find the proportion of learners who
enjoys using computers in learning hyperbolic graphs.

32
3.3 POPULATION
In this study, the population consisted of Grade 10 to 12 learners and their teachers in
schools in the Vhembe District, Limpopo Province.
3.4 SAMPLING PROCEDURES
A convenience sampling technique was used to identify schools for the current study.
The total number of schools identified was nine. In each of the nine schools, I then
randomly selected fifteen learners from Grades 10 to 12. Five learners were selected
from each grade. Altogether 135 learners and 7 teachers completed the questionnaire
in the study. Given the nature of the problem of my study and its design, I deemed the
sample size appropriate.
3.5 DATA GATHERING INSTRUMENTS
I used two types of data gathering instruments. Firstly, I employed the questionnaire
(see Appendix A) for learners. The questionnaire inquired on how learners use
computers in learning hyperbolic graphs.
Secondly, I used the interview schedule (see Appendix B and C) to collect data from
both learners and teachers. Interviews offered me an opportunity to understand the
experiences of the teachers and learners.

33
3.5.1 Development of the Instruments
3.5.1.1 Questionnaire Instrument
In this study, questionnaires were adapted from the study by Gebrekal (2006) entitled
“The influence of the use of computers in the teaching and learning of graphs in school
Mathematics”.
In this study, I adapted Gebrekal’s instrument used to collect data relating to quadratic
equations. The originator of the instrument concentrated on quadratic equations.
Guided by this instrument, I modified the instrument in Gebrekal (2006) which focused
on hyperbolic graphs. Where Gebrekal concentrated on MS Excel and RJS software, I
focused on Autograph and Heymath (see Appendix A).
One questionnaire for the learners was used in the study. The questionnaire used four
Point Likert-type scales and had two sections, each consisting of ten closed questions.
Respondents were required to indicate the extent to which they strongly agree, agree,
disagree or strongly disagree. The first set of questions dealt with personal information.
The second section focused on how the learners used Autograph to learn hyperbolic
graphs (see Appendix A).
The purpose of the questionnaire was to investigate the use of computers on learners’
problem solving, their motivation and attitude towards themselves and the teachers in
learning hyperbolic graphs using computers.
3.5.1.2 Interview
Semi-structured interviews were made up of two schedules. One schedule was for
Mathematics learners (see Appendix B) and the other one was for teachers (see
Appendix C). The first three questions in the teachers’ schedule focus on how the

34
teachers used the computers. The fourth question focus on the experiences of the
teacher in teaching hyperbolic graphs using the computer. The 5th question inquired on
the advantages of using computers when teaching graphs. The challenges teachers
encounter when they use computers in teaching Mathematics were considered. The first
three questions in the learners’ schedule dealt with how the learners used the computer
to learn Mathematics. The fourth question dealt with the experiences of the learner in
learning hyperbolic graphs using a computer. The 5th question sought to find out the
advantages of using computers when learning hyperbolic graphs. The literature review
considers this under the benefits of learning Mathematics with computers. The
challenges learners encounter when they use computers in learning Mathematics were
considered. Thirty learners who had computers at home were interviewed. These are
learners who used computers to do mathematical tasks at home. Seven teachers were
interviewed.
The purpose of the interview was to investigate the use of computers on learners’
attitude, motivation and problem solving in the learning of hyperbolic graphs. The
researcher wanted to probe far beyond the answer to the standardized prepared
questions to get more information.
3.5.1.3 Learners’ interview
The semi-structured interview schedule consisted of eight open-ended questions
designed and conducted after completion of the experiment. Thirty learners were
interviewed in this study. A tape recorder was used to record the responses.
3.5.1.4 Teachers’ interview
All seven teachers who participated in the study were interviewed. The purpose of the
interview was to gather the teachers’ views on the use of computers in the teaching
hyperbolic graphs in Mathematics.

35
3.6 VALIDITY AND RELIABILITY OF INSTRUMENTS
The validity and reliability of the instruments used in this study is the section discussed
below.
3.6.1 Validity
In addition to piloting the questionnaires, it was also given to an established researcher
to validate. All the suggestions and recommendations were taken into consideration to
ensure validity. The content validity of the questionnaire instrument was carried out.
The researcher wanted to assess the learners’ interest in learning hyperbolic graphs
with computers. The instrument indicates a high content validity as high percentages of
leaners showed interest in using computers to learn hyperbolic graphs.
3.6.2 Reliability
The Cronbach alpha was then used to determine the internal consistency of the
questionnaires. The instrument was administered to 35 learners in pilot study. The
reliability coefficient obtained for section B and section C was an overall alpha of 0.71.
3.7 PILOT STUDY
A pilot study was conducted in one of the schools where computers were used in the
teaching and learning of Mathematics in one of the districts in Limpopo. The
questionnaire was administered to Grades 10 to 12 learners. The respondents were
asked to complete a four point Likert type scale questionnaire and indicate the extent to
which they strongly agree, agree, strongly disagree and disagree with the statement.
From this, the frequencies and percentage distribution of frequencies of learners’
responses to items were calculated and this was followed by a reliability analysis (see
Appendix I).

36
The data gathered through the questionnaire in the pilot study strongly supports the
argument that computers are useful in teaching and learning hyperbolic graphs. The
results from learners’ interviews show that learners enjoy learning hyperbolic graphs
using computers. However a few learners did not favor the method of using computers
in learning hyperbolic graphs. They indicate that in tests and examinations computers
are not allowed in the exam rooms and this could create problems if one depends on
them entirely.
3.8 IMPLICATIONS OF THE PILOT STUDY FOR THE MAIN STUDY
Based on the results of the pilot study, I concluded that the main study would be
feasible. The descriptive survey design was appropriate for the nature of the problem I
sought to address. The instruments used were able to give the desired data to address
the research questions.
3.9 DATA GATHERING PROCEDURES
Following the outcomes of the pilot study, I then embarked on the data collection for
the main study. Nine secondary schools were visited in a period of two weeks, in order
to collect data. Teachers in each school helped me administer the questionnaires to
learners. The questionnaire was administered to one hundred and thirty five learners in
nine secondary schools. In each secondary school, the last period was used to
administer the questionnaire. Fifteen learners in each school completed the
questionnaire. The researcher scored the questionnaire. During study time, learners
who had computers at home were interviewed in English. A video recorder was used to
record learners’ responses. It took me about forty minutes to interview all the learners
in each school. The teachers were then interviewed after learners’ interviews. It took
me twenty minutes to interview all the teachers in each school.

37
3.10 DATA ANALYSIS TECHNIQUE
I used descriptive statistical analysis to analyse data from the questionnaire. Descriptive
statistics summarised the general nature of the responses to the questionnaire items
and the relationship between questionnaire items and responses that were closely
related (Leedy 2005). Learners responded to items in the questionnaire using a four
point Likert scale with the following choices: strongly disagree, disagree, agree and
strongly agree. A statistician analysed the learners’ responses and gave statistical
interpretation of data. The responses to questionnaire items were presented using bar
charts and frequency tables. Data from the interview were transcribed (see Appendix D,
F, G and H). Learners who were interviewed were all those who used computers at
home to do Mathematics problems. They were thirty in number. After the transcription,
I grouped the interviews into themes and categories and similar categories were then
analysed and interpreted.
3.11 ETHICAL CONSIDERATION
This entails informing participants of the study about their rights in taking part, as well
as making them understand the purpose of the study as indicated in the consent form
in Appendix K. Letters requesting permission to carry out the study were given to the
principals. All the nine principals stamped the letters and permission was granted to the
researcher to conduct the study in these schools (see Appendix J for the letters). The
study was ethically cleared by the university.
(a) Informed Consent
The participants were informed about the nature of the study to be conducted so that
they could decide whether to take part or not. The participants were informed about
the nature of the research and issues on confidentiality. (See Appendix K, for the
informed consent form).

38
(b) Confidentiality
The information provided to the researcher is confidential and would be used for
research purposes only (See Appendix K).

39
CHAPTER 4
DATA ANALYSIS AND INTERPRETATION
4.1 INTRODUCTION
The purpose of this chapter is to present, analyse and interpret data. Data collected in
the main study are presented below. Data collected through the questionnaire are
presented first, and then followed by the interview responses.
4.2 DATA FROM THE LEARNERS’ QUESTIONNAIRE
The learners responded to items in the questionnaire by indicating the extent to which
they either agreed or disagreed with each item. The frequencies and percentage
distribution of frequencies of learners’ responses per item were calculated followed by a
reliability analysis.
The figures and tables below show the responses of learners in the questionnaire. The
responses determine the extent to which learners used computers when they learned
hyperbolic graphs. Figure 4.1 shows the extent to which learners agreed or disagreed
with the items on the use of computers to learn hyperbolic graphs.

40
Figure 4.1: The extent to which learners agreed or disagreed with items in
the questionnaire

41
Table 4.1: Percentage average scores of learners’ responses to questionnaire
items
Respons
e
Item
1
Item
2
Item
3
Item
4
Item
5
Item
6
Item
7
Item
8
Item
9
Item
10
Strongly
Disagre
e
0% 0% 0% 2% 0.3% 5.9% 0% 1.3% 4% 0.3%
Disagre
e
0% 0.3% 11.1
%
6.6% 10.2
%
10.2
%
9.8% 10.2
%
16.6
%
10.3
%
Agree 48.8
%
68.7
%
44.3
%
32% 46.5
%
34% 48.8
%
47.2
%
42.7
%
49.4
%
Strongly
Agree
51.1
%
31% 44.6
%
59.4
%
43% 49.9
%
41.4
%
41.3
%
36.8
%
40%
Table 4.1 presents the percentage average scores of learners’ responses per item in the
questionnaire.
The data in Figure 4.1 and Table 4.1 is the same but presented differently. The
interpretation of the data in Figure 4.1 and Table 4.1 is presented below.
All the learners (100%) agree with item 1 that hyperbolic graphs are an interesting
topic to learn using the computer software programme, Autograph or Heymath. All
learners (100%) agree with item 2 that it is convenient to solve a hyperbola graph
problem using the computer software programme, Autograph or Heymath. The majority
(44.3% agree) and (44.6%) strongly agree with item 3 that the use of a computer
software programme in learning hyperbolic graphs enables learners to create a table of
values of the graphs quickly. Only 11.1% of the learners disagree that the computer is
helpful in learning hyperbolic graphs and that it enables learners to create tables of
value of the graphs quickly.

42
A substantial number of learners (59.4%) strongly agree and (32%) of the learners
agree with item 4 that the use of computers in teaching hyperbolic graphs enables
learners to draw graphs easily. A small percentage (6.6%) disagrees and (2.2%)
strongly disagree that the use of computers in learning hyperbolic graphs enables
learners to draw graphs easily. Most of the learners either agreed (46.5%) or strongly
agreed (43%) with item 5 that the use of computer in learning hyperbolic graphs
enables a learner to get sufficient time to investigate the nature and properties of the
graphs.
A significantly smaller percentage (0.3%) strongly disagrees and (10.2%) disagree that
the computers are helpful in learning hyperbolic graphs and that they enable learners to
get time to investigate the nature and properties of graphs. A significantly larger
percentage of learners strongly agree (49.9%)or agree (34%) agree with item 6 that
the computers are helpful in learning hyperbolic graphs and that they encourage
learners to work in groups. A smaller number of learners (5.9%) strongly disagree and
(10.2%) disagree that computers are convenient in encouraging group work.
A substantial number of learners (41.4%) strongly agree and 48.8% of the learners
agree with item 7 that the use of computers in learning hyperbolic graphs gives the
learners the opportunity to share their views with their peers. A small percentage
(9.8%) disagree that the use of computers in learning hyperbolic graphs gives learners
the opportunity to share views with their peers. A fair number of learners (41.3%)
strongly agree and 47.2% of the learners agree with item 8 that the use of computers
in learning hyperbolic graphs gives learners the opportunity to share their views with
their teachers. A small percentage (10.2%) disagrees and 1.3% strongly disagree that
the use of computers in learning hyperbolic graphs gives learners the opportunity to
share views with their teachers.

43
The majority agrees (42.7%) and 36.8% strongly agree with item 9 that the use of a
computer software programme in learning hyperbolic graphs motivates learners to work
independently on their problems. Only 4% of the learners strongly disagree and 16.6%
of the learners disagree that the computer is helpful in motivating learners to work
independently on their problems.
A significantly large percentage of learners (40%) strongly agree and 49.4% agree with
item 10 that the computers are helpful in learning hyperbolic graphs and giving learners
opportunities to engage with real life mathematical problems. A smaller number of
learners (10.3%) strongly disagree and 0.3% disagree that computers are convenient in
giving learners the opportunity to work with real life mathematical problems.
In summary, data in Figure 4.1 and Table 4.1 above show us that a high percentage of
learners agree that computers are useful in learning hyperbolic graphs. Only a small
percentage of learners disagrees that computers are useful in learning hyperbolic
graphs.
In Figure 4.2 below, the learners’ responses have been categorised into agree or
disagreed. That is, each of the positives (strongly agree and agree) were grouped
together and likewise the negatives (i.e. disagree and strongly disagree). Figure 4.2
shows how learners agreed or disagreed with items on the use of computers to learn
hyperbolic graphs.

44
Fig 4.2: The extent to which learners agreed or disagreed with items in the
questionnaire.

45
Table 4.2: Percentage average scores of learners’ responses per item
Response Item
1
Item
2
Item
3
Item
4
Item
5
Item
6
Item
7
Item
8
Item
9
Item
10
Strongly
Disagree
or
Disagree
0% 0.3% 11.1% 8.6% 10.5% 16.1% 9.8% 11.5% 20.5% 10.6%
Agree or
Strongly
agree
100% 99.7% 88.9% 91.4% 89.5% 83.9% 90.2% 88.5% 79.5% 89.4%
Table 4.2 presents the percentage average scores of learners’ responses per item in the
questionnaire.
Data in Figure 4.2 and Table 4.2 is the same data presented in graph format and table
format. The explanation of these data is given below. In this discussion, strongly
disagree and disagree is referred to as disagree and strongly agree and agree as agree.
All the learners (100%) agree with item 1 that a hyperbolic graph is an interesting topic
to learn using the computer software programme, Autograph or Heymath. The majority
of learners (99.7%) agree with item 2 that it is convenient to solve a hyperbola graph
problem using the computer software programme, Autograph or Heymath. A
significantly small percentage (0.3%) disagrees that it is convenient to solve a
hyperbola graph with a computer.
The majority (88%) agree with item 3 that the use of a computer software programme
in learning hyperbolic graphs enables learners to create a table of values of the graphs
quickly. Only 11.1% of the learners disagree that the computer is helpful in learning

46
hyperbolic graphs and that it enables learners to create tables of values of the graphs
quickly.
A substantial number of learners (91.4%) agree with item 4 that the use of computers
in learning hyperbolic graphs enables learners to draw graphs easily. A small
percentage (8.6%) disagrees that the use of computers in learning hyperbolic graphs
enables learners to draw graphs easily.
The majority (89.5%) agree with item 5 that the use of computers in learning
hyperbolic graphs enables a learner to get sufficient time to investigate the nature and
properties of the graphs. A significantly small percentage (10.5%) disagrees that
computers are helpful in learning hyperbolic graphs and that they enable learners to get
time to investigate the nature and properties of graphs.
A significantly large percentage of learners (83.9%) agree with item 6 that the
computers are helpful in learning hyperbolic graphs and that they encourage learners to
work in groups. A smaller number of learners (16.1%) disagree that computers are
convenient in encouraging group work.
A substantial number of learners (90.2%) agree with item 7 that the use of computers
in learning hyperbolic graphs gives the learners the opportunity to share views with
their peers. However a small percentage (9.8%) disagrees. A large number of learners
(88.5 %) agree with item 8 that the use of computers in learning hyperbolic graphs
gives learners the opportunity to share views with their teachers, while a small
percentage (11.5%) disagrees.
The majority (79.4%) agrees with item 9 that the use of a computer software
programme in learning hyperbolic graphs motivates learners to work independently on
their problems. Only 20.6% of the learners disagreed.

47
A significantly large percentage of learners (89.4%) agree with item 10 that computers
are helpful in learning hyperbolic graphs and that they give learners an opportunity to
engage with real life mathematical problems. A smaller number of learners, however
(10.6%) disagree that computers are convenient in giving learners opportunity to work
with real life mathematical problems.
In summary, data in figure 4.2 and table 4.2 above show that a high percentage of
learners agrees that computers are useful in learning hyperbolic graphs. Only a few
learners indicate that computers are not useful in learning hyperbolic graphs.
Even though many learners agree that computers are useful in learning hyperbolic
graphs, it is noted, that, since the Likert-scale was used, in responding to the
questionnaires, what learners believe in, is not necessarily what they sometimes do.
4.2.1 Analysis of the Learners’ Questionnaire Responses per Item
The focus in this section is on analysing the learners’ responses item by item.
Furthermore, the learners’ responses have been categorised into agree or disagree.
This means that each of the positives (strongly agree and agree) were put together and
likewise the negatives (disagree and strongly disagree).
Question 1: Hyperbolic graph is an interesting topic to learn using a
computer software programme (Autograph and Heymath)
Response Item 1
Strongly Disagree
or Disagree
0%
Agree or Strongly
agree
100%
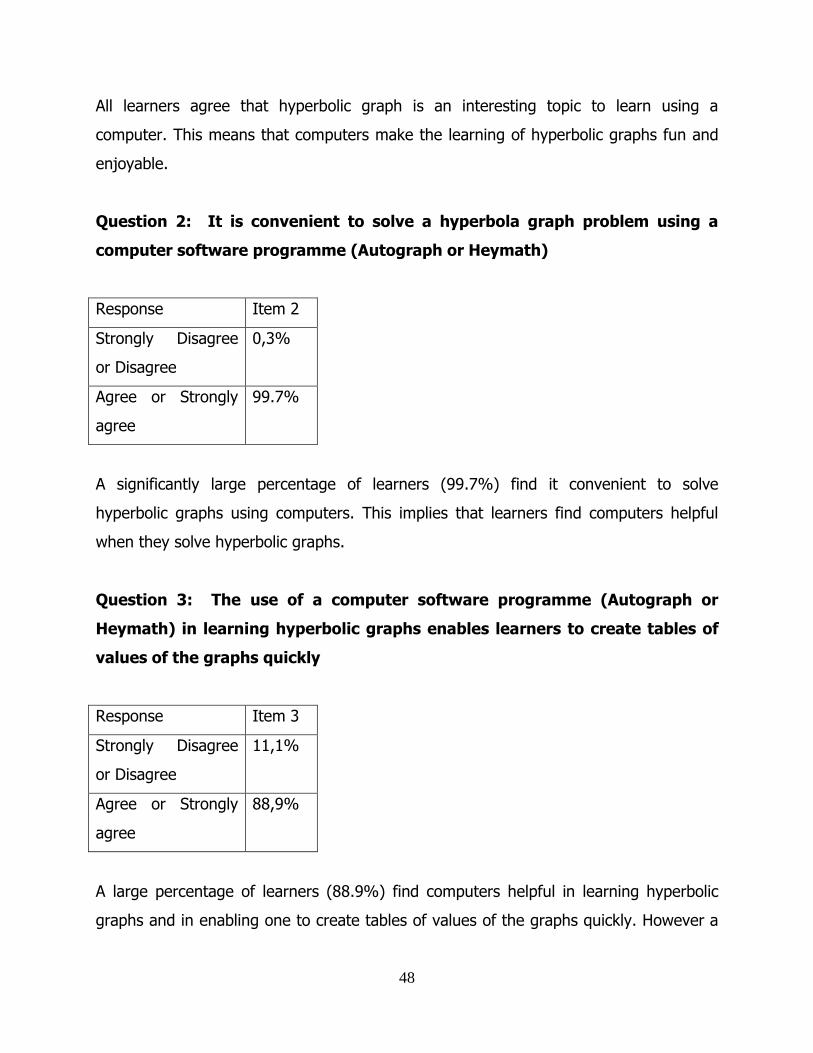
48
All learners agree that hyperbolic graph is an interesting topic to learn using a
computer. This means that computers make the learning of hyperbolic graphs fun and
enjoyable.
Question 2: It is convenient to solve a hyperbola graph problem using a
computer software programme (Autograph or Heymath)
Response Item 2
Strongly Disagree
or Disagree
0,3%
Agree or Strongly
agree
99.7%
A significantly large percentage of learners (99.7%) find it convenient to solve
hyperbolic graphs using computers. This implies that learners find computers helpful
when they solve hyperbolic graphs.
Question 3: The use of a computer software programme (Autograph or
Heymath) in learning hyperbolic graphs enables learners to create tables of
values of the graphs quickly
Response Item 3
Strongly Disagree
or Disagree
11,1%
Agree or Strongly
agree
88,9%
A large percentage of learners (88.9%) find computers helpful in learning hyperbolic
graphs and in enabling one to create tables of values of the graphs quickly. However a

49
few learners (11.1%) do not find computers helpful in enabling them to create tables of
the graphs quickly. This implies that many learners find computers helpful in creating
tables of the graphs, while a few learners do not find computers helpful.
Question 4: The use of a computer in learning hyperbolic graphs enables
learners to draw graphs easily
Response Item 4
Strongly Disagree
or Disagree
8,6%
Agree or Strongly
agree
91,4%
A significantly large percentage of learners (91.4%) find it convenient to draw
hyperbolic graphs using computers. This implies that learners find computers helpful
when they draw hyperbolic graphs.
Question 5: The use of computers in learning hyperbolic graphs enables a
learner to get sufficient time to investigate the nature and properties of the
graphs
Response Item 5
Strongly Disagree
or Disagree
10,5%
Agree or Strongly
agree
89,5%
A large percentage of learners (89.5%) find computers helpful in learning hyperbolic
graphs and in enabling them to get sufficient time to investigate the nature and

50
properties of the graphs. However, a few learners (10.5%) do not find computers
helpful in enabling them to get sufficient time to investigate the nature and properties
of the graphs.
This implies that many learners find computers helpful in learning hyperbolic graphs
and in enabling them to get sufficient time to investigate the nature of graphs, while
and a few learners do not find computers helpful.
Question 6: The use of computers in learning hyperbolic graphs encourages
learners to work in groups
Response Item 6
Strongly Disagree
or Disagree
16,1%
Agree or Strongly
agree
83,9%
A high percentage of learners (83.9%) find computers useful in learning hyperbolic
graphs. They also give them time to work in groups. A small percentage (16.1%) does
not find computers useful. This indicates that many learners find computers useful in
learning hyperbolic graphs in that more time becomes available for learners to work in
groups.

51
Question 7: The use of computers in learning hyperbolic graphs gives
learners the opportunity to share views with their peers
Response Item 7
Strongly Disagree
or Disagree
9,8%
Agree or Strongly
agree
90,2%
A significantly large percentage of learners (90.2%) find computers helpful in learning
hyperbolic graphs and they give them opportunity to share views amongst themselves.
A small percentage of learners (9.8%) do not find computers useful in learning
hyperbolic graphs or in giving them an opportunity to share views amongst themselves.
This implies that computers are useful in learning hyperbolic graphs and in providing
learners with time to share their views amongst themselves.
Question 8: The use of computers in learning hyperbolic graphs gives
learners the opportunity to share views with their teachers
Response Item 8
Strongly Disagree
or Disagree
11,5%
Agree or Strongly
agree
88,5%
A notably high percentage of learners (88.5%) find the use of computers in learning
hyperbolic graphs useful in helping them to share their views with their teachers. A
small percentage of learners (11.5%) do not find the use of computers useful in giving
them an opportunity to share their views with their teachers. This shows that many

52
learners find computers helpful in learning hyperbolic graphs as they get ample time to
share their views with their teachers.
I am conscious of the fact that this information needs to be confirmed through the
interviews.
Question 9: The use of computers in learning hyperbolic graphs motivates
learners to work independently on their problems
Response Item 9
Strongly Disagree
or Disagree
20,6%
Agree or Strongly
agree
79,4%
A high percentage of learners (79.4%) find computers convenient in the learning of
hyperbolic graphs and they also motivate them to work independently. A small
percentage of learners (20.6%) do not find computers helpful in learning hyperbolic
graphs and also in giving them time to work independently. This implies that computers
are helpful in learning hyperbolic graphs and in providing learners with time to work
independently.

53
Question 10: The use of computers in learning hyperbolic graphs gives
learners the opportunity to engage with real life mathematical problems
Response Item 10
Strongly Disagree
or Disagree
10,6%
Agree or Strongly
agree
89,4%
A high percentage of learners (89.4%) find computers convenient to learn hyperbolic
graphs. They also give them time to engage with real life mathematical problems. A
small percentage of learners (10.6%) do not find computers helpful in learning
hyperbolic graphs and also in giving them time to engage with real life mathematical
problems. This implies that many learners find computers helpful in learning hyperbolic
graphs and in providing them with time to engage with real life mathematical problems.
In summary the data gathered through the questionnaire in the main study strongly
supports the argument that computers are useful in learning hyperbolic graphs. It
confirms that the integration of computers into the teaching and learning of
Mathematics is important as learners are attracted to computers. This then implies that
learners will enjoy Mathematics and not fear it.
The questionnaire was administered to 135 learners. One of the questions in the
questionnaire sought to find out whether learners had computers at home. Of the 135
learners 30 learners indicated they had computers. The learners with computers at
home responded in the following way to how they use their computers:

54
Question 11: Do you use your computer at home for your school work? If
yes, please explain what type of work you do with your computers
The learners’ responses to this question indicated that:
• 45.5% of the learners with computers at home use them for assignments,
projects and investigations;
• 43% of the learners have access to internet and they indicated that they use
computers at home to search for information they need to do their school tasks;
• 91% of the learners use their computers at home to do Mathematics; and
• 3% of the learners who have computers at home use computers for music and
to watch movies.
Many of the learners’ response to the questionnaire confirmed that they use computers
to do Mathematics.
4.3 REPRESENTATION AND ANALYSIS OF THE LEARNERS’ RESPONSES TO
INTERVIEW QUESTIONS
Thirty learners were interviewed in the main study. The learners who use computers at
home to do Mathematics were interviewed in all the nine secondary schools. The
interviews were conducted during study time and took about forty minutes. I recorded
the learners’ responses myself. Some learners did not respond to questions asked and
when I probed them they indicated that they agreed with what other learners had said.
After the learners’ interviews, the teachers who teach Mathematics in Grades 10 to 12
were also interviewed. In some schools only one teacher taught Mathematics in Grades
10 to 12. In the transcripts the Learners are identified by L1 which refers to learner 1;
L2 refers to learner 2 up to L30. In the transcripts the teachers are identified as T1
which refers to teacher 1 and T2 which refers to teacher 2 and so on. The section

55
below presents the responses to the interviews as well as an analysis of the learners’
responses.
Question 1: How are you being taught graphs in Mathematics?
The first question learners were asked is how they were being taught graphs in
Mathematics. The responses to this question were:
• L1: Most of the time she starts by telling us the function, presses the mode and
the table will appear and then we draw the graph.
• L2: When she is teaching us, she will tell us the values of x and we find y and
then draw the graph.
• L3: They use the table method, where you have to complete the table, given x
and you find y.
• L4: We use a calculator, press shift, it will make us a table and we use the table,
then we will choose the table. They will ask us where the graph starts and end
and we will plot the graph.
• L5: We press mode and then shift then the table comes and we put values of x
and corresponding values of y comes and we draw the graph.
• L6: They encourage us to use a scale on the Cartesian scale
• L7: Sometimes we use the graph paper.
• L8: They give us the first step, we find y-intercept and x-intercept, and use the
turning point, we substitute x to the equation and find the value of y and then
draw the graph.
• L9: They just give us equations so that we can work them out, get coordinates
and plot the graph, in graph paper or any paper, and we check the effects of the
graph.
• L10: They tell us how to draw the graph and they give us the formula of the
graph
• L11: They give us the value of x, and tell us to find y using that formula.

56
• L12-L30: Agree with the L3‘s response.
The learners’ responses to question 1 show that learners were not in agreement in
terms of a specific method used to teach them graphs in Mathematics. Learners pointed
out that the table method is used. The other learners talked about the use of a plain
paper, calculator and the use of intercepts. Other learners indicated that teachers give
them the function and values of x and the learners then calculate the corresponding
values for y and then plot the graph. Some of the learners indicated that teachers
showed them how to draw the graph. This is supported by Raines and Clarke (2011)
who argue in favor of the use of computers over traditional methods of teaching
Mathematics when they insist that learners are generally attracted to computers.
The response to question 1 indicates that learners were passive in the teaching and
learning process. Teachers dictated the method learners used to plot graphs.
Question 2: What were your experiences in learning hyperbolic graphs using
paper and pencil?
The responses to this question were:
• L1: The method is a bit slow and we need a curve, and points are not enough.
• L2: It takes time to draw the hyperbola; it is difficult to make it curve.
• L3: It takes a lot of time to complete the table.
• L4: it takes a lot of time to find the accurate scale.
• L5: It takes a lot of time. The extra time I spent on drawing the graph I could
use it to do other things and it is difficult.
• L5: It is difficult if I don’t have a ruler and wait for another learner’s ruler for her
to finish using it.
• L6: Sometimes we are asked to draw more than three graphs
• L7: Or sometimes we can use wrong scales
• L8: Sometimes we can forget to name the x and y axis.

57
• L9: It is a bit difficult and the shape is not visible, so it is difficult.
The learners’ responses to question 2 indicate that the paper and pencil method is slow,
needs more points and it is difficult. Some learners indicted that sometimes they are
required to draw three graphs and the paper and pencil method makes it difficult to
finish in time. Learners’ responses also pointed out that sometimes the shape of the
graph is not clear if points are few. Lin (2008) indicates that using Mathematics
textbook often creates a dull classroom. He further adds that involving learners in
hands-on computer activities will lead to learners understanding the content.
The learners’ responses to question 2 shows that learners are not comfortable with the
use of the paper and pencil method. This may indicate that the use of computers could
motivate learners to engage better with hyperbolic graphs.
Question 3: What can you say about the importance of computers
(Autograph software and Heymaths software) in learning hyperbolic graphs?
The responses to this question were:
• L1: The computer is fast.
• L2: On paper when we draw some cannot use free hand and it is not beautiful.
• L3: It is much simpler and faster to answer questions. We are able to know more
graphs, graphs that we cannot understand in class.
• L4: It helps us in the assignment as it will be very fast.
• L5: It is easy because we just click equation and ok. If we do it ourselves it takes
a longer time.
• L6: The points come out straight unlike when we use paper and pencil.
The learners’ responses to this question show an interest in the use of computers in
learning hyperbolic graphs. They claim that the computer is accurate, fast, and easy to

58
work with in the area of hyperbolic graphs. Learners also indicated that more properties
of hyperbolic graphs were learned in a short space of time. Some learners indicated
that computers can be useful in working out assignments. This is supported by Kaput
(1992) who indicates that learners working with the appropriate computer software can
work with more graphs in a short space of time.
The response to question 3 indicates that the use of computers can ease some of the
difficulties that learners encounter in learning hyperbolic graphs, and also improve their
understanding of hyperbola graphs. However, it is important to note that, the actual
drawing of the graph is a necessary skill that a learner must acquire. The use of
computers can help learners to explore the properties of hyperbolas.
Question 4: What were your experiences in learning hyperbolic graphs using
computer software such as Autograph software or Heymaths?
The responses to this question were:
• L1: I learnt many things when clicking the computer, I was unable to draw
hyperbola by computer.
• L2: There are many things. We are unable to see the points how they came
about.
• L3: It is much easier. We are able to see how the graph shifts when we change
coefficients.
• L5: Same as L3.
• L6: It was very interesting because we just had to click the equation and the
graph came out.
• L7: Happy because I didn’t work it myself I did it by computer.
• L8: It is very fast.
• L9-L30: Responded as L3.

59
Learners’ responses to this question show that learners enjoyed seeing the graph come
out by just clicking buttons on the computer.
Learners’ responses show that they were able to see the effects of parameters on the
graph and it was also much easier to see how the graph shifted. Gebrekal (2006)
supports the response of learners when she indicates that a lot of time can be allocated
to analysing the graphs and a little time to making the graphs.
The responses to question 4 indicate that learners were able to see the effects of
shifting the graph easily using the computers.
Question 5: What are the advantages of using computers when learning
graphs?
The responses to this question were:
• L1: We are able to finish fast.
• L2: We are able to see the graph and facts of the graph.
• L3: No need to draw the points to plot.
• L4: It is easy to draw.
• L5: We are able to see the shifting of the graph when we increase the
coefficient.
• L6: I can communicate with another learner and tell him or her how I have done
it.
• L7: Same as L4.
• L8: Same as L5.
This question was asked as a follow up to question 3 in case learners misunderstood it.
Learner’s responses to this question show that learners enjoy working with computers
to draw graphs.

60
Learners maintain that they are able to finish drawing graphs fast with computers, and
that there is no need to draw a table of values. It is easy to draw the graph and one
can see the movement of the graph and at the same time one can help others who do
not understand how to use computers. Suharwoto (2006) explains that some of the
benefits of using the computer include increased accuracy and speed in data collection
and graphing, real–time visualisation, interactive modelling of mathematical processes,
ability to collect, compute, and analyse large volumes of data, collaboration for data
collection and interpretation, and more varied presentations of results. Suharwoto
supports the learners’ responses which show that learners enjoy using computers in
learning graphs.
The responses to question 5 indicate that the advantages of using the computers when
studying graphs include the fact that it is easier and faster to draw graphs.
Question 6: What are the disadvantages of using computers when learning
graphs?
The responses to this question were:
• L1: When you use a computer you can be perfect but when you write a test you
will struggle.
• L2: When we are working, the electricity goes.
• L3: We are unable to draw for ourselves as the computer makes it easy for us.
• L4: It can make us to become lazy, because in a test you will not be having a
computer.
• L5: Same as L2.
• L6: If at home there is no computer, so it will be difficult to apply what we have
learnt.
• L7: We don’t know the steps on how points came about.
• L8: If the electricity goes.
• L9: In the examination we won’t have computers.

61
• L10: When you use a computer you don’t know how to draw yourself, as the
computer gives you the finished product.
• L11: When you use computers and get answers to problems but when you write
exams you will not get it.
• L12: If I press another key instead of the correct key then I get a wrong graph.
• L13-L30: Same as L2.
Learners’ responses to this question indicate that when one uses computers one can be
perfect but one might struggle when writing tests. Learners pointed out that one must
know how to plot the graph without the aid of a computer. Learners also indicated that
in tests and examinations when computers are not available, one could struggle with
hyperbolic graphs. Some learners indicated that not having a computer at home can
deny them the privilege of practicing at home. Pressing the wrong key could result in
getting the wrong graph.
The responses to question 6 indicate that learners need to know how to draw the
hyperbola graph manually as they will be expected to draw the graph in tests and
examinations. Computers can also spoil learners and they can become lazy to draw
graphs on their own. The responses also indicate that electricity cuts could hinder the
usage of computers in the learning of graphs.
Question 7: Mention the challenges you encounter when using computers to
learn Mathematics.
The responses to this question were:
• L1: Some learners don’t know how to use the computer.
• L2: It needs a person who knows how to use a computer. Also to press plus on
the computer we need to press shift first on the keyboard.
• L3: If you are addicted to using a computer and if the electricity is cut off, it can
be a disadvantage.

62
• L4: Not to find the graph you are looking for. One must know the procedure of
using computers.
• L5: When you don’t have a computer at home to practice using it.
• L6: Same as L1.
• L7: Or you take hyperbola, and write parabola then you get the wrong graph.
• L8: If we are given an assignment and leave it to the last minute and when we
go to the lab and find no electricity.
• L9: Not to find the graph you are looking for. One must know the procedure of
using a computer.
Learners indicated that it could be a challenge to use a computer if one does not know
how to operate a computer. A large number of learners indicated that a computer does
not show the steps that one needs to follow when drawing a graph and this is a
challenge. Some learners noted that trusting the computer only could be a problem if
you have an assignment which is due and on that day there is no electricity.
The responses to question 8 indicate that some learners are not able to operate a
computer and this could be a challenge. The other challenge is that a computer does
not show the steps involved but only gives the finished product. Electricity cuts were
indicated by many learners as a disadvantage to those who rely on computers only.
Question 8: Do you have anything else to add?
The response to this question was:
• One learner asked how he can get the autograph programme to his home
computer.
• The rest of the learners indicated that they had nothing to add.

63
4.4 REPRESENTATION AND ANALYSIS OF THE TEACHERS’ RESPONSES TO
INTERVIEW QUESTIONS
Seven teachers were interviewed in the study. Their responses to the interview
questions are discussed below:
Question 1: How are you teaching graphs in Mathematics?
The responses to this question were:
• T1: I use the table method, we give learners x values and they compute the
values of y.
• The Learners use graph paper but even in a plain paper they can sketch the
graph.
• T2: Using graph papers and pencil. Also I make use of the Heymath programme.
• T3: Manually, by point plotting. Also by using the Autograph programme.
• T6-T7: Agreed with T1.
The teachers’ responses to this question reflect that teachers use many methods in
teaching graphs. Teachers pointed out that they use the table method, graph paper and
pencil, the Heymath programme and Autograph. Bagui’s (1998) argument concurs with
the responses given by teachers when he indicates that computers play a major role in
assisting teachers in the classroom. The response to this question shows the integration
of methods in the teaching and learning of graphs. This is supported by Kim, Lee,
Spector and De Meester (2013) when they indicate that in the field of education,
teachers are concerned with how to integrate computers into instruction to improve the
quality of Mathematics instruction and also enhance learners’ performance.
The responses to question 1 indicate that teachers use both paper and pencil method
and computers to teach graphs.

64
Question 2: What were your experiences in teaching hyperbolic graphs using
paper and pencil?
The responses to this question were:
• T2: The shape of the graph is not clear; it depends on how accurate you are.
Shapes are not clear if the Cartesian plane is not properly done and the learners
miss it. It is another point where learners confuse the effects of a negative sign
and when they plot some points they get lost.
• T3: It takes time; It is time consuming.
• T4: Same as T3. A lot of errors are involved.
• T5: Same as T3.
• T6: It takes time to make the table. Mostly when learners make mistakes in
computing, it is difficult for them to trace their mistakes after drawing the graph.
There is lack of accuracy in sketches that is smoothness of curves.
• T7: Same as T3.
The teachers’ responses to this question indicate that the shape of the graph is not
clear, the method is time-consuming and the graph is not accurate.
The responses to question 2 indicate that the shape of the graph is not clear when
using the paper and pencil method. The paper and pencil method is also time -
consuming.
Question 3: What can you say about the importance of computers
(Autograph or Heymath) software in teaching hyperbolic graphs?
The responses to this question were:
• T1: One thing for sure, it is amusing; just entering an equation, the graph comes
out very fast.
• T2: Learners experience more. Learners can work individually.

65
• T3: It is time saving. Heymath can be followed since there is audio. It is
motivating because the voice prompts.
• T5: It is time-saving and accurate.
• T6: It is very important especially in this area of technology.
• T7: It is user friendly.
Teachers show interest in the use of computers to teach hyperbolic graphs. The
teachers pointed out that computers are amusing. They further argue that the
knowledge acquired is not conceptual but procedural. Teachers also indicated that it is
time-saving to use computers in teaching hyperbolic graphs and that computers are
user-friendly. Yushau, Mji and Wessels (2003) indicate that working with appropriate
computer software can result in a large amount of graphing learning being experienced
in a relatively short space of time. Learners acquire procedural knowledge and not
conceptual knowledge.
The responses to question 3 indicate that using computers to teach hyperbolic graphs
motivates learners. It is also time-saving and learners get more experience in learning
graphs.
Question 4: What were your experiences in teaching hyperbolic graphs using
computer software such as Autograph or Heymath?
The responses to this question were:
• T2: From past experiences we are blessed to have computers and it is possible
to have learners in a computer lab. It enables us to reduce the coverage of work.
Our task is just to make learners distinguish between hyperbola, parabola and
trigonometric graphs.
• T3: It was exciting. Learners could see shifting of the graphs.
• T4: It is time-saving; learners enjoy using the computers. It is less of errors.

66
• T5: It was excellent.
• T6: There are no mistakes and learners get accurate graphs faster.
• T7: It is better.
Teachers’ responses to this question indicated that they felt blessed to have computers
and to teach Mathematics to learners in a computer laboratory. Teachers added that
their work could be covered quicker with the aid of computers. Computers enabled
learners to enjoy learning. Teachers further indicated that their role is to specify the
graph learners are to study so that the computer would give them the desired graph.
Yushau, Mji and Wessels (2003) support the teachers’ responses when they indicate
that computers, especially in the area of graphs, can be an accurate tool of drawing the
graphs.
The responses to question 4 indicate that computers enable teachers to be faster, and
to cover a lot of work in a short space of time. Computers also make learning exciting
for learners.
Questions 5: What are the advantages of using computers when teaching
graphs?
The responses to this question were:
• T1: Very fast, takes shorter time.
• T3: It can show different graphs in a short space of time.
• T4: It is motivating and time saving. Learners concentrate more.
• T5: It is time saving and accurate
• T6: There are no mistakes and learners get accurate graphs faster.
• T7: It is simple and easy.
The teachers’ responses to this question indicated that computers motivate learners and
are very fast. They also enable the teaching and learning of graphs to take shorter

67
time. Teachers also confirmed that different graphs can be shown in a short space of
time when using computers. According to Challoo and Marshall (2005), the majority of
teachers believed that computer technology does enhance the learners understanding
of course content.
The responses to question 5 indicate that computers are very fast, and that it takes
learners a shorter time to draw graphs.
Question 6: What are the disadvantages of using computers when teaching
graphs?
The responses to this question were:
• T1: Learners will simply come to the lab and find graphs without knowing them.
• T2: Internet abuse.
• T3: Not all the steps are done or shown. Learners tend to become lazy.
• T4: Learners miss the 1st principles needed in how to plot points. Learners
eventually become lazy as everything is done for them.
• T5: Encourages laziness to think and computers are not allowed in tests and
examinations.
• T6: Promotes laziness and learners do not really get to understand how the
graph came about.
• T7: Some learners are not exposed and overcrowded classes.
Teachers’ responses to this question show that overdependence on computers by
learners could lead to laziness. Teachers also stated that the other disadvantage of
using computers is internet abuse. Teachers also added that all the steps are not
shown when using computers, and learners tend to be lazy. Teachers also pointed out
that in examinations and tests, computers are not helpful as they are not used in the
exam room. Teachers also mentioned that over crowdedness in classes can result in
learners not being exposed to computers. The response to this question implies that

68
skills in teaching graphs should not be sacrificed by using the computer. This is also
supported in literature by Thomas, Bosley, Delos Santos, Gray, Hong and Loh (2006)
who indicate that teaching concepts without sacrificing skills is an important way of
using computers.
The responses to question 6 indicate that learners could become too lazy to draw
graphs on their own and this could be a major disadvantage. Computers also do not
show the steps of drawing the graph, but give the finished product.
Question 7: Mention the challenges you encounter when using computers to
teach mathematics.
The responses to this question were:
• T1: Electricity can interfere with the lesson when it goes. Learners need to be
empowered with computer Literacy, so they need to have such lessons before
they come to the lab. Teachers need to be trained on computer usage as this is
an area of challenge.
• T3: We cannot work if there is no electricity. Computers are not enough for all
learners.
• T4: Using the Heymath programme we have limited examples.
• T5: Over crowdedness and limited computers.
• T6: Some classes are too big and with the limited amount of time, not all
learners may get the chance to use the computer.
• T7: Being computer illiterate.
Teachers’ responses to this question show that computers are not enough for individual
learners, and this is a challenge. Teachers further suggested that learners need to be
empowered with computer skills before they can make use of computers in their
learning. Teachers indicated that they also needed training on computer usage as it is a
major challenge. Some teachers mentioned electricity cuts off as a challenge in using

69
computers to teach Mathematics, and also the fact that computers are not enough for
all learners.
The responses to question 7 indicate that teachers need to be trained to use many
programmes that they have to teach Mathematics.
Teachers were excited that they are using computers to teach hyperbolic graphs. The
teachers urged the department of education to train teachers on programmes they give
to schools, in order for teachers to implement them in the teaching and learning of
Mathematics.
Teachers indicated the need to be trained on the programmes the department supplies
to schools.
4.5 SUMMARY OF THE DATA
This section provides a summary of the data derived from the learners’ questionnaire,
learners’ interviews and teachers’ interviews. The summary draws an overall picture of
what has emerged from the data with regards to the problem being investigated.
4.5.1 Summary of the Data from Learners
The aim of the investigation was to investigate the use of computers in the teaching
and learning of hyperbolic graphs in grades 10 to12 of Mathematics classes. The
questionnaires were administered to learners. The analysis of the questionnaire data
indicates that the use of computers can positively influence learners’ understanding of
graphs in terms of problem-solving, their motivation to be involved and perception
towards graphs, as well as facilitating group work and discussions among themselves.
The responses to the questions in the interview confirmed that the use of computers
can positively influence learners’ understanding of graphs in terms of problem-solving,

70
motivation, perception and the classroom environment. The use of computers can,
therefore, ease some of the difficulties that learners are facing in learning hyperbolic
graphs. It can also help learners to engage with and explore the nature and properties
of hyperbolic graphs. Computers can also facilitate and encourage learners to have a
positive attitude towards Mathematics in general.
4.5.2 Summary of the Data from the Teachers
The responses to the questions in the interview for teachers confirmed that the use of
computers can positively influence teachers’ method of teaching graphs in terms of
problem-solving, motivation, perception and the classroom environment. The use of
computers can, therefore, ease some of the difficulties that teachers are facing in
teaching hyperbolic graphs. It can also help learners to engage with and explore the
nature and properties of hyperbolic graphs. Computers can also facilitate and
encourage teachers to have a positive attitude towards Mathematics in general.
However, the use of computer software programmes such as the Autograph or
Heymath can have some limitations in the learning of hyperbolic graphs as one of the
respondents pointed out during interview that the computer does not show the steps
involved in drawing the graph.
4.6 FINAL REMARKS
Having analysed the data and seen what has emerged from the results, I will now
discuss the implications of these results, the impact of the study, and then make
recommendations for future studies. The chapter that follows discusses all these
aspects.

71
CHAPTER 5
SUMMARY, CONCLUSION AND RECOMMENDATIONS
5.1 INTRODUCTION
The purpose of this study was to investigate the use of computers in the teaching and
learning of hyperbolic graphs in grades 10-12 of the Mathematics.
The study sought to address the following questions:
• What views do learners have about the use of computers to learn hyperbolic
graphs in Mathematics?
• What views do teachers have about the use of computers to teach hyperbolic
graphs in Mathematics?
The study followed an exploratory design as I was interested in determining how
computers are used in the teaching and learning of hyperbolic graphs.
Nine secondary schools in Vhembe District, which use computers in the teaching and
learning of Mathematics, took part in the study. The focus was on grades 10-12
Mathematics learners and teachers who use computers in the teaching and learning of
hyperbolic graphs.
Questionnaires were distributed to a sample of 135 learners. All the questionnaires
distributed were returned. The questionnaires were made available in English which is
the medium of instruction at all the targeted schools.

72
5.2 DISCUSSION OF THE RESULTS
Based on the research question which sought to find out the view of learners about the
use of computers in learning Mathematics, this study shows that learners strongly
support the use of computers to learn Mathematics.
The analysis of the questionnaire data indicates that the use of computers can
positively influence learners’ understanding of hyperbolic graphs, and this is indicated
by the high percentage of learners (100%) who agreed that the topic of hyperbolic
graphs is interesting to learn using computers. A significantly large percentage of
learners (99.7%) found computers convenient to solve hyperbolic graphs. The study
revealed that the majority of learners found computers helpful in drawing graphs
quickly (Alper, 2009).
The need to use computers in learning Mathematics, as evident in this study,
strengthens the argument presented in section 2.2 which mentions that learners favour
learning Mathematics with computers more than direct instruction. What seems to
emerge from these findings is that learners want to be active and not passive in the
classroom. According to Raines and Clarke (2011), computers seemingly enable
learners to participate fully in class.
What also was concluded from the study is that a significant percentage of learners
(89.5%) found computers helpful in enabling them to get sufficient time to investigate
the nature and properties of graphs. Perhaps it is for this reason that Raines and Clarke
(2011) argue that learners working with appropriate software can work with more
graphs in a short space of time. The hyperbolic graphs seem to take much of the
learners’ time if the computing and drawing of the graph is manual. The implication of
this is that computers seem to be helpful in drawing hyperbolic graphs quicker. This
then results in learners getting sufficient time to investigate the nature and properties
of graphs.

73
The responses of learners to the questions in the interview showed that the use of
computers can positively influence learners’ understanding of hyperbolic graphs in
terms of problem solving, motivation, perception and the classroom environment. The
use of computers can, therefore, ease some of the difficulties that learners face in
learning hyperbolic function. It can also enable learners to engage with and explore the
nature and properties of hyperbolic graphs. Computers can also facilitate and
encourage learners to have a positive attitude towards Mathematics in general.
Computers enable learners to plot more graphs in a short space of time. This is
confirmed in section 2.4 by Raines and Clarke (2011) under the benefits of learning
Mathematics with computers which shows that computers enable learners to draw
graphs much easier, quicker and more accurately. This then enables learners to devote
more time to analysing the graphs.
The answer to the research question which sought to find out the views of teachers
about the use of computers to teach Mathematics reveals that teachers strongly support
the aid of computers in the teaching of Mathematics as indicated by Thomas, Bosley,
Delos Santos, Gray, Hong and Loh (2006).
The responses of teachers to the interview questions confirmed that the use of
computers can positively influence teachers’ understanding of graphs in terms of
problem-solving, motivation, perception and the classroom environment. The use of
computers can, therefore, ease some of the difficulties that teachers face in the
teaching of hyperbolic graphs. It can also help learners to engage with and explore the
nature and properties of hyperbolic graphs. Computers can also facilitate and
encourage teachers to have a positive attitude towards Mathematics in general.
Teachers generally complain about finishing the syllabus in time. Computers seem to be
a resource that could be helpful as the preparation of lengthy calculation problems and
the plotting of graphs could be achieved quicker by the computer as stated by Raines
and Clarke (2011).

74
This is confirmed in section 2.5 under the effectiveness of teaching Mathematics with
computers. The conclusion one makes from teachers’ responses to interviews is that
they have a target to complete the syllabus in time. Computers can indeed be essential
teaching resources and can thus be very helpful in the teaching and learning of
hyperbolic graphs.
Many advantages of using computers to teach and learn Mathematics were revealed in
this study such as:
• they are quick and accurate in drawing hyperbolic graphs;
• they enable learners to be active in Mathematics classrooms;
• visualization barrier is eliminated as the drawing can be enlarged to suite the
learners needs;
• teachers will be able to finish the syllabus in time as lengthy preparations will be
overcomed; etc.
The advantages cited above concur with the Literature cited in this study. The use of
computers in learning hyperbolic graphs was supported by much of the literature cited.
Raines and Clarke (2011) argue that, computers enable learners to draw graphs much
easier, quicker and more accurately. Thomas, Bosley, Delos Santos, Gray, Hong and
Loh (2006) also supports that, teachers prefer using computers, as they are helpful and
reduce the load of making lengthy lesson preparations. Yushau, Mji and Wessels (2003)
confirm that, with computers, learners can visualise mathematical concepts which are
difficult to comprehend without computers. They further allude that, computers provide
easier and clearer illustrations than those teachers could make.
The response of learners in interviews in this study confirms that using computers is
quicker when one wants to draw graphs. This enables learners to have enough time to
investigate important properties of graphs. This supports the argument presented in

75
section 2.5 where Moila (2006) discussed the benefits of using computers to teach and
learn Mathematics.
The study shows that the disadvantage of using computers in the teaching and learning
Mathematics is supported by fewer learners and teachers. This is supported by Persson
(2011) when he insists that teachers mentioned risks of depending on computers in
studying graphs.
There were learners who argued that computers are not useful in learning hyperbolic
graphs. Few of the teachers who were interviewed also indicated that computers, even
though useful, can make learners lazy. Some learners indicated that computers jump
some steps in the plotting of a graph, and only produce a finished product. This is
confirmed in section 2.3 were it is argued that teaching a computer intensive class can
produce learners who are proficient in computer usage without grasping mathematical
concepts.
Based on the research question on how computers are used in the teaching and
learning of Mathematics, this study shows that a significantly large percentage of
learners (90.2%) agree that computers enable them to share views with their peers,
encourage them to work in groups and motivates them to work independently. The
study also shows that computers enable learners to work on real life problems. Real life
problems require creativity on the part of learners. In section 2.5, Yushau, Mji and
Wessels (2003) argue that computers promote creativity in learners. One concludes that
learners who are exposed to computers have the advantage of being skilled and
creative problem solvers in Mathematics.
Learners are exposed to computers at home and in schools. Classrooms where
computers are used in the teaching and learning of Mathematics help reduce the issue
of visualization. This is the reason why Suharwoto (2006) argues that the benefits of

76
using computers include increased accuracy and speed in data collection and graphing
as well as real time visualisation as indicated in section 2.5.
Findings in this study support the use of computers as a useful resource in learning
Mathematics. The findings in this study are confirmed by Rowlett (2013), when he
agrees that computers when placed in proper context can be useful in aiding learners to
understand Mathematics. Teachers also support the use of computers in teaching
hyperbolic graphs. Perhaps that is the reason why Clarke (2011), indicates that,
working with appropriate computer software can pack a large amount of graphing
experience into a relatively short space of time. He further states that, computers
address the time factor in teaching Mathematics, enabling teachers to finish the
syllabus in time. This confirms that teachers support the use of computers in teaching
hyperbolic graphs as revealed in this study.
However, it is important to note that learners must know how to plot graphs manually
since in the tests and examinations they plot graphs manually.
5.3 IMPLICATIONS OF THE FINDINGS
Learners’ responses to the questionnaires and the interviews showed that the use of
computers can positively influence learners’ learning of graphs in terms of problem-
solving. More specific, the use of computers can:
• Allow learners to draw graphs quickly and easily;
• Encourage learners to engage with and explore the nature and properties of
hyperbolic graphs actively;
• Motivate learners to learn Mathematics, and enable them to be skilled and
creative problem solvers, that is computers, aid learners in conceptual
understanding;
• Create a positive attitude in learners towards hyperbolic graphs and Mathematics
in general and give learners conceptual understanding of hyperbolic graphs.
• Encourage learners to work in groups;

77
• Help learners to develop self-regulation; and
• Encourage learners to interact among themselves and with their teachers.
Teachers’ responses to the interviews showed that the use of computers can positively
influence teachers’ teaching of graphs in terms of problem solving. More specific, the
use of computers can:
• Allow teachers to draw graphs quickly and easily;
• Encourage teachers to engage learners and explore the nature and properties of
hyperbolic graphs actively;
• Motivate teachers to teach Mathematics;
• Create a positive attitude in teachers towards hyperbolic graphs and towards
Mathematics in general;
• Encourage teachers to help learners to work in groups;
• Encourage teachers to help learners to develop self-regulation; and
• Encourage learners to interact among themselves and with their teachers.
5.4 CONCLUSION
The aim of the study was to investigate the use of computers in the teaching and
learning of hyperbolic graphs in grades 10-12 Mathematics. The results of the
investigation indicate that the use of computers has a positive impact on learners’
achievements, problem-solving skills or exploration of mathematical ideas, motivation,
attitude and the classroom environment. This is similar to the findings reported in the
literature review. Learners can analyse graphs quickly, represent graphs in different
ways and solve real life problems using computers. Learners can be encouraged to
explore the nature and properties of graphs on their own, work in a group, discuss
concepts, make conjectures and verify their findings using computers. Thus computers
can encourage learners to be active in the Mathematics classroom than they are in the
traditional paper-pencil way of teaching Mathematics.

78
On one hand the use of computers can be helpful to teachers as it enables them to
finish the syllabus efficiently. On the other hand, it serves as a learners’ resource in
their learning of Mathematics.
The problem of visualisation is also overcome as each learner will have his/her own
computer to work with. The issue of accuracy in graphs is also taken care of when
computers are used.
Learners are by nature active. This method of employing computers makes the learners
to be active in Mathematics classrooms. Teachers also benefit in the sense that
preparation of materials will not take a lot of time as the computer is a complete
package of resource. The role of the teacher as a facilitator is also enhanced.
5.5 LIMITATIONS OF THE STUDY
The results from this study, that, computers are useful in teaching and learning
hyperbolic graphs cannot be generalised, as the study was conducted in a unique
research site with specific conditions. What came out from the study may not
necessarily be found in other areas.
5.6 RECOMMENDATIONS
It is recommended that:
• Computers should be used to teach all topics in Mathematics;
• School Mathematics curriculum designers and teachers should take advantage of
the benefits of using computers in the teaching and learning of Mathematics, and
they should encourage teaching and learning with computers;
• Teachers need training on how to use the software they have in schools so that
they can make use of them fruitfully; and

79
• The Department of Education should purchase computers for schools without
computers so that learners can make use of them in Mathematics classes. Other
researchers could investigate Mathematics topics where computers can be used
as a resource for teaching and learning.

80
REFERENCES
Agyei, D.D. & Voogt, J. (2012). Developing Technological Pedagogical Content
Knowledge in Pre-service Mathematics Teachers through Collaborative Design.
Australian Journal of Educational Technology, 28(4) 547-564.
Ahuja, O.P. & Jahangiri, J.M. (2003). An Integrated Approach to Teaching and Learning
College Mathematics: Research in Mathematical Education. Journal of the Korea Society
of Mathematical Education Series D, 7 (1):11-24.
Ahuja, O.P.; Lim-Teo, S.K. & Lee, P.Y. (1998). Mathematics Teachers’ Perspective of
their Students’ Learning in Traditional Calculus and its Teaching Strategies. Journal of
the Korea Society of Mathematical Education: Research in Mathematical Education: 2(2)
89-108.
Alexander, M.P. (1993). The Effective Use of Computers and Graphing in College
Algebra. Dissertation Abstracts International. 54(6): 2080A.
Almekhlafi, A.G., and Almeqdadi, F.A. (2010). Teachers’ Perception of Technology
Integration in the United Arab Emirates School Classrooms. Educational Technology &
Society, 13 (1), 165-175.
Alper, A. (2009). Trends and Issues in Educational Technologies: A Review of Recent
Research in TOJET. The Turkish Online Journal of Educational Technology, Volume 8
Issue 2 Article 12.
Andrew, G.E. (1995). The Irrelevance of Calculus Reforms. Ruminations of a Sage on
the Stage. UME Trends 6(6) 17-23.

81
Bagui, S. (1998). Reasons for Increased Learning Using Multimedia. Journal of
Educational Multimedia and Hypermedia, 7(1) 3-18.
Bagwell, T. & Stetson, R. (1999). Technology and Teacher Preparation: Journal of
Technology and Teacher Education, 7(2) 145-152.
Baldin, Y. (2002). Preparing Future Mathematics Teachers to Teach with Technology in
Battista, M.T. (2001). Shape Makers: A Computer Environment that Engenders
Students’ Construction of Geometric Ideas and Reasoning. Computers in the Schools,
17(1-2): 105-120
Belland, B.R. (2009). Using the Theory of Habits to Move Beyond the Study of Barriers
of Technology Integration. Computer and Education, 52: 353-364.
Belson, W.A. (1986). Validity in Survey Research. Aldershot: Gower.
Berger, M. (2010). Using CAS to Solve a Mathematics Task: A Deconstruction.
Computers & Education 55:320 – 332.
Bergqvist, T., Holmquist, M. & Lingefjafrd, T. The Role of Technology when Teaching
Mathematics, 25-33.
Butler, M. (2008). Professional Development for Teachers Using Technology.
Proceeding of the 7th WSEAS International Conference on Education and Educational
Technology. Venice.
Capper, J. (2003). Complexities and Challenges of Integrating Technology into the
Curriculum. Technologia, 60-63. Available Online: http//www.Technologia.org

82
Challo, L.B., Marshall, R.B. & Marshall, I.M. (2005). Availability, Effectiveness and
Utilization of Computer Technology among High School Mathematic Teachers in the
Instructional Process. National Forum of Teacher Education Journal- 14 (3) 1-12.
Centre for Development and Enterprise (CDE) (2004). From Laggard to World Class:
Reforming Mathematics and Science Education in South Africa. Report No 13,
Johannesburg
Chandler, P.A. (1993). The effect of the graphing calculator on high school students’
mathematical achievement. Dissertation abstracts international, 53(11):3832A.
Cheng-Yao Lin, (2008). Beliefs about Using Technology in the Mathematics Classroom:
Interviews with Pre-service Elementary Teachers. Eurasia Journal of Mathematics,
Science & Technology Education 4(2), 135-142.
Choike, J.R. (2000). Teaching Strategies for Algebra for All. Mathematics Teachers
93(7), 556-563.
Clarke, P.J. (2007). Exploring the Use of Computer Technology in a Caribbean Context:
Views of Pre-service Teachers. International Journal of Education and Development
using Information and Communication Technology. Volume 3, Issue 1, 23-38.
Clemments, D.H. (2000). From Exercises and Tasks to Problems and Projects-Unique
Contributions of Computers to Innovate Mathematics Education. The Journal of
Mathematical Behaviour, 19(1): 9-47.
Cohen, L., Manion, L. & Morrison. 2007. Research Methods in Education. London:
Routledge

83
Confrey, J. (1992). Using Computers to Promote Students Inventions on the Function
Concepts. In S. Malcon, L. Roberts & K. Sheingold (Eds), and this Year in School
Science (1991). Washington, DC: American Association for the Advancement of
Science: 141-174.
Cooper, T. & Norton, S. (2001). Factors Influencing Computer Use in Mathematics
Teaching in Secondary Schools. 24th Annual Conference. Sydney.
Cuban, L. (2001). Oversold and Underused: Computers in the Classroom. Cambridge,
Massachusetts, USA: Harvard University Press.
Department of Education, 2003. National Curriculum Statement Grades 10-12.
Mathematics.
Dessart, D.J.; DeRidder, C.M. & Ellington, A.J. (1999). The research backs calculators.
Mathematics Education Dialogue, 2(3): 6
De Villiers, M.D. (1999). Rethinking Proof with the Geometer’s Sketchpad. Berkeley, CA:
Key Curriculum Press.
De Vos, A.S (Ed) (2002). Research at Grassroots: For the Social Sciences and Human
Service Professions (2ndEdition). Pretoria: Van Schaik Publishers.
Dimitriyev, V. and Sarapuu, T. Usage of Educational Multimedia by Estonian
Mathematics and Science Teachers in [email protected], [email protected]
Doer, H.M. & Zangor, R. (2000). Creating Meaning for and with the Graphing
Calculator. Educational Studies in Mathematics, 41: 143-163.

84
Durmus, S. (2000). The Effects of the Use of Technology on College Algebra Students’
Achievement and Attitudes Towards Mathematics: A Constructivistic Approach.
Dissertation of Abstracts International, 60(10): 3622A.
Dunham, P.H. & Dick, T.P. (1994). Research on Graphing Calculators. The Mathematics
Teacher, 87(6): 440-445.
Dreyfus, T. (1994). The Role of Cognitive Tools in Mathematics Education. In Didactics
of Mathematics as a Scientific Discipline.
Ernest, P. (1991). The Philosophy of Mathematics Education. Hampshire: The Falmer
Press.
Farrell, A.M. (1996). Roles and Behaviours in Technology-integrated Precalculus
Classrooms. Journal of Mathematics Behaviour, 15 (1), 33-53.
Fey, J.T. (1989).Technology and Mathematics Education: A Survey of Recent
Developments and Important Problems. Educational Studies in Mathematics, 20(3):
237-272.
Funkhouser, C. (1993). The Influence of Problem Solving Software on Student Attitudes
about Mathematics. Journal of Research on Computing in Education, 25(3): 339-346.
Gay, L.R. (1992). Educational Research - Competencies for Analysis and Application.
Singapore: Merrill, MacMillan.
Glasersfeld, E.V. (1992). Questions and answers about radical constructivism.
Washington DC: NSTA: 169-182.

85
Gebrekal, Z.M. (2006). The Influence of the Use of Computers in the Teaching and
Learning of Graphs in School Mathematics. A Dissertation Submitted in Partial Fulfilment
of Master of Education. University of South Africa.
Giamiti, C.M. (1991). The Effect of Graphing Calculator Use on Students’ Understanding
of Variations on a Family of Equations and the Transformations of their Graphs.
Dissertation Abstracts International, 52(1): 103 A.
Godwin, S. & Sutherland, R. (2004). Whole-class Technology for Learning
Mathematics: the Case of Functions and Graphs. Education, Communication &
Information, 4(1), 131-152.
Goldenberg, E.P. (2000). Issues in Mathematics Education. Thinking and Talking about
Technology in Mathematics Classrooms. USA: Education Development Centre Inc.
Goos, M. & Bennison, A. 2007. Technology-Enriched Teaching of Secondary
Mathematics Factors Influencing Innovative Practice Mathematics: Essential Research,
Essential Practice, 1: 315-324.
Graham, T.M. & Thomas, O.J. (2000). Building a Versatile Understanding of Algebraic
Variables with a Graphic Calculator. Educational Studies in Mathematics, 41(3): 265-
282.
Guyer, T. (2008). Computer Algebra Systems as the Mathematics Teaching Tool. World
Applied Sciences Journal 3 (1): 132-139.
Hall, M.K. (1993). Impact on the Graphing Calculator on the Instruction of
Trigonometric Functions in Pre-calculus Classes. Dissertations Abstracts International,
54 (2): 451A.

86
Hallberg, B. (1997). Windows Sources Microsoft Excel for Windows Super Guide.
MacMillan Computer Publishing. USA.
Hannafin, R.D. & Scott, B.N. (2001) Teaching and Learning with Dynamic Geometry
Programs in Student-centred Learning Environments: A Mixed Method Inquiry.
Computers in the Schools, 17(1-2): 121-142.
Heid, M.K. (1989). How Symbolic Mathematical Systems could and should Affect Pre-
college Mathematics. Mathematics Teacher, 82(6), 410-419.
Hennessy, S., Fung, P. & Scanlon, E. (2001). The Role of Graphic Calculator in
Mediating Graphing Activity. International Journal of Mathematical Education in Science
and Technology, 32(2): 267-290.
Hiebert, J. Carpenter, T.P., Fennema, E., Fuson, K., Human, P.G., Murray, H. Olivier,
I.A. & Wearne, D. 1996. Problem Solving as a Basis for Reform in Curriculum and
Instruction: The Case for Mathematics. Educational Researcher, May 1996: 12-21.
Hollar, J.C., & Norwood, K. (1999). The Effects of a Graphing – Approach Intermediate
Algebra Curriculum on Students’ Understanding of Function. Journal for Research in
Mathematics Education, 30(2): 220-226.
Ibraim, A. (2004). Computer- Supported Collaborative Problem Solving and Anchored
Instruction in a Mathematics Classroom: An Exploratory Study. International Journal of
Learning Technology, 1(1): 16-39.
Ijeh, S.B. (2003). The Effect of Scaling in the Understanding of Algebraic Graphs for
Grade 9 Learners. A Dissertation Submitted in Fulfilment of Master of Education.
University of South Africa.

87
Inan, F.A. & Lowther, D.L. (2010). Laptops in the K-12 classrooms: Exploring Factors
Impacting Instructional Use. Computers & Education, 55: 937 – 944.
Isikal, M. & Askar, P. (2005). The Effect of Spread Sheet and Dynamic Geometry
Software on the Achievement and Self-efficiency of 7th Grade Students. Educational
Research, 47(3) 333-350.
Jarret, D. (1998). Integrating Technology into Middle School Mathematics: It’s Just
Good Teaching. North West Regional Educational Laborotary. Available Online: http://
www.nwrel.org/msec/book 6. Pdf
Jeffries, M.G. (1989). The Effects of Three Levels of Feedback on Anxiety and Academic
Performance during Computer – Assisted Instruction. PhD Thesis, University of Florida.
Johannesen, I. (2007). 10th International Conference on Engineering Education.
Increasing the Learning Outcome in Mathematics by Use of Computer Programs Like
Mathematica, September 3-7.
Jordaan, T. (2005). Misconceptions of the Limit Concept in a Mathematics Course for
Engineering Students. A Dissertation Submitted in Partial Fulfilment of MEd. University
of South Africa.
Kadiyala, M. & Crynes, B. (1998). Where is the Proofs? A Review of Literature on
Effectiveness of Information Technology in Education.
Kamii, C. (1994). Young Children Continue to Reinvent Arithmetic - 3rd Grade
Implications of Piaget’s Theory. New York: Columbia University, Teachers College Press.

88
Kehagias, A. & Vlachos, P. (1996). Computer Aided Instruction vs. Traditional
Teaching: Comparison by a Controlled Experiment. Greece.
Kim, C.; Lee, C.; Spector, J.M. & De Meester, K. (2013). Teacher Beliefs and
Technology Integration. Teaching and Teacher Education, 29: 76-85.
Kimmis, D. (1995). A Course for Prospective Secondary School Mathematics Teachers.
Technology in School Mathematics. Middle Tennesee State University.
Kissane, B. & Kemp, M. (1998). Graphics Calculators and Lower Secondary
Mathematics. Australian Mathematics Teacher, 54(4) 4-10.
Kulik, C.C. & Kulik, J.A. (1991). Effectiveness of Computer-based Instruction: An
Updated Analysis. Computers in Human Behavior, 7(2): 75-94.
Kulik, J., Bangert, R. & Williams, G. (1983). Effects of Computer-based Teaching on
Secondary School Students. Journal of Educational Psychology, 75: 19-26.
Kyriazis, A., Korres, K. (2001). Teaching of Plane Curves, in High School with the Use of
Computers. Proceedings of the 18th Conference of Mathematics Education of the
Hellenic Mathematical Society.
Leedy, P. & Ormrod, J. (2005). Practical Research Planning and Design (8th Edition).
Pearson: Merrill Prentice Hall.
Limpopo Department of Education (2011). Report on the Heymath programme.
Mathematics, Science and Technology (MST).

89
Liu, L. & Cummings, R. (2001). A Learning Model that Stimulates Geometric Thinking
through Use of PCLogo and Geometer’s Sketchpad. Computers in the schools, 17(1-2):
85-104.
Liu, T.C. (2010). Developing Simulation-based Computer Assisted Learning to Correct
Students’ Statistical Misconceptions Based on Cognitive Conflict Theory using
‘Correlation’ as an Example. Educational Technology & Society, 13(2): 180 – 192.
Makgato, M. (2003). The Development of a Curriculum for Technology Teacher
Education and Training: A Critical Analysis. A Dissertation Submitted in Fulfilment of
DEd. University of South Africa.
Manoucherhri, A. (1990). Computers and school mathematics reform: Implications for
mathematics teacher education. Journal of Computers in Mathematics and Science
Teaching, 18 (1), 31-48.
McDonald, & Trautman, T. (2005). Computer Assisted Middle School Mathematics
Remediation Intervention: An Outcome Study.
Means, B. & Olson, K. (1995). Technology’s Role in Education Reform (SRI Project
2882): SRI International.
Mehmet, E. (2002). Integrating Science and Mathematics Education Research into
Teaching Conference Maine University. Application of Computer Aided Mathematics
Teaching in a Secondary School, 1-6.
Mifflin, H. (2000). The American Heritage Dictionary of the English Language. Houghton
Mifflin Harcourt. New York.

90
Mogari, D., Kriek, J., Stols, G. & Ogbonnaya, U.I. (2009). Lesotho’s Students’
Achievement in the Mathematics and their Teaching Background and Professional
Development. Pythagoras, 70, 3 – 15.
Moila, M.M. (2006). The Use of Educational Technology in Mathematics Teaching and
Learning: An Investigation of a South African Rural Secondary School. A Dissertation
Submitted in Partial Fulfilment of M. Ed. University of Pretoria.
Monaghan, J. (2004). Teachers’ Activities in Technology-Based Mathematics Lessons.
International Journal of Computers for Mathematical Learning, 9(3): 327-357.
Naatanen, M. (2005). The Mathematics Education into the 21st Centuary Project:
Enriching Mathematics Teaching with Computers, 169-171.
National Council of Teachers of Mathematics (NCTM) (2000). Standards and Principles
in School Mathematics: An Overview. Reston, VA: NCTM.
National Council of Teachers of Mathematics (NCTM). (2003). The Use of Technology in
the Teaching of Mathematics. Reston, VA: NCTM.
Ng, W. & Gunstone, R. (2002). Students’ Perceptions of the Effectiveness of the World
Wide Web as a Research and Teaching Tool in Science Learning. Research in Science
Education, 32(4), 489-510.
Nicaise, M. & Barnes, D. (1996). The Union of Technology, Constructivism and Teacher
Education. Journal of Teacher Education, 470(3): 205-212.
Niess, M.L. (2005). Preparing Teachers to Teach Science and Mathematics with
Technology: Developing a Technology Pedagogical Content Knowledge. Elsevier Ltd.

91
O’Callaghan, B. (1998). Computer Intensive Algebra and Students’ Conceptual
Knowledge of Functions. Journal for Research in Mathematics Education, 29(1):21-40.
Olkun, S., Altun, A. & Smith, G. (2005). Computers and 2D Geometric Learning of
Turkish Fourth and Fifth Graders. British Journal of Educational Technology, 36(2) 317-
326.
Pankow, C.K. (1994). The Effects of College Student Use of Computers the Learning of
Algebraic Concepts. Dissertation Abstracts International, 55(12): 27774A.
Persson, P. (2011). Teaching and Learning Mathematics at Secondary Level with TI-
Nspire Technology. Report from the Research Project. Malmo University.
Pollak, H.O. (1986). The Effect of Technology on Mathematics Curriculum. In M. Carss
(Ed.) Proceedings of the Fifth International Congress on Mathematical Education.
Boston: Birkhauser Press: 346-351.
Porzio, D. (1999). Effects of Differing Emphases in the Use of Multiple Representations
and Technology on Students’ Understanding of Calculus Concepts. Focus on Learning
Problems in Mathematics, 21(3):1-29.
Pomerantz, H. (1997). The Role of Calculators in Math Education. Prepared for the
Urban Systematic Initiative/ Comprehensive Partnership for Mathematics and Science
Achievement Superintendents Forum. Retrieved from Texas Instruments website:
http://education.ti.com/sites/US/downloads/pdf/therole.pdf
Posthuma, A.B. (2000). Introduction to pre-calculus A: Only Study Guide for FDEMME1-
J. MPE110-N. Pretoria: UNISA.

92
Prepelita-Raileanu, B. (2008). Learning and Teaching in the Digital Age. Proceeding of
the 7th WSEAS International Conference on Education and Educational Technology.
Venice.
Quesada, A.R. & Maxwell, M.E. (1994). The Effects of Using Graphing Calculators to
Enhance College Students’ Performance in Pre-calculus. Educational Studies in
Mathematics, 27(2): 205-215.
Radmaste Centre (2008). University of Witwatersrand. Johannesburg.
Raines, J.M. & Clark, L.M. (2011). A Brief Overview on Using Technology to Engage
Students in Mathematics. Current Issues in Education, 14(2).
Rich, B.S. (1993). The Effect of the Use of Graphing Calculators on Learning the
Function Concepts in Pre-calculus Mathematics. In L. Lum (Ed), Proceedings of the
Fourth International Conference on Technology in Collegiate Mathematics.
Massachusetts: Addison-Wesley Publishing Company: 389-393.
Rittz, C.T III. (1999). The Effect of Using Graphing Calculators on Student Achievement
in Introductory Algebra and Geometry. Dissertation Abstracts International, 38(3): 51.
Roblyer, M.D. (1989). The Impact of Microcomputer-Based Instruction on Teaching and
Learning: A Review of Recent Research.
Rosenthal, I.G. (1999). New Teachers and Technology: Are they Prepared? Technology
and Learning, 19 (8): 1-2.
Rowlett, P. (2013). Developing a Healthy Sceptisim about Technology in Mathematics
Education. Journal of Humanistic Mathematics, 3(1): 136-149.

93
Ruthven, K., Hennesessy, S., & Deany, R. (2008). Construction of Dynamic Geometry:
a Study of the Interpretative Flexibility of Educational Software in Classroom Practices
of Teachers. Computers and Education, 51(1): 297-317.
Sax, G. (1979). Foundations of Educational Research. Englewood Cliffs, NJ: Prentice-
Hall.
Schroeder, T.L. & Lester, F.K. (1989). Developing Understanding in Mathematics via
Problem Solving. In: Paul R. Trafton & Albert P. Shuttle (Eds.), New Directions for
Elementary School Mathematics , 31-56. Reston, VA: NCTM.
Smith, B.A. (1996). A Meta-analysis of Outcomes from the Use of Calculators in
Mathematics Education. Dissertation Abstracts International, 58(3A): 125.
Smith-Gratto, K., & Fisher, M.M. (1999). An Aid to Curriculum and Computer
Integration: Prototypes of Teachers. Computers in the Schools, 15(2), 16-71.
Stat, C. (2005). The international Herald Tribune, September 23.
Stein, M.K., Silver, E.A. & Smith, M.S. (1998). Mathematics Reform and Teacher
Development from a Company of Practice Perspective. In J. Greeno & S. Goldman
(Eds.), Thinking Practices: A Symposium on Mathematics and Science Learning
Hillsdale, NJ: Erlbaum: 17-52.
Suharwoto, G. (2006). Secondary Mathematics Pre-service Teachers Development of
Technology Pedagogical Content Knowledge in Subject-Specific, Technology –
Integrated Teacher Preparation Program. A Dissertation submitted in partial fulfilment
of Doctor of Philosophy. Orgon State University.

94
Taft, C. (2000). A Rational for Integrating Technology into the Classroom. Online.
Available: http://middle.usm.k12-k12.wi.us/faculty/taft/technology/report.html
Taplin, M. (2007). Mathematics through Problem Solving, Accessed on January 03 2007
from Website: http:// www.mathgoodies.com/articles/problem-solving.html
Tarmizi, R., Ayub, A., Abu Bakar, K. & Yunus, A. (2010). Effects of Technology
Enhanced Teaching on Performance and Cognitive Load in Calculus. International
Journal of Education and Information Technologies Issue 2, Volume 4, 109-120.
Taylor, R. (1980). Computers and Calculators in the Mathematics Classroom. In M.M.
Lindquist (Ed), Selected Issues in Mathematics Education. USA: McCutchan Publishing
Corporation: 132-158.
The International Study Centre (1998). International Study Finds the Netherlands and
Sweden Best in Mathematics and Science Literacy. Accessed on: http://
timss.bc.edu/timss 1995 i/presspop3.html
Thomas, M. (2006). Teachers Using Computers in Mathematics: A Longitudinal Study.
Proceedings 30thConference of the International Group for the Psychology of
Mathematics Education, Volume 5, 265-272.
Thomas, M., Bosley, J., Delos Santos, A., Gray, R., Hong, Y. & Loh, J. (2006).
Technology Use and the Teaching of Mathematics in the Secondary Classroom.
Teaching & Learning Research Initiative in [email protected]
Tooke, D.J. (2001). Mathematics, the Computer and the Impact on Mathematics
Education. Computers in the Schools, 17 (1-2): 1-8.

95
Waits, B.K. (1997). The Merging of Calculators and Computers: A Look to the Future of
Technology Enhanced Teaching and Learning of Mathematics. Columbus, Ohio USA.
Waski, M. (2012). Montessori Algebra for Adolescent. North American Montessori
Teachers’ Association. Amsterdam, Netherlands.
Weigand, H.G. Changes of Working Styles while Using a Computer Algebra System-the
Case of Functions, 148-15.
Wheeler, S. (2000). The Role of the Teacher in the Use of ICT. Available Online:
http://www.fae.plym.ac.uk/tele/roleteach.htm.
Wiest, L.R. (2001). The Role of Computers in Mathematics Teaching and Learning.
Computers in the Schools, 17(1-2): 41-56.
Yushau, B., Mji, A. & Wessels, D.C.J. (2003). Creativity and Computer in the Teaching
and Learning of Mathematics. Technical Report Series TR 311.
Zhao, Y. (2007). Social Studies teacher’s Perspectives of Technology Integration.
Journal of Journal of Technology and Teacher Education, 15(3): 311-333.

96
APPENDICES
Appendix A
Learners’ Questionnaire
The purpose of the questionnaire is to investigate how computers can be used to teach
and learn hyperbolic graphs in Grades 10-12 Mathematics.
Personal information of learner
Please provide the following details below
School Name ---------------------------------------------------------------------------------
Learner’s grade --------------------------------------------------------------------------------
Learner’s age --------------------------------------------------------------------------------
Learner’s sex --------------------------------------------------------------------------------
Do you have a computer at home? Yes or No ------------------------------------------------
If yes, is the computer connected to the internet? -------------------------------------------
Do you use your computer at home for your schoolwork? Yes or No ----------------------
If yes, please explain what type of school work?------------------------------------------------
-----------------------------------------------------------------------------------------------------------
-----------------------------------------------------------------------------------------------------------
-----------------------------------------------------------------------------------------------------------
-----------------------------------------------------------------------------------------------------------
--------------------------------------------------------------------------------------------------------

97
Instructions:
• Answer all questions.
• All answers will be treated in the strictest confidence.
• Tick your choice from the given alternatives (indicate the extent to which you
agree or disagree with the following).
Hyperbolic graph is an interesting topic to learn using a computer (Autograph, and
Heymath etc.)
Strongly disagree
Disagree
Agree
Strongly agree
It is convenient to solve a hyperbola graph problem using a computer software
(Autograph or Heymath)
Strongly disagree
Disagree
Agree
Strongly agree

98
The use of a computer (Autograph or Heymath) in learning hyperbolic graphs enables
one to create tables of values of the graphs quickly
Strongly disagree
Disagree
Agree
Strongly agree
The use of computers in learning hyperbolic graphs enables one to draw graphs easily.
Strongly disagree
Disagree
Agree
Strongly agree
The use of computers in learning hyperbolic graphs enables one to get sufficient time to
investigate the nature and properties of the graphs
Strongly disagree
Disagree
Agree
Strongly agree

99
The use of computers in learning hyperbolic graphs gives learners the opportunity to
work in groups.
Strongly disagree
Disagree
Agree
Strongly agree
The use of computers in learning hyperbolic graphs gives learners the opportunity to
share views among themselves.
Strongly disagree
Disagree
Agree
Strongly agree
The use of computers in learning hyperbolic graphs gives learners the opportunity to
share views with their teachers.
Strongly disagree
Disagree
Agree
Strongly agree

100
The use of computers in learning hyperbolic graphs motivates learners to work
independently on their problems.
Strongly disagree
Disagree
Agree
Strongly agree
The use of computers in learning hyperbolic graphs gives learners the opportunity to
engage with real life mathematical problems.
Strongly disagree
Disagree
Agree
Strongly agree

101
Appendix B
Interview Questions for Learners
1. How are you being taught graphs in Mathematics?
2. What were your experiences in learning hyperbolic graphs using paper and
pencil?
3. What can you say about the importance of computers (Autograph software and
Heymath software or any other software) in learning hyperbolic graphs?
4. What were your experiences in learning hyperbolic graphs using computer
software such as Autograph and Heymath?
5. What are the advantages of using computers when learning graphs?
6. What are the disadvantages of using computers when learning graphs?
7. Mention the challenges you encounter when using computers to learn
Mathematics.
8. Do you have anything else to add?
Thank you for participating in both interview and questionnaire.

102
Appendix C
Interview Questions for Teachers
1. How do you teach graphs in Mathematics?
2. What were your experiences in teaching hyperbolic graphs using paper and
pencil?
3. What can you say about the importance of computers (Autograph or Heymath
software) in teaching hyperbolic graphs?
4. What were your experiences in teaching hyperbolic graphs using computer
software such as Autograph or Heymath software?
5. What are the advantages of using computers when teaching graphs?
6. What are the disadvantages of using computers when teaching graphs?
7. Mention the challenges you encountered when using computers to teach
Mathematics.
8. Do you have anything else to add?
Thanking you for participating in both interview and questionnaire.

103
Appendix D
Transcription of Learners’ responses to interviews in pilot study
1. How are you being taught graphs in Mathematics?
• L1: We use the table method using a graph paper.
• L2: We also use plain paper to draw the graph.
• L3: We use a calculator and press mode and shift and get a table and put values
and plot the graph.
• L4: We use the table method where we complete the table. Given the x- value
and we find the y-value.
• L5: Our teacher encourages us to find the intercepts and then plot the graph.
• L6-L9: Same response as L1.
2. What were your experiences in learning hyperbolic graphs using paper and pencil
method?
• L1: Plotting the hyperbola graph becomes slow and the points are not enough
and you can extrapolate.
• L2: It takes time to draw a hyperbola graph and it’s difficult to turn it.
• L3: It needs a lot of points to plot the hyperbola.
• L4: It is quite difficult to produce a shape and it takes a lot of time to complete
the table.
• L5: Finding the accurate scale is difficult.
• L6-L9: Same as L3‘s response.
3. What can you say about the importance of computers (Autograph software and
Heymaths software or any other software) in learning hyperbolic graphs?
• L1: It is fast and takes no time to produce the graph.
• L2: It is fast and easy.
• L3: It gives an accurate shape and saves time.
• L4: It is always correct

104
• L5: One can learn many properties of graphs within a short space of time.
• L6-L9: Same as L1‘s response.
4. What were your experiences in learning hyperbolic graphs using computer
software such as Autograph software or Heymaths?
• L1: We were able to see the effects of parameters on the graph
• L2: It is much easier seeing how the graph shifts.
• L3-L9: Agree with L1 and L2.
5. What are the advantages of using computers when learning graphs?
• L1: It is quick to finish drawing the graph.
• L2: You can see the graph and effects on the graph.
• L3: No need to draw table of values to plot the graph.
• L4: It is easy to draw with the computer.
• L5: Same as L2.
• L6: You can also help others who do not understand.
• L7: You can also see the movement of the graph.
• L8-L9: Agree with L4.
6. What are the disadvantages of using computers when learning graphs?
• L1: It is easy with computers but you must know how to plot the graph yourself.
• L2: The computer is not available when we write tests and examinations
• L3: When there is no electricity we cannot use computers.
• L4: You can be lazy when you depend entirely on computers to draw graphs.
• L5: When you don’t have a computer at home it could be a problem.
• L6-L9: Agree with L2 and L3.

105
7. Mention the challenges you encounter when using computers to learn
Mathematics.
• L1: There are those who do not know how to operate a computer.
• L2: The computer does not show us the steps but the graph is just drawn for us.
8. Do you have anything else to add?
• All the learners indicated they had nothing to add.

106
Appendix E
Representation and analysis of the teacher’s interviews in pilot study
1. How are you teaching graphs in Mathematics?
• T1: I use table method, we give learners x values and they compute the values
of y.
• The Learners use graph paper but even in a plain paper they can sketch the
graph.
• T2: Using graph papers and pencil. Also I make use of heymath program.
• T3: Manually by point plotting. Also by using autograph program.
The responses to question 1 indicate that teachers use both paper and pencil method
and computers to teach graphs.
2. What were your experiences in teaching hyperbolic graphs using paper and
pencil?
• T2: The shape of the graph is not clear, it depends on how accurate you are.
Shapes are not clear if the Cartesian plane is not properly done and the learners
miss it. It is another point where learners confuse the effects of a negative sign
and when they plot some points get lost.
• T3: It takes time that is it is time consuming.
• T1: Same as T2 and T3.
The responses to question 2 indicate that the shape of the graph is not clear when
using the paper and pencil method. The paper and pencil method is also time
consuming.

107
3. What can you say about the importance of computers (Autograph or Heymath
software) in teaching hyperbolic graphs?
• T1: One thing for sure it is amusing, just entering an equation, the graph comes
out very fast.
• T2: Learners experience more. Learners can work individually.
o T3: It is time saving. Heymath can be followed since there is audio. It is
motivating because the voice prompts the learners.
The responses to question 3 indicate that using computers to teach hyperbolic
functions motivates learners. It is also time saving and learners experience more.
4. What were your experiences in teaching hyperbolic graphs using computers
using (MS Excel, Autograph or Heymath software?)
• T2: From past experiences we are blessed to have computers and it is possible
to have learners in a computer laboratory. It enables us to reduce the coverage
of work. Our task is just to make learners distinguish between hyperbola,
parabola and trigonometric graphs.
• T3: It was exciting. Learners could see shifting.
• T1: Agree with T2 and T3.
The responses to question 4 indicate that computers enable teachers to be faster and
able to cover a lot of work in a short space of time. Computers also make learning
exciting for learners.
5. What are the advantages of using computer when teaching graphs?
• T1: Very fast, takes shorter time.
• T3: It can show different graphs in a short space of time.
• T2: Same as T1.

108
The responses to question 5 indicate that computers are very fast and take shorter time
to draw graphs.
6. What are the disadvantages of using computers when teaching graphs?
• T1: Learners will simply come to the laboratory and find graphs without knowing
them.
• T2: Internet abuse
• T3: Not all the steps are done or shown. Learners tend to become lazy.
The responses to question 6 indicate that learners could be lazy to draw graphs on their
own and this could be a disadvantage of using computers. Computers also do not show
the steps of drawing the graph but gives the finished product.
7. Mention the challenges you encounter when using computers to teach
Mathematics.
• T1: Electricity can interrupt the lesson when it goes off. Learners need to be
empowered with computer Literacy, so they need to have such lessons before
they come to the laboratory. Educators need to be trained on computer usage as
this is an area of challenge.
• T3: We cannot work if there is no electricity. Computers are not enough for all
the learners.
• T2: Same as T1 and T3.
The responses to question 7 indicate the challenge on the need to train teachers to use
many programmes that they have in studying mathematics.
8. Do you have anything else to add?
• T1: We now know Autograph that was with us for a long time and we knew
very little about it. Now we can make use of it.

109
• T2: The department must train educators on the programme they give to
schools in order for educators to implement in the teaching and learning of
mathematics.
Teachers indicated the need to train educators on the programmes they supply to
schools.

110
Appendix F
Transcription of interview responses of Learners who use computers at home
Question
Do you use your computer at home for your school work? If yes, please explain what
type of work you do with your computers.
• L1: It helps me to do research using the student library for my investigation and
research tasks. I use my computer to type my CV.
• L2: Learn more about Microsoft office programs.
• L3: I use the computer to do practical investigations
• L4: Investigations and researches.
• L5: If I am given a research project and investigation, I can use the internet to
find some information that can help me to do my investigation or my research. I
Google.
• L6: I use my laptop to connect internet the internet then I Google information
that I want. I use Google in the internet to search for information.
• L7: Life Sciences, Life orientation and Physical Sciences assignment and
investigations.
• L8: Collecting data on the internet when information in books is not enough as in
the case when talking about the world of today and statistics.
• L9: Downloading some of question papers and treat them. Investigating
something I don’t know which is relative to schoolwork
• L10: I use it when searching for things or information needed at school e.g. Life
Sciences, Geography, Life orientation only.
• L11: Searching for programmes which are needed. For example in Geography
we learn about G/S ( Geographicinternation system)
• L12: I take my economics notes from my teacher via my USB and I open my
notes on the pc and print them if I want. I study better with notes on the pc
than when they are in my books.
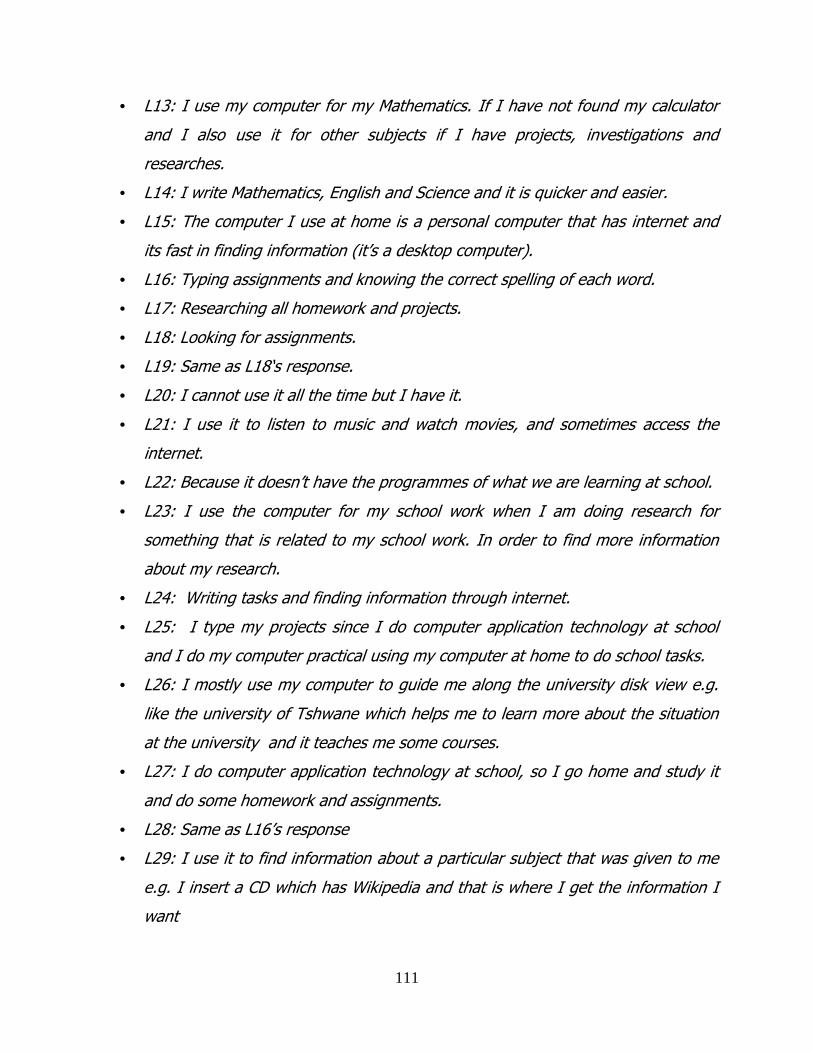
111
• L13: I use my computer for my Mathematics. If I have not found my calculator
and I also use it for other subjects if I have projects, investigations and
researches.
• L14: I write Mathematics, English and Science and it is quicker and easier.
• L15: The computer I use at home is a personal computer that has internet and
its fast in finding information (it’s a desktop computer).
• L16: Typing assignments and knowing the correct spelling of each word.
• L17: Researching all homework and projects.
• L18: Looking for assignments.
• L19: Same as L18‘s response.
• L20: I cannot use it all the time but I have it.
• L21: I use it to listen to music and watch movies, and sometimes access the
internet.
• L22: Because it doesn’t have the programmes of what we are learning at school.
• L23: I use the computer for my school work when I am doing research for
something that is related to my school work. In order to find more information
about my research.
• L24: Writing tasks and finding information through internet.
• L25: I type my projects since I do computer application technology at school
and I do my computer practical using my computer at home to do school tasks.
• L26: I mostly use my computer to guide me along the university disk view e.g.
like the university of Tshwane which helps me to learn more about the situation
at the university and it teaches me some courses.
• L27: I do computer application technology at school, so I go home and study it
and do some homework and assignments.
• L28: Same as L16’s response
• L29: I use it to find information about a particular subject that was given to me
e.g. I insert a CD which has Wikipedia and that is where I get the information I
want

112
• L30: I use my personal pc to try and study how to draw some of the
mathematical graphs.
• L31-33: They were silent, that is they gave me no responses but indicated they
had computers at home.

113
Appendix G
Transcription of Learners’ responses to interviews questions in the main
study
1. How are you being taught graphs in Mathematics?
• L1: Most of the time she starts by telling us the function, tells us to press the
mode and then the table will appear and then we draw the graph.
• L2: When she is teaching us she will tell us the values of x and we find y and
then draw the graph.
• L3: They use the table method, where you have to complete the table, given x
and you find y.
• L4: We use a calculator, when we press shift it will make us a table and we use
the table, then we will choose the table they will ask us where the graph starts
and end and we will plot the graph.
• L5: We press mode and then shift then the table comes and we put values of x
and the corresponding values of y come up and we draw the graph.
• L6: They encourage us to use a scale on the Cartesian scale
• L7: Sometimes we use graph paper.
• L8: They give us the first step, we find y-intercept and x-intercept, and use the
turning point, we substitute x to the equation and find the value of y and then
draw the graph.
• L9: They just give us equations so that we can work them out, get coordinates
and plot the graph, on graph paper or any paper, and we check effects of the
graph.
• L10: They tell us how to draw the graph and they give us the formula of the
graph
• L11: They give us the value of x, and tell us to find y using that formula.
• L12-L30: Agree with L3’s response

114
2. What were your experiences in learning hyperbolic graphs using paper and
pencil?
• L1: The method is bit slow and we need a curve and points are not enough.
• L2: It takes time to draw the hyperbola; it is difficult to make it curve.
• L3: It takes a lot of time to complete the table.
• L4: it takes a lot of time to find the accurate scale.
• L5: It takes a lot of time. The more time I spent on drawing the graph I could
use it to do other things and it is difficult.
• L5: It is difficult if I don’t have a ruler and wait for another learner’s ruler for her
to finish using it.
• L6: Sometimes we are asked to draw more than three graphs
• L7: Or sometimes we can use wrong scales
• L8: Sometimes we can forget to name the x and y axis.
• L9: It is a bit difficult and the shape is not visible, so it is difficult.
3. What can you say about the importance of computers (Autograph software and
Heymaths software or any other software) in learning hyperbolic graphs?
• L1: The computer is fast.
• L2: On paper when we draw some cannot use free hand and it is not beautiful.
• L3: It is much simpler and faster to answer questions. We are able to know more
graphs, that we cannot understand them in the class.
• L4: It helps us in the assignment as it will be very fast.
• L5: It is easy because we just click equation and ok if we do it ourselves it takes
a longer time.
• L6: The points come out straight unlike the paper and pencil.
4. What were your experiences in learning hyperbolic graphs using computer
software such as Autograph software or Heymaths?
• L1: I learnt many things when clicking the computer, I was unable to draw
hyperbola by computer.

115
• L2: There are many things. We are unable to see the points how they came
about.
• L3: It is much easier. We are able to see how the graph shifts when we change
coefficients.
• L5: Same as L3.
• L6: It was very interesting because we just had to click the equation and the
graph came out
• L7: Happy because I didn’t work it myself I did it by computer.
• L8: It is very fast.
• L9-L30: Same response as L3.
5. What are the advantages of using computers when learning graphs?
• L1: We are able to finish fast.
• L2: We are able to see the graph and facts of the graph.
• L3: No need to draw the of points to plot .
• L4: It is easy to draw.
• L5: We are able to see the shifting of the graph when we increase the
coefficient.
• L6: I can communicate with another learner and tell him or her how I have done
it.
• L7: Same as L4.
• L8: Same as L5.
6. What are the disadvantages of using computers when learning graphs?
• L1: When you use a computer you can be perfect, but when you write a test you
will struggle.
• L2: When we are working the electricity goes.
• L3: We are unable to draw for ourselves as the computer makes it easy for us.
• L4: It can make us to become lazy because in a test you will not be having a
computer.

116
• L5: Same as L2.
• L6: If at home there is no computer, it will be difficult to apply what we learnt.
• L7: We don’t know the steps of how points came about.
• L8: If the electricity goes.
• L9: In the examination we won’t have computers.
• L10: When you use a computer you don’t know how to draw the graph for
yourself, as computers give you the finished product.
• L11: When you use a computer and get the graph correctly but when you write
exams you will not get the graph correctly.
• L12: If I press another key instead of the correct key, then I will get a wrong
graph.
• L7-L30: Same as L2.
7. Mention the challenges you encounter when using computers to learn
Mathematics.
• L1: Some learners don’t know how to use the computer.
• L2: It needs a person who knows how to use a computer. Also to press plus on
the computer, we need to press shift first on the keyboard.
• L3: If you are addicted to using a computer and the electricity is off, it can be a
disadvantage.
• L4: Not to find the graph you are looking for. One must know the procedure of
using a computer.
• L5: When you don’t have a computer at home to practice using it.
• L6: Same as L1.
• L7: Or you take hyperbola, and write parabola then you get the wrong graph.
• L8: If we are given an assignment and leave it to the last minute and when you
go to lab and find no electricity.
• L9: Not to find the graph you are looking for. One must know the procedure of
using a computer.

117
8. Do you have anything else to add?
• One learner asked how he can get the autograph programme to his home
computer.
• The rest of the learners indicate they have nothing to add.

118
Appendix H
Transcription of Teachers’ responses to interview questions
Seven teachers were interviewed:
1. How do you teach graphs in Mathematics?
• T1: I use the table method, we give learners x values and they compute the
values of y.
• The Learners use graph paper but even on plain paper, they can sketch the
graph.
• T2: Using graph papers and pencil. Also I make use of the Heymath programme.
• T3: Manually by point plotting. Also by using the Autograph programme.
• T6-T7: Agreed with T1.
2. What were your experiences in teaching hyperbolic graphs using the paper and
pencil?
• T2: The shape of the graph is not clear; it depends on how accurate you are.
Shapes are not clear if the Cartesian plane is not properly done and the learners
miss it. It is another point where learners confuse the effects of a negative sign
and when they plot some points get lost.
• T3: It takes time, that is, it is time consuming.
• T4: Same as T3. A lot of errors are involved.
• T5: Same as T3.
• T6: It takes time to make the table. Mostly when learners make mistakes in
computing, it is difficult for them to trace their mistakes after drawing the graph.
There is lack of accuracy in sketches that is smoothness of curves.
• T7: Same as T3.

119
3. What can you say about the importance of computers (Autograph or Heymath
software) in teaching hyperbolic graphs?
• T1: One thing for sure, it is amusing. When one just enters an equation, the
graph comes out very fast.
• T2: Learners experience more. Learners can work individually.
• T3: It is time-saving. Heymath can be followed since there is audio. It is
motivating because of the voice prompts.
• T5: It is time-saving and accurate
• T6: It is very important, especially in this area of technology
• T7: It is user-friendly.
4. What were your experiences in teaching hyperbolic graphs using computer
software such as Autograph or Heymath software?
• T2: From past experiences, I would say we are blessed to have computers and it
is possible to have learners in a computer lab. It enables us to reduce the
coverage of work. Our task is just to make learners distinguish between
hyperbola, parabola and trigonometric graphs.
• T3: It was exciting. Learners could see shifting of the graphs.
• T4: It is time-saving. Learners enjoy using the computers. It is less of errors.
• T5: It was excellent.
• T6: There are no mistakes and learners get accurate graphs faster.
• T7: It is better.
5. What are the advantages of using computers when teaching graphs?
• T1: Very fast, takes a shorter time.
• T3: It can show different graphs in a short space of time.
• T4: It is motivating and time-saving. Learners concentrate more.
• T5: It is time saving and accurate.
• T6: There are no mistakes and learners get accurate graphs faster.
• T7: It is simple and easy.

120
6. What are the disadvantages of using computers when teaching graphs?
• T1: Learners will simply come to the lab and find graphs without knowing them.
• T2: Internet abuse.
• T3: Not all the steps are done or shown. Learners tend to become lazy.
• T4: Learners miss the 1st principles needed in how to plot points.
• Learners eventually become lazy as everything is done for them.
• T5: Encourages laziness to think.
• T6: Promotes laziness and learners do not really get to understand how the
graph came about.
• T7: Some learners are not exposed to computers and overcrowded classes.
7. Mention the challenges you encounter when using computers to teach
Mathematics.
• T1: Electricity can interfere with the lesson when it goes. Learners need to be
empowered with computer Literacy, so they need to have such lessons before
they come to the lab. Teachers need to be trained on computer usage as this is
an area of concern.
• T3: We cannot work if there is no electricity. Computers are not enough for all
learners.
• T4: Using the Heymath programme we have limited examples.
• T5: Over crowdedness and limited computers.
• T6: Some classes are too big, and with the limited amount of time, not all
learners may get the chance to use the computer.
• T7: Being computer illiterate.
8. Do you have anything else to add?
• T1: We now know Autograph that was with us and we knew little about it. Now
we can make use of it.
• T7: Most programmes must be installed in school computers.

121
Appendix I
Presentation of results from the pilot study
Figure 3.1 below, shows how learners agreed or disagreed with items on the use of
computers to learn hyperbolic graphs.
Fig: 3.1: The extent to which learners agreed or disagreed with items in the
questionnaire.
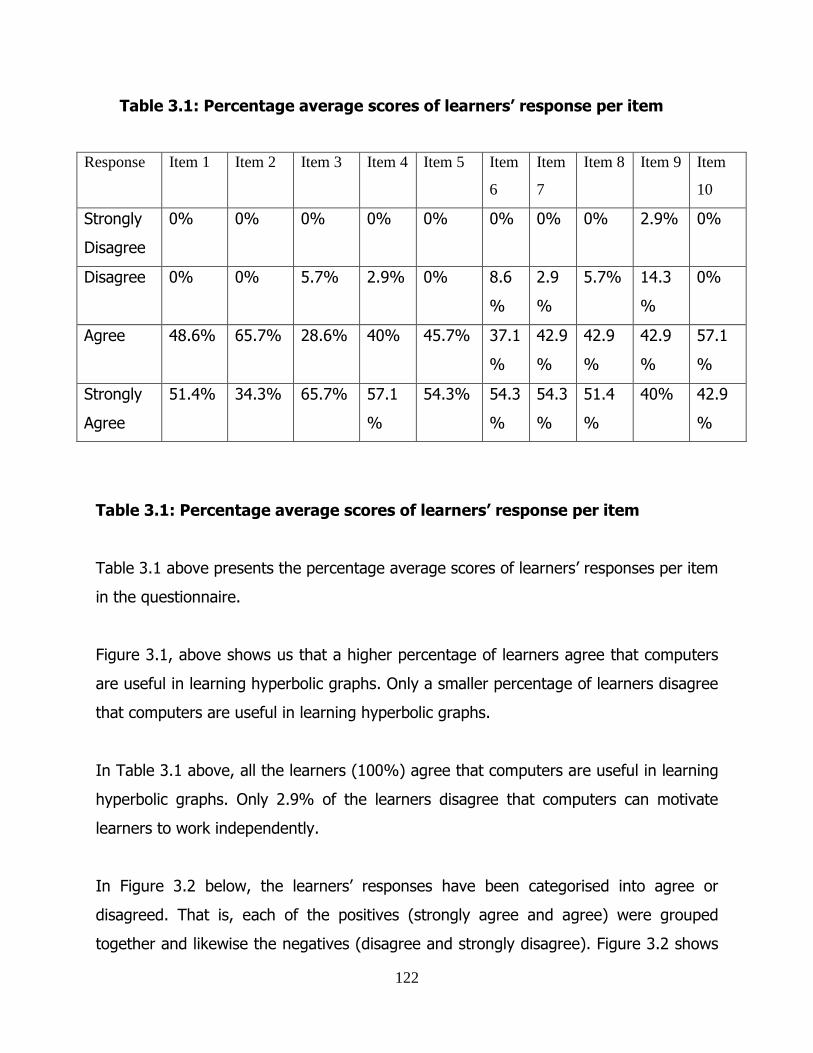
122
Table 3.1: Percentage average scores of learners’ response per item
Response Item 1 Item 2 Item 3 Item 4 Item 5 Item
6
Item
7
Item 8 Item 9 Item
10
Strongly
Disagree
0% 0% 0% 0% 0% 0% 0% 0% 2.9% 0%
Disagree 0% 0% 5.7% 2.9% 0% 8.6
%
2.9
%
5.7% 14.3
%
0%
Agree 48.6% 65.7% 28.6% 40% 45.7% 37.1
%
42.9
%
42.9
%
42.9
%
57.1
%
Strongly
Agree
51.4% 34.3% 65.7% 57.1
%
54.3% 54.3
%
54.3
%
51.4
%
40% 42.9
%
Table 3.1: Percentage average scores of learners’ response per item
Table 3.1 above presents the percentage average scores of learners’ responses per item
in the questionnaire.
Figure 3.1, above shows us that a higher percentage of learners agree that computers
are useful in learning hyperbolic graphs. Only a smaller percentage of learners disagree
that computers are useful in learning hyperbolic graphs.
In Table 3.1 above, all the learners (100%) agree that computers are useful in learning
hyperbolic graphs. Only 2.9% of the learners disagree that computers can motivate
learners to work independently.
In Figure 3.2 below, the learners’ responses have been categorised into agree or
disagreed. That is, each of the positives (strongly agree and agree) were grouped
together and likewise the negatives (disagree and strongly disagree). Figure 3.2 shows

123
how learners agreed or disagreed with items on the use of computers in the learning of
hyperbolic graphs.
Fig 3.2: The extent to which learners agreed or disagreed with items in the
questionnaire.

124
Table 3.2: Percentage average scores of learners’ responses per item
Response Item
1
Item
2
Item
3
Item 4 Ite
m 5
Item 6 Item 7 Item 8 Item 9 Item
10
Strongly
Disagree
or
Disagree
0% 0% 5.7% 2.9% 0% 8.6% 2.9% 5.7% 17.1
%
0%
Agree or
Strongly
agree
100
%
100
%
94.3
%
97.1
%
100
%
91.4% 97.1
%
94.3
%
82.9
%
100
%
Table 3.2 presents the percentage average scores of learners’ responses per item in the
questionnaire.
In Figure 3.2 above, a higher percentage of learners strongly agree or agree that
computers are useful in learning hyperbolic graphs. Only a few learners indicated that
computers are not useful in learning hyperbolic graphs.
In Table 3.2 above all the learners (100%) agree that computers are useful in learning
hyperbolic graphs. 17.9% of the learners disagree that computers motivate learners to
work independently.
Representation and analysis of the data in the learner’s questionnaire of the
pilot study
The aim of the pilot test was to assess the instrument’s validity and reliability. The
researcher wanted to determine whether the questionnaire items were meaningful to
learners. The data obtained from the questionnaire was analysed. The analysis of the
pilot data is in the next section

125
Question 1: Hyperbolic graph is an interesting topic to learn using a
computer (Autograph, and Heymath etc.)
All the learners, that is 100% of the learners, agree that hyperbolic function is an
interesting topic to learn using computers.
Question 2: It is convenient to solve a hyperbola graph problem using a
graph if you use a computer (Autograph or Heymath)
All the learners, that is 100% of the learners, agree that it is convenient to solve a
hyperbola graph problem using a computer.
The responses to item 1 and 2, presented in Figure 3.2 and Table 3.2 indicate that the
use of computers can encourage learners to learn hyperbolic graphs and produce a
positive disposition in learners towards hyperbolic graphs. All the respondents agreed
that a hyperbolic graph is an interesting topic to learn using a computer.
Question 3: The use of a computer (Autograph or Heymath) in learning
hyperbolic graphs enables one to create tables of values of the graphs
quickly
A small percentage, that is 5.7% of the learners, disagree that the use of computers in
learning hyperbolic graphs enables one to create tables of values of the graphs quickly.
A high percentage (94.3%) of the learners agree that the use of computers in learning
hyperbolic graphs enables one to create tables of values of the graphs quickly

126
Question 4: The use of computers in learning hyperbolic graphs enables one
to draw graphs easily.
A significantly low percentage, that is 2.9% of the learners, disagree that the use of
computers in learning hyperbolic graphs enables one to draw graphs easily. A fairly high
percentage that is 97.1% of the learners agrees that the use of computer in learning
hyperbolic graphs enables one to draw graphs easily.
Question 5: The use of computers in learning hyperbolic graphs enables one
to get sufficient time to investigate the nature and properties of the
graphs
All the learners agree that the use of computers in learning hyperbolic graphs enables
one to get sufficient time to investigate the nature and properties of the graphs.
Question 6: The use of computers in learning hyperbolic graphs gives
learners the opportunity to work in groups
A small percentage (8.6%) of the learners disagree that the use of computers in
learning hyperbolic graphs gives learners the opportunity to work in groups. The
majority of the learners (91.4%) agree that the use of computers in learning hyperbolic
graphs gives learners the opportunity to work in groups
Question 7: The use of computers in learning hyperbolic graphs gives
learners the opportunity to share views among themselves.
A low percentage (2.9%) of the learners disagree that the use of computers in learning
hyperbolic graphs gives learners the opportunity to share views among themselves. A
high percentage that is 97.1% of the learners agree that the use of computers in

127
learning hyperbolic graphs gives learners the opportunity to share views among
themselves
Question 8: The use of computers in learning hyperbolic graphs gives
learners the opportunity to share views with their teachers.
A small percentage (5.7%) of the learners disagree that the use of computers in
learning hyperbolic graphs gives learners the opportunity to share views with their
teachers. A high percentage that is 94.3% of the learners agree that the use of
computers in learning hyperbolic graphs gives learners the opportunity to share views
with their teachers
Question 9: The use of computers in learning hyperbolic graphs motivates
learners to work independently their problems.
A low percentage (17.1%) of the learners disagree that the use of computers in
learning hyperbolic graphs motivates learners to work independently their problems. A
high percentage (82.9%) of the learners agrees that the use of computers in learning
hyperbolic graphs motivates learners to work independently their problems.
Question 10: The use of computers in learning hyperbolic graphs gives
learners the opportunity to engage with real life mathematical problems.
All learners agree that the use of computers in learning hyperbolic graphs gives learners
the opportunity to engage with real life mathematical problems.
The responses to items 3,4,5,9 and 10 as presented in Figure 3.1 and Table 3.1 and
Figure 3.2 and Table 3.2 above indicate that the use of computers can enable learners
to engage with and explore the nature and properties of hyperbolic functions and their
graphs easily and quickly.

128
The responses to item 6, 7 and 8 as presented in Figure 3.1 and Table 3.1 and Figure
3.2 and Table 3.2 above indicates that the use of computers can facilitate learners’
group work and facilitate discussion among themselves and between learners and
teachers.
The data gathered through the questionnaire strongly supports the argument that
computers are useful in learning hyperbolic graphs. The literature review also supports
the use of computers in the teaching and learning of mathematics. It is, therefore,
important to integrate the use of computers into the teaching and learning of
mathematics
Learners who have computers at home and use them for mathematical school work
were interviewed and their responses are analysed below. A total of nine learners were
interviewed in the pilot study. These are learners who had indicated that they have
computers at home and that they use them for mathematical tasks. The following
section presents analysis of interview questions
REPRESENTATION AND ANALYSIS OF THE LEARNER’S INTERVIEWS
1. How are you being taught graphs in mathematics?
The learners’ responses to question 1 reflect that learners were not in agreement in
terms of specific methods which are used to teach them graphs in Mathematics. Six of
the learners pointed out that the table method is used. The other learners talked about
the use of a plain paper, calculator and the use of intercepts. The literature review
points out that the traditional paper and pencil method is ineffective in teaching graphs
as learners become passive in class. This is in agreement with Kehagis and Vlachos
(1996) who say that learners are generally attracted to computers.

129
The response to question 1 indicates that learners were passive in the teaching and
learning process. Teachers were the ones dictating the method learners use to plot
graphs.
2. What were your experiences in learning hyperbolic graphs using paper and pencil
method?
The responses of learners to question 2 indicate that the paper and pencil method is
slow, needs more points and it is difficult. This is supported by Lin (2008) who argued
that pre-service teachers expressed a desire to integrate the use of computers in their
classroom instruction. He further indicates that using Mathematics textbooks often
creates a dull classroom. Involving learners in hands-on activities which require them to
use using computers as resources will help learners to understand content.
The responses of learners to question 2 show that learners are not comfortable with the
use of the paper and pencil method. This may be interpreted as indicating that the use
of computers could serve as a motivation for learners to draw better hyperbolic graphs.
3. What can you say about the importance of computers (Autograph software and
Heymath software) in learning hyperbolic graphs?
To this question, learners showed an interest in the use of computers in learning
hyperbolic graphs. They claim that the computer is accurate, fast, and easy to work
with in the area of hyperbolic graphs. Learners also indicated that more properties of
hyperbolic graphs were learned in a short space of time. Computers enable learners to
cover more graphs than when they draw them manually. This is supported by Kaput
(1992) who indicates that learners working with the appropriate computer software can
work with more graphs in a short space of time.
The response to question 3 indicates that the use of computers can ease some of the
difficulties that learners encounter in learning hyperbolic graphs and improve their
understanding of hyperbola graphs. The use of computers can help learners to explore
the properties of hyperbolas.

130
4. What were your experiences in learning hyperbolic graphs using computers using
Autograph software or Heymaths?
Learners’ responses show that they were able to see the effects of parameters on the
graph, and that it was also much easier to see how the graph shifted. Gebrekal (2006)
supports the response of learners when she indicates that a lot of time can be allocated
to analysing the graphs and a little time to making the graphs.
The responses to question 4 indicate that learners were able to see the effects of
shifting the graph easily using computers.
5. What are the advantages of using computers when learning graphs?
This question was asked as a follow up to question 3 in case learners misunderstood it.
Learners’ responses to this question show that learners enjoy working with computers
in drawing graphs.
Learners maintain that computers are quick in drawing graphs, that there is no need to
draw a table of values, it is easy to use computers in drawing graphs, you can see the
movement of the graph and you can help others who do not understand through the
use of computers. The learners’ responses are in agreement with Suharwoto (2006)
who explains that the benefits of using the computer include increased accuracy and
speed in data collection and graphing, real-time visualisation, interactive modelling of
mathematical processes, ability to collect, compute, and analyse large volumes of data,
collaboration for data collection and interpretation and more varied presentation of
results.
The response to question 5 indicates that the advantages of using computers in
studying graphs include the fact that it is easier and faster to draw graphs.

131
6. What are the disadvantages of using computers when learning graphs?
Learners’ responses to this question indicate that over dependency on computers can
be problematic. Learners pointed out that one must know how to plot the graph without
the aid of a computer. Many learners indicated that electricity cuts could be a
disadvantage if one relies on computers only. Learners also indicated that in tests and
examinations, where computers are not available, one could struggle with hyperbolic
graphs. The issue of sacrificing skills was indicated by learners when they responded.
They argued that computers jump all the steps of drawing a graph, and only give the
finished product.
The responses to question 6 indicate that learners need to know how to draw the graph
manually as they will be expected to draw the graph in tests and examinations.
Computers can also spoil learners and they can become lazy to draw graphs on their
own. The responses also indicate that electricity could hinder the use of computers in
the learning of graphs.
7. Mention the challenges you encounter when using computers to learn
mathematics
Few of the learners indicated that it could be a challenge to use a computer if one does
not know how to operate a computer. A large number of learners indicated that a
computer does not show the steps followed when drawing a graph, and this is a
challenge.
The responses to question 8 indicate that some learners are not able to operate a
computer; This could be a challenge. The other challenge is that a computer does not
show the steps involved in the drawing of a graph, but only gives the finished product.
8. Do you have anything else to add?
All the learners indicated they had nothing to add.

132
An interview was also conducted with three teachers who taught Mathematics Grades
10 to 12 in the pilot study.
REPRESENTATION AND ANALYSIS OF THE TEACHER’S INTERVIEWS IN PILOT
STUDY
1. How are you teaching graphs in Mathematics?
The responses of teachers to this question reflect that teachers integrate many
methods in teaching graphs. Teachers pointed out that they use the table method,
graph paper and pencil, the Heymath programme and Autograph. Literature supports
the use of computers in mathematics classroom. This is confirmed by Bagui (1998)
when he indicates that computers are play an increasing role in assisting teachers in the
classroom. The response to this question shows the integration of methods in the
teaching and learning of graphs. This is supported by Mc-Donald and Trutman (2005)
who indicate that in the field of education, teachers are concerned with how to
integrate computers into instruction, in order to improve the quality of Mathematics
instruction and also enhance learners’ performance.
The responses to question 1 indicate that teachers use both paper and pencil method
and computers to teach graphs.
2. What were your experiences in teaching hyperbolic graphs using paper and
pencil?
The responses of the teachers to this question indicate that the method is time-
consuming, and the shape of the graph is not clear.
The responses to question 2 indicate that the shape of the graph is not clear when
using the paper and pencil method. The paper and pencil method is also time
consuming.

133
3. What can you say about the importance of computers (Autograph or Heymath
software) in teaching hyperbolic graphs?
Teachers showed interest in the use of computers to teach hyperbolic graphs. The
teachers pointed out that computers are amusing. They further pointed out that if one
just entered an equation where the graph would come out fast. Teachers also indicated
that it is time saving to use computers in teaching hyperbolic graphs. Literature
supports the use of computers in teaching Mathematics. According to Yushau, Mji and
Wessels (2003), working with appropriate computer software can result in one packing
a large amount of graphing experience into a relatively short space of time.
The responses to question 3 indicate that using computers to teach hyperbolic graphs
motivates learners. It is also time saving and learners experience more.
4. What were your experiences in teaching hyperbolic graphs using computers
using (Autograph or Heymath software?)
Teachers’ responses to this question indicated that they felt blessed to have computers
and to be teaching learners Mathematics in a computer laboratory. Teachers reflected
that their work could be covered quicker with the aid of computers. Computers enabled
learners to enjoy learning. Teachers further indicated that their role is to specify the
graph learners are to study so that the computer would give them the desired graph.
Teachers also alluded to the fact that computers are accurate tools for drawing graphs.
This is strengthened by Yushau, Mji and Wessels (2003) who indicate that computers,
especially in the area of graphs, can be an accurate tool of drawing the graphs.
The responses to question 4 indicate that computers enable teachers to be faster and
to cover a lot of work in a short space of time. Computers also make learning exciting
for learners.

134
5. What are the advantages of using computers when teaching graphs?
The teachers’ responses to this question indicated that computers are very fast and
take shorter time when used to teach graphs. The teachers also confirmed that
different graphs can be shown using computers in a short space of time. Teachers
support the use of computers in the teaching of Mathematics. According to Challoo
Marshall (2005), the majority of teachers believed that computer technology does
enhance the learners understanding of course content.
The responses to question 5 indicate that computers are very fast and enable one to
take shorter time to draw graphs.
6. What are the disadvantages of using computers when teaching graphs?
To this question, teachers pointed out that the overdependence on computers by
learners could be a disadvantage. Teachers also stated that other disadvantages in
using computers include internet abuse. The teachers also added that all the steps are
not shown when one is using computer and that learners tend to be lazy. The response
to this question implies that skills in teaching graphs should not be sacrificed by using
the computer. This is also supported in literature by Thomas, Bosley, Delos Santos,
Gray, Hong & Loh (2006) who they indicate that teaching concepts without sacrificing
skills is an important way of using computers.
The responses to question 6 indicate that learners can be lazy to draw graphs on their
own, and this could be a disadvantage of using computers. Computers also do not show
the steps of drawing the graph, but just give the finished product.
7. Mention the challenges you encounter when using computers to teach
Mathematics
Teachers’ responses suggested that learners need to be empowered with computer
skills before teachers can make use of computers in teaching. Teachers further
indicated that they also needed training on computer usage as it is a challenging area.

135
Some teachers mentioned electricity cuts as also a challenge of using computers in the
teaching of Mathematics. They also said that computers are not enough for all learners.
Literature shows us that there is need to train teachers on how to use computers. This
is supported by Smith-Gratto and Fischer (1999) who indicate that lack of appropriate
teacher-training is often considered as the main problem in implementing computers in
classroom instruction.
The responses to question 7 indicate the need to train teachers to use various
programmes in the studying of Mathematics.
8. Do you have anything else to add?
Teachers were excited that they are using computers to teach hyperbolic graphs. They
recommended that the department of education should train them on the programmes
they give to schools, in order for teachers to implement them in the teaching and
learning of Mathematics. Teachers indicated the need to train teachers on the
programmes the department of education supplies to schools.

136
Appendix J
Request permission letter to the School
Enquiries: Mavhungu LE
0726009029
X Sec. School
01-08-2011
Sir
Request for permission to collect data at your school
With reference to the above matter, kindly consider my request to collect data at your
school. The data is for my study in Masters of Science in Mathematics, Science and
Technology degree that I am presently doing with the University of South Africa.
In this study the teachers and learners in grade 10-12 will be sampled to participate.
Classroom observations will also be done when the computers are used in the teaching
and learning of Mathematics.
Your cooperation is always appreciated.
Yours faithfully
Mavhungu LE

137

138

139

140

141

142

143

144

145

146

147