Embed Size (px)
Citation preview

AFRPL TR-79-48
AN INVESTIGATION OF PARTICLE SIZE DISTRIBUTION USING
•14 LASER HOLOGRAPHY OF BURNING SOLID PROPFLLANT
S AIR FORC ROCKET PROPULSION LABORATORY an
00 EDWARDS AFB, CALIFORNIA 93523
0 AUTHORS" MT2HAEL J. ADAMS
T. W. OWENS
SEPTEMBER
1979
Approved for Pubtzc Rezeasc
Distkibution Untimnted
CA.
LAIAIR FORCE ROCKET PROPULSION LABORATORY D DDIRECTOR OF SCIENCE AND TECHNOLOGY
AIR FORCE SYSTEMS COMMAND 816EDWARDS AFB, CALIFORNIA 93523 JA L O
80 A
" 80180

I
NOTICES
When U.S. Government drawings, specifications, or other data are used for
any purpose other than a definitely related Government procurement operation,
the Government thereby incurs no responsibility nor any obligation whatsoever,
and the fact that the Government may have formulated, furnished, or in any
way supplied the said drawings, specifications, or other data is not to be
regarded, by implication or otherwise, as in any manner licensing the holder
or any other person or corporation, or conveying any rights or permission
to manufacture, use, or sell any patented invention that may in any way be
related thereto.
FOREWORD
This is a final report on research conducted in-house in the combustion
technology section, Combustion and Plume Branch, Propulsion Analysis Division
of the Air Force Rocket Propulsion Laboratory. The work wab accomplished
under the AFRPL project number 2308MICF. Work started in November 1977, and
was terminated on 30 September 1978 due to technical problems.
The authors would like to extend their sincere apprecia'ion for the assistance
given to them by Mr, Leon Triplett and Mr. David Cooke in the establishment
of the holographic recording and reconstruction test areas.
This report has been reviewed by the Information O~ficeiXOJ and is releasableto the NationalTechnical Information Service (NTIS). At NTIS It will be
available to the general public, including foreign nations. This technical
report has been reve,.ied and is approved for publication; it is unclassified
and suitable for general public release.
MIC'1AEL '. ADAMS WILBUR C. ANDREPO"•-•Principle Investigator Chief, Combustion Technology Section
FOR THE COMMANDER
EUGE G. HAE(W
Lhi, Propuls on and Analysis Division

iNr I ASS I FjLDtSECURITY CLASS-FirATION OF THIQ -AGE ("-n, 1)ata_ Entered) ___________________)~R:EPORT DOCUMENTATION PAGE READR INSTRUCETIONSOR
2.GV CCESSICN NO. -'PEC'FIT'i CATALOG NUMBEA
_C_ ITL -fan~ubitII - Q& A-ARIOD COVERED
, ANJNVESTIGATION OF2XARTICLE-SIZE ..JSTRIBUTION F.INAL PEPAOT,USIG LSERHOOGRAPHY OF BUKNING SOLID PROPELP.ANT ffiv 1977 # Sep 78
PERFORMING ORd. REPORTUME
7. ATHO a) . CONI RACT OR~ GRANT NUMBER(,,
T.W.U0WENS(
B WI OMIG RGNIATION NAME AND ADORESS I0. PPOGPAW 'LEMENTPRJF.APEA A WORK UNIT NUMBI RS
AIR FORCE ROCKET PROPULSION LABORATORY/PAcC 62302FEDWARDS AFB, CALIFORNIA 93523 ICF
I I. CONTROLLING OFFICE N AMR AND ADDRESS 12 REPRRT OATE
14, MONITORING AGENCY NAME &AODDESSQIf different from Controlling Office) I5. SECURITY CLASS, (of this report)
UNCLASSIFIED15o, DECL ASSI FICATION/ODOWNGRADING I
SCHEDULE
I6. DISTRIOL, TIO STATEMENT (of this Report)
APP~ROVED FOR PUBLIC RELEASE; DISTRIBUTION UNLIMITED
17. DISTRIBUTION STATEMENT (of the abstract onteged in Block 20, If dilferent from Report)
III. SUPPLEMENTARY NOTES
19. K EY WORDS (Continue an to verse old* If necessary and Identify by block num ber)
COMBUSTIONPARTI'tLE SIZE DISTRIBUTIONHOLOGRAPHY
20, BST RAC T (Continue on reverse side if necessary end Identify by block number)
A test area was modified to allow holographic recordings to be made ofburning solid propellant samples as contained in a pressurized windowbomb. A holographic reconstruction area was also established. Anattempt was made to develop a semi-antonated holographic data retrieval(HDR) system using existing AFRPL hardware. The purpose of the HDRsystem was to retrieve particle size and positions information in a
DD I1JAN 73 1473 EDITION OF INOV 65 IS OBSOLETE UCASIFIE n I
SECURITY CLASSIFICATION OF TH.IS PACE ("o~n Dol Fts r

UNL£LAS I F lEDi&EeaRIVr-4.\CLASIFJCATION OF THIS -AGE(Wfeu Data Xntnred)
timely manner from holographic reconstructions of tt'e propellantcombustion. Experiments with the NOR system revealed 5erlousdeficiencies in the areas o$ resolution and partic., recognition.Since a primary goal of the program was to establoh particledistribution correlations from holographically derived particle *1
information, the present program has been inactirated pendingthe development and acquisition of an improve; ;'R system.
- -I I. . .
UNCLASSIFIEDl)SECURITY C.L.ASSI VICATIC'e OF THIS PAOErWI..n D6e4, Fn1e.Vd)

PREFACE
The objective of th's study was to obtain the particlc size distri-
bution in the combustior, field above a burning solid propellant using
holography. This study also sought to identify the influence of propellant
formulation on that particle size distribution and attempted to identify
an appropriate statistical representation of the particle size distribution
above the surface of a burning solid propellant.
The program was terminated prior to obtaining any useful particle
count data. Experiments using holographic reconstructions of an AF-1951
resolution target revealed that an on-site electronic image analyzer, pro-
posed as an automated data retrieval system, could not detect small particles
(<50um) though the recorded holograms did provide good particle size
resolution (<10m) when examined visually. Holographic recordings exhibit
limited contrast for small objects. Electronic edge detection for small
objects could not be achieved against the background noise inherent to a
holographic recording. Hardware limitations In the data retrieval effort
coupled to a time constraint on the study forced a temporary abandonment jof the experimental program. Manual data retrieval, though possible, was
not implemented since the process is tedious, questionable as to accuracy,
and much too time consuming to gather sufficient data to formulate meaning-
ful statistical models. This report documents the proposed experiment and
the reason for its unquccessful conclusion. It is hoped that the experi-
ences and supporting material found in this report may prove useful to
those initiating similar studies in the future.
A
-i,I
TABLE OF CONTENTS
SECTION PAGE
1.0 INTRODUCTION 7
1.1 BACKGROUND 7
1.2 DEFINITIONS 7
1.3 PARTICLE SAMPLING 8
2.0 LASER DIAGNOSTICS IN PARTICLE MEASUREMENT 11
2.1 LASER DOPPLER 11
2.2 LASER HOLOGRAPHY 13
2.3 HOLOGRAPHIC IMAGE RESOLUTION 17
3.0 EXPERIMENTAL INVESTIGATION 17
3.1 EXPERIMENT AND APPLICATION 17
3.2 PROPELLANT TEST MATRIX 18
3.3 THE HOLOGRAPHY SYSTEM 19
4.0 EXPERIMENTAL PROCEDURES 25
4.1 IMAGE INTERROGATION 25
4.2 PARTICLE RECOGNITION 28
4.3 ELECTRONIC IMAGE ANALYSIS 29
5.0 RESULTS AND DISCUSSION 31
5.1 INITIAL INVESTIGATIONS 31
5.2 COMBUSTION HOLOGRAMS 32
5.3 POSITIONING 33
"5.4 PARTICLE FOCUS 35
"6.0 CONCLUSIONS AND RECOMMENDATiONS 37
6.1 CONCLUSIONS 376.2 RECOMMENDATIONS 38
REFERENCES 40
4
3
~P!CDIGPAGE NMFIA

t
LIST OF FIGURES
FIGURE PAGE
1 PARTICLE SIZE MEASUREMENT: RESOLUTION 10
2 VELOCIMETER AND PARTICLE SIZING SCHEMATIC 12
3 RECORDING OF OFF-AXIS HOLOGRAMS
4 RECONSTRUCTION OF OFF-AXIS HOLOGRAMS 15
5 LAYOUT OF RECORDING AREA 22
6 LAYOUT OF RECONSTRUCTION AREA 23
LENS BOX ADJUSTMENT FIXTURE 24
8 SCENE INTERROGATION 26
9 ELECTRONIC PARTICLE DETECTION AND SIZING 30
10 FOCUS CRITERIA 36
i4

LIST OF TABLES
TABLE PAGE
1 LASER SPECIFICATIONS 20
2 PROPELLANT TEST MATRIX 21
%I
:,,
" i5
t
1.0 INTRODUCTION
1.1 Background
1.1.1 Acoustic instabilities are often observed in solid rocket motors.
Quite simply, instability occurs in a motor when the delicate balance between
driving and damping mechanisms is sufficiently perturbed to allow finite
pressure disturbances to grow (Reference 1). Logically, one can seA to
suppress observed instability by decreasing driving or increasing dimping
within the motor cavity. Additives are introduced in the fuel to produce
particles which are in turn ejected in') the combustion flow fie d (Reference 2).
The presence of solid particulate provides a mechanism to dissip.dte acoustic
energy by iicreasing particle damping and decreasing driving mechAnisms.
1.1.2 Theoretical observations indicate that optimal damping appears
to be dependent on the size of the particles within the motor c:aity (Refer-
ences 3 and 4). Optimal damping occurs when the dynamic and thermal relax-
ation times associated with the particles equals that of the acoustic period
within the motor• Acoustic attenuation is therefore dependett on both
frequency and particle size, and concentration.
1,1.3 Though particles assist in suppressing acoustic instability,
particles also reduce motor performance. Theoretical investigations (Refer-
ence 5) have shown that the dynamic and thermal lags from the presence of
particles can reduce expected thrust. Therefore, one must balance acoustic
suppressicn against acceptable performance loss. Ideally, an optimum
part;cle size is sought based upon this trade-off.
1.2 Definitions
1.2.1 Before proceeding with further discussion, it will be beneficial
to provide clarif:zation concerning some of the terminology to be used in
this report. Unless stated otherwise, the term "particle" is used to identify
any solid matter occupying the gaseous media above the surface of a burning
solid p.-opellant. No distinctions are made regarding the identity (i.e.
composition) of particles. Although solid particles below lOOpm are rarely
spherical (Reference 6), references to particle size measurement shall imply
P1c1EDING PAGE _%MY Im

a spherical shape consideration.
1.2.2 One often rcfers to the dispersion of particles in a gaseous
media. Dispersion constitutes the spread of particle size around a statist-
ical mean. Monodispersed particles are of a single size, a situation quite
rare in naturally occuring two-phase flow systems. Polydispersel particles
show a distribution in size. Statistical methods aie employed to simplify
the representation of particle size in a polydispersed flow field. The
combustion f;'eld above a burning solid propellant is an example of a
polydispersed flow field. In this field, particles range in size from
submicron to several hundried microns in diameter.
1.2.3 A particle count determines the frequency of occurence of discrete
particle sizes within a fixed volume. Particle counts are generally repre-
sented Ly a histogram. Given a sufficiently large particle count, the assoc-
iated histogram can be smoothed to obtain a size frequency curve. Once
normalized, the area between any interval on the abscissa to this curve
defines the probability of finding a pa-ticle size within that interval.
1.2.4 Particle counts are used to obtain number-size distributions.
Henceforth, the labe! size distrijution shall imply equivalence to a number-
size distribution. When a size distribution shows a single characteristic
peak, the distribution is called unimodal. Unimodal distributions are
labeled homogeneous. Size distributions showing several peaks are called
multimodal and hence labeled heterogeneous.
1.2.5 Appropriate statistical definitions and considerations with
regard to particle fitld analysis can be fouind In References 7 or 8. In
general, the most common approach is to "fit" particle size data to well
known statis*ical forms, for example, in log-normal distr~bitions. Such
distributions are well characterized and easily programmed into a theoretical
study,
1.3 Particle Sampling
1.3.1 VIarious thecretical an,-iyse: -an be applied to predict the effects
of particle size distribution on stabi'ity and oerformance (References 3

Ithroýugh 5). These same methods can also be used in a parametric study to
predict an optimum particle size distribution with regard to a particular
motor/propellant combination. However, any theoretical prediction needs
experimental verification. Unfortunately, it is not possible to cast
propellants which will exhibit an a priori choice of particle size dis-
tribution in the combustion field. A more logical experiment is to ob-
tain a particle ýtze distribution measurement from subscale testing and
then use that measLrement in stability and performance analyses. Since
particle distribution represents an empirically derived quantity, a
particle count must be made by sampling the combustion flow field.
Particle sampling is accomplished using physical or optical methods.
Ar indication of size resolution which can be obtained using optical and
physical methods is Illustrated in Figure 1.
1.3.2 Physical sampling of a combustion flow field primarily uses
collection devices to gather particles. For example, during propellant
combustion, particles in the flow field are allowed to impact a holding
material or quench liquid. The collected particles are then carefully
,stributed on slides. Size and count information are determined by elec-
-ionic. or mechanical sizing instrumentation. There are problems associated
with particle collection. First, particle samples are gathered outside
the combustion environment. Particle collection in a combustdon flow
field is quite difficult and also disturbs the fiow structure, Second,
the method of collection may physically alter the particles lending un-
controllable bias to any size distribution correlation. Third, once
collected, the particles generally require careful preparation before
size and count measurements are taken. All of the aforementioned
problems lead one to try optical methods to sample particle laden flows.
1.3.3 In contrast to collection devices, optical methods do not
gather physical objects. One does require that the flow be accessible
to a light beam via wiidowing. Optical sampling does not interfere with
the flow field and therefore permits sampling in the actual combusticn
environment., However, effects such as flame luminosity or high particle
loading (i.e., concentration) may interfere with optical detection methods.
*
S49

MeasurementRadiation Techniques
radio waves 10 -- 40 "2
S 12 4 Sieves
Far 10 0
Inf red collecti n La'se r Region of CurrentcTa Methods interest
N'ar \,v M i ( •r°o Ire scopeoran ge - .40., "
yel low.L i Qh t!reeniI
blu Ul t • -- Visibility Limitviolet Vilet F
A 0-2__10"8
10- 4_. _I0"I10
Figure 1. Particle Size Measurement-, Resolution
10

1.3.4 There are several optical methods used in particle size
measurement, two of which are laser doppler and laser holography. The
first method constitutes a fixed point, real-time measurement while the
latter method is a fixed time, spatial ..,easurement.
2.0 LASER DIAGNOSTICS IN PARTICLE MEASUREMENT
2.1 Laser D6ppler
2.1.1 The key premise b, nd the use of a laser doppler system is that
measurable properties of scattered light are dependent on the size and
optical properties of the particles which scatter the light,ie.Illuminated
particles serve as secondary radiation sources A typical laser doppler
arrangement is shown schematically in Figure 2. A laser source is divided
into two spatially separated beams of equal intensity. The two beams are
focused to some crossover point where they establish a fringe pattern of
varying intensity. The fringe pattern fills a small ellipsoid volume and
as such is viewed as a point measurement in the flow under examination.
Particles in the combustion flow pass through the scene volume and disturb
the fringe spacing. The scene volume is "oabserved" with one or more
photodetectors. A disbturbance in the scene volume is seen as a modulated
signal from the photodetector. Signal modulation is examined with a
pulse height analyzer to extract flow field information.
2,1.2 Particle size information is obtained from the visibility of the
output signal from the photodetector (References 9 and 10). Visibility
represents an average intensity value and is a measure of the extent to
which the doppler frequency can be measured. Ideally, there exists a
one-to-one linear relationship between measured light intensity and particle
size. Light intensity is related to the depth of the modulated signal which
"in turn is represented by measured visi;ility. Durst and Eliasson (Reference
10) suggest an additional measurement of signal amplitude be made to estab-
lish particle size. A laser doppler derived size measurement in a poly-
dispersed particle field is an average value. This average value can vary
depending on the shape of the particles, particle concentration, and the
size range of the particles.
!1

C-3z
LL.
us 0
00 v u
* 4 (I))
* ~11.2I-C I>'44o
w
12 2

2.1.3 There are several limitations to extracting particle size infor-
mation from a laser doppler apparatus. First, this method of size measurement
requires careful calibration of the response of the system to establish
the particle size range where the presupposed linear response assumption ;s
valid. Second, if the Intensity of a laser beam is assumed to be Gaussian,
proper weighting must be applied to derive particle distributions to avoid
biasing to larger particle sizes. Third, a high particle concentration can
cause multiple scattering to occur which results in a saturated signal from
the photodetector. This saturation limit s dependent upon the size of the
particulate; however, a reasonable upper limit in combustion flows appears
to be around 104 particles/cm3 . Other effects such as flame luminosity can
also interfere with the photodetector signal. A complete discussion of
problems associated with doppler measurements can be found in Reference 9.
The present study chose to use laser holography to obtain measurements of
particle size and count.
2.2 Laser Holography
2.2.1 A photograph represents an instantaneous recording of a scene as
projected two-dimensionally onto a light-sensitive material. Photographs
are a record of the amplitude of an incident object wave from the scene.
Amplitude information is realized as image contrast on the developed pic-
ture. A photograph exhibits limited depth of field and restricted viewing.
For example, one cannot see behind objects recorded in the foreground,
However, limited parallax can be obtained with stereoscopic methods.
2.2.2 A hologram also represents an instantaneous recording on light-
sensitive material. However, unlike a conventional photograph, a hologram
contains a record of both the amplitude and phase of the object wave which
passes through the scene. The addition of phase information allows the
scene to be reconstructed at any later time. Holograms give an extended
1 depth of field that is many times greater than that exhibited by conven-
tional photographs. The field of viL' in the recorded scene is limited
primarily by the resolution capability of the recording material. One
obtains virtually complete parallax In holographic recordings. By chang-
ng the observation point in a holographic reconstruction, one can see
¶" throughout the entire scene volume, hence in three dimensions.
13

2.2.3 Phase information is introduced to a holographic recording
throughi a coherent reference wave with a known phase distribution. The
reference wave acts as a carrier frequency to the object wave. The method
one uses to introduce the reference wave into the recording distinguishesbetween two holographic techniques, namely in-line or off-axis recording.
Further discussion will be restricted to the off-axis method shown schema-
tically in Figures 3 and 4 (Reference 12).
X
_ R
object bea
Figure 3. Recording of Off-Axis Holograms (Reference 12).
2.2.4 In the off-axis method, recording begins by splitting a parent
laser beam into two spatially separated beams of different Intensity. Since
the reference beam acts as a carrier, this beam should be of greater in-
tensity. Typically, the ratio of reference to object beam intensity is four
to one. When the object beam passes through the scene volume, the beam is
scattered as it encounters an object. This scattered wave is recorded
on a special holographic plate, Simultaneously, the reference beam is
14

directed to the record!ng material without Interference. Both beams must be
spatially and temporally coherent as they are superimposed on the holographic
plate. Once superimposed at the plate, the beams form an interference
pattern. Intensity distribution is again observed as image contrast whrle
phase information is represented by the frequency and shape of the recorded
interference fringes. Following the recording process, the holographic
plate is processed similar to a conventional photograph,
2.2.5 Holographic reconstruction begins by replacing the developed
plate in the same orientation as existed in the recording process. Ideally,
the same wavelength laser beam is passed through the exposure, but in a
direction directly opposite to that observed by the reference beam d,1ring
the recording process. The hologram acts as a diffraction grating. Re-
construction yields a zero order traveling wave and two additional first
order diffraction waves. Higher diffraction orders are missing or quite
weak since the two beam 7rradiance pattern is essentially sinusoidal. Of
the two diffraction waves, one gives an undistorted real image in front of
the hologram. The second wave gives an unwanted virtual image which is
ignored. Reconstruction is illustrated in Figure 4 (Reference 12).
First OrderFirstOrder Higher Order.- Virtual Image Hir Order
Virtual Images
"%% •Higher Order
Real Images
'%% First OrderA.Real Image
0-R R
Figure 4• Reconstruction of Off-Axis Holograms (Reference 12),
'15

2.2.6 The off-line recording method virtually eliminates self-inter-
ference between illuminated points on an object during plate exposure. In
addition, the method requires less critical plate processing as well as
complete spatial separation of zero and first order waves during reconstruc-
tion. Furthermore, the off-axis method reduces nonlinear effects in the
recording material (Reference 13 and 14).
2.2.7 In this study, combustion holograns are recorded using diffuse
illumination since direct illum;nation causes strong refraction patterns
to be observed In the reconstructed scene (Reference 15). Diffuse Illum-
ination is introduced during the recording proces3 by placing a screen
(e.g., frosted glass) in the path of the object beam before it enters the
scene volume. The diffusing screen acts to distribute radiation from
points on the object over the entire plate exposure. This averaging
method gives a granular texture to the reconstructed image. The observed
Interference Is called speckle noise. As will be discussed later, specklenoise will Inhibit object detection in a holographic reconstruction.
2.2.8 Particle concentration in the scene volume also is a limitingfactor in holographic studies of particle laden flow fields, A high
particle concentration decreases the quality of t':e recorded hologram due
to increased wave scattering. Lower quality in the recording results in
poorer particle size resolut;on in the reconstructed intage. Several invest-
Igators (References 17 and I1 indicate that high quality holographic re-
cordings require low particle concentrations. Witherow (Reference 18) has
made an effort to quantify this concentration limit. Using holograms of
monodispersed particles in silicon gel, Witherow indicates that a range3 53
of 10 to 10 particles/cm corresponds with holographic recordings of
good to poor quality respectively. These limiting values are not readily
applicable to a combustion study for several obvious reasons. First,
natural particle flows are rarely monodispersed. Second, in i• combustion
environment, other factors such as flame luminosity (Reference 15) may
limit recording quality.
2.2.9 Interestingly, holography appears to share the same particle
concentration limit as laser doppler. However, both methods are quite
complimentary. The conwmonality of certain flow limitations is therefore
not unexpected.
16

2.3 Holographic Image Resolution
2.3.1 Holography, like other optical methods, is limited in resolutionby the laws of diffraction. A point source image appears as a diffraction
disc whose finite dimension determines resolution. Resolution in a holo-graphic recording is limited by the effective numerical aperture of thehologram (References 12 throLgh 14). The numerical aperture may or may
not be represented by the physical size of the exposure. Regardless,ideal resolution is never achieved d6e to the presence of speckle noise.
2.3.2 As mentioned previously, speckle noise originates during therecording process when transforming direct laser illumination to dif jseillumination and is observed In the reconstructed image as a mottled scenetexture. Speckle noise increases with decreasing numerical aperature inthe hologram. The net effect of speckle noise Is to reduce the resolving
* power in the hologram. Recorded objects become Indistinguishable as theirsize approaches that of the speckle. Since speckle noise cannot be suppressedduring the recording process it must be eliminated during Image reconstruc-
tion.
2.3.3 Mechanical methods of speckle removal (References 15, 21, and 22)have met with marginal success. Electronic filtering through an imageanalyzer has also been applied as a method for speckle removal (References 17,18, 20, and 23). Image processing with computer software is also applicable(Reference 24). The present study chose the method employed by Briones andWuerker (Reference 15), namely introducing a rotating mylar disc into thereconstruction apparatus.
3.0 EXPERIMENTAL INVESTIGATION
3.1 Experiment and Application
3.1.1 As stated earlier, the present study used laser holography torecord particle data (e.g., size and count) in the flow field above thesurface of a solid propellant. The feasibility of applying holography tothis combustion event was demonstrated by Briones and Wuerker (Reference15). The intent of the present study was to restrict attention to special
17

Tpropellants exhibiting parametric variations in composition. Particle
size distribution for these special propellants was desired for several
reasons. First, one might observe trends between propellant formulation
and size distribution. If observed, such trends might assist in controlling
particle size in the motor cavity through formulation. In the event trends
are not observed, one can still use size distribution information to screen
propellants to obtain a desired particle size. Should solid propellants
exhibit characteristic "signatures" in particle size distribution, such
information might be used to identify propellants showing potential stability
problems. A validation in the equivalence of propellant samples through
particle distribution measurement offers a potential means to maintain
quality control.
3.1.2 Another possible application is in the area of solid propellant
combustion modeling. Near surface particle distribution measurement pro-
vides, In essence, another boundary concition which may be of help In
Incorporating such effects as agqiomeration into combustion models of
metallized propellants. Particle distribution measurements in the flow
field are a logical compliment to the chemical control studies of Miller
(Reference 19).
3.2 Propellant Test Matrix
3.2.1 Special propellants were prepared as shown by the test matrix
in Table I. The baseline formulation was kept simple to lessen the compli-
cation of identifying potential trends between formulation and size distri-
bution. The baseline formulation was varied parametrically to assess the
influence of the following parameters on particle distribution, namelya. oxidizer size and distribution*
b. aluminum site and distribution*
c. HIX distribution,'
Ammonium Perchlorate and HhX samples were examined by both MSA and image
analysis in an effort to characterize propellant ingredientb. These results
*Distribution as applied here refers to that observed in the ingredients
which make up the propellant.1
18 ',

14,
are also presented in Table i. The results appear inconsistent at first
glance., However, one must remember that an MSA analysis yields weight-
averaged values whereas image analysis will yield number-averaged values.
While one should not expect perfect agreement between the two methods, the
observed discrepancies are alarming. Since the MSA analysis was consistent
with a similar analysis done on the same samples prior to this study, the
results from the MSA analysis will be assumed as correct. Strand burn
rate measurements are summarized in Table 1. The results are consistent
with the observation of Miller (Reference 19).
3.3 The Holography System
3.3.1 Holographic recording was conducted using a Q-switched ruby
laser (6943A) In conjunction with a specially constructed holocamera
(Reference 15). The laser system Is summarized In Table 2. Propellant
combustion tests were conducted using a pre-pressurized windowed chamber
to enclose a small (2 X 3 X 6mm) propellant sample. Propellant ignition
was implemented with a burn wire. To keep the observation windows clean,
a nitrogen purge was directed around the propellant sample during combustion
tests. Recording functions (i.e., propellant ignition, laser discharge,
chamber vent) were sequenced through a mechanical timer. Time delays must
be set manually and were determined by trial and error. One can expect
the timer settings to vary in relation to the varying burn rate of different
propellants. Figure 5 shows the layout of the recording area.
3.3.2 A spectra Physics Model 175 continuous wave helium neon laser
(6389A) was used to provide illumination during holographic reconstruction.
Reconstruction was conducted in a separate area using the layout show•n in
Figure 6. The procedure begins by replacing the developed hologram back
into a portable lens box unit of the holocamera. The lens box allows one
to maintain the same optical arrangement as was used during recording.
Once placed into the lens box, the ho;ographic plate cannot itself be re-
positioned. Therefore, the lens box Is placed upon a specially constructed
pedestal which allows the plate to be positioned for optimum illumination
and resolution. The pedestal, which Incorporates three axis positioning,
leveling, and tilt control is shown in Figure 7.
19

Table I- LASER SPECIFICATIONS
Recording Reconstruction
SPulsed Ruby Helium Neon
wavelength 6943 A 6389 A
Average OutputPower (Energy) 1 Joule 50 mw.
Raw Beam Diameter (db) 2.0 imm. 2.0 mm.
Beam Divergence O.uO7 my. .007 mv.
Ocular SEED* (db<dp) 2.26 X 105 cm. 2.8 X 103 cm.
Ocular Optical Density 6.72 1.7Exposure Duration 5 X 10 -8ec,
1 X 10 sec, .25 sec.
Laser Pulse Duration 50 ns. (single & double)pulse ) continuous
10 ns. (single pulse( chopped )
Safety Eyeware American Optical #585 American Optical #581O.D. - 46 O.D. - 6.0
* SEED w Safe Eye Exposure Distance
dp - pupil diameter, assumed at 7ram
2
20
CN co -4 eq
ý co 04C4 C
4) -
-44 -T - -
1. co
cc OvN M
LIN.0 *'0 LA mr.
(n~~~ LAC 0 0
N 4c ON 0 d)'UN 4-A IA v
4-% 'f0 0 N
0 * 4W04--0 N- 0 N L
''A
~ %0 LA
1. - 8 ALCA OD 4)K1 44 cm NO
0 4)
L?
.4 F o I I .(
I.d
Jc 4)
ie
• 0 L.. 4 cm
22

"to image Analyzr
I Cle3n Room
Dark Room
-0 1/ .... .,•
0)Work bench
I TVjz Monitor
Tape - -Viticon
Dock 1.e0000 000, HMicroscope
Holographic Reconstruction XYZ TableArea
Slens boxand Plate
S~holderMi rror
..&,.Indicator Control switch expander
Visible Emmislon"Indicator (Red Light)
* nFigure 6. Layout of Reconstruction Area.
23

3.3.3 The contructed Image Is received through a conventional micro-
scope. The microscope is in turn attached to a vidicon camera. The camera
incorporates a silicon-faced tube which is sensitive to red light. Video
output from the camera is passed to either 4 s•adord televi;,on monitor
or a Bausch and Lomb Omnicon image analyzer. A video monitor is required
to establish the focus and magnification in the imaging system. The elec-
tron!c Image analyzer supplies an automated data rttrievel capability with
regard to particle size and count information.
4.0 EXPERIMENTAL PROCEDURES
4.1 Image Interrogation
4.1.1 As shown in Figure 8, the reconstructed scene volume of co•e
combustion field Is divided Into smaller subvolumes whose cross section
is defined at any point along the optical axis by the overall ;nagnifica-
tion of the imaging system. Bexon (Reference 20) has shown that the overall
magnification of an Imaging system of the type used in this study will
change slightly in each plane along the optical axis. Fortunately, these
Incremental changes in magnification can oe calculated by knowing the
magnification In a predetermined reference plane and the separation distance
between the reference plane to the adjacent plane of interest along the
optical axis. One establishes a reference plane by placing a known target
in the scene volume during te recording of the hologram. Upon reconstruc-
tion, the known target Is used to calibrate the overall magnification in
the reference plane. The location of the reference plane is specified by
the position of optimum focus on the target. Once established, thl
position represents the relative zero location along the optical axis.
All subsequent movements along the optical axis are made with reference
to this zero position.
4.1.2 Several points should be h'.,de at this time. First, in this
study, each olane along the optical axis will present an image containing
both In and out of focus particles. The focus of the imaging system should
not be changed once established In the reference plane. Therefore, there
is a need to develop some criteria by which to Identify out of focus par-
ticles. This requirement will be explained in more detail later. Second,
24

Ssince the location of the reference plane is a relative position, this
location must be reset for each hologram. Third, the overall maqnification
at pointr along the optical axis must be determined in order to prevent
redundant particle sizing when examining adjacent subvolumes.
Z /Scene Vlm
Sgo Planes u v m
Rference Plane r-
Flqure 8. Scene Interrogation
4.1.3 A total screening of the entire reconstructed scene, though I
desired for completeness, may not be required to obtain a statistical
average which can represent the actual particle distribution above the
burning propellant surface. The total numb.r of particlef which one must
count is dependent upon both the extent of Isotropy* In the particle field
and degree of particle dispersion. Obviously, a mor-dispersed particle
field which Is totally isotropic does not require a large particle count,
Polydispersed particle fields present a greater problem. A possible
solution Is to count particles until some chosen statistical average shows
little change with increasing particle count (Reference 8). This condition
SIn an isotropic combustion field, particle concentration is invarian, In
all directions.
25
04-00 .

is observed by plotting mean values against particle count. This proposed
method is not foolproof since its success assumes that particles are ran-
domly distributed such that the final mean value reflects the proper
weighting in all particle sizes. A cursory interrogation of the entire
scene volume may be required to lend support to statistical determinations.
4.1.4 The results reported by Briones and Wuerker (Reference 15)
appear to indicate that the particle field above a burning solid propellant
does not show any layering as to particle size. However, this observation
is bdsed on a particle count of 568 particles in one small reglon (6.4 X 10³
cm ) above the propellant surface. Furthermore, these results were obtained
from one hologram and hence represent a single test of one propellant
sample (16% Al, 84% A p). Admittedly, it is somewhat premature to predict
isotropic behavior in solid propellant combustion particle fields basedupon this single observation. However, this study proceeded using an
isotropic assumption. The Isotropic assumption can be checked visually
or by comparing statistical averages of particle distribution as determined
for discrete layers from the optical axis. If an isotropic assumption is
not applicable, spatial coordinates must be assigned to the particles which
are counted. This indexing procedure would allow direct monitiring of any
spatial variation In mean particle size. Since solid propellant combus-
tion is essentially a steady state process, the particle field Is assumed
to equilibrate quickly with regard to its mean properties. Therefore,
mean properties are assumed to have no temporal dependence. This assumption
can be validated by examining mean particle properties at different times
Into the propellant burn. This task is accomplished during the recording
process by double pulsing the Illuminating laser. Thi reference beam
polarity is flipped on the second pulse. The overall process gives two
distinct holograms which represent two burn times (Referenceb 15 and 16).
Using the equipment described in section 3.0, the Interval between the two
recordings can range from 5 to 500 usec.
4.1.5 As mentioned earlier, the combustion window bomb utilizes a
nitroget, purge during the propellant burn. Turbulent mixing between the
purge gas and the products of combustion will occur. The Influence of
26

the purge gas diminished near the propellant surface. Since interest lies
only in particle distribution associated with propellant combustion,
sampling will be restricted to small distances from the propellant surface.
4.2 Particle Recognition
4.2.1 Sizing particles in the reconstructed combustion field begins
with particle recognition. The most immediate means by which to identify
particles is to use the human eye. Consider briefly how this complex
process ef object recognition proceeds. The eye receives a visual input.
Sensory, information Is passed to the brain for processing. For example,
background noise or other features of noninterest are automatically
subtracted from the Image. Compensation is made for uneven illumination.
As an Image is received, the eye integrates over the total area of the
scene. One "sees" continuous tone Images where colors blend in intensity
(level) and spatially (area). Detected features are examined with regard
to shape, focus, and contrast. Object boundaries are distinguished by
discernable contrast with the surrounding media. Once appropriate bound-
aries have been defined, an object can be sized. Objects are sized
individually by comparing the object to a calibrated reference. In a
combustion field where there are many objects, manual sizing becomes along and tedious operation. Furthermore, the human eye can tire and isalso subject to false images (optical Illusions). For holographically
examining particles in a combustion flow field, one realizes that auto-mated particle detection aihu sizing is a more practical approach.
4.2.2 Automation is a universal term which has varying degrees ofinterpretation. As applied to the discussion which follows, automated
particle data retrieval refers to the decomposing of an image plane intoa vi4teo signal for subsequent processing by a compucer and/or other elec-tronic devices. At this point, a distinction Is drawn between electronicversus computer image analysis. Electronic image analysis evolves froman analog process and involves only the direct acquisition of image data.Computer image analysis involves the digitization of an image (acquisi-
tion) for subsequent analysts by computer software (processing) (Refer-ences 25 and 26).
27

4.2.3 As stated earlier, objects are detected in an image usi~ng
discernable contrast. Discernable contrast is quantized by discrete grey
levels. Hence,,contrast is measured according to the grey level sensi-
tivLty of the image receiver. For example, a scanning mlcrodensitometer
can detect 256 levels of ,grey. A good photographic film can record about
200 of these levels. The human eye can resolve about 50 grey levels while
an electronic image analyzer works with 40 levels. Thus, electronic de-
tection by dlscernable contrast is Ideally as good or slightly poorer than
the capability exhibited by the human eye. If an object cannot be detected
by the eye, it will probably resist detection by an electronic Image analyzer.
However, electronic analyzers offer a major advantage. Detected objects
are sized virtually instantaneously. Hence, a field of polydispersed
particles can be examined much faster than can be achieved manually. Further-
more, if properly calibrated, these machines offer greater accuracy since
they are not subject to fatigue.
4.3 Electronic Image Aualysis
4.3.1 A typical electronic Image analyzer operates in the following
manner (References 28 and 29). An Image is brought to the face of a
vidicon tube by a lens arrangement. An electronic beam scans the face of
the tube much like one sweeps across a page of printed text. The output
voltage from the vidicon tube varies with the brightness of the image.
Thus, as the beam travels horizontally across a line (raster) on the
tube face, brightness variations are observed el,ýctronically as a voltage
time waveform. Scanning motion Is from left to right. As the beam isreturned to a new sLarting position, the line of travel is blanked so
that detection Is only in the foward (left to right) direction. The
scan procedure is therefore Interlaced.* The beam initally sweeps every
other line and then returns to pick up those lines neglected during the
Initial sweep. Vertical sampling can also be added. The reader is re-
ferred to Reference 27 for more details.
SSome machines, for example the Imanco Quantinet image analyzer, employ a
slower sequential line scan procedure.
28
r ii:

4.3.2 A silicon vidicon tube which has m lines of total scan and n
light values per line has a total of N = m-n picture elements (pixels).
A standard tube contains 2.5 X 105 pixels (m = 512, n = 480). The total
scan period associated with such a tube is approximately 0.1 sec. A
silicon vidicon tube is used in the present study since it shows excellent
spectral response and sensitivity to wavelengths in the red regime (Refer-
ence 27). In contrast, the human eye shows poorer spectral response in this
regime.
4.3.3 From the previous remarks, it is obvious that grey level infor-
mation Is carried in the voltage signal from vidicon. Grey level Informa-
tion, as applied to electronic object detection, Is used as shown in Figure
9 (Reference 30). The amplitude of the voltage signal from the vidicon is
compared to a preset reference value. When the amplitude of the input signal
rises above that of the reference value, a binary signal is switched to a
logical "1". When the amplitude falls below that of the reference, the binary
signal returns to logical "0". The duration of the binary pulse corre-
sponds to the size of the object along the line of scan.
0 0 , path of scan
2 detected object
,amplitude of
vide signal
-------- .. ..... ..-- 4 reference signal
. _Binary Signal
object diameter - s
Figure 9. Electronic Particle Dectection and Sizing (Reference 30).
29

4.3.4 There are problems associated with electronic object detection.
First, non-spherical objects of similar reflectance can produce different
vidicon signal variations depending upon the position of the object.
Since detection proceeds from a fixed reference, position dependent inten-
sity variations can lead to false detection or no detection at all. This
argument can also be extended to include focus problems when working with
Images showing an extended depth of field. Secondly, optical devices, slbch
as microscopes or camera lenses, suffer from light fall-ofW along the edges
of the field of vie. This aperture effect reduces the dynamic range* of
the Image receiver. Similarly, glare or uneven illumination can also re-
duce such sensitivity.
4.3.5 Several electronic image analyzers have been used in holographic
particle studies (References 17, 18, 20, 23, and 31). The present study
elected to use the Bausch and Lomb Pattern Analysis System. The decision
to use this system was based solely on the basis of its on site availability.
5.0 RESULTS AND DISCUSSION
5.1 Initial Investigations
5.1.1 Holograms of an AF 1951 resolution target were recorded using
the helium neon laser and holocamera discussed in section 3.3. These
holograms were taken to verify holocamera operation and to provide holograms
for evaluating size resolution limits in the proposed automated data re-
trieval system. The holograms showed a size resolution of approximately
lopm when examined visually via a video monitor. Resolution would be worse
for ccmbustion holograms since for those holograms there is a slight
difference in the wavelength between the recording and reconstruction laser.
5.1.2 A second set of holograms was recorded also using the helium
neon laser. The target was a half inch thick acrylic disc which contained
dispersed aluminum oxide particles (a -lOum). These holograms were to be
used to Investigate problems associated with discriminating in and out of
* Dynamic range is defined as the ratio of maximum input signal to the
"minimum detectable signal.
3030

Ifocus particles using an electronic image analyzer. Unfortunately, the
acrylic holding material was too crystaline in its internal structure with
the result that the recorded holograms exhibit severe refraction upon their
reconstruction. No further effort was made to substitute a new holding
material since experiments using holograms of the resolution target showed
detection was inhibited for objects much larger than the particles in the
disc. Since size resolution could not be improved In the data retrieval
system, the problem of out of focus particles was at this point of second-
ary importance to this study.
5.2 Combustion Holograms
5.2.1 A test facility was constructed to record combustion holograms
of the propellants described In section 3.2. Attempts to record these
holograms were not successful due to unexplained fogging of the holographic
plates. A series of experiments were conducted to identify the cause of
the plate fogging.
5.2.2 Flame light from the combustion of the propellant was eliminated
as a possible source of Interference. First, the narrow band filter was inplace during all attempts to record propellant combustion. Second, plate
fogging was also observed when attempting to record holograms of Inert
objects.
5.2.3 The Internal alignment of the pu!sed ruby laser being used
during recording was rechecked and found to be satisfactory. However, It
was suggested that the ruby laser was placed too close to the holocamera
during recording. Since the ruby rods become transparent during lasing,
it was suspected that the intense light from the flash lampb which surround
the rods was being transmitted to the holographic plate. Therefore, the
laser was reversed from the holocamera with the source beam now being trans-
mitted to the camera by mirrors. The optical path length (L) to the camera
was now increased by a factor of ten or more. Since the light Intensity2
from the lamps would decrease as 1/L , any interference from the lamps
would be virtually eliminated. However, plate fogging was still observed.
31

5.2.4 Another possible answer to plate fogging was improper alignment
of the reflecting surfaces in the holocamera. It was observed that Internal
alignment of the holocamera was seasitive to any movement of the camera
housing. Mirror mounts were occasionally discovered to be loose. Unfor-
tunately, since the lens box had to be removed to perform holographic
reconstructions, the camera alignment had to be constantly re-established.
Once the internal alignment had been set, the ratio of object to reference
beam intensity was checked visually and found to be satisfactory. Even
when alignment in the holocamera was carefully preserved, plate fogging
continued.
5.2.5 The holocamera housing was checked for possible leakage from
outside light. The camera was loaded and subjected to room illumination.
Subsequent development of the plate revealed no plate exposure thus veri-
fying the Integrity of the camera housing.
5.2.6 The problem of plate fogging was never resolved though the
facts lead one to suspect that the holoca,,era is still misaligned. Holo-
grams were taken with the holocamera during recording with the helium neon
laser. The ruby laser was repositioned to eliminate flash lamp Interference.
The intensity ratio between the object and reference beams was checked and
verified as satisfactory. The holocamera housing was checked for light
leakage, and none was found. Holographic plates were fogged regardless
of the target being recorded. The alignment of the holocamera was found to
be sensitive to movements of the holocamera housing, such as occurs when
the lens box is removed. Problems with the proposed automated data re-
trieval system obviated any need In this study to continue attempts to
make combustion holograms.
S* 5.3 Positioning
S5.3.1 Accurate positioning is an Integral part of the scene interroga-
tion process proposed In section 4.1. The viewer must be aware of both
•. 3
•32
"1
ii.

his position within the total scene and the area covered by his field of
view. This information is required to prevent redundant paiticl- counts.
Originally, the microscope-camera arrangement was mounted on a movab!e
(X-Y-Z) platform. The platform had a minimum step increment of 4opm alc.ng
each axis. Coordinate information on the platform was relayed to the optr-
ator by a digital display. The holographic plate was held stationary and
the entire exposure illuminated by a fixed lAser source. Subvolumes, as
defined by the imaging system, were indexed and scanned using the moving
platform.
5.3.2 Several problems caused the above positioning arrangement to be
abandoned. First, the step Increments of the platform were much too coarsefor accurate positioning. Second, the platform was subject to drift. Afixed position within the scene volume was diFficult to maintain for a
period sufficient to make an accurate particle count since drift occurredin 40m increments, I.e., the minimum step accuracy, Third, a requirement
for higher magnification was accompanied by an additional requirement ofmore illumination to the field of view. To meet this demand, the illuminating
laser beam was collimated to a smaller diameter during reconstruction. This
action results In a smaller Illuminated region on the exposure. Becausethe laser source remained fixed, lateral plate movement was required to
examine all areas over the exposure. Since beam collimation necessitatesmovement of the plate, it was decided to also fix the location of the cameraand interrogate the scene volume by moving the holographic p'ate along theoptical axis. Plate movement was accomplished using the lens box pedestal
described in Section 3.3. The minimum step increments were reduced to
10um. More accurate manual positioning devices with step increments of1pm are available commercially, but were not obtained for this study.
5.3.3 The imaging system exhibited a size resolution of approximately1Opm. Electronic object detection using the image analyzer was limited toa resolution of about 50m. A shading corrector was purchased to improve
the performance of the image analyzer. Hofever, the unit was defectiveand was not available for this study. Detection could be expected toimprove with shading correction.
33
5.4 Particle Focus
5.4.1 As stated earlier, any Image plane within the reconstructed
volume of the combustion holograms examined in this study shows both in
and out of focus particles. Obviously, out of focus particles must be
screened from detection. Screening requires either a definition of focus
in terms of the voltage output to the electronic image analyzer or manual
judgement.
5.4.2 Consider first the process of manual focus determination. One
observes marked changes in edge contrast In a particle when passing through
the position of optimum focus with the Imaging system. The Initial reaction
to such an observation is to use grey level Information to define focus.
Electronically, the procedure Involves specifying an acceptable voltage rise
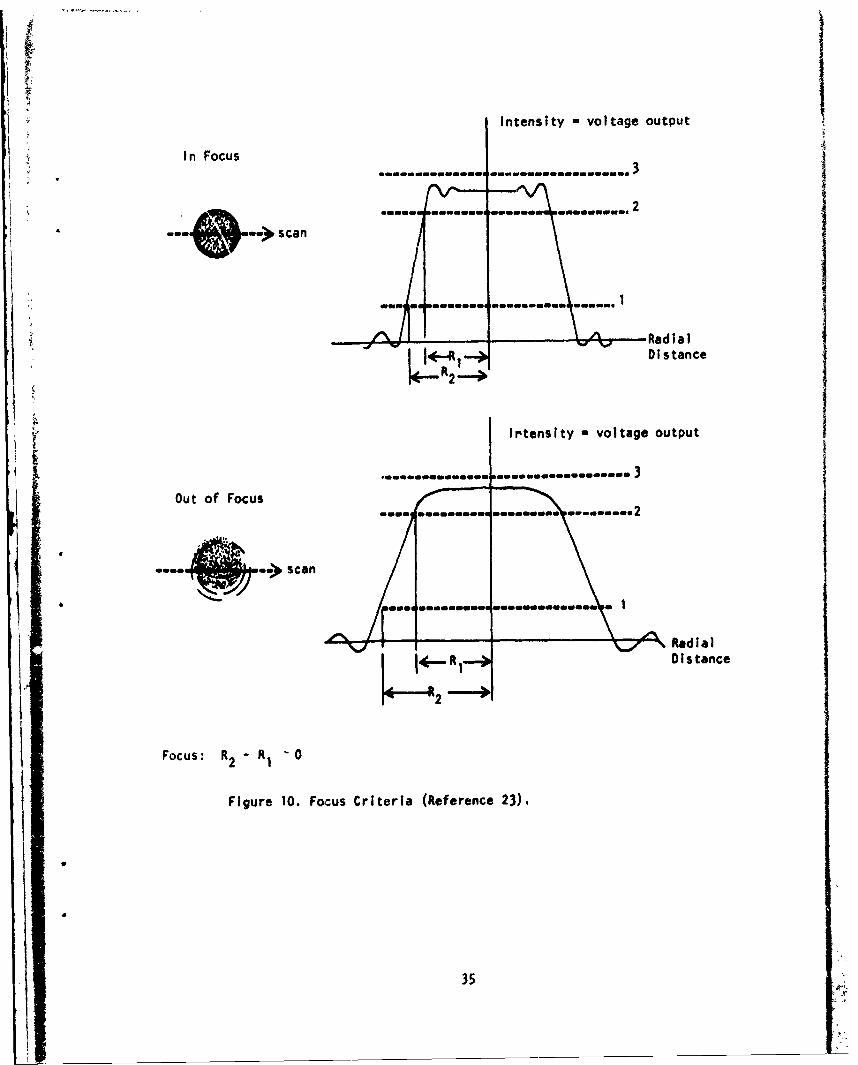
in the output signal from the vidicon. As Illustrated in Figure 10, the
voltage output (Intensity) between two reference levels will steepen as a
particle comes Into focus. Bexon (References 20 and 31)monitors Individual
particle area measurements at two threshold levels to determine particle
focus. Trolinger (Reference 23) employs a similar procedure, but uses
particle measurements of area and perimeter. Both schemes work reasonably
well but require that Information be cataloged on each detected particle.
This requirement demands that Individual particles be assigned spatial
coordinates to facilitate monitoring of stored information. Since the
Bausch and Lomb system cannot Index Individual particles, these focus
algorithms cannot be uied. A different method of focus determination
is required for this study.
5.4.3 An Immediate option was to discriminate particle focus manually
using a light pen. This idea was rejected for several reasons. First,
such a procedure defeats the purpose of applying electronic image analysis,
namely speed in data retrieval. Second, manual focus discrimination for
small particles requires very fine step control (<tOtem). Visual Interpre-
tations are also biased by operator error.
34
Intensity -voltage output
In Focus
.me scan
_ _Radial
Distance
Irtensity - voltage output
Out of Focus
.. •, .e scan
Radial.-R -4 Distance
Focus: R 2 - RI ,0
Figure 10. Fo:us Criteria (Reference 23).
9
35

5.4.4 A second option was to establish the focus criteria using thepreviously mentioned target in the reference plane. Once the focus ismanually established in this plane, all detected particles from this plane
are assumed to be in fQcus. This focus criteria proved to be inadequate
for several reasons. Since speckle noise Interferes with the detectionof smaller objects, a focus criteria established through grey level thres-holding with larger objects does not hold when applied to smaller objectswhere edge contrast diminshes. Changes in illumination from that observed
in the reference plans also compromises object detection and hence focusdetermination.
5.4.5 Thus, as shown by other Investigators (References 17, 18, 20,21, and 23), electronic image analysis of a holographic reconr.truction ofa particle field requires: a) complete spatial indexing of detected fea-
tures, b) computer software to monitor information on detected features,
and c) good holographic reconstructions exhibiting both low optical noise
and good illuminati~n In all Image planes.
6.0 CONCLUSIONS AND RECOMMENDATIONS
6.1 Conclusions
6.1.1 Automated date retrieval from holographic reconstructionsrepresents a key requirement In performing the experiment proposed earlier.A statistical representation of particle size distribution, as sought bythis study, requires a sufficiently large particle count to assure confidencein any proposed correlations. The large amount of data required for suchassurance rules out manual data retrieval. For example, Oriones and Wuerkerreport a work period of eight days to count 568 particles in one small
region of one holographic reconstruction. Obviously, any proposed statist-ical representation of the particle field above a burning solid propellantmust be based on a much larger particle count and verified with severalholograms. Practicality dictates turning to some form of automated particlesizing and counting procedure when dealing with holographic reconstructions
of particle flow fields.
36
36
+bi'

6.1.2 (,ae approach to automated data retrieval is to use an electronic
image analyzer to size and count particles in the holographic reconstruction
of the particle field. Given sufficient object contrast in the reconstructed
scene, an electronic image analyzer will perform adequately. However, as
discussed earlier, holograhic reconstructions of small (<50m) objects show
limited contrast and poor edge definition. Though discernable with the
human eye, such objects are not readily detected by an electronic analyzer.
Electronic Image analysis examines measured intensity and grey levels
against preset reference values to detect and size objects. As expected,
both operations are Inhibited for objects showing poor edge definition
and contrast.
6.1.3 Each image plane in a reconstructed hologram of a particle field
includes objects which are both in and out of focus. The present study
reinforces the findings of other Investigations (References 20, 23, and
1 31), namely that focus discrimination requires a complete spatial indexing
of all detected features. Once features have been indexed, detected objects
can be monitored Individually to determine status with regard to focus.
Only data on focused particles is stored for inclusion in a statistical
analysis. The reported success of focus algorithms is encouraging
(References 17, 23, and 31).
6.1.4 The degree of success in apply~ng electronic image analysis to
holographic reconstructions seems to be based primarily upon (a) the type
of machine (analyzer) being used, (b) the quality of the holographic re-
construction, (c) the properties associated with the recorded event, suchas particle concentration, and (d) the dynamic range associated with the
systom receiving the reconstructed image.
6.2 Reconviendations
6.2.1 The factor which limits the application of electronic image
analysis to examine holographic reconstructions of particle fields is thequality of the recorded image. One seeks methods which will improve image
quality. Image improvement during recording is limited since the process
37

is primarily dependent upon the equipment being used and the skill of the
operator. Image quality can also be influenced by plate development. Care
must be exercised during this procedure. Even with adequate provisionsbeing taken during recording and plate development, one must still contend
with optical noise.
6.2.2 Optical noise is suppressed during the reconstruction process.
One can regard out of focus particles as optical noise since such features
are to be neglected In any particle count. An approach to feature detection
against a noisy background Involves optical (analog) filtering (References
32 and 33). These filters are real-time devices which would Ideally provide
an Image with objects representing a prespecified size range and shape.
Such filters have been used successfully in airborne reconnaissance. Pattern
detection has been used extensively In radar Imaging. As applied to the
present problem, analog filters would be constructed to provide feature
detection In various size range Intervals. In principle, analog filters
could be ised to assist an electronic Image analyzer In Its task of detection.
However, optical filters must still contend with problems such as out of focus
particles.
6.2.3 Another approach to noise suppression is to apply computer image
processing. A thorough discussion of Image processing can be found In
the book by Pratt (Reference 26). Basically, once a picture frame (i.e.,Image plane) Is digitized, It can be altered using computer software to
manipulate grey level Information, For example, Image enhancement has
been used In sizing particles from electron microscope Images (Reference 34).
Computwenhancement has proven effective In Improving Image qualityoriginally lost by high magnification or photographic limitations
(Referenues 35 through 38). More recently, computer methods have been
applied to Improve the Image quality of holographic reconstructions of
spray droplet fields (Reference 24). The strength of Image processing
lies in its flexibility in selectively improving Image quality. The
obvious weakness of such an approach Is that computer Image processing takesconsiderable time and data manipulation to implement as compared to elec-
tronic Image analysis. One desires the best of both worlds, namely the
speed of electronic image analysis and the versatility provided by
4omputer software.
38

6.2.4 The marriage of both methods is already a reality (References
39 and 40). The technology in image analysis is advancing far too rapidly
to capture and summarize the area in this report. Urdoubtedly, many of
the obstacles encountered in this study with renards to data retrieval wi.,t
Sbe overcome as new hardware is developed. The reader should therefore be
cautioned against premature Judgement against P.lectronic Image analysis of.
holocyrams. Naturally, there exist unique prabk-ms to be bolved, yet, the
investigations which seek solutions to thzse problems are only just beginning.
REFERENCES
1. Dobbins, R.A. and Temkin, S., "Measurement of Particulate Acoustic
Attenuation," AIMJ., V.2, No. 6, Jone 1964.
2. Temkin, S. and Dobbin, R.A., "Attenuation arid Dispersion ,)f Sound byPartlciseate Relaxation Processes," J. Acoust. Soc. Amer., V. 40, No. 2,February 1966.
3. Levine, J.N. and Culick, F.E.C., "Nonlinear Analysis of Solid RocketCombustion Instability, Vol. 1: Analysis and Results," AFRPL-TR-74-45,July 1974.
4. Lovine, R.L., "Standardized Stability Prediction Method for SolidRocket Motors, Vol. 1," AFRPL-TR-76-32, May 1976.
5. Coats, D.E., et. al., "A Computer Program for the Prediction of SolidPropellant Rocket Motor Performance, Vol. 1," AFRPL-TR-75-36, July 1975.
6. Soo, S.L., Fluid Dynamics of Multiphase Systems, Blaisdell Publishing Co., 1967.
7. Riyad, R.I. and Clayton, F.C., Particle Size: Measurement, Interpretation,and Application, John Wiley and Sons, Inc., 13
8. Hesketh, H.E., Fine Particles In Gaseous Media, Ann Arbor SciencePublishiers, Inc., 1977.
9. Buchava, P., et. al., The Accuracy of Flow Measurements by Laser DopplerMethods. Procecedtngs of the LDA Symposium Copenphagen, HemispherePublishing Corporation, June 1976.
10. "Capabilitiis In Laser Instrumentation," SDL Report No. 75-6019, SpectronDevelopment Laboratories, Inc., October 1975.
I). Durst, F. and Ellasson, B., "Properties of Laser Doppler Signals andtheir Exploitation for Particle Size Measurements," Proceedings of theLDA Symposium Copenhagen, June 1976.
12. Yu, F.T.S., Introduction to Dif;raction, Information Processing, andHolography, MIT Press, 1973.
39

13. Smith, H.M., Principles of Holography, 2nd Edition, Wiley Intersciencet975.
14. Ostrovsky, Y.1., Holography and Its Applications, MIR Publishers, Moscow,1977.
15. Briones, R.A., and Wuerker, R.F., "Application of Holography to theCombustion Characterization of Solid Rocket Propellants," AFRPL-TR-77-90,April 1978.
16. Krile, T.F., et. al., "Holographic Representations of Space-VariantSystems Using Phase-Coded Reference Beams," Applied Optics, V. 16,No. 12, December 1977.
17. 3lz, R.A., and Menzel, R.W., "Particle Field Holography at ArnoldEngineering Development Cente.," Optical Engineering, V. 1, No. 3,9ay-June 1979.
18. Witherow, W.K., "A High Resolution Holographic Particle Sizing System,"Optical Engineering, V. I, No. 3, May-June 1979.
19. Miller, R.R., e~t. al., "Control of .qolids, Distribution In ItTPB Propellants,"AFRPL-TR- 78-14, *Wp--"•' 1978.
20. Bexon, R., "agnification In Aerosol Sizing by Holography," J.. Phys. E.Scd. Instrum., Vol. 6, 1973.
21. Ih, C.S., and Baxter, L.A., "Improved Random Spatial Phase Modulationsfor Speckle Elimination," Applied Optics, V. 17, No. 9, Hay 1978.
22. Cox, M.E., and Vahala, K.J., "Image Plume Holograms for HolographicMicrotcopy," Applied Optics, V. 17, No. 9, May 1978.
23. Trollnger, J.D., "An Examination of Automatic Data Reduction Methods forParticle Field Holograms," SOL Report No. 77-6233, Spectron DevelopmentLaboratories, Inc., December 1977.
24. Feinstein, S.P., and Girard, M.A., "Feasibility of Automated DropsizeDistributions from Holographic Data Using Digital Image ProcessingTechniques," 17th Aerospace Sciences Meeting, Paper No. 79-0297,i January 1979.
25. Computer Eye Handbook, Spatial Data Systems, Inc., Second Edition, 1974.
26. Pratt, W.K., Dii.tal Image Processing, Wiley Interscionce, 1978.
27. Eye Com Picture Digitizer and Display, Spatial Data System, Inc., FirstEdition, 1977.
23. Dyall, W.T., "Televiewers: What Do You Mean by Iligh Resolution,"Electro-Optical Systems Deseg, March 1978.
29. Sparks, J.E., "Television that Nobody Watches," Machine Design, February10, 1972.
30. Shear, R., "Effects of Shading in Images," Electro-Optical System Design,February 1978.
*0

31. Bexon, R., Bishop, G.D., and Gibbs, J., "Aerosol Sizing by HolographyUsing the Quantimet," IMANCO Report on Equipment and Applications, No. 3.
32. Casasent, D., "Optical Data Processing for Engineers, Part 1: Funda-mentals, Techniques and System Architectures," Electro-Optical SystemsDesign, February 1978.
33. Casasent, D., "Optical Data Processing for Engineers, Part 2: RealTime Devices," Electro-Optical Systems Design, April 1978.
34. Hall, E.L., Varsi, G., Thompson, W.B. and Gauldin, R., "Computer
Measurement of Particle Sizes in Electron Microscope Images," IEEETransactions on Systems, Man, and Cybernetics, February 1976.
35. Naderl, F., and Sawchuk, A.A., "Detection of Low Contrast Images inFilm-Grain Noise," Applied Optics, V. 17, No. 18, September 1978.
36. Cannare, T.M., Trussel, H.J., and Hunt, B.R., "Comparison of ImageRestoration Methods," Applied Optics, V. 17, No. 21, November 1978.
37. Matuska, W., et. al., "Enhancement of Solar Cornna and Comet Details,"Optical Engineering, V. 17, No. 6, November-December 1978.
38. Mengers, P., "Low Contrast Imaging," Electro-Optical Systems Design,October 1978.
39. Toner, M.C., Dix, M.J., and Sawistowski, H., "Automatic ImAge Analyser,"Microprocessors, V. 2, No. 2, April 1978.
40. Toner, M.C., Dix, M.J,, and Sawistowski, H., "A Television-MicroprocessorSystem for High Speed Image Analysis," J. Phys. E: Instrum., V. 11, 1978.
41

![PARTICLE SIZE, PARTICLE SIZE DISTRIBUTION & COMPACTION AND COMPRESSION [PREFORMULATION STUDY] (1-32)](https://img.dokumen.tips/doc/110x75/56649e855503460f94b87eac/particle-size-particle-size-distribution-compaction-and-compression-preformulation.jpg)


![Experimental Investigation of Particle Size Distribution ... · PDF fileExperimental Investigation of Particle Size Distribution in Commercial Tahina ... [7] proposed a plan ... C](https://img.dokumen.tips/doc/110x75/5aa3bfac7f8b9aa0108efc28/experimental-investigation-of-particle-size-distribution-investigation-of-particle.jpg)