Embed Size (px)
Citation preview

i
An investigation of novel genetic tools
for the manipulation of CHO cell
phenotypes during recombinant protein
production
A thesis submitted for the degree of Ph.D.
Dublin City University
by
Alan Griffith, B.Sc (Biotechnology)
The research described in this thesis was performed under the supervision of
Dr. Niall Barron and Prof. Martin Clynes.
National Institute for Cellular Biotechnology
Dublin City University
2015

ii
This thesis is dedicated to my wonderful family and friends - especially
Angela, Gordon, Shane, Lena and Eddie.

iii
I hereby certify that this material, which I now submit for assessment on the programme of
study leading to the award of Ph.D is entirely my own work, and that I have exercised the
reasonable care to ensure that the work is original, and does not to the best of my
knowledge breach any law of copyright, and has not been taken from the work of others
save and to the extent that such work has been cited and acknowledged within the text of
my work.
Signed: ________________________ (Candidate) ID no: 54343697
Date: ________________________

iv
Acknowledgements
It’s a great pleasure for me to thank the following people that have made my experience in
the NICB an unforgettable one. Their help and support during my 4+ years coupled with
their advice and ideas enabled me to obtain my Ph.D.
Mostly I’d like to thank my wonderful girlfriend Laura and parents Angela and Gordon,
and of course Shane-dog. The understanding from Laura on weekends especially was
nothing short of a miracle and help from my parents near the end when times were tough.
Same can be said of the boys in Dunluce, C/W and Braintrust.
I cannot express how much thanks and praise I can give to my supervisor Dr. Niall Barron,
who gave me help and mentored me like no other boss could have done. The only problem
being now is that, I will want all my future bosses to be as kind, understanding and as
intelligent as him so maybe the standard is set too high. Also thanks for guiding me through
the ups and downs over the duration of the project and keeping me focused and driven and
of course thanks for the opportunity.
And of course special mention to Professor Martin Clynes, who somehow manages to
oversee everyone and everything in and outside the NICB building. Thanks for making
time to sit down and discuss career plans, paper ideas and discuss other topics like sport.
Never once did I feel under pressure regarding the environment and this made life so much
easier. Thank you Martin for putting your faith in me from the beginning. It really hits
home now that its been such a long time since I emailed you and asked for 6 weeks work
experience.
Thanks to the Carol, Geraldine and Yvonne on the reception desk for dealing with
deliveries and other behind the scenes tasks, and also Gillian for running the prep room like
clockwork and making life easier in general. To everyone in the NICB, I think we all have
helped each other at one time or another so I won’t mention names.
Two big mentions must go to Dr. Olga Piskereva who taught me a lot at the very start of
my career in the NICB and many hints and tricks in a molecular sense and I have taken
them with me. Furthermore, thanks to Dr. Nga Lao who thought me so much during her
short stays, about science and her home in Vietnam, no problem to huge for these two
ladies.
Finally thanks to my lunch crew, Paul, Shane, Martin, Mark the baker, Gemma, Noelia,
Andrew, Edel, Deirdre, all the newbie’s (Chemistry girls Creina, Zara and Andrea - we had
some good laughs in the lab) and of course the enigma that is Mary White over in Invent.

v
Table of Contents:
Abstract 1
Abbreviations 3
Section 1.0: Introduction 7
1.1: Introduction to Biotechnology in Bioprocessing 8
1.2: Chinese Hamster Ovary Cells 9
1.3: Media Optimistation 10
1.4: Strategies in Mammalian Cell Engineering 12
1.4.1: Stable recombinant clone generation in CHO (rCHO) 12
1.4.2: Overexpression engineering 14
1.4.3: Site-specific techniques 16
1.4.3.1: Site-specific nucleases for genome editing 16
1.4.3.2: Cre/LoxP system 19
1.4.4: RNA interference engineering 20
1.4.5: Cis-regulatory elements 23
1.4.5.1: Scaffold/matrix attachment regions (S/MAR) 23
1.4.5.2: Ubiquitous Chromatin Opening Elements 24
1.4.5.3: IRES elements 25
1.4.5.4: Other engineering strategies 26
1.5: The CHO Genome Project 26
1.6: Gene Promoters 28
1.6.1: Types of Promoters 30
1.6.1.1: Constitutive promoters 30
1.6.1.2: Tissue-specific or development-stage-specific promoters 31
1.6.1.3: Inducible promoters 32
1.6.1.4: Synthetic promoters 36
1.7: Promoter engineering 38
1.8: Exogenous Inducer Molecules (IMs) and building a promoter catalogue 39
1.9: Viral versus Endogenous CHO promoters in bioprocessing 41
1.9.1: Endogenous promoters responsive to temperature inducibility 42
1.9.2: Cirbp – The classical temperature inducible gene 42
1.10: Promoter Analysis – Bioinformatics 44
1.10.1: Identifying and locating transcriptional elements 47
1.11: Engineering of important cellular pathways 50
1.11.1: Engineering of cellular proliferation and cell cycle arrest 50
1.11.2: Programmed cell death (PCD) engineering 53
1.11.3: Effect of low Temperature on culture performance 57
1.12: MicroRNA roles in gene regulation and engineering potential 60
1.12.1: Background and scope 60
1.12.2: The miR-17-92 cluster 64
1.13: XIAP is an important gene in apoptosis regulation 65
1.13.1: Background 65
1.13.2: Structure and Function 66

vi
1.14: Identifying miRNAs that regulate bioprocess-relevant phenotypes 67
1.14.1: Methods for identifying mRNA:miRNA interactions 68
1.14.2: MiRNA Pulldown using biotinylated mRNA Capture Technique 72
1.15: Aims of Thesis 74
Section 2.0: Materials and Methods 76
2.1: Ultra Pure Water 77
2.2: Sterilisation 77
2.3: Glassware 77
2.4: Preparation of cell media 77
2.5: Routine Management of cells 78
2.5.1: Precaution measures 78
2.5.2 Sub-culturing of cell lines 78
2.5.2.1 Anchorage dependant cells 78
2.5.2.2 Suspension Cells 79
2.5.3: Cell counting 79
2.5.4: Cryopreservation of cells/Cell freezing 80
2.5.5: Reviving cell lines from cryopreservation/Cell thawing 80
2.5.6: Mycoplasma testing 80
2.6: DNA manipulation and other techniques 81
2.6.1: Designing and Ordering Primers 81
2.6.2: Polymerase Chain Reaction (PCR) 82
2.6.3: Analysis of DNA samples using agarose gel electrophoresis 85
2.6.4: Cloning of DNA: Endonuclease restriction digestion of DNA 85
2.6.4.1: Alkaline Phosphatase (AP) treatment 86
2.6.5: Cloning of DNA: Ligations 87
2.6.6: Transformation into bacterial cells 88
2.6.7: Small scale preparation of plasmid DNA (Miniprep) 89
2.6.8: Large scale preparation of plasmid DNA (Midiprep) 89
2.6.9: Sequencing and Verification 90
2.6.10: Genomic DNA Extraction 90
2.6.11: RNA Extraction 91
2.6.12: Determination of RNA purity with Bioanalyser 92
2.6.13: DNase treatment 93
2.6.14: Reverse Transcription PCR and cDNA generation 94
2.6.15: Real-Time Quantitative PCR (RT-qPCR) 95
2.6.16: Transfection of Mammalian Cells 97
2.7: SEAP assays 98
2.8: Flow cytometry and cell imaging using Guava® Easycyte systems 99
2.9: PCR based miRNA Taqman Low Density Arrays (TLDA) 100
2.9.1: Reverse Transcription 101
2.9.2: PCR using 2x TaqMan® Master mix 102
2.9.3: TLDA data analysis 104
2.10: Functional analysis (FA) of selected gene and miRNA targets 104
2.11: Bradford Assay and Protein Quantification 105
2.12: Western Blotting
106

vii
2.12.1: Western sample preparation 106
2.12.2: Preparation of gel 106
2.12.3: Transfer Preparation 107
2.12.4: Transfer 107
2.12.5: Blocking / Antibodies 107
2.12.6: Antibody detection 108
2.13: Dual-Luciferase Reporter Assay (DLR) 108
2.14: Apoptosis/Nexin® Assay 110
2.14.1: Spent media and sodium butyrate (NaBu) treatment 112
2.15: EPO Assay and Quantification 113
2.16: p27 Assay and Quantification 114
2.17: Other Essential Techniques of Cell Culture 114
2.17.1: Single Cell Cloning via Serial Dilution 114
2.17.2: Cell Sorting / FACS 116
2.18: IgG ELISA Quantitation Set 117
2.19: MicroRNA-mRNA moiety capture using biotinylated oligos 118
2.19.1: Biotinylated DNA Oligo Design 118
2.19.2: miR-Capture full protocol 119
2.20: Bioinformatics and Regulatory Web-based software 122
Section 3.0: Results – Project 1 124
3.1: Identification, Isolation and Verification of CHO gene Promoters 125
3.1.1: Introduction 125
3.1.2: Identification of Temperature-sensitive genes in ‘Omics dataset 127
3.1.2.1: Choosing target genes for study 127
3.1.2.2: Identification of constitutive genes 129
3.1.3: Target gene summary 133
3.1.4: Real Time-qPCR validation of target genes 135
3.1.5: Investigation of Promoter activity versus Transcript stability 144
3.1.6: In silico identification of promoter sequences 150
3.1.7: Workflow of Isolation and Cloning of Gene Promoters 151
3.1.8: Primer Design 153
3.1.9: Promoter amplification and isolation 155
3.1.10: Cloning into Expression Vectors Design/Manipulation 157
3.1.11: Promoter fragments - Initial expression screen 162
3.2: Driving reporter-gene expression in a temperature-dependant manner 165
3.2.1: Introduction 166
3.2.3: Luciferase reporter expression results 177
3.2.4: CMV and SV40: Poor viral controls 181
3.2.5: Driving expression of a bioprocess product (EPO) 186
3.2.6: Driving expression of an cellular engineering transgene (p27) 190
3.2.6.1: Temp responsive p27 expression in ‘attached’ culture 191
3.2.6.2: Temp responsive p27 expression in ‘suspension’ culture 198
3.2.6.3: p27 effect on SEAP activity in CHO-K1-SEAP 205
3.2.7: Promoter – Ranking to GOI 208

viii
3.3: Bioinformatics / In-silico analysis of promoter sequences 210
3.3.1: Introduction 210
3.3.2: Promoter mapping 210
3.3.2.1: Cross-species alignments and TFBS location 210
3.3.2.2: Genomatix™ analysis 215
3.3.2.3: ‘Cpgplot’ results 218
3.4: Co-expression Pattern Analysis 220
3.5: Viral versus Endogenous stability 225
3.5.1: GFP-stability - Mixed population results 225
3.5.2: GFP-stability - Single cell population results 227
Section 4.0: Results – Project 2 231
4.1: XIAP as a novel target for engineering in CHO 231
4.1.1: IAPs and their origin 231
4.1.2: XIAP in Glioblastoma 231
4.1.3: XIAP – from human to CHO engineering 232
4.1.3.1: XIAP sequence comparison – Human and CHO 233
4.1.4: XIAP expression in various cell lines 236
4.1.5: Single cell cloning/Isolation of XIAP high producers 238
4.2: Functional Validation – Apoptosis 239
4.2.1: Preliminary testing –behaviour in apoptosis-inducing conditions 239
4.2.2: Growth and viability in adherent culture 245
4.2.3: Growth and viability in suspension culture 250
4.2.3.1: XIAP clonal variation – Growth in suspension culture 254
4.2.4: Fed-batch runs – Growth and viability in suspension culture 258
4.2.5: Apoptosis - Nexin® Assay on adherent and suspension culture 261
4.2.6: Functional Validation using RNAi - XIAP effect on growth 264
4.2.7: XIAP clone 12 productivity results 269
4.2.7.1: SEAP productivity 269
4.2.7.2: EPO productivity 271
4.2.7.2.1: Densitometry – EPO 272
4.2.7.3: IgG productivity 273
4.3: Identification and Validation of miRNAs using a novel Capture technique 277
4.3.1: XIAP is a direct and functional target of miRNAs 277
4.3.2: MiR-Capture as a tool to identify mRNA:miRNA interactions 281
4.3.3: Designing a capture oligo-hook for human and CHO XIAP mRNAs 283
4.3.4: Validation of XIAP mRNA:miRNA specific isolation 286
4.3.5: TLDA analysis – miRNA expression profiling on captured elute 290
4.3.6: Functional effects of XIAP mRNA-specific miRNAs 298
4.3.6.1: XIAP 3’UTR targeting by miRNA- in silico 304
4.3.6.2: XIAP 3’UTR targeting by miRNA- in vivo 305

ix
Section 5.0: Discussion, Conclusions and Future work 308
5.1: Project 1 Discussion – Endogenous promoters as gene engineering tools 309
5.1.1: Project overview 309
5.1.2: Promoter isolation 311
5.1.3: Screening target genes and transcript validation 312
5.1.3.1: Initial promoter fragment screen 312
5.1.3.2: RT-qPCR analysis and half-life determination 313
5.1.4: Prioritising useful promoters 315
5.2: Reporter-gene expression 318
5.2.1: GFP and Luciferase 318
5.2.2: Driving inducible exp of a ‘product gene’ using temperature 312
5.2.3: Driving inducible exp of an ‘engineering gene’ using temperature 323
5.3: In silico promoter analysis 325
5.4: The most appropriate promoter for each GOI - Promoter specificity 329
5.5: Viral versus endogenous stability in extended culture 331
5.6: Comparisons to analogous promoter studies 333
5.7: Inducible mechanisms for improving bioprocess behaviour 337
5.8: Conclusions – Project 1 339
5.9: Future recommendations – Project 1 341
5.9.1: Promoters from other CHO cell types 341
5.9.2: Clone longer promoter fragments 341
5.9.3: Create stable CHO lines to test activity in fed-batch culture 341
5.9.4: The degree of inducibility of promoters over various temperatures 342
5.9.5: Viral controls in temperature shift experiments 342
5.9.6: Transcription factors further work 343
Section 6.0: Project 2 discussion 345
6.1: XIAP – potential as an anti-apoptotic bioprocess target in CHO cells 346
6.2: Stable overexpression of XIAP in CHO exhibit beneficial phenotypes 346
6.3: XIAP overexpression is directly linked to anti-apoptotic behaviour in CHO 349
6.4: Targeting XIAP with siRNA reverses the beneficial phenotypes 351
6.5: Effect of XIAP overexpression on productivity 353
6.6: Targeting XIAP using ncRNAs as a route to CHO cell engineering 357
6.7: MiR-Capture - to identify miRNAs targeting predetermined mRNAs 358
6.8: Functional validation of specific miRNAs from miR-Capture 367
6.9: Conclusions – Project 2 370
6.10: Project 2 - Future work 372
6.10.1: Cell-adhesion analysis 372
6.10.2: Clonal variation in XIAP clones 372
6.10.3: Analysis of metabolite utilisation and waste accumulation 373
6.10.5: MiR-Capture improvements 373
6.10.6: Are other genes targeted by the XIAP miR-Capture miRNAs 374
6.10.7: XIAP 3’UTR reporter assay improvements 374
6.10.8: Using promoters to control XIAP transgene expression 375

x
Section 7.0: Bibliography & Appendices 376
7.1: Bibliography 376
7.2: Project 1 –Appendix 415
7.3: Project 2- Appendix 422

1
Abstract
Chinese Hamster Ovary (CHO) cells are the most common mammalian cell line used
around the world and are considered the “workhorse” for production of recombinant
proteins in the pharmaceutical industry.
Efforts have been made to optimise the production process through advancements in media
formulation and improving process control strategies like bioreactor design, fed-batch
feeding and temperature shift approaches, increasing batch titres from 50 mg/L to 5-10 g/L.
However, it is believed that there is still room for improvement in the advent of media and
process optimisation reaching a plateau. An alternative route to overcome this plateau is
through engineering of the CHO host cells themselves.
The overall aim of this PhD project was to identify and exploit endogenous CHO promoters
to enhance heterologous protein expression.
Having obtained ~ 30 CHO putative promoter sequences of varying length from 9 target
genes from PCR, we screened and cloned 4 priority CHO promoter fragments into a variety
of reporter vectors (GFP, Luciferase, p27 and EPO) to test their strength and utility. We
have identified 3 novel temperature responsive promoters fragments from Cirbp SSu72 and
Mdm2 genes and one constitutive promoter from a miRNA cluster [miR-17-92].
These promoters can permit moderate to high expression of a desired protein similarly to
viral commercial ones such as cytomegalovirus (CMV) and simian virus (SV40) as well as
boost expression levels of reporter proteins upon a temperature shift to 31oC. As a result,
these novel tools are particularly advantageous in a bioprocess where reduced temperature
is used already to increase protein production. In addition, we reported a ~94% decrease in
clonal GFP stability of a CMV viral promoter versus our endogenous promoters over a 3
month timecourse experiment proving that viral promoters cannot sustain prolonged
activity in culture like our novel endogenous promoter sequences.
We have also shown that CHO clones overexpressing human XIAP exhibited 2/3-fold
increased resistance to apoptosis and survival in extended culture settings compared to
control cells. A secondary aim was to identify potential interacting miRNAs by utilising a
novel pulldown method (miR-Capture), to isolate miRNAs targeting the anti-apoptotic
XIAP mRNA in two different cell types, using a biotinylated anti-sense oligonucleotide
capture affinity technique.
Thus, identifying miRNAs which may impact on favourable phenotypes such as anti-
apoptosis and increased growth rate may provide a means of improving CHO cell lines
used for biopharmaceutical production. From the miR-Capture, there were 26 miRNAs
detected in the human lysates and 14 in the CHO lysates. Four miRNAs (miR-124, miR-
526b*, miR-760 and miR-877) were shown to be common from parallel CHO and human
miR-Capture’s, using oligos designed against XIAP. Functional validation provided further
evidence that miR-124 targets XIAP mRNA in CHO and human cells and may be a suitable
target for miRNA engineering in CHO.

2
In conclusion, we demonstrate the potential utility of novel endogenous, temperature
sensitive promoters and the overexpression of XIAP in conjunction with existing
production processes to ameliorate bioprocess performance further.

3
Abbreviations
μ - microlitre or growth parameter
3’/5’ - 3 Prime/5 Prime denoting directionality of nucleic acid strands
3D - Three dimensional
% - percentage
AM - anti-Mir
ATCC - American Tissue Culture Collection
AKT - Protein Kinase B (also known as PKB)
BLAST - Basic Local Alignment Search Tool
BSA - Bovine Serum Albumin
cDNA - Complementary DNA
ChIP - Chromatin Immunoprecipitation
CHO - Chinese Hamster Ovary
CMV - Cytomegalovirus
CRISPR - Clustered regularly-interspaced short palindromic repeats
(k)Da - (kilo) Daltons
DIANA - DNA intelligent Analysis
DMEM - Dulbecco’s Minimal Essential Medium
DMSO - Dimethyl Sulfoxide
DNase - Deoxyribronuclease
DNA - Deoxyribonucleic acid
dNTP - Deoxynucleotide triphosphate (N= A, C, T, G or U)
Doc - Docetaxel (Taxotere®)
ECL - Enhanced chemoluminescence
EDTA - Ethylene diamine tetracetic acid

4
ER - Endoplasmic reticulum
FBS - Fetal Bovine Serum
FC - Fold Change
FCS - Fetal Calf Serum
GAPDH - Glyceraldehyde-6-phosphate dehydrogenase
GBM - Glioblastoma
GFP - Green Florescent Protein
hGH - human Growth Hormone
Hrs - Hours
IMs - Inducer molecules
IMS - Industrial Methylated Spirits
IPTG - Isopropyl β-D-1-thiogalactopyranoside
IVCC - Integral of viable cell concentration
LB - Luria Broth
LTR - Long Tandem Repeat
MCap - Molecular cut and paste mechanism
Min(s) - Minute(s)
miRNA - MicroRNA
MOPS - 3-(N-morpholino) propanesulfonic acid
mRNA - Messenger RNA
M.W - Molecular weight
NaBu - Sodium Butyrate
NCTCC - National Cell & Tissue Culture
NEAA - Non-Essential Amino Acids
NEB - New England Biolabs
Neo - Neomycin antibiotic

5
NHA - Normal Human Astrocytes
nt - Nucleotides
OD - Optical Density
Oligos - Oligonucleotides
p53 - Protein 53 (tumor suppressor protein)
PBS - Phosphate Buffered Saline
PCD - Programmed cell death
PCR - Polymerase Chain Reaction
pEGFP - Plasmid containing enhanced Green Florescent Protein reporter gene
pGL3 - Plasmid containing Luciferase reporter gene
PLACE - Plant cis-acting regulatory DNA elements
PM (-) - Pre-Mir (neg control)
PS - Phosphatidylserine
p.s.i - Pressure per square inch (Ψ)
PVDF - polyvinylidene difluoride membranes
Qp - Specific Protein productivity
rCHO - Recombinant CHO
RNA - Ribonucleic Acid
RNase - Ribonuclease
Rpm - Revolutions per minute
RSA - Rous sarcoma Virus
RSAT - Regulatory Sequence Analysis Tools
RT - Room Temperature
RT-PCR - Reverse Transcriptase-PCR
SCR - Scrambled control
Sec(s) - second(s)

6
SFM - Serum Free Medium
siRNA - small interfering RNA
sv40 - Simian virus 40
TBS - Tris buffered saline
TBS-T - Tris buffered saline –Tween20
TE - Tris-EDTA
Tet on/off - Tetracycline-Controlled on/off system
TF(s) - Transcription Factor (s)
TLDA - TaqMan Low Density Arrays
Tm - Melting temperature of Primers
TSS - Transcription/Translation Start Site
UPR - Unfolded Protein Response
UHP - Ultra high purity water
UTR - Untranslated Region
Wgs - Whole genome shotgun
WHO - World Health Organisation
w/v - Weight per volume
XIAP - X-linked inhibitor of Apoptosis gene

7
Section 1.0
Introduction

8
1.1: Introduction to Biotechnology in Bioprocessing
The birth of recombinant DNA technology in 1973 by Cohen and Boyer made possible the
emergence of Biotechnology and its continuation into mainstream business (Cohen et al.
1973). Biotechnology bridged the gap between drug development and manufacturing of
recombinant proteins as new therapeutic medicines by allowing the application of DNA
cloning methods for commercial purposes.
Over the last 4 decades, we have witnessed a change in genetic engineering from simple
artificial plasmid constructs in microorganisms to more elaborate mammalian recombinant
protein technology. Now recombinant protein therapeutics which are primarily produced in
mammalian cells, constitute a $108 billion global market (Wuest, Harcum and Lee 2012).
More recently the number of recombinant technologies has increased globally with Chinese
Hamster ovary (CHO) mammalian host cells becoming the leading mammalian platform in
the production of biopharmaceuticals. They account for over 60% or entire global
production (Hernandez Bort et al. 2012) (Fussenegger et al. 1998) (Kim and Lee 2012).
In the last few years we have seen the yield and titres of batch production reach record
highs, going from milligrams to grams per litre (Zhou et al. 1997) (Lim et al. 2010). This
was due to many factors such as; bioreactor design and improved materials, optimisation of
media, improved expression systems and selection of high-producing CHO clones. As a
result, some believe the maximum output of these little protein super factories has been
reached whereby the cells can’t actually make anymore due to the limits of the cellular
machinery.
The next generation of improvements in bioprocessing may come from genetic engineering
approaches such as; vector engineering, the use of endogenous promoters and anti-
apoptotic regulation (topics which will be covered in the succeeding introduction sections),
as tools with the overall aim to allow more efficient protein production by overcoming this
capacity bottleneck (Wurm 2004).
Improving productivity may not be the only goal but infact, recent years have shown that a
level of control is thought to be just as if not more desirable than maximum protein yield.
This control is often dependant on the bioprocess in question, or the nature of a particular
9
protein (ex: protein product versus an engineering target or toxic versus non-toxic product)
and represents another avenue to use engineering tools.
The focus of the work described in this thesis is about identifying and implementing some
novel genetic tools in the form of promoters to gain greater control over CHO cell
behaviour and performance within a bioreactor.
1.2: Chinese Hamster Ovary Cells
Chinese Hamster Ovary (CHO) cells were derived from the ovaries of Hamsters as the
name suggests. In 1957, Theodore T. Puck obtained a female Chinese Hamster from Dr.
George Yerganian's laboratory at the Boston Cancer Research Foundation and used it to
derive the original Chinese Hamster ovary cell line.
Since then, CHO cells have become the workhorse cell-line of choice for recombinant
protein production because of their rapid growth and high protein production capacity
necessary for large scale biopharma production increasing production of the drug of interest
(Jayapal et al. 2007) (Mead et al. 2009).
A variety of cellular expression systems have been used over the years including; bacteria,
yeast, insect and plant cells which can produce valuable recombinant proteins. The majority
of new protein products are made in mammalian cells, in fact among the 58 biopharma
molecules approved from 2006 to 2010, 32 are produced by mammalian systems (Walsh
2010). This is due in part to the fact that only mammalian cells can facilitate post-
translational modifications (PTMs) such as folding and glycosylation on the protein of
interest, to be fully biologically active in other mammalian cells.
Take the three major therapeutic proteins on the market today, erythropoietin (EPO), tissue-
type plasminogen activator (t-Pa) and β-interferon. All require appropriate glycosylation
made possible by the PTMs offered by CHO cells (Kim and Lee 2012).
Furthermore, the first approval of t-Pa in 1986, paved the way for mammalian cells to be
the emerging workhorses in an expanding field, with CHO cells being the most valuable
due to the following characteristics;

10
Easy to handle and robust in culture
Perform PTMs for full protein functionality
Relatively safe – (as they do not propagate most human pathogenic viruses)
Fast growing cell line (fast turnaround times)
Accept foreign/exogenous DNA readily when transfected
They can be grown and adapted in a multitude of medium types
A broad range of commercial sub clones exist
They can grow in suspension or adherent/attached cultures
As CHO cells gained popularity for being safe hosts, FDA approval became more
widespread, offering a big advantage to multinational pharmaceutical companies and of
course the patients. In addition, CHO cells did not suffer from the disadvantage of a low
specific productivity (Qp) like other mammalian expressers at the time, as it could be
overcome with gene amplification systems such as dihydrofolate reductase (DHFR) and
glutamine synthetase (GS) (Lim et al. 2010).
1.3: Media Optimistation
Before any genetic alterations were even conceived, media formulation and composition
was of utmost importance in the maintenance and growth of mammalian cells. It was
important because they are a more complex biological entity than bacteria and fungi and
thus survival is harder outside a favourable environment. Once a basal growth medium is
established additional amino acids, lipids, salts, vitamins growth factors etc can be added to
satisfy all the nutritional needs of the cells in culture.
Cellular productivity is proportional to biomass and cell viability/health of producer cells
(Kumar et al. 2007). Each cell line will have a defined growth medium in which it performs
best and in the case of CHO cells over the last 20 years, tweaking the media composition
often through trial and error, has yielded excellent titer results up to a g/L scale (Jayapal et
al. 2007). However, culture media should not increase the osmolality or encourage
generation of excess metabolic waste products as these affect both quantity and quality of
the protein product (Castro et al. 1992).

11
Three main categories for existing media formulation are; (1) Serum supplemented media,
(2) Serum-free media and (3) Protein-free media. Ideally nutrient formulations totally free
of exogenous proteins containing no materials of animal origin to be used for high density
cell culture and biological production are the holy grail in media optimisation (Jayme
1999).
(1) Serum is an ill-defined non cellular portion of blood that remains after removal of blood
cells and clotting proteins and is one of the most important basic requirements for
mammalian cells during ‘in vitro’ culture. Serum can protect the cells from shear-stress and
has been shown to delay the onset of apoptosis and increase viability in culture. Zanghi et
al, report that using 5% FBS reduced the specific cell death rate by 65% during a 3-d
lactate-consumption phase and a 10% FBS supplement increased cell viability to >99%
during exponential growth from ~75-90% compared to protein-free media (Zanghi et al.
1999). However, high batch-batch variations of isolated serum and risk of contamination
from prions and viruses resulting in transmissible spongiform encephalopathy (TSE), have
led to developments of formulations free of serum.
(2) Eradication of serum from culture medium is necessary when a protein product is for
therapeutic purposes, as mentioned to avoid cross contamination with pathogens and
immunogenic responses. Also important are the costs of downstream processing to purify
the target protein/drug once the process is complete, which otherwise can be complicated
by the presence of protein-rich serum.
(3) The elimination of proteins such as growth factors, from media is also beneficial in
much the same way as elimination of serum, mainly allowing further reduction in
downstream process costs in the pharmaceutical industry when producing recombinant
proteins.
However, care is needed when sourcing of non-protein additives (e.g., geographic location,
endemicity and species) and then use trusted validation methods before supplementation
(Jayme 1999) (Jayme and Smith 2000). An example of a chemically defined protein-free
formulation would be the CDM-HD by FibercellSystems™ and is optimised for use in their
hollow fiber bioreactor systems.

12
In conclusion, while media optimisation has been beneficial and a vital cog in improving
bioprocess production using mammalian cells. Some believe improvements have reached a
plateau and alternative means are being sought such as host cell and vector engineering
(Lim et al. 2010) (Kim et al. 2012). Altering cell genetics through engineering approaches
and using specific molecules/genes involved in certain pathways within the cell could
influence proliferation and apoptosis for example, allowing the cells to perform beyond
their natural characteristics and thus drive more beneficial protein production.
1.4: Strategies in Mammalian Cell Engineering
To improve characteristics of recombinant CHO (rCHO) cells in regard to cell growth and
foreign protein production, numerous strategies have been targeted mainly to increase the
time integral of viable cell concentration (IVCC) and/or specific productivity of each
individual cell (Qp). Enhancing Qp is the common goal for biotechnologists with many
engineering methods being used in various ways, which will be discussed over the course
of this section.
1.4.1: Stable recombinant clone generation in CHO (rCHO)
The generation of a producing cell line is through the introduction of a transgene encoding
the protein product into host CHO cells. This is usually followed by gene copy number
amplification to increase its transcript level and subsequent intensive screening to isolate
the high-producers capable of increased secretory capacity (Seth et al. 2006) (Kantardjieff
and Zhou 2014).
By transfecting a plasmid encoding a GOI, external DNA is incorporated into cells via
transient (short term) transfection or integrated into the genome of the cells via stable
transfection (permanent).
Only the cells which contain the integrated GOI and selective marker in their genome can
survive under selective pressure, this facilitates a high degree of heterogeneity where all
resultant progeny to display the same behaviour characteristics. Routinely then, the next
step is to identify the best performers over extended periods, often screening for
13
characteristics related to bioprocessing such as; high growth rate, slow death rate and high
specific cell productivity (Qp).
A common method to construct recombinant CHO cell lines is to transfect dihydrofolate
reductase (DHFR) negative (dhfr−) CHO cell lines such as the DG44 (Urlaub et al. 1983),
with the cDNA genes for DHFR and the protein of interest. Initial transformants are
selected for growth in the absence of glycine, purines, and thymidine. The transfected genes
are then amplified by stepwise increasing the concentration of methotrexate (MTX), a
competitive inhibitor of DHFR, in the culture medium (Kaufman 1990). During this
process the transfected genes are amplified several 1000-fold resulting in an increased
production rate for the recombinant protein (Crouse et al. 1983).
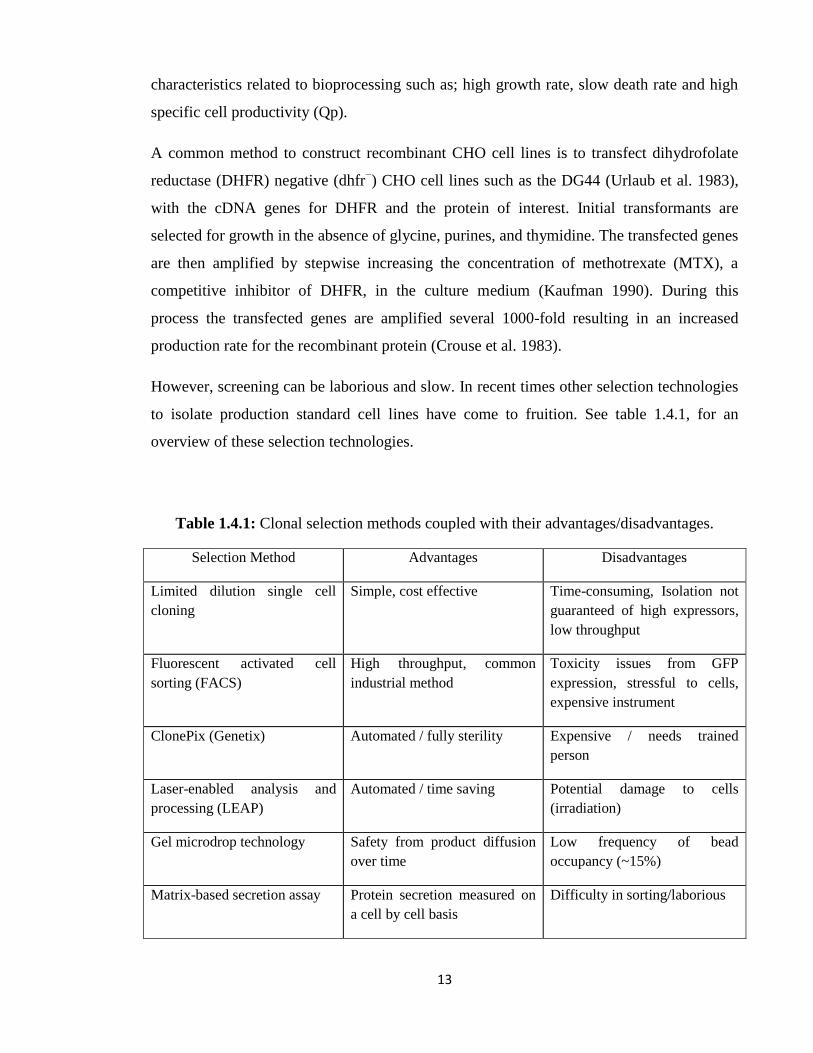
However, screening can be laborious and slow. In recent times other selection technologies
to isolate production standard cell lines have come to fruition. See table 1.4.1, for an
overview of these selection technologies.
Table 1.4.1: Clonal selection methods coupled with their advantages/disadvantages.
Selection Method Advantages Disadvantages
Limited dilution single cell
cloning
Simple, cost effective Time-consuming, Isolation not
guaranteed of high expressors,
low throughput
Fluorescent activated cell
sorting (FACS)
High throughput, common
industrial method
Toxicity issues from GFP
expression, stressful to cells,
expensive instrument
ClonePix (Genetix) Automated / fully sterility Expensive / needs trained
person
Laser-enabled analysis and
processing (LEAP)
Automated / time saving Potential damage to cells
(irradiation)
Gel microdrop technology Safety from product diffusion
over time
Low frequency of bead
occupancy (~15%)
Matrix-based secretion assay Protein secretion measured on
a cell by cell basis
Difficulty in sorting/laborious

14
In conclusion, random integration and gene amplification still represent the standard
approach in industrial application for generating production strains (Kramer, Klausing and
Noll 2010). Additional avenues such as, introduction and overexpression of genes and site-
specific integration techniques which can facilitate insertion of a product gene in contrast to
random integration are discussed in the coming sections.
1.4.2: Overexpression engineering
Probably the most traditional way to engineer cell lines is based on overexpression of
certain genes. It usually involves the isolation of a native DNA sequence (often the cDNA
of a full gene), this fragment is then subsequently cloned into a mammalian expression
vector/plasmid for transfection into a host for propagation. The stable integration into the
cell genomes is promoted by applying antibiotic selective pressure. Furthermore, it is
possible to increase the expression of the amplified gene by raising the selective pressure
(Kramer et al. 2010) (Klausing and Noll 2010).
Studies have shown that overexpression of proliferative and anti-apoptotic genes can lead
to improved bioprocess phenotypes, for example, overexpression of the bcl-2 and Beclin-1
genes and their homologues represents a frequent overexpression strategy to increase
viability and inhibit apoptosis in CHO (Figueroa et al. 2003)(Ifandi and Al-Rubeai 2005,
Lee et al. 2013). While Omasa et al, report that overexpression of the growth arrest DNA
damage inducible protein 34 (GADD34) could improve recombinant human antithrombin
III product concentrations by ~40% (Omasa et al. 2008). Additionally, overexpression of
HSPs (HSP27 and HSP70) was found to extended culture times and increase productivity
in CHO cultures (Lee et al. 2009).
Overexpression and manipulating genes or regulatory pathways can be a valuable approach,
however, problems can arise. These modifications could destabilize the metabolic balance
within the cells and impair other functions and cause unexpected side-effects (Kramer, et
al. 2010). For example; overexpression of Bcl-2 resulted in down-regulation of DNA repair
and NHEJ (non-homologous end-joining) leading to abnormal chromosomal formation in
approximately 30% of cell divisions in metaphase (Wang et al. 2008).

15
Although site-specificity is not a prerequisite for introduction of transgenes into a host for
overexpression, the success of integration can be boosted by more specific insertion
methods, particularly into favourable areas of the genome permitting high transcription
rates. Targeted integration also may avoid unwanted disruption of coding sequence. It is a
powerful tool to have more control of targeted integration of an exogenous sequence into a
predetermined genomic location.
Methods such as site-specific recombination (SSRs) have come to prominence to tackle the
issues of sub-optimal expression of transgenes at unfavorable chromosomal loci. Strategies
such as using site-specific nucleases, recombinase-mediated cassette exchange (RMCE),
for example the Cre/LoxP system, and cis-acting elements have all been shown to increase
efficiency of site-specific insertion of a transgene.
1.4.3: Site-specific targeting techniques
1.4.3.1: Site-specific nucleases for genome editing
Gene targeting and knockout are useful tools to study gene function and modify features of
a cell. Early methods revolved around using chemical agents, radiation and transposons
(Remy et al. 2010). The outcome of these non-targeting methods was based on chance and
screening for cells with the desired mutation was time and labour intensive.
Using more accurate methods like homologous recombination to induce mutations at
specific locations was explored. To increase the occurrence of HR, double-stranded breaks
(DSBs) can be introduced at certain sites within the genome (Kramer, Klausing and Noll
2010).
This can be achieved by using site-specific nucleases such as; Zinc-finger nucleases
(ZFNs), Transcription activator-like effector nucleases (TALENs), Meganucleases and
more recently the emergence of Clustered regulatory interspaced short palindromic repeats
(CRISPRs) all comprise powerful classes of tools that are redefining the boundaries of
biological research (Gaj et al. 2013), and could hold the key for improved gene therapy.

16
Chronologically, the first engineered nuclease technology, Zinc-Finger nuclease, was
presented in a 1991 publication by Pavletich and Pabo (Pavletich and Pabo 1991). ZFNs
recognise specific DNA sites in the genome based on a unique specifically designed zinc-
finger DNA binding motif attached to a cleavage domain (FokI restriction enzyme). The
DNA is cleaved and then relies on the ability of cellular repair machinery to use extra-
chromosomal DNA (donor DNA) as a template to enhance homologous recombination
(HR).
The development of ZFN-mediated gene targeting provided molecular biologists with the
ability to site-specifically and permanently modify both plant and mammalian genomes
including the human genome via stimulation of homologous recombination (HR) (Durai et
al. 2005). A study by Cost et al, in CHO ZFN engineering, recently where they reported
that by knocking out the pro-apoptotic genes Bak and Bax in CHO cells, generated clones
were more resistant to apoptotic stress induced by starvation, staurosporine, and sodium
butyrate (Cost et al. 2010).
As genome editing became more prominent in cell engineering, more cost effective
competing technologies have arisen. A similar class of nucleases termed ‘TALENs’
(Transcription-Activator-Like Effector Nucleases), employ a similar FokI domain design
and show promise in a range of species (Mussolino and Cathomen 2012) (Hockemeyer et
al. 2011).
Meganucleases, homing endonucleases capable of recognizing long DNA sequences
(~45bp) are divided into five sub-families (Kramer, Klausing and Noll 2010) (Paques and
Duchateau 2007). Limitations in recognition motifs are one concern, but engineered
meganucleases can be constructed by domain swapping. An example of an engineered
meganuclease is the knockout of RAG1 gene locus in 293H cells (Grizot et al. 2009).
However, they have drawbacks such as lower mobility owing to being quite large compared
to the more motile smaller ZFNs and TALENs (Epinat et al. 2003).
CRISPRs were first discovered in the 1980s, but their function wasn’t confirmed until 2007
by Barrangou and colleagues. They are a distinctive feature of the genomes of most
bacteria and archaea. Termed RNA-guided endonucleases (RGENs), they are derived from
the prokaryotic adaptive immune system involved in resistance to bacteriophages which
17
integrates a genomic fragment from an invading infectious agent into its CRISPR locus
(Barrangou et al. 2007). Approximately 40% of sequenced bacterial genomes, and ~90% of
those from archaea, contain at least one CRISPR locus, furthermore the availability of a
public database which is regularly updated called ‘CRISPRdb’ is accessible at
http://crispr.u-psud.fr/crispr (Grissa et al. 2007).
Using CRISPR instead of the other site-specific nucleases eliminates the need to construct a
completely customized endonuclease for each target, something that is still required by
TALEN and Zinc Finger. As a result of this the entry barrier to genome editing has been
lowered significantly, allowing for more users and more innovation (Gratz et al. 2013).
Three types of CRISPR mechanisms have been identified (Figure 1.4.3.1), type II is the
most studied to date. DNA from viruses or foreign agents are digested and incorporated
into a CRISPR locus amidst a series of short (~20bp) repeats. These loci are then
transcribed and processed into RNAs (crRNA), which is then used to guide effector
nucleases to target invading DNA sequence further based on sequence complementarity
(Jinek et al. 2012).

18
Figure 1.4.3.1: The 3 stages of CRISPR-Cas action. CRISPRs act in three stages:
adaptation, expression and interference. In type I and type II CRISPR-Cas systems, but not
in type III systems, the selection of proto-spacers in invading nucleic acid probably depends
on a proto-spacer-adjacent motif (PAM) (Koonin and Makarova 2013).
In summary, genetic engineering using the various methods above are useful for a number
of applications. These include; targeted gene mutations, chromosomal rearrangement, and
the creation of transgenic animals. While applications such as gene therapy, allele disabling
and editing (editing an organisms DNA by altering, removing or adding nucleotides to the
genome) are possible, however they can suffer from drawbacks such as; off-target
effects/cleavage (wrong digestion site) and immunogenicity issues, as is the case with many
foreign proteins/molecules inserted into a living organism.

19
Recently, improvements in zinc-finger nuclease design (Ramalingam et al. 2011) and
TALEN design (Joung and Sander 2013) are being sought to decrease immunogenicity,
cytotoxicity and subsequently increase efficacy regarding genome editing. These
mechanisms can contribute to the development of precise targeting within a cells genome
and they all combine to expand the tailored engineering toolbox further.
1.4.3.2: Cre/LoxP system
The Cre/LoxP site-specific recombinase method can also be used for gene targeting and
DNA manipulation via insertions, deletions, and inversions. First reported by Kito et al, the
system was utilised for reproducible monoclonal antibody production using CHO cells.
They showed that after gene-targeting of loxP in clone MK2 with selective gene
amplification with methotrexate (MTX), the MTX-resistant colonies showed high levels of
antibody production (Kito et al. 2002). Placing Lox sequences appropriately allows genes
to be activated, repressed, or exchanged for other genes.
Kameyama et al described an accumulative gene integration system (AGIS), in which
target gene cassettes could be repetitively integrated into a pre-determined site on a plasmid
or cellular genome by recombinase-mediated cassette exchange (RMCE), using Cre and
mutated LoxPs. The equilibrium and specificity of the recombination reaction can be
controlled using mutated LoxPs (Kameyama et al. 2010).
Two advantages of the Cre/LoxP technology include; insertion of a cassette in the correct
orientation and it being of higher efficiency than random integration methods. The
properties of site-specific recombinases in combination with other biotechnological tools
(Inducible systems, shRNA/siRNA mediated gene silencing) make them useful instruments
to induce precise mutations in specific cells or tissues in a time-controlled manner (Garcia-
Otin and Guillou 2006).

20
1.4.4: RNA interference engineering
RNA interference (RNAi) is an evolutionarily conserved phenomenon for sequence-
specific gene silencing. RNAi was first described by Fire et al, 1998 in C. Elegans where
dsRNA was introduced into worms and specific mRNA silencing was seen. After injection
into adult animals, purified single strands had at most, a modest effect, whereas double-
stranded mixtures caused potent and specific interference (Fire et al. 1998).
In the RNAi pathway (Figure 1.4.4), RNAi is induced by small interfering double-stranded
RNA molecules (siRNAs) which are approximately 21 to 23 nucleotides in length and
serve as the regulatory molecules that guide and induce sequence-specific gene silencing.
This leads to negative regulation of gene expression at a post-transcriptional level and is
termed post-transcriptional gene silencing (PTGS) (McManus and Sharp 2002) (Sakurai,
Chomchan and Rossi 2010) (McManus and Sharp 2002) (McManus and Sharp 2002).
RNAi-mediated gene silencing can be performed using artificially synthesised siRNA
molecules (native siRNAs were originally found in plants) or via the endogenous
expression of short hairpin RNA molecules (shRNAs) encoded by plasmids or viral vectors
(Amarzguioui et al 2005). However, unlike chemically synthesised siRNAs which have
been shown to only cause a transient knockdown of a target gene after transfection (3-5
days), shRNA vectors can induce a longer term and more stable expression of RNAi
silencing in target cells after transfection (Wu 2009).

21
Figure 1.4.4: Pathway of siRNA. ShRNA is processed by Dicer into siRNA duplexes that
are then bound by the RISC. Each duplex consists of a guide strand (red) which remains
bound to RISC and a passenger strand (blue) which is degraded. Target mRNAs are
recognised by base pairing and are subsequently silenced by different mechanisms. The
m7G structure of the mRNA depicts the eukaryotic 5′-Cap structure, (A)n stands for the
polyadenylation of the 3′-end (Kramer, Klausing and Noll 2010).
Furthermore, arising from shRNA vector-mediated silencing are another class of small non-
coding RNAs called microRNAs or miRNAs, which are produced by the cell naturally
(unlike siRNAs which are generally artificially made by chemical synthesis), to further
regulate gene expression. Both siRNA and miRNAs are commonly used to induce RNAi in
mammalian cells for functional studies.
Typically, RNA interference can be subdivided into three main pathways by the biogenesis
of the small RNAs mediating the silencing: short interfering RNAs (siRNAs), microRNAs
(miRNAs) and PIWI-interacting RNAs (piRNAs), respectively (Siomi and Siomi 2009).
Despite their distinct functions, the boundaries between their pathways are not well
defined; but the general mechanism is applicable to all three types. Additionally, the key
role of the piRNAs seems to be the protection of the germ line genome (Choudhuri 2009)
(Siomi et al. 2011).
RNAi technology has become a novel reverse genetic tool for silencing gene expression in
mammalian cells for a number of potential benefits including; developing new therapeutics
for certain diseases like cancer (Takeshita and Ochiya 2006). Additionally, because of the
ability of RNAi to silence disease-associated genes in tissue culture and animal models, the
development of RNAi-based reagents for clinical applications such as HIV replication
22
inhibition (Berkhout and Liu 2014) and personalised cancer treatment is gathering pace, as
technological enhancements that improve siRNA stability and delivery in vivo, while
minimising off-target and non-specific effects, are developed (Leung and Whittaker 2005)
(Wu et al. 2014).
More related to the work presented in this project, is using siRNA-mediated silencing as a
tool for investigating gene function. For example, the knockdown of pro-apoptotic factors
using RNAi like Alg-2 and caspases 3 and 7 (caspase suppression has been shown to lead
to increased viability and subdued autophagy). The zinc finger transcription factor
‘Requiem’ has also been reported to improve cell viability and more importantly increase
recombinant protein production such as interferon-γ in CHO cells by targeting the apoptosis
cascade (Lim et al. 2010) (Wu 2009).
Additionally, siRNAs are attractive to regulatory authorities as they have not induced any
toxic reactions to date as shown in vivo studies in mammals and many have been developed
as therapeutics over the last decade aiding in personalised cancer treatment (Hong et al.
2007) (Rossbach 2010) (Wu et al. 2014). For example; Song et al showed that by silencing
the Fas gene through intravenous injection of Fas siRNA with RNAi holds therapeutic
promise to prevent liver injury by protecting hepatocytes from cytotoxicity (Song et al.
2003). In addition, Brummelkamp et al reported that viral delivery of small interfering
RNAs can be used to target the oncogenic K-RAS (V12) allele in human tumor cells
allowing for tumor-specific gene therapy to reverse the oncogenic phenotype of cancer cells
(Brummelkamp et al. 2002).
In summary, small RNA molecules such as siRNAs and miRNAs were once deemed too
small to impinge on large complex organisms. Ironically they are now considered as
attractive biological tools to control regulation by sequence-dependent degradation of
mRNA with more development being made in the area of small molecule engineering than
any other field in genetics at present (Jadhav et al. 2012).

23
1.4.5: Cis-regulatory elements
Other important cell engineering elements for augmenting gene expression include;
S/MARs, UCOEs, and IRES elements. ‘Cis’ meaning “on the same side as” as derived
from latin. They are essentially DNA/RNA regulatory sequences that are located generally
in the same location or on the same chromosome and close to the coding sequence they
regulate.
1.4.5.1: Scaffold/matrix attachment regions (S/MAR)
S/MARs are one of the most widely used cis-acting elements outside of native promoters;
they organise the chromatin into structural domains and can be mapped to non-random
locations in the genome by using stress-induced DNA duplex destabilization (SIDD) or
when placed under negative superhelical tension (Bode et al. 2006).
S/MARs do not have a clear-cut consensus sequence; the characteristics that define their
activity are thought to be structural, they occur at the flanks of transcribed regions, in 5´-
introns, and also at gene breakpoint cluster regions (BCRs) (Benham, Kohwi-Shigematsu
and Bode 1997). They are believed to define boundaries interfacing heterochromatin and
euchromatin domains (two structural forms of chromatin, heterochromatin is more tightly
packed than euchromatin and therefore euchromatin is more transcriptionally active)
thereby acting as epigenetic regulators (Harraghy et al. 2011).
Regarding use in CHO cells, S/MARs have been tested to evaluate their performance in
rCHO cells, with Harraghy et al, reporting increases in recombinant antibody production
and reducing the number of clones to be screened and time to production by as much as 9
months after incorporating MARs into suitable expression vectors (Harraghy et al. 2012).
Girod et al reported that the chicken lysozyme MAR interestingly mediates a dual effect by
working as a cis-acting element as well as working as a trans-acting element for a separate
co-transfected plasmid (Girod, Zahn-Zabal and Mermod 2005).

24
Locus control regions (LCRs) and Boundary elements (BEs) are two other chromatin
elements and these were screened for their ability to augment the expression of
heterologous genes in mammalian cells even though LCRs composition and locations
relative to their cognate genes are different (Li et al. 2002). Of all chromatin elements
assayed, the chicken lysozyme matrix-attachment region was the only element to
significantly increase stable reporter expression (Zahn-Zabal et al. 2001).
1.4.5.2: Ubiquitous Chromatin Opening Elements
Similar in function to S/MARs, UCOEs are promoter-like elements associated with
endogenous house-keeping genes. They contain extended CpG islands found to be resistant
to methylation and the effects of transgene silencing (Nair et al. 2011).
A study by Benton et al, showed the results of combining the cytomegalovirus (CMV)
promoter with fragments derived from UCOE, a vector with 8kb UCOE sequence, resulting
in a much improved number of clones expressing high levels of GFP after flow cytometry
analysis – thus reducing the level of screening necessary to isolate such high producing
clones perhaps (Benton et al. 2002).
Additionally their mode of action has relative experimental ease of use, which is combined
with vector engineering, which can subsequently be readily transfected into mammalian
cells. UCOEs are useful additions to mammalian engineering to improve desirable
phenotypes without using the more potentially disruptive and damaging genetic
manipulations like directed mutagenesis for example.
Where there were size concerns for transfection efficiency, smaller sequences of UCOE
(1.5-4kb) from human were utilised by (Brooks et al. 2004) (Boscolo et al. 2012). Both
have shown great potential regarding recombinant productivity increases with quick
implementation into production systems.

25
1.4.5.3: IRES elements
Internal ribosomal entry segments (IRES) are elements that affect the outcome of gene
expression in a cell based on interaction with other elements present and have varying
degrees of efficiency. These sequences allows for translation initiation to take place in the
middle of a messenger RNA (mRNA), thus going against the convention where 5’cap
recognition is need to initiate translation. They are typically of viral origin but recently
found in the mRNA of the tumor suppressor p53 gene (Sharathchandra et al. 2014).
IRES elements are particularly useful for creation of bicistronic mRNAs that encode both a
gene of interest and a selectable marker for stable transfection (Martinez-Salas et al. 1996)
(Koh et al. 2013).
Fussenegger and co-workers created a technology called ‘pTRIDENT’, it involves a series
of tricistronic vectors that utilise three IRES segments to link 3 genes which normally
would not be expressed in unison (Fussenegger et al. 1998) (Fux et al. 2004). Although
overall the process seems to be less efficient than natural cap-dependant translation, there is
an argument that selection is actually improved due to impairment of the marker expression
downstream whereby creating better-expressing transfectants and false positive clones may
be reduced.
On the contrary, targeting IRESs by silencing or knockdown can be a suitable avenue for
therapeutic development as IRES-mediated hepatitis C (HCV) and polioviruses (PV) that
infect humans use the IRES mechanism for synthesis of viral proteins (Dasgupta et al.
2004).
After critical examination of IRES publications over the last decade, flaws were uncovered
leading to alternative interpretations, such as the possibility that IRES elements might
function using other mechanisms such as cryptic promoters, splice sites, or sequences that
modulate cleavage by RNases. In short, the focus on IRES-binding proteins has gotten us
no closer to understanding the mechanism of internal initiation (Baranick et al. 2008). The
uncertainty about these mechanisms might underlie what-appears-to-be internal initiation,
and Kozak et al offer a temporary solution, where it might be beneficial to redefine IRES to
mean "internal regulatory expression sequence.

26
This compromise would allow the sequences to be used for gene expression studies, for
which they sometimes work, without asserting more than has been proven about the
mechanism (Kozak 2003).
1.4.5.4: Other engineering strategies
In addition to all engineering methods described previous, there are many more strategies
that expand further than the scope of this project. Due to the increasing demand for quality
recombinant proteins the interest in alternative strategies has grown in recent years.
Other strategies used to engineer mammalian cells include; glycosylation engineering (Park
et al. 2012), chaperone engineering, (Josse, Smales and Tuite 2012), unfolded protein
response (UPR)-based engineering (Chien et al. 2014), metabolic engineering (Le et al.
2013) and secretion engineering (Peng et al. 2010).
1.5: The CHO Genome Project
Until recently, the absence of a publicly available CHO genomic sequence was a hindrance
to many researchers interested in studying CHO cell lines. Although genetic heterogeneity
among CHO cell lines is well documented, a systematic, nucleotide resolution
characterisation of their genotypic differences has been hindered by lack of a unifying
‘Gold standard’ sequence resource for CHO cells as a whole.
As the most common mammalian cell line used in biologic production processes, the CHO
genomic sequence along with its mapping and annotating, became a research priority in the
field of biotechnology. As a result of explicitly identifying the CHO genetic code,
biotechnologists aimed to improve the efficiency and understanding of cell culture
bioprocessing overall (Wuest et al. 2012).
In 2010 there were only a few known institutes in possession of entire or at least partial
CHO genome sequences or resources (Kramer et al. 2010). Among them were the
“Consortium for Chinese Hamster Ovary Cell Genomics” group and they have amassed a
sequence repertoire of more than 68,000 expressed sequence tags (ESTs), representing

27
more than 28,000 unique CHO transcripts (Kantardjieff et al. 2009). Furthermore, the
Chinese Hamster genome database at http://www.chogenome.org/ is another online
resource for the CHO communities (Hammond et al. 2012).
In July 2011, a consortium group led by Beijing genomics institute (BGI) based in
Shenzhen, China released the first draft of the CHO-K1 ancestral cell line (Xu et al. 2011).
The assembly comprised 2.45 Gb of genomic sequence, with 24,383 predicted genes
annotated from scaffold assembly’s and made available to the public on GenBank and the
resource at www.chogenome.org. The information within will facilitate genome-scale
science for the optimisation of biopharmaceutical protein production for years to come and
in 2012 they were nominated for Upstream Collaboration of the Decade at the BPI awards
in Rhode island, USA.
More recently, Lewis et al reported their findings upon analysing six CHO cell lines
derived from CHO-K1, DG44 and CHO-S lineages. More importantly, they published the
Chinese Hamster sequence as a reference to compare all cell line sequences to. They
identified genes missing in the different lines and detected >3.7 million SNPs, 551,240
indels (an insertion or deletion event) and 7,063 copy number variations (Lewis et al.
2013).
Up until these sequences were released, the isolation and identification of promoter
sequences and gene sequences in CHO was slow and tedious. Cross species alignments
based on sequence comparisons in other rodent species such as rat and mouse were used to
make educated guesses and roughly map the region of promoter upstream of the target
genes used in this study (see results section 3.2). So with the advent of the fully assembled
CHO-K1 sequence, this process was simplified approximately midway through the project.

28
1.6: Gene Promoters
A promoter is a segment of DNA (usually occurring upstream from a gene coding region)
that acts as a controlling element in the expression of that gene by initiating transcription.
The typical organisation of a promoter and gene segment is shown in figure 1.6. Vectors
used in bioprocessing and gene therapy require an expression cassette. The expression
cassette consists of three vital components: promoter, therapeutic or product gene and
polyadenylation signal. The promoter is chiefly responsible for controlling expression of
the gene and is therefore a potential tool in driving protein production (Zheng and Baum
2008) (Preker et al. 2008)
Crucial to the activity of a promoter is its ability to recruit RNA polymerase (RNAP), to
initiate transcription. RNA polymerase enzymes are essential to life and are found in all
organisms and many viruses. There are 5 distinct types; each type is responsible for
synthesis of a different molecule. RNAP I is involved in ribosomal synthesis (rRNA)
(Grummt 1999). RNAP II is involved in synthesising precursors of mRNA (including
snRNA and miRNA) and is the most studied type owing to its strong control over
transcription (Hahn 2004). RNAP III synthesises transfer RNA (tRNA) present in the
cytosol (Geiduschek and Tocchini-Valentini 1988). RNAP IV and V are less studied but are
involved in siRNA-directed heterochromatin formation and synthesis in plants (Wierzbicki
et al. 2009).
All common polymerase II promoters share similar sequence structures; a core promoter
consisting of either a conserved TATA box-enriched well defined region or more
expansive, evolvable CpG islands, an initiator element and a downstream promoter element
(Kadonaga 2004) (Carninci et al. 2006), and a proximal promoter (Heintzman and Ren
2007).

29
Figure 1.6: DNA structure and configuration surrounding a TATA-based promoter locus.
The regulatory proteins and specific transcription factors recruit the RNA polymerase II to
the transcription start site (TSS) to initiate transcription.
Promoters contain specific sequences and response elements which allow RNA polymerase
and other transcription factors’ (TF’s) to bind securely to the transcription start site (TSS)
of the DNA to begin transcription and ultimately protein synthesis. A promoter’s ultimate
function is to facilitate expression of different gene products at various times in their
biological pathways in order to maintain homeostasis (Gagniuc and Ionescu-Tirgoviste
2012).
Promoters can have proximal and distal regions, and the expression of a particular gene
may be regulated by the concerted action of both cis and trans-acting elements related to
that promoter. The boundaries between proximal and distal regions are ill-defined and the
entire mapping of promoters and the interactions between proximal and distal sequences
can be complex (Sanyal et al. 2012) (Davydova et al. 2011).
Proximal sequence is taken to be adjacent to the gene of interest and usually embodies 250-
300 nucleotides (nt) upstream of the TSS, and contains all primary regulatory elements and
transcription factor binding sites. The distal promoter region can be anywhere from 300
base pairs (bp) to many Kilobases (Kb) away. Signal transduction occurs due to the
foldable nature of DNA to bring distal elements into close proximity with complexes bound
at the proximal region.

30
1.6.1: Types of Promoters
Eukaryotic promoters are diverse and can be difficult to characterise, with the general
consensus being that there are two major classes, namely TATA and CpG island based
promoters. However, a recent study divided them into 10 sub-classes by analysing
thousands of promoter sequences using novel methodologies termed the ‘Kappa index of
coincidence’ method and a specialised data entry method based on an electronic conversion
of images into electronic signals using a ‘Optical Character Recognition’ (OCR) neural
network (Gagniuc and Ionescu-Tirgoviste 2012).
However, here we have sub-classed the types of promoters into four more amenable types
based on their mode of driving gene expression;
1.6.1.1: Constitutive promoters
These are promoters that can drive expression in almost all tissues and cellular
environments; they are largely and oftentimes entirely independent of environmental
factors and stimuli. Reports have shown functionality across species and those derived from
viruses; CMV, RSV, LTR, adenovirus MLP and SV40 are examples of compact high-
expressing constitutive promoters frequently used in cell engineering (Mulligan and Berg
1981) (Makrides 1999).
Qin et al carried out a systematic comparison of eight commonly used constitutive
promoters (SV40, CMV from viruses, UBC, EF1A, PGK and CAGG from mammals, and
COPIA and ACT5C from Drosophila). They found that these promoters vary considerably
from one another in their strength when tested in various cell lines from different species.
While most promoters have fairly consistent strengths across different cell types, the CMV
promoter can vary considerably from cell type to cell type (Qin et al. 2010).

31
1.6.1.2: Tissue-specific or development-stage-specific promoters
More relevant to gene therapy and therapeutics are tissue-specific promoters. Gene therapy
is used to correct genetic defects or to deliver new therapeutic functions to the target/patient
cells. A tissue-specific promoter is a promoter that has functionality in only certain cell
types. Use of a tissue-specific promoter in the expression cassette can restrict unwanted
transgene expression as well as facilitate persistent transgene expression in the target organ.
Therefore, choosing the correct promoter, especially a tissue-specific promoter, is a major
step toward achieving successful therapeutic transgene expression (Zheng and Baum 2008).
A tissue-specific promoter directs the expression of a gene in specific tissue(s) or at certain
stages of development and can be useful tools to drive expression in combination with other
expression strategies such as RNAi. For example, Wolff et al combined the use of tissue-
specific promoters with miRNA silencing expression in antigen-presenting cells (APCs) to
increase the probability of long-term expression and establish transgene tolerance in liver
and skeletal muscle (Wolff, Wolff and Sebestyen 2009).
As different promoters have variable the optimal dose of a therapeutic transgene product
over time may be achieved by varying the promoter utilised to avoid promoter activity
attenuation and extinction post-delivery as reported by Qin et al. They also reported that the
cytokines interferon-gamma (IFN-gamma) and tumor necrosis factor-alpha (TNF-alpha)
inhibit transgene expression from certain widely used viral promoters/enhancers
(cytomegalovirus, Rous sarcoma virus, simian virus 40, Moloney murine leukemia virus
long terminal repeat) delivered by adenoviral, retroviral or plasmid vectors in vitro (Qin et
al. 1997).
Many tissue specific promoters are also seen in plants, promoters that control the
expression of plant genes to improve areas such as tobacco manufacture and genetically
modified foods. However, for the purpose of this literature review plant promoters are not
discussed. A good database of promoter and cis-transacting elements from plants are on
PLACE (http://www.dna.affrc.go.jp/PLACE/).

32
1.6.1.3: Inducible promoters
As their name suggests, this type of promoter can be induced by various factors such as;
small molecules, environmental stimuli aswell as artificially controlled by biotic and abiotic
factors like oxygen levels, heat, cold, chemical compounds like biotin, copper, cumate,
alcohol, gases, steroids which subsequently can facilitate control via induction.
Pertinent to this entire study, by harnessing such induced control, fine tuning gene
expression via inducible promoters may potentially improve biopharma processes. This
might be achieved by regulating certain pathways like apoptosis and growth by controlling
favourable or unfavorable genes involved in the pathway.
Furthermore, the synthesis of difficult to produce or toxic proteins requires inducible
expression systems with low basal expression strength and high induciblity after a triggered
event/stimulus. Certain proteins, such as kinases, transmembrane receptors, or transporters
are inherently toxic to the producer cell and can only be produced using transient or
inducible expression systems (Boorsma et al. 2002).
Another concern is clonal instability during CHO cell line development. There are several
underlying causes, the most prominent of which are DNA copy number decrease and
transgene silencing, while in some cases it has been shown that unstable cell lines are more
prone to apoptosis (Dorai et al. 2012). Clonal instability can also manifest due to the
toxicity of the therapeutic protein(s) that the cells express. To circumvent such product-
induced instability, Misaghi et al developed an inducible vector based on doxycycline
induction. Their findings suggest that this regulated expression system could be suitable
for production of difficult proteins that would normally trigger instability (Misaghi et al.
2014).
Initial advances in inducible expression methodology were made using prokaryote cells,
whereas more recently focus has been on mammalian cells. The E.coli lac promoter (lac
operon) was the flagship mechanism for providing inducible gene expression via interplay
between lactose substrate and IPTG induction (a lactose metabolite that binds to the lac
repressor). However, due to it having relatively weak expression strength meant that very
high levels could not be achieved as lac genes are not transcribed to a significant level in
the absence of induction (Davies and Jacob 1968) (Gronenborn 1976).

33
Berkner et al identified a range of inducible and constitutive promoters to be used in S.
acidocaldarius, where genetically modified stable shuttle vectors were developed based on
low molecular weight carbohydrates that don’t impede the bioprocess (Berkner and Lipps
2008). Findings showed that the most suitable inducible promoter was a maltose inducible
promoter (266bp sequence), with induction feasible with either maltose or dextrin at
concentrations of 0.2-0.4% (Berkner et al. 2010).
In another example Valdez-Cruz et al, report the use of a temperature inducible expression
system, based on the pL and/or pR phage lambda promoters regulated by the thermolabile
cI857 repressor has been widely use to produce recombinant proteins in prokaryotic cells
(Valdez-Cruz et al. 2010).
Some of the bacterial based systems suffered irregular expression and relied on toxic
inducer molecules when used in mammalian cells, however, the Tet-on/off system was
shown to be exempt from these issues (again utilising E.coli via its tetracycline repressor).
Inducible expression systems such as the tetracycline responsive system (Gossen and
Bujard 1992) and early binary systems used chimeric transactivators from insect hormones
to drive responsive target promoters. This typically involved the binding of a ligand-
dependant transactivator to its cognate promoter (Fussenegger 2001) (Vilaboa et al. 2005).
Their use in bioprocess development strategies has been limited as a result of the
combination of low or leaky expression, costs and side effects of chemical regulators, time-
consuming construction of stable cell lines, and difficulties in managing levels of the
regulating agent. Furthermore, regulatory authorities such as the FDA, prefer bioprocess
strategies that do not make use of antibiotics or hormones (Boorsma et al. 2002) (Weber et
al. 2007).
Boorsma et al developed the first novel temperature-regulated DNA expression system,
designated ‘pCytTS’. This layered system based on Sindbis virus cDNA carries the gene
for a non-cytopathic and temperature-sensitive replicase and a gene of interest. The titres of
β-IFN were shown to be highly glycosylated while the β-IFN mRNA did not show any
accumulation of mutations under viral replicase amplification even after 10 days in culture
at 29oC. This highlighted that ‘pCytTS’ system has applicability in bioprocessing and has
the ability to produce high-quality glycoproteins (Boorsma et al. 2002).

34
Other existing inducible based promoters include Heat-shock protein promoters,
particularly the powerful human chaperones ‘hsp27’ and ‘hsp70’, which have been used for
gene therapy strategies because of their efficiency and the possibility of induction by dose-
dependent external heat. (Garrido et al. 2006) (Rerole et al. 2011).
Spatial and temporal control of transgene expression using hsp70 promoters provides a
non-invasive method of accurate control using temperature (Rome, Couillaud and Moonen
2005). Hsp70 was found to be strictly inducible having little or no basal expression levels
in most cells. Noonan et al observed that Hsp70B' appeared transiently in response to heat
stress whereas interestingly another heat-shock protein tested ‘Hsp72’ levels persisted for
many days measured by a GFP-reporter and flow cytometry. Finally they showed that
‘Hsp70B' was optimally induced by temperature when cell numbers were low, whereas
‘Hsp72’ levels were greatest at higher cell number, so there is some ambiguity to the
induciblity of heat-shock promoters even in the same protein family (Noonan et al. 2007).
In addition, Rohmer et al reported on two novel adenoviral vectors designed with an
insulated human ‘hsp70B' promoter and they showed stringent heat-inducible gene
expression with induction ratios up to 8000-fold, but required an upstream insulator
sequence to avoid sub-optimal performance of the promoter (Rohmer et al. 2008).
Another useful inducible promoter is the mouse mammary tumor virus (MMTV)
originating from murine models. Its control over gene expression has been shown to be
regulated by glucocorticoids and its sequence contains a hormone response element (HRE)
located between -202 and -59 upstream of the start of transcription in the long terminal
repeat (LTR) region of proviral DNA and is necessary for this induction (Cato, Henderson
and Ponta 1987). James et al engineered CHO cells to overexpress a secreted protein
(SEAP) upon induction of the MMLV promoter using dexamethasone. They achieved ~10-
fold higher SEAP titres compared to the constitutive SV40 promoter after CHO cells were
grown for up to 9 days (James et al. 2000).
This again highlights a useful system of regulation control; however it still needs an
external receptor to function fully and also it can it can be difficult to maintain
reproducibility when using external components.

35
In 2004, Running-Deer and Allison reported the first use of CHO regulatory sequences (not
called promoter as the sequences used were flanking on the 5’ and 3’ of the gene) from the
Chinese Hamster elongation factor 1α (CHEF-1α) gene for use in the high level expression
of proteins such as the CCR4 chemokine receptor. They cloned a 19kb fragment containing
the gene as well as 12kb of the 5’ flanking sequence and 4kb of the 3’ flanking sequence
into six reporter gene constructs and transfected into CHO-DG44 cells.
As a comparison, CHO cells were also transfected with the same six reporter genes inserted
into commercial vectors utilising either the immediate early promoter from
cytomegalovirus (CMV) or the human EF-1alpha promoter and the average expression
levels from pooled, stable transfectants were 6- to 35-fold higher in the CHEF-1 vectors.
Finally they also used the CHEF-1α vectors to express a membrane-bound protein in stably
transfected non-CHO cell lines such as Jurkat, K562 and HEK-293, suggesting that CHEF-
1α vectors may be useful for high-level protein expression not only in CHO cells, but also
in a variety of other mammalian cell lines (Running Deer and Allison 2004).
More recently, Thaisuchat et al identified one temperature sensitive promoter S100a6
(Calcyclin) that was capable of temperature inducible transgene expression of luciferase.
Calcyclin and its flanking regions were identified from a genomic CHO-K1 lambda-phage
library and then various constructs were investigated for promoter activity at 37°C and
33°C after transfection into DHFR-deficient CHO cells. Upon a shift to 33°C, a two to
three-fold increase of basal productivity (already higher than SV40 promoter) was
achieved. This CHO S100a6 promoter can be characterised as a cold-shock responsive
promoter with the potential for improving process performance of mammalian expression
systems, of particular advantage for a process with reduced expression during initial cell
growth followed by the production phase at low temperature with a boost in expression
(Thaisuchat et al. 2011).
In conclusion, inducible promoters can serve as genetic switches for fine tuning gene
therapy proteins or for maximal performance and productivity in bioprocesses.
36
1.6.1.4: Synthetic promoters
Promoters can also be manufactured by synthetic means and combined to make a multi-
purpose promoter with all essential components to drive gene expression. Promoter
engineering often uses components like transactivating proteins and enhancers (DNA
sequence that controls the efficiency and rate of transcription of a specific promoter) to
boost their potential for expression.
The various configurations of transcriptional components have enabled the creation of
genetic networks that are strongly analogous to the architectural design and functionality of
electronic circuits. Toggle switches which possess "memory' so as to remember transient
administered inputs and oscillatory networks which produce regularly timed expression
outputs, are two examples of networks that have been constructed using such properties
(Greber and Fussenegger 2007).
Furthermore, many synthetic promoter systems are controlled and induced by using
components that are responsive to external stimuli such as heat and many are generated to
study gene function in plant and mammalian models (Venter 2007).
Although synthetic promoters seem attractive in that you can pick and choose specific
components to make a ‘super’ promoter, a drawback is that many regulatory bodies, like
the FDA, do not like promoting such artificial gene therapy approaches. This is perhaps due
to lack of data relating to the potential side-effects and immune response issues resulting
from using exogenous synthetic sequences (Tigges and Fussenegger 2009) (Jain 2013).
This gave rise to the construction of synthetic promoter libraries and it has represented a
major breakthrough in systems biology. Systems biology represents an area of combined
biology and mathematics, where all functional parts of cellular pathways and interactions
are studied. It now enables the subtle tuning of important regulatory pathway activities. A
number of tools are now available that allow the modulation of gene expression and the
detection of changes in expression patterns (Mijakovic et al. 2005) (Hammer et al. 2006).
More specifically for CHO engineering, Brown et al describe the first library of ~140
synthetic promoters specifically designed, by harboring 7 repeats of discrete transcription
factor binding site sequences upstream of a minimal CMV, to regulate the expression of

37
recombinant genes at varying levels in three CHO cell lines (CHO-S, CHO-K1 and CHO-
DG44) and offering precise control of recombinant transcriptional activity (Brown et al.
2014).
A successful example of a synthetic mammalian promoter construct was reported by
Hartenbach and Fussenegger. They introduced specific mutations into a synthetic internal
ribosome entry site (IRES(GTX)) derived from the GTX homeodomain protein creating a
novel synthetic P(GTX) promoter, resulting in additional transcriptional activity. It
mediated high-level expression of a variety of transgenes like SEAP and human vascular
endothelial growth factor 121 (VEGF-121) in CHO-K1 cells, thus outperforming
constitutive phosphoglycerate kinase (P(PGK)) and human ubiquitin C (P(hUBC))
promoters in comparison (Hartenbach and Fussenegger 2006).
Precise regulation advancements in systems biology via inducible and synthetic sequences
can assist other areas like drug discovery and therapeutics, plus they can generate biological
meaningful in vivo data, that can be flexibly and repeatedly reproduced. Using
combinations of synthetic and inducible regulatory sequences can benefit bioprocess
productivity and allow control over complex host cells (Aubel and Fussenegger 2010).
Other common mammalian expression systems used in industrial protein production are
shown in table 1.6.1.4.
Table 1.6.1.4: Existing CHO/mammalian promoter systems.

38
1.7: Promoter engineering
So why the interest in promoter engineering? Based on current trends in bioprocessing,
gaining control over protein production using inducible promoters is an attractive avenue
for researchers. Some of the early developments utilised the Tet on/off inducible system,
Mazur and colleagues reported on the cytostatic cell-cycle-arresting gene (p27) under
control of a single tetracycline-repressible Tet (off) promoter system. They showed that the
behavior of the engineered CHO cell lines could be controlled by the addition or
withdrawal of the exogenous agent tetracycline to or from the cell culture medium (Mazur
et al. 1998) (Mazur et al. 1999).
Systems and synthetic biology have made significant leaps over the past decade, they
enable rational and predictable reprogramming of cells to conduct complex physiological
activities (Wieland and Fussenegger 2012). Weber and Fussenegger have reviewed ways to
utilise metabolite, hormone, and light-triggered genetic switches to control cellular activity
and gene circuits (Weber and Fussenegger 2010).
Analogous to the engineering of electronic circuits, there now exists an extensive repertoire
of artificial regulatory elements that has further enabled the ambitious reprogramming of
cells to mimic spatiotemporal dynamics such as the oscillation of circadian clocks (Wieland
and Fussenegger 2012), as well as the design of artificial ecosystems for implementation of
time- and distance-dependent bioprocesses through ‘quorum-sensing’ (inducible responses
correlated to population density) (Weber and Fussenegger 2011).
There are potentially as many if not more promoters as there are genes. This cannot be fully
elucidated owing to the complexity within cells but is partly due to discovery of
bidirectional promoters (Trinklein et al. 2004) (Hartenbach and Fussenegger 2005). A
‘bidirectional gene pair’ refers to two adjacent genes coded on opposite strands, with their
5' ends oriented toward one another (Piontkivska et al. 2009). They are often functionally
related, this can be beneficial and harmful as modifications of their shared promoter region
allows them to be co-regulated and thus co-expressed.

39
In conclusion, thanks to the knowledge and insight resulting from the CHO-K1 draft
sequence now being available, this will aid in identifying promoter sequences of more
housekeeping genes for example, accelerating cellular promoter designs for more dynamic
expression control (Datta, Linhardt and Sharfstein 2013).
1.8: Exogenous Inducer Molecules (IMs) and building a promoter catalogue
The design and construction of synthetic gene circuits with complex spatiotemporal
dynamics was pioneered in bacteria, but it took almost a decade until biologists were able
to construct synthetic genetic circuits with complex spatiotemporal dynamics in
mammalian cells (Weber and Fussenegger 2010). In the next section we will discuss
synthetic promoters further within the context of precise inducible expression for
developing bioprocessing plus the broad area of synthetic systems biology providing scope
for novel therapeutic strategies.
There are existing technologies that utilise systematic inducer molecules (IM’s) researched
and tested by a group headed by Martin Fussenegger, Wifred Weber and co-workers. They
have published numerous articles documenting the use of synthetic switches and atypical
combinations of interaction compounds (Ehrbar et al. 2008) (Weber et al. 2007, Weber and
Fussenegger 2011, Weber et al. 2009a, Weber and Fussenegger 2007) (Kramer et al. 2004).
For example, by using the induction of various molecules one can build a portfolio of
mutually compatible systems that can adjust therapeutic transgene levels in response to
antibiotics, hormone analogues, quorum-sensing messengers and secondary metabolites
(Weber and Fussenegger 2004). Other compounds which have been explored include;
gaseous acetaldehyde (Werner et al. 2007), Biotin (Weber et al. 2009b), Cumate (Gaillet et
al. 2010), drug sensing hydrogels (Ehrbar et al. 2008), all of which have had varying levels
of success.
The IMs used to transmit information in their experiments have a multitude of isoforms,
bioconjunctants, hybrid molecules of biology and metal ligands, vitamin H/Biotin, L-
arginine sensors, and even a food additive vanillic acid has shown to be capable of inducing
transgene expression.
40
Furthermore, groups have devised methodology to design synthetic networks based around
these interacting molecules (Greber and Fussenegger 2007) (Aubel and Fussenegger 2010)
(Wieland and Fussenegger 2010) (Weber and Fussenegger 2009).
In early publications, Weber and colleagues reported significant differences in the
regulation performance in diverse cell lines using macrolide- (E.REX system) and
streptogramin- (PIP system) responsive gene regulation systems in mouse and CHO cells
(Weber et al. 2002). They also showed that the implantation of microencapsulated DT40
cells engineered for TIGR-controlled expression of the human vascular endothelial growth
factor A (hVEGF121) provided low-temperature-induced VEGF-mediated vascularisation
in chicken embryos (Weber et al. 2003).
However, they reported a more stringent tunable time-delay circuit where the tetracycline-
responsive transactivator (tTA) induced expression of the pristinamycin-responsive
repressor PIP-KRAB representing a biologic building block for emulating a fundamental
circuit topology in integrated artificial synthetic gene networks (Weber, Kramer and
Fussenegger 2007).
Huang et al showed the use of the metallothionein (MT) expression system as an inducible
metal induction method producing recombinant human growth hormone (hGH) in CHO
cells. The setup was successful in increasing cellular productivity. It was shown that a fed-
batch process could increase the maximum cell numbers two-fold, from 3.3x10⁶ to 6.3x10
6
cell/mL, over those obtained in normal batch fermentations. This, coupled with extended
fermentation times, resulted in a fourfold increase in final hGH titer, from 135 +/- 15 to 670
+/- 70 mg/L at a specific productivity q(hGH) value of 12 pg cell(-1)d(-1). The addition of
NaBu further increased specific productivity of hGH in cells to a value of approximately 48
pg cell(-1)d(-1) (Huang et al. 2004). But once again the use of a metal is not attractive for
large scale industry bioprocessing.

41
1.9: Viral versus Endogenous CHO promoters in bioprocessing
Although viral promoters are examples of strong promoters capable of robust constitutive
expression, they can trigger the undesired silencing phenomenon due to DNA and histone
methylation of the promoter region (Brooks et al. 2004) (Williams, Christensen and Helin
2011). They can also induce stress responses which impact on the unfolded protein
response (UPR) and Endoplasmic-reticulum-associated protein degradation (ERAD)
pathways, leading to incorrect protein folding or even cell death in worst cases. Parkinson’s
disease and cystic fibrosis both have been linked to ERAD malfunction as the pathways are
no longer able to stabilize aberrant proteins and can accumulate and damage the cells
(Vembar and Brodsky 2008) (Mehnert, Sommer and Jarosch 2010).
Studies on viral promoters and enhancers began in the mid-80s and at an early stage were
recognised as useful biological tools (Foecking and Hofstetter 1986). While Zarrin et al
concluded that CMV and RSV promoter/enhancers contain stronger regulatory elements
than do SV40 and V/lambda1 for expression of genes in lymphoid cell lines showing 10- to
113-fold increases (Zarrin et al. 1999).
Another issue seen commonly is the cell-cycle dependence of these promoters that causes
high cell to cell variation in the amount of protein produced at a given time and
heterogeneity in a population (Thaisuchat et al. 2011). They do not routinely allow
induciblity or any control once the expression process begins. Further evidence showed
these viral promoters having the greatest transcriptional activity during S Phase
(replication) between G1 and G
2, this may lead to undesired cell and protein heterogeneity
(Pontiller et al. 2010).
Due to some of these shortcomings, endogenous cellular promoters have been investigated
for the purpose of recombinant protein expression aswell. The idea of using endogenous
promoters is appealing from a regulatory point of view.
As mentioned previously, examples of such endogenous CHO promoters at present are the
constitutive CHO-derived elongation factor-1 (CHEF-1α) gene and the inducible S100a6
(calcyclin). Both can drive high expression of several genes and in a variety of cell lines
including CHO (Running Deer and Allison 2004) (Thaisuchat et al. 2011). More recently,

42
Le et al isolated a CHO-specific promoter (~800bp fragment) of the Thioredoxin-
interacting protein (Txnip) gene and demonstrated its ability to drive transgene expression
synchronous with the CHO host cells natural rhythm. This gene was chosen by the group
because it was previously shown to be dynamically expressed, based on transcriptome and
proteome analysis of Chinese hamster ovary cells under low temperature and sodium
butyrate treatment and subsequent gene set enrichment analysis (GSEA) (Kantardjieff et al.
2010).
Strong cellular promoters may also be sourced from housekeeping genes. Two other
constitutive promoters Chinese Hamster Cofilin (CHCF) and the CHO CH1433e epsilon
promoter confer high expression and outperformed a CMV viral promoter in driving GFP
and luciferase expression (Chan et al. 2008) (Datta, Linhardt and Sharfstein 2013).
Although displaying no inducible expression attributes, constitutive promoters like these
have a niche in the genetic toolbox for recombinant protein production.
1.9.1: Endogenous promoters responsive to temperature inducibility
The previous section described numerous ‘artificial’ inducible systems that have been used
in various biotech applications. Many of these require some sort of exogenous inducer
molecule or trigger to be added to the system which may not always be possible or
desirable. It is this challenge that led our group and others to consider the possibility of
using endogenous gene expression patterns to design more ‘natural’ inducible methods of
control to drive protein expression in response to a process-related
trigger/signal/input/stimulus.
A discrete process trigger that can be capitalised on is the use of temperature shift to adjust
protein expression and will be detailed further in section 1.11.2. There are several well
characterised genes whose expression is responsive to temperature called CSPs. They are
known to increase their genetic expression in response to moderate, but not severe drops in
temperature. The first and best characterised one of these is Cirbp.

43
1.9.2: Cirbp – The classical temperature inducible gene
Cirbp the first cold-shock protein identified in mammalian cells (Fujita 1999)(Nishiyama et
al. 1997) has been extensively studied. Although its exact function is not known, it is
believed to operate as a RNA chaperone (Al-Fageeh and Smales 2009). It facilitates mRNA
translation upon exposure to cold stress. Being composed of one consensus carboxyl-
terminal region containing several AGG motifs, it is structurally very different to bacterial
CSPs (Sumitomo et al. 2012).
Although the Cirbp gene sequence is well characterised in mouse and human models,
Nishiyama et al demonstrated that Cirbp expression is down-regulated at elevated
temperature (37oC) in male germ cells of mice and humans. Additionally, a high level of
Cirp protein was detected immunohistochemically in the nucleus of primary spermatocytes.
(Nishiyama et al. 1998). Furthermore, De Leeuw et al showed that Cirbp modulates cell
cycle progression to protect the host from various stresses and possibly acts as an
oncoprotein as it shuttles from the nucleus to the cytoplasm, and affects the stability and
translation of its target mRNAs (De Leeuw et al. 2007).
Interestingly, the Cirbp gene has alternative promoters, as shown in mouse NIH-T3T cells
(Al-Fageeh and Smales 2009), which result in splice variants which can impact on the
promoter’s sensitivity and strength. Alternative splicing results in three major CIRP
transcripts varying in size due to different transcription start sites. Two of these transcripts
showed varying levels of expression, with the longest transcript (detected at 32oC) showing
a discrete expression and stability profile under mild hypothermic conditions and exhibited
internal ribosome entry segment (IRES)-like activity (Al-Fageeh and Smales 2009).
Another well reported CSP is Rbm3 which is another member of the glycine rich RNA
binding family. It has been suggested that Rbm3 is involved in regulation via the alteration
of miRNAs (Dresios et al. 2005). The 5’UTR of Rbm3 has been extensively investigated
by Mauro and co-workers and they have identified 13 ORFs from a 720nt cDNA leader
sequence and an IRES element, both of which may contribute to cold stress responsiveness
(Chappell et al. 2001) (Chappell and Mauro 2003).
The presence of an IRES element was revealed after deletion and mutation studies and
demonstrate 4 cis-acting elements within this 5’UTR that most likely bind different

44
cyotoplasmic proteins. When comparing IRES activity between 37oC and 33
oC it was
shown to be enhanced up to 5-fold depending on the cell line. They also showed that Rbm3
enhanced cap-dependant mRNA translation at 33oC compared to 37
oC (Chappell et al.
2001).
1.10: Promoter Analysis – Bioinformatics
Integrated genome databases--such as the UCSC, Ensembl and NCBI MapViewer
databases - and their associated data querying and visualisation interfaces (e.g. the genome
browsers) transformed the way that molecular biologists, geneticists and bioinformaticists
analyse genomic data (Schattner 2009) (Teufel et al. 2006).
As sequence entries in the major genomic databases currently rise exponentially, the gap
between available, deposited sequence data and analysis by means of conventional
molecular biology is rapidly widening, making new approaches of high-throughput
genomic analysis necessary. At present, the only effective way to keep abreast of the
dramatic increase in volume of sequence information is to apply bio-computational
approaches (Ecker et al. 2012).
How DNA regulation can be accomplished over long distances has long been intriguing.
Current data indicates that although the mechanisms by which these diverse regulatory
elements affect gene transcription may vary, an underlying feature is the establishment of
close contacts or chromatin loops (Dean 2011). These elements were shown to be often
separated from target genes by distances that can reach 100 kb (Dean 2011), therefore it is
difficult to analyse promoter sequences that have no defined boundaries.
When subjecting a promoter sequence to experimental scrutiny, whether it is a putative
promoter segment, enhancer or any proposed regulatory sequence, subsequent analysis
revolves around finding out answers to various questions.
Some examples include; why and how does it drive expression, which important
transcription factors (TFs) bind to the promoter sequence, why does that arrangement work
in one organism and not in another, why do some promoters regions have TATA boxes
while some have CpG islands architecture.

45
When a protein is needed the cell machinery signals transcription, this is facilitated by
transcription factors. As TFs play an essential role in promoter regulation a natural question
to ask is what transcription factors (TFs) bind to a promoter sequence to gain an insight into
promoter-TF interactions and functionality (Stewart et al. 2012). We now know that the
tissue-specific expression of a particular gene is the result of the presence of a particular
constellation of TFs in the cell nucleus.
But how do the transcription factors themselves come to be expressed in a tissue-specific
manner? In many cases, the genes for transcription factors are activated by other
transcription factors and now we know that transcription factor cascades are responsible for
coherent expression (Nagore et al. 2013) (Handstad et al. 2012).
The aim in deciphering the landscape of the promoter is to establish what the minimal
sequence is, that allows functionality, or can mutations be introduced along the promoter
region to hinder or indeed increase transcriptional rates and can these promoters and their
cognate TFs be further engineered.
Traditional methods like gel retardation, electrophoretic mobility shift assay (EMSA) or
DNA footprinting have been used to identify a region of DNA which a transcription factor
can bind, but they suffer due to TFs binding to ill-defined sites/motifs. One way to
circumvent this is through Chromatin Immunoprecipitation (ChIP), in which a cross-
linking fixing agent such as formaldehyde is used to covalently-link proteins and DNA
complexes. After cross-linking, cells are sonicated and sheared to generate ~500bp
fragments which can be separated using a specific antibody. Then these antigen-antibody
interactions can then be precipitated using beads with an affinity to the chosen antibody.
Lastly, reversing the cross-links with a heat step 65oC for 12-18 hours typically releases the
DNA (Handstad et al. 2012).
Ding and co-workers have developed novel approaches such as (ChIPModule and
SIOMICS) to systematically discover transcription factors and their related cofactors from
ChIP-seq data. Some methods heavily rely on well annotated motifs even though the
number of established motifs is limited. Interestingly, de novo motif discovery methods
often neglect underrepresented motifs in ChIP-seq peak regions. To address this the group
created SIOMICS and it was shown to be advantageous in terms of speed, increasing the

46
number of known cofactor motifs predicted in experimental data sets and reducing the
number of false-positive motifs predicted in random data sets. The SIOMICS software is
freely available at (http://eecs.ucf.edu/∼xiaoman/SIOMICS/SIOMICS.html) (Ding et al.
2013) (Ding, Hu and Li 2014).
Other previous web-based tools such as MEME and DREME, that can process large
eukaryotic datasets in a timely manner, were described by Bailey and Machanick and they
run two complementary motif discovery algorithms on the input data and use the motifs
they discover in subsequent visualisation platforms, binding affinity and identification
steps. DREME is available as part of the MEME Suite of motif-based sequence analysis
tools (http://meme.nbcr.net) (Machanick and Bailey 2011) (Bailey 2011).
Many genes have been extensively studied and co-regulated gene networks have been
experimentally and computationally researched in the ways mentioned. Now entire
websites and software packages exist whereby genes and indeed more importantly for this
project, their adjacent promoters can be analysed. Furthermore, there are only two
promoter-specific landscape studies (Carninci et al. 2006) (Sanyal et al. 2012), they report
extensively across various mammalian cells, however, neither were CHO specific.
Performing comparisons between these unknown sequences against known regulatory
motifs, putative cis-elements and consensus sequences can aid the mapping an unknown
promoter region.
See table 1.10 for a list of existing bioinformatic tools. This is all made possible by the
revolutionary ChIP-seq and Ref-seq strategies (Mimura et al. 2014).

47
Table 1.10: List of existing online bioinformatics tools available.
Motif Search Tools Promoter analysis databases
Motiffinder from TAIR UCSC
Weeder Web AGRIS
MotifSampler AtProbe
GeneSprings AthaMap
MEME/DREME DoOP
TAIR Pattern Match PlantCare
Genomatix PLACE
BioProspector Transfac
Improbizer CBRC
Toucan 2 CSHL
ALGEN:PROMO RSAT
1.10.1: Identifying and locating transcriptional elements
Enhancers, silencers, insulators and transcription factors are DNA elements that play
central roles in regulation of the genome that are crucial for appropriate control of gene
expression but unfortunately, as mentioned, can be located many kb from the genes that
they regulate (Raab and Kamakaka 2010, Bondarenko et al. 2003), making it difficult to
identify these elements.
Building or mapping a framework for promoter architecture can identify conserved
sequences and may constitute vital regulatory sequence. The aim in searching the promoter
landscape for transcription factor bind sites (TFBS) is to establish what sequence confers
functionality. In silico programs look for TFBS motifs in DNA sequence from several
species, upstream of the start codon ATG.
The specificity of a transcription factor can be described by pattern matching. Two
alternative formats are currently used to describe regulatory signals: strings (including the
IUPAC alphabet for ambiguous nucleotides) or position-specific scoring matrices (PSSM)
(van Helden 2003).
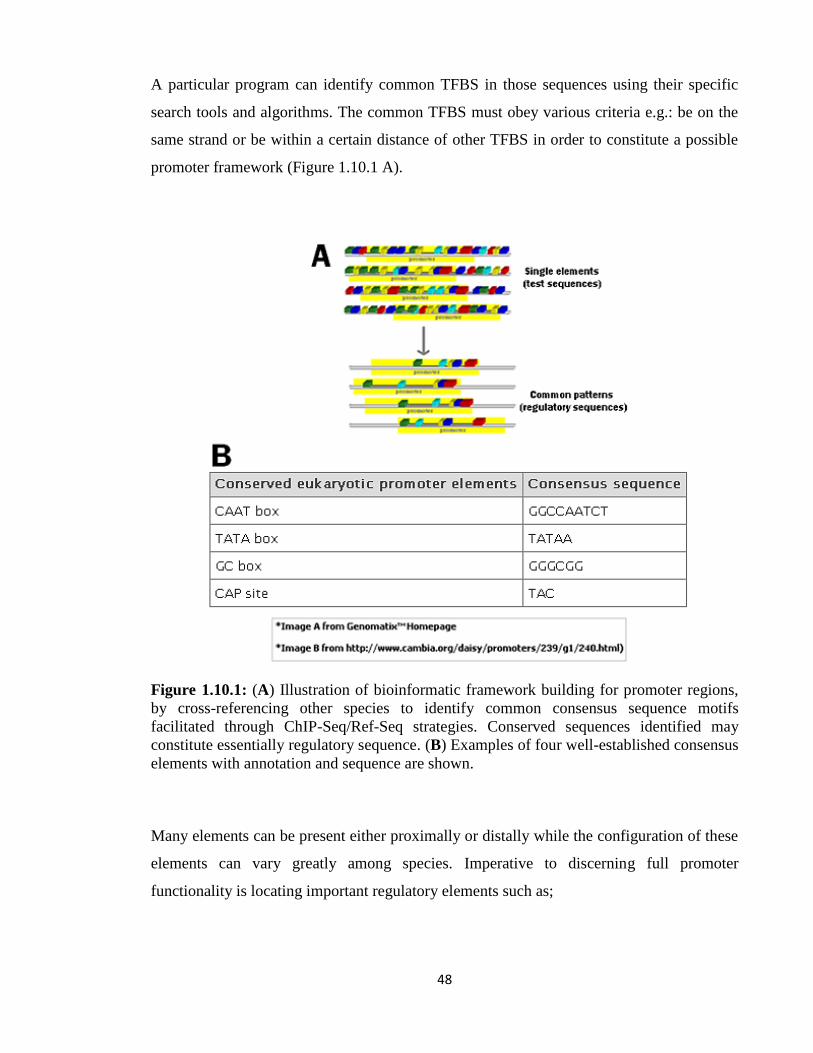
48
A particular program can identify common TFBS in those sequences using their specific
search tools and algorithms. The common TFBS must obey various criteria e.g.: be on the
same strand or be within a certain distance of other TFBS in order to constitute a possible
promoter framework (Figure 1.10.1 A).
Figure 1.10.1: (A) Illustration of bioinformatic framework building for promoter regions,
by cross-referencing other species to identify common consensus sequence motifs
facilitated through ChIP-Seq/Ref-Seq strategies. Conserved sequences identified may
constitute essentially regulatory sequence. (B) Examples of four well-established consensus
elements with annotation and sequence are shown.
Many elements can be present either proximally or distally while the configuration of these
elements can vary greatly among species. Imperative to discerning full promoter
functionality is locating important regulatory elements such as;

49
CAAT box - A consensus sequence close ~80 bp from the TSS start point (+1). It
plays an important role in promoter efficiency, by increasing its strength, and it
seems to function in either orientation. This box is replaced in plants by a consensus
sequence called the AGGA box
TATA box - A sequence usually located ~25 bp upstream of the TSS. The TATA
box tends to be enclosed by GC rich sequences and binds RNA polymerase II and a
series of transcription factors (TFII and TBP) to form an initiation complex
GC box - A sequence rich in guanidine (G) and cytosine (C) nucleotides, is
regularly found in multiple copies in the promoter region and the ubiquitous SP1 TF
usually binds to it
CAP/TSS site - A transcription initiation sequence or start point defined as +1, at
which the transcription process actually starts
Enhancers – No defined locus and orientation independent but crucial to full
functionality and activity diversity by binding to multiple TFs at any given time.
There is currently an interest in studying and isolating enhancers, which can be
attached to heterologous promoter regions to augment transcriptional activity and in
some cases to provide additional levels of control (for example; to confer tissue-
specific or stage-specific expression of a gene)
The sequencing of a large number of genomes has greatly stimulated the development of
computational methodology (in silico) for the identification of signals and patterns in DNA
preserved over evolution as they can be indicative of functionality (Farre et al. 2003).
The web resource Regulatory Sequence Analysis Tools (RSAT) (http://rsat.ulb.ac.be/rsat)
offers a collection of software tools dedictated to the prediction of regulatory sites in non-
coding DNA sequences. These tools include sequence retrieval, pattern discovery and
genomic scale matching, map drawing, random sequence generation plus many more. It
currently holds >100 fully sequenced genomes which are updated regularly from Genbank
(van Helden 2003).
1.11: Engineering of important cellular pathways
Having explored the various means of controlling gene expression using promoters,
regulatory elements and exogenous inducible molecules, we now explore the pathways they
can be used to control.

50
1.11.1: Engineering of cellular proliferation and cell cycle arrest
It has been shown that recombinant protein yields from CHO cell fermentations are
correlated to cell number and longevity (Sunley and Butler 2010). The four phases of
growth for any cell in culture [lag, log, stationary, decline] can be targeted to increase the
longevity of batch cultivation. Ideally, a short lag phase where cells are acclimatise to the
environment, followed by a rapid log/exponential growth phase, where the cells grow to
maximum density as fast as possible so that you get a longer stationary phase. During this
extended stationary phase they can concentrate their metabolic energy to increasing specific
protein productivity and not on other cellular functions.
Care must be taken to monitor the possibility of uncontrolled proliferation beyond a certain
density where nutrient depletion and toxic metabolite waste can cause cell death and
degrade the valuable protein product (Zeng, Deckwer and Hu 1998). The transfer of a
population of cells from a typical cell cycle to a temperature shifted biphasic cycle (Figure
1.11.1) involves reducing the lag and exponential phases, getting to high cell density
(HCD) quickly. This extends the stationary phase, which is the main production phase, as
cellular energy is being utilised for protein synthesis and not cellular growth (Fox et al.
2005) (Fogolin et al. 2004) (Tan et al. 2008) (Kim and Lee 2007) (Schatz et al. 2003).
Figure 1.11.1: Typical and more idealistic biphasic growth curve of cells in culture.
[1=Lag, 2= Exponential, 3= stationary and 4= Decline/death phases].
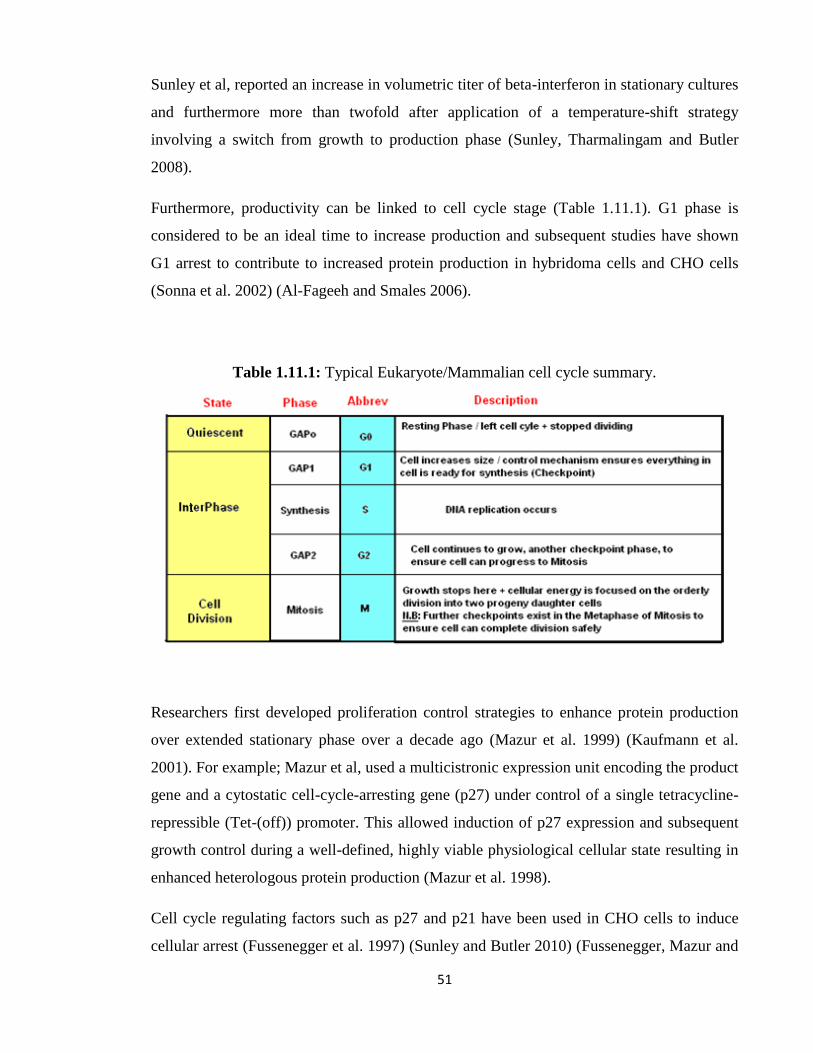
51
Sunley et al, reported an increase in volumetric titer of beta-interferon in stationary cultures
and furthermore more than twofold after application of a temperature-shift strategy
involving a switch from growth to production phase (Sunley, Tharmalingam and Butler
2008).
Furthermore, productivity can be linked to cell cycle stage (Table 1.11.1). G1 phase is
considered to be an ideal time to increase production and subsequent studies have shown
G1 arrest to contribute to increased protein production in hybridoma cells and CHO cells
(Sonna et al. 2002) (Al-Fageeh and Smales 2006).
Table 1.11.1: Typical Eukaryote/Mammalian cell cycle summary.
Researchers first developed proliferation control strategies to enhance protein production
over extended stationary phase over a decade ago (Mazur et al. 1999) (Kaufmann et al.
2001). For example; Mazur et al, used a multicistronic expression unit encoding the product
gene and a cytostatic cell-cycle-arresting gene (p27) under control of a single tetracycline-
repressible (Tet-(off)) promoter. This allowed induction of p27 expression and subsequent
growth control during a well-defined, highly viable physiological cellular state resulting in
enhanced heterologous protein production (Mazur et al. 1998).
Cell cycle regulating factors such as p27 and p21 have been used in CHO cells to induce
cellular arrest (Fussenegger et al. 1997) (Sunley and Butler 2010) (Fussenegger, Mazur and

52
Bailey 1997) (Fussenegger, Mazur and Bailey 1997). Bi et al, reported that in p21 (CIP1)-
arrested cells production of antibody from a stably integrated lgG4 gene was enhanced
approximately fourfold more than in proliferating cells (Bi et al. 2004). Conversely, factors
such as E2F-1 and the oncogenic protein c-myc responsible for cell cycle progression have
been successfully applied to develop rCHO cell lines capable of robust growth and
maximum IVCC (Kuystermans and Al-Rubeai 2009).
In addition to the cell cycle genes mentioned, other gene targets such as; valosin-containing
protein (VCP) knockdown was shown to be detrimental to cell viability in CHO and has
since been used as in in-house control when testing cellular viability (Doolan et al. 2010).
Whereas overexpression of malate dehydrogenase II (MDH II) in CHO cells resulted in
increases in intracellular ATP and NADH, and up to 1.9-fold improvement in integral
viable cell number (IVC) (Chong et al. 2010).
Van Opstal et al reported that addition of a growth inhibitor during mitosis and up to 2
hours after mitosis resulted in arrest of CHO cells in early G1 phase. This was deduced
from the expression of cyclins A and D post-addition. After 24 h of cell cycle arrest, cells
highly expressed the cleaved caspase-3, a central mediator of apoptosis. These results
demonstrate that protein kinase B (PKB) activity in early G1 phase is required to prevent
the induction of apoptosis (van Opstal et al. 2012). This leads us onto the next potential
engineering pathway.
1.11.2: Programmed cell death (PCD) engineering
Another strategy in mammalian engineering is the manipulation of programmed cell death
(PCD) which is important, as it affects the viable cell concentration as well as the product
quality and quantity (Arden and Betenbaugh 2004).
Cellular turnover and death occurs as either necrosis (more sudden and passive) or two
types of PCD; apoptosis (PCD type I) and autophagy (PCD type II). However, inhibition of
apoptosis does not necessarily guarantee the blocking of autophagy-mediated cell death due
to the independency between both processes (Kim, Kim and Lee 2012) (Nikoletopoulou et
al. 2013).

53
Mammalian cells often undergo programmed cell death upon exposure to stresses
encountered in bioreactors. Cell death is triggered by numerous factors like nutrient
depletion, shear stress, elevated osmolarity and accumulation of toxic by-products. The
implementation of strategies to control PCD through apoptosis, prevent the onset of these
stresses and enhance culture productivities represents a major goal of biotechnologists.
Research in apoptosis has increased substantially since the early 1990s and is highly
examined strategy at present (Krampe and Al-Rubeai 2010).
Apoptosis is a biochemical process of programmed cell death (PCD type I). It is a natural
process whereby cellular population homeostasis is maintained by eradicating damaged or
ill-functioning individual cells. Approximately 50-70 billion cells undergo apoptosis in a
human adult daily, which involves complex signaling pathways. This apoptotic signaling is
mediated by a caspases-cascade system in two main networks, which is a series of
proteolytic cascades activated by cleaved caspases (Figure 1.4.2). Caspases can be divided
into two types, effector caspases and initiator caspases (Kim, Kim and Lee 2012).
Apoptotic engineering, be it pro or anti-apoptotic based continues to be a highly desirable
method to control via the various pathway proteins (caspases, Bcl-proteins) and is linked to
mitochondria permeability. The pro-apoptotic Bcl-2 proteins Bad, Bid, Bax, and Bim may
reside in the cytosol but translocate to mitochondria following death signaling, where they
promote the release of cytochrome c (Ow et al. 2008).
Links between cancer and apoptosis have been apparent for some time, the discovery of an
agent that selectively kills tumor cells and not normal cells is the holy grail for cancer
researchers. Even links between transcription factors and apoptosis have been made. For
example, more recently the role of Pokemon (POK erythroid myeloid ontogenic actor),
transcription factor with proto-oncogenic activity was identified. Zhang et al, demonstrated
that it might serve as an important mediator of crosstalk between intrinsic and extrinsic
apoptotic pathways in hepatocellular carcinoma (HCC) cells (Zhang et al. 2013).
Gillissen et al reported that XIAP targeted therapy can be used to overcome TRAIL-
resistant (after the loss of Bak/Bax function) carcinoma cells. This can be achieved by
direct or indirect inhibition of XIAP by RNAi, Mithramycin A or by the SMAC mimetic
LBW-242 as well as inhibition of the proteasome by the drug Bortezomib (Gillissen et al.
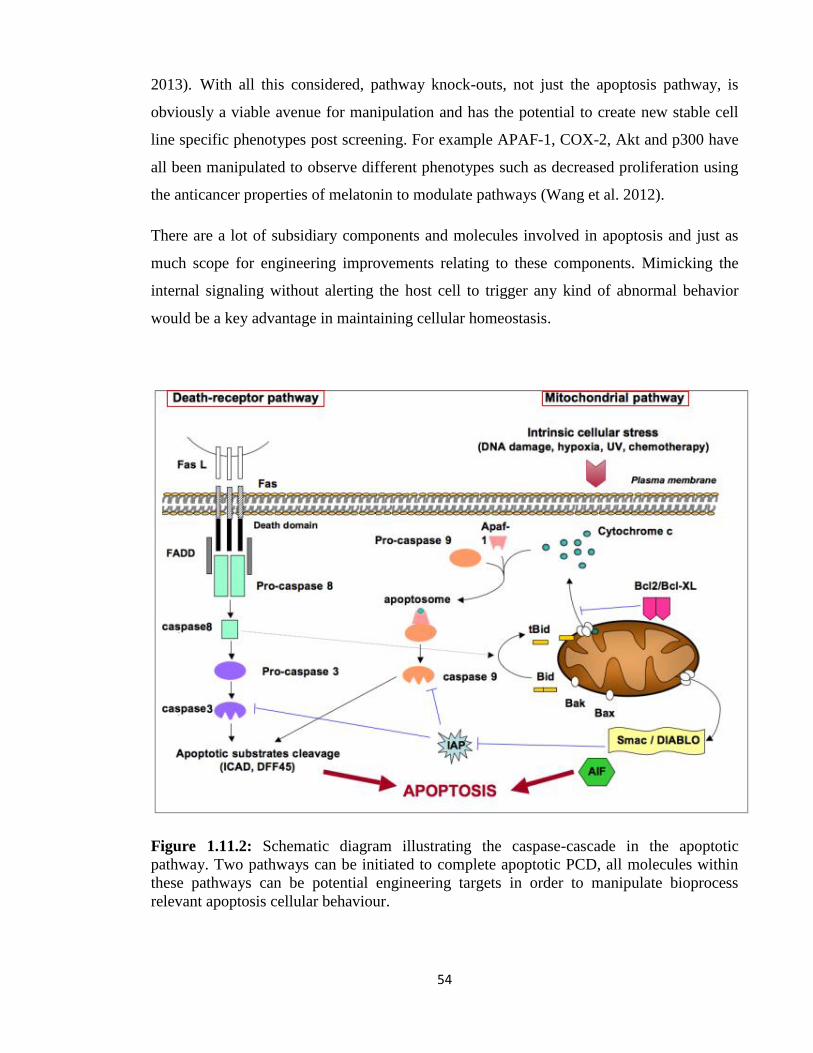
54
2013). With all this considered, pathway knock-outs, not just the apoptosis pathway, is
obviously a viable avenue for manipulation and has the potential to create new stable cell
line specific phenotypes post screening. For example APAF-1, COX-2, Akt and p300 have
all been manipulated to observe different phenotypes such as decreased proliferation using
the anticancer properties of melatonin to modulate pathways (Wang et al. 2012).
There are a lot of subsidiary components and molecules involved in apoptosis and just as
much scope for engineering improvements relating to these components. Mimicking the
internal signaling without alerting the host cell to trigger any kind of abnormal behavior
would be a key advantage in maintaining cellular homeostasis.
Figure 1.11.2: Schematic diagram illustrating the caspase-cascade in the apoptotic
pathway. Two pathways can be initiated to complete apoptotic PCD, all molecules within
these pathways can be potential engineering targets in order to manipulate bioprocess
relevant apoptosis cellular behaviour.

55
Because caspases play a vital role in apoptosis regulation including induction, transduction
and amplification of these signals, then suppression of caspase activation is a promising
strategy. We will discuss in more detail the role of various apoptotic–related genes and
single gene specific engineering targets in section 1.9.
In addition, defective apoptotic processes have been implicated in an array of diseases
(Eschenburg et al. 2012) (Saleem et al. 2013) (Ndozangue-Touriguine et al. 2008).
Disproportionate apoptosis levels causes atrophy (partial wearing of bodily components),
while a deficient amount results in uncontrolled cell proliferation, leading to cancer in
extreme cases.
Autophagy is a catabolic process that takes place through a caspase-independent lysosomal-
mediated degradation pathway and is distinguished from apoptosis (Kim and Lee 2012). It
is a conserved pathway that delivers intracellular materials into lysosomes for degradation,
is involved in development, aging, and a variety of diseases. Up until recently, the focus of
cell death engineering was on apoptosis solely, whereas now more studies involving
engineered CHO cells are being explored, for example; Hwang et al observed the
accumulation of a common autophagic marker, a 16 kDa form of LC3-II and was found to
take place in two antibody-producing CHO cell lines, Ab1 and Ab2 (Hwang and Lee 2008).
They also show that overexpression of Bcl-xL or Akt could delay the autophagic cell death
induced by nutrient exhaustion (Hwang and Lee 2009).
Hyperosmotic stress was found to trigger autophagy also. Han et al studied two rCHO cell
lines, producing antibody and erythropoietin and both were subjected to hyperosmotic
stress resulting from NaCl addition (310-610 mOsm/kg). They found elevated amounts of
caspases 3 and 7, fragmented chromosomal DNA. Concurrently, hyperosmolality increased
the level of accumulation of LC3-II, a widely used autophagic marker measured by western
blot analysis and confocal microscopy (Han et al. 2010).
In summary, by combining information on the interplay between necrosis, apoptosis and
autophagy so we can obtain more specific data of their interwoven roles which can perhaps
prove useful to increase CHO cell performance in future studies. For example, a recent
report by Zou et al reveal a previously unidentified role for autophagy in protection against
necrosis triggered by pathogenic bacteria in C. Elegans and implicate that such a function
56
of autophagy may be conserved through the inflammatory response in diverse organisms
(Zou et al. 2014).
1.11.3: Effect of low Temperature on culture performance
It has been well documented that cultures grown at 37oC and are then shifted to mild
hypothermic temperature of 32-28oC, slows growth and metabolism of CHO cells, which
permits extended viable culture times. As a result, the cellular machinery can direct its
energy on protein synthesis and thus potentially increase productivity (Lim et al. 2010,
Fussenegger, Mazur and Bailey 1997, Kaufmann et al. 1999) (Recillas-Targa 2006).
Additionally, improved cell viability, specific productivity and reduced nutrient uptake rate
are other beneficial culture traits that have been reported (Furukawa and Ohsuye 1998)
(Yoon, Hwang and Lee 2004) (Schatz et al. 2003) (Fogolin et al. 2004). Although, some
early reports did demonstrate the opposite or no significant increase at all. For example; the
cultivation of hybridoma cells at low temperatures resulted in a decrease of specific
monoclonal antibody productivity (Sureshkumar and Mutharasan 1991).
Although this may appear to be a clear cut mechanism of control over cellular growth and
consequently productivity, it can vary hugely depending on cell type/line and the protein
product being expressed. The underlying effects of temperature shift at a cellular and
molecular level remain poorly understood (Recillas-Targa 2006) (Recillas-Targa 2006).
The effects caused to cell from lowering temperature on CHO culture performance which
doesn’t require any additional genetic engineering on the cell, makes it an attractive from
the outset in improving mammalian cell bioprocesses. Many cells respond favourably in
culture, even before any genetic manipulation is undertaken. Two studies on protein
productivity showed that, at reduced temperature CHO cells exhibited a state close to that
of growth arrest and increased protein production levels in SEAP and EPO were
reproducible (Kaufmann et al. 1999) (Yoon, Song and Lee 2003).
Mammalian cells respond to low temperature (mild hypothermia) by synthesising/up-
regulating cold-shock proteins (CSPs) to aid in cellular function. During this change in
environmental temperature, other proteins that work at the customary physiological

57
temperature of 37oC, have been shown to have their transcription and translational
machinery suppressed (Underhill and Smales 2007).
Cold-shock proteins (CSPs) such as CspA, Rbm3, Cirbp, RecA, quickly became targets for
biotechnologists. Two notable CSP genes from the glycine-rich protein (GRP) family are
CIRBP (cold-inducible RNA binding protein) and RBM3 (RNA binding motif protein 3)
which showed upregulation at low temperature (Nishiyama et al. 1997). CSPs share the
cold-shock domain (CSD) as a common motif and are believed to function as RNA/DNA
chaperones, assisting replication and translation via protein folding at low temperatures
(Jiang et al. 1997).
As mentioned in section 1.9.2, Cirbp has since become a standard model for inducible
expression strength in reduced temperature culture experiments and thus could be used as a
tool to assess the prospective temperature induciblity of other genes (Underhill and Smales
2007) (Hong et al. 2007) (Al-Fageeh and Smales 2009). However, CSPs are not fully
conserved across species and their effects are quite variable between cell lines. There are
~30 identified CSPs in E.coli (Gualerzi et al. 2003).
Fox et al hypothesised that improving total production of recombinant protein should be
achieved by stimulating cells to actively grow at low temperature. They reported 7.7 and
4.9-fold increases in total interferon-gamma protein production in CHO cells grown under
stimulated (fibroblast growth factor or insulin supplemented in the serum) hypothermic
conditions compared with the control cultures grown at 37oC (Fox et al. 2005). In another
study by the same group, Tan et al, report that following stable overexpression of Cirbp,
final IFN-gamma titre by production CHO cells was increased by 40% compared with
current temperature-based strategies alone. Furthermore, there was no decrease in cell
growth or recombinant-protein glycosylation quality (Tan et al. 2008).
Much still remains to be discerned about cold adaption at a molecular level. Recent efforts
topics include; measuring the effects of different acclimation periods (duration of cold-
adaption), the effects of lower temperature on aggregate formation in cultures of IgG
producers and how an irregular unfolded protein response (UPR) caused by cold-shock
correlates to misfolding of proteins (Gomez et al. 2012).

58
The response of cells at a genomic level, although poorly understood, dominates the
literature rather than studies into the proteome of a cell. Kaufmann et al were one of the
pioneers in examining the CHO proteome. They saw distinct changes in protein expression
by 2-D polyacrylamide electrophoresis of cells grown at 37oC and 30
oC. These changes in
the proteome suggest that mammalian cells respond actively to low temperature by
synthesizing specific cold-inducible proteins and support the hypothesis that stress signals
must be converted into biochemical signals to alter gene expression patterns of CSPs,
presumably resulting from changes in post-translational protein modifications (Kaufmann
et al. 1999).
Recent studies from researchers within the NICB have reported a number of differentially
expressed proteins and RNAs involved in temperature shift culture over timecourse
experiments (Kumar et al. 2008b) (Kumar et al. 2008a). The resulting dataset has been very
useful for creating target lists for follow up functional validation of important temperature
related proteins.
In parallel with these findings, we aim to combine the already positive intrinsic attributes of
mild hypothermic shifting of culture temperature shift seen above with the isolation of
temperature-sensitive CHO specific promoters in this project, which can be used in parallel
for increased bioprocess performance. In conclusion, although poorly understood, interest
in the cold-shock/temperature shift as a method of increasing bioprocessing, therefore is
really heating up.

59
1.12: MicroRNA roles in gene regulation and engineering potential
1.12.1: Background and scope
Since the discovery of RNAi (section 1.5.4) major attention has focused on studying
miRNA (microRNA) and siRNA (small interfering RNA). Basically hidden in the genome
until recently, miRNAs like siRNAs are non-coding small RNAs and are typically 19-25
nucleotides long. MicroRNAs have a major impact on most biological processes and their
ability of to influence gene expression is now recognised as a fundamental layer of
regulation within the cell (Barron et al. 2011).
MicroRNAs (miRNAs) are strongly implicated in the global regulation of gene expression,
and, in this regard, they consequently affect metabolic pathways on every regulatory level
in different species.
This characteristic makes miRNAs a promising target for cell engineering, while a key
advantage of miRNAs, in contrast to most cell-engineering approaches that rely on
overexpression of regulatory proteins, is that they do not compete for the translational
machinery that is required to express the recombinant product (Muller, Katinger and
Grillari 2008) (Hackl et al. 2011). Furthermore, Maccani et al showed that mature
microRNAs were predominantly upregulated in the producing cell lines compared to non-
producer lines (Maccani et al. 2014).
MicroRNAs with their ability to regulate complex pathways that control cellular behavior
and phenotype have been proposed as potential targets for cell engineering in the context of
optimisation of biopharmaceutical production cell lines and for improving understanding of
mammalian cell physiology.
They are also attractive because of the ability of a single miRNA to influence more than
one target gene. This is due to imperfect base-pairing exempt of seed region; the seed
region constitutes 2-7 nucleotides from the 5’ end of the miRNA which binds with full
complementarity to a target mRNA. It has become apparent that the miRNA molecules
themselves are subject to sophisticated control during biogenesis and degradation (Jadhav
et al. 2013).

60
At present, around 16,000+ miRNAs have been identified across all species. These are
documented in online databases such as ‘mirBase’ and ‘mirWalk’ and used in a plethora of
software algorithms for miRNA:mRNA binding prediction in silico such as; ‘TargetScanS’
and ‘miRNAnda’. There are ~1700 miRNAs in the human genome estimated to be
targeting approximately 60% of genes.
In parallel, CHO miRNA identifications have been growing (Wu 2009)(Hernandez Bort et
al. 2012, Gammell et al. 2007) (Doolan et al. 2012). Furthermore, Hackl et al identified 387
miRNAs in CHO after extensive profiling and next-generation sequencing and numbers
are sure to increase in the future (Hackl et al. 2011).
An interesting feature of miRNA genomic structure (Figure 1.12.1) is that many miRNAs
exist in clusters that are co-expressed. miRNAs are predominantly transcribed by RNA
PolII though some are PolIII-dependent with A/B boxes being identified upstream. It is
estimated that ~50% of all miRNAs are located within introns of protein encoding genes
with the remainder residing in intergenic regions (Barron et al. 2011).

61
Figure 1.12.1: Genomic organisation of miRNA genes. There are four classes of
organization. (1) Intergenic miRNAs, are located in isolation from other genes and occur as
either a monocistronic (a) or polycistronic unit (b). Their transcription is driven by their
own promoter upstream and may be either RNA PolII- or PolIII-dependent. (2) Intronic
miRNAs are located within an intron of a protein-coding gene, again as monocistronic or
polycistronic units. They may be under the control of their own independent promoter or
may be co-transcribed with the host gene. In the latter case they are processed into pre-
miRNAs by the microprocessor complex subsequent to intron splicing. (3) Mirtrons exist in
short introns and differ from other intronic miRNAs in that they by-pass processing by
Drosha and are exported directly to the cytoplasm to engage Dicer. They are co-expressed
with the host gene. (4) Exonic miRNAs are located in an exon and are independently
transcribed from their own promoter. [Black arrow = host gene promoter start site, Black
arrow with lines = miRNA promoter start site, Diamond-shapes with lines = introns, E1/2
= exons] (Barron et al. 2011).
To study the role of miRNAs in the regulation of CHO cell growth, qPCR, microarray and
quantitative LC-MS/MS analysis were utilised for simultaneous expression profiling of
miRNA, mRNA and protein (Clarke et al. 2012). This was the basis for the sampleset used
in this project, where 51 miRNAs were identified to be associated with increased growth
rate (35 miRNAs upregulated and 16 miRNAs downregulated). For other specific miRNAs
for used in engineering recently (Table 1.12.1).
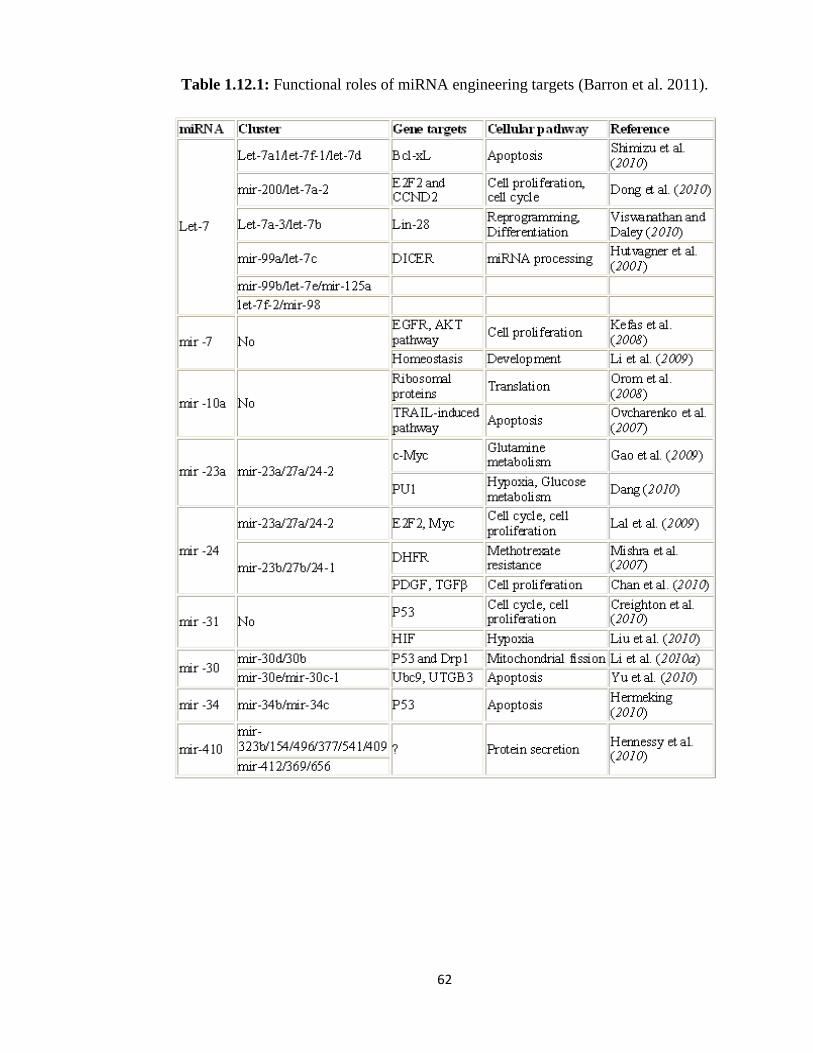
62
Table 1.12.1: Functional roles of miRNA engineering targets (Barron et al. 2011).

63
1.12.2: The miR-17-92 cluster
Clusters of miRNAs are perhaps a result of evolutionary duplication events (Lim et al.
2003) (Yu et al. 2006), more specifically, they are closely linked to early evolution of the
vertebrate lineage (Tanzer and Stadler 2004). Clustering and conservation patterns reported
by Altuvia et al raised the proportion of clustered human miRNAs that are less than 3000 nt
apart to 42%. This suggested that the clustering of miRNA genes was higher than currently
acknowledged at the time (Altuvia et al. 2005). Identification of miRNA family members
could be an important requirement for understanding the full mechanism of post-
transcriptional regulation as they share the same vital seed sequence.
One of the better characterised oncogenic miRNAs is the polycistronic miR17-
92/oncomiR-1 (Olive et al. 2009). It has been identified as a powerful cancer driver that
coordinates the activation of multiple oncogenic pathways, such as the PI3K and NFκB
pathways (Jin, Lai and Xiao 2014).
The pre-miR transcript contains 6 stem-loop hairpin structures that ultimately generate 6
mature miRNAs: miR-17, miR-18a, miR-19a, miR-20a, miR-19b1 and miR-92-1, with
miR-19a acting as an internal brake that opposes the oncogenic activity of the others in
some cancer contexts (Zeitels and Mendell 2013). Furthermore, Olive and co-workers have
done considerable work on this cluster and its molecular dissection in many oncogenic and
apoptotic (interacts with PTEN and Bim apoptotic components) settings with results
suggesting that miR-17-92 can be harnessed to enhance the efficacy of T cell-based tumor
therapy (Olive et al. 2009) (Jiang et al. 2011) (Olive et al. 2013).
Relating to this project Clarke et al, identified the miR-17-92 as differentially expressed in
fast growing CHO cell lines compared to slow cell lines, each of the cluster members being
positively correlated with increasing growth rates (Clarke et al. 2012).

64
1.13: XIAP is an important gene in apoptosis regulation
1.13.1: Background
There exists a family of apoptosis inhibitors called IAPs (inhibitors of apoptosis) that are
well documented. During the process of programmed cell death or apoptosis, caspases
become activated and cause a cascade of events that eventually destroy the cell. X-linked
inhibitor of apoptosis or XIAP is the most potent caspase inhibitor encoded in the
mammalian genome and has the most potential from a cellular engineering perspective in
apoptosis prevention in mammalian engineering (Wilkinson et al. 2004).
Recent evidence showed that inhibitor of apoptosis (IAP) proteins are frequently
overexpressed in cancer and their expression level is implicated in contributing to
tumorigenesis, chemoresistance, disease progression and poor patient-survival.
In addition, Gyrd-Hansen et al showed that IAPs contain an evolutionary conserved
ubiquitin binding domain that regulates NFκB (Gyrd-Hansen et al. 2008). Another example
by Smolewski et al, found elevated cellular levels of cIAP1, cIAP2, XIAP and Survivin
correlated with a progressive course of chronic lymphocytic leukemia. Thus, targeting IAPs
with small-molecule inhibitors by their antisense approaches or natural IAP antagonist
mimetics may be an attractive strategy of anti-cancer treatment (Smolewski and Robak
2011).
One of these IAPs became the focus of the second part of this thesis, XIAP. XIAP is
translated by a cap-independent mechanism of translation initiation that is mediated by a
unique internal ribosome entry site (IRES) sequence element located in its 5' untranslated
region which facilitates its anti-apoptotic function during any kind of induced-cellular
stress like radiation and chemotherapy, making it an attractive therapeutic target (Devi et al.
2004). This also allows XIAP mRNA to be actively translated during conditions of cellular
stress when the majority of cellular protein synthesis is inhibited (Holcik 2003).

65
1.13.1: Structure and Function
The XIAP gene encodes a protein that belongs to a family of 8 apoptotic suppressor
proteins. Members of this family share a conserved motif termed the baculovirus IAP
repeat, which is necessary for their anti-apoptotic function. This protein was first shown to
function through binding to tumor necrosis factor receptor-associated factors TRAF1 and
TRAF2 and inhibits apoptosis induced by menadione, a potent inducer of free radicals, and
interleukin 1-beta which is a converting enzyme (Song et al. 1996).
The XIAP protein consists of 3 major types of structural domains. Firstly, there is the
baculoviral IAP repeat (BIR) domain consisting of roughly 70 amino acids, which
characterises all IAPs. Secondly, there is a UBA domain, allowing XIAP to bind to
Ubiquitin (a regulatory protein found in most tissues and important regulator of
degradation, promotion and prevention of interactions between molecules) (Blankenship et
al. 2009). And lastly, there is a Zinc-binding domain, or a ‘Carboxy-terminal RING Finger’
(Duckett et al. 1998) (Deveraux and Reed 1999).
XIAP stops apoptotic cell death that is induced either by viral infection or by
overproduction of caspases. XIAP binds to and inhibits caspases 3, 7 and 9. The BIR2
domain of XIAP inhibits caspase 3 and 7, while BIR3 binds to and inhibits caspase 9
(Deveraux and Reed 1999). The UBA domain utilises E3 ubiquitin ligase activity and
enables IAPs to catalyse ubiquination of innate caspase-3, or caspase-7 by degradation via
proteasome mode of action (Delhalle et al. 2003).
The most widely used strategy for targeting IAP proteins is based on mimicking the natural
IAP antagonist, Smac/DIABLO. XIAP was shown to be inhibited by DIABLO (Smac) and
HTRA2 (Omi), two death-signaling proteins released into the cytoplasm by the
mitochondria (Eschenburg et al. 2012). Smac/DIABLO is a mitochondrial protein and has
been shown to be a negative regulator of XIAP enhancing apoptosis by binding to XIAP
and subsequently preventing it from binding to caspases (Wilkinson et al. 2004).
Mutations in XIAP mRNA sequence have been shown to result in X-linked
lymphoproliferative syndrome. X-linked lymphoproliferative disease (XLP) is an inherited
immunodeficiency, involving primarily T and natural killer (NK) cells, which in the
majority of cases exacerbates following exposure to Epstein-Barr virus (EBV)(Schuster and

66
Kreth 2000). Furthermore, alternate splicing resulted in multiple transcript variants while
pseudogenes of this gene are found on chromosomes 2 and 11 (Bassiri et al. 2008).
However, mutations affecting the RING finger do not noticeably affect apoptosis,
indicating that the BIR domain is sufficient for the protein’s function. When inhibiting
caspase-3 and caspase-7 activity, the BIR2 domain of XIAP binds to the active-site
substrate groove, blocking access of the normal protein substrate that would result in
apoptosis (Eckelman, Salvesen and Scott 2006, Huang et al. 2001). XIAP distinguishes
itself from the other human IAPs because it is able to effectively prevent cell death due to;
TNF-α, Fas, UV light, and genotoxic agents (Duckett et al. 1998).
1.14: Identifying miRNAs that regulate bioprocess-relevant phenotypes
Combining miRNA engineering with anti-apoptotic engineering is an attractive prospect in
bioprocessing and therapeutics, especially considering the role of the XIAP gene within
cancer disease states becoming more recently publicised (Ren et al. 2014). Developments
combining both have been promising, for example Liu et al reported that miR-7 targeted
and downregulated XIAP. Subsequent ectopic expression of XIAP then rescued the effects
induced by miR-7 on HeLa and C-33A cells (Liu et al. 2013).
Another study by Druz et al used nutrient depleted spent media, to induce apoptosis in
order to identify resultant miRNA expression post-induction using microarrays and
bioinformatics analysis. They reported up-regulation of the mouse miR-297-669 cluster and
focused on the pro-apoptotic role of mouse specific miR-466h and its capability to
modulate the apoptotic pathway in mammalian cells (Druz et al. 2011).
In a separate study, it was found that expression of miR-23b was reduced in brain cancer
Glioblastoma cells (GBMs). CHO cells were transfected with miR-23b mimics
subsequently leading to down-regulation of XIAP. Combined exposure of GBM cells with
Docetaxel and miR-23b mimics resulted in significantly increased apoptosis compared to
the drug alone. Reduced expression of miR-23b in GBMs, and subsequent deregulated
expression of XIAP may contribute to the ability of GBMs (especially faster growing lines
like SNB-19) to evade apoptosis at least partially. This highlighted that miR-23b may be a
67
promising candidate for the development of targeted treatment options in human Glioma
(Griffith, Kinsella et al, in preparation).
In summary, as a consequence of these findings plus other literature links between XIAP,
miRNA and apoptosis in human disease states (Gillissen et al. 2013) (Saleem et al. 2013)
(Ndozangue-Touriguine et al. 2008) (Smolewski and Robak 2011), we wanted to bridge a
connection between XIAP and the miRNAs that control its regulation in both human and
CHO as a means to improve bioprocessing based on anti-apoptotic engineering, in addition
to using endogenous promoters to improve transgene expression and will be explored in a
in the second part of this project.
1.14.1: Methods for identifying mRNA:miRNA interactions
A recent publication from Bort et al, detailed an extensive database of miRNAs. By using
clustering analysis they revealed groups of genes with similar expression patterns, which
were subjected to functional pathway analysis. In total, over 1400 mRNAs and more than
100 miRNAs were differentially regulated (p<0.05) in the batch culture at the beginning
relative to the end of the culture. Therefore, during batch or fed-batch cultivations it can be
expected that the transcription pattern of genes will change and that such changes may give
indications on the cellular state in terms of viability, growth, and productivity (Hernandez
Bort et al. 2012).
Although numerous bioinformatics tools exist (Watanabe et al. 2007) (Li et al. 2010) to
predict possible miRNA:mRNA interactions, true experimental validation of such
interactions can be difficult and laborious. See table 1.14.1 for a list of existing methods.
Due to the low degree of complementarity between the miRNA and its target region of
mRNA 3’UTR, in silico prediction programs are often imprecise and therefore not very
reliable for validation. In order to bridge the gap, iterative interactions between in silico and
experimental methods are being explored and are beginning to play a vital role in the
biological study of miRNAs (Chaudhuri and Chatterjee 2007).

68
Table 1.14.1: Methodology, description and reference for current miRNA isolation and
identification methods.
Method Description References
Gene Reporter Assays 3’UTR analysis with transcriptome/proteome using pre-
miRs and anti-miRs after modulation (Orom and Lund 2010)
IP of Ago2 proteins Pulldown using highly specific monoclonal antibodies (Beitzinger and Meister 2011)
Let-7 - Approach Using an endogenous Let-7 to isolate cDNA via base pair
complementary in vivo (Andachi 2008)
Biotinylated tagged miRNAs Bead Affinity purification using tagged miRNAs and
analysis with RT-qPCR (Orom and Lund 2007)
Digoxigenin (DIG) labelled
miRNAs
Another in vitro LAMP method, using anti-DIG antiserum
to isolate from Zebrafish and C.Elegans (Hsu and Tsai 2011)
TAP-Tar Tandem affinity method where miRNA:mRNA complexes
are IP’d using anti-Ago Ab and streptavidin beads in vitro (Nonne et al. 2010)
HITS-CLIP In vitro cross-linking of miRNA:mRNA complexes and
Ago2 proteins (Chi et al. 2009)
PAR-CLIP Photoactivatable-ribonucleoside enhanced cross-linking
and IP, can be used to assess regulatory impact of miRNAs
(Hafner et al. 2010, Hafner et
al. 2012)
p21Cip1/Waf1 - 3’UTR
targeting
To try isolate a single mRNA of interest, but must be
transfected into cell line leading to laborious complications (Wu et al. 2010)
lncRNA:PAR-CLIP
Systematic transcriptome wide analysis of lncRNA-miRNA
interactions, combination of recently discovered lncRNA
and PAR-CLIP technique
(Jalali et al. 2013)
miR-133a-HAND2
MS2-GFP fusion tag approach to empirically identify
miRNAs in the 3'UTR of the mRNA encoding cardiac TF
‘Hand2’
(Vo et al. 2010)
Unexpectedly, besides 3’UTR binding sites, these above studies highlighted that a large
proportion of miRNA targets were actually mapped within the mRNA coding sequence.
Furthermore, miRNAs regulate target mRNA expression in a moderate way and can work
synergistically or additively with other miRNAs. It is recommended that additional assays
are implemented to independently confirm observations from any affinity capture (Hassan
et al. 2013).
The small size of miRNAs provides a limited amount of sequence information for
specificity. Furthermore, as partial pairing between a miRNA and a target site is often
sufficient, a wide net can be cast for genes that are subject to regulation. This property not
only means that a single miRNA can regulate multiple mRNAs but also that predicting
those targets is not straightforward (Pasquinelli 2012).
As different degrees of base pairing mediate target recognition by microRNAs exist,
Pasquinelli detailed these modes of binding across plants, mouse, C. Elegans and human
(Figure 1.14.1). Prediction algorithms can be exempt from accounting for miRNA and
target interaction via these 5 broad pairing criteria.

69
Most cases, in animal models involve duplexes that contain mismatches and multiple
nucleotide bulges. The most common motif is perfect pairing between nucleotides 2 and 7
at the 5′ end of the miRNA, which is called the 'seed' region, and the target site (Thomas,
Lieberman and Lal 2010) (Shukla, Singh and Barik 2011).
There are rare examples of near-perfect complementarity between a miRNA and a target
site that enables cleavage of the mRNA, such as in the case of miR-196 and a sequence in
the HOXB8 mRNA (Yekta, Shih and Bartel 2004). Like any rule of thumb in science there
are exceptions, there are also numerous examples of functional miRNA target sites that do
not readily fit any of the previously described patterns (Rigoutsos 2009), and follow the last
example in figure 1.14.1.

70
Figure 1.14.1: The different degrees of base pairing mediate target recognition by
microRNAs (Pasquinelli 2012).

71
1.14.2: MiRNA pulldown using biotinylated mRNA capture technique
Despite their biologic importance, determining miRNA targets represents a major
challenge. The problem stems from the discovery that functional mRNA regulation requires
interaction with as few as 6 nucleotides (nt) of miRNA seed sequence (Lim et al. 2005).
Bioinformatic analysis has greatly improved the ability to predict, however, different
algorithms produce divergent results with high false positive rates commonly seen
(Bentwich 2005) (Watanabe, Tomita and Kanai 2007) (Baek et al. 2008).
First described by Hassan et al, ‘miR-Capture’ can be used to identify specific miRNAs
that target any chosen mRNA (Figure 1.14.3). This involves a biotinylated anti-sense
oligonucleotide (designed against any mRNA exonic sequence) that is captured on
streptavidin beads along with its bound mRNA and associated bound miRNAs (Hassan et
al. 2013).
Beitzinger et al reported the first biochemical identification approach of miRNA targets
from human cells using antibodies specific to the argonaute (Ago) protein complexes
involved in the miRNA/RISC pathway (Beitzinger et al. 2007). They went on to generate a
full protocol for isolation and immunoprecipitation validation a few years later (Beitzinger
and Meister 2011).
Interestingly, Zisoulis et al developed a similar biochemical method to identify on a large
scale the target sequences recognised by miRISC in vivo using live animal models. The
bound RNA molecules were trimmed to the regions protected by Argonaute, and subjected
to a series of isolation and linker ligation steps and identified by high-throughput
sequencing methods (Zisoulis et al. 2011).

72
Figure 1.14.2: MiR-Capture Affinity technique with miRNA:mRNA. (1) CHO adherent
cell culture source. (2) GOI in cytoplasm and cellular environment, (3) MiRNA-n denotes
any target miRNAs within the mRNA locality either latent (grey) or signalled (green). The
capture oligo was designed against an exposed loop structure determined from M-Fold
software.
Although there is an abundance of other experimental methods see table 1.14.1, all have
varying advantages and disadvantages, with none being the standard bearer. However, as
most of the competitive techniques are limited to 3’UTR targeting, miRNAs within the
5’UTR or coding region will not be identified. Thus, the miR-Capture technique has the
added benefit of being able to target a single specific genes mRNA transcript but also to
potentially identify miRNAs anywhere along the full length of an mRNA transcript, XIAP
in this case (Hassan et al. 2013).

73
1.15: Thesis aims
1) Identify CHO genes that exhibit difference in expression between 37oC and 31
oC.
2) Identify whether differential expression is a result of changes in mRNA
transcription or stability.
3) As a result then to generate temperature shift/inducible promoters that could be
used in conjunction with a routine temperature shift phase in a bioreactor as a tool
to control transgene expression.
4) Manufacture a promoterless reporter GFP plasmid host to enable quantitative and
qualitative promoter studies in a reproducible manner.
5) Isolate constitutive promoters to drive expression at a defined level, not influenced
by temperature and other external stimuli, in particular directing our efforts towards
a novel miRNA cluster identified from microarray expression profiling.
6) Test the utility of promoters which display inducible and constitutive expression as
alternatives to CMV promoters to be used in bioreactor and protein production
settings.
7) Test stability of expression between viral and endogenous promoters over a
timecourse of 3 months, using a GFP reporter stably transfected into CHO-k1
parental cells.
8) Characterise and map various transcription factor binding sites present in the CHO
promoters using bioinformatic approaches.
9) Based on a parallel study (undertaken in collaboration with Dr. Paula Kinsella),
whereby we showed that XIAP/miR-23b influences proliferation of Glioblastoma
cells, examine XIAP as a potential anti-apoptotic engineering target in CHO
studies.
10) Creation of XIAP specific CHO-K1 stable clones, perhaps observing increased
growth densities and reduced sensitivity to apoptosis and which may be used in
protein production settings.
11) Utilise a novel pulldown method (miR-Capture) to isolate cell-specific
microRNAs targeting XIAP messenger RNA using a biotinylated anti-sense
oligonucleotide capture affinity technique

74
12) Compare the CHO and human XIAP sequence and the milieu of miRNAs that bind
to the full length mRNA from each species and see which miRNA are common, if
any.
13) Validate the most promising miRNA candidates targeting XIAP from the miR-
Capture approach (12).
14) Identify potential miRNAs that may be used to facilitate beneficial phenotypes in a
bioreactor for increasing protein production in the future.

75
Section 2.0
Materials and Methods
76
2.1: Ultra Pure Water
Ultra high purity (UHP) water was used, where applicable, in all media and preparation of
solutions during this project. The water was purified in house by a reverse osmosis system
(Elga USF Maxima water purification system) to a standard of 12-18MΩ/cm resistance.
2.2: Sterilisation
Water, glassware and all thermolabile solutions were sterilised by autoclaving at 121°C for
20 mins under 15 p.s.i. pressure. Thermolabile solutions were filtered through a 0.22um
sterile filter (Millipore, SL6V033RB), with low protein binding filters used for all protein-
containing solutions.
2.3: Glassware
All glassware was washed and sterilized routinely. A deproteinisation agent RBS-25 (AGB
scientific, 83460) was used to remove proteineous material and eliminates cellular debris
from glassware. UHP was then used to rinse meticulously with a final sterilisation
performed using an autoclave.
2.4: Preparation of cell media
Using clean water and glassware, ATCC medium was routinely made by combining stock
500ml DMEM and F-12 Ham basal media (Sigma, 56495C) containing glutamine and
sodium pyruvate (Gibco-Invitrogen 11360-035). This was finally supplemented with either
FBS or FCS to a desired concentration of usually 2-10% FBS/FCS, depending on
experiment.
In addition, sterility checks were done for all complete culture media and cell culture
related solutions by incubating a small aliquot at 25-37oC for a period of 5-7 days to ensure
that no bacterial or fungal contamination was present at the time of usage.

77
2.5: Routine Management of Cells
2.5.1: Precaution measures
All routine cell culture work was carried out in a class II laminar air-flow cabinet (Nuiaire
Biological Cabinet) or (Holten). Strict aseptic techniques were adhered to at all times (see
NICB SOP No. 000-01). Laminar flow-biological safety cabinets (BSCs) were switched on
at least 15 minutes prior to use and swabbed with 70% IMS prior to and following all work.
Additionally, IMS was used on all equipment placed within the BSC. Experiments were
performed using only one cell line at any given time in the BSC to avoid cell line cross-
contamination. Each week, cell culture cabinets and any incubators that were used were
cleaned with industrial detergents (Virkon), IMS and UHP. A separate lab coat was worn
during aseptic work and nitrile gloves were worn at all times during cell culture work.
2.5.2: Sub-culturing of cell lines
Over the course off the project, cells where grown in either suspension or adherent formats.
The following was how each where subcultured and grown continuously.
2.5.2.1: Anchorage dependant cells
Adherent cell lines were grown in T25cm2 or T75cm
2 tissue culture flasks and typically fed
every 2-3 days. The spent media was either discarded to waste or sterile filtered (0.22μm)
to be used as conditional media for future experiments. Cell culture flasks were rinsed with
pre-warmed (37°C) trypsin/EDTA solution (0.25% trypsin (Gibco, cat # 15090), 0.01%
EDTA (Sigma, cat # E4884) solution in PBS in order to remove any naturally occurring
trypsin inhibitors present in residual serum.
Fresh trypsin was then aliquoted in volumes dependant on flask size (1ml – 3ml) and left in
the incubator at 37oC for 5-10 mins, until cells were detached from the respective flask
under the microscope. This cell suspension was then transferred to sterile 20ml universals
(Greiner, cat # 201151) for centrifugation at 1000rpm for 4-5 mins. Cell pellets were
resuspended in fresh ATCC media and counted (see section 2.5.3) and subsequently
reseeded to desired concentration depending on experiment.

78
2.5.2.2: Suspension Cells
Cell lines used throughout the project had been adapted to suspension growth were either
grown in 250ml disposable flasks (Corning, cat # 431144) with a 50ml working media
volume or disposable 50 ml spin-tubes (Sartorius, cat # DF-050MB-SSH) using a 5ml
media working volume.
When subculturing cells, typically a sample was counted (see section 2.5.3) and the
necessary volume extracted and centrifuged at 1000rpm for 4-5mins in a 20ml universal
(Greiner, cat # 201151). The resulting pellet was resuspended with fresh ATCC media and
seeded as desired, depending on the experiment.
2.5.3: Cell counting
Prior to cell counting samples were taken from one of the sub-culturing methods described
in section 2.5.2. Cell numbers and viability estimations were carried out using a method
where the culture sample was mixed at a 1:1 ratio with trypan blue (Gibco, cat 525). The
mixture was incubated at room temperature for a 2-3 minutes and then an aliquot (~10μl)
was applied to a chamber of a haemocytometer.
Within the haemocytometer, there are sixteen squares making up a grid. We calculated the
cell number per mL in the original cell suspension flask by counting individual cells
contained in four grids under the microscope. This was done by dividing the cell count by
four to get the average cell number of a sample then multiplying the average by a factor of
104 (volume of grid) and finally multiplying by the dilution factor (if original ratio wasn’t
1:1).
The volume occupied by the sample chamber is 0.1cm x 0.1cm x 0.01cm (i.e. 0.0001cm3);
therefore the average cell number was multiplied by 104 which is equivalent to cells per
mL. Viable cells were differentiated from non-viable based on their membrane remaining
intact and healthy and not allowing uptake of the trypan dye. The percentage viability can
be calculated then by dividing viable versus non-viable cells to get a percentage viability of
a sample population.

79
2.5.4: Cryopreservation of cells/Cell freezing
To allow long term storage of cell lines and stocks, cells were preserved with 5% DMSO
(Sigma, cat # D8418), a known cryoprotectant and submersed in liquid nitrogen at a
temperature below -180oC. Note: This can be done from plates or culture flasks.
Cells for cryopreservation were harvested in the log phase to ensure they were in a healthy
state and counted as per section 2.5.3. Samples were then centrifuged and the resultant
pellet was resuspended with a suitable volume of fresh media. An equal volume of 2x
freezing medium (10% DMSO and neat FBS) was added drop-wise (to prevent toxic shock)
to the cell suspension providing a final concentration of 5% DMSO. Finally, aliquots of this
suspension were placed into 1.5ml cryovials (Greiner, cat # 12279), labelled and
immediately placed at -80oC, after 6-12 hours cryovials were transferred to liquid nitrogen.
2.5.5: Reviving cell lines from cryopreservation/Cell thawing
Prior to the removal of a cryovial from liquid nitrogen, fresh media was pre-warmed at
37oC in a sterile container. The cryovial was removed, and working as quickly as possible,
placed into a sterile water bath at ~35-40oC for 1 minute. The thawed cells were then
transferred to the pre-warmed media and centrifuged at 1000rpm for 4 minutes. The
supernatant was removed and the cell pellet was resuspended in additional pre-warmed
fresh ATCC and transferred to a T25cm2 flask. Small aliquots of this sample were assessed
for viability and sterility checked using tryptone soya broth (TSB) and thioglycollate broth
(Thio) and incubated at 37oC for 7 days to ensure no contamination occurred during the
cryopreservation or revival steps.
2.5.6: Mycoplasma testing
Routine mycoplasma examinations were carried out on all cell lines used in this study by a
trained in-house technician. This was to ensure all experiments and cultures remained
contamination free and results obtained were not affected by the presence of mycoplasma
in any of the CHO cell cultures used during experimentation.

80
2.6: DNA manipulation and other techniques
Throughout this project, many unique plasmids were generated with various inserted DNA
fragments that were needed for further experiments; this DNA cloning forms part of the
general project workflow (Figure 3.1.3.1). To incorporate a foreign DNA sequence into a
plasmid requires the manipulation of a few techniques.
Target sequences were amplified via PCR (section 2.6.2) using specific gene primers which
bind to a complementary section within a genomic DNA template (section 2.6.10). These
PCR products were then purified using agarose gel electrophoresis (section 2.6.3). To
facilitate insertion, restriction sites were manually designed on the 5’ and 3’ ends of primer
sets (forward and reverse) as complementary sequences matching the corresponding
reporter plasmids used for cloning. Both the PCR product and report backbone were
digested via restriction endonuclease enzymes (section 2.6.4) to fashion ‘sticky’ ends for
performing ligation reactions (section 2.6.5). This facilitated the creation of unique reporter
plasmids which allowed insertion of any DNA inserts with complementary restriction sites
for future work.
Once these constructs were successfully cloned and sequenced (2.6.9), these plasmids were
then transformed into bacteria cells (section 2.6.6). To generate more copies of these
plasmids, Mini or Midi preps were used to generate the higher concentrations necessary for
performing transfections into mammalian cells (section 2.6.7 and 2.6.8).
2.6.1: Designing and Ordering Primers
Primers are small (18-25nt) strands of nucleic acid, which serve as a starting point to DNA
synthesis in PCR applications. They are required for DNA replication because the enzymes
that catalyze this process, DNA polymerases, can only add new nucleotides to an existing
strand of DNA. Primers and oligos can be used interchangeably. Primers were designed
from sequence homology to either CHO or mouse. By using the software at
(http://www.basic.northwestern.edu/biotools/oligocalc.html) this allowed us to check the
melting temperature (Tm) and % GC content and ensure these sequences were kept within
81
the general design criteria deemed good practice by molecular biologists. The sequences
were then ordered from a company based in Germany called MWG Eurofins™.
2.6.2: Polymerase Chain Reaction (PCR)
This technique has become commonplace in molecular labs around the world ever since
1983, when Kary B.Mullis developed the technique. It is a thermal cycling reaction, which
can generate thousands of copies of a DNA sequence from a single piece of starting DNA,
called a template. Using specific primers as mentioned in section 2.6.1, varying lengths of
DNA sequence can be amplified based on primer location within the template and by
following the typical reaction cycling show in table 2.6.2.1.
Essential to the success of PCR is the ‘Taq polymerase’, a heat stable enzyme capable of
assembling new DNA strands from single building blocks called nucleotides (nt), then as
PCR progresses, the DNA generated is itself used as a template for replication.
Many companies offer various PCR kits and master-mixes which can benefit the researcher
in numerous ways, some reduce non-specific amplification, some are used as master-mixes
to reduce reagent waste and errors from pippetting, while some have faster cycling
capabilities.
Three main PCR reagents used over the project were; a Redtaq(TM)
2x master mix (cat #
BIO-25043) a Platinum(R)
high-fidelity Taq polymerase (cat #11304-011) and Velocity(R)
DNA polymerase (cat # BIO-21098).
Each PCR cycling protocol varies depending on PCR mix used and what size amplicon is
to be generated. The general PCR reaction volumes and components can be seen in table
2.6.2.1.

82
Table 2.6.2.1: Typical PCR components and volumes.
Component Volume (μl)
10x Polymerase buffer
5
2mM dNTP 5
Taq Polymerase 0.4
Forward Primer (10nM) 1
Reverse Primer (10nM)
1
Template DNA
1
H20 9.5
Total Volume 50
PCR master-mixes were added to thin-walled 0.2ml PCR tubes and kept on ice till the
thermal cycler was pre-heated and the general conditions were as follows;
Table 2.6.2.2: Typical cycling conditions for a PCR run.
Stage Temperature Time Cycle Number
Initial Denaturation 95°C 2 mins
Denaturation 94°C 30 secs
25 cycles Annealing (primer specific) 30 secs
Elongation 72°C 1 min/kb
Final elongation 72°C 10 mins
Throughout the project, PCR had to be modified from these general conditions due to
efficiency issues and hard to isolate sequence targets. Having varied many conditions and
cycler settings for optimisation, it was difficult to fully exemplify them all. However, we
will describe the frequently used types of PCR and the theory behind them.

83
Nested PCR:
This method involved using two sets of primers that were used in two rounds of successive
PCRs. In the first reaction, one pair of primers were used to generate DNA products, which
may additionally create non-specifically amplified DNA fragments, but ideally copies of
the correct sequence to be amplified were also present. This first PCR reaction sample was
then used as the template in a second PCR reaction with a set of primers whose binding
sites are completely or partially different from each of the primers used in the first reaction
but are located within the first amplified sequence and are thus nested within the first
amplicon created from the PCR round 1. This allowed a more efficient PCR due to having a
much more specific template in the second round of PCR Note: Nested PCR is often more
successful in specifically amplifying long DNA fragments than conventional PCR, but it
requires more detailed knowledge of target sequences.
Touchdown PCR:
Touchdown PCR was another variant of PCR that was used to reduce non-specific bands
being generated/amplified. This was achieved by gradually lowering the annealing
temperature as PCR cycling progressed. The annealing temperature in the initial cycles was
usually a few degrees (3-5°C) above the Tm of the primers used and although this sounds
excessive, it has been shown that PCR’s can be successful with exaggerated temperatures.
Even if only a few copies are initially created at higher temperatures, then in later cycles, as
the temperature drops below the Tm, the few copies generated previously are subsequently
used as templates in the lower temperature rounds of cycling. In other words, the higher
temperatures give greater specificity for primer binding, and the lower temperatures permit
more efficient amplification from the specific products formed during the initial cycles.
While the above two types of PCR were used in the generation of promoter fragments used
in this study other types were also utilised such as; In-silico PCR, Inverse PCR and reverse-
transcriptase PCR (RT-PCR) at different stages.

84
2.6.3: Analysis of DNA samples using agarose gel electrophoresis
After a PCR run, we wanted to test and visualise the target fragments created. We
performed agarose gel electrophoresis and the protocol used was as follows;
1. First, a stock of 50x TAE buffer was created (242g Tris Base, 57.1ml Glacial Acetic Acid,
100ml 0.5M pH8.0 EDTA, to 1L with UHP water). This was diluted to 1x stock with UHP
water and Agarose (Sigma, cat # A9539) added to a final concentration of 1% w/v. This
percentage was chosen to run and visualise most fragments on the gel matrix, however this
percentage could be increased or decreased to achieve better resolution on smaller or larger
fragments respectively.
2. This solution was then heated in a microwave until dissolved; Ethidium Bromide was then
added to a final concentration of 0.5 µg/ml and poured into the appropriate mould with a comb
to allow for sample wells.
3. Once solidified the gel was placed in an electrophoresis tank filled with 1x TAE buffer. DNA
samples, mixed with a suitable loading buffer, were then added to the wells and current applied
to the gel. 90-100V was generally used for visualisation; however greater resolution could be
achieved at a lower voltage applied for a longer period.
4. A reference DNA ladder sample was also generally run alongside samples to measure and
compare visualised band sizes.
5. Once sufficiently separated, bands could be visualised in a UV light box at a 254nm
wavelength. If the reaction has non-specific bands along with the correctly sized one, it was cut
it out of the gel with a scalpel and purified.
2.6.4: Cloning of DNA: Endonuclease restriction digestion of DNA
Two combined molecular methods were used in the cloning of nucleic acids as needed over
the course of the project. Restriction enzyme digestion was performed using specific
endonucleases and ligation using a T4 ligase (Roche cat: 10481220001) enzyme. From the
outset of primer design, suitable restriction enzymes (Acc65i + Xho1) were chosen. The
complementary sequence for these restriction sites to allow DNA cleavage was included
with every primer set ordered. As a result, when PCR generated the correct fragment, they
contain sticky ends to permit cloning via the T4 ligase in a ligation reaction.
Primers were designed with ‘Acc65I’ restriction sites on all forward primers and an ‘Xho1’
on all reverse primers (with additional bases to allow for anchorage of enzyme). This
allowed us to perform a restriction digest to create ‘sticky ends’ at 5’ and 3’ ends of the
amplified PCR fragments. These fragments were then ligated into two reporter
plasmids/vectors (pEGFP + pGL3). These plasmids in parallel were also subjected to
restriction digestion using the same enzymes (thus generating compatible ends for ligation).
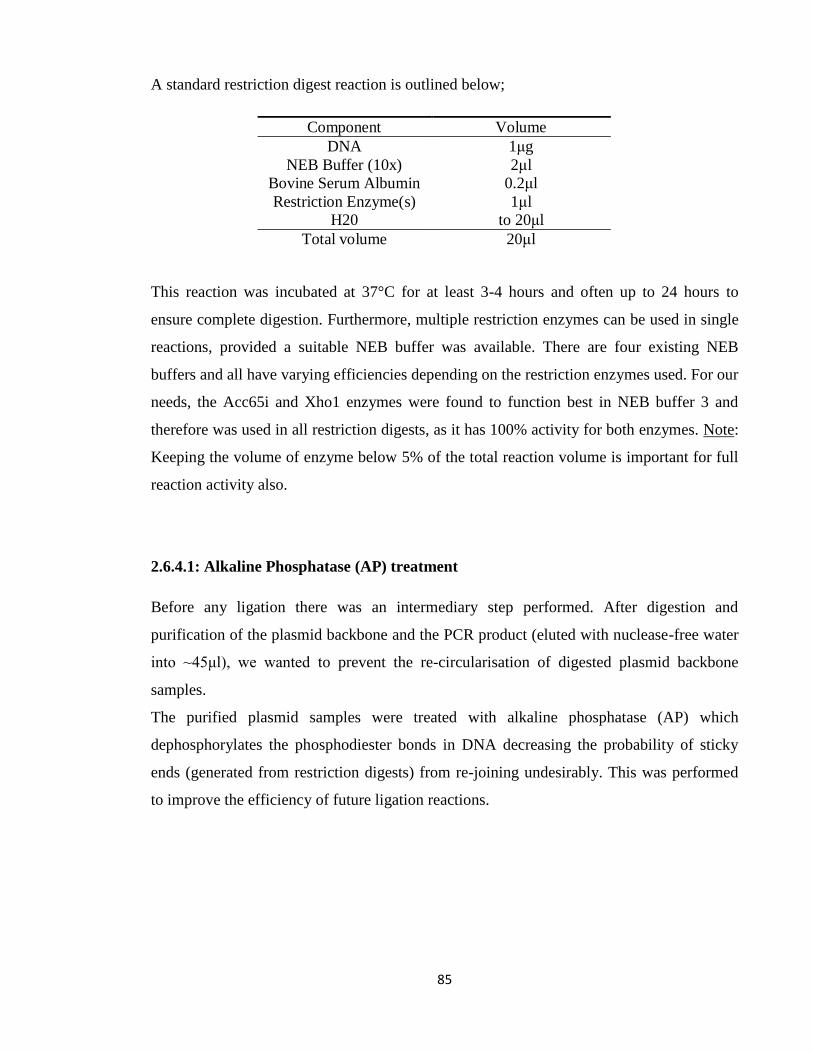
85
A standard restriction digest reaction is outlined below;
This reaction was incubated at 37°C for at least 3-4 hours and often up to 24 hours to
ensure complete digestion. Furthermore, multiple restriction enzymes can be used in single
reactions, provided a suitable NEB buffer was available. There are four existing NEB
buffers and all have varying efficiencies depending on the restriction enzymes used. For our
needs, the Acc65i and Xho1 enzymes were found to function best in NEB buffer 3 and
therefore was used in all restriction digests, as it has 100% activity for both enzymes. Note:
Keeping the volume of enzyme below 5% of the total reaction volume is important for full
reaction activity also.
2.6.4.1: Alkaline Phosphatase (AP) treatment
Before any ligation there was an intermediary step performed. After digestion and
purification of the plasmid backbone and the PCR product (eluted with nuclease-free water
into ~45μl), we wanted to prevent the re-circularisation of digested plasmid backbone
samples.
The purified plasmid samples were treated with alkaline phosphatase (AP) which
dephosphorylates the phosphodiester bonds in DNA decreasing the probability of sticky
ends (generated from restriction digests) from re-joining undesirably. This was performed
to improve the efficiency of future ligation reactions.
Component Volume
DNA 1μg
NEB Buffer (10x) 2μl
Bovine Serum Albumin 0.2μl
Restriction Enzyme(s) 1μl
H20 to 20μl
Total volume 20μl

86
The following reaction was performed at 37oC for 1 hour:
Finally, to remove any traces of enzyme that may damage DNA or inhibit further reactions;
we purified samples using the MinEluteTM
PCR Purification Kit (Qiagen, cat # 28006).
2.6.5: Cloning of DNA: Ligations
Once plasmid backbones and inserts were ready to be ligated, an enzyme called ‘ligase’
was used to anneal the DNA fragment insert to the backbone. We used a T4 ligase from
Roche, (cat: 10481220001).
Next, we used an open source ligation calculator found online (http://www.insilico.uni-
duesseldorf.de/Lig_Input.html), which uses the following formula to work out amounts of
nucleic material (in nanograms) needed for preparing efficient ligation concentrations;
Table 2.6.5: Typical ligation components and volumes.
*Note: The insert DNA volume was variable depending on the sample concentration. Volume used was
sufficient in each case for a minimum of 1:5 vector: insert ratio.
Component Volume
Purified Plasmid 44.6μg
AP Buffer (10x) 5μl
AP (Roche, cat. 11097075001) 0.4μl
Total volume 50μl
Insert length (bp)
Insert mass (ng) = Vector length (bp) x Vector Mass (ng) x 5 (ratio)
1:5 Insert Ratio Control (No insert) Control (No ligase)
Ligase Buffer (10x) 1.5 1.5 1.5
Plasmid Backbone (60ng)
1 1 1
Insert DNA variable* 0 0
Ligase Enzyme 0.5 0.5 0
H2O to 20l to 20l to 20l
Total Volume 20 20 20

87
The reagents were placed in thin-walled PCR tubes and positioned in a beaker of ice water
and left for 6-10 hours or overnight in some cases. By using ice water, the reaction was
subjected to a gradient of temperature, as opposed to a single temperature. Gradually
overnight the temperature would increase up to room temperature (~21oC). This allowed a
more efficient ligation, as only using a single temperature can often be the rate-limiting step
of ligation. Finally, the enzyme was inactivated by incubation for 10 mins at 65°C and the
resultant ligated mixture was then used for bacterial transformation (section 2.6.6).
2.6.6: Transformation into bacterial cells
The introduction of foreign DNA into a bacterial cell was performed to increase the copy
number of these plasmids by using the bacteria’s rapid doubling times. The protocol was as
follows;
1. A vial (200μl) of competent cells (DH5, Invitrogen, cat # 18263-012) was removed
from storage at -80°C and thawed on ice. Transformation tubes Falcon, cat # 352059)
were also chilled on ice during this time.
2. Once thawed 50μl of the bacteria was added to a transformation tube along with 2.5μl
(5% total volume) of plasmid sample or ligation reaction mixture.
3. This mixture was left on ice for 10-15 mins, heat shocked in a 42°C waterbath for 30-
40 secs then placed back on ice for a further 1-2 mins.
4. 500μl of SOC media (Invitrogen, cat # 15544) was immediately added, and this
mixture incubated at 37°C for 1 hour at 200rpm agitation speed.
5. The sample was then transferred to a fresh 1.5ml tube (Costar, cat # 3620) and spun
at 3000rpm in a bench top microfuge (Hettich Mikro 120) for 3 mins to pellet the
bacterial cells.
6. The majority of the supernatant was removed and the pellet resuspended in 40μl
SOC.
7. This was then spread on LB agar plates (10g Tryptone (Sigma, cat # T7293), 5g
Yeast Extract (Oxoid, cat # LP0021), 10g NaCl (Sigma, cat # S7653), 20g agar select
(Sigma, cat # A5054), to 1L with UHP water, autoclaved before use) containing
Ampicillin or Kanamycin depending on plasmid used in ligation (100ng/ml working
concentration) and incubated overnight at 37°C.
2.6.7: Small scale preparation of plasmid DNA (Miniprep)
Once transformations were completed, the next step was to generate more copies of the
plasmids generated. Commercial kits exist for small and large scale preparation of plasmids
from bacterial cells and the following protocol was performed as outlined in the operating
manual;

88
1. After successful generation of transformed bacterial colonies (see 2.6.6), a single
colony was picked and grown overnight at 37°C, 170rpm in a 5-10ml aliquot of LB
broth (autoclaved before use) containing appropriate antibiotic.
2. This culture was then processed using a Qiagen QIAprep Spin Miniprep kit (Cat # No.
27106, see manufacturers protocol for details), with a final DNA elution step carried
out using 30-50μl of TE buffer.
3. The concentration (ng/μl) of this DNA prep was determined using a NanoDrop 1000®
spectrophotometer. This could then be used in subsequent DNA manipulation reactions
or stored at -20°C. Typical yields were ~200-450ng/μl.
This miniprep sample was then used in downstream processes; typically small scale
minipreps were suitable and used in initial tests to ensure cloning was successful and for
sending a sample away for sequencing to Eurofins MWG™. This was followed by
restriction digestion to cleave the insert out of the plasmid, thereby verifying that the
correct fragment went in to the respective plasmid.
2.6.8: Large scale preparation of plasmid DNA (Midiprep)
For generating larger quantities of cloned plasmids, a Midiprep kit was used. This had the
added benefit of being a more stringent purification process as the kit contained endotoxin-
free buffers and materials to ensure a cleaner (free from endotoxins) final plasmid sample.
A larger volume of Luria broth (LB) media was used to facilitate larger scale proliferation
of the bacterial cells. The LB recipe was: (10g Tryptone (Sigma, cat # T7293), 5g Yeast
Extract (Oxoid, cat # LP0021), 10g NaCl (Sigma, cat # S7653), to 1L with UHP water, then
autoclaved.
Midipreps were used when high plasmid concentrations were required. Furthermore, the kit
removes harmful endotoxins often from bacterial debris such as lipopolysaccharide (LPS)
in order not to affect or be detrimental to healthy cells during transfections. The following
protocol was performed as outlined in the operating manual;
1. After successful generation of transformed bacterial colonies as before, a starter culture
of LB and single colony, equivalent to a miniprep (5-10ml universal) was made.
2. This starter culture was then added to a further 200ml of LB broth containing
Ampicillin or Kanamycin and incubated overnight at 37°C, 170rpm.
3. After incubation this culture was then spun at 6000g for 15 mins, 4°C, and the
supernatant discarded.

89
4. The resulting cell pellet was then processed using a Qiagen Plasmid Maxi kit (Cat # No.
12362, see manufacturers protocol for details), with a final DNA resuspension step
carried out using 250-500μl of TE buffer.
5. The concentration of this DNA prep was determined using a NanoDrop 1000
spectrophotometer. This was then used in subsequent DNA manipulation reactions or
stored at -20°C.
2.6.9: Sequencing and Verification
Once all the above steps were completed, the resulting samples containing the previously
prepared DNA (plasmids + inserts), needed to be sequence verified. This was to ensure that
the correct fragment insert was ligated into each reporter plasmid in the correct orientation
and with no sequence mutations. Aliquots of each sample to be sequenced were sent to
Eurofins MWG™ along with the forward and reverse primers specific to each PCR
fragment isolated. Thus, they could sequence it base by base using the same specific
primers. Resulting sequence information was sent back in FASTA format for analysis to
ensure full confidence that the plasmids contained the inserted promoter sequences
upstream of each reporter gene.
2.6.10: Genomic DNA Extraction
From actively growing CHO cell cultures, an aliquot containing approximately 1x10⁶ cells
was removed and centrifuged at 1000rpm for 5 mins. The supernatant was aspirated and the
cell pellet was lysed and genomic DNA extracted as per the guidelines of the Promega
Wizard™ SV Purification kit (cat # A2360). DNA was eluted into ~150μl of RNase free
water from the resin column into a 1.5ml eppendorf. Yields of genomic DNA were
typically in the range of 200-450ng/μl.
2.6.11: RNA Extraction
Purification of RNA (mRNA) from biological samples was a fundamental technique used
during this project, and in particular when studying genetics and gene expression. It can be
done in two ways, if the total RNA was needed including microRNAs, then an isolation kit
MirVana™ (Ambion cat # AM1561) was used, again as per kit guidelines.

90
For experiments not requiring the full complement of miRNAs, then, a Tri-Reagent®
solution (Ambion.cat # AM9738) was used to extract RNA. This solution was used along
with the following reagents; isopropanol (Sigma.cat # W292907), chloroform (Sigma.cat #
C2432) and ethanol (Merck.cat # K41392783). Eluted RNA was stored in the -80oC
freezers in-between experiments. RNA is easily degraded due to the abundance of
ribonuclease enzymes in cells and tissues, so storage at -80oC was essential for ensuring
RNA integrity. RNA degradation was checked by running the samples using agarose gel
electrophoresis to visualise both ribosomal subunits (Figure 2.6.11).
Note: Sometimes RNA can degrade over extended periods of time even in -80oC, and
indeed when the samples are exposed to multiple freeze-thaw cycles.
Figure 2.6.11: (A) An agarose gel showing gradual degradation of RNA samples from left
(high quality) to right (degraded/poor quality). (B) An agarose gel showing the ideal quality
of RNA samples, where the ribosomal subunits (28s and 18s) are shown.
2.6.12: Determination of RNA purity with Bioanalyser
The Agilent 2100 Bioanalyser® (cat # G2940CA) is a micro-fluidics based platform for the
analysis of proteins, DNA and RNA. The supplied 12-well chip (Figure 2.6.12) contains
interlinked channels and reservoirs allowing the analysis of samples containing minute
amounts of starting RNA material.
Once the wells and channels were filled, the chip becomes an integrated electrical
circuit. The 16-pin electrodes of the cartridge are arranged so that they fit into the
wells of the chip. The channels were first filled with a polymer gel matrix on the chip
priming station and vortexed to fix the matrix to the chip surface. A RNA ladder (RNA

91
6000 Nano) was included for RNA size comparison and was loaded, along with the RNA
samples to be tested, into the appropriate wells. To each well, 1μl of each sample was
loaded with a fluorescent dye (marker) included in the Nano RNA 6000® kit (cat # G2938-
90034).
When all samples were loaded, the chip was briefly vortexed at 2400 rpm and loaded into
the Agilent 2100 Bioanalyser® machine. Because of a constant mass-to-charge
ratio and the presence of a sieving polymer matrix, the molecules were separated by
size and smaller fragments migrated faster than larger ones. The machine is fully automated
and separates samples by injecting the individual samples into a separation chamber were
components are electrophoretically separated and detected by their fluorescence. These
signals are translated into gel images and electropherograms for in silico analysis. The
software automatically compares unknown samples tested to the generated ladder
fragments, to determine the concentration of the unknown samples and to identify the
ribosomal RNA peaks.
Figure 2.6.12: The RNA 6000 Nanochip used in the Agilent 2100 Bioanalyser®.
2.6.13: DNase treatment
After RNA extraction, it was common practice to use an enzyme called deoxyribonuclease
(RQ1), (Promega.cat #M6101). It catalyses the hydrolytic cleavage of double and single
stranded DNA. This was essential and beneficial for maintaining the integrity of the RNA,
because typically after RNA extraction there may be DNA carryover and in some cases this
could affect and hinder subsequent enzymatic experiments such as reverse transcription and
qPCR. DNase treating the biological samples degraded any potential DNA carried over and
thus prevent non-specific amplification.

92
Figure 2.6.13 illustrates the difference between 10 RNA purified samples at 3 different
stages of treatment. In the original samples, we performed a PCR run on the 10 extracted
samples which produced DNA amplicons when they shouldn’t. Then after DNase treatment
the same PCR run yields no amplified DNA bands which were indicative of a successful
DNase step. We performed a final PCR on the samples after a reverse transcription-cDNA
generation step (section 2.6.14) and got clean amplified bands, indicating that the RT
worked and qPCR can be used to calculate gene expression accurately with no DNA
contamination present.
Figure 2.6.13: The effect of DNase treatment on DNA carryover post RNA extraction to
ensure samples could be used for future applications.
2.6.14: Reverse Transcription PCR and cDNA generation
Now that RNA material was ready to be used in downstream applications, the next step was
to create double stranded cDNA from single stranded RNA, using the Taqman® Reverse
Transcription kit (Applied Biosystems.cat # 4387406). This kit uses a special enzyme
common in retroviruses called ‘reverse transcriptase’ the resulting cDNA then is amplified
by specific PCR steps.
By performing these steps we created a cDNA sample to be used in follow on qPCR
experiments to measure the absolute or relative expression of gene targets between different
samples or in comparison to an endogenous (house-keeping) gene control.

93
All reaction components were thawed on ice and if performing more than one RT reaction,
then we scaled up as required and added 10% volume surplus extra (n+1) allowing for
pippetting errors and volume loss of liquid when dispensing. A typical reaction can be seen
in the table 2.6.14 and cycler conditions were as follows;
Table: 2.6.14: Components for RT reaction.
The following thermocycler conditions were programmed for this reaction;
2.6.15: Real-Time Quantitative PCR (RT-qPCR)
Although similar to the PCR section 2.6.2, RT-qPCR needed its own section due to its
importance in this project and its complexity and because its follows on from the previous
sections in the workflow. Like routine PCR, it is a technique that amplifies up a template
portion of DNA, however, at each step a quantitative reading can be taken simultaneously
while amplification proceeds.
Unlike regular PCR which only allows quantification at the end point (band on a gel),
qPCR can be used to determine whether a gene is currently over-expressed or knocked
down in a particular sample in real-time (ex: cell line grown at a certain temperature), as
well as comparing its relative expression between controls and other samples.
Component Volume (μl)
x1 RT reaction
10x RT Buffer
25x dNTPs
10x Random Primers
RNA inhibitor
2
0.8
2
1
1
3.2
10 (2 μg)
RT Enzyme (MultiScribe)
Nuclease-free H20
RNA sample
Total Volume 20 μl
Stage Temperature Time
1 25°C 10 mins
2 37°C 60 mins
3 85oC 5 mins
4 4°C/ -20oC -

94
qRT-PCR was used to measure this expression level by using computational software on
the Applied Biosystems® 7500 Fast thermal cycler to obtain cycle threshold (Ct) values
(values above a cycle threshold of fluorescent detection). We subsequently calculated
mRNA transcript copy numbers. The quantity can be either an absolute number of copies or
a relative amount when normalised to DNA input or a house-keeping normalising gene like
GAPDH.
Two main ways of detection are probe-based methods (FRET) and reporter binding dyes
(SYBR green). The probe method relies on a DNA-based probe with a fluorescent reporter
at one end and a quencher of fluorescence at the opposite end. The proximity of both,
determines the detection of fluorescence in a given run. Where exonuclease activity of Taq
polymerase separates both, unquenched emission of fluorescence occurs, creating a signal
to be detected by the software.
Most frequently we used the dye based method involving the binding of a double stranded
(ds) DNA and a dye which allowed detection due to increasing amounts of fluorescence
with each cycle completed. The abundance of the SYBR green (Applied Biosystems, cat
#4309155) signal detected dye then allowed quantification.
One drawback is that non-specific primer dimmers (where annealing of primers to one
another) can create small ds DNA molecules which also incorporates the dye giving false
positive results. This was accounted for by performing dissociation/melting curve analysis
after the initial qPCR run. The melt curve run heated the sample from 60oC to 95
oC by
increasing in increments of 1oC every minute till the amplicon dissociates; sharp peaks
indicated a clean amplified product (Figure 2.6.15).
Note: In some cases experiments needed to be run again with improved primer design.

95
Figure 2.6.15: Dissociation/Melt curve extrapolation and images.
A main advantage of qPCR is the fact that it can determine the expression of a gene at a
given point in time or under the influence of a condition such as temperature as long as it is
a controlled. For example, you can determine the absolute expression of mRNAs or relative
expression in comparison with endogenous control, we used either beta-actin or GAPDH
house-keeping genes to normalise because their expression remains relatively unchanged,
regardless of cellular state.
A typical reaction setup was set up on ice in a Micro-Amp optical 96-well plate (Applied
Biosystems, cat # 4346906) for qPCR, and was as follows;
Component Volume x1 well (μl)
2x SYBR/Taqman Mix 10
Forward Primer (10nM)
1
Reverse Primer (10nM)
1
cDNA 1
H2O 7
Total Volume 20

96
Reactions were then carried out on an Applied Biosystems® 7500 Fast Real-Time PCR
System under the following cycling conditions;
Finally, results were analysed in excel and exported using the corresponding Applied
Biosystems® software.
2.6.16: Transfection of Mammalian Cells
A common technique used by molecular scientists is transfection, where one can introduce
foreign DNA/vectors into mammalian cells for testing and mimicking expression much like
the in vivo environment. Transfection of cells typically means the opening of ‘pores’ on the
cells membrane, which allow the uptake of genetic material.
During this project we used either Lipofectamine 2000® (L2000) (Invitrogen.cat #18324-
111) or TransIT®-2020 reagent (Mirius.cat #MIR-5404) for transfection experiments.
Transfections can be transient (short term) or stable (long term). In transient experiments,
the DNA material is not incorporated into the cells nuclear genome and after a few cell
cycles, is diluted by natural cell division (mitosis). However, often short term is desirable
for what the scientist is trying to analyse.
In stable transfections, the DNA material is integrated into the genome, due to the presence
of a selectable marker (e.g.: G418/geneticin drug or toxin marker) routinely contained
within a plasmid. Therefore, all subsequent progeny will have taken up the foreign DNA
aswell. Stable clones were generated after 3-6 weeks of selective pressure and passages and
can be used indefinitely if stored via cryopreservation in liquid nitrogen.
97
The following protocol was used for transfections in 24-well format;
1. Approximately 18-24 hours before transfection, plates cells so that at time of transfection
confluency is ~50-80%, I often use seeding density of 2-5x10⁵ for adherent cells and 5-
8x10⁵ for suspension cultures.
2. Incubate overnight at 37oC in 5% CO2 incubator.
3. Next day warm TransIT®-2020 reagent to RT and vortex gently
4. Place 50μl serum free media per sample well in sterile tubes
5. Add 500ng stock plasmid DNA and gently mix
6. Add 1.5μl of TransIT®-2020 to the mixture and gently mix
7. Incubate at RT for 15-30 mins to allow sufficient time for complexes to form
8. Add this mix drop-wise random areas of the sample well
9. Gently rock the plates to create a evenly distributed environment in the wells
10. Inoculate for 24-72 hours and it is not necessary to replace with fresh media
11. Harvest and assay as required.
2.7: SEAP assays
A functional assay was used to determine the secreted alkaline phosphatase (SEAP)
producing capability of cells grown in culture and is called the SEAP assay. It is an
enzymatic colorimetric detection assay and is advantageous due to it being much less
expensive than other techniques, can be setup quickly and can be performed using a
conventional ELISA plate spectrophotometer.
To determine the amount of SEAP produced by CHO cells, we utilised the adapted CHO-
K1-SEAP cell line (adapted by Dr. Niraj Kumar in-house), which were grown in SFM-II
media. Depending on the kind of experiment undertaken, sample aliquots were taken at
appropriate time intervals (days 1-12 for our time-points) during culture growth and
centrifuged at 13000rpm for 10 minutes and supernatant transferred for storage. Samples
were used in the assay straight away or placed at -20oC storage to be used at a later date.
For example, when all timepoints samples were collected and therefore all samples were
ran together on the one plate.
To perform the assay, 50μl of this supernatant media was transferred to individual wells of
a flat-bottomed 96 well plate (Costar. cat # CLS3595). To each well, 50μl of a 2x SEAP
buffer (10.5g diethanolamine, 50μl of 1M MgCl2 and 226 mg of L-homoarginine in a total
volume of 50ml) was added. Plates were then incubated for 10 minutes at 37oC to prime the

98
reaction; during those 10 minutes SEAP substrate solution was made up (158 mg of p-
nitrophenolphosphate (Sigma, cat # P4744) in 5ml of 1x SEAP buffer in a universal
wrapped in tinfoil (to avoid light exposure). Then just prior to placing the plate into the
BioTek® plate reader, 10μl of the SEAP substrate solution was added to each well with a
multi-channel pipette. The change in absorbance per minute (OD405/min) was the indicator
of the amount of SEAP present in each sample and calculated in excel.
2.8: Flow cytometry and cell imaging using Guava® Easycyte systems
Using a microcapillary Guava® flow cytometer in-house we were able to utilise two assays
for the project, The Viacount® Assay and the ExpressPlus® Assay. The Viacount was used
for cell counting and to calculate the percentage viability of cells in a given culture sample.
The Viacount assay is regarded as more accurate than using a standard haemocytometer
coupled with higher throughput. For example, 96 samples could be multiplexed on the one
plate. The Viacount assay distinguishes between viable and non-viable cells based on
differential permeabilities of two DNA binding dyes in the Viacount reagent (Guava
Technologies. Cat # 4000-0041). The nuclear dye only stains nucleated cells, while the
viability dye brightly stains cells undergoing apoptosis (programmed cell death).
To perform cell counts, a volume of cells in culture was processed by taking old media out
and trypsinising the cells (no need for trypsin in suspension cultures), viacount reagent was
allowed to equilibrate to room temperature and was aliquoted 1:1 with the sample volume
to be tested. Samples were placed in a round-bottomed 96-well plate and incubated at RT
for 10 minutes before reading on the Guava® flow cytometer. Cell numbers and % viability
values were exported into excel for analysis.
As a means to calculate promoter activity the ExpressPlus® program was used to measure
the GFP intensity within a population of cells, and involves gating negative and positive
GFP cells and allocating a Y-mean expression value to each sample.
In promoter studies, transfection, as described in section 2.6.16, was carried out using the
constructed plasmids (reporter gene and promoter fragment inserts) and attached CHO-K1
cells grown in 24-well format. The cellular machinery then promotes protein synthesis and
99
thus GFP expression strength of our promoters of interest which were detected from their
excitation peak at a wavelength of 395 nm when exposed to ultraviolet light in the Guava®
flow cytometer.
After 24-48 hours, samples were taken. Media was removed and cells were treated with
trypsin. The sample is diluted with nuclease-free water as required depending on cell
density and aliquoted into a round-bottomed 96-well plate and read using flow cytometry
again. Y-mean values were indicative of GFP fluorescence intensity and values were
exported to excel for analysis.
Unlike the Viacount® reagent and program, the ExpressPlus® program only required cells
to be in suspension with no additional reagent needed; therefore pippetting well after
trypsinisation to ensure no clumping was imperative.
2.9: PCR based miRNA Taqman Low Density Arrays (TLDA)
Taqman® Low Density Arrays (Applied Biosystems.cat #4334812) are 384-well micro-
fluidic cards designed for multiplex analysis of gene expression patterns of up to 8 samples
in parallel across a defined set of gene targets (Figure 2.9.2). TLDA arrays are highly
sensitive and reproducible which involves PCR amplification and simultaneous
quantification of a DNA molecule based on a similar technology to qPCR as mentioned in
section 2.6.15.
The arrays contain complementary probes for all known mouse miRNAs as the mouse
genome is sequenced while the CHO genome was not fully sequenced at the time of testing.
Homology to another rodent species was the best viable option.
The probes are divided into two primer pool sets (A+B) with A containing the more
common miRNAs and B having more rare, less characterised ones.

100
2.9.1: Reverse Transcription
The RT reaction to create the full complement of cDNA prior to TLDA is described below;
A volume of 7μl of RT mix was added to each labelled thin-walled PCR tube (as required),
then to each tube 2μl of RNA sample (100ng) and 1μl of Multiplex RT rodent Primer Pool
A or B were added. The sample was mixed gently and incubated on ice for 10 mins. The
reverse transcription reaction was performed using the G-Storm thermal cycler under the
following conditions;
Step Type Time (mins) Temperature (oC)
HOLD 30 16
HOLD 30 42
HOLD 5 85
HOLD ∞ 4
Two separate RT reactions were performed (A+B primers), on the RNA extracted from the
cells being tested. Analysis of miRNA expression was done in two separate experiments;
one was based on temperature shift causing differential expression pattern shifts and thus
identified candidate miRNAs for further study and functional validation related to
temperature inducibility in the project.
Another study, involved the ‘Mir-Capture’ approach (section 1.14.2), where cells
underwent targeting by a biotinylated anti-sense oligonucleotide capture affinity technique
(section 2.19). RNA was extracted with the MirVana™ (Ambion cat # AM1561) isolation
kit to ensure miRNAs were kept intact. This RNA was then loaded into the micro-fluidic
cards and loaded into the Applied Biosystems® 7900HT thermal cycler for analysis.
Component Volume x1 RT (μl)
100mM dNTPs 0.20
MultiScribe™ RT enzyme (50 U/μl)
2
10x Reverse Transcription Buffer
1
RNAse Inhibitor (20 U/μl) 0.125
Nuclease free H2O 3.675
Total Volume 7

101
2.9.2: PCR using 2x TaqMan® Master mix
After the RT step, the reaction tube was diluted 62.5 fold by adding 615μl of nuclease-free
water to the 10μl RT reaction mix and each individual sample for PCR was prepared as
follows;
Component Volume (μl) per reservoir port
Diluted RT reaction 50
TaqMan 2x Universal Master mix (No
AmpErase® UNG)
50
Total Volume 100
This 100μl sample specific RT was then loaded into the large fill hole in the card with the
smaller hole allowing air to escape and not cause bubbles and hinder the filling process (see
figure 2.9.2). The card(s) are then centrifuged at 2000rpm for 1 minute to allow every well
to be loaded equally.
Figure 2.9.2: Schematic representing the loading of the Taqman® Low Density Array
(TLDA) micro-fluidic cards to analyse miRNA expression.

102
Arrays were incubated on ice for 10 minutes and subsequently run on an Applied
Biosystems® 7900HT real time PCR machine using the following cycle conditions;
2.9.3: TLDA data analysis
The resulting data from two TLDA runs generated Ct values at each cycle similar to regular
qPCR but within the TLDA software each miRNA probe is annotated with 518 miRNAs on
card A and 303 miRNAs on card B. Analysis was carried out using specialist software
Statminer® from Integromics™ for the temperature-shift profiling experiment as this
generated a huge dataset. Within each card, a set of endogenous control miRNAs are
present, the U6 endogenous control was used for normalisation to calculate the ΔCt while a
cycle threshold of ≤35 and p-value ≤0.05 were used as standard cut off criteria for
identifying differential expression miRNAs.
For the ‘MiR-Capture’ experiment, expression values were calculated using the
comparative Ct method as previously described (User Bulletin No. 2, Applied Biosystems).
Briefly, this technique uses the formula 2−ΔΔCt
to calculate the expression of target genes
normalised to a calibrator. The threshold cycle (Ct) indicates the cycle number at which the
amount of amplified target reaches a fixed threshold. Ct values range from 0 to 40 (the
latter representing the default upper limit PCR cycle number that defines failure to detect a
signal).
ΔCt values [ΔCt = Ct (target gene) – Ct (RPLP0)], were calculated for the scrambled
mismatch capture oligo sample and subsequently used as the calibrator. All gene expression
values were assigned a relative value of 1.00, to determine comparative gene expression
such that ΔΔCt = ΔCt (mismatch oligo sample) – ΔCt (XIAP capture oligo sample). PCR
amplification efficiency was calculated by analysing the standard curves from each gene
amplification, a slope of the line close to -3.3 was indicative of a 100% efficient
amplification run.
Stage Temperature Time Cycle Number
Enzyme Activation 95°C 20 sec 1 cycle
Denaturation 95°C 3 secs 40 cycles
Annealing/Elongation 60°C 30 secs

103
2.10: Functional analysis (FA) of selected gene and miRNA targets
RNA interference (RNAi) was carried out using small interfering RNA (siRNAs) to silence
the expression of specific genes mainly the valosin containing protein (VCP cat #4390555))
and X-linked inhibitor of apoptosis (XIAP cat #4390824) plus a double stranded duplex
negative control siRNA (PM- cat #4090975).
Other chemically synthesised small RNAs (pre-miR mimics or antagomirs) were used to
suppress or induce the expression of selected miRNAs. We used the following pre-miR
mimics (miR-124, miR-222 and miR-19b cat #AM17100) to validate suppression of
endogenous XIAP in CHO-K1 and GBM SNB-19 cells.
The siRNAs and miRNAs used in this project were purchased from Ambion/Life
Technologies®. The siRNAs were from the Silencer® range and the miRNAs were from
the MirVana™ range, while all were transfected into mammalian cells using NeoFX™
transfection reagent (Ambion.cat #AM4511). All transfections were carried out using
sterile 1.5mL eppendorfs or filter-cap spin tubes (Sartorius) in 2ml working volumes or in
24-well format.
2.11: Bradford Assay and Protein Quantification
In order to calculate the protein concentration of samples, a spectroscopic and colorimetric
assay called the Bradford Assay was used and is based on the absorbance shift of
coomassie brilliant blue dye from red to blue under acidic conditions.
Cells were grown in culture and underwent transfection of luciferase-promoter reporter
plasmid constructs, after 48 hours the media was removed and cells were either trypsinised
or centrifuged if using suspension cells just centrifuged. After centrifugation cell samples
were washed 3 times with PBS and cells pellets were lysed with an in-house lysis buffer
cocktail (7M Urea, 2M Thiourea, 4% CHAPS, 30mM Tris and adjusted with HCL to pH
8.5) additionally a phosphatase inhibitor (Halt™ cat#78420), RNase inhibitor (Ambion
cat#N8080119) and a protease inhibitor (Qiagen cat#19157) were added to the lysis buffer
cocktail to protect the lysed proteins from the cellular nucleases and proteases.

104
BSA stock (2μg/ml) was diluted to a half with nuclease-free water or the same lysis buffer
that the samples were processed in. Then serial dilutions from this 1000x working stock
were made to create a standard curve [1000x-750x-500x-250x-125x-0] from which the
protein concentrations of our unknown samples can be calculated from.
Using 96-well plates, a 5μl volume of lysed sample and a 250μl volume of BioRad®
Quickdye reagent (cat #500-0205) was added to each sample to be read in triplicate along
with a zero/blank sample (lysis buffer only). The samples were read using KC4 software on
a BioTek™ Synergy HT plate reader at 595nm absorbance. The intensity of the blue dye
increases as the samples protein concentration increases. Due to the disadvantage of a short
linear range of the Bradford assay, samples were usually diluted (1:10) before loading to
ensure sample results are within the standard curve range.
2.12: Western Blotting
Western blotting is a widely accepted analytical technique used to detect specific proteins
in a given sample of tissue homogenate or extract. Proteins within a sample were first
separated based on molecular weight (M.W) or isoelectric point (Pl) on a polyacrylamide
gel and then transferred to a membrane where they are probed with an antibody (Ab)
complementary to a specific protein which allowed detection of a given protein. We used
the following 6-step protocol;
2.12.1: Western sample preparation
Cell pellets were resuspended in adequate volume of cell lysis buffer (same as
bradford lysis buffer in section 2.11)
Bradford assay was performed to calculate protein concentrations to ensure all
samples contain same amount of protein
2x Laemmli sample buffer (Sigma. cat #S3401) was added to all samples to
ensure lane-to-lane consistency and reproducibility; all volumes were equal on
same gel (10μg protein)
For lanes of the gel that were empty; 2x Laemmli and sample buffer was used
only to ensure no empty wells are running
The samples were boiled at 95oC for 5 mins, centrifuged and stored at -20
oC if
not using immediately. Note: Re-boil if re-using previously frozen samples

105
2.12.2: Preparation of gel
Pre-warm Invitrogen precast Bis-Tris 4-12% gels (Invitrogen.cat #EC6175BOX) at
RT for at least 30 mins before use
Prepare 800mL of MOPS running buffer (NuPage 20x. cat #NP0001))
Rinse wells three times and remove white label/comb
Load 4μl full range M.W marker (New England Biolabs. cat #P7708S) and protein
samples into the wells
Add transfer buffer (BioRad. cat #161-0734) including NuPage antioxidant
(Ambion. cat #NP0005) (inner chamber)
The gel was run at 200V for approx. 1 hour
2.12.3: Transfer Preparation
Prepare transfer buffer (50mL per membrane) - kept on ice
Cut PVDF-membrane (approx same size as filter paper)
Equilibrate PVDF-membrane for approx 10-15 secs using methanol and rinse well
with UHP and incubate in transfer buffer
Soak filter paper in transfer buffer before use
Cut the gel, removing the wells and thick part of gel and snip corner to keep track of
orientation of gel
Equilibrate gel in transfer buffer for ~5mins on shaker platform
2.12.4: Transfer
Set up semi-dry transfer as follows;
5 sheets of Whatman 3mm filter paper (cathode plate) (Whatman. cat #1001824)
Nitrocellulose Membrane (GE healthcare. cat #RPN3032D)
Gel
5 sheets of Whatman 3mm filter paper
Remove excess air after each layer by rolling a pipette along the surface to ensure
no air bubbles remain
Transfer the proteins at 340 mA (constant), 15V max, >20mins (allow longer for
higher MW proteins)
2.12.5: Blocking / Antibodies
Stain membranes with Ponceau (Sigma. cat # P7170) to check equal loading and
successful transfer
Destain with UHP water
Block unspecific binding for 2 hours at RT with 5% milk powder (Marvel) in
TBS-T

106
Add primary antibody (1o) and incubate o/n on shaker or 2 hours at RT is
usually fine
Rinse membrane with TBS-T
Wash membrane (x3) in TBS-T, 10 mins each wash on shaker
Add appropriate secondary antibody (2o) and incubate for ~2hours
Rinse membrane again with TBS-T
Repeat x3 washes with TBS-T, 10 mins each on shaker
2.12.6: Antibody detection
Prepare detection solution : ECL (Pierce®. cat #80196) 1mL solution A and
1mL solution B (store in the dark)
Prepare developer (Kodak. cat #LX24) and fixer (Kodak. cat #FX-40) reagents,
they can be reused several times, wrap bottles in tinfoil and store at RT and in
the dark
Incubate membrane and detection solution for 1 min, remove excess fluid with
tissue and cover with transparent material (poly pockets) and careful to avoid
bubbles
In the dark room, using only the red light as it doesn’t damage the
autoradiographic film (Roche. cat #11666916001)
Cut the film to size and place film on top of membrane (careful to mark position
for orientation again)
~2-5 mins exposure time for unknown protein samples and ~30-45 secs for
Beta-actin and GAPDH controls
Careful not to over expose the film
After exposure, place film in developer (watch developing progress) and briefly
immerse in water to rinse and transfer to fixer for a few minutes till film
becomes transparent and rinse with water again
Air dried and observe gel image on film (scanned onto computer if necessary)
2.13: Dual-Luciferase Reporter Assay (DLR)
The dual-luciferase assay (Promega. cat #E1910 and E1960) was used for reporter studies.
Segments of DNA (our promoter fragments of interest in this case) were placed upstream of
a luciferase gene in promega’s pGL3-basic vector (cat #E1751) by ligation methods
(section 2.6.5). These plasmid constructs were subsequently transfected into CHO-K1 cells
for testing.

107
In addition to this, a pGL3-Control vector (Promega. cat # E1741) was also transfected as
comparison control. Finally, to normalise discrepancies in transfection efficiency, a strong
expression ‘Renilla’ luciferase pRL-CMV vector (Promega. cat #E226A) was used to co-
transfect alongside test samples.
The DLR assay can be done from any vessel. Typically a 24-well plate format was used.
The kit comes with all reagents necessary to complete assay and the protocol was as
follows;
DLR Protocol:
Sample preparation:
1. Cells were transfected with 0.5μg of test (Basic pGL3 + promoter fragments) vector
and 400ng of Renilla
2. After required time post transfection (24-48 hours typically), growth media was
removed from wells
3. Washed cells with cold PBS (1x) and subsequently removed
4. 200μl of 1x PLB lysis buffer was dispensed into all wells for testing
5. Gentle shaking of the plate for 15-20 mins on a belly dancer until all cells became
detached and lysed
6. Transferred to suitable vial/tubes for freezing or testing straight away on BioTek®
Synergy™ HT multimode plate reader (prod #7091000) and performed as per
operators manual (Bulletin #TM040)
Dual-Luciferase Assay:
1. The BioTek® reader has injector capabilities, so the injectors 1 and 2 were set to
dispense 100μl of LARII and Stop & Glo® reagent respectively
2. For measurement readings, a 1-2 second delay and 5-15 second read times were
used
3. Using special black flat bottomed (to avoid auto-luminescence) 96-well plates
~20μl of each PLB lysate sample was loaded per well
4. The software was setup and run, 100μl of LARII was dispensed and firefly-
luciferase activity was measured in kinetic reads over 10 seconds. This was
followed by 100μl of Stop & Glo® which quenched the first firefly signal and
triggered the Renilla-luciferase control to be measured over 10 second kinetic reads
also
5. All figures for firefly were normalised to Renilla values and were expressed in
relative luciferase units (RLU)
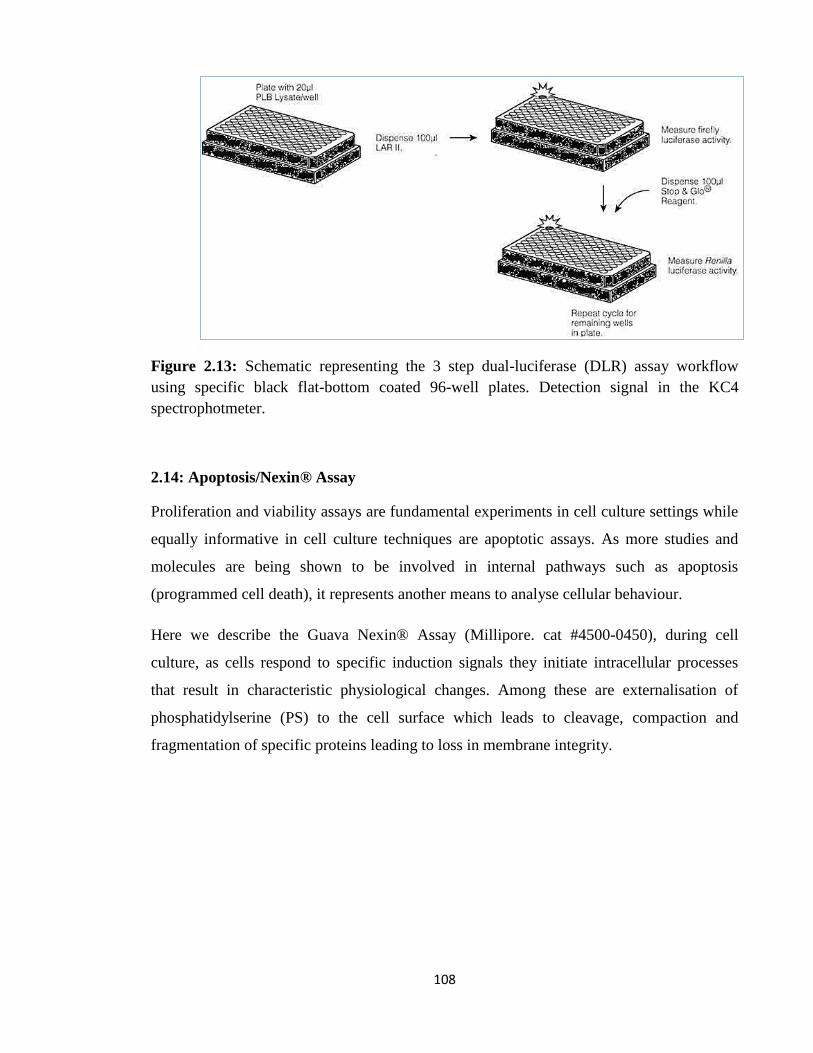
108
Figure 2.13: Schematic representing the 3 step dual-luciferase (DLR) assay workflow
using specific black flat-bottom coated 96-well plates. Detection signal in the KC4
spectrophotmeter.
2.14: Apoptosis/Nexin® Assay
Proliferation and viability assays are fundamental experiments in cell culture settings while
equally informative in cell culture techniques are apoptotic assays. As more studies and
molecules are being shown to be involved in internal pathways such as apoptosis
(programmed cell death), it represents another means to analyse cellular behaviour.
Here we describe the Guava Nexin® Assay (Millipore. cat #4500-0450), during cell
culture, as cells respond to specific induction signals they initiate intracellular processes
that result in characteristic physiological changes. Among these are externalisation of
phosphatidylserine (PS) to the cell surface which leads to cleavage, compaction and
fragmentation of specific proteins leading to loss in membrane integrity.

109
Annexin-V is a calcium-dependent binding protein with a high affinity for PS, as molecules
of PS are localized to the cell membrane where Annexin-V can readily bind them. The
Nexin® Assay was then utilised to detect levels of PS on the external membrane of a
population of cells in a sample and a built in dye 7-AAD give an indication of cell health
and structural integrity and ultimately its stage of apoptosis, as three populations can be
distinguished from the assay in tandem;
Non-apoptotic cells: Annexin V (-) and 7-AAD (-)
Early apoptotic cells: Annexin V (+) and 7-AAD (-)
Late stage apoptotic/Dead: Annexin V (+) and 7-AAD (+)
Cells were seeded based on vessel used, frequently, 6-well plates we seeded 1x10⁵ cells per
well and included suitable positive (sodium butyrate to induce apoptosis) and negative
(fresh media) controls. Cells were incubated over a timecourse of usually 7-14 days. The
Guava Nexin® reagent was equilibrated to RT prior to addition to cell samples.
Note: Cell samples must contain at least 1% BSA or FBS for the Nexin reagent to bind to
the cell surface. This was of no concern, as our samples were typically grown in 1-5%
serum.
A 100μl volume of sample was removed from each well after trypsinisation and mixed
well. Samples were placed into round bottomed 96-well plates with 100μl of Nexin®
reagent (1:1 ratio) and incubated at room temperature for 20 minutes in the dark before
acquiring and running the Guava software.
A typical output from a Nexin run is shown in figure 2.14; the software divided the plots
into 4 quadrants:
Upper left: Cell debris/nuclear debris (-) (+)
Upper right: cells in late stage apoptosis and necrotic integrity (+) (+)
Lower left: Viable cells, not undergoing detectable apoptosis (-) (-)
Lower right: cells in early stage apoptosis (+) (-)

110
Figure 2.14: Illustration of software output file after Nexin® Assay, breakdown of
4 quadrants post-acquisition of cell samples.
2.14.1: Spent media and sodium butyrate (NaBu) treatment for apoptosis studies
To induce apoptosis for apoptosis studies in this project, two conditions were used. One
was the use of late culture conditional spent media (after 9 days) and based on findings
from Druz et al, where they used spent media to induce apoptosis (Druz et al. 2011). CHO-
K1 cells grown in ATCC or SFM-II media for 9 days in culture were harvested and passed
through 0.22 micron filters to remove cells and cellular debris. The media was then
supplemented into healthy cell populations to trigger an apoptosis environment.
Additionally, sodium butyrate (NaBu) was used to trigger apoptosis also. This method was
less novel as for the last three decades, at millimolar concentrations, NaBu was added to
cell cultures, many morphological and biochemical modifications have been reported
(Kruh,J. 1982). However, more recently it has been used to increase monoclonal
productivity at low concentrations (Yoon et al. 2004), but at higher concentrations it
induces autophagy and apoptosis (Lee et al. 2012). It is the latter that we utilised NaBu for
our work.
A 1M stock of NaBu was made up in PBS. 1/2mM was deemed sufficient for induction of
low level apoptosis, while 5/10mM was needed to trigger a noticeable apoptosis effect.
Therefore from our stock we typically used 120μl in 12mLs of ATCC media to add to cells
grown in 6 or 24-well plates.

111
2.15: EPO Assay and Quantification
EPO (Erythropoietin) is a glycoprotein hormone and cytokine and is responsible for red
blood cell signalling and formation. It has a predicted molecular weight of ~34kDa.
Using a recombinant form of human EPO, a well known biopharmaceutical product, we
cloned it into the reporter plasmid constructs.
Extracellular and Intracellular levels of this protein were measured using western blotting
and reverse transcriptase qPCR in order to infer that the promoters used in this thesis can be
used to drive expression of an industrial strength important protein. EPO is secreted into the
media aswell as having intracellular levels.
For detection in western blotting, a primary polyclonal EPO antibody was given to our
group by Dr. Paul Barham, and a similar anti-EPO antibody was ordered from Abcam PLC
Cambridge (cat #Ab30545) during the later stages of the project. The EPO antibody was
diluted to 1/1000 before use and the western protocol then was followed as described in
section 2.12.
Assays were performed in 24-well suspensions and adherent plate formats to keep
concentrations of protein high and to allow for multiplexing in the same experiment.
For extracellular detection, transfection was carried out as outlined in section 2.2.16, after
4/5 days post-transfection, a 20μl volume of media was taken off and centrifuged to ensure
no cellular carryover and processed as before. Note: qPCR cannot be done on extracellular
protein.
For intracellular detection, media was removed 4/5 days post-transfection and washed twice
with 1x PBS, lysis buffer was added to cells and protein content measured via Bradford
Assay. 10μg of protein was loaded onto a Bis-Tris 4-12% SDS gel as before. Additionally,
this time replicates were left to be treated with Trizol® reagent to isolate the total RNA
from each sample to generate cDNA for qPCR analysis and EPO mRNA transcript levels.

112
2.16: p27 Assay and Quantification
Using an enzyme inhibitor called CDKN1B, also known as p27, was cloned into the
promoter-plasmid constructs in order to test the promoters of interest from a more growth
related phenotypic viewpoint. The encoded protein binds to and prevents the activation of
cyclins A-CDK2, E-CDK2 and cyclin D-CDK4 complexes, and thus controls the cell cycle
progression from G1 to S phases, therefore acting as a cell growth suppressor.
This phenotypic effect was used as a proof of concept reporter while showing that the
promoter of concern can be used in an established cell regulatory pathway scenario.
Reduction in cell numbers were indicative of p27 expression strength and proliferation
inhibition caused by the overexpression of p27, therefore by calculating the cell numbers
and growth profiles in p27 positively transfected samples we could analyse the promoters
further.
Readings were achieved by using the Guava Flow Cytometry system and Guava Viacount®
Assay once again to count the cell population numbers and viability as described in section
2.8 and values exported to excel for analysis.
2.17: Other Essential Techniques of Cell Culture
2.17.1: Single Cell Cloning via Serial Dilution
Obtaining single cell clones is an important aspect in many molecular experiments, in order
to derive a single cell and all subsequent progeny can perform identically during a certain
experiment. Cells can have differing rates of growth, gene expression and apoptosis for
example therefore by performing single cell cloning we can circumvent any variability seen
in heterogeneous mixed populations.
In 96-well plates, we used attached cells at ~90% confluency. Cell stocks were rinsed with
PBS and detached by incubation at 37oC with pre-warmed trypsin for 5-10 mins. Addition
of fresh warm media containing serum stopped the trypsin action and samples mixed well
to disrupt any possible cell clumping. An aliquot of these cells were then centrifuged and
resuspended and then the following protocol from Corning Inc™ was followed;

113
1. Fill the reagent dispensing tray with 12mL of the appropriate culture medium, then
using an 8-channel micropipettor add l00μL medium to all the wells in the 96-well
plate except well A1 (see diagram below) which is left empty.
2. Add 200μL of the cell suspension to well A1 (See Figure 1.) Then using a single
channel pipettor quickly transfer a 100μL aliquot from the first well to well B1 and
mix by gently pipetting being careful to avoid making bubbles. Using the same tip,
we repeated these 1:2 dilutions down the entire column, discarding the original
100μL from H1 so that it ends up with the same volume as the wells above it.
3. With the 8-channel micropipettor add an additional l00μL of medium to each well
in column 1 (giving a final volume of cells and medium of 200μL/well). Then using
the same pipettor quickly transfer l00μL from the wells in the first column (A1
through H1) to those in the second column (A2 through H2) and mix by gently
pipetting. Avoiding bubbles!!
4. Using the same tips, repeat these 1:2 dilutions across the entire plate, discarding
l00μL from each of the wells in the last column (A12 through H12) so that all the
wells end up with 100μL of cell suspension.
5. Bring the final volume of all the wells to 200μL by adding 100μL medium to each
well. Then label the plate with the date and cell type. Adding filtered conditioned
medium (medium in which cells have been previously grown for 24 hours) to the
wells can increase the success rate (cloning efficiency) for difficult to grow cells.
6. Incubate plate undisturbed at 37°C in a humidified CO2 incubator.

114
7. Clones should be detectable by microscopy after 4/ 5 days and be ready to score
after 7 to 10 days, depending on the growth rate of the cells. Check each well and
mark all wells that contain just a single colony. Typically the number of single
clonal events was around 10 clones per plate.
8. After 1/2 weeks, these clones should have spread out into larger single colonies
visible under the microscope. These colonies can then be subcultured from the wells
into larger vessels. Usually each clone is transferred into a single well in a 12 well
or 24-well plate for further growth.
2.17.2: Cell Sorting / FACS
A Fluorescence-activated cell sorter (FACS) can separate cells based on size and
fluorescence intensity. Unlike the Guava flow cytometry the FACS can sort cells aswell as
measure fluorescence. Cells transfected with a GFP gene can then be sorted by expression
strength in real time and placed straight into a 96-well plate to proliferate from a single
clone. Cells are directed into a stream that forms miniscule droplets after a laser is directed
at the stream, the idea is that in one of every two or three droplets will contain a single cell.
CHO cells were sorted based on fluorescence in the top 25% range, as detected by the FITC
(fluorescein isothiocyanate) channel in the software and directly placed into 96-well plates.
Pre-loaded in these plates were equal amounts of conditional and fresh ATCC media
supplemented with 2.5% FCS. Additionally, 1x Penicillin/Streptomycin solution (to avoid
bacterial contamination) plus 500μg/mL of G418 was also added. A stringent fluorescent
gating cut-off was applied using untransfected/GFP negative cells (representing basal auto-
fluorescence), this facilitated the software to discriminate between positive and negative
GFP expressing cells in the populations to be sorted.
2.18: IgG ELISA Quantitation Set
We used the Bethyl Laboratories Inc® kit (Cat#: E80-104) for the detection of human
version of the IgG antibody in supernatant from media, plasma serum and other biological
fluid samples in a convenient 96-well plate format (Cat#: E105).

115
Samples and control standards were diluted in suitable ELISA diluents (Blocking buffer +
Tween 20) as required to ensure samples were all within range of a standard curve for
concentration calculations. We used the following daily timepoints and dilutions; Day1
1\100, Day2 1\200, Day3 1\400, Day4 1\600, Day5 1\600, Day6 1\800, Day7 1\800, Day 8
1\1000.
ELISA Procedure Overview:
1. Add 100 l of standard or sample to designated wells.
[Note: Run each standard or sample in duplicate.]
2. Cover the plate and incubate at room temperature (20-25C) for 1 hour.
3. Wash the plate FOUR times.
4. Add 100 l of anti-human IgG Detection Antibody to each well.
5. Cover the plate and incubate at room temperature for 1 hour.
6. Wash the plate FOUR times.
7. Add 100 l of HRP Solution A to each well.
8. Cover the plate and incubate at room temperature for 30 minutes.
9. Wash the plate FOUR times.
10. Add 100 l of TMB Substrate Solution to each well.
11. Incubate the plate in the dark at room temperature for 30 minutes.
12. Stop the reaction by adding 100 l of Stop Solution to each well.
13. Measure absorbance on plate reader at 450 nm ABS within 30 mins of addition of stop
solution.
See the technical sheet PDF (E80-104) supplied in the kit for all other protocol information,
such as precautions, troubleshooting and calculation aids.

116
2.19: MicroRNA-mRNA moiety capture using biotinylated oligos
As mentioned in the introduction, miRNAs are responsible for the regulation of gene
expression via translational repression or messenger RNA degradation. Although numerous
bioinformatic prediction models exist to identify miRNA-mRNA interactions, experimental
validation of bona fide interactions from in vivo samples can be very difficult and
laborious.
Here we present a full microRNA ‘Mir-Capture’ affinity technique protocol which was
used to experimentally extract cognate miRNAs that target a specific mRNA. Streptavidin
beads were used along with an anti-sense capture oligonucleotide which was
complementary to a specific gene of interest. In our case, the X-linker inhibitor of apoptosis
(XIAP) gene or more specifically it’s mRNA was chosen as the target.
2.19.1: Biotinylated DNA oligo design
The secondary and tertiary structures of the CHO and Human XIAP mRNA transcript
variants were modeled with M-Fold, which is found here;
http://mfold.rna.albany.edu/?q=mfold/RNA-Folding-Form2.3.
The most thermodynamically stringent structures were selected in each case. Exposed
single strand regions were identified and used as attachment points for the oligos for each
cell line. For Human (SNB-19), two oligos were designed due to the XIAP 3’UTR being
unusually long in order to capture full length of the transcript and not miss prospective
bound miRNAs.
See table 2.19.1 for a list of the capture oligos used over the project. Two control capture
oligos were designed, one fully scrambled sequence oligo as negative control (should not
target anything) and one oligo with a 3-base mismatch to accentuate the sensitivity of the
miR-Capture assay compared to the affinity of the true capture oligo targeting XIAP.
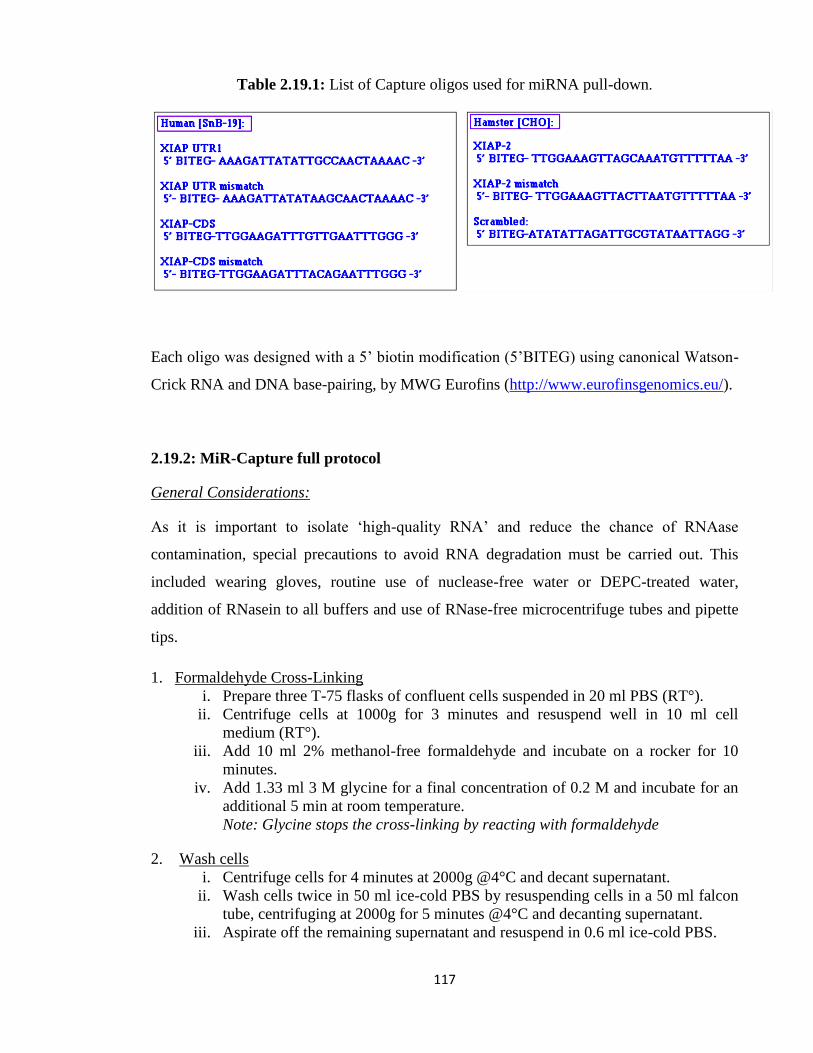
117
Table 2.19.1: List of Capture oligos used for miRNA pull-down.
Each oligo was designed with a 5’ biotin modification (5’BITEG) using canonical Watson-
Crick RNA and DNA base-pairing, by MWG Eurofins (http://www.eurofinsgenomics.eu/).
2.19.2: MiR-Capture full protocol
General Considerations:
As it is important to isolate ‘high-quality RNA’ and reduce the chance of RNAase
contamination, special precautions to avoid RNA degradation must be carried out. This
included wearing gloves, routine use of nuclease-free water or DEPC-treated water,
addition of RNasein to all buffers and use of RNase-free microcentrifuge tubes and pipette
tips.
1. Formaldehyde Cross-Linking
i. Prepare three T-75 flasks of confluent cells suspended in 20 ml PBS (RT°).
ii. Centrifuge cells at 1000g for 3 minutes and resuspend well in 10 ml cell
medium (RT°).
iii. Add 10 ml 2% methanol-free formaldehyde and incubate on a rocker for 10
minutes.
iv. Add 1.33 ml 3 M glycine for a final concentration of 0.2 M and incubate for an
additional 5 min at room temperature.
Note: Glycine stops the cross-linking by reacting with formaldehyde
2. Wash cells
i. Centrifuge cells for 4 minutes at 2000g @4°C and decant supernatant.
ii. Wash cells twice in 50 ml ice-cold PBS by resuspending cells in a 50 ml falcon
tube, centrifuging at 2000g for 5 minutes @4°C and decanting supernatant.
iii. Aspirate off the remaining supernatant and resuspend in 0.6 ml ice-cold PBS.

118
iv. Transfer to screw-cap tube and wash 50 ml falcon tube with an additional 0.6 ml
ice-cold PBS.
v. Transfer this to the screw cap tube and centrifuge for 2000g @4°C for 5
minutes.
vi. Aspirate off all supernatant and flash-freeze for 1 minute in Liquid nitrogen, -
80°C long-term storage or proceed straight to lysis step.
3. Lyse cells
i. Re-suspend cells in 0.4 ml ice cold FA lysis buffer per ~100 mg pellet.
ii. Add 0.4 ml 0.5 mm glass beads.
iii. In a screw-cap microtube, lyse cells by using a FastPrep cell disrupter 4 times
for 30 sec at speed 5.5, incubating sample on ice between each treatment.
iv. Puncture a hole in the bottom of the tube with a sterile 0.45 mm needle.
v. Place the tube into another microtube in a 15-ml centrifuge tube. Centrifuge for
5 minutes at 3500 g @4°C.
vi. Add 0.6 ml FA lysis buffer to the beads and centrifuge the sample for 5 minutes
at 3500g @4°C.
vii. Optional Add 0.4 ml FA lysis buffer to lysate to dilute sample.
Can store at -80oC.
Can check RNA fragment size on a polyacrylamide gel.
4. DNase Treatment
i. Mix the lysate by pipetting.
ii. On ice add the following to 1.4 ml lysate:
25 mM MgCl2
5 mM CaCl2
120U Rnasein
120 μg RNase-free DNase I.
iii. Mix by flicking the tube, centrifuge and incubate at 37°C for 15 minutes.
iv. Add 20 mM EDTA to stop the reaction.
v. Centrifuge the lysate for 5 minutes at 18,000g at 4°C.
vi. Transfer the supernatant to a new screw-cap tube.
This is potential stopping point when the lysate is flash-frozen and stored at -
80°C. However, this is unadvisable.
Magnetic Separation
5. Bead Preparation
i. Re-suspend beads in the original vial by rotation or vortexing.
ii. Transfer 0.2 ml beads per sample to Eppendorf tubes.
iii. Mix in 1 ml of 1X B&W Buffer to each tube and place on a Dynal magnet for 2
mins. If >0.4 ml beads, pellet them first for 2 minutes on the magnet and
remove supernatant prior to adding 1 ml 1X B&W Buffer.
iv. Remove supernatant by aspiration with a pipette while the tube is on the
magnet
v. Remove the tube from the Dynal magnet and add 1 ml 1X B&W buffer.
Consolidate samples to one tube if possible.

119
vi. Repeat steps iii-v x 2 (total washes 3 times)
vii. Wash the beads twice in 1 ml Solution A (RT°) for 2 minutes and pellet beads
for 2 minutes.
viii. Wash the beads once in 1 ml Solution B (RT°), pellet beads for 2 minutes and
remove all supernatant.
6. mRNA:microRNA Capture
i. Resuspend beads in twice the original volume of 2X B&W buffer (pH 7.5) (i.e.
: 400 μl per 200 μl beads).
ii. Add the same volume of oligonucleotides resuspended in 1X TE buffer at 0.8
μmol per oligonucleotide per sample (8 μl of 100 μM oligo).
iii. Incubate on the tube rotator for 15 minutes at RT° to allow the oligos to bind to
the beads.
iv. For each sample, take 800 μl bead mix, remove buffer/oligo mix and wash
them twice in 1 ml of 1X B&W buffer (pH 7.5) @RT°.
v. Resuspend beads in 0.7 ml Hybridisation Buffer @ 37°C.
vi. Add 0.5 ml 1X TE (pH 7.5) @ 37°C and add 0.2 ml of the cell lysate.
vii. Incubate, while rotating in the hybridisation oven for 1.5 hours at max speed at
37°C.
viii. Resuspend the beads in 1 ml Washing Buffer A @37°C and rotate in the
hybridisation oven at 37°C at max speed for 5 minutes. During pelleting make
sure that beads stuck to the cap of the tube are also washed down.
ix. Repeat step viii another 3 times (total of 4 times).
x. Resuspend the beads in 1 ml Washing Buffer B @37°C and rotate in the
hybridisation oven at 37°C at max speed for 5 minutes.
7. Elution of mRNA:microRNA complex
i. Place the microfuge tube into the Dynal Magnet. Ensure that the tubes are
properly inserted.
ii. Allow the microfuge tube to remain in the Dynal for 2 minutes. Gently shake
while the microfuge tubes are held in position
iii. Remove Wash Buffer B by aspiration with a pipette while the tube remains in
the Dynal Magnet. Avoid aspiration along the wall where the dynabeads are
attracted by the magnet
iv. Resuspend the beads in 200 μl 1X TE buffer (pH 7.5) @80°C by flushing the
desired volume of medium along the side of the tube where the target material
is attracted. Resuspend well.
v. Heat to 80oC for 5 minutes (this will elute the sample and partially reverse
crosslinks).
vi. Place the tube immediately on the Dynal magnet for 10 seconds and transfer
the eluted mRNA in the supernatant to a new RNAase free tube. Carefully
ensure no beads have been transferred. This can be checked by centrifuging
and observing a brown pellet. Can store at -80oC
8. Reverse cross-link and Purify RNA
i. Incubate the samples at 70°C for 45 minutes to reverse the formaldehyde
crosslinks.

120
ii. Purify the sample using Trizol-chloroform-ethanol precipitation or column-
based purification (High pure miRNA isolation kit – Roche cat #
05080576001).
iii. Measure RNA yield, and proceed to Reverse Transcription qPCR (See section
2.6.15).
iv. Samples ready for TLDA expression analysis. TLDA (A+B) Human specific
micro-fluidic cards were used for all processed samples and run on the Applied
Biosystems® 7900HT fast thermal cycler (section 2.9).
v. Enrichment analysis using the ΔΔCT method in excel was performed.
2.20: Bioinformatic and Regulatory Web-based software
Over the course of this project, many web-based software programs were utilised, for a
plethora of reasons; to identify genomic data, to design primers, to check melting
temperatures, to predict important regulatory sequences of DNA, sequence retrieval and
searching gene nomenclature etc.
The web resource Regulatory Sequence Analysis Tools (RSAT: http://rsat.ulb.ac.be/rsat/)
offers a collection of these tools dedicated to processing the above enquiries. RSAT
currently holds >100 fully sequenced genomes, and continually updated by GenBank.
Table 2.20: List of all existing bioinformatic programs that were used during the project,
including all hyperlinks and a brief description of the programs function.
Web Tool: Hyperlink: Description:
UCSC http://genome.ucsc.edu/ Genome browser for
mammals/BLAT/In silico work
MWG Eurofins http://www.eurofinsgenomics.eu/ Oligo and small molecule
ordering/Sequencing checks
Genomatix http://www.genomatix.de/ Generation of genome wide
transcription factor data
OligoCalc http://www.basic.northwestern.edu/biotools/oligocalc.html Oligonucleotide Properties
Calculator/ Tm
calculator/Hairpin loop
formations/primer design
M-Fold http://mfold.rna.albany.edu/?q=mfold/RNA-Folding-
Form2.3 2
o/3
o structure folding
pattern/Visual interpretation
CHO consortium http://www.chogenome.org/ Expansive CHO sequence
database/BLAST
ClustalW/Omega http://www.ebi.ac.uk/Tools/msa/clustalw2/ Multiple sequence alignment
program for DNA/RNA or
proteins
CGCDB http://www.cgcdb.org/ Transcript database for CHO
coexpression gene patterns and
correlation maps

121
Section 3.0
Results
Project 1
Endogenous CHO promoters as tools to drive transgene
expression.

122
3.1: Identification, Isolation and Verification of CHO gene Promoters
3.1.1: Introduction
The aim of this project was to identify and exploit endogenous Chinese Hamster Ovary
(CHO) gene promoters to enhance heterologous protein expression and in turn improving
cell lines used for biopharmaceutical production. To date ~70% of genetically engineered
proteins for human therapy (arthritis, cancer, diabetes etc) are produced in mammalian cells
and more specifically CHO cells.
The cost of manufacturing biopharmaceuticals needs to be reduced in the interests of both
patient welfare and sustaining an innovative research and development ethos. By finding
ways to optimise the production of these drugs and minimise the costs involved, the
research described herein may play a role in lowering the overall costs of these therapies.
Initial profiling undertaken in the NICB collaboration with Pfizer generated an expansive
detailed dataset with 300+ expression profiles, which have been compiled using a unique
2nd
generation Wyeth proprietary (WyeHamster3a) microarray chip. In generating this
dataset, the cell samples used covered numerous cell-lines growing in different process
scenarios, at different temperatures, at different stages of cell culture progression, Qp,
lactate/ammonia production, and protein products produced. These samples were then
profiled from a transcriptomics viewpoint via the said microarray chips.
This extensive dataset was then mined for example to identify target genes linked to cell
lines with advantageous phenotypes [cells capable of reaching high density, high
productivity, fast growth, tolerance to lactate or ammonia waste]. This created a sample
matrix giving a sizable bioinformatics dataset to tackle the original aim to identify CHO
genes with potential as cell engineering targets.
To identify genes that are temperature responsive, the dataset was analysed based on
differential between 37oC (regular culture temperature) and 31
oC (mild hypothermic
culture). Thus promoters from promising candidate genes could be targeted for cloning and
analysis.
Viral promoters have been well documented as highly active in driving transgene
expression in different cell types and many are used commercially (SV40, CMV, RSV and
123
LTR) (Walther and Stein 1996) (Zarrin et al. 1999). As viral genomes are much smaller
than mammalian genomes, the architecture of promoters is easier to study. Eukaryotic gene
expression is more complex and requires precise coordination of complex regulatory
architecture (promoters, enhancers, silencers). Recognition and binding of these promoter
sequences by transcription factors occurs within the context of chromatin, whose dynamic
structural characteristics play a significant role in regulating gene expression (Mellor 2005).
A central dichotomy in industrial protein production revolves around the control between
converting cellular metabolic energy for biomass generation versus product secretion.
Many processes nowadays incorporate an initial growth phase quickly followed by a switch
to production phase whereby cell growth ceases and cellular machinery resources are
directed to protein synthesis. This is achieved most readily via temperature shift, and
although highly useful can present logistical challenges in large bioreactors. Genes can be
antagonistic during this biphasic setup, for example overexpression of proliferation-
enhancing genes would be advantageous earlier in the growth phase, but undesirable later
in the production phase, it is this aspect that this project addresses.
By undertaking this study, firstly, we aim to identify promoters capable of driving
expression of various protein products to test their applicability and to expand the CHO
metabolic engineering toolbox. And secondly, to assert temporal control over bioprocess-
engineering transcripts (for example; growth, viability, productivity and apoptosis related
genes) that can be switched on or off at the appropriate times to maximise their effects in
the production process. In doing so, we intend to investigate whether endogenous inducible
promoters are more attractive than viral and other existing inducible systems.
3.1.2: Identification of Temperature-sensitive genes in ‘Omics dataset
3.1.2.1: Choosing target genes for study
The original transcriptional profiling used to identify potential promoters, generated over
300 expression profiles, covering numerous CHO cell lines grown at various stages during
a wide series of time points.

124
This gene expression analysis, carried out on the proprietary CHO-specific WyeHamster2a
microarray, enabled the study of ~3,500 sequences, representing approximately 10-15% of
the CHO transcriptome (Melville et al. 2011).
All microarray data were processed as described previously and analysis was conducted
with the help of Dr. Colin Clarke a bioinformatician for the NICB/NIBRT (Clarke et al.
2011). Weighted gene coexpression network analysis (WGCNA) was utilised to explore
CHO cell transcriptome patterns associated with bioprocess relevant phenotypes. Cells
were sampled for gene expression analysis at various stages of the culture and bioprocess-
relevant characteristics including cell density, growth rate, viability, lactate, ammonium and
cell specific productivity (Qp) were also determined.
A probe set is a collection of probe sequences designed to interrogate a given
complementary sequence. The dataset used consisted of 295 microarrays from 121
individual CHO cultures producing a range of biologics including monoclonal antibodies,
fusion proteins and therapeutic factors. Non-producing cell lines were also included in the
study consisting of CHO-K1 and CHO-DUX cell types (Clarke et al. 2011). The complete
sampleset can be found online at (ncbi.nlm.nih.gov/geo/query/acc.cgi?acc=GSE3032).
We wanted to identify genes from the dataset whose expression changed from high to low
or vice versa in response to a temperature shift to 31oC. We then analysed the fluorescent
expression readings to discern values most positively or negatively correlated with culture
temperature – in this case either 37oC or 31
oC (Table 3.1.2.1).

125
Table 3.1.2.1: List of genes most highly correlated or anti-correlated with culture
temperature. The list represents the resulting directory of genes up-regulated at 31oC (blue)
and genes down-regulated at 31oC (red) temperature shift, the closer the correlation is to -1
or 1 the more differentiated it is. Additionally, logarithmic and linear fluorescence
expression (Exp) units and Fold change (FC) were shown for each temperature.
Table 3.1.2.1 showed the correlation values and expression fold-change (FC) plus the
fluorescence units from the probe sets, while the p-values indicated how significant the
result was. As expected Cirbp (a well known cold-shock protein (CSP) and discussed
further in section 1.9.2) is top of the dataset as it was upregulated at 31oC. Interestingly
PPID showed slightly higher correlation but in the opposite direction, i.e: down-regulated
at 31oC. Full gene nomenclature can be found in table 3.1.4.
Figure 3.1.2.2, illustrates a theoretical correlation between gene expression and
temperature. The closer the (PCC) Pearson correlation coefficient (a measure of the
strength and direction of the linear relationship between two variables that is defined as the
sample covariance of the variables divided by the product of their standard deviations) is to
-1 or 1, the better differentiated it is between 37oC and 29-31
oC and thus indicative of
potential induciblity strength.
Fluorescence Exp Units from Probes
Probeset ID Gene ID Correlation p value log2 37C log2 31C Lin 37 Lin 31 FC
AF022942_at Cirbp -0.8300 2.84E-76 5.0580 6.4685 33.3 88.6 2.66
WAN013I2Q_at SSU72 -0.8156 1.41E-71 6.3503 7.4743 81.6 177.8 2.18
WAN013I96_at MDM2 -0.7859 4.10E-63 5.8465 6.8534 57.5 115.6 2.01
WAN008E3Q_at Zfp180 -0.7835 1.69E-62 5.0642 5.5602 33.5 47.2 1.41
WAN008CFZ_at HSBP1 -0.7772 6.73E-61 6.8876 7.5605 118.4 188.8 1.59
WAN0088WY_at RBBP9 -0.7614 4.20E-57 5.0998 5.3787 34.3 41.6 1.21
WAN008E1S_at PPID 0.8826 4.57E-98 6.0474 4.9556 66.1 31.0 2.13
WAN013HVE_at NARS 0.8363 1.85E-78 6.9074 6.0437 120.0 66.0 1.82
WAN013I1P_at HNRPA2B1 0.7923 7.66E-65 8.1388 7.0289 281.9 130.6 2.16
WAN008CX4_at MCM5 0.7690 6.96E-59 6.1437 5.0653 70.7 33.5 2.11
WAN008DZY_at MCM7 0.7511 8.94E-55 6.9750 6.0094 125.8 64.4 1.95

126
Figure 3.1.2.2: Graphical representation of the theory behind the correlation analysis. Two
genes were chosen for illustration purposes. 1 and -1 represent perfect correlation or anti-
correlation between gene expression and temperature.
This approach was based on the hypothesis that genes whose mRNA levels closely
correlate to temperature changes, are likely to be under the transcriptional control of
temperature-sensitive promoters. These promoters, in turn, could be utilised for driving
expression of choice transgenes, to engineer particular CHO phenotypes in a process
parameter-dependant manner, temperature in this case.
3.1.2.2: Identification of constitutive genes
In addition to temperature sensitive genes, we also looked for constitutively highly
expressed genes within the dataset whereby the expression level stayed constant (ideally at
a high level) regardless of process stage (Exponential, Lag), temperature and irrespective of
cell line.
The premise being that, strong endogenous promoters might be useful alternatives to viral
promoters for transgene expression. Constitutive expression ideally should be independent
of any exogenous stimulus or response, compared to inducible expression which can be
controlled by exogenous signals (Williams, Christensen and Helin 2011).

127
Figure 3.1.2.2.1: Graphical representation depicting the expression level between
temperature change samples across the entire dataset. Some genes can have higher
expression values but large variability; PPIA and UBA52 have the highest mean expression
across the sampleset value while maintaining relatively low variance.
All genes below the expression threshold of 100 fluorescent units were discounted from
subsequent study as they would not be expected to drive transgene expression to an
adequate level and were identified as having high mean fluorescent expression detected by
the microarray probes while those highly expressed with the lowest variance (cut-off of
0.06 was applied) were deemed most suitable for further study and cloning (Figure
3.1.2.2.1).

128
Table 3.1.2.3 (A): List showing the least variable genes across the entire dataset at 37oC. Fluorescence mean denotes the log2 mean
intensity of the fluorescent probe for a particular gene. Variance accounts for the standard deviation of the genes mean intensity across
all probes.
37oC Gene Fluorescence
Probeset ID Symbol Gene Name: MEAN Variance
WAN013I1V_at NA POSSIBLE UNIGENE 11.6565 0.0477
WAN013I9I_at PPIA Peptidylprolyl isomerase A (cyclophilin A) 11.3494 0.0598
WAN008DXW_at RPLP1 Ribosomal protein, large, P1 11.1367 0.0579
WAN0088IV_x_at Mm.393149 Transcribed locus, moderately similar to XP_223768.3 PREDICTED: similar to OTTHUMP00000060196 10.7009 0.0533
WAN013HXJ_at NA Cluster includes WAN008D0Z 10604B-D01 10.6103 0.0600
AF081142_at UBA52 Ubiquitin A-52 residue ribosomal protein fusion product 1 10.5659 0.0569
WAN013I40_at Mm.309697 PREDICTED: Mus musculus similar to ribosomal protein S14, transcript variant 2 (LOC545121), mRNA 10.5620 0.0474
WAN013I1R_at CHCHD2 Coiled-coil-helix-coiled-coil-helix domain containing 2 10.1004 0.0459
WAN008COL_at RPL29 Ribosomal protein L29 9.7244 0.0580
WAN013I0F_at RPL4 Ribosomal protein L4 9.6603 0.0577
WAN008EDB_at COX4I1 Cytochrome c oxidase subunit IV isoform 1 8.9102 0.0482
WAN008D39_x_at AUP1 Ancient ubiquitous protein 1 8.6597 0.0175
X13175_f_at NA X13175 Hamster KG4 mRNA related to cellular proliferation 8.5803 0.0400
WAN00OGTM_x_at NKX6-1 NK6 transcription factor related, locus 1 (Drosophila) 8.5116 0.0546
U62588_x_at SDC1 Syndecan 1 8.4345 0.0532
WAN008D42_at HSPB8 Heat shock 22kDa protein 8 8.4132 0.0587
WAN008EXK_x_at Uqcrc1 Ubiquinol-cytochrome c reductase core protein 1 8.3798 0.0419
WAN013I9C_at SDHC Succinate dehydrogenase complex, subunit C, integral membrane protein, 15kDa 8.3225 0.0531
L00366_x_at TK1 Thymidine kinase 1, soluble 8.2619 0.0438
WAN008E36_at PSMB5 Proteasome (prosome, macropain) subunit, beta type, 5 8.2396 0.0455

129
Table 3.1.2.3 (B): List showing the least variable genes across the entire dataset at 31oC. Fluorescence mean denotes the log2 mean
intensity of the fluorescent probe for a particular gene. Variance accounts for the standard deviation of the genes mean intensity across
all probes.
31oC Gene Fluorescence
Probeset ID Symbol Gene Name: MEAN Variance
WAN014IYJ_at NA WAN014IYJ Internal ribosomal entry site (IRES) from AR135605 Sequence 1 from Wyeth patent US 6136536. 12.8454 0.0521
WAN013I14_at NA POSSIBLE UNIGENE 12.2278 0.0531
WAN013I1V_at NA POSSIBLE UNIGENE 11.5927 0.0206
WAN014IYS_f_at DHFR Dihydrofolate reductase 11.4824 0.0436
WAN013I9I_at PPIA Peptidylprolyl isomerase A (cyclophilin A) 11.3603 0.0523
WAN013HV1_at RPS8 Ribosomal protein S8 11.1138 0.0583
AF081143_at Rps18 Ribosomal protein S18 11.0390 0.0515
WAN0088IV_x_at Mm.393149 Transcribed locus, moderately similar to XP_223768.3 PREDICTED: similar to OTTHUMP00000060196 [Rat] 10.7042 0.0509
WAN013I40_at Mm.309697 PREDICTED: Mus musculus similar to ribosomal protein S14, transcript variant 2 (LOC545121), mRNA 10.6191 0.0487
AF081142_at UBA52 Ubiquitin A-52 residue ribosomal protein fusion product 1 10.5677 0.0547
WAN013I06_at NA Cluster includes WAN008E0Q 11229C-H06 10.3438 0.0504
WAN013I1E_at 1810064F22Rik RIKEN cDNA 1810064F22 gene 10.1183 0.0499
WAN013I1R_at CHCHD2 Coiled-coil-helix-coiled-coil-helix domain containing 2 10.0775 0.0430
WAN013HXA_at Gnb2l1 Guanine nucleotide binding protein (G protein), beta polypeptide 2 like 1 10.0269 0.0480
WAN013I3Q_at RPS19 Ribosomal protein S19 9.8787 0.0441
WAN008COL_at RPL29 Ribosomal protein L29 9.7988 0.0447
WAN013I1Y_at EIF3S2 Eukaryotic translation initiation factor 3, subunit 2 beta, 36kDa 9.6027 0.0589
WAN008EDB_at COX4I1 Cytochrome c oxidase subunit IV isoform 1 9.0282 0.0434
WAN008ENW_at TKT Transketolase (Wernicke-Korsakoff syndrome) 8.8994 0.0573
WAN013HZU_at Sdhc Succinate dehydrogenase complex, subunit D, integral membrane protein 8.7338 0.0468

130
The four genes highlighted in blue table 3.1.2.3(A+B), were prioritised for isolation of their
respective promoter sequences; PPIA, UBA52, COX4l1 and Sdhc. As can be seen from the
fluorescence values for these four genes, there was very little fluctuation between their
expression at 37oC and 31
oC.
In contrast, DHFR was highly expressed with low variance seen across all samples cultured
at 31oC (Figure 3.1.2.3 B), however it was not found amongst the list of most highly
expressed genes at 37oC (Figure 3.1.2.3 A). DHFR was a transgene from a plasmid cloned
into CHO cells and driven by a viral promoter, so high expression levels were expected as
viral promoters generally drive high expression levels of genes they precede.
In addition to the mRNA expression profiling dataset mentioned, we also had access to a
microRNA profiling dataset generated in the lab previously. This dataset contained
expression data on approx 350 miRNAs across 30 CHO samples with varying growth rates.
Upon similar analysis, as performed on the mRNA dataset, the miR-17-92 cluster was
found to be highly expressed and constitutive across samples. Therefore, we also prioritised
isolating the promoter of this miRNA cluster to investigate its potential to drive constitutive
transgene expression. Independent of this profiling, the cluster has been shown to be
involved in highly proliferative cell types such as; Neuroblastoma and lung epithelial
progenitor cells reported by (Mestdagh et al. 2010) (Lu et al. 2007) respectively.
3.1.3: Target gene summary
Now that priority gene targets were identified, the next step with our investigation was to
validate these CHO-specific target genes from tables 3.1.2.2 and 3.1.2.3 above.
Figure 3.1.3, shows all gene targets extrapolated from expression profiling regarding
inducible and constitutive expression. In 2011, Xu et al released a draft CHO-K1 genome
assembly comprising of 2.45 Gb of genomic sequence, with 24,383 predicted genes
arranged in scaffolds after whole genome shotgun sequencing. The availability of this
genomic sequence facilitated us in identifying the CHO-specific target gene sequences
which were arranged on assembly scaffolds (Xu et al. 2011).

131
Table 3.1.3: Full Cricetulus griseus (CHO) Gene names, NCBI/GenBank scaffold ID and
common functions they are involved in.
Gene Full Name Scaffold ID Function
Cirbp Cold inducible RNA
binding protein Scaffold 881_79
SSU rRNA binding mRNA 3'-UTR binding nucleotide binding poly(A) RNA binding Translation repressor activity
SSu72 RNA Polymerase II
CTD Phosphatase
Homolog
Scaffold 2657_20
CTD phosphatase activity Protein binding
MDM2 Mouse 3T3 double
minute 2 homolog Scaffold
414_104+414_105
Enzyme binding Identical protein binding Ligase activity Metal ion binding p53 binding
PPID Peptidylprolyl
isomerase D Scaffold 1479_109 Estrogen receptor binding
Heat shock protein binding Peptidyl-prolyl cis-trans
isomerase activity Protein binding Transcription factor binding
Nars asparaginyl-tRNA
synthetase Scaffold 1555_74
ATP binding asparagine-tRNA ligase activity Nucleic acid binding
HNRPa2b1 Heterogeneous nuclear
ribonucleoprotein
A2/B1
Scaffold 291_30
RNA binding Nucleotide binding poly(A) RNA binding pre-mRNA intronic binding
PPIA peptidylprolyl
isomerase A
(cyclophilin A)
Scaffold 750_45 Peptidyl-prolyl cis-trans isomerase activity
Poly(A) RNA binding Protein binding Unfolded protein binding Cyclosporin A-mediated
immunosuppression Virion binding
UBA52 ubiquitin A-52 residue
ribosomal protein
fusion product 1
Scaffold 1845_23 Targeting cellular proteins for degradation by the 26S proteasome
Maintenance of chromatin structure
Regulation of gene expression Regulation of stress response
miR-17-92
cluster [miR-17, miR-18a, miR-19a, miR-20a, miR-19b, and miR-
92a]
miRNA polycistron
consisting of also
known as oncomir-1 or
host gene [MIR17HG]
Scaffold 3425_6 Found in several human B-cell lymphomas (non-Hodgkin's)
Regulates cell proliferation and collagen synthesis
Over expressed in Lung cancers

132
In light of the dogma regarding promoters being located adjacent/upstream to the genes
they control, in order to isolate sequence, the location of each promoter and the ATG start
codon was determined. The CHO sequence was identified using cross-species alignments
from mouse, human, and rat sequence conservation. We implemented an arbitrary range of
~5000bp upstream of this determined ATG start site (+1) in order to optimistically capture
all putative regulatory sequence. First we will present the validation of these genes as
suitable targets, the workflow and isolation of putative promoters will be expanded further
in sections 3.1.7 and 3.1.8.
3.1.4: Real Time-qPCR validation of target genes
The first objective was to differentiate between target genes that exhibit temperature shift
dependant expression versus mRNAs that are simply more stable and thus remain in the
cells cytoplasm for longer. High mRNA transcriptional turnover rather than increased
mRNA stability should be indicative of a more active/responsive promoter.
First RT-qPCR was performed on these genes in the original RNA samples from the
previous profiling experiment (Table 3.1.4.1), to verify the array-detected levels of the
priority genes and provide further evidence for choosing them as targets.
Table 3.1.4.1: RNA sampleset tested via qRT-PCR for the expression levels of all
identified target genes. Note: miR-17-92 was determined in a separate sample set profile
including small RNAs.
Sample
ID Cell Type
Time
Point
Culture
Temp oC
Cell Density
(x106
cells/ml)
Culture
vessel type
Culture
volume
135 CHO DG44 3 Days 37 1.19 Shake Flask 50 mls
244 CHO DUX 3 Days 37 2.54 Shake Flask 50 mls
294 CHO DUX 3 Days 29.5 10.4 Bioreactor 1 liter
204 CHO DUX 4 Days 37 2.37 Shake Flask 30 mls
336 CHO DUX 5 Days 31 9.23 Shake Flask 50 mls
309 CHO DUX 7 Days 37 2 Bioreactor 1.6 liters
209 CHO DUX 8 Days 31 3.27 Shake Flask 30 mls
20 CHO K1 3 Days 37 3.19 Bioreactor 1 liter
265 CHO K1 5 Days 31 7.57 Shake Flask 200 mls
99 CHO K1 7 Days 37 2.64 Shake Flask 60 mls
175 CHO K1 9 Days 31 8 Bioreactor 1.8 liters
442 CHO K1 10 Days 31 9.93 Bioreactor 2 liters

133
By choosing a diverse RNA sampleset for validation, including wide variation in culture
growth timepoints, different CHO cell types and of course different culture temperatures,
the aim was to have as wide a scope as possible.
The first step was to order specific qPCR primers (see appendices) for the same targets.
Some considerations were needed here. These qPCR-specific primers differed from cloning
primers seen in section 3.1.6. All qPCR primers were designed as stringently as possible to
each other with respect to melting temperature (~56-61oC), nucleotide size and GC content,
to allow analysis of more than one gene set per 96-well reaction plate. Also by ensuring the
primers spanned intron-exon boundaries, provided assurance that the mRNA target only is
detected after reverse transcription. Additionally, by designing the primers to produce small
amplicons (~100-250bp) this promotes efficient amplification to ensure they are accurately
quantified.
In order to perform absolute qPCR analysis to calculate the mRNA copy number for each
gene target, first we needed to generate material for a standard curve. In parallel, the
sampleset RNA quality was verified on an agarose gel to ensure the samples were of
suitable quality (Figure 3.1.4.1).
Figure 3.1.4.1: Agarose gel electrophoresis to perform a RNA quality check on the CHO
sampleset extrapolated from Table 3.1.4.1. Sample ID labels are shown on the gel image
(Black). Both large and small ribosomal subunits (28S and 18S) were shown to be intact
across sampleset and the 28S subunit was approximately double the intensity of the 18S.

134
Traditionally, the intensity of these rRNA bands on denaturing agarose gels have been used
to calculate a ratio that served as an indication of RNA integrity. A 28S/18S gradient of two
is considered to be indicative of good quality RNA. The RNA samples were all deemed to
be sufficient quality for proceeding to qPCR validation, with very little smearing, which is
often an indication of RNA quality (Figure 3.1.4.1).
Next the RNA samples from Table 3.1.4.1 were reverse transcribed to convert RNA to
cDNA; 1μg in total was used in a 20μl reaction with a DNase treatment step beforehand to
ensure no DNA carryover into the qPCR reaction.
Separately, standard PCR and agarose gel extraction were performed to isolate and purify
all gene amplicons for the standard curve generation. Absolute quantification relates the
PCR signal to input copy number using a calibration curve.
To generate material/transcript copies of each gene for this standard curve, we generated
the amplicons using regular PCR and subsequently analysed them using Agilent
technologies Bionalyzer 2100® to ensure a single amplicons that were contamination free
and of good quality (Figure 3.1.4.2).
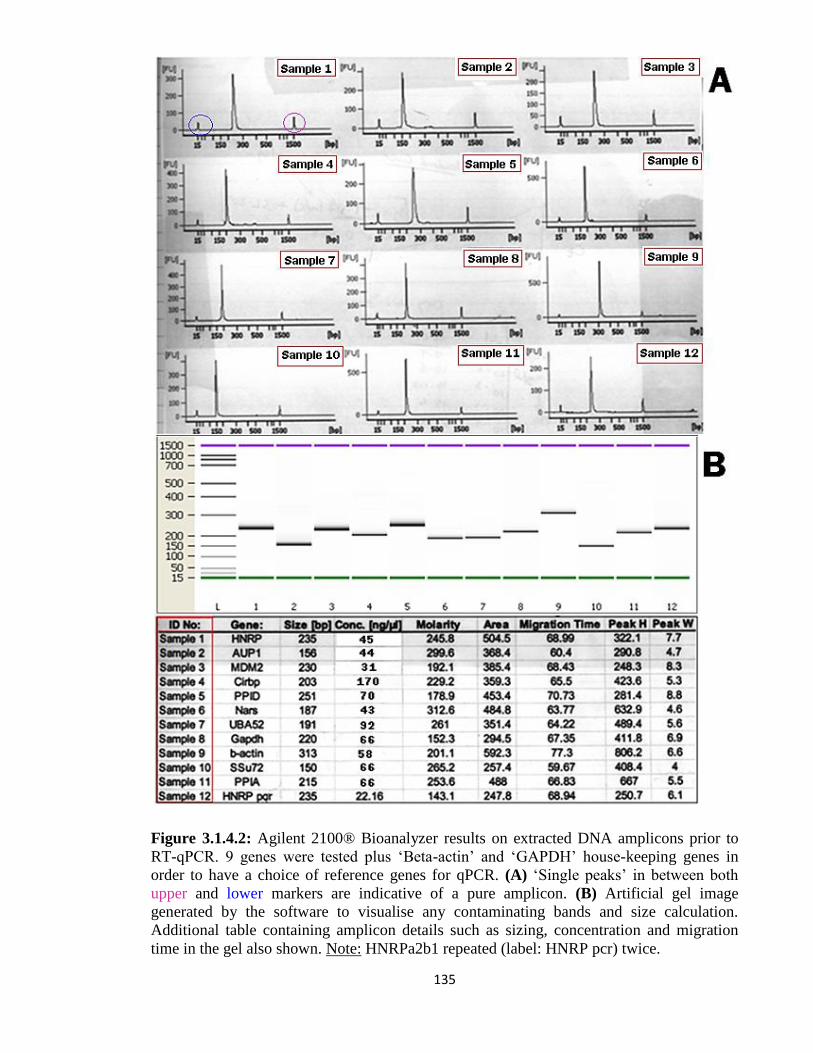
135
Figure 3.1.4.2: Agilent 2100® Bioanalyzer results on extracted DNA amplicons prior to
RT-qPCR. 9 genes were tested plus ‘Beta-actin’ and ‘GAPDH’ house-keeping genes in
order to have a choice of reference genes for qPCR. (A) ‘Single peaks’ in between both
upper and lower markers are indicative of a pure amplicon. (B) Artificial gel image
generated by the software to visualise any contaminating bands and size calculation.
Additional table containing amplicon details such as sizing, concentration and migration
time in the gel also shown. Note: HNRPa2b1 repeated (label: HNRP pcr) twice.

136
For creation of the standard curve we calculated the copy number for each gene amplicon,
to generate a stock DNA concentration in [ng/μl]. These stocks were used to generate a
standard curve via serial dilution for each gene after using a dsDNA copy number
calculator found here http://cels.uri.edu/gsc/cndna.html.
This calculation is based on the assumption that the typical weight of a base pair (bp) is
650Da. This means that one mole of a bp weighs ~650g and that the molecular weight of
any double stranded DNA template can be estimated by taking the product of its length
(in bp) and 650 and by using Avogadro's number, 6.022x10²³
molecules/mole, the number
of molecules of the template per gram can be calculated.
Next serial dilutions were performed to represent the exponential dilutions based on each
order of magnitude (10^). Ideally, having ~3.3 PCR cycle difference between each genes
10-fold dilution is indicative of efficient amplification cycles. By pre-calculating all copy
numbers of the stock gene amplicons as shown in table 3.1.4.4, the CTs calculated from
each run can be cross referenced to the standard curve for each gene to establish the copy
number. In this way we can evaluate if there is a difference in mRNA copy number across
the sampleset in response to temperature change.
Note: Only three genes were prioritised from here onwards, Cirbp, MDM2 and SSu72 and
are representative of the analysis done on the entire gene target list (Table 3.1.3). Post-
validation, these 3 genes were highlighted as the best candidates (based on initial GFP
screen performance) and became the main focus of this project and encouraged us to avoid
displaying repetitive results.

137
Table 3.1.4.4: Total copy number per 20μl stock for Cirbp, MDM2 and SSu72 genes with
exponential dilution concentration and their respective copy numbers per 20μl calculated
from a standard curve. Figure representative of all genes tested, however, only three genes
with the highest priority for the next phase of analysis were shown.
Gene
Total Copy (per
20μl) Sample dil Conc [ng/ μl]
Copy No per
20μl:
Cirbp 10 -1 17 9.55E+10
Stock Conc: 170ng/ul 9.55E+11 10 -2 1.7 9.55E+09
Amplicon size: 165bp 10 -3 0.17 9.55E+08
10 -4 0.017 9.55E+07
10 -5 0.0017 9.55E+06
10 -6 0.00017 9.55E+05
10 -7 0.000017 9.55E+04
10 -8 0.0000017 9.55E+03
10 -9 0.00000017 9.55E+02
10 -10 0.000000017 9.55E+01
Gene
Total Copy (per
20μl) Sample dil Conc [ng/ μl]
Copy No per
20μl:
MDM2 10 -1 1.6 1.6E+10
Stock Conc: 31ng/ul 1.60E+11 10 -2 0.16 1.6E+09
Amplicon size: 180bp 10 -3 0.016 1.6E+08
10 -4 0.0016 1.6E+07
10 -5 0.00016 1.6E+06
10 -6 0.000016 1.6E+05
10 -7 0.0000016 1.6E+04
10 -8 0.00000016 1.6E+03
10 -9 0.000000016 1.6E+02
10 -10 0.0000000016 1.6E+01
Gene
Total Copy (per
20μl) Sample dil Conc [ng/ μl]
Copy No per
20μl:
SSu72 10 -1 6.6 6.1E+10
Stock Conc: 66ng/ul 6.11E+11 10 -2 0.66 6.1E+09
Amplicon size: 100bp 10 -3 0.066 6.1E+08
10 -4 0.0066 6.1E+07
10 -5 0.00066 6.1E+06
10 -6 0.000066 6.1E+05
10 -7 0.0000066 6.1E+04
10 -8 0.00000067 6.1E+03
10 -9 0.000000067 6.1E+02
10 -10 0.0000000067 6.1E+01

138
Figure 3.1.4.5: Standard curve values and plot for absolute copy number calculation for
three genes [Cirbp, SSu72 and MDM2] out of the nine tested. Triplicates of each 105 to
1010
serial standard dilution used. A slope of -3.3 indicates a PCR efficiency = 100%.
Generally 3.3 ±0.15 is considered acceptable for quantification purposes.
Standard curves were generated by including triplicate standards (105 to 10
10) onto the
same qPCR reaction plate as the sampleset RNAs which had been reverse transcribed
previously (Figure 3.1.4.5).
All 3 standard curve slopes in this case are within acceptable limits and the R2 values are
relatively linear for all 3 across the concentration range also (all above 0.99). The standard
triplicates used only ranged from 105 to 10
10, this was optimised to this range as lower than
a 105 dilution was shown to be too concentrated and led to inaccurate cycle threshold (Ct)
readings of less than 12.
139
Next we wanted to investigate the copy number per 20ng of RNA per sample for each of
the three priority genes between 37oC and 31
oC samples from the RNA sampleset, denoted
by the sample IDs. We performed qRT-PCR to get Ct values for each sample tested. The
samples were grouped together based on original culture temperature from table 3.1.4.1.
In all 3 cases the 31oC samples all have substantially more mRNA transcript copy numbers
(Figure 3.1.4.6). MDM2 had much higher Ct values overall and therefore a much lower
copy number range, all under 250 copies, than Cirbp and SSu72. However, the 37oC
sample copy numbers were all calculated to be comparable being between 50 and 150
copies for each gene.
No obvious trend was seen from the analysis; however some interesting results were
observed, for example; for all 3 genes, the 336 (5 days in culture) and 442 (10 days in
culture) samples both being cultured at 31oC, showed that 442 samples had lower copy
numbers overall compared to 336 samples.
Furthermore, the 294 samples (also at 31oC) had more copy numbers than both 336 and 442
samples, the only difference being that the 294 samples were only in culture for 3 days
(Figure 3.1.4.6). This would indicate that as time in culture progressed, each genes mRNA
levels decreased at 31oC; perhaps indicating that mRNA was degraded to some extent. This
was encouraging because generally it is accepted that at 31oC transcripts can become more
stable, and if this was the case here, then these target genes and their putative promoters
would not be suitable for use as inducible transgene expression tools.
This was further addressed in section 3.1.5.
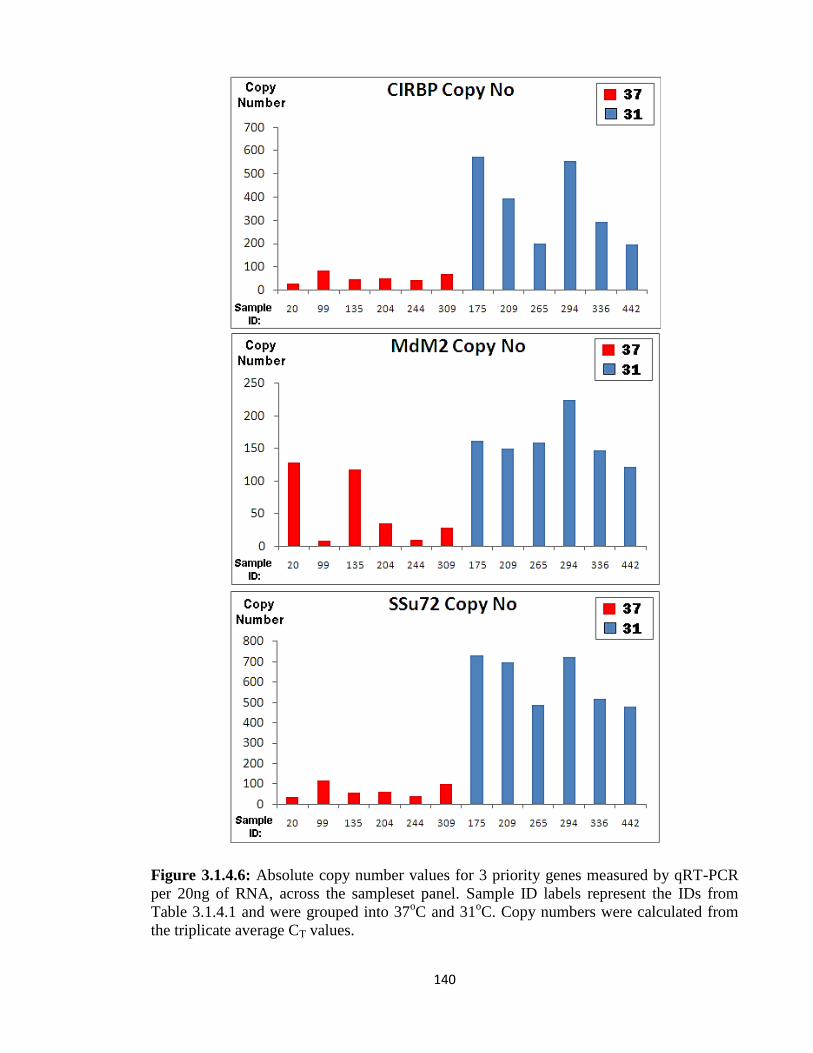
140
Figure 3.1.4.6: Absolute copy number values for 3 priority genes measured by qRT-PCR
per 20ng of RNA, across the sampleset panel. Sample ID labels represent the IDs from
Table 3.1.4.1 and were grouped into 37oC and 31
oC. Copy numbers were calculated from
the triplicate average CT values.

141
3.1.5: Investigation of promoter activity versus transcript stability
Having verified the microarray data for our genes of interest by qPCR, we wished to
establish whether the change in the quantities of mRNA observed in each case was due to
high transcriptional turnover of the mRNA (desirable) or if the mRNA of that particular
gene was just highly stable (undesirable).
In order to test this, cells were cultured at 37oC and 31
oC in the presence or absence of
actinomycin D (a transcriptional inhibitor) and total RNA was extracted at various
timepoints. Transcripts exhibiting greater stability (half-life) would be expected to be
detectable at higher levels by qPCR than more labile mRNAs post-actinomycin D
treatment.
Table 3.1.5.1: CHO-K1 cells cultured at 37oC and 31
oC were treated with a 5mM
concentration of actinomycin D. RNA was extracted after time (T) 0, 12 and 24 hours,
reverse transcribed and the average CT results for the 3 respective genes were calculated by
qRT-PCR. The copy number for each gene was calculated from the logarithmic (ln)
standard curve. The % copy number values relative to the T0 values were also shown.
Time Gene Avg CT Ln Copy No Copy No % of T0
37 T0 Cirbp 22.6 9.6031 14811 1.0
T12 Cirbp 24.3 8.2930 3996 27.0
T24 Cirbp 29.6 4.2221 68 0.5
31 T0 Cirbp 23.3 9.0821 8796 1.0
T12 Cirbp 23.4 9.0438 8466 96.2
T24 Cirbp 28.8 4.8478 127 1.4
Time Gene Avg CT Ln Copy No Copy No % of T0
37 T0 MDM2 29.8 3.1309 23 1.0
T12 MDM2 31.7 1.7731 6 25.7
T24 MDM2 32.7 1.0747 3 49.7
31 T0 MDM2 30.2 2.8452 17 1.0
T12 MDM2 32.4 1.2750 4 20.8
T24 MDM2 32.6 1.1260 3 86.2
Time Gene Avg CT Ln Copy No Copy No % of T0
37 T0 SSu72 22.1 10.6926 44031 1.0
T12 SSu72 24.0 9.2266 10164 23.1
T24 SSu72 30.9 3.8922 49 0.5
31 T0 SSu72 24.8 8.6273 5582 1.0
T12 SSu72 24.8 8.6016 5440 97.5
T24 SSu72 29.0 5.3814 217 4.0

142
Figure 3.1.5.1: Absolute mRNA transcript copy numbers calculated for the 3 genes in
CHO-K1 cells grown at 37oC (A) and 31
oC (B). Copy numbers after ActD treatment (T24)
versus no treatment control (T0) as determined from a standard curve. Copy number
calculated as per 100ng of RNA, reverse transcribed to cDNA. Also shown is the fold
change [x] between pre and post-ActD treatment. (C) Dissociation/melt curves for each
gene qPCR amplicon is under its corresponding bar graph.
143
SSu72 was found to be the most abundant transcript at 37oC and Cirbp the most abundant
at 31oC, while MDM2 was the least for both temperatures (Figure 3.1.5.1 A+B). The fact
that Cirbp was the most abundant transcript detected at 31oC was not surprising based on it
being a well characterised cold-shock protein (CSP) and becomes up-regulated at lower
culture temperatures.
The cycle thresholds increase over time in the presence of ActD for each gene, so fewer
transcripts are detected indicating that treatment was effective (Table 3.1.5.1A+B).
Additionally, to optimise the concentration of actinomycin D to use, we assessed 3
concentrations. We added [0-2-5mg/ml] ActD after 0, 12 and 24 hours in comparison to
PBS/DMSO control samples (No treatment) also after 0, 12 and 24 hours. It was deduced
that 2mg/ml of ActD was less inhibitory than the 5mg/ml concentration; therefore 5mg/ml
was used in this experiment (data not shown).
After calculating the copy number, the biggest differential was seen in the SSu72 samples.
This would suggest that the SSu72 transcripts were less stable than Cirbp and that MDM2
transcripts were the most stable. Finally the dissociation curves demonstrated specific
amplification of the target; a single peak was indicative of a single product and thus no
contamination during amplification steps (Figure 3.1.5.1 C).
Note: The absolute mRNA copy number values shown in figure 3.1.5.1 were markedly
more abundant than mRNA values seen in figure 3.1.4.1. We were unsure as to why this
was observed, one possible reason is the fact that the RNA samples were archival from >6
years and although we showed them to be relatively undegraded maybe less RNA was
subjected to qRT-PCR analysis. In addition, we used a higher concentration of starting
RNA (100ng) per sample compared to 20ng in the initial qRT-PCR validation.

144
Another point to consider was the ½ life of each transcript. Regulation of mRNA turnover
in the cytoplasm is important for controlling the abundance of cellular transcripts and, in
turn, the levels of protein expression (Ross 1995) (Parker and Song 2004) (Wilusz,
Wormington and Peltz 2001). In mammalian cells, the first major step that triggers mRNA
decay is deadenylation (i.e. removal of the 3′-poly(A) tail) (Chen et al. 2008).
So by estimating the mRNA decay (Figure 3.1.5.2), for the purpose of further assurance
that my gene promoters have a prominent decay rate, signifying that they are
transcriptionally active rather than transcriptionally stable (Harrold et al. 1991).
To determine the decay rate (–k) in hour-1
and subsequent half-life (t1/2) of the transcripts
between no treatment controls and actinomycin D treatment at each timepoint the following
formulas were used as described by (Chen, Ezzeddine and Shyu 2008);
The turnover rate or stability of mRNA in vivo is usually reported as the time required to
degrade by 50% of the original amount of mRNA molecules (i.e., the half-life of mRNAs).
Additionally, it is important to note that the half-life of an mRNA (t1/2) is inversely
proportional to its decay rate constant (kdecay), while the minus symbol indicates that the
mRNA is being degraded rather than synthesized.

145
Figure 3.1.5.2: Copy numbers of each gene in order to compare decay (red lines) between
times 0 (T0) and 24 hours later (T24) for 37oC (◊) and 31
oC (◊). The 12 hour timepoint was
disregarded for decay and half-life determination.

146
Figure 3.1.5.2 showed that there was a more appreciable change in copy number after 24
hours than 12 hours after treatment with ActD. For this reason, we calculated decay rates
based on differences between copy numbers at time zero (T0) and 24 hours (T24) for both
temperatures (Table 3.1.5.2).
Table 3.1.5.2: Decay rates and half-life (T1/2) of gene transcripts between 2 timepoints;
Time 0 and Time 24, post-actinomycin D treatment of CHO-K1 cells. Values calculated
from Figure 3.1.5.2 results.
The decay rate was lower and mRNA half-life was higher at 31oC in all cases (Table
3.5.1.2). Cirbp decay and stability appeared to be relative constant with only a marginal
decrease in decay rate and as a result a marginal increase in mRNA half-life. Al-Fageeh and
Smales also reported similar results for various Cirbp 5’ UTR leader sequences from NIH-
3T3 mouse cells. They showed that although Cirbp mRNA stability was increased at 31oC,
half-life of 13.9 hr at 37oC versus 15 hr at 31
oC, it was marginal compared to a beta-actin
control which had a more substantial difference between 37oC (10.4 hr) and 31
oC (15.8 hr)
(Al-Fageeh and Smales 2009).
MDM2 mirrored this observation; however the mRNA levels were much lower overall,
based on higher CTs and it doesn’t appear to be as highly expressed in CHO-K1 cells at
37oC or 31
oC, unlike Cirbp and SSu72. SSu72 was a little over twice as stable at 31
oC as at
37oC, based on the decay rate being 2.44 hr
-1 at 37
oC and 5.12 hr
-1 at 31
oC. This could
perhaps contribute partly to higher SSu72 mRNA detection from the original microarray
profiling, but as it is known that at lower culture temperature mRNA transcripts do become
more stable so this was not unexpected.
37 31Time (kdecay) h -1 t 1/2 Time (kdecay) h -1 t 1/2
Cirbp 24h-0h -0.2243 3.09 hr Cirbp 24h-0h -0.1761 3.97 hr
MdM2 24h-0h -0.0846 8.19 hr MdM2 24h-0h -0.0722 9.60 hr
SSu72 24h-0h -0.2833 2.44 hr SSu72 24h-0h -0.1353 5.12 hr

147
In conclusion, the gene promoter targets identified and prioritised in this project are indeed
promising candidates to drive temperature dependant gene expression. The most
transcriptionally active gene appears to be SSu72, with post-actinomycin D treatment
indicating high turnover rate and least stability. By calculating the copy number at the
mRNA level, it would appear that the promoters of these genes were highly active.
3.1.6: In silico identification of promoter sequences
At the beginning of my project, the Chinese Hamster genome was not fully sequenced so
laborious cross-species alignments between mouse, human and rat were used, until (Xu et
al. 2011) published a draft of the genome in 2011 and generously uploaded it onto the
GenBank public database.
Having established that the higher mRNA levels of the target genes seen at 31oC were not
due to excessive RNA stability, we progressed them for promoter cloning to test their
utility. Before the CHO genomic sequence became publicly available in 2011, it was
difficult to identify the putative promoter sequences upstream of the gene targets. Therefore
the initial part of this project involved designing primers based on conserved regions
between human/mouse and rat genomic sequence (Figure 3.1.8.1).
The first step was to extract the correct CHO gene-coding sequence from the database at
http://www.chogenome.org/. By first obtaining the mouse/rat ortholog coding sequence
(CDS) for each gene in the list, then by using ‘BLAST’ (Basic Local Alignment Search
Tool) as an algorithm for comparing primary biological sequence information, the
sequences could be extrapolated from the CHO sequence information stored in assembly
scaffolds and contigs within the database based on evolutionary conservation between these
species.
Using multiple sequence alignment software tools (Tcoffee and ClustalW) we were able to
pinpoint the ATG start site, and from this point upstream obtain the putative CHO promoter
regions for each target gene. Furthermore, although invaluable for this project to progress,
the CHO draft sequences published by Xu et al had only arranged the sequences in
scaffolds and contigs in FASTA format and were poorly annotated making extracting
sequences difficult.

148
Because of this, even when the start codon (ATG) for each gene was located within a
scaffold, sometimes the scaffold only contained a couple of hundred bases upstream before
encountering the end of the scaffold. Both the MDM2 and miR-17-92 promoter cloning
were affected in this way, making it challenging to design appropriate primers to amplify
longer stretches of putative promoter sequence.
3.1.7: Workflow of Isolation and Cloning of Gene Promoters
The schematic in figure 3.1.7.1 represents a step by step workflow of how these promoter
constructs were isolated and cloned into vectors to test their activity.
To make this undertaking more manageable, the top three temperature sensitive genes from
table 3.1.2.1 were chosen for further study. We focused on Cirbp, SSu72, MDM2 due to
being up-regulated at 31oC and PPID, Nars and HNRPa2b1 for being down-regulated at
31oC and finally *AUP1, PPIA, UBA52 and miR-17-92 cluster for showing constitutive
expression across the array data.
Note: *AUP1 was identified in the early part of this project as a target for constitutive
expression based on least variance across the dataset. However after re-analysis of the mean
expression values, where the mean fluorescence signal was found to be very low across the
probe set when checked against the list generated in table 3.1.2.3 and was deemed not to be
strong enough to drive transgene expression and excluded from this point on.
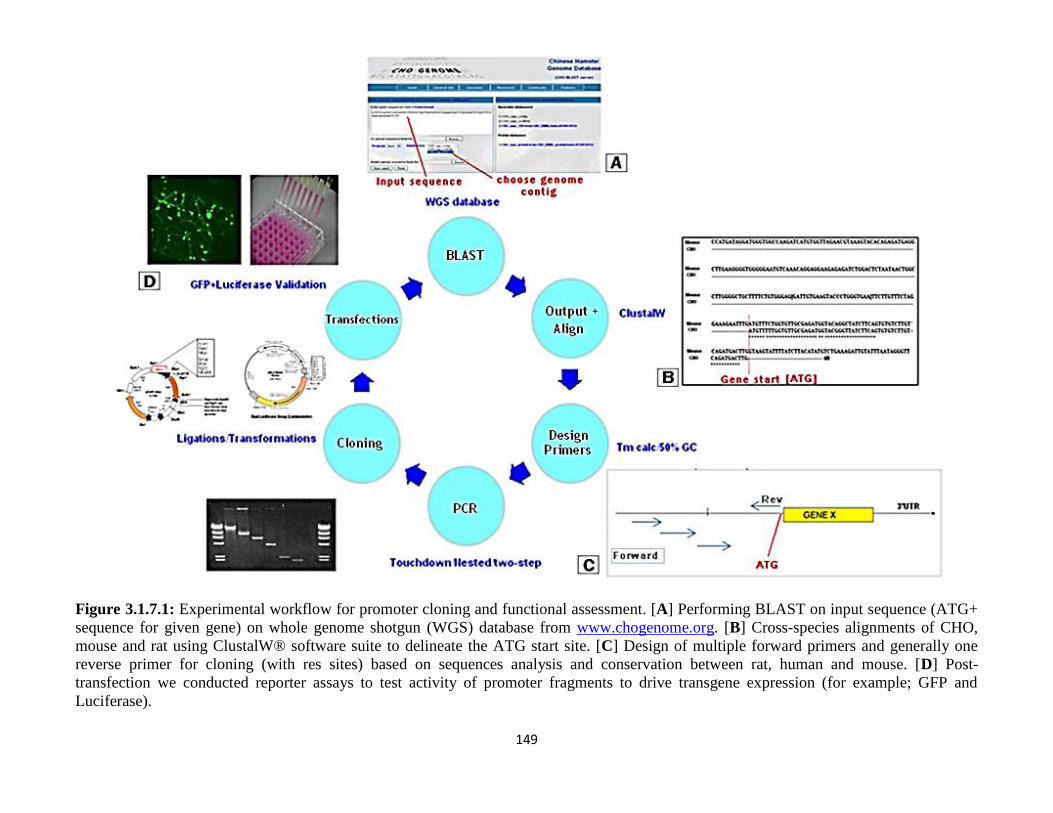
149
Figure 3.1.7.1: Experimental workflow for promoter cloning and functional assessment. [A] Performing BLAST on input sequence (ATG+
sequence for given gene) on whole genome shotgun (WGS) database from www.chogenome.org. [B] Cross-species alignments of CHO,
mouse and rat using ClustalW® software suite to delineate the ATG start site. [C] Design of multiple forward primers and generally one
reverse primer for cloning (with res sites) based on sequences analysis and conservation between rat, human and mouse. [D] Post-
transfection we conducted reporter assays to test activity of promoter fragments to drive transgene expression (for example; GFP and
Luciferase).

150
3.1.8: Primer Design
Having obtained the CHO specific sequence, next primers were designed to extract the
putative promoter upstream of these genes by identifying regions of sequence conservation
across mouse, rat and human orthologues.
Note: Before the CHO sequence became available the project began with designing and
screening mouse-specific primers against CHO genomic DNA. This proved futile for
amplifying CHO promoter sequence; however by isolating the mouse sequences we
obtained promoters capable of driving transgene expression as a back-up to the CHO
promoters. This was based on the assumption that promoter sequences from another rodent
species would be active in CHO cells if the endogenous CHO sequences were too difficult
to obtain. Primer design across species was reliant on sequence conservation like the
example shown in figure 3.1.8.1.
The reverse primer was designed to bind upstream of the gene start codon [ATG] and a
series of forward primers were designed to create a panel of progressive truncated promoter
fragments for each prioritised gene. However, not all gene primers were shown in figure
3.1.8.2, owing to cloning issues explained in later sections.
Figure 3.1.8.1: Cross-species alignments between mouse, rat, and human to design CHO-
specific primer sequences for the target genes (forward and revere primers for the Cirbp
gene shown for illustration purposes). The principle being, that if the primers were
designed in highly conserved regions, then there was a high chance the primer would
facilitate PCR amplification and extraction from CHO and mouse gDNA templates.

151
Figure 3.1.8.2: Primer maps designed for isolation of a panel of varying lengths of
promoter regions upstream of each prioritised CHO gene. Also shown were the sizing and
nucleotide positions. MDM2, SSu72 and Cirbp were categorised into inducible and the
miR-17-92 cluster was categorised as constitutive. (Cirbp m) denotes the mouse version
while (Cirbp C) denotes the CHO version.
The 3 most promising gene promoters regarding temperature inducible differential
expression (MDM2, SSu72 and Cirbp) can be seen here along with the truncated promoter
primers for the Cirbp mouse orthologue control gene. The miR-17-92 mouse and CHO
constructs were included with these prioritised gene promoters for further study as a
comparison while the CHO-promoter sequence of this cluster is more novel.
Mouse primers for all genes from the list were also designed as a backup if isolating the
CHO sequences proved problematic (Appendices section 6.2.1), but were not included in
figure 3.1.8.1, as they ultimately were not cloned due to the CHO isolation being
successful.

152
3.1.9: Promoter amplification and isolation
Having now generated a panel of primers for cloning, the next step was isolating the
sequences upstream of each genes ATG start site from genomic DNA extracted from
mouse and CHO cells. For the PCR template, total genomic DNA was extracted from
CHO-K1 and mouse (min-6) cell pellets using the Promega Wizard® extraction kit.
Post-extraction we wanted to check this DNA template to see if it was suitable and not
degraded in order to proceed to PCR. Agarose gel electrophoresis using a low percentage
gel (0.6%) was performed to visualise the quality of the high molecular weight gDNA
(Figure 3.1.9.1) and the gDNA band was estimated to be approximately 23kb. This was
followed by NanoDrop™ results to check DNA integrity, a 260/280 ratio = 1.8 – 2.0 was
indicative of high-quality DNA. Genomic DNA that would be considered unusable would
be indicated by a large smear in the gel lanes, and if it was sheared then bands less than
12kb would be apparent.
Figure 3.1.9.1: Quality checks of the different extracted mammalian genomic DNA used
over the project. L = Ladder. Human SNB-19 gDNA (wells 1, 2), CHO-K1 gDNA (wells 3,
4), CHO-K1-SEAP (well 5), min-6/murine gDNA (wells 6, 7).
Having identified suitable template for mouse and CHO, next we wanted to isolate the
various sizes of each genes promoter sequence by using the primers designed from figure
3.1.8.2 and polymerase chain reaction (PCR). 0.8-1.2% agarose gels were run to identify
the various sizes of fragment generated from PCR. As a representative example, MDM2-
specific primers were used to amplify products so they could be extracted using gel
extraction kit and purified for downstream cloning (Figure 3.1.9.2).
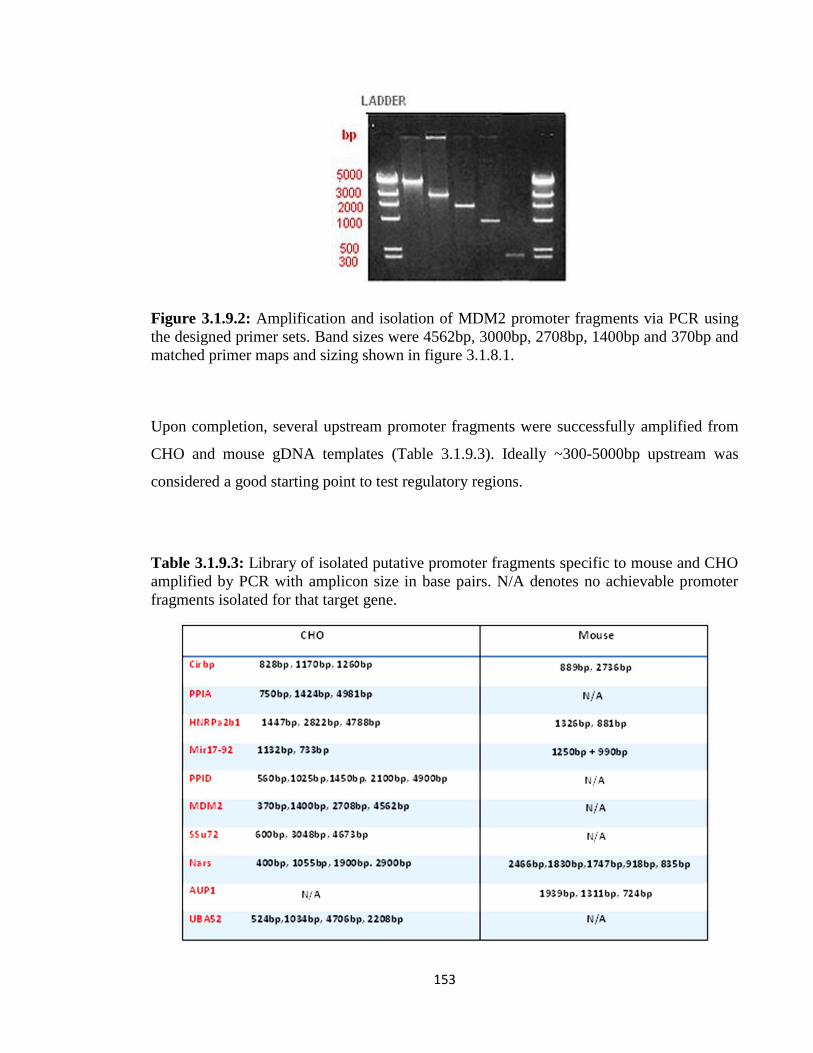
153
Figure 3.1.9.2: Amplification and isolation of MDM2 promoter fragments via PCR using
the designed primer sets. Band sizes were 4562bp, 3000bp, 2708bp, 1400bp and 370bp and
matched primer maps and sizing shown in figure 3.1.8.1.
Upon completion, several upstream promoter fragments were successfully amplified from
CHO and mouse gDNA templates (Table 3.1.9.3). Ideally ~300-5000bp upstream was
considered a good starting point to test regulatory regions.
Table 3.1.9.3: Library of isolated putative promoter fragments specific to mouse and CHO
amplified by PCR with amplicon size in base pairs. N/A denotes no achievable promoter
fragments isolated for that target gene.

154
As mentioned briefly, halfway through the project our focus switched from mouse
extraction to CHO once it was possible to obtain the CHO draft sequence from Genbank.
As a result mouse experiments were sidelined to concentrate on extracting the CHO
specific fragments (Table 3.1.9.3) and hence why there were numerically more CHO
fragments isolated.
Having now created a library of various promoter fragments, we decided to screen them
initially using a GFP-reporter to see if they could drive detectable GFP expression (Table
3.1.11).
3.1.10: Cloning into Expression Vectors Design/Manipulation
The promoter fragments isolated from table 3.9.1.3 were cloned using a pEGFP-C1 plasmid
from Clontech Laboratories, Inc (USA) and a pGL3 Luciferase plasmid from Promega
(USA) (Figure 3.1.10.1). The CMV promoter was first removed from pEGFP-C1 to allow
insertion of a synthetic linker (Figure 3.1.10.2), which in turn allowed cloning of the
isolated promoter fragments (containing restriction sites from the primer design) upstream
of the GFP-reporter gene.

155
Figure 3.1.10.1: Illustrated are the two reporter vectors used to test the activity of the
isolated promoters (by driving a reporter gene). An enhanced GFP (pEGFP-C1) was altered
to generate (pEGFP-altAL) containing a linker (synthetic MCS) and was placed upstream
of a GFP gene. Additionally, a polyA tail termination sequence was included upstream of
the promoter. Also shown was the commercially available Luciferase (pGL3-Basic) which
did not undergo any alterations.
Figure 3.1.10.2: Illustration of synthetic ‘linker’ sequence containing multiple cloning sites
was designed based on the MCS from pGL3-basic vector to complement the design of the
cloning primers. Contained within the linker, was a Nhe1 restriction site. It was altered so
as not to have two sites that might impede cloning, as a Nhe1 was already present upstream
of the GFP gene. AseI and NheI (pink) sites flank the linker which allowed an insertion
point for the linker into the pEGFP-C1 vector.

156
Some restriction sites existed twice as a result of linker insertion, so further digestion by
BamHI and BspEI restriction enzymes removed the downstream multiple cloning site
(MCS) and klenow treatment was used to blunt and re-ligate the plasmid backbone.
Additionally, to finalise the pEGFP vector for reporter work, a poly-A termination
sequence was inserted upstream of the linker site to ensure background expression was
quenched. First the poly-A sequence from the pGL3-basic was amplified by PCR and
isolated. Then it was cloned with the following primers containing AseI and Acc65i
restriction sites;
5’- ggccattaatAAGGTACGGGAGGTACTTGG – 3’ Forward (Ase1 @ +4629bp from ATG)
5’ – atatggtaccTTACCAACAGTACCGGAATGC – 3’ Reverse (Acc65i @ -55bp from ATG)
Figure 3.1.10.3: (A) Poly-A PCR gel electrophoresis result using the above primers at
55oC and 60
oC annealing temperatures, followed by ligation into pEGFP with digestion
verification using Ase1 + Acc65i restriction enzymes. (B) Sequencing result aligned
against original pEGFP-C1 vector backbone sequence using ClustalW software,
highlighting the inserted poly-A, denoted in red.
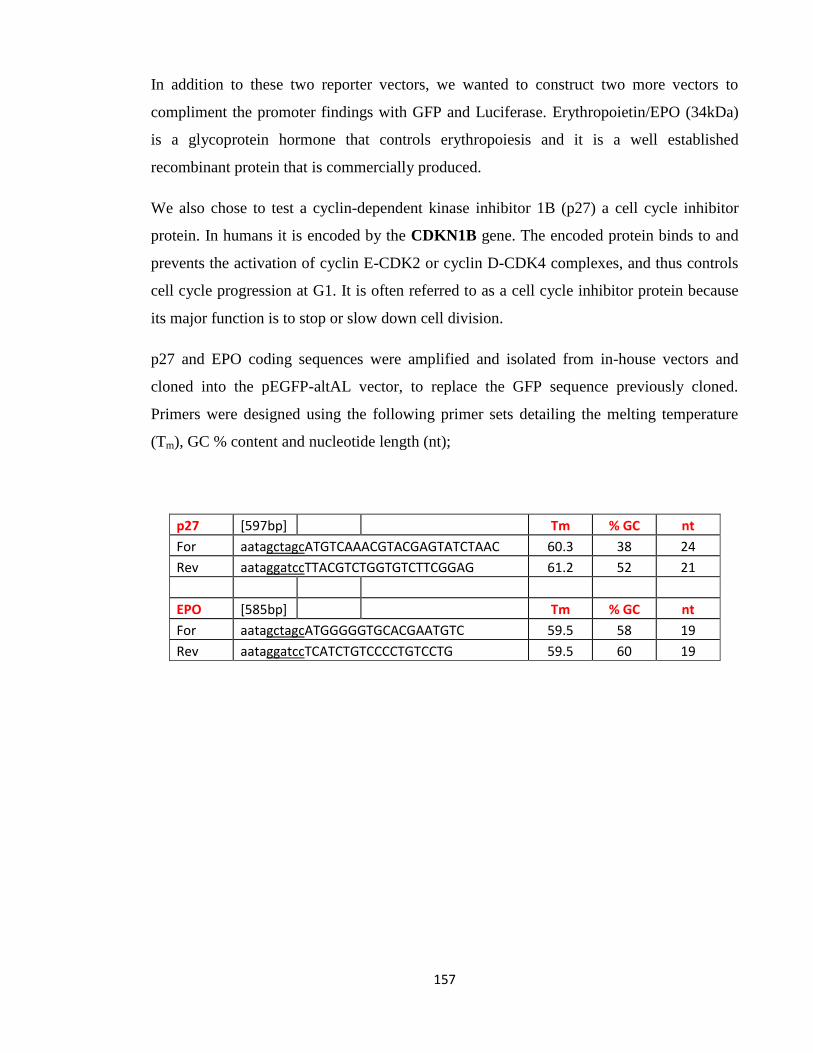
157
In addition to these two reporter vectors, we wanted to construct two more vectors to
compliment the promoter findings with GFP and Luciferase. Erythropoietin/EPO (34kDa)
is a glycoprotein hormone that controls erythropoiesis and it is a well established
recombinant protein that is commercially produced.
We also chose to test a cyclin-dependent kinase inhibitor 1B (p27) a cell cycle inhibitor
protein. In humans it is encoded by the CDKN1B gene. The encoded protein binds to and
prevents the activation of cyclin E-CDK2 or cyclin D-CDK4 complexes, and thus controls
cell cycle progression at G1. It is often referred to as a cell cycle inhibitor protein because
its major function is to stop or slow down cell division.
p27 and EPO coding sequences were amplified and isolated from in-house vectors and
cloned into the pEGFP-altAL vector, to replace the GFP sequence previously cloned.
Primers were designed using the following primer sets detailing the melting temperature
(Tm), GC % content and nucleotide length (nt);
p27 [597bp]
Tm % GC nt
For aatagctagcATGTCAAACGTACGAGTATCTAAC 60.3 38 24
Rev aataggatccTTACGTCTGGTGTCTTCGGAG 61.2 52 21
EPO [585bp]
Tm % GC nt
For aatagctagcATGGGGGTGCACGAATGTC 59.5 58 19
Rev aataggatccTCATCTGTCCCCTGTCCTG 59.5 60 19

158
Figure 3.1.10.4: Vector map detailing the creation of p27 and EPO vectors. The GFP gene
was removed from pEGFP-altAL using NheI and BamHI and replaced by either the EPO or
p27 CDS. In parallel, EPO and p27 primers were designed to clone out the EPO and p27
CDS (585bp + 597bp respectively) from in-house vectors containing each gene.
In summary, we successfully constructed a GFP and reporter vector (pEGFP-altAL) with a
MCS and poly-A termination sequence to be utilised in promoter studies. EPO is an
example of a protein product, while p27 is an example of an engineering target, both of
which may benefit under temporal expression control from potential promoter sequences,
which was next to be examined.

159
3.1.11: Promoter fragments - Initial expression screen
The next step was to examine these promoter fragments by cloning into the pEGFP-altAL
vector in order to test GFP transgene expression. Rather than progressing with ligations for
all promoter fragments generated from the previous section into all four vectors, we used
the pEGFP-altAL reporter vector to initially screen the fragments from table 3.1.9.3. This
initial screen was used to identify gene promoter fragments which would be suitable
candidates for further testing and cloning into the other reporter vectors.
CHO-K1 cells were transfected in triplicate in 24-well format and GFP fluorescence
measured 24-hours later, quantitatively on the Guava™ flow cytometry system and
qualitatively using the Leica® fluorescent microscope. Four promoters, Cirbp, MDM2,
SSu72 and miR-17-92, exhibited moderate to strong GFP expression when tested and
followed the expected expression trend (Table 3.1.11).
This large panel screen gave us an insight to the initial expression behavior of the various
isolated gene promoters and was a good starting point for further study. Additionally, it
may also serve as a guide in future promoter studies, as to progress with all fragments was
not a viable option. Full GFP expression quantification is reported in section 3.2.2.

160
Table 3.1.11: Initial mouse and CHO promoter fragment panel screen. Summary of GFP expression (exp) reporter results, expected and
observed effects, and fragment sizing ligated into pEGFP-altAL designed vector. N/A denotes not applicable due to no cloning. (+) denotes
GFP strength with (+++) being strongest, (-) denotes no detectable expression.

161
After screening all gene promoters of various sizes, efforts became focused on 6 promoter
fragments of interest from 4 gene sources [MDM2, SSu72, Cirbp, miR-17-92]. These were
categorised into 4 inducible promoters, three being novel to CHO (MDM2, SSu72 and
Cirbp) while a Cirbp-promoter from mouse was used as a control sequence as it was shown
to be temperature inducible in previous studies. Additionally, 2 constitutive promoter
fragments from the miR-17-92 cluster were included (one for CHO and one for mouse).
We were disappointed that initial GFP reporter results showed no detectable expression
from the other constitutive promoters investigated, namely UBA52 and PPIA which
showed substantial expression from the array data (Table 3.1.2.3). We hypothesised that
perhaps essential promoter and indeed any temperature sensitive sequence was located
further upstream and thus not contained within the isolated fragments.
Note: For these reasons, the fragment mapping seen in figure 3.1.8.2 contains all 6 of these
promoters as representative of entire screen.
There were no similar promoter studies found in the literature based on these four
promoters in CHO, while only Cirbp has been explored in murine models (Al-Fageeh and
Smales 2009). The miR-17-92 cluster was explored in various human models (Hayashita et
al. 2005) (Lu et al. 2007) (Ji et al. 2011), however, the promoter was not.
In conclusion, 6 promoter fragments from 3 different target genes plus one miRNA cluster
were successfully identified and cloned. These promoter fragments were subsequently
chosen for progression to further promoter studies using the 3 additional vectors described
previously. The mouse equivalent promoter fragments were not pursued, only the Cirbp and
miR-17-92 cluster mouse promoter fragments were progressed in tandem with their CHO
orthologues. Furthermore, the miR-17-92 promoter fragments were included due to their
novelty in CHO.

162
3.2: Driving reporter-gene expression in a temperature-dependant manner
3.2.1: Introduction
All promoter constructs were cloned into the respective vectors as described in section
3.1.10. Some larger fragments were problematic to clone and coupled with the shorter
sequences portraying good expression characteristics, shorter fragments were prioritised as
being more attractive as regulatory tools. For this reason, the decision to halt further
analysis of the larger variants was taken.
As a result the following promoter fragments were utilised from this point onward; 828bp
CHO Cirbp, 370bp MDM2 and 654bp SSu72 fragment sizes were chosen based on having
a favourable size as well as being capable of high GFP expression. Additionally, an 889bp
mouse promoter fragment from Cirbp was included in all experiments, this fragment can be
viewed as a temperature-sensitive control based on previous reports and being the most
correlated between 37oC and 31
oC from microarray profiling. In addition, it was used as a
comparison for the Cirbp-CHO fragment which has not been investigated for temperature
induciblity before and holds novelty compared to mouse Cirbp, which have been reported
(Al-Fageeh and Smales 2009) (Sumitomo et al. 2012).
Furthermore, by including the mouse and CHO versions of Cirbp in all reporter
experiments served two purposes, firstly it provided a control comparison for temperature
induciblity for all other promoters and secondly to examine any potential differences
between mouse and CHO, for which no reports currently exist for the latter in the literature.
In conclusion, promoter choice influences the efficacy of specific gene expression, as does
the cell type (Spenger et al. 2004). So ultimately the aim was to provide a complete
representation of expression levels of these putative promoter fragments across all 4
reporter vector platforms to investigate the candidate promoters’ utility in driving transgene
expression.

163
3.2.2: GFP-reporter expression results
Firstly, we wanted to investigate these constructs both qualitatively and quantitatively.
Using a combination of microscopy and flow cytometry to detect GFP expression resulting
from a GFP reporter vector driven by these isolated promoter sequences. CHO-K1 cells
were transiently transfected with the 8 GFP-promoter constructs and cells grown at 37oC or
31oC in parallel. GFP mean expression was typically measured 24-48 hours post-
transfection using the Guava™ flow cytometry modus operandi. For qualitative analysis,
GFP fluorescence images were also taken using the Leica® Fluorescent microscope at 37oC
and 31oC for comparison (Figure 3.2.2.1).
The GFP expression results (pEGFP-altAL + 8 promoter fragments), included the inducible
promoter constructs (Cirbp-mouse and CHO, SSu72 and MDM2) along with the miR-17-92
promoter constructs from mouse and CHO. A positive control (CMV) vector, a
promoterless negative control (pTATA (-)) plus the endogenous comparison control (Cirbp-
mouse) were also included (Figure 3.2.2.1).

164
Figure 3.2.2.1: GFP fluorescence of CHO-K1 cells transfected with 8 GFP-promoter
[pEGFP-altAL+ promoter] constructs. Cells were grown in 6-well plate format and
incubated at 37oC and 31
oC. Images were taken using the Leica® Fluorescent microscope
36 hours post-transfection.
All novel CHO promoters (MDM2, SSu72 and Cirbp) gave an indication of being
temperature sensitive promoters. Post-transfection into CHO cells, all 3 CHO promoters’
showed increased GFP expression based on fluorescence intensity upon temp shift to 31oC
from 37oC. The p-TATA (-) promoterless control showed basal level GFP intensity
compared to all other constructs as expected.
The Cirbp-mouse promoter appeared to have noticeably increased GFP fluorescence at
31oC compared to 37
oC, indicating an increase in GFP expression owing to reduced culture
temperature as expected of this comparison control construct.
Interestingly, the CMV promoter control also exhibited an increase upon temperature shift,
which was unexpected and this observation will be discussed further in section 3.2.4.
MDM2 showed much lower GFP expression at 37oC which complies with the native
expression levels seen from the qPCR validation (Figure 3.1.4.6), however, expression
noticeably increases at 31oC.

165
Cells transfected with the SSu72 promoter construct showed a moderate GFP expression
increase upon 31oC temperature shift and also had higher GFP intensity than MDM2 at
37oC, and SSu72 seemed to drive GFP expression strongly at both temperatures. Cells
transfected with the Cirbp-CHO promoter performed as expected relative to Cirbp-mouse
control, displaying increased GFP expression at 31oC.
Cells transfected with the miR-17-92 constitutive promoter constructs displayed lower GFP
expression than expected considering it is acknowledged as a highly expressed cluster. In
fact, increased saturation gain on the images for miR-17-92 samples was required to
visualise positive GFP expressing cells (Figure 3.2.2.1).
Next the cells were analysed by flow cytometry in order to more accurately quantify the
levels of fluorescence from each promoter construct transfected into CHO-K1 cells and
tested at 37oC and 31
oC again (Figure 3.2.2.2).

166
Figure 3.2.2.2: Average GFP mean fluorescence values of cell populations’ transfected
with promoter-pEGFP-altAL constructs. After transfection in 24-well plates, cells were
incubated at 37 and 31oC (shifted after 6-8 hours) and measured for GFP activity 24-48
hours later. Error bars represent standard deviation (± SD) between biological triplicates of
samples taken at both temperatures. The fold changes (x) represent 37v31 values to show
relative expression change for each promoter. * represents statistical significance p-value
<0.05, ** p-value<0.01, *** p-value<0.001, determined by a 2 tailed students T-Test
between both sets of triplicate samples for both temperatures. (n = 9).
Figure 3.2.2.2 illustrates the strength of each promoter construct at each temperature plus
the fold change between those temperatures - indicative of temperature induciblity. MDM2
had the biggest fold change (3.77x) followed by CMV (3.25x). With the expectancy that
the inducible promoter constructs tested should portray a high fold change between
temperatures, it was unexpected that the CMV-promoter displayed such temperature
responsive expression also. Although the GFP expression of the Cirbp constructs for mouse
and CHO mirrored each other, the CHO version showed higher GFP expression at both
temperatures; however a slightly lower fold change of 2.79x was calculated.

167
The SSu72 construct, despite having the lowest fold change of 2.46x, drove higher GFP
expression at both temperatures than MDM2, but lower than both Cirbp constructs and the
CMV control. The CMV promoter drove strong GFP expression as expected and was
marginally the best performing construct and had a mean fluorescence of ~350. The
pTATA (-) control had very low GFP expression as expected with a fold change of 1.13x
representing the basal/background level of GFP expression by the promoterless vector
backbone.
The miR-17-92 cluster promoters did not drive strong GFP expression, but was detectable
nevertheless and resulted in higher GFP expression than the basal control pTATA (-). The
CHO version did however show slightly higher GFP expression at 31oC; perhaps indicating
it may not be constitutive regulatory sequence as expected, while the mouse version
expression was unchanged based on an insignificant p-value. The low levels of GFP
expression resulting from these 2 promoter fragments would suggest that crucial parts of
the regulatory sequence may be missing.
Figure 3.2.2.3: Relative GFP mean fluorescence values for all promoter constructs as a
percentage compared to CMV-promoter control at each temperature. CMV activity was set
to 100%.

168
Figure 3.2.2.3 illustrates the GFP expression differential between temperatures for all
promoter constructs tested. Only the Cirbp–CHO construct had stronger expression strength
relative to the CMV at 37oC, whereas the MDM2 construct has the lowest GFP expression
at both temperatures but was very promising from a fold change viewpoint, while the
activity relative to CMV was ~50% and ~48% for each temperature.
The SSu72 promoter showed higher expression at both temperatures than MDM2 and had
~75% activity relative to CMV at 37oC and ~45% at 31
oC. The Cirbp-CHO promoter
activity was ~103% and ~89% for 37oC and 31
oC respectively and marginally out-
performed the Cirbp-mouse control which correlated with the observations from the
microscope images (Figure 3.2.2.1).
The miR-17-92 cluster promoters overall activity was much less than the 3 inducible
promoters with activities between 20% and 10% relative to the CMV promoter.
Nonetheless, these promoters could still have utility regarding control of lower transgene
expression, as high constitutive expression is not always desirable and smaller incremental
expression is needed depending on the transgene being expressed in a bioprocess.
Finally, we repeated the same protocol but alternatively measured promoter activity using a
second flow cytometer platform – a FACSAria™ from BD Biosciences (Figure 3.2.2.4).
We used a second flow cytometry platform in order to compare GFP expression results
between two separate technologies.
The FACS is capable of detecting a much greater range of fluorescence intensity – several
orders of magnitude greater than than the Guava. This analysis was performed to ensure we
were not missing a population of cells with expression levels outside the range detectable
on the Guava.
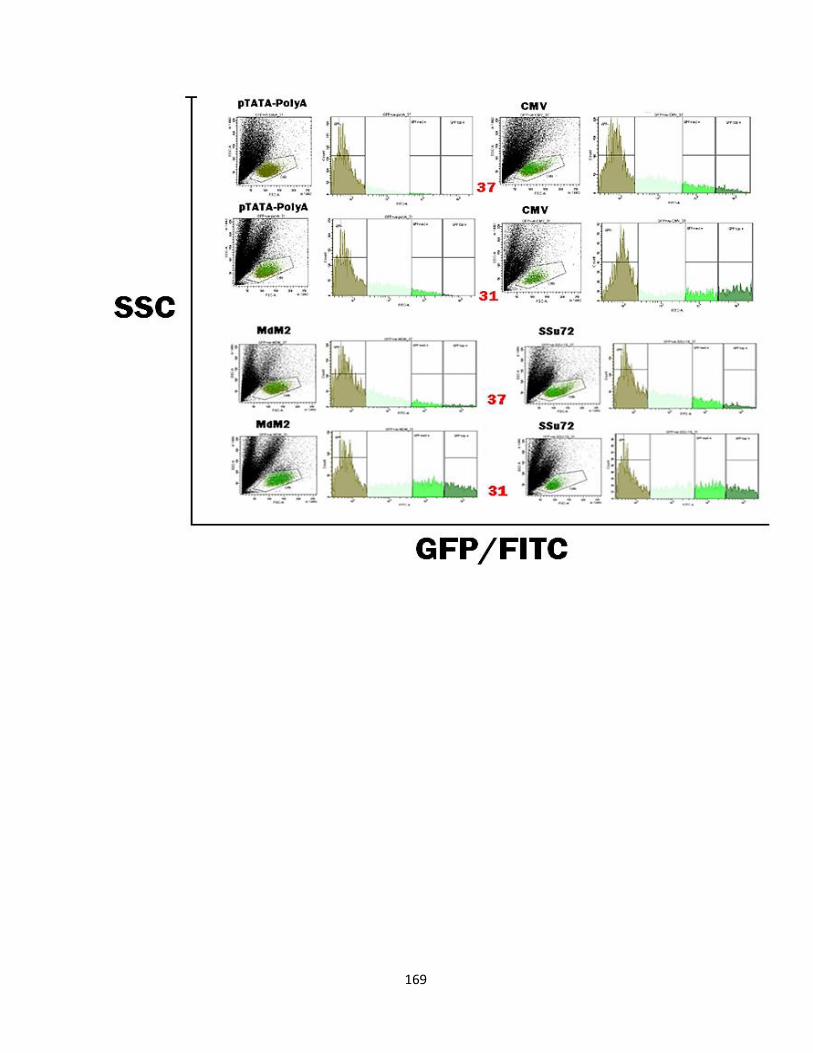
169

170
Figure 3.2.2.4: FACS results 36 hours post-transfection of 8 promoter constructs into attached
CHO-K1 cells in 24-well format. Dotplots are shown in the left images below the label for
each promoter construct with GFP+ cells gated using the software. This gate was further sub-
divided into mid to high FITC ranges as shown. On the X-axis is the GFP-FITC fluorescence
and on the Y-axis is side-scatter (SSC) which is proportional to the granularity and overall
size of the cells. Plots show the cell populations at both temperatures (37oC - top and 31
oC -
bottom). The left sector (black) indicates the non-florescent cell population. The far right
sector displays the cells with highest GFP intensity (dark green). Cells transfected with the
pTATA (-) and a cells only control were included as controls.
171
Once again, CHO-K1 cells were transfected with the 8 promoter constructs, cultured at
either 37oC or 31
oC and GFP fluorescence measured 36 hours later. In all cases, the GFP
positive populations of cells were shifted to the right (more cells showing higher GFP
fluorescence) upon temperature shift to 31oC (Figure 3.2.2.4).
GFP intensity in all three low, mid and high sub-gate ranges increased at 31oC especially in
the highest GFP intensity range (far right sector). The sector breakdown for medium and
high GFP intensity plus the number of cells (#Events) in each of the gated populations can
be seen in appendices 6.2.2.
The CMV control GFP intensity increased at 31oC in each gate compared to 37
oC, and also
was the strongest promoter once again. Interestingly, the miR-17-92-mouse promoter
showed markedly more GFP expression and there was an obvious increase in expression at
31oC compared to 37
oC. This would indicate that it is acting contrary to its expected
constitutive nature. The miR-17-92-CHO counterpart showed expression levels equivalent
to the pTATA (-) negative control.

172
Figure 3.2.2.5: FACS results for the GFP-promoter constructs transfected into CHO-K1
cells showing mean fluorescence of GFP+ gated populations (from figure 3.2.2.4) assayed
36 hours later. Shown as bar headers were the temperature shift fold change (x) values
between 37oC and 31
oC. Error bars represent standard deviation (± SD) between biological
triplicates of samples taken at both temperatures. * represents statistical significance p-
value <0.05, ** p-value<0.01, *** p-value<0.001, determined by a 2 tailed students T-Test
between both sets of triplicate samples for both temperatures.
The CMV promoter once again drove the highest GFP expression (~72000) and a 5.44x
fold increase upon temperature shift to 31oC. The mouse miR-17-92 promoter had stronger
expression at both temperatures than the CHO version, however, unlike the analysis
performed using the Guava®, in this case, the promoter resulted in >2-fold increased GFP
expression at 31oC compared to 37
oC. This is not dissimilar to the changes seen in the
Cirbp promoters.

173
Figure 3.2.2.6: Median GFP expression values in transiently transfected CHO-K1 cells.
Error bars represent standard deviation (± SD) between biological triplicates of samples
taken at both temperatures. In the bar headers showed the temperature shift fold change (x)
values between 37oC and 31
oC. * represents statistical significance p-value <0.05, ** p-
value<0.01, *** p-value<0.001, determined by a 2 tailed students T-Test between both sets
of triplicate samples for both temperatures.
The median figures were calculated by measuring the GFP intensity of the highest
expressing cells within the gated population and here it demonstrated a very similar pattern
to the mean values reported in figure 3.2.2.5. However, discrete differences were seen
between data sets, especially at a fold change level. MDM2, for example, was double
[8.38x] that of SSu72 [4.34x], while Cirbp-mouse had a higher median than the Cirbp-CHO
ortholog, meaning that although the average FITC signal might be high, the median showed
that some cells were of a higher GFP intensity range.
One of the most striking observations was the impact of temperature reduction on the
activity of the CMV viral promoter. This will be addressed later in the section.
174
In conclusion, using GFP as a reporter gene, all of our novel isolated promoters can drive
GFP expression albeit at various degrees of strength. MDM2, SSu72, miR-17-92-mouse,
miR-17-92-CHO and Cirbp-CHO constructs all showed markedly increased fold changes
due to temperature downshift (31oC) when compared to the strong CMV control and also
compared favourably to the endogenous Cirbp-mouse control. Additionally, it was
interesting to observe that the CHO version of Cirbp had marginally better expression than
its mouse orthologue.
3.2.3: Luciferase reporter expression results
Having tested the various promoter fragments for their ability to drive GFP at 37oC and
31oC we then switched vectors to investigate their activity in another reporter gene,
Luciferase.
The GFP assays didn’t account for variations in transfection efficiency between the various
promoter constructs. Therefore, by incorporating a second vector and reporter gene, in this
case, a Renilla Luciferase from the sea pansy ‘Renilla reniformis’ we now had a vector
which could be included in every experiment as a normalisation control. This second vector
was under the control of a CMV promoter and the resulting Luciferase signal from Renilla
can then be used to account for small differences in transfection efficiency.
It became apparent that the Renilla vector was also temperature sensitive, presumably
owing to the fact that Renilla expression was under a similar CMV promoter control.
Therefore, this observation highlighted that the vector would not be a suitable control for
normalisation between samples. To rectify this we reverted to using a Bradford protein
assay to calculate total protein concentrations per sample in order to normalise across all
samples. The Luciferase results of transfections normalised in this manner are shown in
figure 3.2.3.1.
The positive control in this assay was a viral SV40 driven Luciferase (pGL3-Control), not a
CMV as used in the GFP assays; finally a basic promoterless control (pGL3-basic) vector
was used as a negative control.

175
Figure 3.2.3.1: Luciferase results for CHO-K1 cells grown in 24-well plates. Cells were
transfected with pGL3-plasmids containing promoters of interest driving expression of
Luciferase gene and relative Luciferase units were measured on a BioTek® Plate reader 48
hours later. Included controls were a strong positive promoter (SV40) and a minimal-
TATA negative promoter (pGL3-basic). The bar headers represent the temperature shift
fold change (x) values between 37oC and 31
oC. Error bars represent standard deviation (±
SD) between biological triplicates of samples taken at both temperatures. * represents
statistical significance p-value <0.05, ** p-value<0.01, *** p-value<0.001, determined by a
2 tailed students T-Test between both sets of triplicate samples for both temperatures.
Luminescence (RLU) values were normalised to protein concentration measured using the
Bradford assay.
The first point to note is that, unlike the GFP experiments, the positive control construct
using another viral promoter (SV40) was much less responsive to a temperature downshift.
However, there was a significant increase (~1.5x) in expression, but it was much more
modest than the CMV-driven control in the GFP assays seen previous.
Interestingly, the miR-17-92-mouse promoter had the highest Luciferase expression at
37oC, while the Cirbp-mouse control promoter drove the strongest expression at 31
oC, out-
performing the CHO version in contrast to the GFP expression results. MDM2 had a
markedly higher fold change of 41.62x in comparison to all other promoter constructs.

176
This large fold change was in contrast to the GFP results where it was only 3.77x higher at
31oC (Figure 3.2.2.2).
SSu72 had a more modest FC of 1.67x, however the promoter drove higher expression of
Luciferase at both temperatures, similar to the SV40 control. The miR-17-92-CHO
promoter displayed very low Luciferase expression, only slightly higher than the
promoterless pGL3-basic control.
Figure 3.2.3.2: Relative promoter activity results measured by the Luciferase reporter
assay. Data represented as a relative % of SV40 viral promoter control for both 37oC and
31oC temperatures. SV40 activity was set to 100%.
Interestingly, the miR-17-92-mouse promoter out-performed all other constructs at 37oC
being ~42% stronger than SV40, while the CHO version was relatively lower at ~23%. In
comparisons to the SV40 control at each temperature, MDM2 and SSu72 showed 5% and
99% activity at 37oC, but upon temperature shift this activity rose to 145% and 118%
respectively. The MDM2 promoter demonstrated a large differential between 37oC and
31oC, indicating the strongest temperature responsiveness which was quite striking.

177
In this assay the Cirbp-mouse promoter outperformed the CHO equivalent by 11.9% at
37oC and 35.7% at 31
oC, while both were more expressive than SV40 at 31
oC by 113% and
77% respectively which was very promising. MDM2 and SSu72 promoters although less
active than the Cirbp-promoters, also seemed to be interesting candidates for future study as
their expression results were on par with SV40.
Furthermore, the SV40 control promoter did not illicit the same expression strength at
either temperature compared to the CMV promoter used in the GFP experiments. In fact,
the different results achieved using the two different reporter platforms highlight the
importance of testing the activity of promoter sequences of interest in more than one
experimental circumstance, in order to gain a complete picture of their transcriptional
properties.

178
3.2.4: CMV and SV40: Poor viral controls
Upon completion of the above two reporter platforms for target promoters, one concern was
continuously raised over the results. Why do the CMV and SV40 promoters display
inducible expression when it is commonly accepted that they are constitutive promoters?
Having appropriate controls is important when conducting promoter studies; our results so
far have demonstrated that these viral promoters were in fact not suitable controls in
temperature shift promoter studies. CMV (also contained in commercial Renilla vector) and
to a lesser extent SV40 promoters were all shown to be responsive to a low temperature
culture shift.
In fact, Bruening et al demonstrated that CMV promoters were upregulated in response to
stress, and was induced from reduction in available nutrients, accumulation of metabolic
by-products and of course reductions in culture temperature. They showed that reduced
temperature culture of mouse NIH-3T3 cells caused up-regulation of the early CMV
promoter (pCMV-lacZ) after transfection, and appeared to result in activation of the MAP
kinase cascade pathway. They concluded that if the CMV promoter (or any viral promoter
control) can be up-regulated by cellular stresses like cold shock, inadvertent activation of
the stress kinase pathways may complicate, if not invalidate, the interpretation of a wide
range of experiments (Bruening et al. 1998).
More commonly, it is believed to be an innate immune response to combat pathogenicity,
although the exact mechanism is unclear, by viral DNA in order to survive and remain
quiescent within a host until conditions become more favourable, in this case lower
environment temperature (Bruggeman et al. 1995).
To test whether the CMV promoter was behaving as a temperature inducible promoter an
experiment was designed to observe if the CMV-driven reporter gene expression increase at
31oC was occurring due to the mRNA being more stable or more transcriptionally active at
this temperature.
179
CHO-K1 cells were transfected with the CMV-GFP vector and either treated with
actinomycin D or fresh culture media only, coupled with a temperature shift to 31oC to
investigate the effects of 31oC on the mRNA transcript level. Cells were harvested 4, 14
and 24 hours later and RNA was reverse transcribed and GFP mRNA levels quantified by
qPCR.
The copy number in a given sample was calculated from a standard curve (see appendices
table 6.2.2.1) as described previously in section 3.1.4.
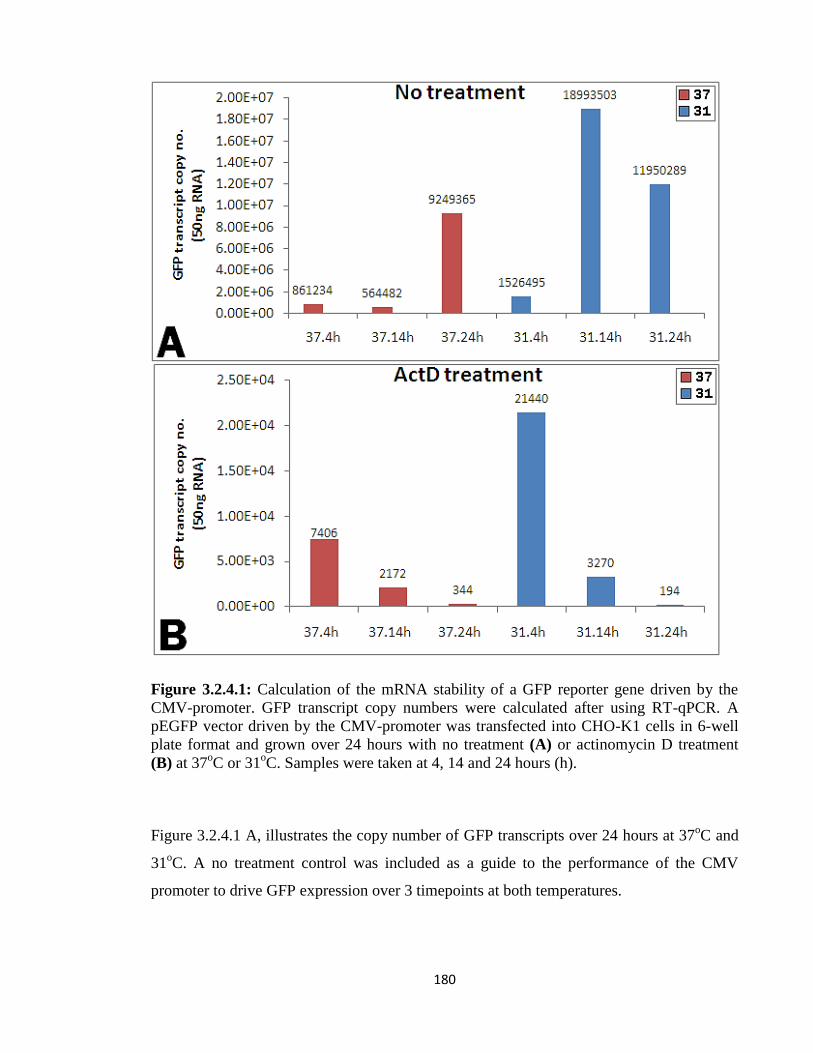
180
Figure 3.2.4.1: Calculation of the mRNA stability of a GFP reporter gene driven by the
CMV-promoter. GFP transcript copy numbers were calculated after using RT-qPCR. A
pEGFP vector driven by the CMV-promoter was transfected into CHO-K1 cells in 6-well
plate format and grown over 24 hours with no treatment (A) or actinomycin D treatment
(B) at 37oC or 31
oC. Samples were taken at 4, 14 and 24 hours (h).
Figure 3.2.4.1 A, illustrates the copy number of GFP transcripts over 24 hours at 37oC and
31oC. A no treatment control was included as a guide to the performance of the CMV
promoter to drive GFP expression over 3 timepoints at both temperatures.

181
More critically, we wanted to examine the drop in GFP transcript number post-actinomycin
D treatment over the same time points and at both temperatures (Figure 3.2.4.1 B).
In the untreated samples at 37oC, transcript copy numbers increased from 8.61x10
5 at 4
hours to 9.24x10⁶ after 24 hours while at 31
oC copy numbers increased from 1.52x10
6 at 4
hours to 1.19x10⁷ after 24 hours (Figure 3.2.6.1 A). Interestingly, there was more GFP
transcript measured at 14 hours compared to 24 hours at 31oC, which was unexpected. This
could indicate that there is interplay between stability and transcript turnover yet to be fully
understood between 14 and 24 hours at mild hypothermia and may be cell cycle related.
There was some fluctuation in copy number over the 3 timepoints which was unexpected;
however, Al-Fageeh and Smales also reported such anomalies between timepoints. They
observed that between 2, 6 and 12 hours the transcript levels of mouse Cirbp mRNA
transcripts varied significantly upon 31oC cold-shock with copy number being lower at 12
hours compared to the copy number 6 hours previous (Al-Fageeh and Smales 2009).
During the first 4 hours at 31oC, GFP transcript numbers were 2-fold higher than the
numbers at 37oC, owing to more GFP expression being driven under the CMV under
normal (no treatment) conditions (Figure 3.2.4.1 A). The expected transcriptional increase
at 31oC by CMV in the untreated samples only becomes substantial from 4 hours onwards.
The difference in copy number between temperatures after 4 hours was 2.97x10⁵ compared
to the difference after 14 and 24 hours, which were 8.68x10⁶ and 7.72x10
6 copies
respectively, thus showing a strong increase in transcription upon temperature shift after the
initial 4 hours (Figure 3.2.4.1 A).
The absolute copy number of GFP transcripts dropped as early as 4 hours in the
actinomycin D treated samples and more so after 24 hours, where the transcript level had
dropped by approximately 21-fold at 37oC and 110-fold at 31
oC. Transcripts also decayed
more quickly during the first 10 hours at 31oC than the same time period at 37
oC (Figure
3.2.4.1 B).

182
Overall, the GFP mRNA under control of the CMV promoter appeared to be less stable at
31oC than at 37
oC based on higher decay rates and lower half-life of GFP mRNA between
24 hours and 4 hours. The half-life at 37oC was calculated to be 4.51hr
-1 compared to
2.45hr-1
at 31oC over the 20 hours in culture (Table 3.2.4.2).
We assume this accounted for the increased GFP expression caused by temperature
downshift shown in the reporter assays previous. The complete decay rate and half-life
values between each time-point were shown in table 3.2.4.2.
Table 3.2.4.2: Decay rate (k in h-1
) and half-life (t1/2) for actinomycin D treatment at both
temperatures representative of figure 3.2.4.1 results.
We conclude that the change in mRNA abundance can be attributed to a transcriptional rate
change, and not increased transcript stability caused by the CMV promoter within the cells.
It was also observed that in the untreated control samples at 37oC and 31
oC, the transcript
copy numbers increased over time at 31oC while with the addition of actinomycin D the
reverse was seen. In other words, we saw reduced stability at 31oC versus 37
oC and
comparatively increased transcriptional activity at 31oC after 24 hours. Finally, the CMV
promoter used in these studies appears to be more transcriptionally active at 31oC and
therefore will no longer be referred to as a reporter control.
ActD @ Time (kdecay) h-1 t 1/2
37oC 24h-4h -0.1535 4.51
24h-14h -0.1843 3.76
14h-4h -0.1227 5.64
31oC 24h-4h -0.2824 2.45
24h-14h -0.1881 3.68
14h-4h -0.235 2.94
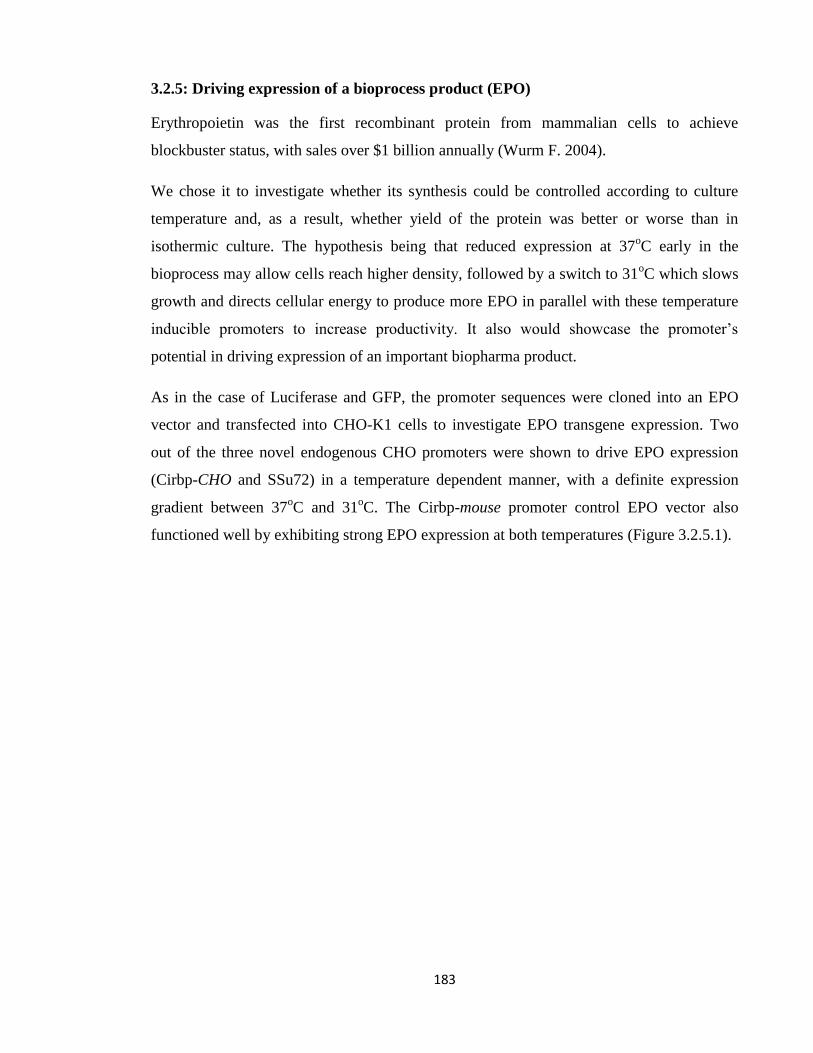
183
3.2.5: Driving expression of a bioprocess product (EPO)
Erythropoietin was the first recombinant protein from mammalian cells to achieve
blockbuster status, with sales over $1 billion annually (Wurm F. 2004).
We chose it to investigate whether its synthesis could be controlled according to culture
temperature and, as a result, whether yield of the protein was better or worse than in
isothermic culture. The hypothesis being that reduced expression at 37oC early in the
bioprocess may allow cells reach higher density, followed by a switch to 31oC which slows
growth and directs cellular energy to produce more EPO in parallel with these temperature
inducible promoters to increase productivity. It also would showcase the promoter’s
potential in driving expression of an important biopharma product.
As in the case of Luciferase and GFP, the promoter sequences were cloned into an EPO
vector and transfected into CHO-K1 cells to investigate EPO transgene expression. Two
out of the three novel endogenous CHO promoters were shown to drive EPO expression
(Cirbp-CHO and SSu72) in a temperature dependent manner, with a definite expression
gradient between 37oC and 31
oC. The Cirbp-mouse promoter control EPO vector also
functioned well by exhibiting strong EPO expression at both temperatures (Figure 3.2.5.1).
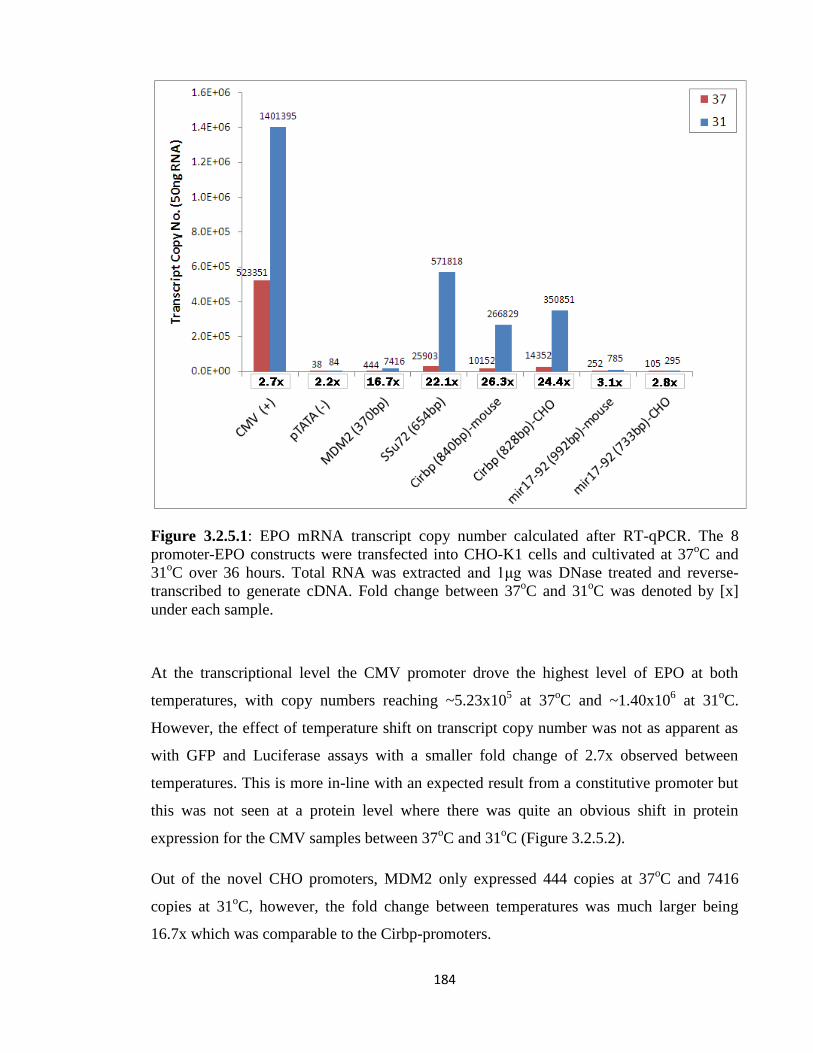
184
Figure 3.2.5.1: EPO mRNA transcript copy number calculated after RT-qPCR. The 8
promoter-EPO constructs were transfected into CHO-K1 cells and cultivated at 37oC and
31oC over 36 hours. Total RNA was extracted and 1μg was DNase treated and reverse-
transcribed to generate cDNA. Fold change between 37oC and 31
oC was denoted by [x]
under each sample.
At the transcriptional level the CMV promoter drove the highest level of EPO at both
temperatures, with copy numbers reaching ~5.23x10⁵ at 37
oC and ~1.40x10
6 at 31
oC.
However, the effect of temperature shift on transcript copy number was not as apparent as
with GFP and Luciferase assays with a smaller fold change of 2.7x observed between
temperatures. This is more in-line with an expected result from a constitutive promoter but
this was not seen at a protein level where there was quite an obvious shift in protein
expression for the CMV samples between 37oC and 31
oC (Figure 3.2.5.2).
Out of the novel CHO promoters, MDM2 only expressed 444 copies at 37oC and 7416
copies at 31oC, however, the fold change between temperatures was much larger being
16.7x which was comparable to the Cirbp-promoters.
185
The SSu72 promoter performed the best of all the promoters tested (excluding CMV)
regarding transcript abundance at both temperatures and indeed at the protein level at both
temperatures (Figure 3.2.5.2).
The basal pTATA (-) control produced low levels of EPO transcript as would be expected
of a minimal promoter. The miR-17-92-mouse promoter expressed marginally more
transcripts than the CHO version, while both promoters drove transcription slightly better at
31oC. The abundance of EPO transcripts varied greatly from the Luciferase values
produced by the miR-17-92 promoters. The miR-17-92 mouse promoter only produced 785
copies at 31oC while the CHO ortholog produced 295 copies at 31
oC.
For the Cirbp-promoters, the effect of temperature shift to 31oC was shown to increase EPO
transcript copy numbers in both orthologs tested. Although the CHO sequence generated
more transcripts at each temperature, the temperature induciblity was less pronounced with
the fold change being marginally less (24.4x) than the Cirbp-mouse promoter, with itself
been the most temperature responsive among all promoters and had a 26.3-fold difference
between 37oC and 31
oC.
Figure 3.2.5.2: Western blots for the 8 promoter-EPO constructs plus a cells only control.
CHO-K1 cells were transfected with the promoter constructs and cultured in 24-well plates
at 37oC and 31
oC. Supernatant from each sample well was harvested 48-hours later.
Supernatant was subsequently loaded onto a 4-12% SDS/Bis-Tris gel and probed with anti-
EPO antibody from Abcam®. As extracellular EPO was secreted into the growth media; no
loading control for EPO was available.
Figure 3.2.5.2 shows that no EPO protein was detected for pTATA (-), MDM2 or either
miR-17-92 promoter; this was unexpected in lieu of previous results in Luciferase and GFP
assays. Surprisingly, the MDM2 promoter resulted in very low EPO mRNA levels, and
186
consequently no protein was detectable by western blot. This result was evidently different
to what was observed for the two reporter proteins previously.
Chen et al see such anomalies aswell, using only two reporter protein platforms for analysis
of transgene expression (GFP and Luciferase). They tested two putative promoter CHO
fragment sequences derived from a promoter-trap method that underwent hygromycin
selection. They showed that clone #2 was strong enough to drive GFP expression but not
Luciferase. Furthermore, clone #2 only exhibited ~20% GFP expression strength for
compared to the SV40 viral promoters used in the study (Chen et al. 2013). Our promoters,
although varying in strength across reporter platforms, performed to relatively higher levels
than the 20% of the CMV and SV40 promoters. As a result, we conclude that MDM2 might
not be suitable for EPO production but could still hold value in other protein production
settings.
Both Cirbp promoters drove expression of EPO as evidenced by qPCR and western blotting
data (Figure 3.2.5.1 and 3.2.5.2). At a transcriptional level the Cirbp-CHO promoter
expressed more copies of EPO than the Cirbp-mouse version at both temperatures. This was
encouraging as a novel finding because so far, only Cirbp promoters from mouse had been
reported in the literature (Al-Fageeh and Smales 2006).
Furthermore, the lack of EPO expression from the miR-17-92-CHO promoter was not
surprising due to its low level GFP and Luciferase expression compared to the other
promoters in previous sections. Moreover, the miR-17-92-mouse promoter had an extra
259bp which may contain addition regulatory sequence. However, to recount, this was not
apparent after cloning in a 1.1kb fragment of the miR-17-92-CHO during the initial
promoter fragment GFP screen (Table 3.1.11), but the landscape of both promoters may be
different. Regardless, in theory, the miR-17-92 CHO promoter could still be utilised to
drive expression of genes that are not required at high levels, such as toxic proteins or dose-
dependent engineering targets that do not require strong expression.
In conclusion, three of the novel isolated promoters [SSu72, Cirbp-CHO, and Cirbp-mouse]
have shown their utility from a bioprocess product viewpoint. They drove expression of a
well-known and important therapeutic glycoprotein [EPO] at both 37oC and 31
oC, with
markedly increased expression seen at 31oC.

187
3.2.6: Driving expression of an cellular engineering transgene (p27)
In the previous section, we investigated the use of several promoters on the production of
EPO at different temperatures. Realistically the product gene is unlikely to be expressed in
an inducible manner such as this, although there have been examples reported (eg:
Regenerons’ ciliary neurotrophic factor (CNTF)/Axokine and interleukin-1) (Preti 2003)
(Gabay 2003).
Inducible promoters are more likely to be useful for controlling the temporal expression of
a cell engineering transgene. Therefore, our next experiment was to consider their use in
this manner. We chose to use cyclin-dependant kinase inhibitor 1B (p27) to investigate
whether they could drive expression of an engineering target to influence a phenotype in
culture. Successful induction of p27 should result in reduced cellular growth via cell cycle
inhibition in the G1 phase.
Controlling p27 expression by inducible promoters could be utilised in a CHO cell line
bioprocess to arrest cell growth and to quickly transition cells into a productive phase to
increase protein production for example.
Here the effect of p27 expression was reported after transfecting the promoter constructs
into attached parental CHO-K1 cells as well as a specially adapted in-house suspension
CHO-K1-SEAP cell line.
We chose a second cell line for two reasons. Firstly to see if p27 could be induced in more
than one cell type in order to impact proliferation and secondly we also wanted to measure
the SEAP productivity of the cells at different cell densities by the varying p27 expression
resulting from the different promoters.
Finally, including a suspension culture will provide data on the utility of these promoters in
a format more relevant to industrial bioprocesses.

188
3.2.6.1: Temperature responsive p27 expression in ‘attached’ culture
CHO-K1 parental cells were seeded and grown at 37oC in 24-well plates for 12 hours prior
to transfection of promoter constructs driving p27. Six hours after transfection, half the
cultures were switched to a 31oC incubator and 66 hours later all cultures were trypsinised
and subsequently stained for viability and analyised by flow cytometry (Figure 3.2.6.1). In
addition, we calculated relative cell density normalised to the pTATA (-) control for all
samples at each temperature (Figure 3.2.6.2).

189
Figure 3.2.6.1: (A) Cell densities were measured 72 hours post-transfection with p27-
promoter constructs. Guava™ flow cytometry was used to calculate cell numbers for
attached CHO-K1 cells grown in 24-well plate format. Error bars represent standard
deviation (± SD) between biological triplicates at both temperatures. * represents statistical
significance p-value <0.05, ** p-value<0.01, determined by a 2 tailed students T-Test
between the pTATA (-) control and all other constructs over 3 replicate experiments. (n =
3). (B) Percentage viability values were also measured by flow cytometry 72 hours later at
37oC and 31
oC.
Post-transfection, all promoter constructs caused a reduction in cell number at 37oC
compared to the pTATA (-) control (Figure 3.2.6.1 A). Interestingly, both MDM2 and
SSu72 constructs caused greater growth suppression than CMV at 37oC, plus SSu72 caused
greater suppression at 31oC also. The Cirbp promoters had a similar effect as CMV,
whereas the miR-17-92 promoters only caused slightly reduced cell densities compared to
pTATA (-) control at 37oC. Switching the cells to a 31
oC incubator resulted in 6x10
4 less
cells per well in the pTATA (-) control samples, representing approximately a 18% drop
compared to cells maintained at 37oC and this was taken to be in response to temperature
shift alone, on cell growth. All promoter constructs tested had a higher cell density
differential when compared to this value from the pTATA (-) control.

190
In contrast, the CMV promoter transfected cells had ~60% reduction in cell numbers at
31oC compared to 37
oC, presumably due to the added effect of transgenic p27 expression
and its subsequent added suppression on proliferation. MDM2 and SSu72 both displayed a
45% and 53% reduced cell density upon temperature shift. However, the greatest impact
caused by temperature shift on relative cell density, between 37oC and 31
oC, was in
cultures transfected with the Cirbp promoters, as highlighted by significant P-values across
3 similar experiments (Figure 3.2.6.2).
Cirbp-CHO had the biggest differential between temperatures being 2.51x10⁵ cells/well;
this represented a reduction of 74% of 37oC cell numbers. The Cirbp-mouse promoter had
the next highest cell number differential of 2.26x10⁵ cells/well; this represented a reduction
of 70% of 37oC cell numbers. By taking into account the pTATA (-) control at 18%, we
calculated the more accurate cell number reduction percentages of 55% (Cirbp-CHO) and
51% (Cirbp-mouse) as a result of normalising to the pTATA (-) control. For the full figures
and % cell number reductions for each p27 construct see tables 6.3.1 and 6.3.2 in the
appendices.
The CMV cell number differential between temperatures was 1.97x10⁵ cells/well compared
to MDM2 and SSu72 being 1.23x10⁵ and 9.20x10
4 cells/well respectively. This resulted in
a larger fold change seen in the CMV promoter samples than MDM2 and SSu72 samples
and appeared to be more inducible upon temperature shift providing further evidence that
CMV was not a good control.
Interestingly, the viability values measured at 31oC were marginally lower overall than the
viability values at 37oC (Figure 3.2.6.1 B). This was unexpected, as lower cultivation
temperature in usually reported to increase viability. There are potentially two reasons why
this may have been observed. One is that maybe the cells were still only adjusting to cold
shock after 3 days and secondly, perhaps the transfection procedure was more impactful at
31oC. Indeed as the viability was lower in all samples that underwent transfection, whereas
the cells only samples had slightly higher viability at 31oC being 97.8% compared to 96.8%
at 37oC.

191
The miR-17-92 promoters had minimal impact on cell density at 37oC but showed reduced
cell numbers at 31oC compared to the pTATA (-) control. However, their impact was not
comparable to the other promoters at either temperature and had the least relative cell
density reduction compared to the pTATA (-) control (Figure 3.2.6.2). This correlated to
the RT-qPCR validation which showed much less p27 mRNA transcripts (Figure 3.2.6.3).
Additionally, they showed a significant response to temperature shift (p<0.05) at an mRNA
transcript level which again is not what one would expect of constitutively active
promoters.
Figure 3.2.6.2: Relative CHO-K1 cell density fold-change (fc) in attached culture. Cell
densities were normalised to the promoterless (pTATA-) negative control sample (Set to
1.0) of its respective 37oC versus 31
oC values.
Overall, there was a correlation between increased copy number and the effect on growth
due to overexpression of p27 (Figure 3.2.6.1 A). For example; MDM2 and SSu72 had the
biggest effect on the cell growth and this correlated with greater p27 mRNA transcript
abundance (Figure 3.2.6.3).
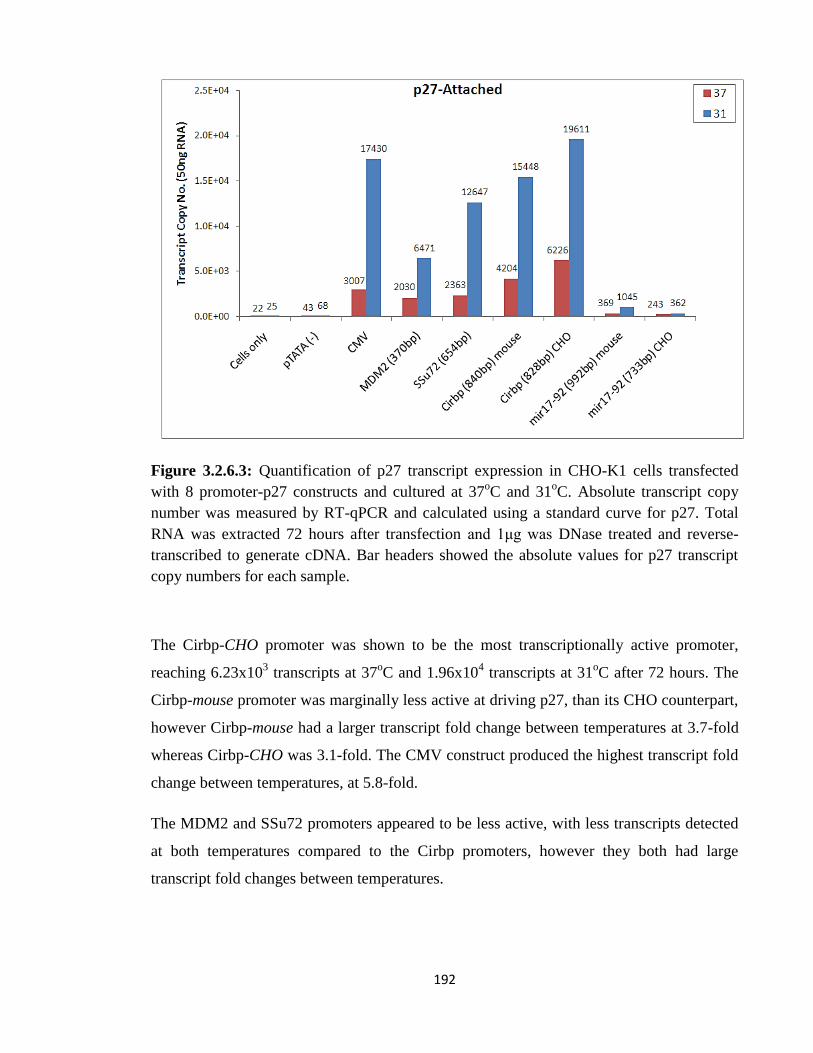
192
Figure 3.2.6.3: Quantification of p27 transcript expression in CHO-K1 cells transfected
with 8 promoter-p27 constructs and cultured at 37oC and 31
oC. Absolute transcript copy
number was measured by RT-qPCR and calculated using a standard curve for p27. Total
RNA was extracted 72 hours after transfection and 1μg was DNase treated and reverse-
transcribed to generate cDNA. Bar headers showed the absolute values for p27 transcript
copy numbers for each sample.
The Cirbp-CHO promoter was shown to be the most transcriptionally active promoter,
reaching 6.23x10³ transcripts at 37
oC and 1.96x10
4 transcripts at 31
oC after 72 hours. The
Cirbp-mouse promoter was marginally less active at driving p27, than its CHO counterpart,
however Cirbp-mouse had a larger transcript fold change between temperatures at 3.7-fold
whereas Cirbp-CHO was 3.1-fold. The CMV construct produced the highest transcript fold
change between temperatures, at 5.8-fold.
The MDM2 and SSu72 promoters appeared to be less active, with less transcripts detected
at both temperatures compared to the Cirbp promoters, however they both had large
transcript fold changes between temperatures.

193
The fold change between 37oC and 31
oC for MDM2 and SSu72 copy numbers were
calculated to be 3.4-fold and 5.4-fold respectively, indicating that they were the most
temperature responsive at a transcriptional level when driving p27.
The observed correlation between growth arrest and p27 transcript abundance encouraged
us to investigate the levels of p27 protein present in the cells using western blot analysis
(Figure 3.2.6.4).
There was an obvious increase in p27 protein (band intensity) expression in the 31oC
samples compared to the 37oC samples overall. The pTATA (-) control detected low levels
of p27 protein at 37oC and slightly more at 31
oC; this was also seen at a transcriptional
level (Figure 3.2.6.3). There was no endogenous level of p27 detected in the cells only
sample at either temperature.
The CMV promoter appeared to drive the most amount of p27 protein at 31oC. MDM2 and
SSu72 also produced strong detection at 31oC and interestingly, SSu72 had similar
detection at 37oC (Figure 3.2.6.4). The Cirbp-promoters had dissimilar results compared to
each other. The Cirbp-mouse promoter had a bigger differential between temperatures than
the Cirbp-CHO and the CHO version as more p27 was detected at 37oC; however less p27
was detected than in the CMV samples. The miR-17-92 mouse promoter appeared to drive
reasonable p27 protein expression based on the protein detected with no apparent intensity
difference between temperatures.

194
Figure 3.2.6.4: Western blots for the 8 promoter-p27 constructs plus a cells only control. CHO-K1 cells were transfected with the p27
promoter constructs and cultured at 37oC and 31
oC. 1x10
6 cells were trypsinised and then lysed 72 hours post-transfection with an in-house
lysis buffer cocktail. A Bradford assay was performed to calculate protein concentration for all samples. 10µg of protein was subsequently
loaded onto a 4-12% SDS/Bis-Tris gel and probed with anti-p27 antibody from Abcam® and a house-keeping gene GAPDH as a loading
control. [p27 = ~27kDa and GAPDH = ~40kDa].

195
3.2.6.2: Temperature responsive p27 expression in ‘suspension’ culture
Our early experiments had illustrated the transcript-dependent nature of the
activity/induciblity of these promoters. Having observed such interesting and encouraging
results with p27 – under the transcriptional control of the Cirbp promoters in particular –
we wanted to assess whether this effect was maintained in cells grown in a different culture
format i.e.: suspension culture.
This is important, as ultimately the aim was to develop tools for use in commercial
bioprocesses in bioreactors and oftentimes the dynamics of different culture formats can
have adverse effects on gene expression. Feng et al examined differential expression of two
viral promoters (SV40 and CMV) and one mammalian (beta-actin) and they found that
beta-actin and SV40 promoters exhibited suppressed gene expression of 70 and 56%,
respectively, in suspension cells. They conclude that regardless of mammalian or viral
vectors, one cannot assume that all expression vectors behave similarly in both suspension
and adherent state. (Feng, Hicks and Chang 2003).

196
Figure 3.2.6.2.1: (A) Guava™ flow cytometry was used to calculate cell numbers for
suspension CHO-K1-SEAP cells grown in 24-well suspension plate format. Cell densities
were measured 72 hours post-transfection with p27-promoter constructs. Error bars
represent standard deviation (± SD) between biological triplicates at both temperatures. *
represents statistical significance p-value <0.05, ** p-value<0.01, determined by a 2 tailed
students T-Test between the change in cell numbers at 37oC and 31
oC between pTATA (-)
control and all other constructs over 3 replicate experiments (n = 3). (B) Percentage
viability values were also measured by flow cytometry 72 hours later at 37oC and 31
oC.
All constructs displayed reductions in cell numbers for both temperatures compared to the
pTATA (-) control (Figure 3.2.6.2.1). Switching the cells to a 31oC incubator resulted in
6x10⁴ less cells per well in the pTATA (-) control samples, representing a 23.6% drop
compared to cells maintained at 37oC and this impact on cell growth was taken to be in
response to temperature shift alone. All promoter constructs tested had more substantial
reductions at 31oC compared to their 37
oC counterpart samples.
Cirbp-CHO had the largest drop at 48.2% followed closely by the MDM2 and SSu72
constructs which showed 45.2% and 39% reductions in cells at 31oC compared to cells
maintained at 37oC when normalised to the pTATA (-) control. The MDM2 and SSu72
promoter cell densities between temperatures showed differentials of 1.84x10⁶ cell/mL and

197
1.51x10⁶ cells/mL respectively, and both caused substantial growth suppression at both
temperatures. However, only MDM2 was shown to be statistically significant over 3
similar experiments. For the full figures and % cell number reductions for each p27
construct see tables 6.3.1 and 6.3.2 in the appendices.
The transfected CMV promoter resulted in the fewest cell numbers at both temperatures
presumably due to strongly driving p27 expression. Surprisingly, this was the opposite of
the attached culture results (Figure 3.2.6.1.1 A), whereby the MDM2 and SSu72 promoters
caused a bigger reduction in cell numbers than the CMV promoter. However, the cell
number differential between 37oC and 31
oC for CMV was only 5.18x10
5 cells/mL and was
less than the differential between 37oC and 31
oC for pTATA (-) control which was
8.31x10⁵ cells/mL. This perhaps indicated that CMV was the least temperature responsive
promoter in suspension CHO-K1-SEAP culture, however, CMV did show a 16% reduction
after normalisation to the pTATA (-) control.
The Cirbp-CHO promoter had the largest cell density differential at 1.91x10⁶ cells/mL
while the Cirbp-mouse ortholog promoter had a difference of 1.80x10⁶ cells/mL between
temperatures. Both Cirbp promoters, like the attached culture results, showed significant P-
values from 3 replicate experiments when compared to the pTATA (-) control.
The miR-17-92 constructs had a similar impact on suspension CHO cells compared to the
attached cells but once again the impact on cell numbers was modest but not
overwhelming. Again the mouse version outperformed the CHO version, when normalised
to the pTATA (-) control, miR-17-92-mouse promoter resulted in a 20.4% reduction in cell
numbers compared to a 13.5% reduction from the miR-17-92-CHO promoter.
Overall, the viability % in the suspension cultures was lower compared to attached culture
(Figure 3.2.6.2.1 B). This could be attributed to suspension cells being more sensitive to the
transfection process and hypothermic environment. The reduced viability seen previously
in attached culture was evident again, with all 31oC samples having been less viable
following flow cytometry analysis. However, we also see that the cells only control
samples which did not undergo transfection showed marginally (1.6% increase) higher
viability at 31oC was more in-line with what we expected.

198
Figure 3.2.6.2.2: Relative CHO-K1-SEAP cell population density as a fold-change (fc) in
suspension culture. Cell densities were normalised to the promoterless (pTATA-) negative
control sample (Set to 1.0) of its respective 37oC versus 31
oC values.
All promoter constructs showed decreased cell density relative to the pTATA (-) basal
control, suggesting that all constructs drove p27 expression sufficiently to inhibit growth at
varying strengths. Once again, the miR-17-92 promoters had the least impact on growth –
having between ~5-14% lower growth than pTATA (-) across both temperatures. The CMV
had the biggest impact and indeed similar reduction of ~60% at both temperatures after
normalisation to the pTATA (-) control values for both 37oC and 31
oC (Figure 3.2.6.2.2).
The Cirbp-CHO promoter showed the strongest effect at 31oC compared to all other
promoters with a 62% reduction in cell density, marginally more than the CMV promoter.
It also had the largest response to temperature with a 2.12-fold reduction in cell density.
MDM2 and SSu72 promoter constructs had moderate effects on cell growth at both
temperatures with 52% and 55% reductions when normalised to the pTATA (-) control
values at both temperatures. Furthermore, both had cell density differentials between 37oC
and 31oC of 1.85-fold and 1.93-fold respectively.

199
Finally, the CMV promoter did cause cell growth to be reduced significantly but there was
a very small difference between temperatures. This indicated that the CMV promoter was
less temperature responsive in this experiment also. We hypothesised that this was maybe
due to the growth repressive effect of p27 expression reaching saturation within the cells,
whereby the natural growth of the suspension cells could simply not be reduced any lower
than ~7.82x10⁵ cells/mL (Figure 3.2.6.2.1 A).
Figure 3.2.6.2.3: Absolute transcript copy number results from RT-qPCR analysis.
Suspension culture CHO-K1-SEAP cells were transfected with all eight p27-promoter
constructs. RNA was extracted from the cells after 72 hours in culture at 37oC and 31
oC.
RNA was then reverse transcribed to generate cDNA for qPCR and analyised using a
HT7900 applied Biosystems™ PCR thermal cycler.
The activity of the CMV promoter resulted in more p27 transcript expression compared to
all other promoter constructs. Cells only and pTATA (-) controls showed very low levels of
p27 as expected. The miR-17-92 constructs did not seem to drive p27 at as high a level as
the four temperature sensitive promoters (Figure 3.2.6.2.3).

200
However, the mouse version did perform better than the CHO version, having 8.3-fold and
9.9-fold more transcripts at 37oC and 31
oC respectively.
Interestingly, MDM2 and SSu72 showed lower amounts of transcripts at both temperatures
compared to the CMV contrary to the attached culture result (Figure 3.2.6.3). MDM2 and
SSu72 promoters along with the Cirbp-promoters showed quiet varying amounts of p27
transcripts than what was expected, based on the cell growth numbers being reported as
consistently reduced among all four promoters (Figure 3.2.6.2.1 A). The Cirbp-CHO
promoter was the only construct that expressed p27 transcripts to a similar level as the
CMV promoter after temperature shift to 31oC.
Because qPCR only measured mRNA expression and not total protein synthesis, it is
important to be aware that disparities can exist between qPCR (transcript) and western blot
(protein) results (Figure 3.2.6.2.4).
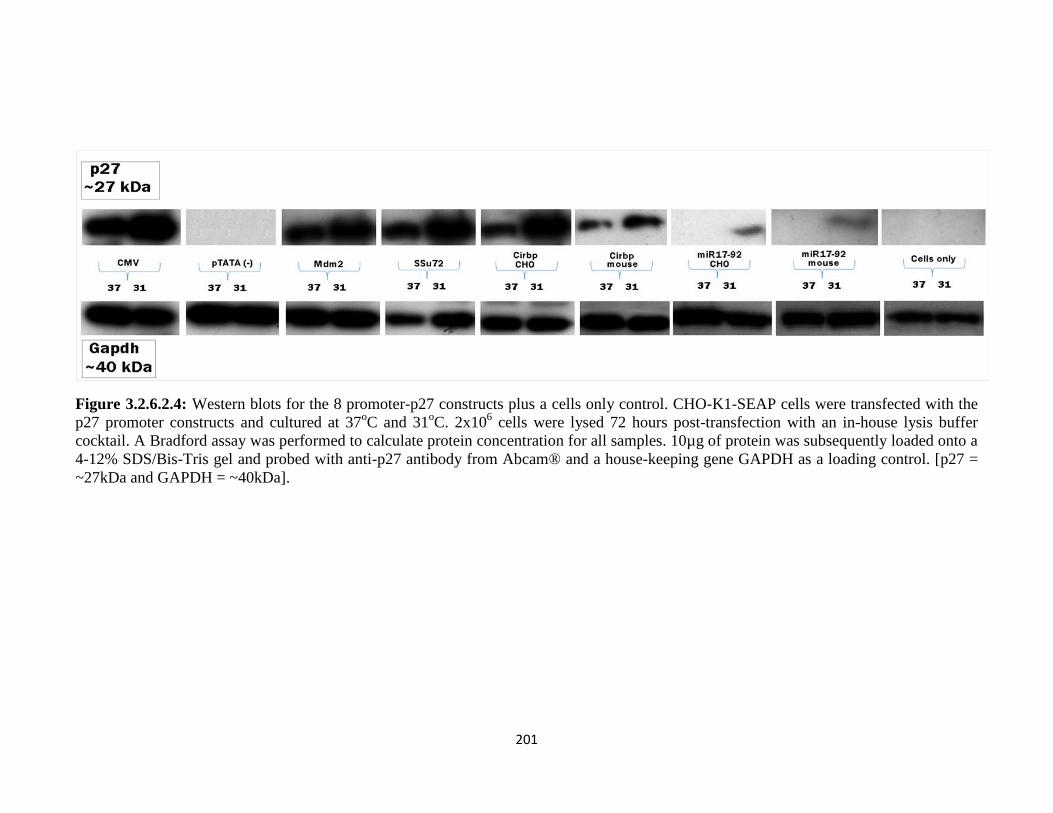
201
Figure 3.2.6.2.4: Western blots for the 8 promoter-p27 constructs plus a cells only control. CHO-K1-SEAP cells were transfected with the
p27 promoter constructs and cultured at 37oC and 31
oC. 2x10
6 cells were lysed 72 hours post-transfection with an in-house lysis buffer
cocktail. A Bradford assay was performed to calculate protein concentration for all samples. 10µg of protein was subsequently loaded onto a
4-12% SDS/Bis-Tris gel and probed with anti-p27 antibody from Abcam® and a house-keeping gene GAPDH as a loading control. [p27 =
~27kDa and GAPDH = ~40kDa].
202
Similar to the attached culture transfections, all constructs showed increased p27 protein
expression at 31oC (Figure 3.2.6.2.4). Cells only and pTATA (-) controls did not drive p27
to a detectable level. The 3 CHO promoters, MDM2, SSu72 and Cirbp all had similar p27
detection based on band intensity (Figure 3.2.6.2.4), however the Cirbp-mouse promoter
appeared to have less p27 detected an indeed not as an obvious increase at 31oC.
Surprisingly, both miR-17-92 promoters appeared to drive p27 protein at 31oC only, with
the mouse version having a marginally bigger band.
3.2.6.3: p27 effect on SEAP activity in CHO-K1-SEAP
Additionally, as we used a suspension CHO-K1-SEAP adapted cell line created in-house by
Dr. Niraj Kumar a secreted alkaline phosphatase (SEAP) assay was performed having taken
the cell supernatants 72 hours post-transfection with the p27 plasmid constructs. This
exercise was to see if SEAP productivity was affected by using temperature-inducible
expression of a growth-associated gene i.e: p27.

203
Figure 3.2.6.3: Secreted Alkaline phosphatase (SEAP) production (units/mL) by SEAP-
secreting CHO-K1 cells 3 days post-transfection with p27 constructs. Error bars represent ±
SD. A cells only control was included as an indicator of the intrinsic SEAP productivity at
each temperature.
SEAP yield seemed to be proportional to the amount of cells present (see figure 3.2.6.2.1
A) and SEAP production wasn’t affected by inducing p27 expression with a temperature
shift to 31oC. The hypothesis was that the more active a promoter was in driving p27, the
less SEAP that should accumulate in the supernatant as a result of less cells being present.
For example, there was more SEAP protein present as expected in the basal pTATA (-)
control at both temperatures (~414 and 323 SEAP units per mL respectively) than all other
transfected constructs. All transfected promoter constructs [MDM2, SSu72 and both Cirbp
orthologs] had an indirect effect on SEAP productivity, we saw lower SEAP detected at
31oC and all had similar levels of SEAP, with Cirbp-CHO having the lowest at 92 SEAP
units per mL (Figure 3.2.6.3).
All transfected promoters had a larger SEAP differential between 37oC and 31
oC, in
comparison to the cells only and pTATA (-) controls. Assuming the 37oC samples were
100% we found that the % drop in SEAP was lowest in the CMV promoter samples (~11%)
204
while the largest drop was seen in the MDM2 promoter samples (~43%) followed by
Cirbp-CHO (~40%). MDM2 showed the largest differential in SEAP and was represented
with a fold change of 2.86-fold drop in SEAP units between 37oC and 31
oC samples.
The cells transfected with the miR-17-92 promoters showed the highest SEAP
concentrations, directly linked to the growth numbers (Figure 3.2.6.2.1 A), and presumably
indirectly linked to their modest ability to drive p27 expression. They did show a reduction
in SEAP at 31oC compared to 37
oC, albeit much less of a reduction than the other
endogenous promoters but interestingly showed a higher reduction than the CMV (11%),
with a 19% reduction for the mouse and a 16% reduction for the CHO version.
Cells transfected with the CMV constructs showed the lowest SEAP concentration at both
temperatures but had a lower fold change of 1.49-fold and the response to temperature shift
was not as impactful on SEAP productivity as the inducible endogenous promoters.
As hypothesised from the attached culture results seen previous, this may be attributed to a
saturation of p27 overexpression by the CMV promoter, whereby the cells were not going
to be growth inhibited any further at 31oC as there is already a strong inhibitory effect on
growth in the 37oC sample. Additional growth inhibition by p27 overexpression caused by
the temperature downshift by the CMV promoter samples may have experienced an
expression overloading on the cells, preventing a further reduction in growth.
Cells transfected with the Cirbp promoters showed marginally lower SEAP overall
compared to cells transfected with the MDM2 and SSu72 promoters, this was more than
likely due to Cirbp being marginally more active at driving p27 expression leading to a
reduced cell growth and therefore lower SEAP concentration.
In conclusion, our data demonstrated that placing novel CHO and mouse promoter
sequences upstream of a cytostatic growth gene (p27), can cause a phenotypic and
metabolic effect on two CHO cell lines especially MDM2 and SSu72 promoters. Variation
was seen between attached and suspension culture probably due to different growth
dynamics. One cannot assume that all expression vectors behave similarly in both
suspension and adherent state as shown by (Feng, Hicks and Chang 2003). The miR-17-92
cluster promoters performed the poorest in driving p27 and like the EPO section, the
promoters seem limited in their functionality, with the mouse performing marginally better.

205
Furthermore, all transfected promoters resulted in quite variable levels of transcripts and
protein levels, highlighting one of our main findings; that it if these inducible promoters are
to be used as tools in gene expression/regulation, then it is important to match the most
suitable promoter to the right gene of interest GOI (Table 3.2.7).
3.2.7: Promoter – Ranking to GOI
To summarise the performance of our promoters over all four reporter platforms used in
this project, table 3.2.7 was devised to establish a somewhat subjective promoter ranking
catalogue. The ranking was based on total expression strength based on protein levels (A)
and temperature induciblity (B) depending on the promoter’s purpose. We believe this
catalog can be expanded as future work contributes further to the promoter toolkit for use in
fine-tuning gene regulation.
From analysing the performance of all promoters across all 4 reporter systems, there was no
obvious behavioral trend apparent by any promoter post-ranking. MDM2, SSu72 promoters
and both orthologs of Cirbp vary from one reporter assay to the next.
For example, the MDM2 promoter was ranked 4th
compared to Cirbp-CHO in 1st for GFP
expression and ranked 3rd
compared to Cirbp-mouse in 1st in driving Luciferase expression
(Table 3.2.7 A). However, regarding induciblity at 31oC as indicated by the fold changes
measured between both temperature expression values, MDM2 was ranked higher within
the GFP and Luciferase assays than all other promoters. The miR-17-92 cluster promoters
were consistently the weakest performing promoters within the study but represent very
novel sequences capable of driving transgene expression nonetheless.

206
Table 3.2.7: Ranking of gene promoters [#1-6] from this study, excluding CMV and SV40
promoters, based on reporter gene expression. (1 = best). (A) Represents an indication of
promoter strength. Ranking based on accumulative total expression from both temperatures.
(B) Represents an indication of the strength of promoter temperature induciblity. Ranking
was based on the fold change between 37oC and 31
oC in each reporter case. (-) denotes an
equal rank value.
Expression level [37+31]
Rank #GFP Luciferase EPO p27
MDM2 4 3 4 2
SSu72 3 4 1 1
Cirbp-CHO 1 2 2 3
Cirbp-mouse 2 1 3 4
mir17-92-CHO 5 6 5 5
mir17-92-mouse 6 5 6 6
Temp shift FC [31/37]
Rank #GFP Luciferase EPO p27
MDM2 1 1 3 3
SSu72 3 4 4 2
Cirbp-CHO 2 3 2 1
Cirbp-mouse 4 2 1 4
mir17-92-CHO 6 6 5- 5
mir17-92-mouse 5 5 5- 6

207
3.3: Bioinformatics / In-silico analysis of promoter sequences
3.3.1: Introduction
As a general rule, promoter regions tend to be located 1500-50bp (but could be thousands
of base pairs further away) from the transcriptional start site (TSS). Enhancer elements and
trans-acting molecules can be located several thousand base pairs away and even on
different chromosomes for example, making analysis as well as isolation difficult
(Khambata-Ford et al. 2003). Several open source promoter prediction programs are
available for public use and can be used to evaluate prospective DNA sequences.
Several online tools (Genomatix, UCSC) were used throughout to provide a comprehensive
analysis of the isolated promoter sequences. Transcription factor binding sites (TFBS) and
polymerase-II binding sites can be located within a promoter sequence to build a
framework of each promoter.
One of the important goals in the post-genomic era is to predict gene expression regulation
on the basis of presence of TFBS in promoter regions (Ding et al. 2013). Genome wide
comprehension of TFBS would be useful to build a transcriptional regulatory network in
CHO biology however understanding of Transcription Factors (TF’s) and TFBS remains
relatively poorly understood, especially in CHO cells.
3.3.2: Promoter mapping
3.3.2.1: Cross-species alignments and TFBS location
There is a plethora of software tools and algorithms at present but for this project we
concentrated on four resources, Genomatix ElDorado™ (MatInspector/FrameWorker
applications), the web resource Regulatory Sequence Analysis Tools (RSAT), ‘Cpgplot’
and the UCSC genome browser. The specificity of a transcription factor can be described
by a sequence pattern. Two alternative formats are currently used to identify these
regulatory patterns: strings (including the IUPAC alphabet for ambiguous nucleotides) or
position-specific scoring matrices (PSSM) (van Helden 2003)

208
Figure 3.3.2.1 illustrates a multi-alignment conservation snapshot of each promoter
sequence; the ATG start codons and predicted transcriptional start sites (TSS) were also
shown. Various transcription factors were identified as a result of highlighting conserved
sequence across evolutionary related organisms and which is often indicative of regulatory
sequence.
This comparative cross species alignment of all 4 promoter sequences [MDM2, SSu72,
Cirbp and miR-17-92] from Rat, Mouse and CHO was done to try and provide detailed
representative maps for identifying the promoter framework encompasing TFBS, core
promoter and possible temperature sensitive regions (Figure 3.3.2.2).

209
Figure 3.3.2.1: Cross-species alignments using ‘ClustalW’ multiple alignment software by inputting the respective promoter sequences in
FASTA format. TF’s were identified using the PROMO:ALGEN™ transcription factor analysis tool which utilises the TRANSFAC™
database. Shown are the predicted TFBS loci and sequence conservation between species for the 4 novel promoters used in this study.
Mouse orthologs for miR-17-92 and Cirbp are included. The predicted TSS’s are denoted by (\\). [ denotes the ATG start site.

210
The predicted TSS positions from the translational start site ‘ATG’ were as follows;
MDM2 -218, SSu72 -192, miR-17-92 -361 and Cirbp at -387. Additionally, a second TSS
was found in the Cirbp sequence at -1170. This was interesting, in light of Cirbp being
reported by Al-Fageeh and Smales, as being modulated by alternative mRNA leader
sequences and exhibits internal ribosome entry segment (IRES)-like activity (Al-Fageeh
and Smales 2009).
Figure 3.3.2.2: Representative promoter mapping of the predicted TSS and TFBS loci and
annotation for all 4 promoter sequences. Transcription factors across evolutionary related
organisms (mouse, rat and CHO) between sequences were highlighted and mapped for each
promoter. (+1) denotes the transcription start sites.

211
Table 3.3.2.1: Identity matrix showing the sequence homology %. Analysis performed
across all four promoter sequences against promoter sequences from two other rodent
species sequences. Analysis was performed by the ClustalW Omega™ software.
Interestingly, the CHO sequence tested in all cases was shown to be more homologous to
rat than mouse when an identity matrix calculation was used to examine the sequence
conservation of all three species. For example; the CHO Cirbp sequence shared 66%
homology with mouse and 70% with rat (Table 3.3.2.1).
It is generally known that miRNAs themselves are well conserved across species and
evolution but tend to have indistinct promoter regions. Interestingly however, the promoter
sequence alignment across species did reveal a relatively high conservation based on a high
identity matrix percentage. The CHO miR-17-92 sequence was shown to be 61%
homologous to mouse and 63% to rat.
In fact, the CHO SSu72 promoter showed the least conservation with only 51.37% and
51.42% compared to mouse and rat respectively. The highest conservation was seen in
MDM2 with the CHO promoter being 67% and 74% respectively.

212
Finally, we noticed that in all cases, at a gene aswell as promoter conservation level, rat
was always more analogous to CHO, which was interesting as the general consensus is that
mouse is the nearest neighbour in evolution (since its genome was sequenced).
3.3.2.2: Genomatix™ analysis
Additionally, we used the reputable Genomatix™ website to investigate transcription factor
binding sites further. MatInspector™ is a software tool contained in the website that utilizes
a large library of matrix descriptions for TFBS in order to locate matches in DNA
sequences. MatInspector has been shown to not be as fast as searching for ‘IUPAC’ strings
but has been shown to produce superior results. It assigns a quality rating to matches and
thus allows quality-based filtering and selection of matches (Quandt,K. 1995).
The FrameWorker™ software uses a genome annotation system called ‘ElDorado’; it
stores biological data consisting of annotation and gene network data plus all transcription
factor information that is contained in MatBase. This lets researchers analyse and interpret
their experimental results in an in silico biological context for more than 30 different
species.
Figure 3.3.2.2.1 illustrates the FrameWorker™ output for each of the four CHO promoters
used in this study. Mouse sequences were automatically tested for TFBS homology in
parallel for Cirbp and miR-17-92 promoters. It was shown that the amount of TFBS was
proportional to the size of the promoter sequence examined. For example, there were 6
TFBS identified in MDM2 and 15 TFBS identified in miR-17-92 sequences, with the miR-
17-92 sequence being ~620bp longer. There were 11 TFBS identified within the SSu72
promoter sequences and 14 TFBS identified in the Cirbp promoter sequences.

213
Figure 3.3.2.2.1 A: MatInspector™ / FrameWorker ™ analysis on MDM2 and SSu72 promoter sequences across CHO (1), rat (2) and
mouse (3) using the software suite with ElDorado annotation for the species within the database. The TFBS shown were generated by using
a high core and matrix similarity cutoff (>0.90) where >0.80 is considered a good match. The matrix families were denoted by V =
Vertebrate and O = Other functional elements. Black bars indicate the relative size of the input sequence. Above the line represents the sense
strand directionality, and below the line represents the anti-sense strand.

214
Figure 3.3.2.2.1 B: MatInspector™ / FrameWorker ™ analysis on Cirbp and miR-17-92 promoter sequences across CHO (1), rat (2) and
mouse (3) using the software suite with ElDorado annotation for the species within the database. The TFBS shown were generated by using
a high core and matrix similarity cutoff (>0.90) where >0.80 is considered a good match. The matrix families were denoted by V =
Vertebrate and O = Other functional elements. Black bars indicate the relative size of the input sequence. Above the line represents the sense
strand directionality, and below the line represents the anti-sense strand.

215
3.3.2.3: ‘Cpgplot’ results
CpG islands are typically located near transcription start sites and are commonly associated
with promoter regions for most genes. Promoters can often be broadly classed into either
TATA-based or CpG island-based promoters (Carninci et al. 2006).
The European Molecular Biology Open Software Suite (EMBOSS) is a high quality, well
documented package of open source software tools for molecular biology (Rice et al.
2000).
CpG islands scoring (The CpG score is the number of CG dinucleotides in the putative
island sequence). CpG islands are associated with genes, particularly housekeeping genes,
in vertebrates. Getting a relative CpG island score for each promoter will aid in their
characterisation.
The EMBOSS suite is found at http://www.sanger.ac.uk/Software/EMBOSS/.
The CHO sequence for all four promoters was put into the EMBOSS Cpgplot software. The
ratio of observed to expected number of GC dinucleotides patterns is calculated over a
window of user-specified size (-window parameter). The window moved along the input
sequence and the ratio was recalculated until the end of the sequence was reached.
By default, Cpgplot defines a CpG island as a region where the calculated (%G + %C)
content was over 50% and the calculated Observed/Expected ratio was over 0.6. The
calculated ratios were then plotted graphically, together with the regions which match the
program's definition of a putative "CpG island" (a window containing a CG dinucleotide
rich area).
Both the SSu72 and Cirbp CHO promoters were identified as having putative islands
present in their input sequences, while MDM2 and miR-17-92 promoters did not (Figure
3.3.2.3.1). For the SSu72 promoter sequence, a CpG rich region was located between the
340 and 684 nucleotides, while the Cirbp sequence contained a CpG rich region between
nucleotides 583 and 816.
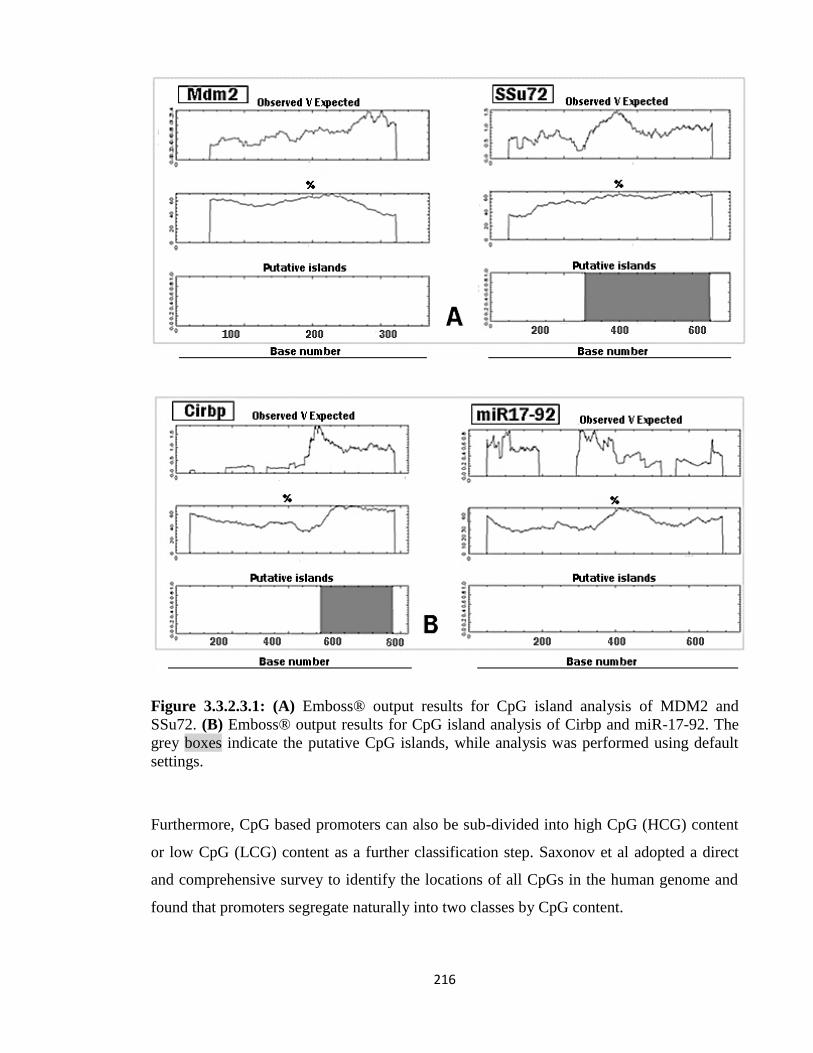
216
Figure 3.3.2.3.1: (A) Emboss® output results for CpG island analysis of MDM2 and
SSu72. (B) Emboss® output results for CpG island analysis of Cirbp and miR-17-92. The
grey boxes indicate the putative CpG islands, while analysis was performed using default
settings.
Furthermore, CpG based promoters can also be sub-divided into high CpG (HCG) content
or low CpG (LCG) content as a further classification step. Saxonov et al adopted a direct
and comprehensive survey to identify the locations of all CpGs in the human genome and
found that promoters segregate naturally into two classes by CpG content.

217
Overall they found that 72% of promoters belong to the class with high CpG content
(HCG), and 28% were in the class whose CpG content is characteristic of the overall
genome (LCG) (Saxonov et al. 2006). Finally, new methods are being explored to genome
sequence exploration, Chuang et al proposed a specific CpG islands prediction analysis
platform (CpGPAP). The platform's supported algorithms (CPSO and CGA) provide a
higher sensitivity and a higher correlation coefficient when compared to Cpgplot, however
we did not compare results (Chuang et al. 2012).
3.4: Co-expression pattern analysis (PCA)
Next we performed co-expression pattern analysis on Cirbp, SSu72 and MDM2 (Figure
3.4.1); unfortunately this cannot be done for the miR-17-92 miRNA cluster, due to its lack
of a clearly defined open reading frame (ORF) and software input limitation.
This co-expression analysis was based on the hypothesis that groups of genes that display
similar expression patterns are likely to be; 1) involved in similar pathways/processes and
more importantly for our study, 2) under the same regulatory control sequences.
In other words, if one takes a large scale profiling dataset (such as the one used to identify
our target promoters originally) and look for subsets of genes whose expression behaviour
over time (or treatment) is very highly correlated, many of these will contain common
regulatory elements within their promoter sequences. The hypothesis was that by aligning
and comparing the promoter regions of these co-expressed genes, it should be possible to
identify common elements.
To perform this co-expression analysis we took all the expression information contained in
the profiling dataset and correlated the expression of every gene in each sample with the
expression of; MDM2, SSu72 and Cirbp. Only genes with a Pearson correlation coefficient
(PCC) value of >0.7 were chosen for further analysis (Figure 3.4.1).

218
Figure 3.4.1: Graph representing co-expression theory of genes following a similar
expression profile. We used the Pearson correlation coefficient (PCC) to identify genes that
followed the same expression pattern from the in-house microarray dataset. The PCC cutoff
was set to 0.7 and ranges from [0-1]. This range represented how close genes were in
comparison to each other.
The co-expressed gene maps were then grouped by the software and showed genes with
similar expression pattern coefficients based on strength of the relationship between genes,
with 1 or -1 being the highest and lowest similarity (Figure 3.4.2).

219
Figure 3.4.2: Co-expression result for the 3 genes used during this project. Analysis was done using the software at www.cgcdb.org, genes
joined by red lines were indicated as having a positive correlation and green lines indicated an anti-correlation. SSu72 had 9 co-expressed
genes based on the stringent 0.7 PCC cut-off, while Cirbp and MDM2 had 2 and 7 genes co-expressed respectively. Full gene annotation is
described in the appendix.

220
Having now identified these 16 co-expressed CHO genes using the software at
www.cgcdb.org, all respective promoter sequences from ~800bp upstream of the start
codon (ATG) for each gene was extracted from the Genbank database. These 16 putative
promoter sequences were compiled and formatted for further analysis (see supplementary
data).
We used the Genomatix™ conserved TF families suite, using the most stringent cutoffs, 3
novel transcription factors were identified in all 16 gene promoter sequences tested. These
were the Ecotropic viral integration site-1 (EVI1), the testis-determining factor (TDF), also
known as Sex-determining region Y (SRY) protein and the Forkhead (FKHD) transcription
factor which consists of many family members.
All three transcription factor binding sights were found in all 16 sequences but interestingly
they had no previous association with CHO or any promoter related studies based on a
comprehensive literature search.
Additionally, a single consensus motif ‘CCCCAGC’ was identified, using the motif finder
from Genomatix™, in all 16 co-expressed gene upstream promoter sequences, including all
4 novel CHO promoters from this study (Table 3.4.3). This motif may be essential for the
temperature sensitive nature of these said sequences.
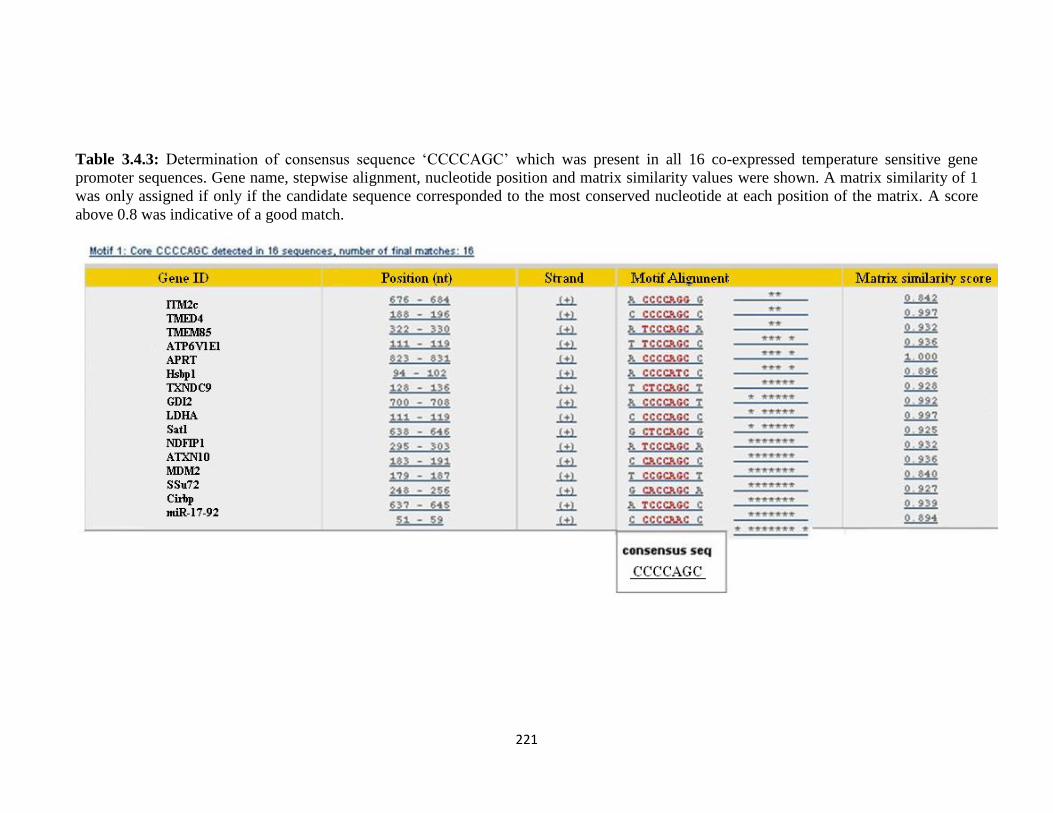
221
Table 3.4.3: Determination of consensus sequence ‘CCCCAGC’ which was present in all 16 co-expressed temperature sensitive gene
promoter sequences. Gene name, stepwise alignment, nucleotide position and matrix similarity values were shown. A matrix similarity of 1
was only assigned if only if the candidate sequence corresponded to the most conserved nucleotide at each position of the matrix. A score
above 0.8 was indicative of a good match.

225
3.5: Viral versus Endogenous stability
To establish if there was a difference between viral and endogenous promoter sequences we
wanted to investigate the stability between the CMV promoter and two of the novel CHO
promoters, miR-17-92 and SSu72. Viral sequences can become silenced over time leading
to cell line instability (Williams et al. 2005). Investigating endogenous promoter sequences
may provide a means of overcoming this.
We transfected the pEGFP-altAL reporter plasmid into CHO-K1 cells, the GFP reporter
containing these three test promoters to measure GFP transgene expression over time in
stable mixed and stable single cell populations. By transfecting the CMV, CHO SSu72
(654bp) and miR-17-92 (992bp) promoter constructs we wished to examine and compare
GFP reporter expression and therefore stability over an extended culture timecourse.
3.5.1: GFP-stability - Mixed population results
Post-transfection, G418 (Gentamycin) was used to select a stable mixed population over 3-
4 weeks, for each of the 3 constructs. This provided us with a viral promoter (CMV) versus
two endogenous promoters (one strong inducible and one weak constitutive) chosen based
on previous reporter results, for a 3 month transgene stability experiment.
In addition to measuring GFP over an extended period in the mixed populations (Figure
3.5.1), we also performed FACS sorting on these populations in order to separate high,
medium and low GFP positive cells into single cell colonies for further stability analysis.
This allowed comparison of stability in mixed stable populations as well as single cell
clones.

226
Figure 3.5.1: Guava™ flow cytometry GFP stability sampling results from 3 promoter
variants (CMV, SSu72 and miR-17-92) stably transfected into CHO-K1 cells. Graph
illustrated the progression of the 3 stable mixed populations during twice weekly passages
by measuring GFP mean expression.
Figure 3.5.1 illustrates the progression of the mixed population over sampling points; the
cells stably expressing GFP under CMV control resulted in much higher GFP expression
overall (~1000) but varied considerably over the first 5 timepoints. The SSu72 promoter
driven stable GFP cells showed lower GFP expression in comparison (~200) but seemed
more consistent and did not appear to fluctuate over the timecourse. Finally, the cells stably
expressing GFP under control of the miR-17-92 promoter resulted in very faint GFP
expression (~90), in keeping with previous GFP reporter results.
The most striking feature of the data was the collapse in GFP expression in the CMV stably
transfected cells after passage 9, dropping to 5.9% (a decrease of 94.1%), of the original
expression. Conversely the SSu72 and miR-17-92 transfected cells remained consistent in
their levels of GFP intensity.
0
200
400
600
800
1000
1200
1400
1600
1800
1 3 5 7 9 11 13 15 17
GFP
Y-M
ean
Passage No.
CMV
SSu72
Mir17-92

227
Furthermore, the SSu72 promoter seemed to marginally enhance GFP expression over time
(Figure 3.5.1). This was verified as the average expression figures indicated a rise from ~90
mean GFP to ~170 mean GFP over the time period. Finally, cells transfected with the miR-
17-92 promoter, showed a reduction to 94% (decrease of 6%) of the original value which
was not as severe as the CMV promoter effect.
3.5.2: GFP-stability - Single cell populations
Next we examined the clonal cell lines that were generated from FACS sorting (see
Appendices 6.3.3) at weekly intervals for 14 weeks. Clones were sorted based on high,
medium and low GFP expression this was done in order to eliminate high CMV expression
levels seen in the mixed population results, as the cause of instability.
After sorting, cells were maintained under selective pressure with intermittent G418
addition to the ATCC media every 3 weeks. Cells were passaged twice weekly and GFP
fluorescence was measured using the Guava™ flow cytometry system during one of these
passages (Figure 3.5.2).
We observed that all CMV driven GFP stable single cell clones show markedly reduced
GFP expression over the 14 week timecourse in comparison to our two novel endogenous
SSu72 and miR-17-92 driven GFP stable clones which stayed remarkably consistent. The
drop-off in expression in single cell clones was not as obvious as was seen in the mixed
population experiment; CMV (clone 11) was the only clone that did not yield lower GFP
expression by the end of the experiment (GFP mean of 155 at beginning and 161 at the end
of the timecourse) (Figure 3.5.2 A).
Although GFP expression in the stable SSu72 clones fluctuated over the timecourse,
whereby during weeks 3-7 we saw 6 out of 12 clones increase their GFP expression but
ultimately returned to the original expression level by weeks 9 and 10 (Figure 3.5.2 B).
GFP expression exhibited by the miR-17-92 clones was again relatively lower compared to
the CMV and SSu72 clones but was noticeably consistent over the timecourse with the

228
majority of clones having higher GFP expression, albeit marginally by the last timepoint
(Figure 3.5.2 C).
In addition, we calculated the overall trend of the 12 clones for each gene promoter. The
slope (m) of the trendline for each clones set of data points was calculated in Excel
(Supplementary data). Then the average slope value across all 12 trendlines was calculated
and imposed onto each graph to represent the overall trend of GFP expression for the entire
12 clonal populations (Figure 3.5.2).
CMV driven single cell clones had the largest slope of -40.2 which was indicative of the
largest decrease in GFP expression, the minus representing a decrease. Interestingly, SSu72
clones showed an increased trend in GFP expression levels with a slope of +8.9. Finally,
miR-17-92 clones showed a decrease in GFP expression, but this was minute compared to
the CMV with a slope of -0.73.
In conclusion, this demonstrated that both endogenous promoter sequences tested can
maintain GFP expression strength compared to a viral counterpart. Furthermore, they
appeared to be exempt from promoter silencing over extended culture time, thus
showcasing their potential for use in driving transgene expression in bioprocessing, by
offering an alternative to commonly used viral promoter sequences.
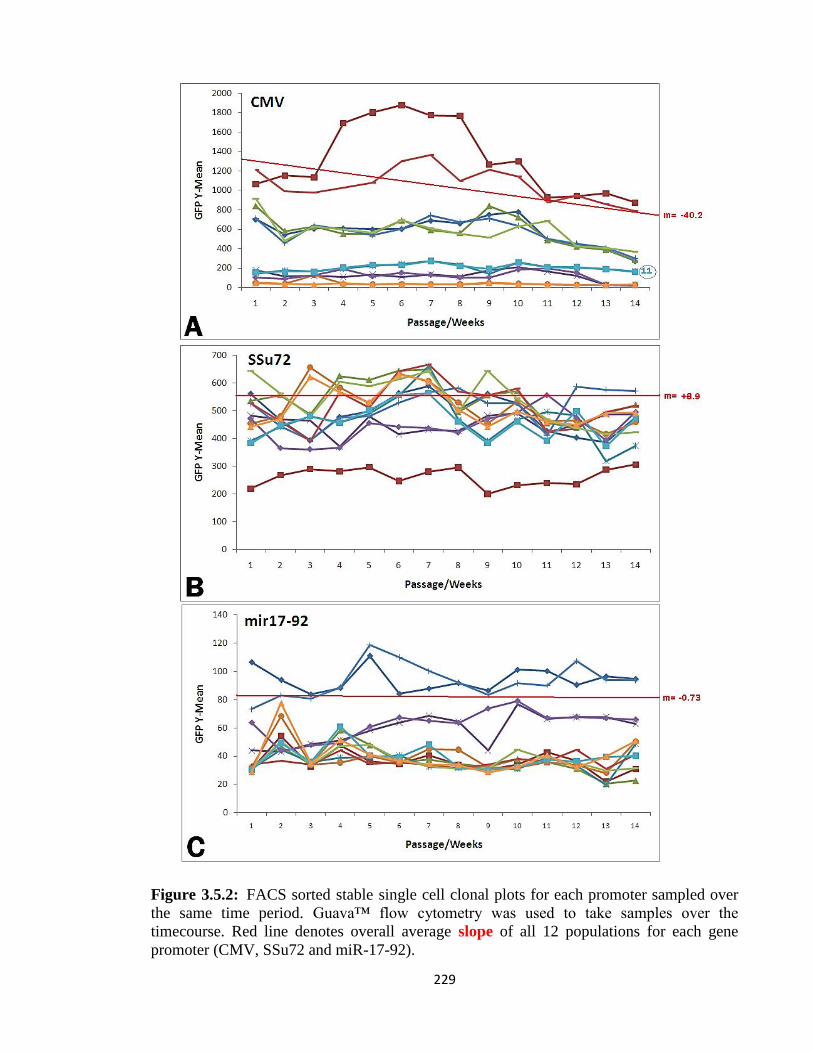
229
Figure 3.5.2: FACS sorted stable single cell clonal plots for each promoter sampled over
the same time period. Guava™ flow cytometry was used to take samples over the
timecourse. Red line denotes overall average slope of all 12 populations for each gene
promoter (CMV, SSu72 and miR-17-92).

230
Section 4.0
Results
Project 2
XIAP as an anti-apoptotic genetic engineering target in CHO
and a subsequent ‘MiR-Capture’ affinity pulldown technique
to identify miRNAs targeting XIAP mRNA.

231
4.1: XIAP as a novel target for engineering in CHO
4.1.1: IAPs and their origin
The Inhibitor of Apoptosis protein (IAP) family are characterised by a novel domain of
∼70 amino acids termed the baculoviral IAP repeat (BIR) one of the 3 domains defining
the family, the name of which derives from the original discovery of these apoptosis
suppressors in the genomes of baculoviruses by Lois Miller and her colleagues (Crook,
Clem and Miller 1993) (Birnbaum, Clem and Miller 1994).
First discovered in baculoviruses, IAPs were shown to be involved in suppressing the host
cell death retort to viral infection. Interestingly, ectopic expression of some baculoviral
IAPs blocks apoptosis in mammalian cells, suggesting conservation of the cell death
program among diverse species and commonalities in the mechanism used by the IAPs to
stall apoptosis in very complex mechanisms and thus be suitable targets for gene therapy
(Smolewski and Robak 2011).
More recently, a second group of BIR-domain-containing proteins (BIRPs) have been
identified that includes the mammalian proteins Bruce and Survivin as well as BIR-
containing proteins in yeasts and Caenorhabditis elegans (Verhagen et al. 2001).
4.1.2: XIAP in Glioblastoma
We became interested in the possibility of using one of these IAPs, more specifically XIAP,
as an engineering target in CHO cells after having contributed to a project entitled “MiR-
23b targets the X-Linked Inhibitor of Apoptosis (XIAP) gene in Glioblastoma”.
Glioblastoma multiforme (GBM) is the most common and most aggressive malignant
primary brain tumor in humans.
It was established that XIAP expression correlated with faster growing more invasive
Glioma cell lines. It was concluded that by increasing the expression of miR-23b in the
established Glioma cell line SNB-19, a 30% decrease in proliferation was achieved.
Furthermore, from qRT-PCR analysis a 65.3% knockdown of XIAP was seen; western blot
232
analysis of the XIAP protein confirmed the expression was strongly inhibited and that there
was a correlation between miR-23b and XIAP and both could be potential candidates for
targeted treatment options in cancer. It is possible that a decrease of miR-23b expression in
Glioblastomas, and subsequent unregulated expression of XIAP, has contributed to the
ability of glioblastoma cells to evade apoptosis.
4.1.3: XIAP – from human to CHO engineering
This previous work on XIAP in the SNB-19 GBM cell line encouraged us to consider the
use of XIAP as an engineering target in CHO cells.
We settled on an approach to combine and apply both miRNA - XIAP anti-apoptotic theory
and practice to the CHO environment. The first step was to see if XIAP was detectable in
various CHO cell lines using the human SNB-19 Glioma cell line (Figure 4.1.4.1) as a
comparison control.
In parallel, a human XIAP overexpression vector (Origene – TruCloneTM
) was transfected
into CHO-K1 cells for the following reasons. 1) To have positive controls for the initial
XIAP western, to make sure XIAP antibody detects XIAP expression in CHO cell lines and
also to see difference between stable and transient transfection of the XIAP vector in CHO.
2) To investigate whether overexpression of XIAP in CHO-K1 cells displays an anti-
apoptotic phenotype/survival compared to control cultures. We planned to measure this in
extended time-course experiments in conjunction with using spent medium (Day 9) and
sodium butyrate (NaBu) addition to mimic an apoptotic culture environment.
Questions to be answered in this part of the project include; is XIAP expressed in CHO?
Does over expression of XIAP in CHO stable clones inhibit the onset of apoptosis? Can
XIAP specific miRNAs be identified through an in vivo capture method? Is XIAP a useful
target in CHO engineering?

233
4.1.3.1: XIAP sequence comparison – Human and CHO
Before progressing further, as we were investigating XIAP between both species a
comparison between XIAP sequences from CHO and human was performed. Until recently
the UCSC genome browser (https://genome.ucsc.edu/) did not have a CHO sequence
interface for searching CHO-specific sequence until Xu et al released the first draft of the
CHO-K1 genome in 2011, but now the sequence information has been integrated into the
UCSC website (Xu et al. 2011).
After initial inspection, the human XIAP full genomic sequence size appeared to span
54.1kb compared to 21.5kb in CHO (Figure 4.1.3.1). In addition, the full mRNA transcript
size was 8.4kb compared to 1.5kb in CHO. The 3’UTR was found to be 6791bp long in
human XIAP whereas it was found to be 28bp in CHO.
Figure 4.1.3.1: UCSC genome browser BLAT output illustrating the incomplete mapping
of 54.1kb of human XIAP total sequence as a comparison across other species. [1] denotes
the chromosomal location (chrx = x chromosome). [2] denotes the 3 transcript variants of
human XIAP. [3] Mouse, Rat and CHO homolog’s highlighted as Refseq versions of
XIAP. [4] denotes the species conservation comparisons for the mRNA coding sequences.
[5] denotes the overall species conservation across 8 additional species for comparison in
that region.

234
Mouse (Mus) and Rat (Rattus) homologs share similarity with the 3 human transcript
variants shown, both span the same sequence distance, while the CHO (Cricetulus)
homolog was markedly shorter (Figure 4.1.3.1). A comparison between the human XIAP
mRNA sequence and CHO mRNA sequence revealed that in the human mRNA there was
6879 more nucleotide bases, nevertheless, the sequences were found to be 88.76%
homologous using ClustalW®.
However, we believed this discrepancy in transcript length was highly unlikely and
proposed that the end of the CHO XIAP 3’UTR was poorly annotated and ill-defined
owing to the draft-nature of sequence annotation (Figure 4.1.3.1). Therefore, we
downloaded the CHO XIAP sequence from www.CHOgenome.org, where the Cricetulus
griseus/CHO sequences are publicly available, to establish the boundary for the CHO XIAP
3’UTR using manual annotation.
The scaffold containing the XIAP gene was identified as NW_003615119 from GenBank.
By mapping the human XIAP 3’UTR to this CHO scaffold we were able to align conserved
putative 3’UTR sequence for CHO. This allowed us to search for CHO-specific expressed
sequence tags (ESTs) which provide further evidence of the true extent of the 3’UTR
sequence. When tested in BLAT on the UCSC genome browser, the chromosomal location
in the UCSC browser was found to be annotated as KE376346, not chromosome-X as
expected. However, using Ref-Seq and expressed sequence tag (EST) comparisons, the
location was established.
The CHO 3’UTR sequence length cut-off was estimated based on a BLAT search of human
XIAP 3’UTR against available C.griseus/CHO sequences using the most 3’ EST
(JP055852). Thus we identified the transcript with the most 3’ EST sequence homology
(TSA: Cricetulus griseus Contig13990.Crgrv2 mRNA sequence)(Figure 4.1.3.2).

235
Figure 4.1.3.2: BLAT output mapping the CHO-specific XIAP mRNA using the UCSC
genome browser software. [1] denotes the chromosomal location. [2] denotes the input
CHO XIAP mRNA sequence from GenBank with exons in solid blocks and introns as
arrowed lines (arrows show direction of expression). [3] denotes the species conservation
comparisons. [4] denotes the 3’ outermost EST reads JP055852 (long) and JI871897
(short). Note: The orientation is 3’-5’ as XIAP in CHO is on the anti-sense strand.
The next step was to use the multi-sequence alignment tool ClustalW® to align the XIAP
mRNA transcript (CDS and 3’UTR only) from both species to investigate the conservation
(see Appendices 6.2.3.1). It was found that the CHO total sequence size was 6300bp with a
4782bp 3’UTR while the human total sequence size was 8413bp, 6791bp being the 3’UTR.
The full transcripts had 81.01% similarity after alignment whereas the alignment for both
3’UTR regions alone revealed 64.22% similarity.
Figure 4.1.3.2 [3], shows that the rat 5’UTR is longer than the human and CHO homologs
but is similar to mouse and extends outside the cropped image. Furthermore, the rat XIAP
3’UTR is a shorter sequence compared to CHO, mouse and human. The human has 2113
nucleotides more than the CHO transcript. One implication of this is that it may potentially
contain more miRNA binding sites compared to rodent species.

236
Finally, the human XIAP codes on the + strand while the CHO XIAP codes on the –strand.
In summary, using manual annotation and in silico mapping, we performed a comparison
between both the CHO and Human XIAP gene sequence. The coding sequence was found
to be 99% homologous (result not shown), however the 3’UTRs were less so at 64.22%,
and the sequence similarity was interspersed even though it spans the same chromosomal
distance (Figure 4.1.3.3). Furthermore, the CHO XIAP 3’UTR was deduced to be 2113bp
shorter in size compared to the human version although the CHO does span the same
chromosomal distance. It remains to be seen if this interspersed additional sequence will
impact the amount of miRNAs detected with the expectation that miRNAs are likely to find
binding sites on longer 3’UTR sequences.
Figure 4.1.3.3: BLAT sequence of XIAP 3’UTR from CHO compared to human. Also
shown are the transcript variants for mouse (Mus XIAP), wild boar (Sus XIAP) and rat
(rattus XIAP) as a general comparison to the difference in conservation across species.
4.1.4: XIAP expression in various cell lines
If we were to implement XIAP as an engineering target it was important to first establish
the levels of endogenous expression in CHO cells. Using an antibody specific to XIAP, we
performed a western blot (Figure 4.1.4) on the following cell lines (Table 4.1.4): CHO-K1
parental and CHO-K1-SEAP cells to test for endogenous XIAP expression, CHO cells
transiently and stably transfected with the human XIAP plasmid as positive control and to
examine the level of XIAP protein in a stable population. Two Glioblastoma (GBM) cell
lines (DK-MG and SNB-19) and a normal human astrocyte (NHA) cell line were also
included as controls.
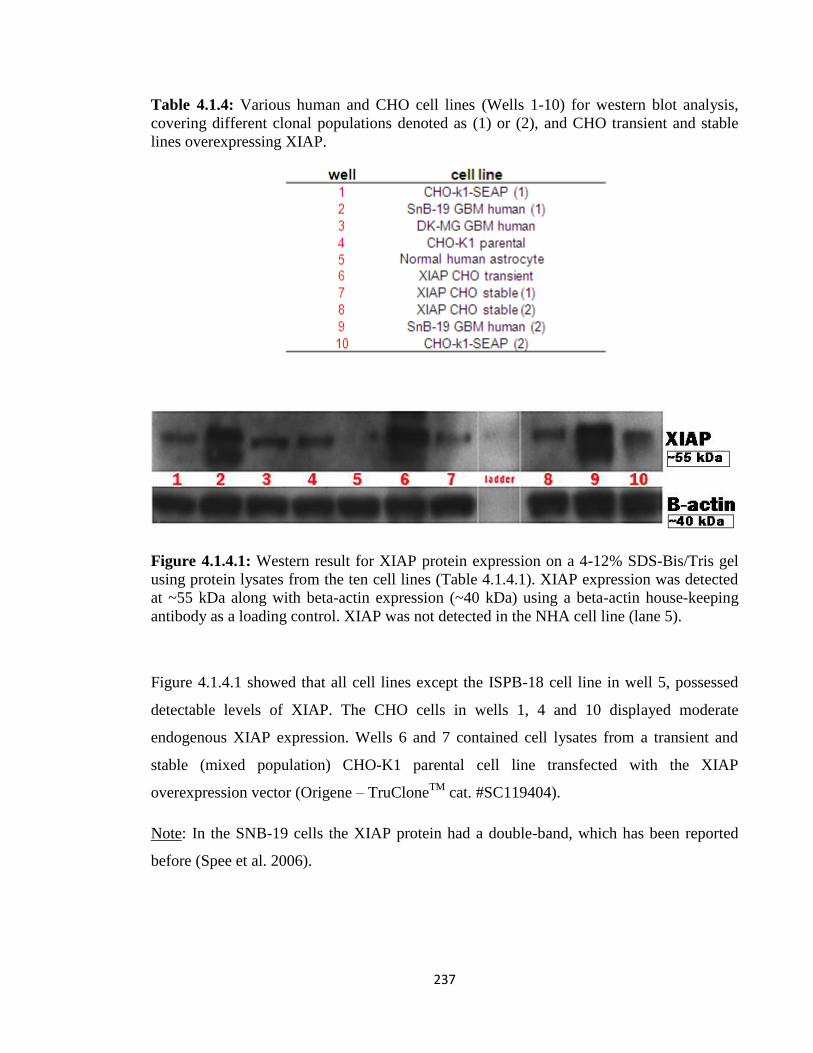
237
Table 4.1.4: Various human and CHO cell lines (Wells 1-10) for western blot analysis,
covering different clonal populations denoted as (1) or (2), and CHO transient and stable
lines overexpressing XIAP.
Figure 4.1.4.1: Western result for XIAP protein expression on a 4-12% SDS-Bis/Tris gel
using protein lysates from the ten cell lines (Table 4.1.4.1). XIAP expression was detected
at ~55 kDa along with beta-actin expression (~40 kDa) using a beta-actin house-keeping
antibody as a loading control. XIAP was not detected in the NHA cell line (lane 5).
Figure 4.1.4.1 showed that all cell lines except the ISPB-18 cell line in well 5, possessed
detectable levels of XIAP. The CHO cells in wells 1, 4 and 10 displayed moderate
endogenous XIAP expression. Wells 6 and 7 contained cell lysates from a transient and
stable (mixed population) CHO-K1 parental cell line transfected with the XIAP
overexpression vector (Origene – TruCloneTM
cat. #SC119404).
Note: In the SNB-19 cells the XIAP protein had a double-band, which has been reported
before (Spee et al. 2006).
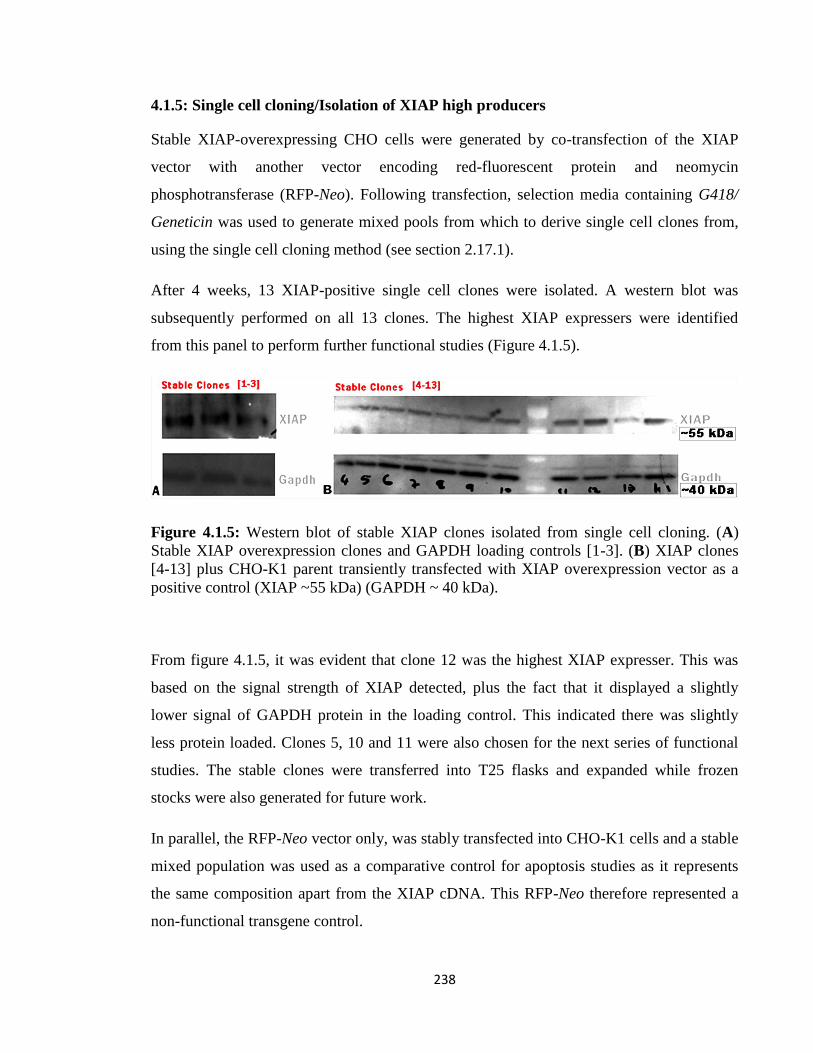
238
4.1.5: Single cell cloning/Isolation of XIAP high producers
Stable XIAP-overexpressing CHO cells were generated by co-transfection of the XIAP
vector with another vector encoding red-fluorescent protein and neomycin
phosphotransferase (RFP-Neo). Following transfection, selection media containing G418/
Geneticin was used to generate mixed pools from which to derive single cell clones from,
using the single cell cloning method (see section 2.17.1).
After 4 weeks, 13 XIAP-positive single cell clones were isolated. A western blot was
subsequently performed on all 13 clones. The highest XIAP expressers were identified
from this panel to perform further functional studies (Figure 4.1.5).
Figure 4.1.5: Western blot of stable XIAP clones isolated from single cell cloning. (A)
Stable XIAP overexpression clones and GAPDH loading controls [1-3]. (B) XIAP clones
[4-13] plus CHO-K1 parent transiently transfected with XIAP overexpression vector as a
positive control (XIAP ~55 kDa) (GAPDH ~ 40 kDa).
From figure 4.1.5, it was evident that clone 12 was the highest XIAP expresser. This was
based on the signal strength of XIAP detected, plus the fact that it displayed a slightly
lower signal of GAPDH protein in the loading control. This indicated there was slightly
less protein loaded. Clones 5, 10 and 11 were also chosen for the next series of functional
studies. The stable clones were transferred into T25 flasks and expanded while frozen
stocks were also generated for future work.
In parallel, the RFP-Neo vector only, was stably transfected into CHO-K1 cells and a stable
mixed population was used as a comparative control for apoptosis studies as it represents
the same composition apart from the XIAP cDNA. This RFP-Neo therefore represented a
non-functional transgene control.

239
4.2: Apoptosis functional validation on cells over expressing XIAP
Now that these XIAP stable cell cultures were derived, a series of experiments was
performed to examine if XIAP overexpression had a beneficial phenotypic effect such as;
increased growth, extended viability, or resistance to apoptosis.
A study by Druz et al, used day 9 spent media to induce/trigger apoptosis in early stage
culture settings to test apoptosis regulation by miRNAs (Druz et al. 2011). We took a
similar approach by cultivating CHO-K1 cells for 9 days and extracting the spent media to
use in this manner.
We also utilised Sodium Butyrate (NaBu) which is well documented to increase cellular
productivity, but can also induce apoptosis at higher concentrations in culture. Sodium
butyrate is an inhibitor of histone deacetylation, and possibly, increases gene transcription
by enhancing gene accessibility to transcription factors (Jiang and Sharfstein 2008). On the
contrary, combinational strategies using NaBu and RNAi to both induce and curtail
apoptosis have been shown to lead to increased production of a range of foreign proteins
such as; EPO, iL-2, β-interferon etc (Yoon, Hong and Lee 2004) (Kim and Lee 2000)
(Hong et al. 2011) (Sung et al. 2007).
Subsequently, addition of NaBu was found to inhibit cell growth and decrease cell viability
in a dose-dependent manner after optimisation (results not shown), and was chosen as a
positive control/trigger during functional validation.
4.2.1: Preliminary testing – cell behaviour in apoptosis-inducing conditions
To begin, we tested the effect of NaBu and spent media treatment on XIAP clone 12 and
RFP-Control stable populations. Cells were seeded at 2x10⁵/well using 6-well plate format
which allowed 4-5 days of growth before reaching 100% confluency. The impact on cell
morphology over time can be seen in figures 4.2.1(1, 2 & 3). We also had an untreated
control plate seeded in parallel to monitor the progression of growth and morphology over
time with no apoptosis inducing treatment.

240
Figure 4.2.1.1: Growth and cell morphology was monitored over 28 days in 6-well plate
format. The comparison was between XIAP clone 12 and RFP-Control (Cont) stable cell
lines cultured in ATCC media only. Images were taken by the Leica™ microscope imaging
suite on various days in culture (3 of which were shown).

241
RFP-Control cells reached confluency by day 4, while XIAP clone 12 reached it
approximately 24-36 hours earlier. By day 14, both populations appeared to be highly
condensed on the plate surface, while the XIAP clone 12 populations had a more elongated
morphology compared to the RFP-Control populations. At this early stage it seemed that
XIAP not only conferred faster growth but seemed to result in notably less death/apoptosis.
Furthermore, by day 28, clone 12 cells appeared healthier morphologically and RFP-
Control cells looked unhealthier, i.e: more detached and much grainier.
Next an independent test was performed to examine if the day 9 spent media (section
2.14.1) could be used to trigger growth arrest/apoptosis. Two types of spent media were
used; ATCC supplemented with fetal calf serum (FCS) and ATCC without FCS, sourced
from two populations of cells grown over 9 days. Cells were seeded at 5x10⁴/well in 24-
well plates and allowed attach for 24 hours before addition of spent media and incubated
for 5 days at 37oC (Figure 4.2.1.2).
Figure 4.2.1.2: Effect of ATCC day 9 spent media on XIAP clone 12 after 5 days in culture
in 24-well plate format. Comparison was done between No treatment (fresh ATCC media)
versus ATCC spent media without FCS (-) versus ATCC spent media with FCS (+). Images
were taken by the Leica™ microscope imaging suite using default settings.

242
The absence of FCS caused more death and detachment of cells and led to an unhealthier
cell state in both cell lines. However, the spent media containing FCS still had a
morphological effect (spiral and elongated cell structure) on the XIAP clone 12 compared
to the non-treated control cells (Figure 4.2.1.2).
This morphology shown may be a defensive mechanism for cell survival or in response to
harsh culture conditions and allowed stronger attachment/adhesion to the substratum. There
is no evidence of this after a literature search, however, many publications have explored
bacteria and cell morphology over extended culture. One publication showed that long term
survival was dependant on the cell wall integrity and that S. aureus cells decreased their
cell size significantly when starved of fresh medium (Watson et al. 1998).
Interestingly, CHO cells elongated and seemed to get larger in harsh culture conditions.
Future experimentation would be required involving isolating cells when they are in this
state and testing for cell adhesion molecules (CAMs) such as integrins, selectins, CD44 and
N-cadherin under flow/shear conditions.
Having observed this abnormal morphological effect we repeated the experiment in 6-well
plates to test over longer time period, owing to increased surface area. We used spent media
once again, but this time included an ATCC media control with no FCS (-) and NaBu
treatment (10mM) on XIAP clone 12 and RFP-Control cultures (Figure 4.2.1.3).

243
Figure 4.2.1.3: Growth and morphology of XIAP clone 12 and RFP-Control cells exposed
to three treatments; ATCC (-) growth media without FCS, ATCC media supplemented with
NaBu at a 10mM concentration and finally spent day 9 media also without FCS (-). Cells
were seeded at 5x10⁵/well and allowed cells to attach in 6-well format for 12 hours before
each treatment step. Cells were cultured over 6 days and images taken at day 2 and day 6
time points.
Observations suggested that in ATCC media, the XIAP clone 12 grew to higher densities
with the well becoming overcrowded, however without any obvious sign of death. The
RFP-Control also grew well albeit not to the same high densities and cells tended to
become detached more easily, i.e: more floating cells (circular morphology) in the media
observed (Figure 4.2.1.3).

244
The NaBu treatment resulted in the biggest difference in cell numbers and cell morphology
between the RFP-Control and clone 12 populations. After 2 days, growth was visibly
reduced based on comparison to ATCC (-) fresh media samples, but the XIAP clone 12 had
more cells (ie: less affected by NaBu treatment presumably owing to the stable XIAP
overexpression) than the RFP-Control samples.
This was even more evident at day 6, where the RFP-Control sample wells showed very
low viable cell numbers and although the XIAP clone 12 samples had less cell growth in
the NaBu treated wells than the ATCC (-) treated wells, clone 12 wells had markedly more
growth than the corresponding RFP-Control wells regardless of condition. This would
suggest greater resilience to death/apoptosis due to overexpression of XIAP.
The spent media samples gave contrasting results, at day 2 there seemed to be more cells in
the RFP-Control, however by day 6, XIAP clone 12 samples exhibited a change in
morphology (cells became more elongated and spiral patterns were seen). Clone 12 also
seemed to be more confluent than the RFP-Control samples beyond day 4-5.
The NaBu treatment method appeared to be more consistent and is more routinely used in
the literature than spent media to induce apoptosis (often there can be gross differences
between spent media collection batches); however spent media is more representative of
late-stage conditions in a industrial bioprocesses.

245
4.2.2: Growth and viability in adherent culture
By performing batch timecourse experiments over 9 days, we wanted to see if differences
in cell numbers existed between the XIAP clone 12 stable cell line and the control vector
(RFP-Control) stable cell line. To achieve this we measured cell density, viability and
prolonged culture survival cultured in fresh ATCC media, ATCC media supplemented with
sodium butyrate or day 9 spent media as mentioned previously (Figure 4.2.2.1).
The non-treated samples were indicative of a natural timecourse progression, giving an
insight into the behaviour between clone 12 stably expressing XIAP and the RFP-Control
population. In addition, we tested the effect on cell numbers after the induction of two
previously reported apoptosis triggers (NaBu and day 9 spent media).
Note: A NaBu concentration of 10mM was found to be optimal by titration experiments to
check the effect of NaBu on healthy CHO-K1 cells, indicated by a substantial decrease in
viability, prior to commencement of the timecourse experiment (results not shown).

246
Figure 4.2.2.1: (A) A 6-well batch culture testing growth characteristics via Guava™ flow
cytometry Viacount®. Cell numbers calculated for stable clones expressing RFP-Neo (RFP
cont) in comparison with XIAP (clone 12) over three treatment conditions. (No
treatment/ATCC (-), 10mM NaBu treatment and day 9 spent media added on day 1). Cells
seeded on day 0 at 5x10⁴ in 6-well plates and counted 6 hours later to allow attachment for
day 0 time point. * represents statistical significance p-value <0.05, ** p-value<0.01,
determined by a 2 tailed students T-Test between both sets of triplicate samples for RFP-
Control and XIAP populations. Error bars represent standard deviation between triplicate
biological samples. (B) Percentage viability averages over the timecourse experiment.
Standard deviation was so minute that it was not included. (n = 4).
Interestingly, NaBu showed a growth promoting effect on Clone 12 over the first 6 days
(4.2.2.1 A) when compared to no treatment (-) control whereas in the RFP-Control samples
treated with NaBu, growth was arrested if not reduced markedly. Perhaps the treatment
with NaBu increased the expression of XIAP from the CMV promoter (NaBu is a
deacetylase inhibitor) in clone 12, hence improving cell growth early in culture. Further
analysis of transcript levels would be required to establish whether this was the case. It was
also concluded that XIAP clone 12 out-performed the RFP-Control (RFP cont) regarding
growth in the no treatment/ATCC and NaBu samples, with more significant difference seen
at later culture time points. For example; in the no treatment samples at day 9, RFP-Control
cell numbers reached 7.20x10⁵ cells/well whereas clone 12 cell numbers reached 1.55x10
6

247
cell/well. In NaBu containing media samples, clone 12 reached 1.48x10⁶ cells/well at day 9
compared to 4.33x10⁵ cells/well for RFP-Control.
NaBu treatment appeared to trigger growth arrest and even decline based on counts from
day 4 onwards compared to no treatment (-) populations. As early as day 2 the XIAP clone
12 not only seemed to be less affected by treatment and recovered faster but rather
continued to exhibit strong growth up to day 9.
Although the spent media addition did trigger growth arrest in early culture, contradictorily
the RFP-Control had infact higher growth on days 6 and 9 compared to clone 12 while the
XIAP clone 12 counts were only higher [1.8x] than the RFP-Control on day 4, being
2.46x10⁵ and 4.54x10
5 cells/well respectively.
Figure 4.2.2.1 (B) illustrates the cellular viability over the timecourse; viability for four of
the six sample populations remained relatively high and constant whereas the two spent
media treated populations showed reduced viability. Interestingly, the RFP-Control spent
population seemed less affected by spent media addition than the XIAP clone 12 population
in day 2, 4 timepoints. However, XIAP clone 12 did recover back up to ~96% in the two
later timepoints while the RFP samples remained the same at ~76-78%. There was variation
seen in both spent media samples (RFP-control and clone 12 populations) on day 0. This
may possibly have been because we took the day 0 sample a few hours after seeding –
hence the spent media had already been detrimental to the culture and thus the viability of
the cells.
Next we wanted to test this same approach in smaller scale 24-well plate adherent format
(Figure 4.2.2.2). This was to observe cell behaviour in two scale formats as at different
scales, cellular dynamics can often be varied (Feng et al. 2003). Even when seeded at a low
density, 24-well scale only allowed for 5-6 days of culture due to confluency on the wells
surface. Once CHO cells become confluent, growth rates typically decrease and true
differences between cell growth counts can become less accurate. Therefore, cells were
seeded at a lower density of 2x10⁴ cells/well to extend the culture timecourse, and although
cells became confluent ~day 6/7, a day 9 time point was included nevertheless.

248
Figure 4.2.2.2: (A) A 24-well batch culture testing growth characteristics via Guava™
flow cytometry Viacount®. Cell numbers calculated for stable clones expressing RFP-Neo
(RFP cont) in comparison with XIAP (clone 12) over three treatment conditions. (No
treatment (-), 10mM NaBu treatment and day 9 spent CHO-SFM-II media added on day 1
cells have attached o/n). RFP-Control and XIAP clone 12 stable cells seeded on day 0 at
2x10⁴ /well in 24-well plates and were allowed attach for 24 hours before treatment step. *
represents statistical significance p-value <0.05, ** p-value<0.01, *** p-value<0.001
determined by a 2 tailed students T-Test between both sets of triplicate samples. Error bars
represent standard deviation between triplicate biological samples. (B) Percentage viability
averages over the timecourse experiment. Viability of day 0 cells was set to 99%. Standard
deviation was so minute that it was not included. (n = 3).

249
Figure 4.2.2.2 shows the comparisons between RFP-Control and XIAP clone 12 over 9
days in culture. In all cases the XIAP overexpressing clone 12 outperformed the RFP-
Control regarding growth and reduced onset of death and presumably apoptosis. The cell
numbers correlate positively with preliminary observations seen in section 4.2.1 suggesting
increased XIAP expression can benefit the longevity of adherent CHO cell culture.
Both NaBu addition and spent media treatment appeared to trigger growth arrest thus
allowing observations of apoptosis in CHO cells to test the effects of XIAP stable
overexpression in apoptosis-inducing culture.
However, contradictorily, NaBu addition onto clone 12 cells appeared to cause an
additional growth increase compared to untreated (-) clone 12 cells. NaBu is a known
inhibitor of histone deacetylase – perhaps treatment of Clone 12 increased acetylation of
the viral promoter thus enhancing XIAP expression and inproving the growth/survival of
those cells. However, this would require further investigation.
The viability percentages can be misleading in some cases where the population densities
of the samples are not taken into account. In other words, the viability for clone 12 samples
were not significantly better than the RFP-Control based on the Viacount assay, however
this does not take into consideration that there was a large disparity between population
numbers.
Visually we observed that XIAP clone 12 underwent a change to its cellular morphology
(spiral/elongated) when treated with spent media in all cases. The presence of FCS in the
spent media also prolonged and protected the cells from death for up to 4 weeks compared
to no FCS spent media; Clone 12 seemed to enter a state of arrest/senescence while RFP-
Control cells consistently died off.
Cell counts indicated that clone 12 had extended growth and longevity but whether this was
a result of a direct anti-apoptotic effect was unclear at this point until we measured
apoptosis directly via Nexin® assay (See section 4.2.5).
Clone 12 also seemed to display extended survival in culture when compared to the RFP-
Control in most instances, early day 2 spent treatments being the only exception. The cells

250
morphology seemed to respond to spent media in XIAP clone 12, while the NaBu treatment
seemed to trigger growth arrest and death in both stable cell lines tested. But the XIAP
clone 12 appeared to be more resilient overall and thus seemed to be a promising
engineering target in CHO at this early stage.
Overall there was a difference between culture formats regarding spent media addition. The
6-well experiment showed that spent media had a positive impact on growth but a negative
impact was seen on growth in the 24- well plates. This may have been due to the fact that
we used different spent media batches, even though both batches were extracted in a similar
fashion. However, subtle variations in composition from batch to batch may have occured.
They may have contributed to the conflicting observations on growth.
4.2.3: Growth and viability in suspension culture
Commercial bioprocessing is customarily performed in suspension culture, so we wanted to
observe cellular behaviour in a suspension setting by first adapting both stable cell lines
[XIAP clone 12 and RFP-Control] to suspension growth.
Once populations were adapted after 3-4 weeks under G418 selection (Geneticin), selection
and growth was monitored in suspension tubes in 1mL media and sub-cultered twice a
week. After 4 weeks it was deemed that cell viability of both clone 12 and RFP-control
cells had reached ~90% after each subsequent passage. However, when RFP-control cells
were grown in 50mL tubes in 5mL volume, RFP-control cells had anemic growth which
may have been a result of incomplete adaption to larger volumes and thus may not have
been a suitable control.
Dedicated suspension culture 24-well plates (Cellstar®) were used to cultivate the adapted
lines (Figure 4.2.3.1). Additionally we used 50mL spin tubes (5mL working volume)
formats in order to assess two different scales of suspension culture (Figure 4.2.3.2).

251
Figure 4.2.3.1: (A) Impact of XIAP overexpression on cell growth. Cell numbers for RFP-
Control and XIAP clone 12 in 24-well suspension plate format. Cells were seeded at
2x10⁵/well in CHO-SFM-II serum free media and measured via Guava™ flow cytometry.
Error bars represent standard deviation between triplicate biological samples. (B) Cellular
% viability over the 12 day timecourse. Error bars represent standard deviation between
triplicate biological samples. * represents statistical significance p-value <0.05, ** p-
value<0.01, *** p-value<0.001 determined by a 2 tailed students T-Test between both sets
of triplicate samples. (n = 3).

252
Figure 4.2.3.2: (A) Impact of XIAP overexpression on cell growth. Cell numbers for RFP-
Control and XIAP clone 12 in 5mL suspension tubes. Cells were seeded at 2.5x10⁵/mL in
CHO-SFM-II serum free media and measured via Guava™ flow cytometry. Error bars
represent standard deviation between triplicate biological samples. (B) Cellular % viability
over the 15 day timecourse. Error bars represent standard deviation between triplicate
biological samples. * represents statistical significance p-value <0.05, ** p-value<0.01, ***
p-value<0.001 determined by a 2 tailed students T-Test between both sets of triplicate
samples. (n = 3).
253
Figures 4.2.3.1 and 4.2.3.2, illustrate the difference in growth and viability between XIAP
clone 12 compared to the RFP-Control stable cell lines in two separate culture formats. The
larger 5mL volume format allowed extension of culture up to day 15 compared to day 12
for 24-well plates. Interestingly, the behavior for XIAP clone 12 is similar in both formats,
with day 9 showing the largest cell density differential between cell lines. At each time-
point, the differences in cell numbers were significantly higher in the clone 12 samples.
In the 24-well results, RFP-Control day 9 cell numbers reached 6x10⁴ cells/mL compared
to ~7x10⁵ cells/mL for clone 12 - whether the low seeding density suited clone 12 more
than the RFP-Control remains to be seen. Other seeding densities were tested but due to cell
clumping in the RFP-Control early in culture, higher seeding densities were not pursued.
Day 9 cell numbers in 5mL culture reached over 3x10⁶ cells/mL compared to RFP-Control
cell samples reaching less than half that at ~1.40x10⁶ cells/mL.
However, there were differences in viabilities seen between formats. In 24-well plates the
cellular viability for clone 12 was relatively high considering the late stage of culture, being
~53% compared to ~23% in RFP samples on day 12. From the 2mL results on days 3 and
6, RFP samples actually had higher viability, RFP being ~89% after day 3 and ~66% after
day 6, compared to clone 12 being ~74% after day 3 and ~61% after day 6.
However, cell numbers on these two days were double in the clone 12 samples compared to
RFP, so we attributed some of this viability difference to a faster growth phenotype
displayed by clone 12. Regardless, it appears clone 12 exerted its superior resistance to
death/apoptosis and a switch was seen between days 6 and 9 (Figure 4.2.3.2 B),
culminating in clone 12 having a viabilities of 39% compared to 18% for RFP-Control after
15 days in culture.

254
4.2.3.1: XIAP clonal variation – Growth in suspension culture
In order to discount the possibility of simple clonal effects as the source of the beneficial
phenotypes we wanted to adapt and test the other XIAP clones [5, 10 and 11] previously
isolated to see if they follow the same phenotype as clone 12. This was conducted using the
same experimental design but with CHO-SFM-II serum free media as the no treatment
control instead of ATCC used previously and again NaBu addition was used to induce
apoptosis to see if clonal differences were apparent.
From the western (Figure 4.1.5) we saw that after FACS sorting of XIAP clones (1-13) had
slightly varying levels of XIAP expression and all lower than clone 12 (hence why it was
chosen originally), clones 5, 10 and 11 were chosen along with clone 12 to test further. To
recap, the RFP-Control is a mixed population of CHO cells transfected with the RFP-Neo
vector, which was co-transfected with the XIAP overexpression vector originally to
facilitate cloning selection.
These three XIAP overexpressing clones were first adapted to serum-free suspension
culture. This was achieved by growing the cells in T25 flasks for 4 weeks while
continuously titrating to lower % FCS and a blend of CHO-SFM-II and ATCC media.
Finally, as the cells no longer needed FCS they were cultured in CHO-SFM-II serum free
media specially formulated for suspension growth.

255
Figure 4.2.3.1.1: (A) Cell numbers for RFP-Control stable CHO-K1 cell line and XIAP clones 5, 10 and 11 grown in 24-well plate
suspension culture format. Cells were seeded at 2.5x10⁴/well in 1mL CHO-SFM-II serum free media and or NaBu treatment 12 hours post
seeding. Cell were measured via Guava™ flow Cytometry and viacount® reagent. * represents statistical significance p-value <0.05, ** p-
value<0.01, *** p-value<0.001 determined by a 2 tailed students T-Test between both sets of triplicate samples with the asterisk placed on
the XIAP clone sample bars representing its corresponding RFP-Control bars. Error bars represent standard deviation between triplicate
biological samples. (n = 3).
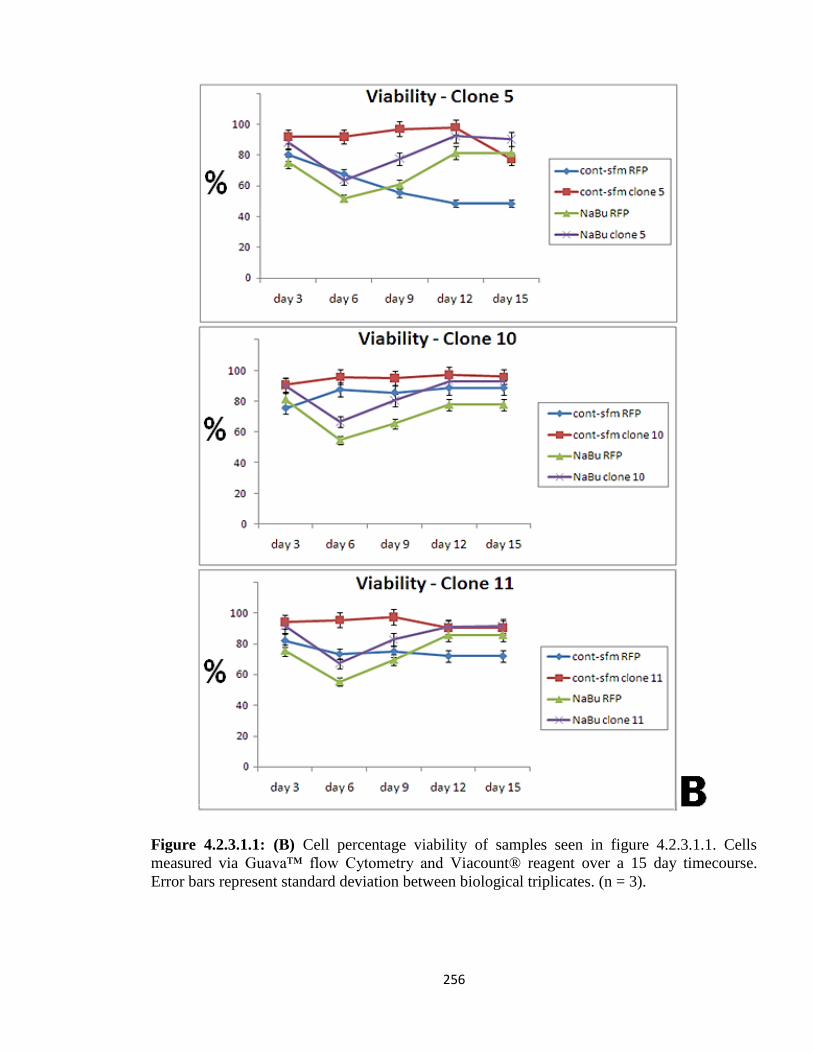
256
Figure 4.2.3.1.1: (B) Cell percentage viability of samples seen in figure 4.2.3.1.1. Cells
measured via Guava™ flow Cytometry and Viacount® reagent over a 15 day timecourse.
Error bars represent standard deviation between biological triplicates. (n = 3).
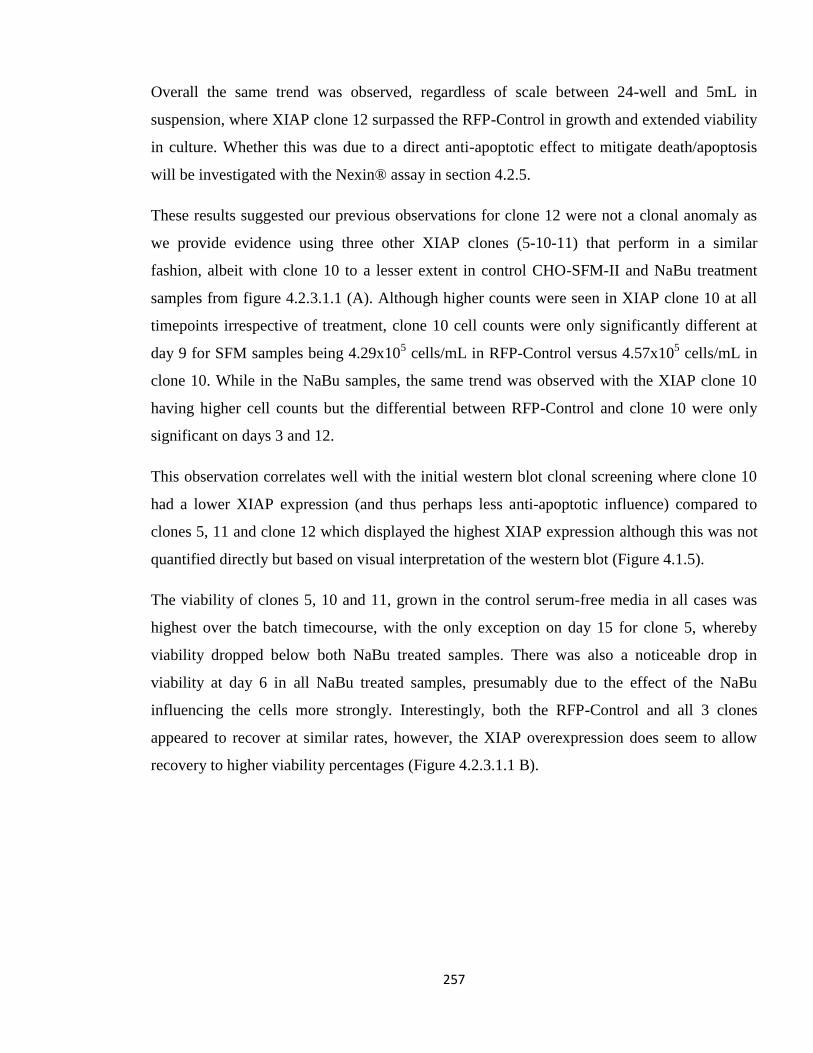
257
Overall the same trend was observed, regardless of scale between 24-well and 5mL in
suspension, where XIAP clone 12 surpassed the RFP-Control in growth and extended viability
in culture. Whether this was due to a direct anti-apoptotic effect to mitigate death/apoptosis
will be investigated with the Nexin® assay in section 4.2.5.
These results suggested our previous observations for clone 12 were not a clonal anomaly as
we provide evidence using three other XIAP clones (5-10-11) that perform in a similar
fashion, albeit with clone 10 to a lesser extent in control CHO-SFM-II and NaBu treatment
samples from figure 4.2.3.1.1 (A). Although higher counts were seen in XIAP clone 10 at all
timepoints irrespective of treatment, clone 10 cell counts were only significantly different at
day 9 for SFM samples being 4.29x10⁵ cells/mL in RFP-Control versus 4.57x10
5 cells/mL in
clone 10. While in the NaBu samples, the same trend was observed with the XIAP clone 10
having higher cell counts but the differential between RFP-Control and clone 10 were only
significant on days 3 and 12.
This observation correlates well with the initial western blot clonal screening where clone 10
had a lower XIAP expression (and thus perhaps less anti-apoptotic influence) compared to
clones 5, 11 and clone 12 which displayed the highest XIAP expression although this was not
quantified directly but based on visual interpretation of the western blot (Figure 4.1.5).
The viability of clones 5, 10 and 11, grown in the control serum-free media in all cases was
highest over the batch timecourse, with the only exception on day 15 for clone 5, whereby
viability dropped below both NaBu treated samples. There was also a noticeable drop in
viability at day 6 in all NaBu treated samples, presumably due to the effect of the NaBu
influencing the cells more strongly. Interestingly, both the RFP-Control and all 3 clones
appeared to recover at similar rates, however, the XIAP overexpression does seem to allow
recovery to higher viability percentages (Figure 4.2.3.1.1 B).

258
4.2.4: Fed-batch culture – Growth and viability in suspension culture
This positive impact in a batch culture setting led us to consider whether it would be equally
beneficial in a fed-batch setting. Having previously adapted all stable clones [RFP-Control
and XIAP clones 5-10-11-12] to suspension growth, clones were monitored in 5mL volumes
in 50mL suspension culture tubes over the same timecourse with batch feeding (CHO CD
Efficientfeed™ A) - every second day to replace 10% of media volume.
The question of whether the advantageous phenotypes carry over into a fed-batch setting was
investigated and the growth and viability results were shown in figures 4.2.4.1 (A, B). The
reasons for this experiment were two-fold. Firstly, to investigate XIAP overexpressing clones
in a small-scale fed-batch setting and secondly, to confirm clonal variance wasn’t seen in fed-
batch culture.
Factors impacting on density can be attributed to non-optimal feeding, coupled with the much
smaller seeding density of 5x10⁴ cells/mL compared to 2x10
5 cells/mL, more commonly used
for timecourse experiments. Since the aim was to capture as much of the cell behaviour over
the longest possible time range, cell seeding needed to be this low.
Cells proliferated exponentially over the first 2 days based on seeding of 5x10⁴ cells/mL
reaching ≥2x10⁵ cells/mL by day 2, but growth appeared to slow after the first supplement of
Efficientfeed™. The feeding was perhaps not optimal for exponential growth past day 4,
however it did allow enough time for the cells to be observed up to day 10.
Osmolality, substrate inhibition and nutrient turnover may be limiting parameters here also;
but without the same resources to investigate these more complex factors of a fed-batch
culture the interplay between these factors remains unclear.

259
Figure 4.2.4.1: (A) Cell numbers for RFP-Control stable cell line and XIAP clones 5, 10, 11
and 12 cell lines in 50mL tube suspension fed-batch format (5mL working volume). Cells
were seeded at 5x10⁴ cells/well in CHO-SFM-II serum free media and measured via Guava™
flow Cytometry viacount® over 10 days. * represents statistical significance p-value <0.05, **
p-value<0.01, *** p-value<0.001 determined by a 2 tailed students T-Test between both sets
of triplicate samples with the asterisk placed on the XIAP clone sample bars representing the
difference between the corresponding RFP-Control bars on left of blue line. Error bars
represent standard deviation between triplicate biological samples. 0.5mL of culture was
removed and supplemented with 0.5mL Efficientfeed™ every 2 days (10%). (B) Cell
percentage viability of samples seen in (A) over 10 days. Error bars represent standard
deviation between triplicate biological samples. (n = 3).
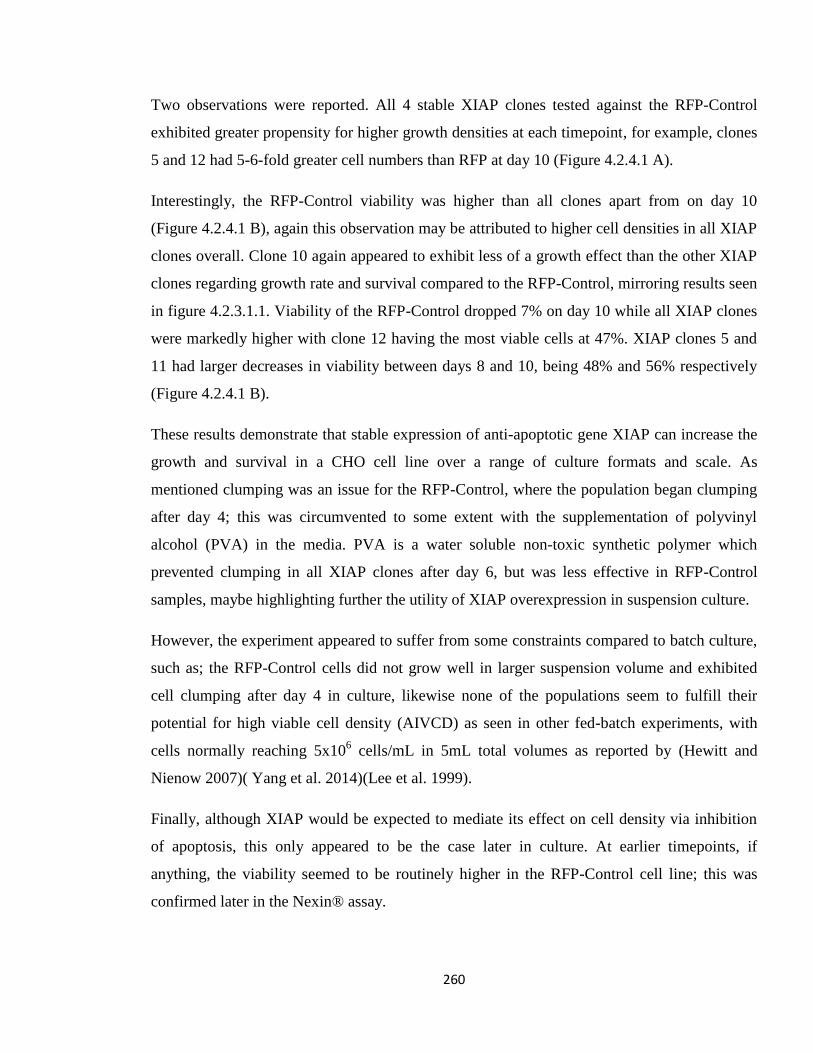
260
Two observations were reported. All 4 stable XIAP clones tested against the RFP-Control
exhibited greater propensity for higher growth densities at each timepoint, for example, clones
5 and 12 had 5-6-fold greater cell numbers than RFP at day 10 (Figure 4.2.4.1 A).
Interestingly, the RFP-Control viability was higher than all clones apart from on day 10
(Figure 4.2.4.1 B), again this observation may be attributed to higher cell densities in all XIAP
clones overall. Clone 10 again appeared to exhibit less of a growth effect than the other XIAP
clones regarding growth rate and survival compared to the RFP-Control, mirroring results seen
in figure 4.2.3.1.1. Viability of the RFP-Control dropped 7% on day 10 while all XIAP clones
were markedly higher with clone 12 having the most viable cells at 47%. XIAP clones 5 and
11 had larger decreases in viability between days 8 and 10, being 48% and 56% respectively
(Figure 4.2.4.1 B).
These results demonstrate that stable expression of anti-apoptotic gene XIAP can increase the
growth and survival in a CHO cell line over a range of culture formats and scale. As
mentioned clumping was an issue for the RFP-Control, where the population began clumping
after day 4; this was circumvented to some extent with the supplementation of polyvinyl
alcohol (PVA) in the media. PVA is a water soluble non-toxic synthetic polymer which
prevented clumping in all XIAP clones after day 6, but was less effective in RFP-Control
samples, maybe highlighting further the utility of XIAP overexpression in suspension culture.
However, the experiment appeared to suffer from some constraints compared to batch culture,
such as; the RFP-Control cells did not grow well in larger suspension volume and exhibited
cell clumping after day 4 in culture, likewise none of the populations seem to fulfill their
potential for high viable cell density (AIVCD) as seen in other fed-batch experiments, with
cells normally reaching 5x10⁶ cells/mL in 5mL total volumes as reported by (Hewitt and
Nienow 2007)( Yang et al. 2014)(Lee et al. 1999).
Finally, although XIAP would be expected to mediate its effect on cell density via inhibition
of apoptosis, this only appeared to be the case later in culture. At earlier timepoints, if
anything, the viability seemed to be routinely higher in the RFP-Control cell line; this was
confirmed later in the Nexin® assay.

261
4.2.5: Apoptosis - Nexin® Assay on adherent and suspension culture
In the early stages of apoptosis, changes occur at the cell surface which can be difficult to
recognise and differentiate between the stages of death. The Nexin® /Annexin V assay, offers
the possibility of detecting early phases of apoptosis before the loss of cell membrane integrity
and permits measurements of the kinetics of apoptotic death (Vermes et al. 1995).
The assay uses the Annexin V protein to tag apoptotic and dead cells within a culture, the
numbers are then counted by Guava® flow cytometry. The mix-and-read Guava Nexin Assay
relies on a two-dye strategy. The assay utilises Annexin V-PE to detect the translocation of
phosphatidylserine (PS) to the external surface of the membrane of apoptotic cells, an early
indication of commitment to apoptosis. The Guava Nexin Assay incorporates this PS-Annexin
V-PE binding as an indicator of early stage apoptotic cells. The cell impermeant dye 7-AAD is
included in the Guava Nexin Reagent as an indicator of membrane structural integrity. 7-AAD
is excluded from live healthy cells and early apoptotic cells, but permeates late stage apoptotic
and dead cells.

262
Figure 4.2.5.1: Measuring Apoptosis via Nexin® Assay apoptotic index for RFP-Control and
XIAP clone 12 cell lines. Cells were evaluated using the Guava™ flow cytometry over a 12
day timecourse in 24-well adherent culture. Error bars represent standard deviation between
triplicate biological samples. * represents statistical significance p-value <0.05, ** p-
value<0.01, *** p-value<0.001 determined by a 2 tailed students T-Test between both sets of
triplicate samples with the asterisk placed on the XIAP clone sample bars representing the
difference between its corresponding RFP-Control bars.

263
In keeping with the earlier viability measurements, XIAP clone 12 was found to have higher
levels of apoptotic cells on days 3 and 6 compared to the RFP-Control. However on day 9 a
shift occurred where XIAP clone 12 still maintained a higher percentage of cells in early
apoptosis but actually had fewer cells progressing to late apoptosis unlike the RFP samples
(Figure 4.2.5.1). For example; out of 2500 events measured by flow cytometry on day 12,
RFP-Control samples had on average 703 cells in early apoptotic state and 328 cells in late
apoptosis, compared to clone 12 which had 734 cells in early apoptosis but only 58 cells in
late apoptosis.
It is important to note that total cell numbers for XIAP clone 12 samples were double
compared to RFP-Control samples on days 3, 6 and 9 due to higher growth rate as seen in
section 4.2. For example on day 3, the average cell density for RFP-Control was 5x10⁵
cells/mL while in clone 12 samples the cell density was 1.49x10⁶
cells/mL. On day 12, RFP
average cell densities were 4.73x10⁵ cells/mL while clone 12 average the cell density was
9.92x10⁵ cells/mL.
In conclusion, the extended culture survival phenotype of XIAP clone 12 can be attributed to
an anti-apoptotic effect at later stages of culture for both attached and suspension experiments.
Therefore, it is unlikely that entire clonal behavior was down to apoptosis-resistance solely.

264
4.2.6: Functional Validation using RNAi - XIAP effect on growth
Stable XIAP overexpression appeared to increase cell growth and reduce apoptosis in the
previous section. In order to further confirm the role of XIAP in this observation, the aim of
this experimental section was to specifically knockdown XIAP in two cell lines using RNAi.
To examine whether this increased growth/reduced apoptosis was specifically a result of XIAP
overexpression, we wanted to see whether these phenotypes could be reversed by specifically
knocking down XIAP using RNAi.
XIAP clones and CHO-K1 cells (not to be confused with the stable RFP-control CHO cells)
were grown in two formats, 24-well suspension plates and 2mL suspension tubes. We
measured the cell counts and viability post- transfection to see the impact various siRNAs had
on both cell lines. Additionally a comparison using two different CHO cell lines, the CHO-K1
parental cell line and the XIAP stable clone 12 (CHO-K1 also had detectable endogenous
XIAP expression as shown in figure 4.1.3.1) in 24-well suspension culture over a 6 day
timecourse.
The XIAP siRNA was pre-designed by Ambion® from the Silencer® select range to target the
human XIAP transcript (NM_001167U32974.1) which the stable XIAP clone 12 was
transfected with. A control VCP siRNA was also chosen, and targets the Valosin-containing
protein which is an ubiquitin segregase that remodels multimeric protein complexes by
extracting polyubiquitinated proteins for recycling or degradation by the proteasome. It is
responsible for proper functionality of CHO cells and when knocked down, reduces viability
and growth radically. It has been used as an in-house siRNA knockdown positive control since
it was identified and functionally validated by Doolan et al, in a large scale microarray CHO
specific profiling study (Doolan et al. 2010). The negative siRNA control (siNeg) was a
scrambled sequence that should not target any coding sequence within CHO cells and served
to control for non-specific effects of the transfection.
Figure 4.2.6 depicts the sequence comparison between the siRNA and the CHO mRNA target.
Despite the 2 base mismatches, we predicted that it might also target the endogenous hamster
XIAP transcript the main purpose was to reverse the overexpression of human XIAP – not
necessarily deplete endogenous version.

265
Figure 4.2.6: Sequence alignment between Silencer® XIAP siRNA and the CHO mRNA
sequence target. A 2 base mismatch is shown at base numbers 11 and 16.
After transfection, we analysied the cells via flow cytometry to see the effects of the various
siRNAs. Figure 4.2.6.2 illustrates the cell counts and viability results for XIAP clone 12 in
2mL suspension tubes over 6 days post-transfection with XIAP, VCP and scramble negative
siRNAs.

266
Figure 4.2.6.1: Functional validation using siRNAs targeting XIAP, VCP and a scrambled negative control (siNeg) of cells grown in
24-well suspension over 6 day culture. CHO-K1 and XIAP clone 12 cells used for functional comparison and the cells were seeded at
2x10⁵/mL. * represents a p-value <0.05, ** p-value<0.01, *** p-value<0.001 as determined by a 2 tailed students T-Test between
triplicate samples and placed on the siNeg data points to represent the statistical significance between siXIAP and siNeg values.
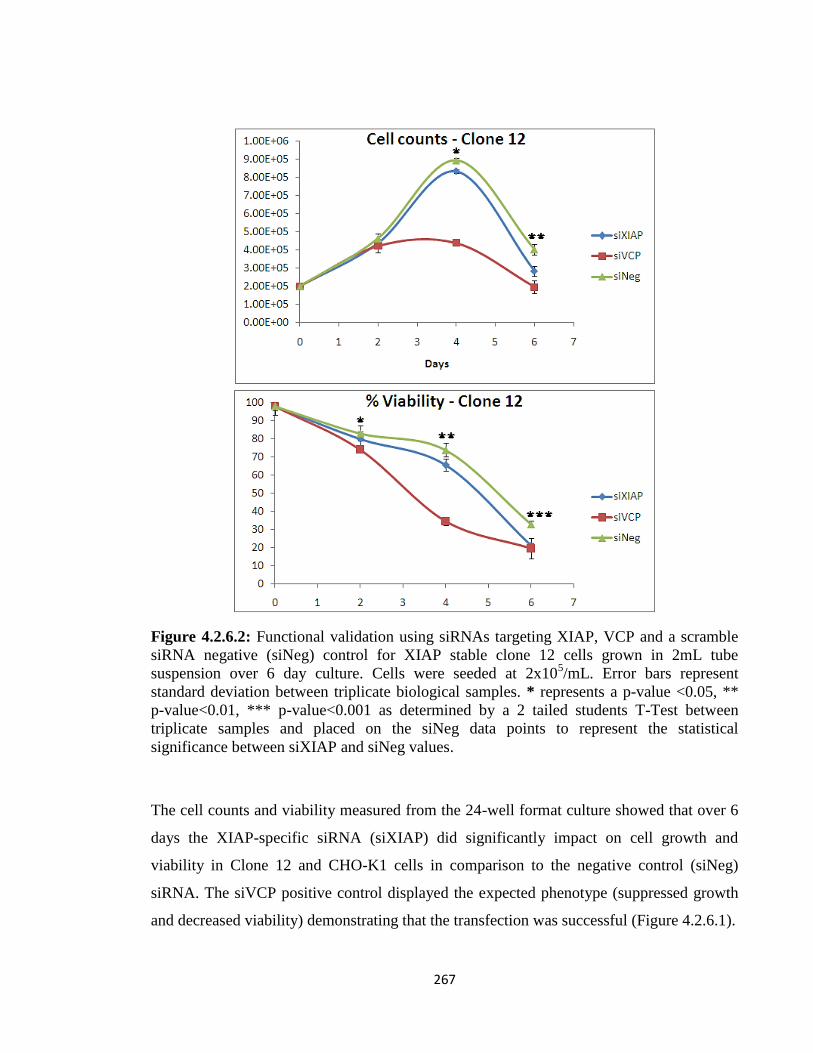
267
Figure 4.2.6.2: Functional validation using siRNAs targeting XIAP, VCP and a scramble
siRNA negative (siNeg) control for XIAP stable clone 12 cells grown in 2mL tube
suspension over 6 day culture. Cells were seeded at 2x10⁵/mL. Error bars represent
standard deviation between triplicate biological samples. * represents a p-value <0.05, **
p-value<0.01, *** p-value<0.001 as determined by a 2 tailed students T-Test between
triplicate samples and placed on the siNeg data points to represent the statistical
significance between siXIAP and siNeg values.
The cell counts and viability measured from the 24-well format culture showed that over 6
days the XIAP-specific siRNA (siXIAP) did significantly impact on cell growth and
viability in Clone 12 and CHO-K1 cells in comparison to the negative control (siNeg)
siRNA. The siVCP positive control displayed the expected phenotype (suppressed growth
and decreased viability) demonstrating that the transfection was successful (Figure 4.2.6.1).

268
By knocking down XIAP there was a significant reduction in cell numbers at days 4 and 6,
while a reduction in cell counts was seen at day 2 for both cell types, though not significant.
Clone 12 cell numbers were the highest on day 4, with the siNeg samples reaching
1.30x10⁶ cells/mL; this indicated the natural cell density of the stable XIAP clone 12 cells,
whereas after knocking down XIAP, cell counts decreased to 8.2x10⁵ cells/mL.
Interestingly, the highest cell numbers seen in the CHO-K1 siNeg samples were on day 6
and reached 9.65x10⁵ cells/mL compared to 5.75x10
5 cells/mL in the siXIAP treated
samples, again indicating that knocking down XIAP does appear to impact on the growth
characteristics of both clone 12 and CHO-K1 cell lines.
Furthermore, the results showed that viability was significantly reduced in siXIAP
transfected samples in comparison to the siNeg control transfected samples on days 2, 4
and 6 for both clone 12 and CHO-K1. Interestingly, the percentage viability seen in siXIAP
transfected samples on day 6 in the CHO-K1 cells dropped to 30%, 8% below the siVCP
transfected samples.
The biggest differential between cell counts after siRNA transfection of clone 12 was seen
on day 4 in 24-well culture whereby siXIAP samples were 8x10⁵ cells/mL and the siNeg
control counts were 1.30x10⁶
cells/mL. The biggest viability differential was seen on day 6
in the 24-well culture, where clone 12 had 71% viability in the siNeg and 39% in the
siXIAP. In contrast the CHO-K1 cell line had 50% viability in siNeg samples while in the
siXIAP samples had 32% viability at day 6.
XIAP knockdown had a more marginal functional effect on cell growth and viability after
day 6 compared to clone 12 in 24-well culture at day 6, but was statistically significant
(Figure 4.2.6.2). The biggest differential was seen on day 6 in cell count with siNeg
transfected cells being 4x10⁵ cells/mL and siXIAP transfected cells being reduced to
2.8x10⁵ cells/mL, while the viability was 32% in siNeg samples and reduced to 19% in
siXIAP samples.

269
Additionally, a western blot was performed to show XIAP expression at the protein level
(Figure 4.2.6.3). This was performed to see the functional efficacy of the XIAP siRNA
post-transfection into CHO-K1 and XIAP clone 12 cells. It was observed that the XIAP
was knocked down on day 3 in both cell lines with CHO-K1 showing less XIAP protein
compared to XIAP clone 12 (Figure 4.2.6.3).
Figure 4.2.6.3: Western blot to validate XIAP siRNA knockdown in CHO-K1 and XIAP
clone 12 cell lines in 24-well suspension culture post-transfection. A positive XIAP protein
control sample from a transient transfection sample seen in figure 4.1.3.1 plus a GAPDH
loading control were also included. (XIAP ~55-57kDa) (GAPDH ~ 40kDa).
Figure 4.2.6.3 illustrates that by day 6 the XIAP knockdown was more obvious in the
CHO-K1 cell line which may simply be due to the higher levels initially present in clone
12. In the clone 12 samples, the XIAP protein was reduced, but was still present on day 3;
and detection of the protein was shown to be similarly decreased at day 6.
Additionally, Gapdh appeared to be marginally lower in the siNeg XIAP clone 12 samples
compared to siXIAP – this would, in theory, mean endogenous XIAP levels were higher
than they appear on the western gel image.
Taken together, from these results we concluded that the XIAP siRNA (siXIAP) caused a
reverse in functional phenotype in the XIAP clone 12 and indeed parental CHO-K1 growth
densities compared to a scramble siRNA negative control (siNeg). Late culture exhibited
the most significant cell count changes, with the most significant differences seen at day 6.
270
The siXIAP samples were evidently reduced compared to the scramble siNeg control in all
cases (Figure 4.2.6.1), thus confirming the functional role of XIAP, at least partially in
impacting cell growth and survival.
4.2.7: XIAP clone 12 productivity results
In light of of previous results showing increased growth and survival by the XIAP clones
and clone 12 in particular, the next step was to see if XIAP engineering could be used to
impact on productivity. SEAP, and two industrially relevant proteins, EPO and IgG were
transfected into clone 12 to investigate whether this phenotype could increase overall
protein production compared to the RFP-Control.
4.2.7.1: SEAP productivity
A vector containing SEAP driven by the CMV promoter was transfected into XIAP clone
12 and RFP-Control cell lines to test SEAP productivity over 12 days. Cells were seeded at
1.5x10⁴
cells/well into 24-well plates on day 0 and allowed attach for 12 hours before
transfection of SEAP-vector (a sample was taken here as day 0).

271
Figure 4.2.7.1.1: (A) Volumetric SEAP productivity assay over a 12 day timecourse post-
transient transfection of the SEAP vector into XIAP clone 12 and RFP-Control cell lines.
SEAP was measured per 50μl of supernatant from cells grown in 24-well suspension plates.
Cells were seeded at 1.5x10⁴ cells/well in ATCC+5% FCS on day 0. SEAP units were
normalised by calculating the mean V (slope) of the SEAP activity using the BioTek™
KC4 plate reader. * represents statistical significance p-value <0.05, ** p-value<0.01, ***
p-value<0.001 determined by a 2 tailed students T-Test between both sample sets of
triplicate samples. (B) Normalised SEAP productivity calculated per cell by dividing total
SEAP by the cell counts for each sample. All error bars represent standard deviation
between triplicate biological samples.

272
Volumetric SEAP activity was more than twice as much in clone 12 samples compared to
RFP-Control samples at all time points. For example on day 9 SEAP was ~125 SEAP units
in RFP-Control samples compared to ~320 SEAP units in clone 12 samples (Figure
4.2.7.1.1 A).
We also wanted to investigate a normalised SEAP productivity per cell, from our analysis
there was no significant difference between both cell lines in terms of specific
productivities. However, on each day, productivity per cell tended to be higher in clone 12.
For example; on day 9 normalised SEAP activity per cell was 0.00501 in RFP-Control
compared to 0.00732 SEAP detected in clone 12 (Figure 4.2.7.1.1 B).
In addition, the large increase in SEAP activity per cell seen at day 12 can perhaps be
attributed to a substantial drop in cell viability for both cell lines, therefore less viable cells
were subsequently counted on day 12, causing the per cell productivity to appear increased.
4.2.7.2: EPO productivity
Next we wanted to investigate the productivity of another protein in clone 12 compared to
the RFP-Control. Cells were seeded at the same density of 1.5x10⁴/well and grown in
ATCC+5% FCS for 12 hours prior to transfection of an EPO-vector driven by a CMV
promoter into both cell lines. Erythropoietin (EPO) is an example of a therapeutic protein
manufactured in CHO cells and many studies have been conducted to increase its
production (Trummer et al. 2006) (Hong et al. 2007) (Park et al. 2012).
A western blot was performed to measure the levels of EPO protein post-transfection,
samples were taken at days 2, 4, 7, 10 and 12 with days 4, 7 and 10 results shown (Figure
4.2.7.2).
We observed an increase in EPO protein yield over the timecourse for both cell lines, with
an obvious increase in the XIAP clone 12 samples at each time-point compared to the RFP-
Control.

273
Figure 4.2.7.2: Western blot of extracellular EPO secreted by RFP-Control and XIAP
clone 12 cell lines over 12 days in 24-well suspension culture. Cells were seeded at
1.5x10⁴/well. (XIAP ~55-57kDa). Equal volumes of supernatant were loaded per lane. No
GAPDH loading control used as extracellular protein taken from culture supernatant.
4.2.7.2.1: Densitometry - EPO
Additionally, we converted all EPO band intensities from the western result into
quantitative numerical values using densitometry to quantify the difference in EPO
production between RFP-Control and XIAP clone 12. Using Total-Lab Quant™ software
we analysed the optical density of the pixels on the photographic film (Figure 4.2.7.2.2).
From this, we were able to calculate a percentage and fold-change increase relative to the
RFP-Control samples at each time-point.

274
Figure 4.2.7.2.1: Densitometry using Total-Lab Quant™ on the western blot for EPO
productivity. Comparison of RFP-Control (set to 1) and XIAP clone 12 cell lines over days
4, 7 and 12. Percentage increase between RFP-Control and clone 12 on each day placed on
the XIAP bar headers.
Densitometry results provided further evidence that XIAP clone 12 did indeed produce
more EPO than the RFP-Control. On day 4 the largest increase of 1.42-fold was seen in
XIAP clone 12, while on day 7, the increase was much less but still higher at 1.08-fold.
Five days later, presumably owing to increased cell numbers at the early stages of culture
and resistance to apoptosis at later stages (after day 6 based on Nexin results seen
previously), the XIAP clone 12 produced 1.28-fold more EPO than the RFP-Control.
Ideally, for a future experiment we would like to extend this culture even longer and
examine EPO productivity beyond 12 days, however, we are aware that product quality
may deteriorate over time in harsh culture conditions.

275
4.2.7.3: IgG productivity
Finally, we wanted to determine whether cells stably overexpressing IgG (in-house CHO
1.14 cell line) yielded more monoclonal antibody (mAb), compared to control cells. Both a
XIAP overexpression vector and a RFP-Neo vector (as before) were co-transfected with an
in-house hygromycin resistance (HYG) vector into CHO 1.14 cells and was used to select
stable mixed populations after 4 weeks.
Note: Having previously experimented with transient transfection of both vectors into CHO
1.14, no significant effect was seen (results not shown).
To ensure that the increased growth and survival phenotypes, seen previously in stable
transfected CHO-K1 cells, repeated in another CHO cell line – we first measured the cell
numbers and viability of the 1.14 cell line stably expressing RFP and XIAP (Figure
4.2.7.3.1). Due to clumping, day 9 was the maximum longevity of the timecourse.

276
Figure 4.2.7.3.1: CHO 1.14 cell numbers and viability percentage measured over 9 days to
investigate the RFP-Neo control stable population compared to the XIAP stable population.
Cells were seeded at 2x10⁴/well in 24-well plates and measured via Guava™ flow
cytometry. * represents statistical significance p-value <0.05, ** p-value<0.01, *** p-
value<0.001 determined by a 2 tailed students T-Test between both sample sets of triplicate
samples for cell counts and cell viability. Asterisks were placed on viability error bars of
XIAP 1.14 data points and denote the statistical significance between the respective RFP
1.14 data points.
It was shown that stable XIAP transfected CHO-1.14 cells grew faster and had prolonged
viability compared to RFP stably transfected CHO 1.14 cells (Figure 4.2.7.3.1). Cell
numbers at each time point were significantly higher overall in the XIAP expressing cells
than the respective RFP expressing cells. After 2 days in culture XIAP stable cell densities
reached 5.05x10⁴ cells/well which was 1.56-fold higher than the RFP stable control average
density of 3.3x10⁴ cells/well.
More strikingly, on day 9, XIAP expressing cell numbers reached 1.98x10⁵ cells/well
compared to only 7.33x10⁴ cells/well for the RFP expressing cells, making the differential
between cell numbers 2.7-fold higher in the stable XIAP samples.

277
Furthermore, viability was also shown to be significantly higher overall in XIAP stable
cells, for example; viability for XIAP 1.14 cells was comparatively higher ~51% than the
RFP 1.14 cells which dropped to ~25% on day 9. Taken together, once again this
highlighted that the stable overexpression of XIAP increased growth and reduced death
phenotypes, this time in a variation of another CHO cell line.
In parallel, we took supernatant aliquots from all assayed cell samples at each timepoint in
order to examine the IgG productivity using an ELISA assay (Figure 4.2.7.3.2).
Figure 4.2.7.3.2: ELISA assay to test IgG concentration of stable CHO 1.14 cells
transfected with XIAP and RFP-Neo vectors grown in 2mL suspension tubes over a 9 day
timecourse. Error bars represent standard deviation between triplicate biological samples.
Fold change between cells represented by [x]. * represents statistical significance p-value
<0.05, ** p-value<0.01, *** p-value<0.001 determined by a 2 tailed students T-Test
between both sets of triplicate samples.

278
It was found that at each timepoint, IgG concentration was higher in the XIAP stable cell
line in comparison to the RFP control, with the fold change between RFP and XIAP clone
12 reaching a maximum of 2.98-fold on day 6. On day 9, the IgG concentration in the
XIAP expressing 1.14 samples had reached ~370 ng/mL compared to ~162 ng/mL in the
RFP expressing control samples (Figure 4.2.7.3.2).
This increase in IgG could be attributed to more cells being present in the XIAP samples,
whereby it out-performed the RFP control, owing to the increased growth and survival
phenotypes shown previously.
Therefore, we wanted to examine the average specific productivity (Qp) for each sample.
The specific productivity was calculated and revealed that on days 2, 4 and 6, the stable
XIAP 1.14 cells had a significantly higher Qp than the stable RFP cells (Table 4.2.7.3).
However, the day 9 values were not statistically significantly different between RFP and
XIAP cell lines.
Table 4.2.7.3: Specific IgG per cell productivity (pg/cell/day) of RFP stable 1.14 CHO
cells compared to XIAP stable 1.14 CHO cells over 9 days in culture. Specific productivity
(Qp) was calculated as the IgG titre divided by the accumulated integral viable cell density
(AIVCD). * represents statistical a significance p-value of <0.05, ** p-value<0.01,
determined by a 3 tailed students T-Test between both sets of triplicate samples.
In conclusion, these productivity results, further support findings that XIAP overexpression
in two separate cell lines can be beneficial in increasing IgG productivity, with a more
modest impact on SEAP and EPO productivity.
Specific (Qp) IgGRFP Qp ± SD XIAP Qp ± SD
Day 2 0.175 0.009 0.238* 0.024
Day 4 0.201 0.010 0.267* 0.025
Day 6 0.167 0.007 0.276** 0.022
Day 9 0.155 0.009 0.174 0.012

279
4.3: Identification and Validation of miRNAs using a novel Capture technique
4.3.1: XIAP is a direct and functional target of miRNAs
As mentioned in sections 4.1.2 and 4.1.3, we referred to previous work in Glioma which
had identified an anti-correlation between XIAP and miR-23b expression in SNB-19 cells.
In this section we aim to use a novel method to identify other miRNAs that target XIAP.
Having shown XIAP to be an attractive gene target for engineering in CHO cells, we
wanted to establish which miRNAs regulate its expression.
Since miRNAs regulate gene expression usually via controlled targeting of a mRNA, a
rational step was to identify miRNAs involved in XIAP expression with a view to using
them as a means to manipulate XIAP expression in CHO cells in a bioreactor setting for
example. Furthermore, this study provided an opportunity to perform a direct comparison
between human (SNB-19) and CHO (CHO-K1) XIAP transcripts in terms of the milieu of
miRNAs that bind to each orthologue.
Upon bioinformatic analysis it was shown that the human XIAP 3’UTR was much longer
(2113bp) in sequence than its CHO orthologue (Figure 4.1.3.3). From the outset, this would
imply that many more miRNAs have the potential to interact and bind with human XIAP.
Investigating the difference between a longer XIAP sequence and a shorter one in two
different organisms to see what miRNAs are common or unique would be interesting.
Through in silico analysis, the XIAP sequence was screened using prediction tools;
TargetScan™ (www. Targetscan.org) miRanda® (www.microRNA.org) and mirBase®
(www.mirbase.org) - together these databases predicted many miRNAs including three
putative binding sites for miR-23b (Figure 4.3.1.1).
In a parallel study in human Glioblastoma cell lines, we used standard miRNA
methodologies to determine whether XIAP mRNA was a molecular target of miR-23b. By
using an miR-23b pre-miR mimic to increase the abundance of miRNA-23b in SNB-19
GBM cells, we wanted to examine the effect on XIAP expression. This was achieved by
analyising GFP-reporter gene expression combined with the presence of the XIAP 3’UTR.

280
Figure 4.3.1.1: (A) The three predicted binding sites of miR-23b within the 6791bp XIAP
3’UTR sequence. Shown are the base pair positions of the 3 predicted binding sites +999,
+3102 and +4634 from the start (+1) of the XIAP 3’UTR after the TAA stop codon of the
XIAP gene. (B) The miR-23b mimics mature sequence with nomenclature and order
number.
We also investigated the effect overexpression of miR-23b had on the mRNA (qPCR) and
protein level (Western blot) of XIAP after transfection into SNB-19 cells (Figure 4.3.1.2).
XIAP expression was suppressed following transient transfection of SNB-19 cells with
miR-23b mimics. The cellular levels of a genuine biological target of a miRNA would be
expected to anti-correlate with the levels of the miRNA in question. The levels of the XIAP
mRNA post-transient transfection with miR-23b were found to be significantly repressed
(~65 %) in comparison to the control cells and premiR-scramble negative (PMN) (Figure
4.3.1.2 A).
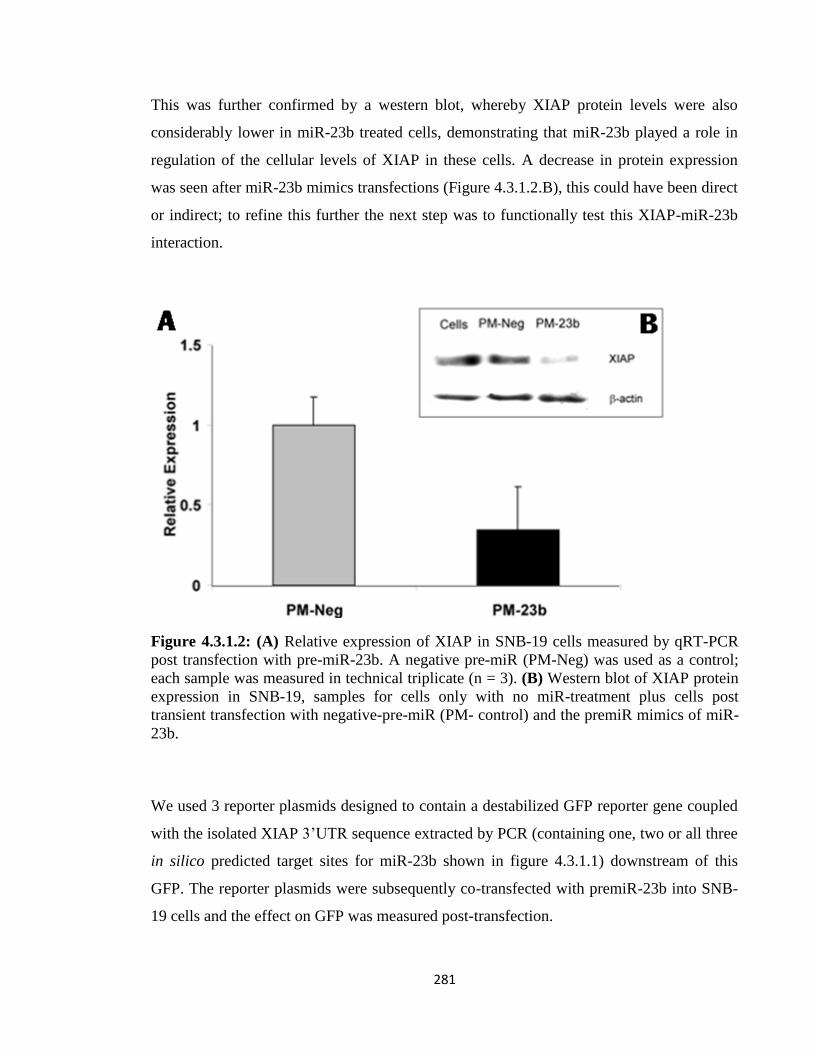
281
This was further confirmed by a western blot, whereby XIAP protein levels were also
considerably lower in miR-23b treated cells, demonstrating that miR-23b played a role in
regulation of the cellular levels of XIAP in these cells. A decrease in protein expression
was seen after miR-23b mimics transfections (Figure 4.3.1.2.B), this could have been direct
or indirect; to refine this further the next step was to functionally test this XIAP-miR-23b
interaction.
Figure 4.3.1.2: (A) Relative expression of XIAP in SNB-19 cells measured by qRT-PCR
post transfection with pre-miR-23b. A negative pre-miR (PM-Neg) was used as a control;
each sample was measured in technical triplicate (n = 3). (B) Western blot of XIAP protein
expression in SNB-19, samples for cells only with no miR-treatment plus cells post
transient transfection with negative-pre-miR (PM- control) and the premiR mimics of miR-
23b.
We used 3 reporter plasmids designed to contain a destabilized GFP reporter gene coupled
with the isolated XIAP 3’UTR sequence extracted by PCR (containing one, two or all three
in silico predicted target sites for miR-23b shown in figure 4.3.1.1) downstream of this
GFP. The reporter plasmids were subsequently co-transfected with premiR-23b into SNB-
19 cells and the effect on GFP was measured post-transfection.

282
Figure 4.3.1.3: XIAP 3’UTR map and results of co-transfection of the SNB-19 cell line.
Measurements were taken 24 hour post-transfection for Guava™ flow cytometry analysis
using the ExpressPlus® software. Plasmids containing a GFP reporter plus one, two or
three XIAP 3’UTR binding sites for miR-23b along with a plasmid with no UTR sequence
as a control. 3µl Lipofectamine 2000® used with 100 nM concentrations of pre-miR-23b
and a pre-miR-Negative (PMN). ** represents a statistical significance p-value of <0.01,
and was determined by a 2 tailed students T-Test between both sets of triplicate samples.(n
= 3).
Only the longest XIAP 3’UTR sequence containing all 3 predicted binding sites (XIAP3)
showed a significantly decreased GFP signal of 36.1 % (Figure 4.3.1.3). This would
suggest that the 3rd
(most 3’) site is the only biologically active miR-23b binding site in the
transcript. Or, that the full 3’UTR must be present, for structural reasons perhaps, for miR-
23b to mediate its effect.

283
4.3.2: MiR-Capture as a tool to identify mRNA:miRNA interactions
As mentioned in section 4.3.1, we investigated the miR-23b role in targeting human XIAP
in SNB-19 GBM cells using a more conventional approach. This led us to ask whether we
could identify miRNAs that regulate XIAP in CHO cells and indeed if they are any
different than the miRNAs identified in human.
One of the challenges with identifying miRNAs that bind a particular gene is that each
miRNA is believed to regulate multiple transcripts and many transcripts are thought to be
regulated by multiple miRNAs (Hafner et al. 2012)(Treiber, Treiber and Meister 2012). .
This is due to imperfect base pairing as miRNAs bind to their target mRNAs by partial
complementarity over a short sequence of usually 2-7 bases termed the ‘seed region’,
however, these seed matches are not always sufficient for repression, indicating that other
determinants may be needed to help specify targeting of miRNA secondary to this seed
pairing. Grimson et al presented a model which can extend beyond this limited seed pairing
prediction. Their model predicts site efficacy without recourse to evolutionary
conservation, and it also identifies effective non-conserved sites and siRNA off-targets
(Grimson et al. 2007).
Furthermore, many computational programs exist to predict miRNA targets, and though
considerable efforts have been made by research groups to recognise miRNAs associated
with a certain binding site on a 3’UTR of a target gene, this can be difficult and computer-
based in silico prediction can only go so far. Using TargetScan™, miRANDA™ and other
such prediction tools can lead to high false positive rates due to the short ‘seed’ region
sequence and temporal/spatial differences of miRNA:mRNA interactions (Sethupathy et
al. 2006) (Megraw and Hatzigeorgiou 2006).
Here we have used a recent novel experimental technique first described in (Orom and
Lund 2010) (Hassan et al. 2013), to search for miRNAs targeting a given mRNA based on a
capture affinity assay. The assay utilises a biotinylated DNA anti-sense oligonucleotide,
which is designed to bind to an exposed loop section within the secondary structure of an
mRNA transcript. Few methods can comprehensively identify miRNAs that target a single
mRNA, see table 1.13.1 for a list of various competitive methods.

284
We proposed to use this method to ‘pulldown’ miRNAs which bind to CHO and human
XIAP mRNAs thus allowing a bone fide validation of miRNA:mRNA interactions. Another
advantage to this method compared with those seen in table 1.13.1, is that it has been
shown that miRNAs can unexpectedly target the mRNA coding region and even the 5’UTR
in some cases (Nonne et al. 2010) (Hsu and Tsai 2011).
As a result, some methods used can miss important interactions based on 3’UTR focused
localisation only, whereas this approach captures all miRNAs bound to the full length
mRNA transcript.
The success of the capture can be dependent on many variables, most importantly the
capture oligonucleotide design. A 5’-Biotin modification incorporates a biotin moiety at the
5' terminus of the oligonucleotide (Figure 4.3.2.1). Biotin binds to avidin or streptavidin
conjugates (beads) which are used as a ‘hook’ to pulldown miRNA:mRNA interaction
molecules.
Figure 4.3.2.1: 5’ Biotin moiety modification to the capture oligo in order to facilitate
pulldown using streptavidin affinity beads.
Using Basic Local Alignment Search Tool (BLAST) to check if the oligo only binds to the
chosen target mRNA and that it doesn’t bind anywhere else within the genome is a crucial
step. However one drawback can be that, the in vivo environment can often vary greatly
compared to what can be discerned from in silico prediction.
As this technique was never performed in CHO cell lines, alterations to the method were
used to optimise the experiment which will be discussed.

285
In summary, by identifying miRNAs that bind to XIAP in CHO, it may provide a route to
regulate CHO XIAP expression (ie: by targeting CHO-specific miRNAs). It would also
provide an opportunity to compare in vivo miRNA-XIAP interactions to those predicted by
in silico approaches such as miR-Walk™ (http://mirwalk.uni-hd.de/). Finally, by
performing the same capture method in human and CHO cells in parallel, we aimed to
identify species/cell line specific differences in the milieu of miRNAs binding XIAP.
4.3.3: Designing the capture oligo-hook for human and CHO XIAP mRNAs
In order to study miRNA interaction with XIAP, the affinity capture technique was
designed to capture or hook the XIAP mRNA complete with bound miRNAs in a way
amenable to downstream rigor i.e: streptavidin bead capture consisting of extensive
washing, eluting and extraction. Two steps are necessary for this, secondary structure
modelling to design a capture ‘hook’ oligo and formaldehyde treatment to cross-link the
miR-Ago-RISC complexes to their mRNA targets.
The complex rules for multi-branch loops were predicted using the M-fold server which
organises the structures and orders them by their initial free energies (ΔG) (Mathews et al.
1999). Using M-fold, the first step was to determine the most thermodynamically stringent
single-stranded regions (ss) within the total XIAP mRNA. The oligos were designed to
target single-stranded regions in the XIAP secondary structure, for CHO (CHO-K1 cell
line) (Figure 4.3.3.1) and human (SNB-19 cell line) (Figure 4.3.3.2).
Due to the XIAP 3’UTR being a longer sequence in human than its CHO counterpart,
making the overall mRNA target sequence more difficult to pulldown, two capture oligos
were designed (one in the CDS and one in the 3’UTR) to ensure such a long transcript was
pulled down.
Initially, a ‘naked’ unfixed capture was performed with all the capture oligos excluding the
formaldehyde step, to bind the mRNA only before completing the full capture protocol (see
section 2.19). This was to test and optimise the oligos for binding specificity to the mRNA
target without undertaking the entire protocol.

286
Figure 4.3.3.1: (A) M-fold snapshot of the predicted secondary structure of the CHO XIAP mRNA transcript. (B) An exposed single-
stranded (ss) region located between bases 116-140. (C) Oligo nomenclature and details including the capture sequence location.
(N.B: T = U). The blue dots indicate the hydrogen bonding between the adjacent bases.

287
Figure 4.3.2.2: (A) M-fold snapshot of the predicted secondary structure of the human (SNB-19) XIAP mRNA transcript. (B) An
exposed single-stranded (ss) region located between bases 116-140. (C) Oligo nomenclature and details including the capture
sequence location. (N.B: T = U). The blue/red dots indicate the strength of the hydrogen bonding between the adjacent bases. Blue
being less tightly bound.

288
Analysis with the Basic Local Alignment Search Tool (BLAST) showed the oligo
sequences to have 100% homology and to be specific to XIAP transcripts.
Figure 4.3.3.2 (C), illustrates human oligos 3 and 4 nomenclature, make note of 5 ds bases
and 3 ds bases respectively following the oligos name and bp. This indicated that each oligo
overlaps with a region that is single stranded with the exception of 5 and 3 bases which are
double stranded at their respective loci. The colour of the dots indicates the type of double
stranded bond: red G-C (strong), blue A-U (weaker), green G-U (very weak).
4.3.4: Validation of XIAP mRNA:miRNA specific isolation
To validate the oligos designed for ‘capture’, qRT-PCR was performed with primers
specific to XIAP, GAPDH, and RPLOP genes to measure levels of mRNA post-capture. If
the oligo design was competent then we expected to see an enrichment of XIAP mRNA
after bead affinity purification compared to total RNA cell lysates for both human and
CHO cell lines.
An initial ‘unfixed’ capture was carried out minus formaldehyde step in order to optimise
the efficiency of the capture oligos at binding and ‘pulling down’ the XIAP target mRNA
based on mRNA enrichment compared to total RNA isolated in parallel (Figure 4.3.4.1).
The levels of XIAP mRNA in the ‘captured’ sample were normalised against GAPDH
mRNA levels in both captured and total RNA samples.
Total RNA samples were exposed to the beads only (without capture oligo) to identify
background noise caused by highly abundant mRNAs that might bind non-specifically to
the streptavidin-coated beads.

289
Figure 4.3.4.1: Validation of XIAP mRNA specific isolation technique. qRT-PCR was
used to measure XIAP target enrichment in the ‘unfixed’ capture on both SNB-19 and CHO
cell lysates post-affinity capture using 3 different oligos for each cell line (the most
efficient oligo shown for each). Relative mRNA enrichment to total lysate was calculated
using the 2- ∆∆Ct
method and normalised using the abundant house-keeping gene GAPDH
(set @ 1).
Enrichment of XIAP mRNA was calculated to be 160-fold for SNB-19 and 141-fold for
CHO samples post-capture compared to XIAP mRNAs in the total lysates. Additionally,
dissociation curve analysis was performed to ensure single qPCR XIAP and GAPDH
amplicons were detected (see appendices 6.2.3.3.1).

290
In addition to incubating cell lysates with the capture oligos, we extracted cell lysates in
parallel using a non-specific oligonucleotide (NSO) as a negative control (to control for
non-specific binding of the oligos) and a total cell lysate (without a capture oligo) to be
tested alongside the two XIAP targeting oligos. The non-specific mismatched sequence
controls were designed not to bind or be specific for any mRNA within either genome
(Human or CHO), based on a BLAST alignment and subsequently qPCR validation (Figure
4.3.4.2).
Once satisfied with the capture technique and efficiency of the oligos, cell lysates
underwent a ‘full’ capture protocol, this included formaldehyde crosslinking and proteinase
K treatment steps. Formaldehyde causes covalent DNA-protein and protein-protein
crosslinks that stabilise complexes during stringent downstream washing steps while it can
be easily reversed at >70oC and has been widely used in a range of molecular biology
procedures such as ChIP (Sutherland, Toews and Kast 2008). Proteinase K was used to
clean up the final captured sample by digesting and denaturing protein bound complexes
including RBPs and DNase remaining post-elution and to release the mRNAs and the
miRNAs from the beads.
Post-capture there was substantial enrichment of the XIAP mRNA (188 and 96-fold) for
SNB-19 human and CHO cell lines respectively. The mismatch/NSO oligo capture lysates
had less XIAP enrichment at 101-fold for SNB-19 and 50-fold for CHO when compared to
total RNA lysate for each cell line (Figure 4.3.4.2). The NSO enrichment values obtained
are consistent with other published studies (Hassan et al, 2013) and it can be expected that
an oligo with only a 3-base mismatch would yield relativily higher enrichment background
than a totally non-specific oligo based on sequence complimentarity. However, as this was
a control oligo which consistently resulted in less enrichment than the true XIAP capture
oligo, we belived this was a suitably stringent control to ensure that XIAP mRNA:miRNA
specific isolation was occurring.

291
Figure 4.3.4.2: ‘Full’ capture run using QRT-PCR validation to measure XIAP mRNA
enrichment fold-change from both SNB-19 and CHO cell lines post affinity bead capture
with additional steps; formaldehyde crosslinking and proteinase K. A non-specific capture
oligo experimental control (NSO) was also included. Relative mRNA enrichment was
calculated using the 2- ∆∆Ct
method using the house-keeping gene RPLOP to normalise (set
@ 1). (n = 3).
Figure 4.3.4.2 illustrates the results for the complete pulldown of XIAP mRNA using two
capture oligos ‘hooks’, one specific for XIAP and one for a non-specific negative control.
The human SNB-19 capture results showed more XIAP mRNA enrichment (188.7-fold)
compared to the CHO capture (96.1-fold) when normalised relative to total lysate sample.
Enrichment comparing the non-specific oligo (NSO) and the capture oligo was higher in
the SNB-19 human capture overall.

292
4.3.5: TLDA analysis – miRNA expression profiling on captured eluate
The next step was to use the captured RNA samples that were isolated from the pull-down
to test the samples for presence of miRNAs bound and subsequently eluted from the beads.
These miRNAs were detected by qPCR using Taqman™ low density arrays (TLDA).
By running the capture samples on the TLDA cards, we wanted to achieve two things; to
examine if the pulled down mRNA contained bound miRNAs and to quantify and compare
the expression profiles for any miRNAs that were present in these captured samples
between human and CHO.
In the pre-processing of the data, one crucial analysis step was normalisation, in order to
reduce measurement errors and technical variability among arrays that might have arisen
during the execution of the experiments. Furthermore, a cycle threshold below 40 was
considered to indicate a miRNA being expressed, while this cut-off would usually be
considered high; it was set to 40 owing to the minute amounts of RNA expected in the
captured eluate.
Prior to miRNA detection, we performed a pre-amplification step on the pulled down
samples. As it was expected that the RNA would be minute in amount, this step was to
boost the starting amount of cDNA before conducting TLDA profiling. However, after
comparing capture samples that were pre-amplified (preamp +) and non-amplified (preamp
-) in parallel using the SNB-19 full capture sample, it was observed that captured samples
with no preamp treatment subsequently yielded better detection results than capture
samples with preamp. This was based on lower endogenous U6 miRNA control Ct values in
the preamp (-) sample (Cts of ~24 compared to Cts of ~33 in preamp (+)).
In addition, more miRNAs were detected overall in the preamp (-) sample with 15 miRNAs
being detected compared to only 3 miRNAs detected in the preamp (+) sample, and these
were the 3 endogenous miRNA controls (two U6 and one RNU44) (Figure 4.3.5.1).

293
Figure 4.3.5.1: TLDA-qPCR output for 384 (top left grid) miRNA probes. The SDS output file illustrates the comparison between pre-
amplification (PreAmp +) and no pre-amplification (PreAmp -) steps. By not performing the pre-amplification step, many more miRNAs
were detected below the 40 cycle threshold cutoff. In the PreAmp – run, only 3 endogenous control miRNAs (two U6 and one RNU44) were
detected in the SNB-19 full capture sample when loaded into a human-specific TLDA A card. Flat line amplification curves denote
undetected miRNA probes.
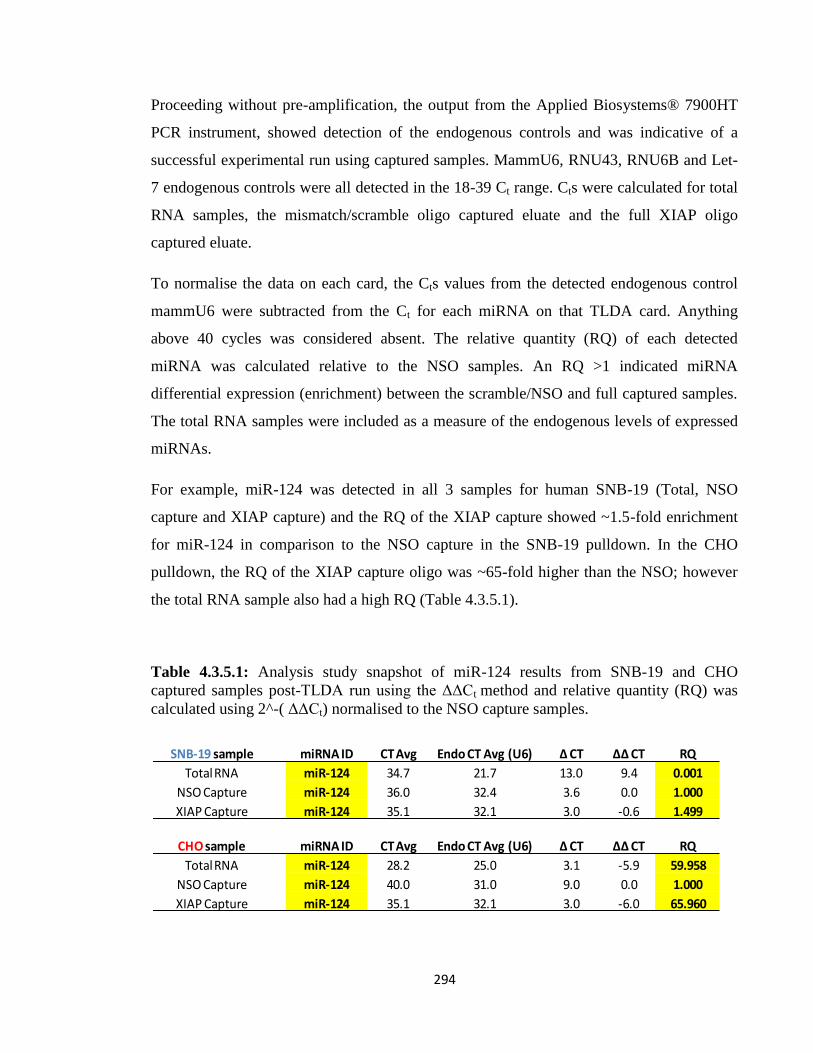
294
Proceeding without pre-amplification, the output from the Applied Biosystems® 7900HT
PCR instrument, showed detection of the endogenous controls and was indicative of a
successful experimental run using captured samples. MammU6, RNU43, RNU6B and Let-
7 endogenous controls were all detected in the 18-39 Ct range. Cts were calculated for total
RNA samples, the mismatch/scramble oligo captured eluate and the full XIAP oligo
captured eluate.
To normalise the data on each card, the Cts values from the detected endogenous control
mammU6 were subtracted from the Ct for each miRNA on that TLDA card. Anything
above 40 cycles was considered absent. The relative quantity (RQ) of each detected
miRNA was calculated relative to the NSO samples. An RQ >1 indicated miRNA
differential expression (enrichment) between the scramble/NSO and full captured samples.
The total RNA samples were included as a measure of the endogenous levels of expressed
miRNAs.
For example, miR-124 was detected in all 3 samples for human SNB-19 (Total, NSO
capture and XIAP capture) and the RQ of the XIAP capture showed ~1.5-fold enrichment
for miR-124 in comparison to the NSO capture in the SNB-19 pulldown. In the CHO
pulldown, the RQ of the XIAP capture oligo was ~65-fold higher than the NSO; however
the total RNA sample also had a high RQ (Table 4.3.5.1).
Table 4.3.5.1: Analysis study snapshot of miR-124 results from SNB-19 and CHO
captured samples post-TLDA run using the ΔΔCt method and relative quantity (RQ) was
calculated using 2^-( ΔΔCt) normalised to the NSO capture samples.
SNB-19 sample miRNA ID CT Avg Endo CT Avg (U6) Δ CT ΔΔ CT RQ
Total RNA miR-124 34.7 21.7 13.0 9.4 0.001
NSO Capture miR-124 36.0 32.4 3.6 0.0 1.000
XIAP Capture miR-124 35.1 32.1 3.0 -0.6 1.499
CHO sample miRNA ID CT Avg Endo CT Avg (U6) Δ CT ΔΔ CT RQ
Total RNA miR-124 28.2 25.0 3.1 -5.9 59.958
NSO Capture miR-124 40.0 31.0 9.0 0.0 1.000
XIAP Capture miR-124 35.1 32.1 3.0 -6.0 65.960

295
In cases of a miRNA not being detected in the total sample but detected in capture samples,
this was maybe due to strong enrichment of that miRNA in the capture step, despite being
expressed at low (undetectable) levels in the cell. We will discuss this in more detail in
later sections.
The low numbers of miRNAs detected led us to believe that the formaldehyde and perhaps
the proteinase K steps may have damaged/denatured some of the miRNAs during the
pulldown technique. This was based on an independent TLDA run conducted whereby we
used the SNB-19 total RNA captured samples, one unfixed and one fixed, and compared
both to see the effect of formaldehyde treatment.
It was found that in the ‘unfixed’ capture there was 102 miRNAs detected compared to 60
miRNAs detected in the ‘fixed/full’ total RNA SNB-19 human captured samples from
TLDA analysis (Figure 4.3.5.2).
TLDA analysis revealed that, in total, 40 miRNAs across both cell lines were detected and
4 miRNAs were common to both cell lines (miR-124, miR-526b*, miR-760 and miR-877)
for a detailed list of these miRNAs and nomenclature analysis see table 4.3.5.2.

296
Figure 4.3.5.2: TLDA-qPCR output for 384 (top left grid) miRNA probes. An independent test illustrating the difference between an
unfixed capture compared to formaldehyde fixed capture of SNB-19 human cells. More miRNAs were detected in the ‘unfixed’ capture
sample as illustrated by more amplification curves being present. A 384-well human-specific TLDA A card was used. Flat line amplification
curves denote undetected miRNAs.

297
Table 4.3.5.2: Profiling of miRNAs using TaqMan Low-Density Array™ based on an Applied Biosystems® 7900HT micro fluidic cards
consisting of two cards with 667 individual miRNA probes to test simultaneously over two cards (A and B). The sequence detection system
(SDS v2.2.2) software was used to operate the 7900HT. Additionally, results from mirWalk® (http://mirwalk.uni-hd.de/) showed if the
detected miRNA targets were predicted to bind XIAP full length mRNA in silico. (Y = predicted, N = not predicted). * denotes passenger
strand of the miRNA.
Predicted Predicted Predicted Predicted Predicted
in silico A cards B Cards in silico in silico A cards B Cards in silico in silico
Y miR-124 miR-135a* N Y miR-124 miR-125b-2* Y miR-124 Y
Y miR-197 miR-135b* Y Y miR-125b miR-30a* Y miR-526b* Y
Y miR-204 miR-149* Y Y miR-17 miR-30e Y miR-877 Y
Y miR-222 miR-188-5p Y Y miR-19b miR-526b* Y miR-760 Y
Y miR-323-3p miR-516a-3p Y N miR-20a miR-572 N
Y miR-494 miR-520c-3p Y Y miR-30b miR-610 Y
miR-526b* Y miR-760 Y
miR-567 Y miR-877 Y
miR-623 Y
miR-625* Y
miR-626 Y
miR-629* Y
miR-630 Y
miR-632 Y
miR-760 Y
miR-768-3p N
miR-801 N
miR-877 Y
miR-923 N
miR-99b* Y
Human SNB-19 CHO-K1 Common to both

298
It was also evident that the human SNB-19 miR-Capture resulted in more bound miRNAs
than CHO. This was somewhat expected owing to the previous mapping of the XIAP
transcript which showed that the human XIAP transcript was 2113bp longer than CHO,
meaning it could potentially contain many more miRNA binding domains. There were 26
miRNAs detected in the human capture, whereas there were 14 miRNAs detected in the
CHO capture (Table 4.3.5.2).
There were 10 miRNA passenger (star) strands detected on the B cards, 7 were detected in
SNB-19 capture and 3 in the CHO capture with miR-526* being common to both cell lines.
Interestingly, in the CHO capture, the miR-125b guide strand was detected on the A card,
while the passenger strand miR-125b* was also detected on the B card (Table 4.3.5.2).
Next we wanted to identify miRNAs bound to XIAP that existed in clusters or families. We
hypothesised that miRNAs identified by miR-Capture, that exist in clusters (same genomic
location) or families (same seed sequence) may be indicative of co-functional relationships
via co-regulating or co-ordinately regulating cellular XIAP.
From the CHO capture, miR-30b was detected on the A card while miR-30a* and miR-30e,
which are all from the same family, were detected on the B card (Figure 4.3.5.2). miR-30
members are generally highly expressed in human cardiovascular and muscle cells (Chen et
al. 2014). Noticeably, no miR-30 family members were detected in the human SNB-19
capture, while there has been only one CHO-specific publication related to miR-30
expression. Fischer et al suggested that the entire miR-30 family substantially improves
bioprocess performance of CHO cells. It was shown that stable miR-30 over-expressing
cells outperformed parental cells by increasing SEAP productivity or maximum cell density
of approximately twofold (Fischer et al. 2014).
Other notable miRNA families identified were; the miR-154 family on chromosome 14
containing miR-323-3p and miR-494 were detected from the SNB-19 capture. In addition,
the miR-10 family containing miR-125b was detected from the CHO capture. Finally, the
miR-515 family on chromosome 19 which contains miR-516a-3p, miR-520c and miR-
526b* was identified from the SNB-19 capture.

299
The miR-17-92 cluster members (miR-17, miR-19b and miR-20a) were all detected in the
CHO capture. MiR-222 was detected in the SNB-19 capture and is often co-expressed with
miR-221; however miR-221 was not present in SNB-19 or indeed CHO pulldowns (Table
4.3.5.2).
None of the 4 miRNAs detected in both cell lines [miR-124, miR-526*, miR-877, miR-
760] have previously been associated with XIAP or CHO in the literature but all are
predicted to bind to XIAP in silico. In some cases a miRNA may not be predicted in silico
but was still detected in the capture. For example, while the TLDA analysis showed that
miR-20a in the CHO miR-Capture samples was pulled down, it was not predicted in silico
(Table 4.3.5.2). Furthermore, out of the 40 identified miRNAs, only 6 were not predicted in
silico by using the MirWalk™ database (miR-135, miR-768-3p, miR-801, miR-923, miR-
572 and miR-20a). There was 209 miRNAs predicted to bind to XIAP across 5’UTR, CDS
and 3’UTR sequence in total (Full table in supplementary data).
Similarly, Hassan et al reported that miR-19b was captured in human cell lines but was not
predicted to bind to the mRNA target they were testing, alpha-1 antitrypsin (AAT).
Nevertheless, from our miR-Capture, miR-19b showed functional effects irrespective of
prediction (Figure 4.3.6.1). A potential recommendation we have is that extra biochemical
assays should be performed to independently confirm such anomalies (Hassan et al. 2013).
In summary, we have presented a readily accessible method for identifying miRNAs that
target a specific mRNA transcript. This method was obtained by combining methodology
from the publication by Hassan et al, and additional steps divised in association with Dr.
Sebastian Vecken (RCSI) . An advantage includes the capture of a full length mRNA and
not just the 3’UTR region. It is also a useful tool to compare mRNA:miRNA interactions
across cell lines via parallel miR-Captures. For example; as we have shown, only 4
miRNAs were common to XIAP transcripts between hamster and CHO cell lines.
Additionally, as it is a relatively novel technique, there is scope for improvement; an
example would be to optimise the formaldehyde crosslinking step to try to isolate bound
miRNAs more efficiently.

300
4.3.6: Functional effects of XIAP mRNA-specific miRNAs
To further validate target miRNA enrichment, Taqman™ single-plex assays were
performed by reverse transcribing the same captured lysate and normalising to the
endogenous U6 highly expressed control miRNA.
For single-plex Taqman™ PCR, miR-124 was chosen as it is a common XIAP target from
TLDA detection in both cell types (Table 4.3.5.2). Two more miRNAs were chosen to
validate, miR-19b (which is part of the miR17-92 cluster mentioned previously) and miR-
222 were selected for validation in CHO and SNB-19 respectively.
Interestingly, as mentioned miR-222 is usually co-expressed with miR-221, however miR-
221 wasn’t detected from the TLDA profiling. By investigating or targeting miR-222, it
could lead to a better understanding between both cluster members and compare it to XIAP
regulation in GBM and CHO cells. Recently, it has been shown that targeting miR-221-222
could serve as potential therapeutic targets for increasing radio-sensitivity of glioblastoma
cells due to modulating the DNA damage response (DDR) (Li et al. 2014a).
To investigate individual miRNA levels in capture eluate from each cell line, first RNA
from the same pulldown capture samples were reverse transcribed with specific RT primers
for the chosen miRNAs plus the specific RT primers for the U6 endogenous house-keeping
control for normalisation. Next Taqman® PCR was performed on the Applied BioSystems
7900HT to measure the relative quantity (RQ) of these miRNAs using more specific single-
plex Taqman™ assays (Figure 4.3.6.1).
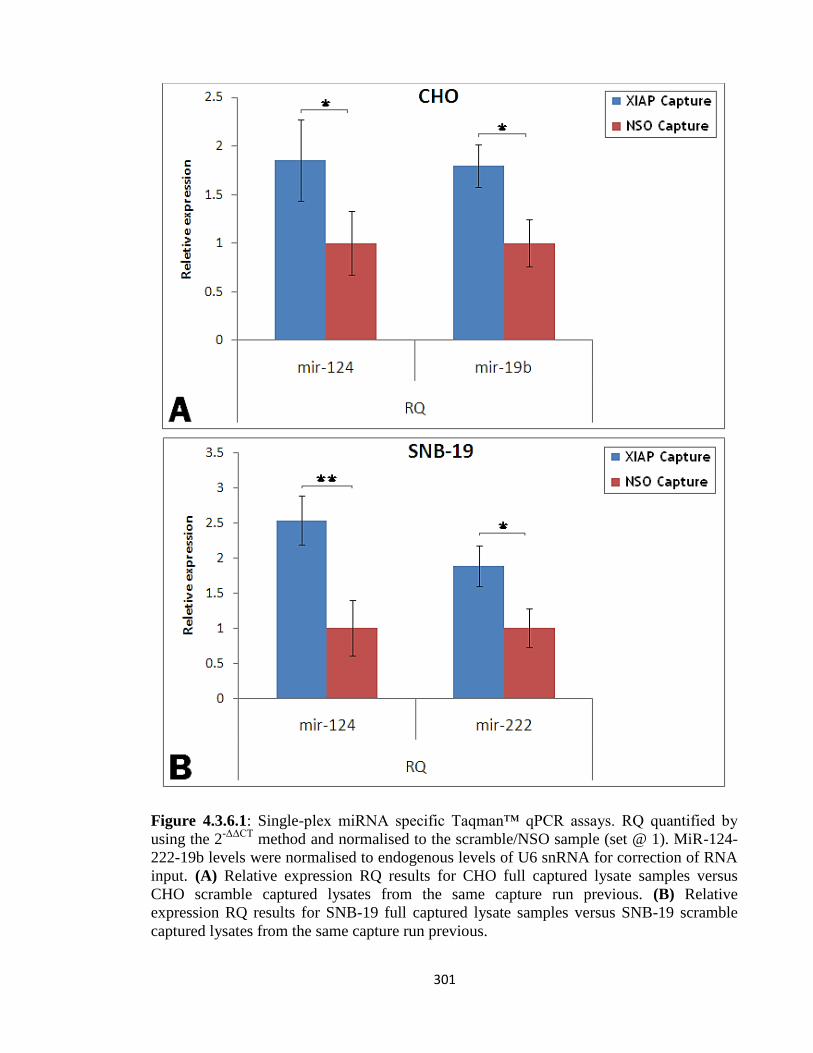
301
Figure 4.3.6.1: Single-plex miRNA specific Taqman™ qPCR assays. RQ quantified by
using the 2-ΔΔCT
method and normalised to the scramble/NSO sample (set @ 1). MiR-124-
222-19b levels were normalised to endogenous levels of U6 snRNA for correction of RNA
input. (A) Relative expression RQ results for CHO full captured lysate samples versus
CHO scramble captured lysates from the same capture run previous. (B) Relative
expression RQ results for SNB-19 full captured lysate samples versus SNB-19 scramble
captured lysates from the same capture run previous.

300
The RQ of all four chosen miRNAs was increased within the XIAP oligo samples
compared to the non-specific oligo samples (Figure 4.3.6.1), thereby validating the TLDA
data, via single-plex miRNA enrichment.
The next step was to determine whether these XIAP-specific miRNAs have a specific
impact on XIAP expression in both cell lines.
Pre-miR mimics were transfected in SNB-19 and CHO-K1 cells to observe if they impact
on XIAP mRNA levels via qRT-PCR (Figure 4.3.6.3) and protein level via western blotting
(Figure 4.3.6.4).
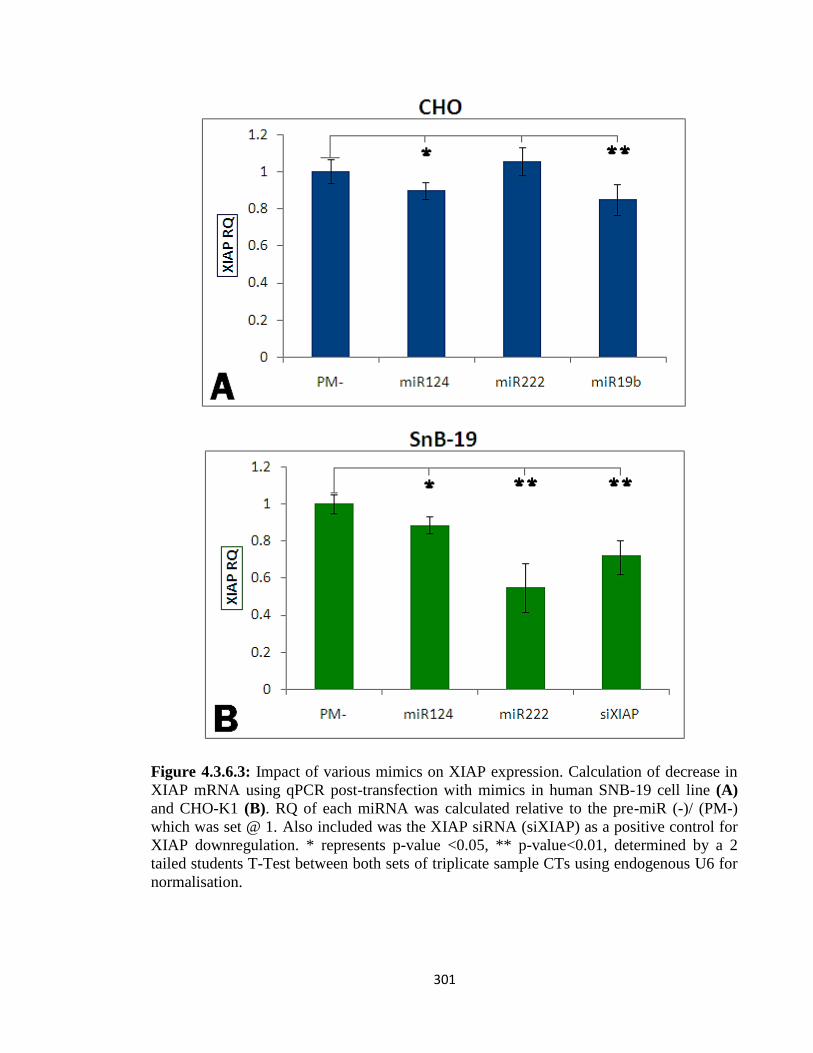
301
Figure 4.3.6.3: Impact of various mimics on XIAP expression. Calculation of decrease in
XIAP mRNA using qPCR post-transfection with mimics in human SNB-19 cell line (A)
and CHO-K1 (B). RQ of each miRNA was calculated relative to the pre-miR (-)/ (PM-)
which was set @ 1. Also included was the XIAP siRNA (siXIAP) as a positive control for
XIAP downregulation. * represents p-value <0.05, ** p-value<0.01, determined by a 2
tailed students T-Test between both sets of triplicate sample CTs using endogenous U6 for
normalisation.

302
In CHO cells, miR-222 was included as an experimental control as it should not cause a
change in XIAP expression based on it not being captured, and indeed it showed no
significant effect. The two other miRNA mimics tested (miR-124 and miR-19b) caused
decreases in XIAP mRNA levels compared to the pre-miR (PM-) control, further
suggesting that they directly interact with XIAP to down-regulate its expression (Figure
4.3.6.3 A).
In SNB-19 cells, miR-124 and miR-222 transfections both resulted in decreased XIAP
mRNA levels of 13% and 55% respectively compared to PM-. Interestingly, miR-222
treatment had the most notable effect on XIAP expression levels, compared to the PM-
treated sample (Figure 4.3.6.3 B).
In addition, the XIAP control siRNA had a modest effect on XIAP mRNA levels, resulting
in a 38% decrease compared to PM-. The siXIAP treatment showed less impact than miR-
222 which was unexpected, as a specific XIAP-siRNA would be expected to induce a more
effective knockdown effect based on previous knockdown results seen in figure 4.2.6.3.
Next we wanted to investigate the impact on the protein level and to see if they correlated
with the qPCR results. Figure 4.3.6.4, illustrates the results from the transfection of mimics
into two cell lines on their XIAP protein levels.

303
Figure 4.3.6.4: Impact of various miRNA mimics on XIAP protein expression. CHO-K1
(A) or SNB-19 (B) cells were transiently transfected with individual miRNA mimics (miR-
124, miR-222, miR-19b) or combinations (Combi) and lysates were analysed for XIAP
expression 60hrs later by western blot (~55-57 kDa). PM- is the scrambled control. The
house-keeping gene GAPDH is the loading control (~40 kDa). The siXIAP control was
included as a positive control.
Both miR-124 and miR-19b overexpression in CHO cells appeared to reduce XIAP protein
expression (Figure 4.3.6.4 A), while the combination sample showed a more modest
decrease compared to the PM- treated cells. This was interesting considering the impact
was greater individually on XIAP expression.
There was no significant decrease in XIAP expression compared to the PM- sample; in
SNB-19 cells, however there did appear to be a modest decrease in the combination
transfection (miR-124-222) sample (Figure 4.3.6.4 B). The siXIAP-treated SNB-19 cells
displayed nearly complete knockdown of XIAP expression compared to miR-222, PM- and
Cells only samples. However, this was not seen at the mRNA transcriptional level (Figure
4.3.6.3 B), and is most likely attributed to miRNAs blocking translation only.

304
4.3.6.1: XIAP 3’UTR targeting by miRNA- in silico
RNAhybrid™, an open source and flexible online prediction tool was used to identify all 4
miRNAs binding positions (pos) within the XIAP 3’UTR, loop structures and minimum
free energy (mfe). The miRNA-mRNA forms an RNA duplex, while the structure with the
lowest mfe is predicted to have the most stable structure (Figure 4.3.6.1.1).
RNAhybrid™ is available at http://bibiserv.techfak.uni-bielefeld.de/rnahybrid.
Figure 4.3.6.1.1: RNAhybrid™ result for each miRNA targeting the XIAP 3’UTR
sequence in CHO and Human. The green strand represents the miRNA and the red strand
is the mRNA. (A) miR-124 and miR-19b secondary structure duplex, minimum free energy
and nucleotide position in the CHO XIAP 3’UTR (4782bp) sequence. (B) miR-124 and
miR-222 secondary structure duplex, minimum free energy and nucleotide position in the
SNB-19-human XIAP 3’UTR (6791bp) sequence.

305
It was predicted that these miRNAs have binding sites in both human and CHO XIAP
3’UTR sequence. After RNAhybrid™ analysis of the full XIAP transcript, we identified
predicted sites for miR-124 in CHO and miR-222 in human sequences respectively.
These binding sites had much lower affinity for each miRNA based on weaker seed regions
(more Uracil present) and lower free energy calculations and perhaps may not be true
binding sites. However, other potential binding sites may exist in the XIAP CDS and
5’UTR, but for the purposes of 3’UTR targeting, this analysis was sufficient.
4.3.6.2: XIAP 3’UTR targeting by miRNA- in vivo
Next we performed another functional assay to see if there was an interaction between
these miRNAs and the XIAP 3’UTR. We used a specifically designed GFP plasmid
containing a cloned 3.7kb 3’UTR XIAP human sequence [NM_001167.2] (Figure 4.3.3.2) -
downstream of the GFP, to test if the XIAP 3’UTR was a target of these same 4 miRNAs.
We co-transfected into SNB-19 and CHO-K1 cells once again, to examine the effects of
these miRNAs on GFP-reporter expression.

306
Figure 4.3.6.1.2: Functional pre-miR XIAP 3’UTR-GFP reporter assay. The pGFP (xiap3)
denotes the GFP-reporter vector containing 3.7kb of XIAP 3’UTR sequence. PM- denotes
the pre-miR-negative mimic (50nM concentration). The Y-mean GFP figures when the
pGFP constructs are co-transfected with 50nM mimics into CHO-K1 (A) and SNB-19 cells
(B) Error bars represent standard deviation between triplicate biological samples. *
represents statistical significance p-value <0.05, ** p-value<0.01, *** p-value<0.001
determined by a 2 tailed students T-Test between both sets of triplicate samples.
307
In CHO cells, the GFP mean florescence showed a significant decrease when the XIAP
3’UTR sequence was present (Figure 4.3.6.1.1 A). The difference in GFP expression
between pGFP (with xiap3 sequence) and miR-124/miR-19b versus pGFP + miR-124/miR-
19b (with no xiap3 sequence) showed that miR-124 mimics reduced GFP expression by
38.7% while miR-19b reduced GFP expression by 33.9%. A significant decrease in GFP
expression was observed for miR-124 (37.1%) and miR-19b (9.2%).
A reduction in GFP florescence was also seen upon transfection of miRNA mimics
[miR124/222] in SNB-19 human cells (Figure 4.3.6.1.1 B). By comparing pGFP (xiap3) +
PM- to pGFP (xiap3) + miR-124/miR-222, we see that miR-124 reduced GFP expression
by 11.2% but was not statistically significant whereas miR-222 reduced GFP expression by
28.9%. Furthermore, the SNB-19 cell line was harder to transfect, hence lower GFP
expression range overall.
The pGFP (xiap3)-only transfected sample showed a reduction in GFP expression
compared to the three pGFP + (mir124/222/PM-) samples, and would perhaps indicate the
endogenous levels of miRNAs targeting the 3.7kb 3’UTR, irrespective of additional
miRNA mimics. However, the long 3.7kb 3’UTR sequence might reduce transfection
efficiency compared to the pGFP vector on its own, due to its larger size - larger constructs
often being more difficult to transfect. In addition, we cannot compare across cell types as
there is potentially different levels of endogenous miRNA present in each cell line.
In summary, here we present an alternative validated method to identify multiple miRNAs
targeting a predetermined mRNA. Our data showed 40 miRNAs in total, that may be cell
specific, plus 4 common and that co-elute with XIAP mRNA transcript in two cell types.
From this target list (Table 4.3.5.2), two miRNAs were chosen for each cell line (miR-124,
miR-19b for CHO and miR124, miR-222 for SNB-19) to test the impact of their
overexpression using premiR mimics in vivo. All four miRNAs subsequently showed a
functional impact on XIAP expression at varying degrees when measured using qRT-PCR,
single-plex Taqman assays, western blotting and GFP-reporter 3’UTR knockdown analysis.

308
Section 5.0
Project 1-
Discussion, Future Work &
Conclusions

309
5.1: Project 1 Discussion – Endogenous promoters as gene engineering tools
5.1.1: Project overview
The most frequently used promoters in expression vectors were derived from the simian
virus 40 (SV40), Rous sarcoma virus (RSV), cytomegalovirus (CMV), and mouse
mammary tumor virus (MMTV). On one hand viral promoters allow high expression rates,
but on the other hand, they can lead to instability and silencing via promoter methylation in
response to foreign sequence being continuously overexpressed (Brooks et al. 2004)
(Mariati et al. 2014).
Consequently, the aim of this study was to identify endogenous promoter that could be used
as tools to improve recombinant protein production in CHO cells. We wanted to investigate
if promoters derived from CHO cells were more beneficial than viral or other exogenous
sequences. Two possible applications of these promoters are, firstly to drive ‘product’ gene
expression in a process-dependant manner and secondly, to drive an engineering gene
designed to impact on CHO cell behaviour in a process dependent manner. The process-
dependent parameter that we focused on in this work was culture temperature.
Initial profiling undertaken in the NICB, generated an expansive CHO transcriptome
dataset, which facilitated differential gene expression analysis. This dataset was mined for
genes which changed expression in response to temperature and more specifically, genes
that increased or decreased expression at lower temperature (Table 3.1.2.1). Additionally,
we identified genes displaying constitutive expression which had the least variance across
the entire dataset (Table 3.1.2.3), however, none of these gene promoters were successful in
driving reporter gene expression effectively when tested.
It should be noted that none of the genes identified in this analysis demonstrated complete
temperature-dependant induciblity. In other words, none were completely repressed (off) at
one temperature and strongly expressed (on) at the lower or higher temperature. Therefore,
the promoters would unlikely behave like ‘classic’ inducible systems such as the TetOn/off
system. However, this doesn’t negate their potential value and utility as the field of CHO
cell engineering matures.
310
As we strive to gain greater control over the CHO ‘platform’ there is every reason to
believe that in some cases simply switching from on to off or vice versa may not be
desirable for optimal control.
By having a range of inducible tools available with different expression characteristics, we
will ensure that a suitable choice can always be made based on the gene whose expression
is being controlled, in addition, to how that control is mediated – e.g.: by changing culture
temperature, rather than adding or subtracting inducer molecules (IMs).
Fussenegger and co-workers have shown a plethora of exogenous IMs and synthetic
inducible systems to increase expression or indeed tightly control inducible expression,
examples include; gas acetaldehyde, biotin, drug-sensing hydrogels, exocytic SNAREs,
siRNA toggle switch and pTRIDENT (Fux et al. 2004)(Werner et al. 2007, Weber et al.
2009) (Ehrbar et al. 2008) (Peng, Abellan and Fussenegger 2010).
However, most of these are not industrially viable as the use of artificial/exogenous
molecules is not feasible from a regulatory point of view (Weber et al. 2009) (Wieland and
Fussenegger 2012). Therefore, more natural/endogenous inducible mechanisms are being
sought.
The mouse (Cirbp and miR-17-92) and CHO-derived promoters studied in this project
(MDM2, SSu72, miR17-92 and Cirbp) could not only drive expression of product genes to
a similar and often better level than viral ones frequently used in bioprocessing settings, but
additionally were shown to be inducible upon a temperature shift to 31oC.
This property could be advantageous in a biphasic bioprocess (Figure 1.11.1), whereby
adjusting a culture to a lower culture, we could arrest growth and simultaneously boost
expression of a particular gene by using a temperature sensitive promoter. When cells are
not growing/dividing they can concentrate cellular energy on protein synthesis (Kaufmann
et al. 1999) (Clark, Chaplin and Harcum 2004) (Yoon et al. 2004) (Kim and Lee 2007).

311
5.1.2: Promoter isolation
As a result of sparse genomic sequence available publically for Chinese hamster in the
early part of this project, we took a different approach to isolating the promoters of these
genes, than reported in studies of analogous nature; (Thaisuchat et al. 2011) (Pontiller et al.
2008) (Chen et al. 2013) (Running Deer and Allison 2004).
For example, Running-Deer and Allison used an approach whereby they screened the
flanking regions of a CHO-K1 lambda phage library after highly expressed genes were
identified. They extracted and cloned a large 12kb region (including the 5’UTR) flanking
the CHEF-1α gene to test it for promoter activity. Ideally, shorter more concise regulatory
sequences would be more attractive in transgene expression vectors; therefore, they tried to
shorten it considerably. They managed to reduce the size from 12kb to 4.1kb without loss
of expression levels; however, once they shortened the fragment to 3.3kb, this reduced
expression by half. Ultimately, 3.3kb was acknowledged as perhaps still too large to be
utilised in a biopharma vector construct (Running Deer and Allison 2004).
Another method is to use restriction enzymes fragment the genomic DNA of the chosen
cells followed by random recombination to re-ligate into reporter plasmids. These are then
screened to identify ‘active’ fragments that drive expression of a reporter gene (Pontiller et
al. 2008). A promoter trap method can also be used whereby a promoterless plasmid
containing GFP and selectable marker is transfected and integrated into cells. Drug-
resistant, GFP positive cells are isolated and the sequences upstream of the integrated
plasmid are identified by sequencing.
Although the name of the method suggests that regulation automatically assumes it is
promoter region specific, however here the isolated regulatory sequences were not
necessarily derived from gene promoter regions (Chen et al. 2013). This study showed that
some strong regulatory elements can be located at unexpected locations in the CHO
genome and this would imply more scope to find potential regulatory sequences/tools as
opposed to focusing on promoter regions only.

312
Our approach was to first identify target genes based on microarray transcriptome data. As
mentioned, we identified genes capable of increased or decreased expression at 31oC (Table
3.1.2.1). Furthermore, we identified genes capable of constitutive expression across a wide
range of parameters including culture stage, temperature and cell type (Table 3.1.2.3).
This was a similar to the approach taken by Le et al to isolate the Thioredoxin-interacting
protein (Txnip) promoter (Le et al. 2013). Then we used cross-species alignments (Figure
3.1.8.1) to identify conserved locations for primer design (Figure 3.1.8.2) to PCR amplify
and extract the promoter regions. This way we could be more certain that putative
promoters were being isolated and not just random segments of DNA which may or not be
clearly defined. Ideally ~300-5000bp upstream sequence was considered a good starting
point to test putative promoter regions.
5.1.3: Screening target genes and transcript validation
5.1.3.1: Initial promoter fragment screen
Various promoter fragments were amplified from gDNA by PCR (Table 3.1.9.3). These
were cloned into a GFP-reporter plasmid and screened (Table 3.1.11.1) for GFP expression
initially to identify suitable fragments for further study in plasmids containing other
transgenes.
There were some interesting observations from the screen. None of the promoters chosen
based on constitutive activity (UBA52, PPIA and AUP1) from either mouse or CHO, were
successful in driving detectable expression except for the miR-17-92 cluster promoter. For
example; despite PPIA topping the list of constitutively highly expressed genes in the array
analysis, reporter plasmids containing either of two putative promoter fragments 1424bp
and 750bp upstream of the PPIA ATG start site failed to drive expression of GFP.
The most obvious reason for this would be that these fragments didn’t contain the necessary
promoter elements needed for the apparent strong transcriptional activity in vivo. This is
and has been one of the greatest challenges in promoter analysis in higher eukaryotes – the
fact that very distal elements and epigenetic/chromatin context can play a major role in

313
promoter activity. Indeed, the classical promoter analysis approach is to start with a large
(2-5kb) of sequence from 5’ of the translational start site, cloned into a reporter vector and
systematically delete ‘chunks’ of sequence while monitoring the effect on reporter output
(Pontiller et al. 2010) (Thaisuchat et al. 2011). Although it would have been interesting to
study some of the non-functional sequences cloned in this project more closely, we opted to
focus on the shorter, more active sequences, keeping in mind our goal of generating
engineering tools for use in vectors to drive transgene expression.
In summary, the mouse miR-17-92 cluster fragments were more effective than the CHO
orthologues. For genes that were identified as being upregulated at 31oC (Cirbp, MDM2
and SSu72) the observed effect correlated with the expected effect from the profiling
dataset with all performing similarly. For genes that were identified as being downregulated
at 31oC, only mouse fragments of HNRPa2b1 and Nars (1326bp and 2466bp) and CHO
fragments of PPID (560bp and 1025bp) were successful in driving GFP expression and
may be candidates for future work regarding using temperature shift in the opposite
manner.
Finally, another consideration before we progressed the promoters to other reporter assays
was that we chose promoter fragments based on size and how easy the fragment could be
cloned into other vectors. All viral promoter sequences used in commercial vectors are
small concise sequences capable of driving strong expression levels and do not impinge on
transfection efficiency like larger sequences would.
5.1.3.2: RT-qPCR analysis and half-life determination
The transcript abundance for Cirbp, MDM2 and SSu72 genes was confirmed to be much
lower in the 37oC samples compared to the 31
oC cultured samples over the entire sampleset
(Figure 3.1.4.6). Unexpectedly, MDM2 transcript copy numbers were much lower overall
compared to SSu72 and Cirbp in contrast to the high fluorescence signals observed in the
initial array data. Despite this, we decided to continue with MDM2 as a candidate
promoter.

314
Transcript levels for miR-17-92 were not measured in this particular instance as small
RNAs were not present due to the extraction method used, but data from a separate study
in-house as well as published reports (Hayashita et al. 2005) (Hernandez Bort et al. 2012),
showed members of this cluster to be most abundantly expressed in various CHO cell lines.
Furthermore, we were interested to see whether a promoter sequence derived from a
miRNA cluster could be used to drive expression of a protein-encoding gene.
Of course, a strong signal on an array or high copy numbers as measured by qPCR could be
as a result of two separate phenomena, high transcriptional turnover of the mRNA
(desirable) or if the mRNA of that particular gene was just highly stable (undesirable) and
subsequently had a slower decay rate within the cells, it may give the impression of
increased expression upon temperature shift.
Stability analysis revealed that the decay rates were quite varied between all 3 genes at both
37oC and 31
oC, however, the decay rate was consistently lower (and thus mRNA half-life
was higher) at 31oC for each individual gene (Table 3.1.5.2). Similarly Cirbp and MDM2
showed a marginal decrease in decay rate and as a result a marginal increase in mRNA
half-life at 31oC with MDM2 shown to be more stable overall at both temperatures. Al-
Fageeh and Smales reported similar results for various Cirbp 5’ UTR leader sequences
from NIH-3T3 mouse cells. They showed that although Cirbp mRNA stability was
increased at 31oC, half-life of 13.9 hr at 37
oC versus 15 hr at 31
oC, it was marginal
compared to a beta-actin control which had a more substantial difference between 37oC
(10.4 hr) and 31oC (15.8 hr) (Al-Fageeh and Smales 2009).
Conversely, SSu72 was a little over twice as stable at 31oC as at 37
oC, based on a decay
rate of 2.44 hr-1
at 37oC and 5.12 hr
-1 at 31
oC. This could perhaps contribute partly to the
higher SSu72 signal the original microarray profiling, but as it is known that at lower
temperature mRNA transcripts tend to be more stable, this was not unexpected. Finally,
although we can partially attribute the increased transcript levels detected from the original
profiling to this increase in stability, it is clearly not responsible for the 6/7-fold increase
observed in the 31oC samples (Figure 3.1.4.6).

315
As a point of reference, Thaisuchat et al also conducted mRNA stability on the S100a6
gene promoter using actinomycin D treatment and a luciferase reporter. It was difficult to
compare results as they analysed mRNA stability over only 6 hours compared to 24 hours
for our analysis but nevertheless they found the transcript decayed by 33% at 37oC,
whereas in parallel the transcript only decayed by 5% in 33oC culture (Thaisuchat et al.
2011). This observation indicates that mRNA stability is enhanced by lowering culture
temperature (only after 4 hours was this apparent) which must contribute to higher mRNA
levels. It was also shown that after 4 hours there was no significant change in stability and
indeed at 37oC transcripts were more stable. Translation presumably has its own set of
limitations at lower temperature and the level with which it influences overall protein
expression in this instance remains unclear.
5.1.4: Prioritising useful promoters
Promoter fragments from Cirbp, SSu72, MDM2 and miR-17-92 cluster were prioritised as
the most suitable candidates for progression as a result of an initial GFP expression reporter
screen (Table 3.1.11.1). As mentioned, there was difficulty in cloning some of the larger
fragments so we focused on the following for the remainder of the project: 828bp CHO
Cirbp, 370bp MDM2 and 654bp SSu72. Not only did this set appear capable of high GFP
expression but smaller fragments would be more suitable in a vector designed for routine
transfection.
Cirbp was one of the most highly ranked genes on our list and although less novel than
some of the other genes, it was included as a recognised temperature sensitive positive
control with which to compare induciblity of the more novel promoters identified (Al-
Fageeh and Smales 2009) (Nishiyama et al. 1998) (Sumitomo et al. 2012). Additionally, an
889bp promoter fragment from mouse Cirbp was included in all experiments as a further
control.
Cold-inducible RNA-binding protein (Cirbp) is a cold-shock protein (CSP), and is well
characterised in human and mouse and is believed to function as a chaperone protein
(Nishiyama et al. 1997) (De Leeuw et al. 2007) (Kaneko and Kibayashi 2012). It assists in

316
assembly, transport, preventing transcription termination and folding of other
macromolecules during various critical cellular responses caused by stimuli such as;
hypoxia and hypothermia (Mihailovich et al. 2010). It has also been reported to be involved
in interleukin IL-1β regulation (Brochu et al. 2013).
Recent results by Liu et al suggest that CSPs (Cirbp and Rbm3) regulate temperature
specific circadian gene expression by controlling alternative polyadenylation (APA) and the
depletion of Cirbp or Rbm3 significantly reduced the amplitudes of core circadian genes.
Having performed PAR-CLIP analysis, they showed that the 3'UTR of a range of circadian
genes were significantly enriched for Cirbp and Rbm3 near the polyadenylation sites
(PASs) (Liu et al. 2013b).
First discovered in yeast, RNA polymerase II CTD phosphatase (SSu72) is an essential
phylogenetically conserved transcription factor phosphatase and is a component of the
cleavage/polyadenylation factor (CPF). It interacts with the general transcription initiation
factor (TFIIB) and termination complexes, promoting RNA polymerase pausing and release
(Krishnamurthy et al. 2004) (Ganem et al. 2003). Pappas and Hampsey, identified a
recessive ssu72-1 allele and showed that it was a synthetic enhancer of a TFIIB (sua7-1)
defect, resulting in a heat-sensitive (Ts(-)) phenotype and a dramatic downstream shift in
transcription start site selection (Pappas and Hampsey 2000). He et al, demonstrated that
SSu72 is required for 3' end cleavage of pre-mRNA but is dispensable for poly(A) addition
and RNAP II termination and interacts with Sub1 and Pta1 genes (He et al. 2003).
Mouse double minute 2 homolog (MDM2), plays a key role in processes like cell growth,
senescence and apoptosis. It is an important negative regulator of the p53 tumor suppressor
and has been identified as a proto-oncogene. MDM2 functions both as an E3 ubiquitin
ligase that recognizes the N-terminal trans-activation domain (TAD) of the p53 tumor
suppressor and as an inhibitor of p53 transcriptional activation (Iwakuma and Lozano 2003)
(Uhrinova et al. 2005).
Lalonde et al identified two promoters for MDM2 in humans which influence its
expression; an internal promoter (P2), which is located near the end of intron 1 and is p53-
responsive, and an upstream constitutive promoter (P1), which is p53-independent.
317
They postulated that sequence variation in the promoter region of MDM2 could lead to
disregulated expression and variation in gene dosage. Their data suggests that part of the
variability in the MDM2 expression levels could be explained by allelic p53-independent
P1 promoter activity (Lalonde et al. 2012).
In a follow up study, a human MDM2 promoter polymorphism (SNP309T>G) was found to
be associated with enhanced Sp1 transcription factor binding and elevated MDM2
transcription while 309G has been found to be associated with elevated cancer risk
(Knappskog and Lonning 2011).
In addition to the protein-encoding gene promoters used in this study, a highly abundant
miRNA cluster (see section 1.12.1) was identified from miRNA expression profiling in-
house. The main focus of this project was to identify temperature-inducible promoter
sequences capable of driving transgene expression; however, it was acknowledged that
investigating a promoter from the miR-17-92 cluster might be an interesting and novel
endogenous tool in CHO cell culture. This cluster was identified as being highly abundant
and it has been shown to be highly expressed in various cell lines in the literature, so it
seemed worthwhile to examine if its promoter could drive transgene expression also.
None of these gene promoters had previously been reported in driving transgene expression
either inducibly or constitutively in any species.

318
5.2: Reporter-gene expression
5.2.1: GFP and Luciferase transgenes
Qualitative analysis using the fluorescent microscope showed that there was an obvious
increase in GFP expression between populations of cells grown at 37oC and 31
oC using
MDM2, SSu72 and both Cirbp promoters (Figure 3.2.2.1). This was evidenced further by
flow cytometry to give quantitative values to each promoter’s strength in driving GFP.
The fact that CMV drove strong GFP expression was not unexpected, however the Cirbp-
CHO promoter activity was encouraging compared to the mouse orthologue and was a
novel finding. All promoters showed temperature sensitivity including the CMV promoter
which showed higher GFP expression at 31oC. This was unexpected and called into
question its suitability as an appropriate control in temperature-shift experiments.
Nonetheless, this led us to examine more than one reporter gene when investigating
promoter behaviour. Only the MDM2 promoter had a larger fold change between
temperatures (Figure 3.2.2.2). This was encouraging that the MDM2 promoter was so
active despite the contrasting results from the qPCR and microarray analyses where we saw
very low transcript numbers from the qPCR validation (Figure 3.1.4.6) and high
fluorescence from the microarray profiling (Figure 3.1.2.1). This gave us confidence in
MDM2 as a potentially useful promoter. Perhaps one reason for this discrepancy is that the
reverse transcription step was not efficient for this gene, as low transcript numbers were
frequently seen in RT-qPCR results throughout the project. The Cirbp-CHO promoter was
the only promoter to drive better GFP expression at both temperatures relative to CMV
(Figure 3.2.2.3).
As most commercial systems utilise viral promoters to drive product gene expression it is
unusual that there are no reports in the literature of viral promoters displaying this
temperature responsiveness. However, it is well known that reducing temperature during
recombinant protein production can improve yield (Wulhfard et al. 2008). Although this is
often related to an improvement in cell viability or culture duration, improved gene
expression could also contribute – Wulhford et al showed it was feasible to use large-scale
(up to 100L) transient gene expression (TGE) in CHO cells and as a result they increased

319
transient recombinant antibody expression by more than 3-fold at 31oC as compared to
expression at 37oC.
The miR-17-92 cluster promoter was disappointing in terms of its ability to consistently
drive high expression of GFP. Although studies on miRNA promoters specifically are
scarce, especially those of mammalian miRNAs, there is reason to believe that they could
be useful as engineering tools due to the dynamic nature of miRNA expression (Jadhav et
al. 2013). Analogous to this reasoning, Lee et al developed a dual-luciferase reporter
system to monitor expression and posttranscriptional regulation of miR-23a in cells in vitro
and in vivo. They used a plasmid encoding firefly luciferase under the control of a 5′
regulatory sequence from the human miR23a∼27a∼24-2 gene cluster to determine whether
the degree of miR-23a transcription is cell-type dependent or differentiation-stage specific.
This demonstrated a functional use for a miRNA promoter sequence in driving a protein-
encoding gene (Lee et al. 2008).
The regulation of intragenic miRNAs by their own intronic promoters is one of the open
questions relating to the understanding of miRNA biogenesis. It is still poorly understood
how miRNAs are regulated and their respective promoters are not well characterised. This
is partly due to the difficulty of predicting promoters from short conserved sequence
features without producing a high number of false positives (Megraw and Hatzigeorgiou
2010) (Schanen and Li 2011). Thus, methods to identify miRNA promoter regions are
being sought. Marsico et al described a model called PROmiRNA, it is a new approach for
miRNA promoter annotation based on a semi-supervised statistical model trained on
deepCAGE data and sequence features. In addition to the model identifying more miRNA
promoters than other methods (miRBase v18 and Ensembl v66), PROmiRNA also returns
all possible alternative promoters for a particular miRNA, including intronic promoters
(Marsico et al. 2013).
Another way to identify miRNA promoters is using chromatin analysis. Ozsolak et al
identified the proximal promoters of 175 human miRNAs by combining nucleosome
mapping with chromatin signatures (Ozsolak et al. 2008). In addition, Long et al analysed
the 5' flanking regions of intergenic miRNAs and intronic miRNAs. They used luciferase
reporter assays also and showed that 22 of the 30 promoters drove gene expression in HEK-
320
293 cells, indicating a high accuracy of the TSSG promoter prediction. Further analysis
showed that approximately 60% of the miRNA promoters tested had a TATA-like box
contained in their sequence (Long et al. 2011). In summary, the high-throughput
identification of miRNA promoter and enhancer regulatory elements can shed light on the
control of miRNA transcription and using a combination of these analysis tools may permit
rapid identification of transcriptional networks of miRNAs.
Another routinely used reporter is the luciferase gene. In order to facilitate normalisation
for transfection efficiency owing to different promoter and plasmid size configurations, we
used the luciferase reporter in conjunction with Bradford assays to quantify the amount of
protein present. Although a constructive assay, there was no normalisation for the GFP
assay in this regard therefore this led to utilising the luciferase reporter gene and Bradford
assay.
The most interesting initial observation was that the SV40 promoter did not appear to be as
responsive to temperature as CMV. Our data showed Cirbp-mouse and Cirbp-CHO both
had the most striking expression change between 37oC and 31
oC (Figure 3.2.3.1). MDM2,
SSu72, Cirbp-CHO and Cirbp-mouse all showed higher expression at 31oC relative to the
SV40 promoter, while only miR-17-92-mouse and SSu72 promoters drove luciferase
expression to a higher level than SV40 at 37oC (Figure 3.2.3.2). This was both interesting
and encouraging as the miR-17-92-mouse promoter performed so poorly in the GFP assay.
Broadly speaking though, the patterns of expression and induciblity were similar to that
observed using GFP as a reporter.
Thaisuchat et al reported on an endogenous CHO promoter (S100a6) which was compared
to SV40 viral promoter using a luciferase reporter, however, it was unclear how they
performed subsequent normalisation post-transfection. They used the Dual-luciferase assay
co-transfecting a plasmid encoding the Renilla luciferase (under the control of a CMV
promoter), however, when we tried to utilise the same plasmid as a normalising control, we
found its expression to be temperature sensitive. For this reason we adopted the Bradford
assay as a means of normalisation. In their study, the SV40 luciferase expression units were
set to 100 % activity for each temperature and all other samples were measured relative to
them.
321
At most, increases of 2/3-fold in luciferase expression were observed using the various
truncated promoter fragments after adjusting the culture to 31oC, with the majority showing
between 1.5/2-fold (Thaisuchat et al. 2011). Conversely, our data showed that upon
temperature shift, the MDM2 and Cirbp-CHO promoters were capable of increasing
luciferase expression levels to ~41-fold and ~3.8-fold respectively, higher than SV40. In
short, it was difficult to compare the absolute activities we observed to their data.
5.2.2: Driving inducible expression of a ‘product gene’ using temperature
Having observed encouraging results using these promoters in both GFP and luciferase
reporter assays, the next step was to test them with more industrially relevant proteins. We
examined the expression of EPO under the control of our various promoters by western blot
and qPCR. At this point, the issue of promoter specificity was raised. In other words, the
ability of individual promoter sequences to drive transcription (at either temperature)
seemed to vary depending upon the gene being transcribed. MDM2 and both miR-17-92
promoters, for example, appeared to be incapable of driving EPO expression (Figure
3.2.5.2). This was surprising considering the substantial expression of GFP and luciferase
for all 3 promoters. In contrast, the SSu72 promoter generated high levels of EPO and was
significantly more active at 31oC. The difference appears to be transcription-specific, as
opposed to a problem with translation, as very little EPO mRNA was detected using these
promoters (Figure 3.2.5.1).
The CMV promoter drove higher EPO expression at 31oC compared to 37
oC, than all other
tested promoters. This highlighted once again, that viral promoters are temperature
sensitive and that they are perhaps poor controls for promoter studies relating to
temperature.
So is inducible expression of a product gene in mammalian culture the way to go? In other
words, is controlling expression using CHO-specific regulatory sequences an attractive
alternative to existing technologies? Although there are commercially available inducible
systems from companies like Clontech and Life Technologies e.g.: GeneSwitch™, there

322
has not been any approved CHO-related regulatory sequence used in large scale
manufacture of protein to date.
Controlled gene expression represents an unmatched potential for biopharmaceutical
manufacturing of unstable, growth-impairing and cytotoxic proteins as well as conditional
metabolic engineering to improve desired cell phenotypes (Werner,N.S et al. 2007). In an
field where inducible systems are difficult to implement technologically, the TetOn/Off
inducible system is the most widely publicised and has shown tight regulation of gene
expression with fold changes of product genes reaching up to many hundred folds
(Sprengel and Hasan 2007) (Nishijima et al. 2009). Other antibiotics and hormones have
also been designed to utilise transgene transcription control systems such as; streptogramin,
macrolide, coumermycin, rapamycin and progesterone (Hartenbach and Fussenegger 2005),
but some of these drugs may elicit side effects following long-term administration at
regulation-effective concentrations (Sartor and Cutler 1996) (Lautermann et al. 2004).
Additionally, drug-based inducers are less suited for transgene modulation of
biotechnologically relevant production cell lines since preparation of inducer-free product
formulations remains a costly downstream processing challenge and requires additional
cross-talk with regulatory authorities.
Although it is interesting to test product gene expression under control of some sort of
inducible system, a more permissible approach would involve the generation of stable cell
lines expressing the product gene. For example, if we take the temperature shift results out
of the equation, at the more normal culture temperature of 37oC our SSu72 promoter was
capable of driving equal or higher expression than the strong CMV promoter and Cirbp-
mouse control of EPO at a protein level (Figure 3.2.5.2).
Recently, alternate ways to trigger product gene expression have been sought; one method
involves gaseous acetaldehyde, which is physiologically inert and approved as a food
additive by the FDA. Weber et al pioneered an acetaldehyde-inducible regulation (AIR)
technology which takes advantage of gaseous acetaldehyde to modulate product gene
expression levels. They showed that human IFN-beta production was fully reversible while
maintaining 95% cell viability during the entire batch process and they suggest it will foster

323
novel opportunities large-scale manufacturing of difficult-to-produce protein
pharmaceuticals (Weber and Fussenegger 2004b) (Weber and Fussenegger 2004a) (Weber
et al. 2005) (Werner et al. 2007).
In contrast to our temperature inducible expression results, the AIR system was shown to
be tightly regulated via autoregulated, bidirectional and multicistronic mammalian and
lentiviral expression vectors that exhibit strict 1:1 transcription stoichiometry. They show
all 3 to be robust and versatile expression platforms for the gas-inducible transgene control
system which they expect to foster future advances in gene therapy and tissue engineering
as well as biopharmaceutical manufacturing (Hartenbach and Fussenegger 2005). Although
this tight control AIR system has potential, it still requires the addition of external
component i.e: gas whereas our temperature responsive promoters do not.
5.2.3: Driving inducible expression of an ‘engineering gene’ using temperature
In the previous section, we discussed the induction of product gene (EPO) expression at
different temperatures. Realistically the majority of product genes are unlikely to be
expressed in an inducible manner such as this. The promoters identified in this project are
more likely to be useful for controlling the temporal expression of a cell engineering
transgene. Therefore, our next focus was to consider their use in this manner. We chose to
use cyclin-dependant kinase inhibitor 1B (p27) to investigate whether they could drive
expression of an engineering target to influence a phenotype in culture. Successful
induction of p27 should result in reduced cellular growth via cell cycle inhibition in the G1
phase.
Overall, there was a correlation between increased transcript copy number of p27 and the
effect on cell number (Figure 3.2.6.1 A). For example, MDM2 and SSu72 promoters had
the biggest effect on the cell growth and this correlated with greater p27 mRNA transcript
abundance (Figure 3.2.6.3). This demonstrates that cell growth can be influenced by using
temperature as a switch mechanism to induce these endogenous CHO promoters. This
mechanism could be valuable in bioprocesses where control over cell density is required.
These promoters could potentially be used to achieve dynamic control of other cellular

324
behaviours for enhanced process characteristics during a bioprocess. For example,
mammalian cell culture metabolism is characterised by glucoglutaminolysis, that is, high
glucose and glutamine uptake combined with a high rate of lactate and non-essential amino
acid secretion (Quek et al. 2010). Thus to circumvent the onset of glucoglutaminolysis,
gaining control over cell density by using a systematic p27 inducible construct, may be a
suitable way to extend culture longevity for example.
Gene expression is a dynamic process by nature, which is constantly adjusting to cope with
various environmental perturbations and other signals. Consequently, endogenous
promoters with intrinsic dynamic activities represent attractive tools to control the
expression dynamics of transgenes. In a study relating to dynamic metabolic engineering
using CHO-specific promoters, Le et al isolated an 800bp promoter fragment containing
part of the putative 5′ UTR and the upstream region of the Thioredoxin-interacting protein
and showed that it could drive expression in concert with cell growth. They further
employed this promoter to control dynamic expression of the mouse GLUT5 fructose
transporter in CHO cells, enabling them to utilize sugar according to the cells needs rather
than in having excess as typically seen in culture (Le et al. 2013).
Alternative dynamic engineering methods such as engineering of metabolic, secretory, and
growth control pathways in producing cells to enhance their growth and product secretion
traits have all been attempted to control expression in CHO cells (Datta et al., 2013) (Kim
et al., 2012) (Kaufmann and Fussenegger, 2003) (Seth et al. 2006). It is reasonable to
assume that in the future, further advancements in protein production will be a reality as a
result of combinatorial approaches utilising many areas of engineering including the use of
endogenous promoter tools.
Additionally, our data from CHO-K1-SEAP cells demonstrated that using the isolated
promoter sequences upstream of a cytostatic gene had a direct effect on cell growth and an
equal but indirect effect on SEAP productivity after 3 days (Figure 3.2.6.2.5).
Furthermore, as the assay was transient by nature, it would be interesting to see the impact
over a longer period generating cell lines with stably integrated temperature-responsive p27
and subsequently measure SEAP secretion over time in various batch or fed-batch settings.

325
Ultimately, the goal of any engineering intervention is to improve the final yield and/or
quality of recombinant protein from a particular process. While, inducible p27 expression
clearly impacted on cell density in response to temperature as planned, this had a knock-on
negative impact on SEAP yield. Therefore, while p27 provided us with a useful model cell
engineering gene, clearly its implementation in a bioprocess in terms of productivity is
impractical. However, it does provide a good demonstration of the applicability of this
approach. It may well be that temperature shift is enough in its own right to reduced cell
growth and that temperature-responsive promoters could be implemented to switch
expression of other genes involved in processes related to recombinant protein production
(rather than cell growth).
In summary, the promoters investigated in this project resulted in quite variable levels of
transcript and protein depending on the reporter gene, highlighting one of our main
findings; that if these inducible promoters are to be used as tools in gene
expression/regulation, then it is important to match each individual transgene of interest to
the most suitable promoter (Table 3.2.6.3.1).
5.3: In silico promoter analysis
The focus of the project was to identify promoter sequences that could be used as tools to
drive transgene expression in a temperature sensitive manner. However, we also had
opportunity to investigate which, if any, promoter elements (such as transcription factor
bind sites (TFBS)) or other features might be responsible for this induciblity. In silico
promoter analysis of the 3 gene promoters used in the reporter studies would be insufficient
for this type of analysis as unlike coding sequence, for example, regulatory sequences are
under different constraints in terms of evolutionary conservation. Even a single base change
in coding sequence may be unacceptable due to the negative impact it may have on the
function or expression of the resulting protein.
On the other hand, promoter modules (2-3 TFBS in tandem that combine to control
initiation of transcription) may tolerate considerable variations in intervening sequence,
without changing the functionality of the regulatory module. Indeed, even TFBS can be

326
quite promiscuous in terms of their exact sequence motif – often allowing interchangeable
use of different nucleotides without impacting TF binding/recruitment.
For these reasons, alignment algorithms used to identify conserved patterns of promoter
elements use different ‘rules’ to those used to align coding sequence and furthermore,
require greater numbers of input promoter sequences in order to perform or predict real
promoter modules effectively.
In order to explore this concept further, we identified a cohort of genes whose expression
patterns across a large transcriptional dataset mimicked that of the 3 temperature-inducible
genes. This ‘guilt-by-association’ approach assumes that genes that are co-expressed are
controlled by the same regulatory elements. In this manner, upstream sequences of 16 co-
expressed genes from the cohort (Figure 3.4.2), were extracted in silico. We used the
‘Conserved TF-family suite’ from Genomatix™ with the highest stringency for analysis
and as a result, we identified binding sites for 3 TFs; EVI1, SRY and FKHD/FOX. None of
these TFs have had previous links to any specific inducible promoter studies in CHO, but a
literature search showed examples in mouse and human disease models.
A gene associated with both murine and human myeloid leukemia is ecotropic viral
integration 1 (EVI1). It is a nuclear TF involved in many signaling pathways for both
coexpression and coactivation of cell cycle genes. EVI1 is a proto-oncogene conserved
across humans, mice, and rats, sharing 91% homology in nucleotide sequence and 94%
homology in amino acid sequence between humans and mice (Buonamici et al. 2003). The
EVI1 gene codes for a zinc finger transcription factor with important roles both in normal
development and in leukemogenesis. The exact mechanism by which EVI1 induces
leukemogenesis is not clear but a study by Fuchs, has shown that EVI1 upregulates cell
proliferation, impairs cell differentiation, and induces cell transformation (Fuchs 2006).
A review by Wieser highlighted that experimental overexpression of EVI1 by itself was
insufficient to cause leukemia in animal model systems, but it did interact with other genes
(Wieser 2007). For example, it was shown that putative interference of EVI1 with the DNA
binding activity of the transforming growth factor-beta (TGF-β) responsive Smad3/Smad4
in causing leukemogenesis (Kurokawa et al. 1998). In summary, EVI1 is able to interfere

327
with the actions of TGF-β in a variety of biological systems and appears to be cell line
specific.
The sex-determining region Y (SRY) or testis-determining factor (TDF) is a member of the
SOX (SRY-like box) gene family of DNA-binding proteins. When complexed with the SF1
protein, SRY acts as a transcription factor that can upregulate other transcription factors,
most importantly SOX9 (Haqq et al. 1993). More recently it has been dubbed the
masterswitch in sex-determination by Kashimada et al. They discuss the cascade of events
triggered by SRY and the mechanisms that reinforce the differentiation of the testes in
males while actively inhibiting ovarian development (Kashimada and Koopman 2010).
Finally, Hiramatsu et al, highlight a more time-specific window on the importance of SRY
action in the initial 6-hour phase for the female-to-male switching of FGF9/WNT4
signaling patterns (Hiramatsu et al. 2009).
FOX (Forkhead box) proteins are a family of transcription factors that play important roles
in regulating the expression of genes involved in cell growth, proliferation, differentiation,
and longevity. Many FOX proteins are important in embryonic development (Tuteja and
Kaestner 2007). There are many members of the FOX family, many annotated by a suffix,
for example, FOXO. Members of the class O regulate metabolism, cellular proliferation,
stress tolerance and possibly lifespan. The activity of FOXO is controlled by post-
translational modifications, including phosphorylation, acetylation and ubiquitination (van
der Horst and Burgering 2007).
Chromatin can be visualised as a string of nucleosome beads linked by ribbons of DNA.
Much of the DNA in the eukaryotic cell is wrapped around nucleosomes and thereby
occluded by histones. This raises the question of, how can a transcription factor find its
binding site, given that an enhancer or other element might be condensed in the
nucleosomes? Recent work has revealed certain transcription factors like Pbx that can
penetrate repressed chromatin and bind to sites in DNA sequences with high affinity, acting
much like a homing beacon for other TFs and their associated co-factors (Berkes et al.
2004). These have been termed ‘pioneering transcription factors’ which appear to be
critical in establishing certain cell lineages. Interestingly, FOX proteins have also shown
328
pioneering transcription activity by being able to bind condensed chromatin during cell
differentiation processes (Zaret and Carroll 2011).
A review by Fukunaga, Shioda and co-workers showed instances of gerbil and mouse brain
ischemia connections to the Akt pathway with the Forkhead box transcription factor, class 0
(FOXO) (Fukunaga and Shioda 2009) (Shioda et al. 2007). Interestingly, after in silico
analysis of the Txnip promoter discussed previously, Le et al identified a FOXO binding
site flanked by two CAAT-box sites in the 800bp promoter sequence. This is intriguing that
both our promoters and the Txnip promoter sequences possess this TFBS. The presence of
this pioneering TF may be related to dynamic induciblity and/or expression strength
reported. In other words, scenarios in vivo in which the binding of a series of TFs to their
binding sites is improbable owing to sites being located at densely packed chromatin
locations and thus not initially cooperative for any interactions, then these special pioneer
transcription factors can be at hand to engage target sites in this dense chromatin location
(Zaret and Carroll 2011).
The CREB TF was located in 15 of the sequences. CREB was first described in 1987 as a
cAMP-responsive transcription factor regulating the somatostatin gene. CREB binds to
certain DNA sequences called cAMP response elements (CRE), thereby increasing or
decreasing the transcription of the downstream genes (Montminy and Bilezikjian 1987).
More recently, its downregulation has been linked to disease progression in disease states
like Alzheimer’s when the expression of CREB in the hippocampal neurons of mice was
examined (Pugazhenthi et al. 2011).
More commonly studied transcription factors such as; TBP, STAT and E2FF had TFBS
located in 13 out of the 16 sequences tested. TATA-bind protein (TBP) and the Signal
Transducer and Activator of Transcription (STAT) especially, are well studied TFs that
play crucial roles in initiating or enhancing transcription with STAT proteins also being
involved in immune tolerance and tumour surveillance (Darnell 1997). In addition, E-box
and CAAT-box motifs were identified in 12 out of 16 sequences, and are regarded as vital
drivers of transcription and regulation with the CAAT-box being frequently regarded as
part of the core promoter architecture (Bi et al. 1997). Furthermore, C2H2 Zinc Finger
Transcription Factors 2 (ZF02) and CCCTC-Binding factor or 11-zinc finger protein

329
(CTCF) sites were also found in 12 of the sequences. CCCTC-Binding factor or CTCF was
initially discovered as a negative regulator of the chicken c-myc gene. This protein was
found to bind to three regularly spaced repeats of the core sequence CCCTC and thus was
named CCCTC binding factor (Lobanenkov et al. 1990). It requires additional sequences
outside the three recognition motifs for tight binding, like many TFs its mode of action is
synchronous with other factors/elements for transcriptional functionality. All of these
identified transcription factors and their respective binding sites could perhaps be, at least
partially, responsible for the promoter functionality shown throughout this project, but this
has yet to be fully elucidated.
Additionally, a single consensus motif ‘CCCCAGC’ was identified by examining across all
these 16 input sequences (including a 1kb upstream portion of the putative miR-17-92
promoter sequence). We used the motif-finder software tool from Genomatix™ choosing
the most stringent cut-off parameters for analysis. This sequence was identified in all 16 co-
expressed gene promoter sequences, including all 4 novel CHO promoters from this study
(Table 3.4.3). While interesting, this sequence has not been identified as a TFBS in the past,
and would require closer investigation using site-directed mutagenesis or similar
experimental verification to draw any further conclusions.
5.4: The most appropriate promoter for each GOI - Promoter specificity
One of the main findings of this project was that the isolated promoters all drove transgene
expression at varying levels, showing utility across 4 reporter gene platforms. For example:
the Cirbp-CHO promoter was more efficient at driving GFP than luciferase but the opposite
was seen for the Cirbp-mouse promoter. Equally, the EPO protein could only be detected
with SSu72, CMV and both Cirbp promoters while MDM2 and both miR-17-92 promoters
could not, even though the latter 3 all drove luciferase to moderate or high expression.
It is important to note that the efficiency of an inducible or indeed any exogenous promoter,
in driving transcription, is dependent on the nature of the gene it regulates, for example it’s
toxicity, and the host cell it is being produced in. This promoter specificity was observed
throughout the project, although we didn’t expose the promoters to such experimental rigor

330
as driving toxic proteins or transfection into a wide-range of cell types, we did observe
mixed levels of promoter activity across the 4 reporter genes.
Promoter usage can be dependent on which location or tissue the sequence resides and
indeed the species and cell type (Carninci et al. 2006) (Spenger et al. 2004) (Lim et al.
2010) and how the diverse mechanisms regulating transcription of different promoter’s
work, still remains unclear for the majority of promoters, especially CHO-specific ones.
Additionally, Strid et al reported on the use of a promoter derived from a key enzyme in
leukotriene biosynthesis called Leukotriene C4 synthase. They used this promoter to drive
expression of enhanced GFP (EGFP). Specific GFP expression was observed in human
monocytic leukemia (THP-1) and rat basophilic leukemia (RBL-1) myeloid cells but not in
human embryonic kidney (HEK293/T) demonstrating cell specificity (Strid et al. 2008).
Similarly, Haverkamp et al showed the cell line specificity was the restrictive reason for
different observed levels of GFP expression. They performed in vivo studies using 4
transgenic mouse cell lines that expressed EGFP under the control of 3 cell-specific
promoters from calretinin, choline-acetyltransferase and parvalbumin genes (Haverkamp et
al. 2009).
Conversely in an older study, Hollenhorst et al, as a promoter specificity determinant,
tested the mRNA levels of the ETS family of TFs. The mRNA levels of the 27 paralogous
human ETS genes were measured in 23 tissues and various cell lines, with the premise
being that ETS factors display highly conserved DNA binding properties and would not be
expected to retain promoter selectivity across tissues (Hollenhorst et al. 2004). Tissues and
complementary cell lines showed similar expression patterns perhaps indicating that tissue
complexity was not always a limitation to specificity.
Either way, it seems apparent that promoter specificity results from the promoter only being
a ‘sum of its parts’, the diverse TFs and combination of elements present in a promoter
sequence all work in concert or if elements are missing or modified through
phosphorylation for example, then the sequences will inadvertently exhibit different
transcriptional rates and promoter selectivity. A recent publication by Authier et al,
revealed that IKK - IκB kinase α (IKKα) and IκB kinase β (IKKβ) – interacts and
331
phosphorylates oncogene related B (RelB) to modulate its promoter specificity and leads to
increased fibroblast migration (Authier et al. 2014). Through phosphorylation, promoter
activity and its transcriptional rate can be altered. Therefore, it is reasonable to assume that
all elements of a promoter sequence can succumb to various levels of activity as a result of
modifications and diverse combinations of TF interactions.
In conclusion, it would appear essential to map the most suitable promoter to an individual
transgene and that using more than one reporter gene assay to test transgene expression
would be good practice for promoter studies overall.
5.5: Viral versus endogenous stability in extended culture
The cytomegalovirus (CMV) major immediate-early promoter/enhancer is used in many
cell culture systems and is considered to be one of the strongest promoters in vitro.
However, when this promoter was used in in vivo approaches for gene therapy, it was
silenced within a few weeks in several organs including the liver (Loser et al. 1998). CMV
silencing was also reported by Teschendorf et al, they showed that >97% of stable HT-29
clones homogeneously expressing GFP, under control of the CMV promoter gave rise to a
scattered patterns of high and low GFP expression (Teschendorf et al. 2002).
The human cytomegalovirus promoter (hCMV) has also been shown to be susceptible to
gene silencing in CHO cells, most likely due to epigenetic events, such as DNA
methylation and histone modifications (Mariati et al. 2014b). Therefore, we assumed that
over time, a CMV viral sequence would become unstable due to promoter silencing in
comparison to endogenous sequence. We examined the performance of two endogenous
promoters (SSu72 and miR17-92) versus a CMV, by stably transfecting each promoter-
GFP construct into CHO-K1 cells to test GFP expression over extended culture time.
Figure 3.5.1, illustrates the 3 GFP stable clonal mixed populations and their mean GFP
fluorescence over three months. Decreases in GFP expression were seen in the clones
transfected with the CMV promoter compared to the two endogenous SSu72 and miR17-92
driven clones over time. This drop in GFP expression was more acute in the CMV stable
mixed population, where GFP expression fell by ~95%.

332
In addition, we sorted these 3 stable GFP heterogeneous populations into single clones
expressing high, medium or low GFP levels to examine this silencing effect further using
homogeneous populations. Over 14 weeks, clones carrying the CMV promoter, once again
showed decreased GFP expression/stability over time, whereas more consistent GFP levels
were seen over the same time period by both SSu72 and mir17-92 clones (Figure 3.5.2).
This underlines once again, the importance of the choice of promoter, in this case, for the
generation of stable cell lines in bioprocessing. Even though our findings showed that viral
promoters were marginally better at driving high level expression (luciferase exempt),
using the endogenous promoters, not only do we get moderate to high expression but we
also get added stability over time in culture, which could be advantageous in a bioprocess
setting.
In parallel to using endogenous CHO promoters to improve stability and expression in
CHO cells, however, alternate ways to circumvent the transcriptional silencing commonly
seen by the CMV viral promoter have been explored. For example; methylation-free CpG
island sequences derived from TBP and HNRPa2b1 genes were inserted into vectors
containing the human hCMV promoter, conferred more stable GFP transgene expression,
aswell as, improved resistance to heterochromatin-mediated silencing (Antoniou et al.
2003) (Williams et al. 2005)..
Similarly, to combat silencing over extended culture, Mariati et al successfully inserted a
core CpG island element (IE) from the hamster adenine phosphoribosyltransferase gene
into a human CMV promoter. It was found to be effective in preventing DNA methylation
and silencing. They also showed that the insertion of IE into a chimeric murine CMV
(mCMV) enhancer and human elongation factor-1α core (hEF) promoter in reverse
orientation did not enhance expression stability, indicating that the effect of IE on
expression stability was possibly promoter specific (Mariati et al. 2014b) (Mariati et al.
2014a).
This experiment demonstrated two things: first, it validated what is generally accepted
regarding viral promoters, i.e: they are susceptible to promoter silencing over long exposure
in culture. Secondly, that endogenously sourced regulatory/promoter sequences maintain

333
strong expression characteristics compared to viral sequences over extended time in culture.
Future work would be to include a repeat of this experiment using various other reporter
proteins to assess whether the stable expression is independent of the transgene downstream
of the promoter.
5.6: Comparisons to analogous promoter studies
In cell line and bioprocess optimisation, dynamic expression using inducible promoters
represents an attractive tool to control the expression of transgenes. Existing inducers such
as tetracycline, hormones and IPTG are undesirable at a manufacturing scale.
Consequently, groups including us have acknowledged that utilising endogenous sequences
from CHO may have more beneficial effects than those involving exogenous sequences
reported in similar studies.
Chen et al isolated 17 stable clones containing CHO sequence using a promoter trap
approach. They generated a collection of transgenic lines with random insertions of a
promoter-less reporter gene and screened for clones expressing the highest levels of
reporter activity. They used GFP to evaluate expression for all clones. Only two clones
showed high quality BLAST matches to the CHO genome and subsequent experimentation
focused on these two clones. Clone 2 showed stronger GFP expression than the basal empty
vector control (~20% of the SV40 viral promoter activity), while clone 11 did not. A clone
2 fragment of 864bp was truncated and placed upstream of a luciferase gene and expression
was reported to be highest in a 156bp fragment (~63% of SV40 control). In comparison, 2
of our promoter constructs displayed higher luciferase expression than SV40 at 37oC and 3
promoters displayed luciferase expression higher than SV40 at 31oC. Finally, only clone 2
was capable of expression in both reporter systems (Chen et al. 2013), similar to what we
observed across reporter assays.
Another group isolated novel CHO sequences using inverse PCR methodology and tested
their utility using the luciferase reporter assay. When constructs C1 – C5 were transfected
into CHO cells, luciferase expression of ~25% and ~40% as a % of the SV40 control were
reported for constructs C1 and C4 and were deemed the most promising. They performed

334
minimal mapping and in silico transcription factor binding site prediction. Only two
predicted TATA-boxes were detected (Pontiller et al. 2010). Both of these studies reveal
sequences that were successful in driving transgenes, however, further characterisation of
the regulatory sequences is needed, and neither relate to dynamic or inducible expression.
Thaisuchat et al did however identify a temperature sensitive promoter - S100a6
(Calcyclin), which wasn’t identified on our initial microarray data. They examined the
promoter activity using the luciferase assay only, but screened an extensive panel (~19) of
truncated S100a6 constructs. From these, 12 displayed activities above the SV40 positive
control.
Although, our promoters do infact drive expression of an industrially applicable protein of
interest, the reporter results were not without their inconsistencies. For example, MDM2
did not produce EPO protein (Figure 3.2.5.2) even though it had shown promise in the
other reporter assays. Perhaps this is highlighting that it should be standard practice to use
more than one reporter assay as a true measurement of a regulatory sequences’ utility. A
typical example is seen at a transcriptional level, where the Cirbp-CHO promoter expressed
more EPO than the Cirbp-mouse version at both 37oC and 31
oC (Figure 3.2.5.1), however,
in the luciferase assay the Cirbp-mouse drives luciferase to higher levels than the CHO
version.
Furthermore, both promoters drove similar moderate to high EPO expression based on
qPCR and western blotting (Figure 3.2.5.1 and 3.2.52), and very little difference in activity
was seen. Nevertheless, regardless of varying promoter activities across reporter platforms
this was encouraging, as to date only Cirbp from mouse is reported in the literature and as a
result of this project, the CHO equivalent can now be further analyised and comparisons
can be made between both promoters, based on having prior knowledge of the mouse
version.
Additionally, with reporter assay comparisons between CHO and mouse species, as in the
case for miR-17-92 and Cirbp promoters, distal regulatory sequences and their location
relative to the ATG start site may differ between species. Alternative promoters may also
exist as well as with different TSS’, as was the case for mouse Cirbp (Al-Fageeh and

335
Smales 2009). In other words, even though the ATG start site was located in two species,
and fragments of similar size were extracted relative to this ATG, then it is likely that they
won’t necessarily have the same framework and elements arranged in the same locations,
meaning they could, and often will as our results show, have different activities. This may
go some way towards explaining why we observed different levels of reporter gene
expression between promoter orthologues, irrespective of the promoter specificity for the
transgene it controls.
Other factors may also come into play demonstrating that functionality of a promoter is not
solely dependent on the reporter gene. For example; we found that transgene expression can
be influenced by culture format. Feng et al fused three different promoters (viral CMV and
SV40 and human beta-actin) to luciferase and beta-galactosidase reporter genes and tested
their expression in adherent and suspension formats. They found that beta-actin and SV40
exhibited suppressed gene expression when transfected into mouse epidermal cells
suspended over-agar compared with cells attached on culture plates. In contrast to the SV40
promoter, CMV promoter activity was not decreased in cells suspended in an over-agar
assay when compared with adherent cells. These studies show that regardless of
mammalian or viral promoters, one cannot assume that all promoter-reporter gene
constructs behave similarly in all conditions (Feng, Hicks and Chang 2003).
The miR-17-92 promoters displayed lower GFP activity than expected, considering the
cluster being highly expressed in many CHO cell lines (Hernandez Bort et al. 2012) and it
being prevalently expressed in lung cancers (Jin et al. 2014) (Hayashita et al. 2005).
However, after examining both using the luciferase reporter, the mouse version was found
to be capable of driving higher luciferase expression than all other promoters tested
including the SV40 control at 37oC (Figure 3.2.3.1). The CHO version did drive luciferase
but not strongly, hinting that there may be crucial regulatory elements missing in the CHO
sequence.
This was interesting as both the mouse and CHO sequences had high sequence homology.
As with the other gene promoter sequences investigated the truncated nature of the
sequences compared to the endogenous locus may be responsible for the observed results.
The reasonably novel nature of using a miRNA-derived promoter sequence also meant that

336
there were sparse published studies, at the time of analysis, to compare our observations
with.
More recently, miR-17-92 transcription was shown to be partly controlled by an E2F-
regulated host gene promoter. An intronic A/T-rich region exists directly upstream of the
miRNA coding region and has shown to be a contributor to the clusters expression.
Deletion analysis of the A/T-rich region revealed a strong dependence on c-Myc binding to
the functional E3 site. Yet, constructs lacking the 5'-proximal ~1.3 kb or 3'-distal ~0.1 kb of
the 1.5 kb A/T-rich region still retained residual promoter activity, suggesting multiple
transcription start sites (TSS) in this region (Thomas et al. 2013). In light of this study, we
investigated the sequence of human, rat, mouse and CHO approximately 1.5kb upstream of
the miR-17-92 coding sequences.
Although subjective, we believe that these A/T rich regions are present in all 4 species,
however, interestingly the mouse promoter, being a larger fragment (more 5’ upstream
sequence), was shown to contain a conserved E-Box site ‘CACGTG’ - this site was not
located in the CHO orthologue and may be a reason for poor expression in 3 of the 4
reporter assays but further work is required for validation. This is in line with the finding
that cluster expression is activated by c-myc binding to a conserved E-box element (E3)
~1.5 kb upstream of the miRNA coding sequence (Ji et al. 2011) (Thomas et al. 2013).
5.7: Inducible mechanisms for improving bioprocess behaviour
Although adjusting culture temperature is routinely used to increase productivity through
extended viability and stationary culture phase, it serves a slightly different function in this
study. Here we present the reoccurring theme of using temperature shift as a control
mechanism. It is an attractive inducible switch because it requires no external molecules or
further engineering (Yoon, Song and Lee 2003) (Fogolin et al. 2004). All promoters used in
this study showed temperature induciblity, which in turn we hope to utilise as
bioproduction tools.

337
Many inducible systems and inducer molecules (IMs) have been pioneered by Fussenegger,
Weber and colleagues over the last ten years. They visualise the cellular environment like
an electronic circuit capable of fully integrated tuneable expression allowing control via
response to distinct input signals/triggers.
These synthetic biology approaches will expand the biological toolbox for manipulation of
cells for use in bioprocessing. Our endogenously sourced promoters and indeed any
regulatory sequences may have added benefits when sourced from a host cell (CHO in our
case), based on stability and greater ease of regulatory approval.
The use of an appropriately chosen native promoter can also have the benefit of providing
more refined control over transgenes with regard to timing and dosage. Le et al, showed
such control by employing a pTixnip-driven mGLUT5 (a mouse fructose transporter under
the pTixnip promoter) to demonstrate the concept of dynamic expression based around a
metabolic engineering approach, to control fructose consumption in sync with culture
growth stage (Le et al. 2013).. As a result, the GLUT5 fructose transporter under control of
the Txnip promoter enabled CHO cells to utilise sugar according to cellular needs rather
than in excess as typically seen in culture. Thus, less lactate was produced, resulting in a
better growth rate, prolonged culture duration, and higher product titer.
Recently it was shown that more dynamic expression that is in sync with the cells natural
circadian rhythm or clock genes is the holy grail of precise inducible regulation (Le et al.
2013) (Lopez et al. 2014). Clock genes are transcriptional regulators engaged in the
generation of circadian rhythms. Cirbp guarantees high amplitude expression of the
circadian clock genes and drives the rhythmic expression of a broad array of genes that
orchestrate metabolism such as; sleep/wake behaviour, and the immune response. Their
results represent a new mechanism of cytokine-regulated expression of clock genes namely
Cirbp by modulating expression based on various concentrations of cytokines TNF and
TGF-beta. This was supported by the finding that overexpression of Cirbp protects cells
from the inhibitory effects of TNF and TGF-beta (Lopez et al. 2014).
If Cirbp expression can be responsive to multiple factors i.e: temperature (as we have
shown) and these two cytokines then its reasonable to assume that a useful molecular
338
circuit could be generated which incorporates sequences responsible for the responsiveness,
and apply it to CHO protein production. This more natural circuit based around Cirbp
which so obviously has a fundamental impact on cell behaviour, based on the amount of
processes it is involved in , would be more appealing than the exogenous or IM circuits
discussed previously.
Although inducible systems and newer dynamic systems as mentioned have inherent
benefits regarding more ‘real’ control of cells via their genes, in some instances the use of
an inducible type system may not be desirable in large-scale manufacturing. This could be
attributed to manufacturing costs and where a bioreactor design isn’t suitable. Another
drawback seen is through lowering temperature is that it decreases specific growth rate (μ)
and thus volumetric productivity often does not increase even though specific productivity
(q) does (Hong et al. 2007).
In conclusion, progress is being made to bridge theory and application between fine tuning
gene expression via synthetic biology or exploring control in sync with the cells natural
rhythm in order to improve bioprocess outcomes.

339
5.8: Conclusions – Project 1
Here we have described a study on CHO-specific promoters with particular emphasis on
temperature induciblity. From the study we make the following conclusions;
Promoter activity was shown to be cell line specific and dependent on the nature of
the transgene it controls.
Having isolated 6 functional promoter fragments of a certain size, there was a
possibility that there is some regulatory sequence missing, potentially preventing
the promoters from performing even better.
It was shown that MDM2 and Cirbp genes both had similar mRNA half-life and
decay rates at both temperatures, suggesting that they were transcriptionally equally
active at both temperatures.
The SSu72 gene on the other hand was shown to be twice as stable at 31oC and had
a lower decay rate which may contribute to the increased expression seen when
driving reporter genes upon temperature shift to 31oC.
The Cirbp-CHO promoter out-performed the Cirbp-mouse promoter in the GFP,
EPO and p27 reporter results regarding expression strength and temperature
induciblity.
The SSu72 and both Cirbp promoters appeared to be less temperature sensitive in
luciferase reporter results than in GFP assays, especially compared to the MDM2
promoter which had a very large differential of ~41-fold between 37oC and 31
oC,
which was very encouraging from an inducible viewpoint.
The MDM2 promoter was not effective in driving an EPO product, whereas SSu72
and Cirbp-CHO promoters were.
All promoters successfully drove p27 expression, directly causing an impact on cell
growth; however, this did not improve SEAP productivity.
It was shown that some results in the GFP and Luciferase reporter formats did not
necessarily transmit similar results using more complex proteins like EPO and p27.
It was shown that two typical viral promoter sequences (CMV and SV40) did not
exhibit constitutive expression at different culture temperatures and were
temperature responsive in all four reporter assays.

340
Therefore, CMV and SV40 to a lesser extent are unsuitable controls to use in
temperature shift experiments.
The CMV promoter was shown to more transcriptionally active at 31oC than 37
oC
when transfected into CHO-K1 cells.
Three TFs were identified as having binding sites in all 16 co-expressed genes;
EV1I, SRY and FKHD/FOXO. Further elucidation is needed to see whether they
contribute to the promoter activities seen and the interactions they may have with
one another.
A consensus sequence ‘CCCCAGC’ was also identified across all 16 temperature
sensitive co-expressed genes. Whether this sequence was essential for promoter
functionality remains to be seen and further work is required.
It was shown that viral promoter sequence stability was more susceptible to gene
silencing and unstable at driving GFP expression over an extended culture period
than two of the endogenous promoters used in this study.
It should be a prerequisite to identify the best promoter sequence to drive a gene of
interest before beginning a bioprocess due to different promoter efficacies across
the different reporter platforms.
341
5.9: Future work – Project 1
5.9.1: Promoters from other CHO cell types
The promoters isolated in this study were from the parental CHO-K1 cell line and showed
varying levels of expression, some with great potential. However, it would be interesting to
extract all equivalent promoter fragments from other choice CHO cell types, for example,
CHO-DG44 cell line. Owing to the diversity of different cell lines, coupled with mutations
like SNPs, indels, chromosome or copy number variations, this may provide us with
analogous versions of the promoters from these other cell lines. These analogous promoters
could be better or indeed worse than the promoters from the CHO-K1 cell line.
5.9.2: Clone longer promoter fragments
Although we were restricted by ligations involving larger fragments over ~1.5kb, and the
lack of CHO sequence information at the beginning of the project, as time progressed, the
CHO sequence became easier to navigate using bioinformatics approaches. As a result, it is
now possible to PCR amplify any chosen sequence size upstream of our target genes (Table
3.1.2.1) and re-test for improved activity using the reporter plasmids. Even though our
promoter fragments showed the ability to drive moderate to high expression of various
reporter genes, it may well be that more sequence would illicit more reporter gene activity,
perhaps due to the presence of enhancer elements and other trans-factors. On the contrary,
cloning more sequence may show reduced activity, as extra sequence may contain silencer
regions for example, so a comprehensive study to test various larger constructs is
recommended.
5.9.3: Create stable CHO lines to test activity in fed-batch culture
It would be interesting to generate CHO cells stably expressing an anti-apoptotic or
proliferation gene under the control of the promoters identified in this study and
subsequently test these cells in a fed-batch reactor setting. By controlling the cells using
these promoters, we could aim to increase protein production by controlling advantageous

342
bioprocess genes. We could utilise a biphasic culture by dropping the temperature during
the culture run to potentially boost expression as our promoters have shown increased
expression levels at 31oC, this would in turn also slow cellular growth and direct cell
metabolism towards increased protein output.
5.9.4: Analyse the degree of inducibility of promoters over various temperatures
In the aftermath of identifying CHO and mouse temperature inducible promoters by
reducing the culture temperature to 31oC, we recommend to analyse these promoters in
driving expression of reporter genes at other low culture temperatures. It would be
interesting to observe the level of inducibility of these promoters and see if they can be
‘tuned’ to exhibit varying levels of gene expression. In other words, would we see varying
levels of reporter gene activity by altering the culture temperature at say 33oC or 29
oC
(other noted temperatures for low temperature culture) to see how gene expression responds
to various temperatures. This may facilitate the promoters’ ability for more tunable control
based on adjusting the temperature of the culture at various points of a batch run for
instance.
5.9.5: Viral controls in temperature shift experiments
The use of viral promoters as a comparative control against unknown promoter sequences
is maybe not the best gauge to use in temperature shift experiments owing to their inducible
expression under mild hypothermia conditions of 31oC. In each case the CMV and SV40
viral show increased expression at 31oC compared to 37
oC.
So these promoters contain discrete sequence information discerning cold-inducible
expression, infact many enhancer and other functional sequences making up a typical
vector construct have viral-origin sequences, even the polyA termination sequence in the
luciferase pGL3-control vector could play a role in temperature shift.

343
It would be interesting to observe the behaviour of a range of virus-derived sequences and
their response to temperature shift.
5.9.6: Transcription factors further work
We identified some unusual transcription factors especially the 3 TF’s common to all 16
temperature sensitive promoter sequences; SRY, FKHD and EVl1. If they are indeed
responsible for the promoter functionality we see throughout the project, then all 3 are
attractive for future genetic engineering. We propose that modulating transcription factor
amplification through vector transfections, could be used in conjunction with our
promoters, as shown by Mangalampalli et al, where they co-transfected the Mouse
Mammary Tumor Virus Promoter system with another vector expressing its specific
transcription factor (glucocorticoid receptor). Increased production of SEAP resulted from
CHO cells grown in increased concentrations of methotrexate supplemented into the
growth media (Mangalampalli et al. 2002).
Ideally mutational studies, for example; the GeneTailor™ kit from Invitrogen should be
used in conjunction with the 3 TFBS, to alter the binding sites within the CHO promoters to
test if this has a knock on effect to the expression levels. Additionally, we could use the
‘Electrophoretic mobility shift assay’ (EMSA) approach to confirm transcription factor
binding. This procedure can determine if a protein or mixture of proteins is capable of
binding to a given DNA or RNA sequence sequences which have bound to the TF for
example will migrate slower due to increased mass (Moxley and Jarrett 2005) (Smith and
Humphries 2009) (Nagore et al. 2013).
Finally, a notable consensus sequence ‘CCCCAGC’ was found in all 16 co-expressed gene
promoters (Figure 3.4.3), while a temperature responsive MCRE element was seen in the
mouse Cirbp promoter sequence, also reported by (Sumitomo et al. 2012) (Higashitsuji et
al. 2012). They showed that the MCRE binds to SP1 and contributes to expression
induction at 32oC. The group further duplicated the sequence (MCRExx48), when placed
upstream of luciferase reporter it promoted >2-fold increases in luciferase expression. If the
consensus sequence we identified was shown to be crucial to induciblity or responsible for

344
the moderate to high expression of reporter genes, then similarly duplication of this
sequence would be a possible future endeavour to increase expression further.

345
Section 6.0
Project 2 -
Discussion, Future Work &
Conclusions

346
6.1: XIAP – potential as an anti-apoptotic bioprocess target in CHO cells
Over the last decade, there has been a steady increase in the volume of studies exploring the
use of gene engineering strategies in order to improve various aspects of CHO cell
performance in a bioreactor (Figueroa et al. 2007) (Lee et al. 2009) (Doolan et al. 2012)
(Mariati et al. 2014b).
Recently, a member of the inhibitor of apoptosis (IAP) proteins family has attracted more
interest (Eckelman, Salvesen and Scott 2006). XIAP was shown to inhibit activation of
members of the caspase family of cell-death proteases, namely caspase-3, caspase-7 and
caspase-9 (Smolewski and Robak 2011). As a result, apoptosis can now be regulated by
targeting anti-apoptosis genes such as XIAP and Bcl-2 (Lee et al. 2012). Furthermore, due
to their prominent ability to control cell death and elevated expression in a variety of cancer
cell types, IAP proteins are attractive gene targets for the development of novel anti-cancer
treatments (Hunter, LaCasse and Korneluk 2007) (de Almagro and Vucic 2012). However,
we aimed to address this from a more bioprocessing perspective, in particular improving
biologic production by CHO cells.
XIAP was identified as a potentially interesting engineering target based on data generated
in a cancer project that was ongoing in the NICB labs. That work established that XIAP
expression correlated with faster growth and a more invasive phenotype in Glioblastoma
(GBM) cells, therefore we hypothesized that XIAP manipulation via overexpression could
affect CHO cell culture behaviour, maybe beneficially.
6.2: Stable overexpression of XIAP in CHO exhibit beneficial phenotypes
When XIAP was stably overexpressed in CHO cells, the general propensity was for cells to
reach higher growth densities and have longer viability in culture while maintaining cellular
homeostasis. Such phenotypes are actively being sought for bioprocessing engineering to
increase batch productivity and yield (Wong et al. 2006)(Dorai et al. 2010)(Wei et al.
2011). These effects were observed to a greater or lesser extent depending on various
factors, including the amount or degree of XIAP overexpression in a particular clone

347
(covered in later sections), the culture environment (media type/additives) and the culture
format. We observed the effect of XIAP overexpression on CHO cell behaviour under
apoptosis-inducing conditions (day 9 spent media and NaBu addition) and in adherent
(Figure 4.2.2.1) and suspension (Figure 4.2.3.1) culture further validating these phenotypes.
In previous studies, XIAP overexpression was shown to inhibit activities of caspase 3, 7
and 9 in CHO-K1 cells and offered protection against etoposide (a cytotoxic anticancer
drug), spent media-induced apoptosis and Sindbis virus infection and subsequently showed
improved cell viabilities by 9-12% 48 hours post-infection (Sauerwald, Betenbaugh and
Oyler 2002) (Sauerwald et al. 2006). Kim et al followed up this inquiry by researching the
impact of XIAP overexpression in recombinant CHO (rCHO) cells producing EPO and
treated with sodium butyrate (NaBu) to induce apoptosis. This was similar to our method of
inducing apoptosis, however, unlike our results which showed XIAP overexpression
circumventing NaBu-induced apoptosis to some degree, Kim et al showed that XIAP
overexpression could inhibit Sindbis virus-induced apoptosis but not inhibit NaBu-induced
apoptosis, as evidenced by DNA fragmentation. They concluded that XIAP overexpression
did not affect cellular growth nor EPO production significantly, suggesting that the release
of mitochondrial proteins might induce caspase-independent apoptosis, which may explain
the specificity of apoptosis inhibition within the cells (Kim and Lee 2009).
In addition, NaBu has also previously been shown to increase the specific productivity and
mRNA transcription in CHO cells (Jeon and Lee 2007) (Jiang and Sharfstein 2008) (Hong,
Lee and Yoon 2011). There is a fine line between adding too much NaBu and not enough,
as too much induces apoptosis (>10mM) while the optimal butyrate concentration for
productivity was observed to be ~2/3 mM. Mimura et al showed 2-4 fold increase in
productivity of chimeric recombinant IgG when using 2mM NaBu supplemented to CHO-
K1 cells in culture while not compromising either glycosylation or biological activity
(Mimura et al. 2001). More recently, Jeon et al reported that 1-2mM resulted in a 55%
increase in human thrombopoietin (hTPO) productivity whereas 5-10mM was needed for a
more cytotoxic effect to induce apoptosis (Jeon and Lee 2007).

348
Conversely, our results indicate that CHO cells overexpressing XIAP exhibited an increase
in cell growth and higher viabilities than controls over extended time (usually 12-15 days)
in various batch culture formats under apoptosis inducing conditions. This conflicting result
may be due to a number of reasons. Kim et al used a regulated XIAP overexpression (Tet-
off-XIAP) construct tightly regulated by doxycycline, whereas for Sauerwald et al and
ourselves, XIAP was constitutively overexpressed with both groups seeing increased
viability (Sauerwald et al. 2006).
Moreover, Sauerwald et al and Dorai et al used a XIAP variant, which retained the BIR
domain but the C-terminal RING domain was absent (Dorai et al. 2009), whereas Liew et al
and ourselves on the other hand used the full length XIAP transcript. We are unsure as to
why we see contrasting results regarding growth and viability, however, it is more likely to
be due to a different cell death mechanism such as rather than this XIAP transcript
discrepancy, perhaps originating from mitochondrial membrane potential (MMP) as
suggested by ( Kim and Lee 2009) (Liew et al. 2010). For instance, it is now accepted that
apoptosis does not function alone in determining the fate of a cell (Booth et al. 2014).
Several death initiator and effector molecules, signalling pathways and subcellular sites
have been identified as key mediators in both processes, either by constituting common
modules or alternatively by functioning as a switch allowing cells to decide which route to
take (Nikoletopoulou et al. 2013), therefore we can assume that the interplay between these
processes and molecules can alter phenotypes perhaps leading to the varying results
observed among publications.
Originally, the function of many of these apoptotic pathway proteins was believed to be
binding the mitochondria and regulating apoptosis through modulation of mitochondria
permeability. Mitochondria are at the core of all apoptosis pathways and are effectively
targets themselves for cell engineering, owing to their essential role in aerobic respiration.
Mitochondrial proteins called SMACs (small mitochondria-derived activator of caspases),
bind to IAPs and deactivate them (Eschenburg et al. 2012). Furthermore, apoptosis pathway
proteins in other organelles, other than mitochondria, within the cell may also both
modulate apoptosis and metabolism adding to the potential for apoptosis-independent
phenotype variations (Majors et al. 2007).

349
Our efforts did not examine caspase activity or mitochondrial membrane potential,
however, we examined cell behaviour over longer culture periods in comparison. For
example, Liew et al only tested cell behaviour over 5 days, viability of their control cells
dropped to 40% after 2 days of serum deprivation, with the XIAP expressing cells
maintaining up to 90% viability (Liew et al. 2010). We have shown that this impact can be
extended to longer durations, mirroring those used in commercial bioprocesses.
6.3: XIAP overexpression is directly linked to anti-apoptotic behaviour in CHO
Cellular death can be divided into apoptosis, autophagy and necrosis. Apoptosis is
morphologically and biochemically distinct from necrosis or autophagy and can be treated
as a separate process (Krysko et al. 2008). For our analysis we did not focus on autophagy
or necrosis, however, we are aware that all three processes and the crosstalk between them
are important to understanding overall cell death behaviour.
Having observed beneficial phenotypes attributed to XIAP overexpression in CHO cell
clones, we wanted to examine if this specifically correlated with cellular apoptosis levels.
We tested XIAP clone 12 in attached and suspension culture once again, and used the
Nexin® assay to measure cells undergoing different stages of apoptosis (Figure 4.2.5.1).
The most obvious impact was a tendency for cells to reach higher cell densities as expected,
but also to be somewhat resistant to apoptosis later in culture – despite tending to be more
prone to apoptosis earlier (Figure 4.2.5.1). We were unsure as to the reason for this
observation: is it dosage dependant? In other words, is there too much XIAP being
expressed earlier in culture from the plasmid coupled with the already relatively high
endogenous levels of XIAP in CHO cells shown from the initial western result (Figure
4.1.4).
Although, XIAP is often overexpressed in cancer cells, where it plays a key role in survival
and also promotes invasiveness, the extracellular signals and intracellular pathways
regulating its expression and activity remain poorly understood. We also do not know if
XIAP expression is fluctuating or is being constitutively expressed at any given point in
time within CHO cells.

350
To estimate the dosage/expression of XIAP at various stages of batch culture would be
interesting and mapping the XIAP levels over a timecourse may answer this question. For
example, Gu et al demonstrated that the upregulation of XIAP protein levels is regulated by
MDM2 at the translational level.
This was interesting as the MDM2 promoter was one of our candidate inducible promoters
identified from project 1, and we have shown that MDM2 gene expression is controlled by
a temperature sensitive promoter. The MDM2 protein has been shown to physically interact
with the IRES of the XIAP 5'-UTR, and to positively regulate XIAP IRES activity. This
XIAP IRES-dependent translation was significantly increased in MDM2-transfected cells
where MDM2 accumulated in the cytoplasm (Gu et al. 2009). Although project 1 focuses
on the MDM2 promoter, rather than the MDM2 protein, it begs the question, what happens
to XIAP levels post-temperature shift? Knowing that MDM2 transcription is activated – i.e:
presumably more MDM2 protein, then would XIAP protein translation be increased or
even impacted due to this? Is it the same biochemical pathway or a closed circuit?
Interesting, but further study would be necessary to establish its relevance to CHO cell
culture.
It should be noted that, comparing apoptosis values between clone 12 and RFP-Control cell
populations was difficult, owing to the RFP-Control samples having much lower cell
densities over all timepoints. Clone 12 cultures presumably depleted the media quicker than
RFP-Control as a result. This may be the reason for the observation that during early-mid
culture, the control cells were less inclined to become apoptotic due to ample carbon source
availability and limited waste product accumulation. One the other hand however, once
both cultures had depleted the media and culture conditions had deteriorated the presence
of excess XIAP conferred a survival advantage on the engineered cells. XIAP was deemed
to have a direct link to apoptosis resistance over all timepoints tested but was found to only
be statistically significantly at later stages of culture (9-12 days) (Figure 4.2.5.1).
In summary, these experiments have suggested that XIAP is potentially a target for
apoptosis engineering in advanced culture when overexpressed in CHO cells.

351
6.4: Targeting XIAP with siRNA reverses the beneficial phenotypes
To provide additional evidence of XIAPs role in the observed phenotypic changes we used
a siRNA targeting XIAP. By knocking down XIAP we expected to reverse the
survival/growth benefit exhibited by clone 12, and to see if XIAP was responsible for these
changes, in two different suspension formats (Figures 4.2.6.1 and 4.2.6.2).
The data showed that targeting XIAP by RNAi significantly impacted the growth and
viability of both XIAP clone 12 as well as the CHO-K1 cell line (Figure 4.2.6.1). The
CHO-K1 cell line was tested in parallel as it was shown previously that XIAP expression
was relatively high in actively growing CHO-K1 cells. Are the above normal XIAP levels
seen a reason for CHO cells to be robust and resilient as is the general consensus?
As regards to cell viability, the impact of XIAP knockdown was seen as early as day 2 in
both cell lines in 24-well and 2mL formats. For growth, this impact was not shown to be
significant at day 2 in culture for either cell line nor suspension culture format, but was by
days 4 and 6. The viability of CHO-K1 cells on day 6 transfected with siXIAP dropped 5%
lower than the siVCP treated cells which highlighted that treatment with siRNAs targeting
XIAP really does hinder the viability phenotype compared to the siNeg control treated
cells. VCP is a well-established RNAi control in the NICB labs, which obliterates CHO
cells in culture when knocked down. The fact that XIAP knockdown caused a more potent
effect is striking.
In conclusion, we saw that XIAP depletion through RNAi caused a reverse in phenotypic
effect on both the XIAP clone 12 and parental CHO-K1 cell densities compared to a siNeg
control. Late culture exhibited the most significant cell count changes overall and by day 6
the XIAP knockdown was more obvious from the western blot also (Figure 4.2.6.3) thus
confirming the functional role of XIAP in impacting cell growth, survival and resistance to
apoptosis. Other groups have reported comparative results of XIAP knockdown affecting
growth and apoptosis sensitivity in human cancer cells, for example, Shi et al showed that
luteolin (a dietary flavonoid commonly found in some medicinal plants) sensitizes TRAIL-
induced apoptosis through down-regulation of XIAP (Shi et al. 2005).

352
Spee et al reported that specific down-regulation of XIAP with RNAi enhances the
sensitivity of canine tumor cell-lines to TRAIL and doxorubicin thereby reducing growth
(Spee et al. 2006). Furthermore, Cho et al investigated the effect of GTP-binding proteins
(Gαs) on apoptosis triggered by cisplatin and its underlying molecular mechanism in
cervical cancer cells and showed XIAP knockdown by siRNA augmented apoptosis. They
concluded that Gαs inhibit cisplatin-induced apoptosis by increasing transcription of XIAP
and by decreasing degradation of XIAP protein in HeLa cervical cancer cells (Cho et al.
2014).
Clonal heterogeneity is always a concern when studying CHO cell behaviour (Dahodwala
et al. 2012) (Ghorbaniaghdam et al. 2014). Therefore, we investigated the possibility that
the phenotypes observed throughout the growth and viability timecourse assays were a
result of a single clonal effect of XIAP overexpression, having focused on one particular
clone (Clone 12) for the majority of the batch runs. As our results show, clone 12 exhibited
higher cell densities while remaining healthier over extended culture, than the control
(RFP) mixed populations up to 9-15 days and across varying culture formats.
Having isolated 3 more clones overexpressing XIAP (5, 10 and 11), we grew them over 15
days alongside clone 12 and the RFP-Control cells in a repeat experiment. All 3 clones
perform in a similar fashion to clone 12 in 24-well suspension format (Figure 4.2.3.1.1 A),
and suggested that initial observations for clone 12 were not due to a clonal specific
anomaly.
Clonal variation among CHO cells has been analysed using transcriptomics by a group in-
house to understand the mechanisms underlying bioprocess phenotypes; they focused on
clonal growth rate variation during CHO cell line development. Using differential
expression and correlation analysis they identified a high priority group of 416 transcripts
(190 upregulated; 226 downregulated) associated with growth rate, highlighting the
heterogeneity among clones when generating producer cell lines (Doolan et al. 2013).

353
6.5: Effect of XIAP overexpression on productivity
Bioprocess engineering often focuses on growth/proliferation strategies to improve
productivity as seen in a review by Kumar et al, for example; the role of cyclin dependent
kinases (CDKs) and temperature shift to control the growth pathways/transitions while Bi
et al, show that the average cell volume of arrested cells was approximately fourfold greater
than that of proliferating cells (Bi, Shuttleworth and Al-Rubeai 2004) (Kumar, Gammell
and Clynes 2007). Alternatively, yields can be improved by targeting pathways, for
example, mTOR kinase signally pathway {{22 Dreesen,I.A. 2010;}}, in order to increase
CHO cell specific productivity, while examples of targeting pathways/genes via miRNAs
is becoming more prevalent (Park et al. 2012) (Strotbek et al. 2013) (Fischer et al. 2014).
The improvements in culture behaviour shown by the XIAP overexpressing clones during
this project ultimately translated into improved yield of various types of recombinant
protein products both transiently and in stable producer lines. In lieu of this we also
examined whether XIAP engineering impacted cell-specific productivity of SEAP, EPO
and IgG.
It was shown that XIAP overexpression had no significant impact on cell-specific SEAP
productivity however volumetric SEAP yield was increased (Figure 4.2.7.1.1). Therefore,
the increase in SEAP yield must be due to the higher clone 12 cell numbers. EPO protein
levels were shown via western blot to be increased in clone 12 cells compared to the RFP-
Control cells over 14 days in culture (Figure 4.2.7.2.1). From a bioprocess point of view,
this validated that using an XIAP stable cell line (clone 12) versus a control CHO-K1 cell
line was better in producing EPO and could be used to increase product titres. We also
converted EPO band intensities to numerical values via densitometry analysis and found
that EPO levels were higher in XIAP clone 12 samples on days 4, 7 and 12 compared to
RFP-Control samples (Figure 4.2.7.2.2). This analysis provided further quantitative
evidence that clone 12 cells did indeed produce more EPO than the RFP-Control cells.
There are a few reports on the link between XIAP expression and productivity. Becker et al
reported that co-expression of both XBP-1 and XIAP genes resulted in a higher titer of IgG
in a serum-free medium than expression of either gene singularly (Becker et al. 2010).

354
Similar studies have shown that overexpressing anti-apoptotic genes such as, Aven and
E1B-19k also increased survival and resistance to apoptosis, with reduced annexin-V
binding compared to controls (Nivitchanyong et al. 2007) (Dorai et al. 2010). Similarly,
Figueroa et al found that stable transfected pools of CHO cells engineered to express either
Aven or E1B-19K alone were found to survive 1-2 days longer than the parent cell line
following glucose deprivation while the expression of both genes in concert increased cell
survival by 3 days. In their spinner flask batch studies, a clonal isolate engineered to
express both anti-apoptosis genes exhibited a longer operating lifetime and higher final
monoclonal antibody (MAb) titer.
Much like what we reported for EPO, SEAP and IgG titers, they found that maximum titers
of MAb were increased by 40-55% in bioreactors containing cells expressing both Aven
and E1B-19K compared to cells expressing each singularly. Furthermore, as with our
findings, these increases in volumetric productivity arose primarily due to enhancements in
viable cell density over the course of the fed-batch culture period since the specific
productivities for the cells expressing anti-apoptosis genes were comparable or slightly
lower than the control CHO cells (Figueroa et al. 2007).
So one thing is apparent, co-expressing anti-apoptotic genes appear to be more beneficial
overall. This was encouraging from our perspective as we only concentrated on one gene,
however, there might be opportunity for further improvement if we were to express another
anti-apoptotic gene in CHO cells, along with XIAP.
Tey et al found that exposure of CHO cells to ammonia toxicity via thymidine treatment
revealed the relative robustness of Bcl-2 transfected cells. Growth was arrested by
treatment with 4 mM thymidine, Bcl-2 overexpressing cells exhibit a viability of over 80%
after 5 days in culture, compared to only 40% in the control cell line (Tey et al. 2000).
Interestingly, measuring titers of a chimeric antibody they reported that under growth-
arrested conditions, there was no major difference in specific productivity of the antibody
between the two cell lines, this was analogous to our IgG results.
One aspect which we may have overlooked in comparison is that they showed that the
mean level of Bcl-2 expression in the overexpressing population also declined significantly,

355
presumably reflecting the exhaustion of precursors for protein synthesis following nutrient
depletion. We did not monitor XIAP expression levels over time like they did so we do not
know how XIAP behaved as time progressed. Conducting and experiment to capture XIAP
expression levels over extended culture, using gene expression analysis via qRT-PCR may
provide this answer.
Dorai et al, also experimented in overexpressing E1B-19K, Aven, and more specifically a
mutant of XIAP (EAX197), they saw a reduction in caspase 3 activity of at least 60% and a
170% enhancement in mitochondrial membrane potential (MMP) compared to controls
when treated with staurosporine (inhibitor of protein kinases through the prevention of ATP
binding to the kinase) (Dorai et al. 2009). The capacity of the apoptotic resistant cell lines
to consume lactate was exploited by cultivating them in a ‘high’ glucose medium
containing 15 g/L (60 mM glucose) in which apoptotic resistant cell lines exhibited lower
maximum lactate (1.8 g/L) compared to control cell lines which accumulated
concentrations of lactate (2.2 g/L) that subsequently appeared to be deleterious for growth.
They also reported titers of a therapeutic antibody product expressed in the said apoptotic
resistant cell line in ‘high’ glucose medium, titers reached 690 mg/L in apoptotic resistant
cells compared to 390 mg/L for a cell line derived from a control host cell line. This was
the first example in the literature in which manipulation of the apoptosis pathway led to an
altered nutrient consumption profile of CHO cells in culture (Dorai et al. 2009).
Furthermore, cells arrested in G1 phase can exhibit more specific productivity (Qp) as
shown by groups Hackl et al, and Sanchez et al. Over expressing miR-7 arrested CHO cell
growth for a period of 96 hours leading to increases in normalised productivity per cell
albeit less than temperature shift studies carried out similarly. With the latter showing that
using a novel sponge decoy approach was able to divert (soak up) endogenous miR-7, and
they further showed that the reverse of this phenotype could increase maximum viable cell
density, leading to increases in productivity (Hackl et al. 2012) (Sanchez et al. 2013).
Enzymes, such as proteases and sialidases, accumulate in batch bioreactors. These enzymes
are known to be detrimental to the quality of recombinant glycoproteins. Therefore, product
quality in bioprocessing is another issue that frequently causes concerns, this is often made
worse by manipulation of an otherwise predetermined natural process, be it an endogenous
356
gene/pathway or external environment change. For example, temperature shift or osmotic
stress were both explored regarding the impact they cause on product quality when
producing tissue type plasminogen activator (tPa) (Clark, Chaplin and Harcum 2004) (Han
et al. 2010). Recently, Yang et al found that using perfusion seed cultures can optimise
capacity utilization and improve process efficiency by increasing volumetric productivity
while maintaining or improving product quality. They used three different CHO cell lines
producing Fc fusion proteins and monoclonal antibodies and where titers were increased
there was no significant deterioration in product quality (Yang et al. 2014).
Therefore, it is reasonable to believe that any undertaking which may cause cellular stress,
leads to unwanted cell death, often resulting in cell debris in culture media for example
after degradation. As a result, care must be taken to ensure product quality is not
compromised. Stressed conditions that can be shown to exhibit beneficial phenotypes such
as growth and productivity as shown by Yoon et al, with EPO production, can invariably
lead to stressed reactions by the cells used such as; loss of sialyation and formation of
inclusion bodies affecting protein quality once undergone downstream processing.
Therefore, increases in production, minus introducing a manipulation step causing cellular
stress could obviously provide an improved route to increase productivity (Yoon, Hwang
and Lee 2004).
This is why we believe that the overexpression of XIAP in stable clone 12 especially, can
be useful in a process setting. Clone 12 displayed two beneficial bioprocess phenotypes
(increased growth rate and decreased apoptosis) that presumably do not put a transfection
or any additional stress load onto the cells at a gene level and can be used as a productivity
cell line in its natural state (with scope to make perhaps further adjustments to improve the
cell line further).
In conclusion, these results, demonstrate that XIAP overexpression in CHO lines can be
beneficial in increasing productivity of therapeutic and reporter proteins, while keeping
genetic manipulation to a minimum. It would be interesting to combine the findings from
each Project to investigate the temporal overexpression of XIAP later in culture in response
to temperature shift, by placing it downstream of the promoters identified in project 1.
357
6.6: Targeting XIAP using ncRNAs as a route to CHO cell engineering
MicroRNAs are strongly implicated in the global regulation of gene expression, and
consequently affect diverse metabolic pathways across many species. This characteristic
makes miRNAs promising targets for cell engineering, while a key advantage of miRNAs,
in contrast to most cell-engineering approaches that rely on overexpression of regulatory
proteins for example, is that they do not compete for the translational machinery that is
required to express the recombinant product (Muller et al. 2008) (Hackl et al. 2011).
Therefore, the second part of project 2 considered the possibility of whether XIAP (from
CHO and human) is subject to miRNA regulation, with a view to increasing productivity
via interplay between miRNA and gene expression.
The cancer project referred to earlier, not only identified XIAP expression as being
correlated with proliferation rate and invasiveness potential of a panel of Glioblastoma
(GBM) cell lines but also that XIAP was a direct target of miR-23b (Figure 4.3.1.2).
Additionally, along with miR-23b, recently other miRNAs have also been shown to target
XIAP such as miR-130, miR-24, miR-7 and miR-519d (Zhang et al. 2013) (Xie et al. 2013)
(Liu et al. 2013a) (Pang et al. 2014). Furthermore, miRNA targeting could be an attractive
route to regulate XIAP without exogenous expression derived from plasmid transfections.
Over the last decade, approaches using other small RNAs i.e: siRNAs, which target XIAP
have shown immediate impacts on human cancer cell phenotypes such as decreased
viability and growth. Often the goal of such siRNA or miRNA based approaches is to
sensitize cancerous cells by knocking down an important gene and simultaneously adding
chemotherapeutic agents such as doxorubicin and TRAIL (McManus et al. 2004) (Spee et
al. 2006), analogous to the findings of Shi et al, whereby they showed that luteolin (a
dietary flavonoid) treatment sensitizes cells to TRAIL-induced apoptosis through down-
regulation of XIAP in HeLa cells (Shi et al. 2005). Our group also observed that XIAP
targeting by a miRNA (in our case miR-23b) sensitized GBM cells to docetaxel treatment
(unpublished data).
Similarly, Pang et al found recently that miR-519d was also capable of sensitizing ovarian
cancer cells to cisplatin-induced cell death by targeting the XIAP transcript and suppressing

358
cellular proliferation, suggesting that miR-519d plays a tumor-suppressive role in human
ovarian cancer (Pang et al. 2014).
The fact that such an important regulatory protein like XIAP can be targeted by siRNAs
and miRNAs provides the basis for the second part of this project, which focused on the
miR-Capture technique. This technique was used to identify potential miRNAs that may
bind to XIAP mRNA and thus allow us to consider an alternative engineering option for
XIAP regulation and will be addressed in more detail in the next section.
6.7: MiR-Capture - to identify miRNAs targeting predetermined mRNAs
Although the miR-Capture technique was described previous by (Hassan et al. 2013), it was
never utilised in CHO before. By performing the XIAP mRNA capture method we wanted
to establish a connection between XIAP overexpression engineering (shown from the first
part of this project) and miRNA engineering (more specifically the miRNAs that interact
with XIAP) in CHO and human, with a view to potentially improve bioprocessing
characteristics overall. Having realised XIAP manipulation can impact on CHO cells,
knowing the miRNAs which regulate XIAP from both species, might provide an alternative
method of controlling endogenous XIAP expression and see which miRNAs are common
between species.
By carrying out a novel MiR-Capture technique, our aims were two-fold. Firstly, to further
validate the interaction between XIAP and ‘real’ miRNAs via bona fide validation using an
affinity capture technique. It is well known that existing software algorithms for prediction
of microRNA-mRNA interactions suffer from considerable false positive rates. A recent
study by Maccani et al highlighted the urgent need for reliable CHO-specific microRNA
target prediction tools and experimentally validated target databases in order to facilitate
functional analysis of high-throughput microRNA expression data in CHO cells (Maccani
et al. 2014). Secondly, we were afforded an opportunity to investigate and compare human
(SNB-19) versus CHO XIAP mRNA homologues to test if they interact with a similar sub-
set of miRNAs and complete the first study of its type using CHO specific sample lysates.

359
This would also be interesting as the mRNA transcripts for CHO and human (SNB-19) are
quite different in size but are reasonably conserved (>60%) at a DNA level.
Investigating this would not only provide better primary understanding of the molecular
mechanisms of XIAP expression control by miRNAs, but also potentially identify
alternative ‘upstream’ routes to manipulating XIAP levels in given cell types without
necessarily overexpressing the protein as an exogenous transgene. In other words, if we
could identify miRNAs that regulate XIAP then they in turn might be used as future tools
to alter endogenous XIAP levels. As briefly mentioned, the advantage of this approach,
from a bioprocessing perspective, is that miRNA-based engineering avoids the added
metabolic burden of translating another competing transgene (XIAP in this case). For
example, by depleting the levels of a miRNA known to repress XIAP, the expression of the
endogenous XIAP protein should increase.
We are witnessing a shift from gene engineering to miRNA engineering with recent
publications substantiating this, for example, Strotbek et al performed a genome wide
functional miRNA screen by transient transfection of CHO cells stably expressing an IgG1
antibody (CHO-IgG1). They identified 9 human miRNAs that improved productivity,
whilst retaining product quality, not only of the CHO-IgG1 cells but also of CHO cells
expressing recombinant human serum albumin (HSA), hinting that miRNAs can act in a
product-independent manner (Strotbek et al. 2013).
This would appear beneficial as the opposite was reported recently by Maccani et al
regarding exogenous gene expression, they suggested that the reaction of CHO cells to
heterologous protein expression is strongly product- and/or clone-specific (Maccani et al.
2014), though our data using XIAP does not support this observation. Encouragingly
however, our broad analysis identified both an anti-apoptotic gene target and numerous
miRNA targets from the miR-Capture.
Jadhav et al also reported on the effect of various miRNAs transiently and stably
transfected into CHO cells and their impact on various phenotypes. They found that CHO
cells stably engineered with miR-17 exhibited both enhanced growth performance and a 2-

360
fold increase in specific productivity, which resulted in a 3-fold overall increase in EPO
titer (Jadhav et al. 2014).
Interestingly, from our analysis, miR-17 was pulled down with XIAP in the CHO-K1
lysate, but not in the SNB-19 lysate (Figure 4.3.5.2). However, careful annotation of the
3’UTR of CHO-XIAP (Figures 4.1.3.1 and 4.1.3.2) revealed a substantially shorter (~2kb)
sequence than in human and indeed other rodent species (Figure 4.1.3.3), therefore this may
be partially attributed to miR-17 or indeed any orthologous miRNA not being present in the
CHO sequence, as miR-17 is predicted to bind the human XIAP 3’UTR at nucleotide
positions 5069 and 5677. In other words, due to the disparity between human and CHO
XIAP 3’UTR sequences and the fact that the sequences match at interspersed regions
(Figure 4.1.3.3), there was no way to fully elucidate or map the presence or lack thereof of
certain miRNAs without further functional validation irrespective of in silico prediction.
Equally constraining is that currently all prediction software haven’t been fully updated to
contain CHO miRNA information.
The miR-Capture technique was optimised to pulldown XIAP mRNA specifically along
with miRNAs bound to it; this was followed by a comparison between CHO and human
cell lines to identify miRNAs targeting XIAP. Four miRNAs were identified common to
both cell lines [miR-124, miR-877, miR-526b*, miR-760]. None of the 4 miRNAs detected
in both cell lines have previously been associated with XIAP or CHO in the literature but
all were predicted to bind to XIAP in silico (Table 4.3.5.2).
Furthermore, there were also 12 more miRNAs detected in the SNB-19 capture, and
obvious questions would be to ask, can this discrepancy in miRNAs detected between both
cell lines be explained by the differences in CHO-XIAP sequence versus the human-XIAP
sequence? And does the 2kb difference in sequence size account for more miRNA binding
as we envisaged? To help interpret the results of the miR-Capture, we compiled a table
dividing up the lists of miRNAs into various categories depending on which samples they
were detected (or not detected) (Table 6.7).

361
Table 6.7: Categories of miRNAs from miR-Capture experiment. Six scenarios of why
miRNAs made the list from figure 4.3.5.2. * denotes an exception where miRNA may have
been pulled down but wasn’t detected in the total lysate.
Categories of miR-Capture miRNA detection:
In total lysate Predicted in silico Pulled down Ex: miR-124
In total lysate Predicted in silico Not pulled down Ex: miR-24
In total lysate Not predicted in silico Pulled down Ex: miR-135a*
In total lysate Not predicted in silico Not pulled down Ex: miR-553
Not in total lysate* Predicted in silico Pulled down Ex: miR-323-3p
Not in total lysate* Not Predicted in silico Pulled down Ex: miR-801
Various miRNAs predicted to bind XIAP may not have been detected because they simply
were not detected in the cell lysates. We can check this by looking at the TLDA output for
the total capture sample for a given miRNA. For example, as shown, miR-222 was detected
in the SNB-19 total and XIAP-capture lysates, additionally it was detected in the CHO total
lysate but not in the CHO XIAP-capture or indeed the non-specific oligo capture. In this
case miR-222 was present in CHO cells extracted at that point in time but was not pulled
down in the capture. It would be interesting to repeat the entire experiment with SNB-19
and CHO-K1 cells at various time points of culture and see if the milieu of miRNAs differ
from what was observed here.
On the contrary, 6 miRNAs (miR-135a*, miR-768-3p, miR-801, miR-923, miR-20a and
miR-572) were detected from the pulldown but were not predicted to bind to XIAP in silico
which again highlights the frailties of computational approaches (Figure 6.7). For example
upon inspection, the levels of miR-135* were found to be relatively high in total, NSO and
capture XIAP lysates compared to other miRNAs that were predicted to bind in silico. This
observation may have been due to non-canonical miRNA-mRNA binding which is not
detectable using current prediction algorithms but has been demonstrated to occur in nature
(Li and Yao 2012) (Pasquinelli 2012).

362
Figure 6.7: Venn diagram showing number of miRNAs predicted to bind in silico versus
miRNAs that were actually pulled down and detected from the miR-Capture and
overlapping miRNAs.
Once the miR-Capture was completed, we performed a literature search to link some of the
most promising miRNAs, starting with the four common ones and their involvement with
growth and apoptosis regardless of cell type.
MiR-124 featured in recent publications regarding reductions in growth of human cancer
cells. Zhang et al found that ectopic expression of miR-124 in transplanted HT1197 cells
resulted in the retardation of tumor growth in mouse tumor xenografts, and the expression
of miR-124 and CDK4 showed an obvious inverse correlation in these xenograft tissues
suggesting that miR-124 can arrest cell cycle and restrain the growth of bladder cancer by
targeting CDK4 directly (Zhang et al. 2014). Additionally, Silber et al found that targeted
delivery of miRNA-124 to glioblastoma multiforme tumor cells inhibited proliferation of
the cells and in parallel induced differentiation of brain tumor stem cells and therefore may
be therapeutically efficacious for the treatment of this disease (Silber et al. 2008).
MiR-526b* was reported as a placental specific miRNA in numerous studies (Miura et al.
2010) (Kotlabova, Doucha and Hromadnikova 2011) and more recently was shown to be
involved in fetal growth restriction (FGR). The expression levels of six other placenta-
specific miRNAs including miR-526b* (hsa-miR-518b, hsa-miR-1323, hsa-miR-516b, hsa-
miR-515-5p, hsa-miR-520h, hsa-miR-519d), were significantly lower in placentas from
FGR pregnancies than in placentas from uncomplicated pregnancies (Higashijima et al.
2013). These other miRNAs listed were not identified from our miR-Capture, in other

363
words, were not co-captured with XIAP and miR-526b*. As growth was affected by miR-
526b* in an opposite fashion (shown to be less expressed) than say miR-124 which when
highly expressed inhibits growth of cancer cells as mentioned previously, thus it was
interesting that miR-526b* was moderately expressed in both cell lines. Mir-877 expression
was not related to growth phenotypes but rather found to be associated with paclitaxel-
induced apoptosis in hepatocellular carcinoma cells (HCC) (Yan et al. 2013).
Interestingly, miR-23b was not detected in the XIAP pulldown which was somewhat
surprising as previous results suggested it targets XIAP. It has been shown by Garcia et al,
that two properties of this miR-23b may explain this finding. Their analysis uses seed-
pairing stability (SPS) and high target-site abundance (TA) and miR-23b was shown to
have unusually weak seed regions (an abundance of A/U bases), low SPS and high TA
(Garcia et al. 2011). Therefore, miR-23b may not bind strongly enough to be pulled down
during the miR-Capture procedure. Of course it could also simply be explained by the fact
that even in the total lysate samples miR-23b was not detectable. Many miRNAs that were
not detected in the capture lysates were detected in the total lysates – as would be expected
using a technique that is specific for one mRNA target. Other miRNAs that were predicted
to bind to XIAP but not captured by miR-Capture such as; miR-130a (Zhang et al. 2013),
miR-7 (Liu et al. 2013a), miR-519d (Pang et al. 2014), miR-220c (Ren et al. 2014), and
miR-24 (Xie et al. 2013) have all been reported as regulating XIAP, largely in human
cancer cell types.
For in silico prediction we used the mirWalk database as it scans all other existing
databases such as TargetScan® and miRanda®, and allowed us to search the entire mRNA
sequence, whereas most other miRNA prediction databases are restricted to the 3’UTR
region. The database contains information based on predicted miRNAs as well as
frequently being updated when functionally validated miRNAs are published in the
literature (Dweep et al. 2011). MirWalk specifically uses a prediction approach whereby it
identifies a strong seed region and ‘walks out’ to identify more complementary sequence
and then assigns a score based on this affinity. In other words, miRNAs such as miR-135a*
may not be predicted based on the binding criteria of the mirWalk software.

364
Recent publications have reviewed the extent of these wide-ranging binding criteria (see
Figure 1.14.1) allowing deeper understanding of the rules used by miRNAs for the
recognition and regulation of targets in vivo. Pasquinelli reviews several methods that are
now available for identifying miRNA target sites and stated that the mere presence of a
miRNA-binding site is insufficient for predicting target regulation. Furthermore, regulation
of targets by miRNAs is subject to various levels of control, and recent developments have
presented a new twist; targets can reciprocally control the level and function of miRNAs
(Pasquinelli 2012). Curiously, target–sequence interactions can also stimulate miRNA
degradation. It has been shown in D. melanogaster and in human cells that extensive
pairing between a miRNA and its target site can induce 3′ end trimming of the miRNA
(Ameres et al. 2010). It remains to be seen whether this may be the case for some miRNAs
targeting XIAP here, subsequently reducing the detected captured output, for example in
the SNB-19 capture, miR-221 was not captured, but its family member miR-222 was. The
apparent flexibility in animal miRNA-targeting rules suggests that factors beyond their sole
pairing capacity may mediate functional interactions in vivo (Grimson et al. 2007). In other
words, the complexity may be so varied that understanding miRNAs via combinations of
bioinformatics and capture methods may not wholly satisfy validation of every miRNA.
Another aspect is co-expression of the mRNA and miRNA in question at a given point in
time, for example, XIAP mRNA expression may differ grossly between stages of culture,
and any in silico predicted miRNA target may not be present at the same stage.
Additionally, folding of the XIAP mRNA may confer various secondary structures which
may not facilitate access to a particular miRNA binding site. Furthermore, under different
states of stress and culture conditions mRNA binding protein occupancy may differ and
block access to the sequence. One way to examine this would be to run multiple captures at
various culture/growth stages.
In addition, it would be interesting to use other techniques (Table 1.14.1), to compare the
miRNAs detected between techniques. The most commonly used methods to identify
miRNA:mRNA interactions via argonaute (Ago) protein binding are HITS-CLIP and PAR-
CLIP, both of which have produced interesting results. As PAR-CLIP and HITS-CLIP
results accumulated, Yang et al conceptualised a novel database, starBase (sRNA target

365
Base), which they have developed to facilitate the comprehensive exploration of miRNA-
target interaction maps from CLIP-Seq and Degradome-Seq data. They established
approximately 400,000 and approximately 66,000 miRNA-target regulatory relationships
from CLIP-Seq and Degradome-Seq data, respectively (Yang et al. 2011). Recently,
starBase version 2.0 was established with many updates including interactive web
implementations to provide visualisation, analysis and downloading of the aforementioned
large-scale data sets (Li et al. 2014).
However, unlike miR-Capture both CLIP techniques are in vitro-based which may not fully
reflect the complexity of in vivo interactions. Other methods, similar in approach to miR-
Capture have been developed which can be used to identify miRNAs that regulate a single
mRNA of interest. One method uses luciferase 3’UTR reporter genes with which individual
miRNAs must be co-transfected into a cell line (Wu et al. 2010). This method suffers from
some limitations, it can be laborious especially when bioinformatic screening predicts
multiple potential regulatory miRNAs and it is limited to 3’UTR targeting only, with
miRNAs targeting CDS and 5’UTR regions going unaccounted for.
Interestingly, the miR-17-92 cluster members (miR-17, miR-19b and miR-20a) were all
detected in the CHO capture lysate (Table 4.3.5.2). The fact that only some of the cluster
members were detected was somewhat unexpected as the cluster was reported to be highly
expressed in many cell types including Neuro- and Glio-blastoma (Hayashita et al. 2005)
(Mestdagh et al. 2010), from which SNB-19 cells were derived. Additionally, as this
clusters promoter was identified in the first project in this thesis, it was encouraging that
these miRNAs appeared to be highly expressed in healthy, unstressed CHO cells, and
therefore under the control of a moderate to strong promoter. This was partial justification
to using the miR-17-92 cluster promoter even though the functional analysis wasn’t overly
striking, but as mentioned it was highly unlikely we isolated the fully functional promoter
region from the outset.
MiR-222 was detected in the SNB-19 capture lysate and has been reported to be often co-
expressed with miR-221 (Howe, Cochrane and Richer 2012); however miR-221 was not
present in SNB-19 or indeed CHO pulldowns (Table 4.3.5.2). Recently, Li et al found that
knocking down the miR-221/222 cluster, significantly increased radiation-sensitivity of

366
Glioblastoma cells which they are normally highly resistant to. Notably, combined anti-
miR-221/222 and radiation therapy remarkably inhibited tumor growth compared with anti-
miR-221/222 or radiotherapy alone in a subcutaneous mouse model (Li et al. 2014a). It
may be interesting to explore the knockdown of miR-222 in both cell lines as a comparison
and expose them to radiation, based on miR-222 only being pulled down in our
glioblastoma SNB-19 lysates.
Interestingly, miR-8/200 and miR-221/222 families play crucial opposing roles that affect
the differentiation state of breast cancers and have been shown to be expressed at higher
levels in highly invasive basal-like breast cancer (BLBC) cells than in non-invasive luminal
cells (Howe et al. 2012), (Li et al. 2014b). This could go some way towards explaining as
to why miR-222 was detected in the invasive human GBM SNB-19 cell line and not in the
CHO XIAP pulldown.
Reports in the literature have associated XIAP with certain miRNAs that are involved in
carcinogenesis pathways and apoptosis regulation. From in vivo data, Ren et al indicated
that the overexpression of miR-200c significantly inhibited tumor growth and increased the
rate of apoptosis. Western blot analysis also demonstrated that the expression of XIAP was
markedly reduced and that caspase-3 was highly activated by the overexpression of
miR-200c (Ren et al. 2014). In addition, Xie et al suggested a novel mechanism by which
miR-24 directly modulates the apoptosis threshold in cancer cells via downregulation of
XIAP expression, and may be useful in order to overcome apoptosis resistance in cancer
cells (Xie et al. 2013).
In conclusion, while other studies have used this capture affinity technique for other mRNA
targets such as; alpha-1 antitrypsin (AAT), interleukin-8 (IL-8) and secretory leucoprotease
inhibitor (SLP1) (Hassan et al. 2013), this is the first miR-Capture study of this type done
in CHO cells and the first capture study on an anti-apoptotic gene.

367
6.8: Functional validation of specific miRNAs from miR-Capture
We presented an alternative validated method to identify multiple miRNAs targeting a
predetermined mRNA. Our data showed 40 miRNAs in total, that may be cell specific, plus
4 common and that co-elute with XIAP mRNA transcript in two cell types. From this target
list (Table 4.3.5.2), two miRNAs were chosen for each cell line (miR-124, miR-19b for
CHO and miR124, miR-222 for SNB-19) for functional validation.
Each of these miRNAs were shown to be more abundant after single-plex Taqman assays,
with miR-124 in the SNB-19 cells being the most abundant (~2.5-fold) compared to the
non-specific oligo (NSO) treated SNB-19 cells. The other 3 miRNAs had similar fold
increases (~1.8-1.9-fold) (Figure 4.3.6.1). Similarly, Chi et al validated genome-wide
interaction maps for miR-124 and its target mRNAs after using the HITS-CLIP approach
(Chi et al. 2009).
All four showed a functional impact on XIAP expression to varying degrees when
measured using qRT-PCR, treatment with pre-miR mimics for overexpression, western
blotting and GFP-reporter 3’UTR knockdown analysis.
XIAP 3’UTR GFP-reporter assay was performed to see the effect of miRNAs had on GFP
expression levels. Surprisingly, miR-19b caused a very small reduction in GFP expression
in CHO cells although it was significant (Figure 4.3.6.1.2 A). This was interesting because
miR-19b was not detected from the human miR-Capture yet was shown to target human
XIAP 3’UTR sequence. Maybe miR-19b does not bind that efficiently to the human XIAP
mRNA and hence was not captured in the human lysate.
Overall using the human XIAP 3’UTR sequence, it was shown that co-transfection of a
pGFP (xiap3) vector with various pre-miR mimics resulted in modest reductions of GFP
expression in both cell lines (Figure 4.3.6.1.2). This was presumably due to the miRNAs
binding to locations on the XIAP 3’UTR as shown by RNAhybrid™ (Figure 4.3.6.1.1) and
therefore impacting on GFP expression levels. As only the human XIAP 3’UTR (3.7kb)
was examined for 3’UTR reporter gene targeting, repeat studies involving the exact CHO
XIAP 3’UTR would prove beneficial.
368
The transfected miR-222 mimics induced a ~55% reduction in XIAP RQ in SNB-19 cells
and had the most striking impact (Figure 4.3.6.3). The miR-222 mimics were included as a
transfection control in CHO cells, as this miRNA was expected not to cause a change in
XIAP expression based on it not being captured i.e: targeting XIAP endogenously, and
indeed it showed no significant effect (Figure 4.3.6.3 A).
The western blotting results did appear to correlate with the mimic transfection results for
the CHO cells, both miR-124 and miR-19b showed reduced XIAP protein levels compared
to the cells only and PM- control samples (Figure 4.3.6.4). However, in the SNB-19 cells,
they did not correlate. For example, miR-222 transfected cells did not seem to have a
reduction in XIAP protein and infact only the combination of miR-124 and miR-222 caused
an impact on XIAP protein level (Figure 4.3.6.3 B).
Transfecting pre-miR mimics into both cell lines resulted in varying amounts of XIAP
knockdown measured as relative quantity (RQ). Hassan et al also observed varied results in
their functional studies post-capture; they reported small percentage knockdown by anti-
miRs and suggest that using higher concentrations of anti-miRs may cause more substantial
functional effects on alpha-1 antitrypsin (AAT) knockdown and we suggest the same for
XIAP. Conversely, they highlighted that some miRNAs that were co-captured with AAT
caused an effect on 3’UTR reporter gene studies but did not have a functional effect on
AAT mRNA or protein levels (Hassan et al. 2013). Our results in fact show the opposite in
some cases, for example, we had moderate but significant knockdown of XIAP mRNA
levels by miR-124 mimics when transfected in SNB-19 cells, yet from the 3’UTR GFP
reporter assay we saw slight knockdown but it was not significant (Figure 4.3.6.1.2).
In summary, this novel technique combined with TLDA analysis, presents a simple
efficient method to identify native interacting miRNAs targeting the whole sequence of an
mRNA transcript. If used together with more stringent prediction programs and more
sensitive specific assays for elucidation of miRNA biogenesis and functionality, this
method is likely to significantly advance miRNA research.
Ultimately what does this mean for protein production and how might we apply our
findings in a bioreactor setting? For one we have identified 4 miRNAs that target both

369
CHO and human XIAP, these miRNAs could be stably overexpressed individually or in
combination in CHO clones to examine their effects on cell growth, recombinant protein
productivity and product quality much like Loh et al did for miRs-17, -19b, -20a, and -92a
(Loh et al. 2014). Since miRNAs suppress mRNA translation, we hypothesized that up-
regulating miR-124 for example or indeed any miRNA identified by miR-Capture could
inhibit endogenous XIAP and induce apoptosis as a result, i.e: they may be pro-apoptotic.
Therefore by targeting these miRNA or using sponge decoys we might promote XIAP
expression leading to even better phenotypes as shown from our data. Furthermore, there is
a high probability that these miRNAs may target more than one anti-apoptotic gene in both
species which may increase the impact on apoptosis regulation further. For example, Druz
et al found that miR-466h affects the apoptotic pathway by targeting at least 5 anti-
apoptotic genes in unison (Druz et al. 2011).
Out of interest we checked other apoptotic related genes Bcl-2 and Aven for predicted
binding sites of the four miRNAs identified from the miR-Capture. The Bcl-2 gene was
shown to contain binding sites for miR-124 and miR-760, with miR-526* and miR-877
sites not being predicted. MiR-124 was the only miRNA out of the four that also contained
bind sites in the 3’UTR of the Aven gene. Therefore, with the help of more extensive
validation, miR-124 may be shown to regulate a host of anti-apoptotic genes, not just XIAP
as we showed in section 4.3.6.
370
6.9: Conclusions – Project 2
The anti-apoptotic gene XIAP plays important roles in survival and apoptosis in
CHO in both adherent and suspension culture.
Stable overexpression of XIAP in CHO single cell clones caused increased growth
rates, higher viabilities and resistance to apoptosis which enabled them to grow to
higher cell densities compared to controls.
There were 4 clones which displayed these phenotypes to slightly varying levels,
while clone 12 exhibited the most striking difference compared to the controls.
Day 9 spent media induced a morphological change in the tested cell lines in
attached culture, and it was impactful on cellular viability in early culture for XIAP
clone 12 and control populations.
Functional validation studies showed that the phenotypes (increased growth and
viability) exhibited by overexpressing XIAP could be reversed by specifically
knocking down XIAP using RNAi in two CHO cell lines (CHO-K1 parental and
CHO stable XIAP clone 12).
The beneficial phenotypes displayed were adjudged not to be a clonal irregularity,
as stable XIAP clones 5, 10 and 11 also displayed these phenotypes albeit to slightly
varying degrees.
Regarding productivity, the stable XIAP clone 12 outperformed the RFP-Control
cell line in all 3 reporter productivity assays [EPO, SEAP and IgG].
Other XIAP observations showed that it was; under control of miR-23b regulation
in Glioma (Figure 4.3.1.2) and expressed highly in various CHO cell lines (Figure
4.1.4).
A novel miRNA affinity capture ‘miR-Capture’ technique was shown to pulldown
cognate miRNAs targeting XIAP. This was revealed in two separate mammalian
cell types (CHO and human).
There were 40 miRNAs identified (26 in human and 14 in CHO) as being enriched
between the capture oligo and control. As expected, more miRNAs were detected in
the human XIAP mRNA presumably owing to it being 2113nt longer in sequence
size.

371
Of the 40 miRNAs detected, 4 miRNA were common between Human (SNB-19)
and CHO (K1), these were [miR-124, miR-877, miR526b*, miR-760]. None had
previous affiliation to XIAP in the literature.
The absence of 6 miRNAs predicted to bind XIAP in silico highlighted the
discrepancies seen between software prediction methods and functional studies.
MiR-124 was validated as a true target of XIAP in both cell lines, while further
validation is needed for the three other common miRNA targets.

372
6.10: Project 2 - Future work
6.10.1: Cell-adhesion analysis
From the abnormal morphology seen in the XIAP clone 12 cells under the microscope in
extended culture under harsh conditions (Section 4.2.1) led us to believe that the elongated
spiral morphology was responsible for survival in harsh conditions. Although not wholly
relevant to biopharma production, we recommend for future experimentation to test for cell
adhesion molecules (CAMs) such as integrins, selectins, CD44 and N-cadherin under
flow/shear conditions. Several families of adhesion receptors have been identified (Albelda
and Buck 1990). The different adhesive properties of our CHO cells may be reflected by
different expression profiles of several CAMs and it would be interesting to analyse CAMs
over time to see if they are responsible for increased survival. For example, in cancer cells,
these CAMs have been associated with the growth and metastatic behaviour in several
malignant entities such as neuroblastoma (Schwankhaus et al. 2014). One way of testing is
by using a Laminar flow adhesion assay using IBIDI microslides VI (IBIDI, Munich,
Germany) connected to a syringe pump (Model 100 Series; kdScientific, Holliston,
Massachusetts, USA) and measure cell movement with an inverted microscope and validate
with qRT-PCR.
6.10.2: Clonal variation in XIAP clones
The process of clonal cell line generation has inherent pitfalls. For example, random
integration of the experimental vector/transgene can result in various genetic phenotypes
such as intensity of expression potentially due to insertional mutagenesis and/or copy
number variation. Vesuna and Winnard et al, also showed that random integration and
amplification can interfere with the regulation of endogenous genes while potentially
creating variation leading to chromosomal instability and karyotype alteration (Winnard et
al. 2006) (Vesuna et al. 2006).
Although care was taken to include a panel to test clonal variation in CHO cells expressing
stable XIAP, only 13 clones survived after 3 months of selective pressure due to
contamination and other technical issues. Although four clones progressed to the apoptosis
373
experiments and were deemed sufficient for an unbiased study, ideally more clones would
be investigated to establish the full extent of the XIAP effect as well as to identify
potentially better clones for future work.
6.10.3: Analysis of metabolite utilisation and waste accumulation
There is scope for analyzing the interdependence of the apoptotic cellular machinery with
metabolism and waste formation (ammonia and lactate) to provide greater flexibility to
mammalian bioreactor process development. Dorai and colleagues provided the first study
pushing these boundaries into apoptosis mediated metabolite and waste interplay. They
showed that overexpression of anti-apoptotic genes E1B-19K, Aven, and a mutant of XIAP
(EAX197), resulted in beneficial traits including improved lactate clearance (>1.8g/L) and
lower ammonia accumulation compared to host cell controls (Dorai et al. 2009) (Dorai et
al. 2010). It would be interesting to assess the XIAP clones in terms of these metabolic
activities.
6.10.5: MiR-Capture improvements
As it is a relatively novel technique, there is scope for improvement in the miR-Capture
technique. An example would be to optimise the formaldehyde crosslinking step to try
isolate bound miRNAs more efficiently. Additionally, it would be an interesting exercise to
repeat the miR-Capture for other anti- and pro-apoptotic genes to see if there is a
commonality of miRNAs pulled down which may target more than one apoptotic related
gene/mRNA.
Finally, as this was a novel technique, many steps can be altered which may be beneficial
or in the contrary detrimental to the success of the miR-Capture process. For example, there
were many washing steps with Catherine greens labs continuously experimenting to
increase the efficiency and reproducibility of the technique. Therefore, multiple repeats of
the technique using different arrangements of washing agents and exposure times may be
useful in detecting more miRNAs (as some may simply not be bound to the XIAP mRNA
374
strongly enough using an oligo hook) and as a result, may have been undetected form the
protocol we used. We could also compare the set of miRNAs after each miR-Capture.
6.10.6: Are other anti-apoptotic genes targeted by the XIAP miR-Capture miRNAs
As mentioned previously in section 6.8, it would be interesting to see if the four miRNAs
identified as common or indeed any miRNA detected from the miR-Capture from either
species affect the regulation of other anti-apoptotic genes. We were limited to in silico
prediction only but we suggest validation using premir and antagomir to overexpress or
knock down various miRNAs which are predicted to bind XIAP and a range of other
related genes. In other words, by performing miR-Capture on other anti-apoptotic genes we
would like to see if they are controlled by an overlapping set of miRNAs.
6.10.7: XIAP 3’UTR reporter assay
The XIAP 3’UTR reporter functional assay showed the decrease in GFP expression
resulting from a co-transfection of a GFP construct containing a 3.7 kb sequence of the
human XIAP 3’UTR with various miRNA mimics (Figure 4.3.6.1.2).
For future work we recommend isolating the CHO XIAP equivalent (~3.7 kb) and clone to
the GFP plasmid and repeat the assay. It would be beneficial to see effect after co-
transfection of the GFP- XIAP 3’UTR construct and various mimics in CHO cells, the
experiment as it wasn’t originally specific for CHO. This was based on the hypothesis that
different cell lines have potentially different levels of endogenous miRNAs, however, it
must be noted that identifying and isolating the CHO 3’UTR sequence was not possible at
the time of designing the experiment. With the release of the draft CHO sequence this is
now possible.

375
6.10.8: Use the promoters from project 1 to control XIAP transgene expression
To amalgamate both projects, we suggest using the temperature sensitive promoters
identified from project 1 to drive competitive inhibitors of miRNAs ‘miRNA sponges’ in
order to repress the set of miRNAs which control XIAP, and hence increase XIAP
expression late in culture for example, to delay the onset of apoptosis. MiRNA sponges are
transcripts which usually function under the control of a strong promoter, so we suggest
using our strong CHO endogenous promoters which would be an attractive means for
controlling XIAP expression coupled with a temperature inducible means of altering
expression.
Similarly, we could use sponges’ specific to the subset of miRNAs which regulate XIAP
and engineer stable CHO cells to reduce these miRNAs and potentially get the same
phenotypes as we saw from the XIAP overexpression experiments.

376
Section 7.0
Bibliography & Appendices

377
7.1: Bibliography
Albelda, S.M. and Buck, C.A. 1990. Integrins and other cell adhesion molecules. FASEB
Journal : Official Publication of the Federation of American Societies for Experimental
Biology, 4(11), pp.2868-2880.
Al-Fageeh, M.B. and Smales, C.M. 2009. Cold-inducible RNA binding protein (CIRP)
expression is modulated by alternative mRNAs. RNA (New York, N.Y.), 15(6), pp.1164-
1176.
Altuvia, Y., Landgraf, P., Lithwick, G., Elefant, N., Pfeffer, S., Aravin, A., Brownstein,
M.J., Tuschl, T. and Margalit, H. 2005. Clustering and conservation patterns of human
microRNAs. Nucleic Acids Research, 33(8), pp.2697-2706.
Amarzguioui, M., Rossi, J.J. and Kim, D. 2005. Approaches for chemically synthesized
siRNA and vector-mediated RNAi. FEBS Letters, 579(26), pp.5974-5981.
Ameres, S.L., Horwich, M.D., Hung, J.H., Xu, J., Ghildiyal, M., Weng, Z. and Zamore,
P.D. 2010. Target RNA-directed trimming and tailing of small silencing RNAs. Science
(New York, N.Y.), 328(5985), pp.1534-1539.
Andachi, Y. 2008. A novel biochemical method to identify target genes of individual
microRNAs: Identification of a new caenorhabditis elegans let-7 target. RNA (New York,
N.Y.), 14(11), pp.2440-2451.
Antoniou, M., Harland, L., Mustoe, T., Williams, S., Holdstock, J., Yague, E., Mulcahy, T.,
Griffiths, M., Edwards, S., Ioannou, P.A., Mountain, A. and Crombie, R. 2003. Transgenes
encompassing dual-promoter CpG islands from the human TBP and HNRPA2B1 loci are
resistant to heterochromatin-mediated silencing. Genomics, 82(3), pp.269-279.
Arden, N. and Betenbaugh, M.J. 2004. Life and death in mammalian cell culture: Strategies
for apoptosis inhibition. Trends in Biotechnology, 22(4), pp.174-180.
Aubel, D. and Fussenegger, M. 2010. Mammalian synthetic biology--from tools to
therapies. BioEssays : News and Reviews in Molecular, Cellular and Developmental
Biology, 32(4), pp.332-345.
Authier, H., Billot, K., Derudder, E., Bordereaux, D., Riviere, P., Rodrigues-Ferreira, S.,
Nahmias, C. and Baud, V. 2014. IKK phosphorylates RelB to modulate its promoter
specificity and promote fibroblast migration downstream of TNF receptors. Proceedings of
the National Academy of Sciences of the United States of America, 111(41), pp.14794-
14799.

378
Baek, D., Villen, J., Shin, C., Camargo, F.D., Gygi, S.P. and Bartel, D.P. 2008. The impact
of microRNAs on protein output. Nature, 455(7209), pp.64-71.
Bailey, T.L. 2011. DREME: Motif discovery in transcription factor ChIP-seq data.
Bioinformatics (Oxford, England), 27(12), pp.1653-1659.
Baranick, B.T., Lemp, N.A., Nagashima, J., Hiraoka, K., Kasahara, N. and Logg, C.R.
2008. Splicing mediates the activity of four putative cellular internal ribosome entry sites.
Proceedings of the National Academy of Sciences of the United States of America, 105(12),
pp.4733-4738.
Barrangou, R., Fremaux, C., Deveau, H., Richards, M., Boyaval, P., Moineau, S., Romero,
D.A. and Horvath, P. 2007. CRISPR provides acquired resistance against viruses in
prokaryotes. Science (New York, N.Y.), 315(5819), pp.1709-1712.
Barron, N., Sanchez, N., Kelly, P. and Clynes, M. 2011. MicroRNAs: Tiny targets for
engineering CHO cell phenotypes? Biotechnology Letters, 33(1), pp.11-21.
Bassiri, H., Janice Yeo, W.C., Rothman, J., Koretzky, G.A. and Nichols, K.E. 2008. X-
linked lymphoproliferative disease (XLP): A model of impaired anti-viral, anti-tumor and
humoral immune responses. Immunologic Research, 42(1-3), pp.145-159.
Becker, E., Florin, L., Pfizenmaier, K. and Kaufmann, H. 2010. Evaluation of a
combinatorial cell engineering approach to overcome apoptotic effects in XBP-1(s)
expressing cells. Journal of Biotechnology, 146(4), pp.198-206.
Beitzinger, M. and Meister, G. 2011. Experimental identification of microRNA targets by
immunoprecipitation of argonaute protein complexes. Methods in Molecular Biology
(Clifton, N.J.), 732pp.153-167.
Beitzinger, M., Peters, L., Zhu, J.Y., Kremmer, E. and Meister, G. 2007. Identification of
human microRNA targets from isolated argonaute protein complexes. RNA Biology, 4(2),
pp.76-84.
Benham, C., Kohwi-Shigematsu, T. and Bode, J. 1997. Stress-induced duplex DNA
destabilization in scaffold/matrix attachment regions. Journal of Molecular Biology,
274(2), pp.181-196.
Benton, T., Chen, T., McEntee, M., Fox, B., King, D., Crombie, R., Thomas, T.C. and
Bebbington, C. 2002. The use of UCOE vectors in combination with a preadapted serum
free, suspension cell line allows for rapid production of large quantities of protein.
Cytotechnology, 38(1-3), pp.43-46.
Bentwich, I. 2005. Prediction and validation of microRNAs and their targets. FEBS Letters,
579(26), pp.5904-5910.

379
Berkes, C.A., Bergstrom, D.A., Penn, B.H., Seaver, K.J., Knoepfler, P.S. and Tapscott, S.J.
2004. Pbx marks genes for activation by MyoD indicating a role for a homeodomain
protein in establishing myogenic potential. Molecular Cell, 14(4), pp.465-477.
Berkhout, B. and Liu, Y.P. 2014. Towards improved shRNA and miRNA reagents as
inhibitors of HIV-1 replication. Future Microbiology, 9(4), pp.561-571.
Berkner, ,Silvia, Wlodkowski, ,Alexander, Albers, ,Sonja-Verena and Lipps, ,Georg. 2010.
Inducible and constitutive promoters for genetic systems in sulfolobus acidocaldarius.
Extremophiles, (3), pp.249-259.
Berkner, S. and Lipps, G. 2008. Genetic tools for sulfolobus spp.: Vectors and first
applications. Archives of Microbiology, 190(3), pp.217-230.
Bi, J.X., Shuttleworth, J. and Al-Rubeai, M. 2004. Uncoupling of cell growth and
proliferation results in enhancement of productivity in p21CIP1-arrested CHO cells.
Biotechnology and Bioengineering, 85(7), pp.741-749.
Bi, W., Wu, L., Coustry, F., de Crombrugghe, B. and Maity, S.N. 1997. DNA binding
specificity of the CCAAT-binding factor CBF/NF-Y. The Journal of Biological Chemistry,
272(42), pp.26562-26572.
Blankenship, J.W., Varfolomeev, E., Goncharov, T., Fedorova, A.V., Kirkpatrick, D.S.,
Izrael-Tomasevic, A., Phu, L., Arnott, D., Aghajan, M., Zobel, K., Bazan, J.F., Fairbrother,
W.J., Deshayes, K. and Vucic, D. 2009. Ubiquitin binding modulates IAP antagonist-
stimulated proteasomal degradation of c-IAP1 and c-IAP2(1). The Biochemical Journal,
417(1), pp.149-160.
Bode, J., Winkelmann, S., Gotze, S., Spiker, S., Tsutsui, K., Bi, C., A, K.P. and Benham, C.
2006. Correlations between scaffold/matrix attachment region (S/MAR) binding activity
and DNA duplex destabilization energy. Journal of Molecular Biology, 358(2), pp.597-613.
Bondarenko, V.A., Liu, Y.V., Jiang, Y.I. and Studitsky, V.M. 2003. Communication over a
large distance: Enhancers and insulators. Biochemistry and Cell Biology = Biochimie Et
Biologie Cellulaire, 81(3), pp.241-251.
Boorsma, M., Hoenke, S., Marrero, A., Fischer, R., Bailey, J.E., Renner, W.A. and
Bachmann, M.F. 2002. Bioprocess applications of a sindbis virus-based temperature-
inducible expression system. Biotechnology and Bioengineering, 79(6), pp.602-609.
Booth, L.A., Tavallai, S., Hamed, H.A., Cruickshanks, N. and Dent, P. 2014. The role of
cell signalling in the crosstalk between autophagy and apoptosis. Cellular Signalling, 26(3),
pp.549-555.

380
Boscolo, S., Mion, F., Licciulli, M., Macor, P., De Maso, L., Brce, M., Antoniou, M.N.,
Marzari, R., Santoro, C. and Sblattero, D. 2012. Simple scale-up of recombinant antibody
production using an UCOE containing vector. New Biotechnology, 29(4), pp.477-484.
Brochu, C., Cabrita, M.A., Melanson, B.D., Hamill, J.D., Lau, R., Pratt, M.A. and McKay,
B.C. 2013. NF-kappaB-dependent role for cold-inducible RNA binding protein in
regulating interleukin 1beta. PloS One, 8(2), pp.e57426.
Brooks, A.R., Harkins, R.N., Wang, P., Qian, H.S., Liu, P. and Rubanyi, G.M. 2004.
Transcriptional silencing is associated with extensive methylation of the CMV promoter
following adenoviral gene delivery to muscle. The Journal of Gene Medicine, 6(4), pp.395-
404.
Brown, A.J., Sweeney, B., Mainwaring, D.O. and James, D.C. 2014. Synthetic promoters
for CHO cell engineering. Biotechnology and Bioengineering,
Brummelkamp, T.R., Bernards, R. and Agami, R. 2002. Stable suppression of
tumorigenicity by virus-mediated RNA interference. Cancer Cell, 2(3), pp.243-247.
Buonamici, S., Chakraborty, S., Senyuk, V. and Nucifora, G. 2003. The role of EVI1 in
normal and leukemic cells. Blood Cells, Molecules & Diseases, 31(2), pp.206-212.
Chappell, S.A., Owens, G.C. and Mauro, V.P. 2001. A 5' leader of Rbm3, a cold stress-
induced mRNA, mediates internal initiation of translation with increased efficiency under
conditions of mild hypothermia. The Journal of Biological Chemistry, 276(40), pp.36917-
36922.
Chaudhuri, K. and Chatterjee, R. 2007. MicroRNA detection and target prediction:
Integration of computational and experimental approaches. DNA and Cell Biology, 26(5),
pp.321-337.
Carninci, ,Piero, Sandelin, ,Albin, Lenhard, ,Boris, Katayama, ,Shintaro, Shimokawa,
,Kazuro, Ponjavic, ,Jasmina, Semple, C.,A.M., Taylor, M.,S., Engstrom, P.,G., Frith, M.,C.,
Forrest, A.,R.R., Alkema, W.,B., Tan, S.,Lam, Plessy, ,Charles, Kodzius, ,Rimantas,
Ravasi, ,Timothy, Kasukawa, ,Takeya, Fukuda, ,Shiro, Kanamori-Katayama, ,Mutsumi,
Kitazume, ,Yayoi, Kawaji, ,Hideya, Kai, ,Chikatoshi, Nakamura, ,Mari, Konno, ,Hideaki,
Nakano, ,Kenji, Mottagui-Tabar, ,Salim, Arner, ,Peter, Chesi, ,Alessandra, Gustincich,
,Stefano, Persichetti, ,Francesca, Suzuki, ,Harukazu, Grimmond, S.,M., Wells, C.,A.,
Orlando, ,Valerio, Wahlestedt, ,Claes, Liu, E.,T., Harbers, ,Matthias, Kawai, ,Jun, Bajic,
V.,B., Hume, D.,A. and Hayashizaki, ,Yoshihide. Genome-wide analysis of mammalian
promoter architecture and evolution.
Castro, P.M., Hayter, P.M., Ison, A.P. and Bull, A.T. 1992. Application of a statistical
design to the optimization of culture medium for recombinant interferon-gamma production
by chinese hamster ovary cells. Applied Microbiology and Biotechnology, 38(1), pp.84-90.

381
Cato, A.C., Henderson, D. and Ponta, H. 1987. The hormone response element of the
mouse mammary tumour virus DNA mediates the progestin and androgen induction of
transcription in the proviral long terminal repeat region. The EMBO Journal, 6(2), pp.363-
368.
Chan, K.K., Wu, S.M., Nissom, P.M., Oh, S.K. and Choo, A.B. 2008. Generation of high-
level stable transgene expressing human embryonic stem cell lines using chinese hamster
elongation factor-1 alpha promoter system. Stem Cells and Development, 17(4), pp.825-
836.
Chappell, S.A. and Mauro, V.P. 2003. The internal ribosome entry site (IRES) contained
within the RNA-binding motif protein 3 (Rbm3) mRNA is composed of functionally
distinct elements. The Journal of Biological Chemistry, 278(36), pp.33793-33800.
Chen, J., Haverty, J., Deng, L., Li, G., Qiu, P., Liu, Z. and Shi, S. 2013. Identification of a
novel endogenous regulatory element in chinese hamster ovary cells by promoter trap.
Journal of Biotechnology, 167(3), pp.255-261.
Chi, S.W., Zang, J.B., Mele, A. and Darnell, R.B. 2009. Argonaute HITS-CLIP decodes
microRNA-mRNA interaction maps. Nature, 460(7254), pp.479-486.
Chien, W., Ding, L.W., Sun, Q.Y., Torres-Fernandez, L.A., Tan, S.Z., Xiao, J., Lim, S.L.,
Garg, M., Lee, K.L., Kitajima, S., Takao, S., Leong, W.Z., Sun, H., Tokatly, I., Poellinger,
L., Gery, S. and Koeffler, P.H. 2014. Selective inhibition of unfolded protein response
induces apoptosis in pancreatic cancer cells. Oncotarget,
Cho, S.W., Kim, S., Kim, Y., Kweon, J., Kim, H.S., Bae, S. and Kim, J.S. 2014. Analysis
of off-target effects of CRISPR/Cas-derived RNA-guided endonucleases and nickases.
Genome Research, 24(1), pp.132-141.
Chong, W.P., Reddy, S.G., Yusufi, F.N., Lee, D.Y., Wong, N.S., Heng, C.K., Yap, M.G.
and Ho, Y.S. 2010. Metabolomics-driven approach for the improvement of chinese hamster
ovary cell growth: Overexpression of malate dehydrogenase II. Journal of Biotechnology,
147(2), pp.116-121.
Choudhuri, S. 2009. Lesser known relatives of miRNA. Biochemical and Biophysical
Research Communications, 388(2), pp.177-180.
Clark, K.J., Chaplin, F.W. and Harcum, S.W. 2004. Temperature effects on product-
quality-related enzymes in batch CHO cell cultures producing recombinant tPA.
Biotechnology Progress, 20(6), pp.1888-1892.
Clarke, C., Doolan, P., Barron, N., Meleady, P., O'Sullivan, F., Gammell, P., Melville, M.,
Leonard, M. and Clynes, M. 2011. Large scale microarray profiling and coexpression
network analysis of CHO cells identifies transcriptional modules associated with growth
and productivity. Journal of Biotechnology, 155(3), pp.350-359.

382
Clarke, C., Henry, M., Doolan, P., Kelly, S., Aherne, S., Sanchez, N., Kelly, P., Kinsella,
P., Breen, L., Madden, S.F., Zhang, L., Leonard, M., Clynes, M., Meleady, P. and Barron,
N. 2012. Integrated miRNA, mRNA and protein expression analysis reveals the role of
post-transcriptional regulation in controlling CHO cell growth rate. BMC Genomics,
13pp.656-2164-13-656.
Cohen, S.N., Chang, A.C., Boyer, H.W. and Helling, R.B. 1973. Construction of
biologically functional bacterial plasmids in vitro. Proceedings of the National Academy of
Sciences of the United States of America, 70(11), pp.3240-3244.
Cost, G.J., Freyvert, Y., Vafiadis, A., Santiago, Y., Miller, J.C., Rebar, E., Collingwood,
T.N., Snowden, A. and Gregory, P.D. 2010. BAK and BAX deletion using zinc-finger
nucleases yields apoptosis-resistant CHO cells. Biotechnology and Bioengineering, 105(2),
pp.330-340.
Crouse, G.F., McEwan, R.N. and Pearson, M.L. 1983. Expression and amplification of
engineered mouse dihydrofolate reductase minigenes. Molecular and Cellular Biology,
3(2), pp.257-266.
Dahodwala, H., Nowey, M., Mitina, T. and Sharfstein, S.T. 2012. Effects of clonal
variation on growth, metabolism, and productivity in response to trophic factor stimulation:
A study of chinese hamster ovary cells producing a recombinant monoclonal antibody.
Cytotechnology, 64(1), pp.27-41.
Darnell, J.E.,Jr. 1997. STATs and gene regulation. Science (New York, N.Y.), 277(5332),
pp.1630-1635.
Dasgupta, A., Das, S., Izumi, R., Venkatesan, A. and Barat, B. 2004. Targeting internal
ribosome entry site (IRES)-mediated translation to block hepatitis C and other RNA
viruses. FEMS Microbiology Letters, 234(2), pp.189-199.
Datta, P., Linhardt, R.J. and Sharfstein, S.T. 2013. An 'omics approach towards CHO cell
engineering. Biotechnology and Bioengineering, 110(5), pp.1255-1271.
Davies, J. and Jacob, F. 1968. Genetic mapping of the regulator and operator genes of the
lac operon. Journal of Molecular Biology, 36(3), pp.413-417.
Davydova, A.I., Erokhin, M.M., Georgiev, P.G. and Chetverina, D.A. 2011. Distant
interactions between enhancers and promoters in drosophila melanogaster are mediated by
transgene-flanking su(hw) insulators. Genetika, 47(8), pp.1037-1043.
de Almagro, M.C. and Vucic, D. 2012. The inhibitor of apoptosis (IAP) proteins are critical
regulators of signaling pathways and targets for anti-cancer therapy. Experimental
Oncology, 34(3), pp.200-211.

383
De Leeuw, F., Zhang, T., Wauquier, C., Huez, G., Kruys, V. and Gueydan, C. 2007. The
cold-inducible RNA-binding protein migrates from the nucleus to cytoplasmic stress
granules by a methylation-dependent mechanism and acts as a translational repressor.
Experimental Cell Research, 313(20), pp.4130-4144.
Dean, A. 2011. In the loop: Long range chromatin interactions and gene regulation.
Briefings in Functional Genomics, 10(1), pp.3-10.
Delhalle, S., Duvoix, A., Schnekenburger, M., Morceau, F., Dicato, M. and Diederich, M.
2003. An introduction to the molecular mechanisms of apoptosis. Annals of the New York
Academy of Sciences, 1010pp.1-8.
Deveraux, Q.L. and Reed, J.C. 1999. IAP family proteins--suppressors of apoptosis. Genes
& Development, 13(3), pp.239-252.
Ding, J., Cai, X., Wang, Y., Hu, H. and Li, X. 2013. ChIPModule: Systematic discovery of
transcription factors and their cofactors from ChIP-seq data. Pacific Symposium on
Biocomputing.Pacific Symposium on Biocomputing, pp.320-331.
Ding, J., Hu, H. and Li, X. 2014. SIOMICS: A novel approach for systematic identification
of motifs in ChIP-seq data. Nucleic Acids Research, 42(5), pp.e35.
Doolan, P., Barron, N., Kinsella, P., Clarke, C., Meleady, P., O'Sullivan, F., Melville, M.,
Leonard, M. and Clynes, M. 2012. Microarray expression profiling identifies genes
regulating sustained cell specific productivity (S-qp) in CHO K1 production cell lines.
Biotechnology Journal, 7(4), pp.516-526.
Doolan, P., Clarke, C., Kinsella, P., Breen, L., Meleady, P., Leonard, M., Zhang, L.,
Clynes, M., Aherne, S.T. and Barron, N. 2013. Transcriptomic analysis of clonal growth
rate variation during CHO cell line development. Journal of Biotechnology, 166(3), pp.105-
113.
Doolan, P., Meleady, P., Barron, N., Henry, M., Gallagher, R., Gammell, P., Melville, M.,
Sinacore, M., McCarthy, K., Leonard, M., Charlebois, T. and Clynes, M. 2010. Microarray
and proteomics expression profiling identifies several candidates, including the valosin-
containing protein (VCP), involved in regulating high cellular growth rate in production
CHO cell lines. Biotechnology and Bioengineering, 106(1), pp.42-56.
Dorai, H., Corisdeo, S., Ellis, D., Kinney, C., Chomo, M., Hawley-Nelson, P., Moore, G.,
Betenbaugh, M.J. and Ganguly, S. 2012. Early prediction of instability of chinese hamster
ovary cell lines expressing recombinant antibodies and antibody-fusion proteins.
Biotechnology and Bioengineering, 109(4), pp.1016-1030.
Dorai, H., Ellis, D., Keung, Y.S., Campbell, M., Zhuang, M., Lin, C. and Betenbaugh, M.J.
2010. Combining high-throughput screening of caspase activity with anti-apoptosis genes

384
for development of robust CHO production cell lines. Biotechnology Progress, 26(5),
pp.1367-1381.
Dorai, H., Kyung, Y.S., Ellis, D., Kinney, C., Lin, C., Jan, D., Moore, G. and Betenbaugh,
M.J. 2009. Expression of anti-apoptosis genes alters lactate metabolism of chinese hamster
ovary cells in culture. Biotechnology and Bioengineering, 103(3), pp.592-608.
Dreesen, I.A. and Fussenegger, M. 2010. Ectopic expression of human mTOR increases
viability, robustness, cell size, proliferation, and antibody production of chinese hamster
ovary cells. Biotechnology and Bioengineering,
Dresios, J., Aschrafi, A., Owens, G.C., Vanderklish, P.W., Edelman, G.M. and Mauro, V.P.
2005. Cold stress-induced protein Rbm3 binds 60S ribosomal subunits, alters microRNA
levels, and enhances global protein synthesis. Proceedings of the National Academy of
Sciences of the United States of America, 102(6), pp.1865-1870.
Druz, A., Chu, C., Majors, B., Santuary, R., Betenbaugh, M. and Shiloach, J. 2011. A novel
microRNA mmu-miR-466h affects apoptosis regulation in mammalian cells. Biotechnology
and Bioengineering, 108(7), pp.1651-1661.
Duckett, C.S., Li, F., Wang, Y., Tomaselli, K.J., Thompson, C.B. and Armstrong, R.C.
1998. Human IAP-like protein regulates programmed cell death downstream of bcl-xL and
cytochrome c. Molecular and Cellular Biology, 18(1), pp.608-615.
Durai, S., Mani, M., Kandavelou, K., Wu, J., Porteus, M.H. and Chandrasegaran, S. 2005.
Zinc finger nucleases: Custom-designed molecular scissors for genome engineering of plant
and mammalian cells. Nucleic Acids Research, 33(18), pp.5978-5990.
Dweep, H., Sticht, C., Pandey, P. and Gretz, N. 2011. miRWalk--database: Prediction of
possible miRNA binding sites by "walking" the genes of three genomes. Journal of
Biomedical Informatics, 44(5), pp.839-847.
Eckelman, B.P., Salvesen, G.S. and Scott, F.L. 2006. Human inhibitor of apoptosis
proteins: Why XIAP is the black sheep of the family. EMBO Reports, 7(10), pp.988-994.
Ecker, J.R., Bickmore, W.A., Barroso, I., Pritchard, J.K., Gilad, Y. and Segal, E. 2012.
Genomics: ENCODE explained. Nature, 489(7414), pp.52-55.
Ehrbar, M., Schoenmakers, R., Christen, E.H., Fussenegger, M. and Weber, W. 2008.
Drug-sensing hydrogels for the inducible release of biopharmaceuticals. Nature Materials,
7(10), pp.800-804.
Epinat, J.C., Arnould, S., Chames, P., Rochaix, P., Desfontaines, D., Puzin, C., Patin, A.,
Zanghellini, A., Paques, F. and Lacroix, E. 2003. A novel engineered meganuclease
induces homologous recombination in yeast and mammalian cells. Nucleic Acids Research,
31(11), pp.2952-2962.

385
Eschenburg, G., Eggert, A., Schramm, A., Lode, H.N. and Hundsdoerfer, P. 2012. Smac
mimetic LBW242 sensitizes XIAP-overexpressing neuroblastoma cells for TNF-alpha-
independent apoptosis. Cancer Research, 72(10), pp.2645-2656.
Farre, D., Roset, R., Huerta, M., Adsuara, J.E., Rosello, L., Alba, M.M. and Messeguer, X.
2003. Identification of patterns in biological sequences at the ALGGEN server: PROMO
and MALGEN. Nucleic Acids Research, 31(13), pp.3651-3653.
Feng, G., Hicks, P. and Chang, P.L. 2003. Differential expression of mammalian or viral
promoter-driven gene in adherent versus suspension cells. In Vitro Cellular &
Developmental Biology.Animal, 39(10), pp.420-423.
Figueroa, B.,Jr, Ailor, E., Osborne, D., Hardwick, J.M., Reff, M. and Betenbaugh, M.J.
2007. Enhanced cell culture performance using inducible anti-apoptotic genes E1B-19K
and aven in the production of a monoclonal antibody with chinese hamster ovary cells.
Biotechnology and Bioengineering, 97(4), pp.877-892.
Fire, A., Xu, S., Montgomery, M.K., Kostas, S.A., Driver, S.E. and Mello, C.C. 1998.
Potent and specific genetic interference by double-stranded RNA in caenorhabditis elegans.
Nature, 391(6669), pp.806-811.
Fischer, S., Buck, T., Wagner, A., Ehrhart, C., Giancaterino, J., Mang, S., Schad, M.,
Mathias, S., Aschrafi, A., Handrick, R. and Otte, K. 2014. A functional high-content
miRNA screen identifies miR-30 family to boost recombinant protein production in CHO
cells. Biotechnology Journal,
Foecking, M.K. and Hofstetter, H. 1986. Powerful and versatile enhancer-promoter unit for
mammalian expression vectors. Gene, 45(1), pp.101-105.
Fogolin, M.B., Wagner, R., Etcheverrigaray, M. and Kratje, R. 2004. Impact of temperature
reduction and expression of yeast pyruvate carboxylase on hGM-CSF-producing CHO
cells. Journal of Biotechnology, 109(1-2), pp.179-191.
Fox, S.R., Yap, M.X., Yap, M.G. and Wang, D.I. 2005. Active hypothermic growth: A
novel means for increasing total interferon-gamma production by chinese-hamster ovary
cells. Biotechnology and Applied Biochemistry, 41(Pt 3), pp.265-272.
Fuchs, O. 2006. EVI1 and its role in myelodysplastic syndrome, myeloid leukemia and
other malignant diseases. Casopis Lekaru Ceskych, 145(8), pp.619-624.
Fujita, J. 1999. Cold shock response in mammalian cells. Journal of Molecular
Microbiology and Biotechnology, 1(2), pp.243-255.
Fukunaga, K. and Shioda, N. 2009. Pathophysiological relevance of forkhead transcription
factors in brain ischemia. Advances in Experimental Medicine and Biology, 665pp.130-142.

386
Furukawa, K. and Ohsuye, K. 1998. Effect of culture temperature on a recombinant CHO
cell line producing a C-terminal alpha-amidating enzyme. Cytotechnology, 26(2), pp.153-
164.
Fussenegger, M. 2001. The impact of mammalian gene regulation concepts on functional
genomic research, metabolic engineering, and advanced gene therapies. Biotechnology
Progress, 17(1), pp.1-51.
Fussenegger, M., Mazur, X. and Bailey, J.E. 1998. pTRIDENT, a novel vector family for
tricistronic gene expression in mammalian cells. Biotechnology and Bioengineering, 57(1),
pp.1-10.
Fussenegger, M., Mazur, X. and Bailey, J.E. 1997. A novel cytostatic process enhances the
productivity of chinese hamster ovary cells. Biotechnology and Bioengineering, 55(6),
pp.927-939.
Fussenegger, M., Moser, S., Mazur, X. and Bailey, J.E. 1997. Autoregulated multicistronic
expression vectors provide one-step cloning of regulated product gene expression in
mammalian cells. Biotechnology Progress, 13(6), pp.733-740.
Fussenegger, M., Schlatter, S., Datwyler, D., Mazur, X. and Bailey, J.E. 1998. Controlled
proliferation by multigene metabolic engineering enhances the productivity of chinese
hamster ovary cells. Nature Biotechnology, 16(5), pp.468-472.
Fux, C., Langer, D., Kelm, J.M., Weber, W. and Fussenegger, M. 2004. New-generation
multicistronic expression platform: PTRIDENT vectors containing size-optimized IRES
elements enable homing endonuclease-based cistron swapping into lentiviral expression
vectors. Biotechnology and Bioengineering, 86(2), pp.174-187.
Gagniuc, P. and Ionescu-Tirgoviste, C. 2012. Eukaryotic genomes may exhibit up to 10
generic classes of gene promoters. BMC Genomics, 13pp.512-2164-13-512.
Gaillet, B., Gilbert, R., Broussau, S., Pilotte, A., Malenfant, F., Mullick, A., Garnier, A. and
Massie, B. 2010. High-level recombinant protein production in CHO cells using lentiviral
vectors and the cumate gene-switch. Biotechnology and Bioengineering, 106(2), pp.203-
215.
Ganem, C., Devaux, F., Torchet, C., Jacq, C., Quevillon-Cheruel, S., Labesse, G., Facca, C.
and Faye, G. 2003. Ssu72 is a phosphatase essential for transcription termination of
snoRNAs and specific mRNAs in yeast. The EMBO Journal, 22(7), pp.1588-1598.
Gaj, T., Gersbach, C.A. and Barbas, C.F.,3rd. 2013. ZFN, TALEN, and CRISPR/Cas-based
methods for genome engineering. Trends in Biotechnology, 31(7), pp.397-405.

387
Gammell, P., Barron, N., Kumar, N. and Clynes, M. 2007. Initial identification of low
temperature and culture stage induction of miRNA expression in suspension CHO-K1 cells.
Journal of Biotechnology, 130(3), pp.213-218.
Garcia-Otin, A.L. and Guillou, F. 2006. Mammalian genome targeting using site-specific
recombinases. Frontiers in Bioscience : A Journal and Virtual Library, 11pp.1108-1136.
Garcia, D.M., Baek, D., Shin, C., Bell, G.W., Grimson, A. and Bartel, D.P. 2011. Weak
seed-pairing stability and high target-site abundance decrease the proficiency of lsy-6 and
other microRNAs. Nature Structural & Molecular Biology, 18(10), pp.1139-1146.
Garrido, C., Brunet, M., Didelot, C., Zermati, Y., Schmitt, E. and Kroemer, G. 2006. Heat
shock proteins 27 and 70: Anti-apoptotic proteins with tumorigenic properties. Cell Cycle
(Georgetown, Tex.), 5(22), pp.2592-2601.
Geiduschek, E.P. and Tocchini-Valentini, G.P. 1988. Transcription by RNA polymerase
III. Annual Review of Biochemistry, 57pp.873-914.
Ghorbaniaghdam, A., Chen, J., Henry, O. and Jolicoeur, M. 2014. Analyzing clonal
variation of monoclonal antibody-producing CHO cell lines using an in silico metabolomic
platform. PloS One, 9(3), pp.e90832.
Gillissen, B., Richter, A., Richter, A., Overkamp, T., Essmann, F., Hemmati, P.G.,
Preissner, R., Belka, C. and Daniel, P.T. 2013. Targeted therapy of the XIAP/proteasome
pathway overcomes TRAIL-resistance in carcinoma by switching apoptosis signaling to a
Bax/Bak-independent 'type I' mode. Cell Death & Disease, 4pp.e643.
Girod, P.A., Zahn-Zabal, M. and Mermod, N. 2005. Use of the chicken lysozyme 5' matrix
attachment region to generate high producer CHO cell lines. Biotechnology and
Bioengineering, 91(1), pp.1-11.
Gomez, N., Subramanian, J., Ouyang, J., Nguyen, M.D., Hutchinson, M., Sharma, V.K.,
Lin, A.A. and Yuk, I.H. 2012. Culture temperature modulates aggregation of recombinant
antibody in cho cells. Biotechnology and Bioengineering, 109(1), pp.125-136.
Gossen, M. and Bujard, H. 1992. Tight control of gene expression in mammalian cells by
tetracycline-responsive promoters. Proceedings of the National Academy of Sciences of the
United States of America, 89(12), pp.5547-5551.
Gratz, S.J., Wildonger, J., Harrison, M.M. and O'Connor-Giles, K.M. 2013. CRISPR/Cas9-
mediated genome engineering and the promise of designer flies on demand. Fly, 7(4),
pp.249-255.
Greber, D. and Fussenegger, M. 2007. Mammalian synthetic biology: Engineering of
sophisticated gene networks. Journal of Biotechnology, 130(4), pp.329-345.

388
Grimson, A., Farh, K.K., Johnston, W.K., Garrett-Engele, P., Lim, L.P. and Bartel, D.P.
2007. MicroRNA targeting specificity in mammals: Determinants beyond seed pairing.
Molecular Cell, 27(1), pp.91-105.
Grissa, I., Vergnaud, G. and Pourcel, C. 2007. The CRISPRdb database and tools to display
CRISPRs and to generate dictionaries of spacers and repeats. BMC Bioinformatics,
8pp.172.
Grizot, S., Smith, J., Daboussi, F., Prieto, J., Redondo, P., Merino, N., Villate, M., Thomas,
S., Lemaire, L., Montoya, G., Blanco, F.J., Paques, F. and Duchateau, P. 2009. Efficient
targeting of a SCID gene by an engineered single-chain homing endonuclease. Nucleic
Acids Research, 37(16), pp.5405-5419.
Gronenborn, B. 1976. Overproduction of phage lambda repressor under control of the lac
promotor of escherichia coli. Molecular & General Genetics : MGG, 148(3), pp.243-250.
Grummt, I. 1999. Regulation of mammalian ribosomal gene transcription by RNA
polymerase I. Progress in Nucleic Acid Research and Molecular Biology, 62pp.109-154.
Gu, L., Zhu, N., Zhang, H., Durden, D.L., Feng, Y. and Zhou, M. 2009. Regulation of
XIAP translation and induction by MDM2 following irradiation. Cancer Cell, 15(5),
pp.363-375.
Gualerzi, C.O., Giuliodori, A.M. and Pon, C.L. 2003. Transcriptional and post-
transcriptional control of cold-shock genes. Journal of Molecular Biology, 331(3), pp.527-
539.
Gyrd-Hansen, M., Darding, M., Miasari, M., Santoro, M.M., Zender, L., Xue, W., Tenev,
T., da Fonseca, P.C., Zvelebil, M., Bujnicki, J.M., Lowe, S., Silke, J. and Meier, P. 2008.
IAPs contain an evolutionarily conserved ubiquitin-binding domain that regulates NF-
kappaB as well as cell survival and oncogenesis. Nature Cell Biology, 10(11), pp.1309-
1317.
Hackl, M., Jadhav, V., Jakobi, T., Rupp, O., Brinkrolf, K., Goesmann, A., Puhler, A., Noll,
T., Borth, N. and Grillari, J. 2012. Computational identification of microRNA gene loci and
precursor microRNA sequences in CHO cell lines. Journal of Biotechnology, 158(3),
pp.151-155.
Hackl, M., Jakobi, T., Blom, J., Doppmeier, D., Brinkrolf, K., Szczepanowski, R.,
Bernhart, S.H., Honer Zu Siederdissen, C., Bort, J.A., Wieser, M., Kunert, R., Jeffs, S.,
Hofacker, I.L., Goesmann, A., Puhler, A., Borth, N. and Grillari, J. 2011. Next-generation
sequencing of the chinese hamster ovary microRNA transcriptome: Identification,
annotation and profiling of microRNAs as targets for cellular engineering. Journal of
Biotechnology, 153(1-2), pp.62-75.

389
Hafner, M., Landthaler, M., Burger, L., Khorshid, M., Hausser, J., Berninger, P.,
Rothballer, A., Ascano, M., Jungkamp, A.C., Munschauer, M., Ulrich, A., Wardle, G.S.,
Dewell, S., Zavolan, M. and Tuschl, T. 2010. PAR-CliP--a method to identify
transcriptome-wide the binding sites of RNA binding proteins. Journal of Visualized
Experiments : JoVE, (41). pii: 2034. doi(41), pp.10.3791/2034.
Hafner, M., Lianoglou, S., Tuschl, T. and Betel, D. 2012. Genome-wide identification of
miRNA targets by PAR-CLIP. Methods (San Diego, Calif.), 58(2), pp.94-105.
Hahn, S. 2004. Structure and mechanism of the RNA polymerase II transcription
machinery. Nature Structural & Molecular Biology, 11(5), pp.394-403.
Hammer, K., Mijakovic, I. and Jensen, P.R. 2006. Synthetic promoter libraries--tuning of
gene expression. Trends in Biotechnology, 24(2), pp.53-55.
Hammond, S., Kaplarevic, M., Borth, N., Betenbaugh, M.J. and Lee, K.H. 2012. Chinese
hamster genome database: An online resource for the CHO community at
www.CHOgenome.org. Biotechnology and Bioengineering, 109(6), pp.1353-1356.
Han, Y.K., Kim, Y.G., Kim, J.Y. and Lee, G.M. 2010. Hyperosmotic stress induces
autophagy and apoptosis in recombinant chinese hamster ovary cell culture. Biotechnology
and Bioengineering, 105(6), pp.1187-1192.
Handstad, T., Rye, M., Mocnik, R., Drablos, F. and Saetrom, P. 2012. Cell-type specificity
of ChIP-predicted transcription factor binding sites. BMC Genomics, 13pp.372-2164-13-
372.
Haqq, C.M., King, C.Y., Donahoe, P.K. and Weiss, M.A. 1993. SRY recognizes conserved
DNA sites in sex-specific promoters. Proceedings of the National Academy of Sciences of
the United States of America, 90(3), pp.1097-1101.
Hartenbach, S. and Fussenegger, M. 2006. A novel synthetic mammalian promoter derived
from an internal ribosome entry site. Biotechnology and Bioengineering, 95(4), pp.547-559.
Hartenbach, S. and Fussenegger, M. 2005. Autoregulated, bidirectional and multicistronic
gas-inducible mammalian as well as lentiviral expression vectors. Journal of
Biotechnology, 120(1), pp.83-98.
Harraghy, N., Buceta, M., Regamey, A., Girod, P.A. and Mermod, N. 2012. Using matrix
attachment regions to improve recombinant protein production. Methods in Molecular
Biology (Clifton, N.J.), 801pp.93-110.
Harraghy, N., Regamey, A., Girod, P.A. and Mermod, N. 2011. Identification of a potent
MAR element from the mouse genome and assessment of its activity in stable and transient
transfections. Journal of Biotechnology, 154(1), pp.11-20.

390
Hartenbach, S. and Fussenegger, M. 2006. A novel synthetic mammalian promoter derived
from an internal ribosome entry site. Biotechnology and Bioengineering, 95(4), pp.547-559.
Hartenbach, S. and Fussenegger, M. 2005. Autoregulated, bidirectional and multicistronic
gas-inducible mammalian as well as lentiviral expression vectors. Journal of
Biotechnology, 120(1), pp.83-98.
Hassan, T., Smith, S.G., Gaughan, K., Oglesby, I.K., O'Neill, S., McElvaney, N.G. and
Greene, C.M. 2013. Isolation and identification of cell-specific microRNAs targeting a
messenger RNA using a biotinylated anti-sense oligonucleotide capture affinity technique.
Nucleic Acids Research, 41(6), pp.e71.
Haverkamp, S., Inta, D., Monyer, H. and Wassle, H. 2009. Expression analysis of green
fluorescent protein in retinal neurons of four transgenic mouse lines. Neuroscience, 160(1),
pp.126-139.
Hayashita, Y., Osada, H., Tatematsu, Y., Yamada, H., Yanagisawa, K., Tomida, S., Yatabe,
Y., Kawahara, K., Sekido, Y. and Takahashi, T. 2005. A polycistronic microRNA cluster,
miR-17-92, is overexpressed in human lung cancers and enhances cell proliferation. Cancer
Research, 65(21), pp.9628-9632.
He, X., Khan, A.U., Cheng, H., Pappas, D.L.,Jr, Hampsey, M. and Moore, C.L. 2003.
Functional interactions between the transcription and mRNA 3' end processing machineries
mediated by Ssu72 and Sub1. Genes & Development, 17(8), pp.1030-1042.
Heintzman, N.D. and Ren, B. 2007. The gateway to transcription: Identifying,
characterizing and understanding promoters in the eukaryotic genome. Cellular and
Molecular Life Sciences : CMLS, 64(4), pp.386-400.
Hernandez Bort, J.A., Hackl, M., Hoflmayer, H., Jadhav, V., Harreither, E., Kumar, N.,
Ernst, W., Grillari, J. and Borth, N. 2012. Dynamic mRNA and miRNA profiling of CHO-
K1 suspension cell cultures. Biotechnology Journal, 7(4), pp.500-515.
Higashijima, A., Miura, K., Mishima, H., Kinoshita, A., Jo, O., Abe, S., Hasegawa, Y.,
Miura, S., Yamasaki, K., Yoshida, A., Yoshiura, K. and Masuzaki, H. 2013.
Characterization of placenta-specific microRNAs in fetal growth restriction pregnancy.
Prenatal Diagnosis, 33(3), pp.214-222.
Hiramatsu, R., Matoba, S., Kanai-Azuma, M., Tsunekawa, N., Katoh-Fukui, Y.,
Kurohmaru, M., Morohashi, K., Wilhelm, D., Koopman, P. and Kanai, Y. 2009. A critical
time window of sry action in gonadal sex determination in mice. Development (Cambridge,
England), 136(1), pp.129-138.
Hockemeyer, D., Wang, H., Kiani, S., Lai, C.S., Gao, Q., Cassady, J.P., Cost, G.J., Zhang,
L., Santiago, Y., Miller, J.C., Zeitler, B., Cherone, J.M., Meng, X., Hinkley, S.J., Rebar,

391
E.J., Gregory, P.D., Urnov, F.D. and Jaenisch, R. 2011. Genetic engineering of human
pluripotent cells using TALE nucleases. Nature Biotechnology, 29(8), pp.731-734.
Holcik, M. 2003. Translational upregulation of the X-linked inhibitor of apoptosis. Annals
of the New York Academy of Sciences, 1010pp.249-258.
Hollenhorst, P.C., Jones, D.A. and Graves, B.J. 2004. Expression profiles frame the
promoter specificity dilemma of the ETS family of transcription factors. Nucleic Acids
Research, 32(18), pp.5693-5702.
Hong, J.K., Lee, G.M. and Yoon, S.K. 2011. Growth factor withdrawal in combination
with sodium butyrate addition extends culture longevity and enhances antibody production
in CHO cells. Journal of Biotechnology, 155(2), pp.225-231.
Hong, J.K., Kim, Y., Yoon, S.K. and Lee, G.M. 2007. Down-regulation of cold-inducible
RNA-binding protein does not improve hypothermic growth of chinese hamster ovary cells
producing erythropoietin. Metabolic Engineering, 9(2), pp.208-216.
Howe, E.N., Cochrane, D.R. and Richer, J.K. 2012. The miR-200 and miR-221/222
microRNA families: Opposing effects on epithelial identity. Journal of Mammary Gland
Biology and Neoplasia, 17(1), pp.65-77.
Hsu, R.J. and Tsai, H.J. 2011. Performing the labeled microRNA pull-down (LAMP) assay
system: An experimental approach for high-throughput identification of microRNA-target
mRNAs. Methods in Molecular Biology (Clifton, N.J.), 764pp.241-247.
Huang, E.P., Marquis, C.P. and Gray, P.P. 2004. Process development for a recombinant
chinese hamster ovary (CHO) cell line utilizing a metal induced and amplified
metallothionein expression system. Biotechnology and Bioengineering, 88(4), pp.437-450.
Huang, Y., Park, Y.C., Rich, R.L., Segal, D., Myszka, D.G. and Wu, H. 2001. Structural
basis of caspase inhibition by XIAP: Differential roles of the linker versus the BIR domain.
Cell, 104(5), pp.781-790.
Hunter, A.M., LaCasse, E.C. and Korneluk, R.G. 2007. The inhibitors of apoptosis (IAPs)
as cancer targets. Apoptosis : An International Journal on Programmed Cell Death, 12(9),
pp.1543-1568.
Hwang, S.O. and Lee, G.M. 2009. Effect of akt overexpression on programmed cell death
in antibody-producing chinese hamster ovary cells. Journal of Biotechnology, 139(1),
pp.89-94.
Hwang, S.O. and Lee, G.M. 2008. Nutrient deprivation induces autophagy as well as
apoptosis in chinese hamster ovary cell culture. Biotechnology and Bioengineering, 99(3),
pp.678-685.

392
Ifandi, V. and Al-Rubeai, M. 2005. Regulation of cell proliferation and apoptosis in CHO-
K1 cells by the coexpression of c-myc and bcl-2. Biotechnology Progress, 21(3), pp.671-
677.
Iwakuma, T. and Lozano, G. 2003. MDM2, an introduction. Molecular Cancer Research :
MCR, 1(14), pp.993-1000.
Jadhav, V., Hackl, M., Bort, J.A., Wieser, M., Harreither, E., Kunert, R., Borth, N. and
Grillari, J. 2012. A screening method to assess biological effects of microRNA
overexpression in chinese hamster ovary cells. Biotechnology and Bioengineering, 109(6),
pp.1376-1385.
Jadhav, V., Hackl, M., Druz, A., Shridhar, S., Chung, C.Y., Heffner, K.M., Kreil, D.P.,
Betenbaugh, M., Shiloach, J., Barron, N., Grillari, J. and Borth, N. 2013. CHO microRNA
engineering is growing up: Recent successes and future challenges. Biotechnology
Advances, 31(8), pp.1501-1513.
Jain, K.K. 2013. Synthetic biology and personalized medicine. Medical Principles and
Practice : International Journal of the Kuwait University, Health Science Centre, 22(3),
pp.209-219.
Jalali, S., Bhartiya, D., Lalwani, M.K., Sivasubbu, S. and Scaria, V. 2013. Systematic
transcriptome wide analysis of lncRNA-miRNA interactions. PloS One, 8(2), pp.e53823.
James, R.I., Elton, J.P., Todd, P. and Kompala, D.S. 2000. Engineering CHO cells to
overexpress a secreted reporter protein upon induction from mouse mammary tumor virus
promoter. Biotechnology and Bioengineering, 67(2), pp.134-140.
Jayapal, K.P., Wlaschin, K.F., Hu, W. and Yap, M.G.S. 2007. Recombinant protein
therapeutics from cho cells - 20 years and counting. CHO Consortium: SBE Special
Edition, pp.40-47.
Jadhav, V., Hackl, M., Druz, A., Shridhar, S., Chung, C.Y., Heffner, K.M., Kreil, D.P.,
Betenbaugh, M., Shiloach, J., Barron, N., Grillari, J. and Borth, N. 2013. CHO microRNA
engineering is growing up: Recent successes and future challenges. Biotechnology
Advances, 31(8), pp.1501-1513.
Jadhav, V., Hackl, M., Klanert, G., Hernandez Bort, J.A., Kunert, R., Grillari, J. and Borth,
N. 2014. Stable overexpression of miR-17 enhances recombinant protein production of
CHO cells. Journal of Biotechnology, 175pp.38-44.
Jayme, D.W. 1999. An animal origin perspective of common constituents of serum-free
medium formulations. Developments in Biological Standardization, 99pp.181-187.

393
Jayme, D.W. and Smith, S.R. 2000. Media formulation options and manufacturing process
controls to safeguard against introduction of animal origin contaminants in animal cell
culture. Cytotechnology, 33(1-3), pp.27-36.
Jeon, M.K. and Lee, G.M. 2007. Correlation between enhancing effect of sodium butyrate
on specific productivity and mRNA transcription level in recombinant chinese hamster
ovary cells producing antibody. Journal of Microbiology and Biotechnology, 17(6),
pp.1036-1040.
Ji, M., Rao, E., Ramachandrareddy, H., Shen, Y., Jiang, C., Chen, J., Hu, Y., Rizzino, A.,
Chan, W.C., Fu, K. and McKeithan, T.W. 2011. The miR-17-92 microRNA cluster is
regulated by multiple mechanisms in B-cell malignancies. The American Journal of
Pathology, 179(4), pp.1645-1656.
Jiang, S., Li, C., Olive, V., Lykken, E., Feng, F., Sevilla, J., Wan, Y., He, L. and Li, Q.J.
2011. Molecular dissection of the miR-17-92 cluster's critical dual roles in promoting Th1
responses and preventing inducible treg differentiation. Blood, 118(20), pp.5487-5497.
Jiang, W., Hou, Y. and Inouye, M. 1997. CspA, the major cold-shock protein of escherichia
coli, is an RNA chaperone. The Journal of Biological Chemistry, 272(1), pp.196-202.
Jiang, Z. and Sharfstein, S.T. 2008. Sodium butyrate stimulates monoclonal antibody over-
expression in CHO cells by improving gene accessibility. Biotechnology and
Bioengineering, 100(1), pp.189-194.
Jin, H.Y., Lai, M. and Xiao, C. 2014. microRNA-17~92 is a powerful cancer driver and a
therapeutic target. Cell Cycle (Georgetown, Tex.), 13(4), pp.495-496.
Jinek, M., Chylinski, K., Fonfara, I., Hauer, M., Doudna, J.A. and Charpentier, E. 2012. A
programmable dual-RNA-guided DNA endonuclease in adaptive bacterial immunity.
Science (New York, N.Y.), 337(6096), pp.816-821.
Josse, L., Smales, C.M. and Tuite, M.F. 2012. Engineering the chaperone network of CHO
cells for optimal recombinant protein production and authenticity. Methods in Molecular
Biology (Clifton, N.J.), 824pp.595-608.
Joung, J.K. and Sander, J.D. 2013. TALENs: A widely applicable technology for targeted
genome editing. Nature Reviews.Molecular Cell Biology, 14(1), pp.49-55.
Kadonaga, J.T. 2004. Regulation of RNA polymerase II transcription by sequence-specific
DNA binding factors. Cell, 116(2), pp.247-257.
Kameyama, Y., Kawabe, Y., Ito, A. and Kamihira, M. 2010. An accumulative site-specific
gene integration system using cre recombinase-mediated cassette exchange. Biotechnology
and Bioengineering, 105(6), pp.1106-1114.
394
Kaneko, T. and Kibayashi, K. 2012. Mild hypothermia facilitates the expression of cold-
inducible RNA-binding protein and heat shock protein 70.1 in mouse brain. Brain
Research, 1466pp.128-136.
Kantardjieff, A., Jacob, N.M., Yee, J.C., Epstein, E., Kok, Y.J., Philp, R., Betenbaugh, M.
and Hu, W.S. 2010. Transcriptome and proteome analysis of chinese hamster ovary cells
under low temperature and butyrate treatment. Journal of Biotechnology, 145(2), pp.143-
159.
Kantardjieff, A., Jacob, N.M., Yee, J.C., Epstein, E., Kok, Y.J., Philp, R., Betenbaugh, M.
and Hu, W.S. 2010. Transcriptome and proteome analysis of chinese hamster ovary cells
under low temperature and butyrate treatment. Journal of Biotechnology, 145(2), pp.143-
159.
Kantardjieff, A., Nissom, P.M., Chuah, S.H., Yusufi, F., Jacob, N.M., Mulukutla, B.C.,
Yap, M. and Hu, W.S. 2009. Developing genomic platforms for chinese hamster ovary
cells. Biotechnology Advances, 27(6), pp.1028-1035.
Kantardjieff, A. and Zhou, W. 2014. Mammalian cell cultures for biologics manufacturing.
Advances in Biochemical Engineering/Biotechnology, 139pp.1-9.
Kashimada, K. and Koopman, P. 2010. Sry: The master switch in mammalian sex
determination. Development (Cambridge, England), 137(23), pp.3921-3930.
Kaufman, R.J. 1990. Selection and coamplification of heterologous genes in mammalian
cells. Methods in Enzymology, 185pp.537-566.
Kaufmann, H., Mazur, X., Fussenegger, M. and Bailey, J.E. 1999. Influence of low
temperature on productivity, proteome and protein phosphorylation of CHO cells.
Biotechnology and Bioengineering, 63(5), pp.573-582.
Kaufmann, H., Mazur, X., Marone, R., Bailey, J.E. and Fussenegger, M. 2001.
Comparative analysis of two controlled proliferation strategies regarding product quality,
influence on tetracycline-regulated gene expression, and productivity. Biotechnology and
Bioengineering, 72(6), pp.592-602.
Kim, H.S. and Lee, G.M. 2007. Differences in optimal pH and temperature for cell growth
and antibody production between two chinese hamster ovary clones derived from the same
parental clone. Journal of Microbiology and Biotechnology, 17(5), pp.712-720.
Kim, Y.G., Kim, J.Y. and Lee, G.M. 2009. Effect of XIAP overexpression on sodium
butyrate-induced apoptosis in recombinant chinese hamster ovary cells producing
erythropoietin. Journal of Biotechnology, 144(4), pp.299-303.

395
Kito, M., Itami, S., Fukano, Y., Yamana, K. and Shibui, T. 2002. Construction of
engineered CHO strains for high-level production of recombinant proteins. Applied
Microbiology and Biotechnology, 60(4), pp.442-448.
Knappskog, S. and Lonning, P.E. 2011. MDM2 promoter SNP285 and SNP309; phylogeny
and impact on cancer risk. Oncotarget, 2(3), pp.251-258.
Koh, E.Y., Ho, S.C., Mariati, Song, Z., Bi, X., Bardor, M. and Yang, Y. 2013. An internal
ribosome entry site (IRES) mutant library for tuning expression level of multiple genes in
mammalian cells. PloS One, 8(12), pp.e82100.
Koonin, E.V. and Makarova, K.S. 2013. CRISPR-cas: Evolution of an RNA-based adaptive
immunity system in prokaryotes. RNA Biology, 10(5), pp.679-686.
Kotlabova, K., Doucha, J. and Hromadnikova, I. 2011. Placental-specific microRNA in
maternal circulation--identification of appropriate pregnancy-associated microRNAs with
diagnostic potential. Journal of Reproductive Immunology, 89(2), pp.185-191.
Kozak, M. 2003. Alternative ways to think about mRNA sequences and proteins that
appear to promote internal initiation of translation. Gene, 318pp.1-23.
Kramer, B.P., Viretta, A.U., Daoud-El-Baba, M., Aubel, D., Weber, W. and Fussenegger,
M. 2004. An engineered epigenetic transgene switch in mammalian cells. Nature
Biotechnology, 22(7), pp.867-870.
Kramer, O., Klausing, S. and Noll, T. 2010. Methods in mammalian cell line engineering:
From random mutagenesis to sequence-specific approaches. Applied Microbiology and
Biotechnology, 88(2), pp.425-436.
Krampe, B. and Al-Rubeai, M. 2010. Cell death in mammalian cell culture: Molecular
mechanisms and cell line engineering strategies. Cytotechnology, 62(3), pp.175-188.
Krishnamurthy, S., He, X., Reyes-Reyes, M., Moore, C. and Hampsey, M. 2004. Ssu72 is
an RNA polymerase II CTD phosphatase. Molecular Cell, 14(3), pp.387-394.
Krysko, D.V., Vanden Berghe, T., Parthoens, E., D'Herde, K. and Vandenabeele, P. 2008.
Methods for distinguishing apoptotic from necrotic cells and measuring their clearance.
Methods in Enzymology, 442pp.307-341.
Kumar, N., Gammell, P. and Clynes, M. 2007. Proliferation control strategies to improve
productivity and survival during CHO based production culture : A summary of recent
methods employed and the effects of proliferation control in product secreting CHO cell
lines. Cytotechnology, 53(1-3), pp.33-46.
Kumar, N., Maurya, P., Gammell, P., Dowling, P., Clynes, M. and Meleady, P. 2008b.
Proteomic profiling of secreted proteins from CHO cells using surface-enhanced laser

396
desorption ionization time-of-flight mass spectrometry. Biotechnology Progress, 24(1),
pp.273-278.
Kurokawa, M., Mitani, K., Irie, K., Matsuyama, T., Takahashi, T., Chiba, S., Yazaki, Y.,
Matsumoto, K. and Hirai, H. 1998. The oncoprotein evi-1 represses TGF-beta signalling by
inhibiting Smad3. Nature, 394(6688), pp.92-96.
Kuystermans, D. and Al-Rubeai, M. 2009. cMyc increases cell number through uncoupling
of cell division from cell size in CHO cells. BMC Biotechnology, 9pp.76-6750-9-76.
Kussie, P.H., Gorina, S., Marechal, V., Elenbaas, B., Moreau, J., Levine, A.J. and
Pavletich, N.P. 1996. Structure of the MDM2 oncoprotein bound to the p53 tumor
suppressor transactivation domain. Science (New York, N.Y.), 274(5289), pp.948-953.
Lalonde, M.E., Ouimet, M., Lariviere, M., Kritikou, E.A. and Sinnett, D. 2012.
Identification of functional DNA variants in the constitutive promoter region of MDM2.
Human Genomics, 6pp.15-7364-6-15.
Lautermann, J., Dehne, N., Schacht, J. and Jahnke, K. 2004. Aminoglycoside- and
cisplatin-ototoxicity: From basic science to clinics. Laryngo- Rhino- Otologie, 83(5),
pp.317-323.
Le, H., Vishwanathan, N., Kantardjieff, A., Doo, I., Srienc, M., Zheng, X., Somia, N. and
Hu, W.S. 2013. Dynamic gene expression for metabolic engineering of mammalian cells in
culture. Metabolic Engineering, 20pp.212-220.
Lee, J.S., Ha, T.K., Park, J.H. and Lee, G.M. 2013. Anti-cell death engineering of CHO
cells: Co-overexpression of bcl-2 for apoptosis inhibition, beclin-1 for autophagy induction.
Biotechnology and Bioengineering, 110(8), pp.2195-2207.
Lee, J.S., Kim, Y.J., Kim, C.L. and Lee, G.M. 2012. Differential induction of autophagy in
caspase-3/7 down-regulating and bcl-2 overexpressing recombinant CHO cells subjected to
sodium butyrate treatment. Journal of Biotechnology, 161(1), pp.34-41.
Lee, J.Y., Kim, S., Hwang do, W., Jeong, J.M., Chung, J.K., Lee, M.C. and Lee, D.S. 2008.
Development of a dual-luciferase reporter system for in vivo visualization of MicroRNA
biogenesis and posttranscriptional regulation. Journal of Nuclear Medicine : Official
Publication, Society of Nuclear Medicine, 49(2), pp.285-294.
Lee, Y.Y., Wong, K.T., Tan, J., Toh, P.C., Mao, Y., Brusic, V. and Yap, M.G. 2009.
Overexpression of heat shock proteins (HSPs) in CHO cells for extended culture viability
and improved recombinant protein production. Journal of Biotechnology, 143(1), pp.34-43.
Leung, R.K. and Whittaker, P.A. 2005. RNA interference: From gene silencing to gene-
specific therapeutics. Pharmacology & Therapeutics, 107(2), pp.222-239.

397
Lewis, N.E., Liu, X., Li, Y., Nagarajan, H., Yerganian, G., O'Brien, E., Bordbar, A., Roth,
A.M., Rosenbloom, J., Bian, C., Xie, M., Chen, W., Li, N., Baycin-Hizal, D., Latif, H.,
Forster, J., Betenbaugh, M.J., Famili, I., Xu, X., Wang, J. and Palsson, B.O. 2013. Genomic
landscapes of chinese hamster ovary cell lines as revealed by the cricetulus griseus draft
genome. Nature Biotechnology, 31(8), pp.759-765.
Li, J.H., Liu, S., Zhou, H., Qu, L.H. and Yang, J.H. 2014. starBase v2.0: Decoding
miRNA-ceRNA, miRNA-ncRNA and protein-RNA interaction networks from large-scale
CLIP-seq data. Nucleic Acids Research, 42(Database issue), pp.D92-7.
Li, L., Xu, J., Yang, D., Tan, X. and Wang, H. 2010. Computational approaches for
microRNA studies: A review. Mammalian Genome : Official Journal of the International
Mammalian Genome Society, 21(1-2), pp.1-12.
Li, Q., Peterson, K.R., Fang, X. and Stamatoyannopoulos, G. 2002. Locus control regions.
Blood, 100(9), pp.3077-3086.
Li, J.S. and Yao, Z.X. 2012. MicroRNAs: Novel regulators of oligodendrocyte
differentiation and potential therapeutic targets in demyelination-related diseases.
Molecular Neurobiology, 45(1), pp.200-212.
Li, W., Guo, F., Wang, P., Hong, S. and Zhang, C. 2014a. miR-221/222 confers
radioresistance in glioblastoma cells through activating akt independent of PTEN status.
Current Molecular Medicine, 14(1), pp.185-195.
Li, Y., Liang, C., Ma, H., Zhao, Q., Lu, Y., Xiang, Z., Li, L., Qin, J., Chen, Y., Cho, W.C.,
Pestell, R.G., Liang, L. and Yu, Z. 2014b. miR-221/222 promotes S-phase entry and
cellular migration in control of basal-like breast cancer. Molecules (Basel, Switzerland),
19(6), pp.7122-7137.
Liew, J.C., Tan, W.S., Alitheen, N.B., Chan, E.S. and Tey, B.T. 2010. Over-expression of
the X-linked inhibitor of apoptosis protein (XIAP) delays serum deprivation-induced
apoptosis in CHO-K1 cells. Journal of Bioscience and Bioengineering, 110(3), pp.338-344.
Lim, Y., Wong, N.S., Lee, Y.Y., Ku, S.C., Wong, D.C. and Yap, M.G. 2010. Engineering
mammalian cells in bioprocessing - current achievements and future perspectives.
Biotechnology and Applied Biochemistry, 55(4), pp.175-189.
Liu, S., Zhang, P., Chen, Z., Liu, M., Li, X. and Tang, H. 2013a. MicroRNA-7
downregulates XIAP expression to suppress cell growth and promote apoptosis in cervical
cancer cells. FEBS Letters, 587(14), pp.2247-2253.
Liu, Y., Hu, W., Murakawa, Y., Yin, J., Wang, G., Landthaler, M. and Yan, J. 2013b. Cold-
induced RNA-binding proteins regulate circadian gene expression by controlling alternative
polyadenylation. Scientific Reports, 3pp.2054.

398
Lobanenkov, V.V., Nicolas, R.H., Adler, V.V., Paterson, H., Klenova, E.M., Polotskaja,
A.V. and Goodwin, G.H. 1990. A novel sequence-specific DNA binding protein which
interacts with three regularly spaced direct repeats of the CCCTC-motif in the 5'-flanking
sequence of the chicken c-myc gene. Oncogene, 5(12), pp.1743-1753.
Loh, W.P., Loo, B., Zhou, L., Zhang, P., Lee, D.Y., Yang, Y. and Lam, K.P. 2014.
Overexpression of microRNAs enhances recombinant protein production in chinese
hamster ovary cells. Biotechnology Journal, 9(9), pp.1140-1151.
Long, Y.S., Deng, G.F., Sun, X.S., Yi, Y.H., Su, T., Zhao, Q.H. and Liao, W.P. 2011.
Identification of the transcriptional promoters in the proximal regions of human microRNA
genes. Molecular Biology Reports, 38(6), pp.4153-4157.
Lopez, M., Meier, D., Muller, A., Franken, P., Fujita, J. and Fontana, A. 2014. Tumor
necrosis factor and transforming growth factor beta regulate clock genes by controlling the
expression of the cold inducible RNA-binding protein (CIRBP). The Journal of Biological
Chemistry, 289(5), pp.2736-2744.
Loser, P., Jennings, G.S., Strauss, M. and Sandig, V. 1998. Reactivation of the previously
silenced cytomegalovirus major immediate-early promoter in the mouse liver: Involvement
of NFkappaB. Journal of Virology, 72(1), pp.180-190.
Maccani, A., Hackl, M., Leitner, C., Steinfellner, W., Graf, A.B., Tatto, N.E., Karbiener,
M., Scheideler, M., Grillari, J., Mattanovich, D., Kunert, R., Borth, N., Grabherr, R. and
Ernst, W. 2014. Identification of microRNAs specific for high producer CHO cell lines
using steady-state cultivation. Applied Microbiology and Biotechnology, 98(17), pp.7535-
7548.
Machanick, P. and Bailey, T.L. 2011. MEME-ChIP: Motif analysis of large DNA datasets.
Bioinformatics (Oxford, England), 27(12), pp.1696-1697.
Majors, B.S., Betenbaugh, M.J. and Chiang, G.G. 2007. Links between metabolism and
apoptosis in mammalian cells: Applications for anti-apoptosis engineering. Metabolic
Engineering, 9(4), pp.317-326.
Makrides, S.C. 1999. Components of vectors for gene transfer and expression in
mammalian cells. Protein Expression and Purification, 17(2), pp.183-202.
Mangalampalli, V.R., Mowry, M.C., Lipscomb, M.L., James, R.I., Johnson, A.K. and
Kompala, D.S. 2002. Increased production of a secreted glycoprotein in engineered CHO
cells through amplification of a transcription factor. Cytotechnology, 38(1-3), pp.23-35.

399
Mariati, Koh, E.Y., Yeo, J.H., Ho, S.C. and Yang, Y. 2014a. Toward stable gene
expression in CHO cells: Preventing promoter silencing with core CpG island elements.
Bioengineered, 5(5),
Mariati, Yeo, J.H., Koh, E.Y., Ho, S.C. and Yang, Y. 2014b. Insertion of core CpG island
element into human CMV promoter for enhancing recombinant protein expression stability
in CHO cells. Biotechnology Progress, 30(3), pp.523-534.
Marine, S., Bahl, A., Ferrer, M. and Buehler, E. 2012. Common seed analysis to identify
off-target effects in siRNA screens. Journal of Biomolecular Screening, 17(3), pp.370-378.
Marsico, A., Huska, M.R., Lasserre, J., Hu, H., Vucicevic, D., Musahl, A., Orom, U. and
Vingron, M. 2013. PROmiRNA: A new miRNA promoter recognition method uncovers the
complex regulation of intronic miRNAs. Genome Biology, 14(8), pp.R84-2013-14-8-r84.
Martinez-Salas, E., Regalado, M.P. and Domingo, E. 1996. Identification of an essential
region for internal initiation of translation in the aphthovirus internal ribosome entry site
and implications for viral evolution. Journal of Virology, 70(2), pp.992-998.
Mazur, X., Eppenberger, H.M., Bailey, J.E. and Fussenegger, M. 1999. A novel
autoregulated proliferation-controlled production process using recombinant CHO cells.
Biotechnology and Bioengineering, 65(2), pp.144-150.
Mazur, X., Fussenegger, M., Renner, W.A. and Bailey, J.E. 1998. Higher productivity of
growth-arrested chinese hamster ovary cells expressing the cyclin-dependent kinase
inhibitor p27. Biotechnology Progress, 14(5), pp.705-713.
McManus, D.C., Lefebvre, C.A., Cherton-Horvat, G., St-Jean, M., Kandimalla, E.R.,
Agrawal, S., Morris, S.J., Durkin, J.P. and Lacasse, E.C. 2004. Loss of XIAP protein
expression by RNAi and antisense approaches sensitizes cancer cells to functionally diverse
chemotherapeutics. Oncogene, 23(49), pp.8105-8117.
McManus, M.T. and Sharp, P.A. 2002. Gene silencing in mammals by small interfering
RNAs. Nature Reviews.Genetics, 3(10), pp.737-747.
Mead, E.J., Chiverton, L.M., Smales, C.M. and von der Haar, T. 2009. Identification of the
limitations on recombinant gene expression in CHO cell lines with varying luciferase
production rates. Biotechnology and Bioengineering, 102(6), pp.1593-1602.
Megraw, M. and Hatzigeorgiou, A.G. 2010. MicroRNA promoter analysis. Methods in
Molecular Biology (Clifton, N.J.), 592pp.149-161.
Mestdagh, P., Bostrom, A.K., Impens, F., Fredlund, E., Van Peer, G., De Antonellis, P.,
von Stedingk, K., Ghesquiere, B., Schulte, S., Dews, M., Thomas-Tikhonenko, A., Schulte,
J.H., Zollo, M., Schramm, A., Gevaert, K., Axelson, H., Speleman, F. and Vandesompele,
400
J. 2010. The miR-17-92 microRNA cluster regulates multiple components of the TGF-beta
pathway in neuroblastoma. Molecular Cell, 40(5), pp.762-773.
Mehnert, M., Sommer, T. and Jarosch, E. 2010. ERAD ubiquitin ligases: Multifunctional
tools for protein quality control and waste disposal in the endoplasmic reticulum. BioEssays
: News and Reviews in Molecular, Cellular and Developmental Biology, 32(10), pp.905-
913.
Mihailovich, M., Militti, C., Gabaldon, T. and Gebauer, F. 2010. Eukaryotic cold shock
domain proteins: Highly versatile regulators of gene expression. BioEssays : News and
Reviews in Molecular, Cellular and Developmental Biology, 32(2), pp.109-118.
Mijakovic, I., Petranovic, D. and Jensen, P.R. 2005. Tunable promoters in systems biology.
Current Opinion in Biotechnology, 16(3), pp.329-335.
Mimura, Y., Lund, J., Church, S., Dong, S., Li, J., Goodall, M. and Jefferis, R. 2001.
Butyrate increases production of human chimeric IgG in CHO-K1 cells whilst maintaining
function and glycoform profile. Journal of Immunological Methods, 247(1-2), pp.205-216.
Mimura, I., Kanki, Y., Kodama, T. and Nangaku, M. 2014. Revolution of nephrology
research by deep sequencing: ChIP-seq and RNA-seq. Kidney International, 85(1), pp.31-
38.
Misaghi, S., Chang, J. and Snedecor, B. 2014. It's time to regulate: Coping with product-
induced non-genetic clonal instability in CHO cell lines via regulated protein expression.
Biotechnology Progress,
Miura, K., Miura, S., Yamasaki, K., Higashijima, A., Kinoshita, A., Yoshiura, K. and
Masuzaki, H. 2010. Identification of pregnancy-associated microRNAs in maternal plasma.
Clinical Chemistry, 56(11), pp.1767-1771.
Montminy, M.R. and Bilezikjian, L.M. 1987. Binding of a nuclear protein to the cyclic-
AMP response element of the somatostatin gene. Nature, 328(6126), pp.175-178.
Moxley, R.A. and Jarrett, H.W. 2005. Oligonucleotide trapping method for transcription
factor purification systematic optimization using electrophoretic mobility shift assay.
Journal of Chromatography.A, 1070(1-2), pp.23-34.
Muller, D., Katinger, H. and Grillari, J. 2008. MicroRNAs as targets for engineering of
CHO cell factories. Trends in Biotechnology, 26(7), pp.359-365.
Mulligan, R.C. and Berg, P. 1981. Factors governing the expression of a bacterial gene in
mammalian cells. Molecular and Cellular Biology, 1(5), pp.449-459.
Mussolino, C. and Cathomen, T. 2012. TALE nucleases: Tailored genome engineering
made easy. Current Opinion in Biotechnology, 23(5), pp.644-650.

401
Nagore, L.I., Nadeau, R.J., Guo, Q., Jadhav, Y.L., Jarrett, H.W. and Haskins, W.E. 2013.
Purification and characterization of transcription factors. Mass Spectrometry Reviews,
32(5), pp.386-398.
Nair, A.R., Jinger, X. and Hermiston, T.W. 2011. Effect of different UCOE-promoter
combinations in creation of engineered cell lines for the production of factor VIII. BMC
Research Notes, 4pp.178-0500-4-178.
Ndozangue-Touriguine, O., Sebbagh, M., Merino, D., Micheau, O., Bertoglio, J. and
Breard, J. 2008. A mitochondrial block and expression of XIAP lead to resistance to
TRAIL-induced apoptosis during progression to metastasis of a colon carcinoma.
Oncogene, 27(46), pp.6012-6022.
Nikoletopoulou, V., Markaki, M., Palikaras, K. and Tavernarakis, N. 2013. Crosstalk
between apoptosis, necrosis and autophagy. Biochimica Et Biophysica Acta, 1833(12),
pp.3448-3459.
Nishijima, H., Yasunari, T., Nakayama, T., Adachi, N. and Shibahara, K. 2009. Improved
applications of the tetracycline-regulated gene depletion system. Bioscience Trends, 3(5),
pp.161-167.
Nishiyama, H., Danno, S., Kaneko, Y., Itoh, K., Yokoi, H., Fukumoto, M., Okuno, H.,
Millan, J.L., Matsuda, T., Yoshida, O. and Fujita, J. 1998. Decreased expression of cold-
inducible RNA-binding protein (CIRP) in male germ cells at elevated temperature. The
American Journal of Pathology, 152(1), pp.289-296.
Nishiyama, H., Itoh, K., Kaneko, Y., Kishishita, M., Yoshida, O. and Fujita, J. 1997. A
glycine-rich RNA-binding protein mediating cold-inducible suppression of mammalian cell
growth. The Journal of Cell Biology, 137(4), pp.899-908.
Nonne, N., Ameyar-Zazoua, M., Souidi, M. and Harel-Bellan, A. 2010. Tandem affinity
purification of miRNA target mRNAs (TAP-tar). Nucleic Acids Research, 38(4), pp.e20.
Noonan, E.J., Place, R.F., Rasoulpour, R.J., Giardina, C. and Hightower, L.E. 2007. Cell
number-dependent regulation of Hsp70B' expression: Evidence of an extracellular
regulator. Journal of Cellular Physiology, 210(1), pp.201-211.
Nivitchanyong, T., Martinez, A., Ishaque, A., Murphy, J.E., Konstantinov, K., Betenbaugh,
M.J. and Thrift, J. 2007. Anti-apoptotic genes aven and E1B-19K enhance performance of
BHK cells engineered to express recombinant factor VIII in batch and low perfusion cell
culture. Biotechnology and Bioengineering, 98(4), pp.825-841.
Olive, V., Bennett, M.J., Walker, J.C., Ma, C., Jiang, I., Cordon-Cardo, C., Li, Q.J., Lowe,
S.W., Hannon, G.J. and He, L. 2009. miR-19 is a key oncogenic component of mir-17-92.
Genes & Development, 23(24), pp.2839-2849.

402
Olive, V., Sabio, E., Bennett, M.J., De Jong, C.S., Biton, A., McGann, J.C., Greaney, S.K.,
Sodir, N.M., Zhou, A.Y., Balakrishnan, A., Foth, M., Luftig, M.A., Goga, A., Speed, T.P.,
Xuan, Z., Evan, G.I., Wan, Y., Minella, A.C. and He, L. 2013. A component of the mir-17-
92 polycistronic oncomir promotes oncogene-dependent apoptosis. ELife, 2pp.e00822.
Omasa, T., Takami, T., Ohya, T., Kiyama, E., Hayashi, T., Nishii, H., Miki, H., Kobayashi,
K., Honda, K. and Ohtake, H. 2008. Overexpression of GADD34 enhances production of
recombinant human antithrombin III in chinese hamster ovary cells. Journal of Bioscience
and Bioengineering, 106(6), pp.568-573.
Orom, U.A. and Lund, A.H. 2010. Experimental identification of microRNA targets. Gene,
451(1-2), pp.1-5.
Orom, U.A. and Lund, A.H. 2007. Isolation of microRNA targets using biotinylated
synthetic microRNAs. Methods (San Diego, Calif.), 43(2), pp.162-165.
Ow, Y.P., Green, D.R., Hao, Z. and Mak, T.W. 2008. Cytochrome c: Functions beyond
respiration. Nature Reviews.Molecular Cell Biology, 9(7), pp.532-542.
Ozsolak, F., Poling, L.L., Wang, Z., Liu, H., Liu, X.S., Roeder, R.G., Zhang, X., Song, J.S.
and Fisher, D.E. 2008. Chromatin structure analyses identify miRNA promoters. Genes &
Development, 22(22), pp.3172-3183.
Paques, F. and Duchateau, P. 2007. Meganucleases and DNA double-strand break-induced
recombination: Perspectives for gene therapy. Current Gene Therapy, 7(1), pp.49-66.
Pavletich, N.P. and Pabo, C.O. 1991. Zinc finger-DNA recognition: Crystal structure of a
Zif268-DNA complex at 2.1 A. Science (New York, N.Y.), 252(5007), pp.809-817.
Peng, R.W., Guetg, C., Tigges, M. and Fussenegger, M. 2010. The vesicle-trafficking
protein munc18b increases the secretory capacity of mammalian cells. Metabolic
Engineering, 12(1), pp.18-25.
Pang, Y., Mao, H., Shen, L., Zhao, Z., Liu, R. and Liu, P. 2014. MiR-519d represses
ovarian cancer cell proliferation and enhances cisplatin-mediated cytotoxicity in vitro by
targeting XIAP. OncoTargets and Therapy, 7pp.587-597.
Pappas, D.L.,Jr and Hampsey, M. 2000. Functional interaction between Ssu72 and the
Rpb2 subunit of RNA polymerase II in saccharomyces cerevisiae. Molecular and Cellular
Biology, 20(22), pp.8343-8351.
Park, J.H., Wang, Z., Jeong, H.J., Park, H.H., Kim, B.G., Tan, W.S., Choi, S.S. and Park,
T.H. 2012. Enhancement of recombinant human EPO production and glycosylation in
serum-free suspension culture of CHO cells through expression and supplementation of
30Kc19. Applied Microbiology and Biotechnology, 96(3), pp.671-683.

403
Pasquinelli, A.E. 2012. MicroRNAs and their targets: Recognition, regulation and an
emerging reciprocal relationship. Nature Reviews.Genetics, 13(4), pp.271-282.
Peng, R.W., Abellan, E. and Fussenegger, M. 2010. Differential effect of exocytic SNAREs
on the production of recombinant proteins in mammalian cells. Biotechnology and
Bioengineering,
Piontkivska, H., Yang, M., Larkin, D., Lewin, H., Reecy, J. and Elnitski, L. 2009. Cross-
species mapping of bidirectional promoters enables prediction of unannotated 5' UTRs and
identification of species-specific transcripts. BMC Genomics, 10(1), pp.189.
Pontiller, J., Gross, S., Thaisuchat, H., Hesse, F. and Ernst, W. 2008. Identification of CHO
endogenous promoter elements based on a genomic library approach. Molecular
Biotechnology, 39(2), pp.135-139.
Pontiller, J., Maccani, A., Baumann, M., Klancnik, I. and Ernst, W. 2010. Identification of
CHO endogenous gene regulatory elements. Molecular Biotechnology, 45(3), pp.235-240.
Preker, P., Nielsen, J., Kammler, S., Lykke-Andersen, S., Christensen, M.S., Mapendano,
C.K., Schierup, M.H. and Jensen, T.H. 2008. RNA exosome depletion reveals transcription
upstream of active human promoters. Science (New York, N.Y.), 322(5909), pp.1851-1854.
Pugazhenthi, S., Wang, M., Pham, S., Sze, C.I. and Eckman, C.B. 2011. Downregulation of
CREB expression in alzheimer's brain and in abeta-treated rat hippocampal neurons.
Molecular Neurodegeneration, 6pp.60-1326-6-60.
Qin, J.Y., Zhang, L., Clift, K.L., Hulur, I., Xiang, A.P., Ren, B.Z. and Lahn, B.T. 2010.
Systematic comparison of constitutive promoters and the doxycycline-inducible promoter.
PloS One, 5(5), pp.e10611.
Qin, L., Ding, Y., Pahud, D.R., Chang, E., Imperiale, M.J. and Bromberg, J.S. 1997.
Promoter attenuation in gene therapy: Interferon-gamma and tumor necrosis factor-alpha
inhibit transgene expression. Human Gene Therapy, 8(17), pp.2019-2029.
Quek, L.E., Dietmair, S., Kromer, J.O. and Nielsen, L.K. 2010. Metabolic flux analysis in
mammalian cell culture. Metabolic Engineering, 12(2), pp.161-171.
Raab, J.R. and Kamakaka, R.T. 2010. Insulators and promoters: Closer than we think.
Nature Reviews.Genetics, 11(6), pp.439-446.
Ramalingam, S., Kandavelou, K., Rajenderan, R. and Chandrasegaran, S. 2011. Creating
designed zinc-finger nucleases with minimal cytotoxicity. Journal of Molecular Biology,
405(3), pp.630-641.

404
Recillas-Targa, F. 2006. Multiple strategies for gene transfer, expression, knockdown, and
chromatin influence in mammalian cell lines and transgenic animals. Molecular
Biotechnology, 34(3), pp.337-354.
Remy, S., Tesson, L., Menoret, S., Usal, C., Scharenberg, A.M. and Anegon, I. 2010. Zinc-
finger nucleases: A powerful tool for genetic engineering of animals. Transgenic Research,
19(3), pp.363-371.
Ren, Y., Han, X., Yu, K., Sun, S., Zhen, L., Li, Z. and Wang, S. 2014. microRNA-200c
downregulates XIAP expression to suppress proliferation and promote apoptosis of triple-
negative breast cancer cells. Molecular Medicine Reports, 10(1), pp.315-321.
Rerole, A.L., Jego, G. and Garrido, C. 2011. Hsp70: Anti-apoptotic and tumorigenic
protein. Methods in Molecular Biology (Clifton, N.J.), 787pp.205-230.
Rigoutsos, I. 2009. New tricks for animal microRNAS: Targeting of amino acid coding
regions at conserved and nonconserved sites. Cancer Research, 69(8), pp.3245-3248.
Rohmer, S., Mainka, A., Knippertz, I., Hesse, A. and Nettelbeck, D.M. 2008. Insulated
hsp70B' promoter: Stringent heat-inducible activity in replication-deficient, but not
replication-competent adenoviruses. The Journal of Gene Medicine, 10(4), pp.340-354.
Rome, C., Couillaud, F. and Moonen, C.T. 2005. Spatial and temporal control of
expression of therapeutic genes using heat shock protein promoters. Methods (San Diego,
Calif.), 35(2), pp.188-198.
Rossbach, M. 2010. Small non-coding RNAs as novel therapeutics. Current Molecular
Medicine, 10(4), pp.361-368.
Running Deer, J. and Allison, D.S. 2004. High-level expression of proteins in mammalian
cells using transcription regulatory sequences from the chinese hamster EF-1alpha gene.
Biotechnology Progress, 20(3), pp.880-889.
Sakurai, K., Chomchan, P. and Rossi, J.J. 2010. Silencing of gene expression in cultured
cells using small interfering RNAs. Current Protocols in Cell Biology / Editorial Board,
Juan S.Bonifacino ...[Et Al.], Chapter 27pp.Unit 27.1.1-28.
Saleem, M., Qadir, M.I., Perveen, N., Ahmad, B., Saleem, U., Irshad, T. and Ahmad, B.
2013. Inhibitors of apoptotic proteins: New targets for anticancer therapy. Chemical
Biology & Drug Design, 82(3), pp.243-251.
Sanchez, N., Kelly, P., Gallagher, C., Lao, N.T., Clarke, C., Clynes, M. and Barron, N.
2013. CHO cell culture longevity and recombinant protein yield are enhanced by depletion
of miR-7 activity via sponge decoy vectors. Biotechnology Journal,

405
Sanyal, A., Lajoie, B.R., Jain, G. and Dekker, J. 2012. The long-range interaction landscape
of gene promoters. Nature, 489(7414), pp.109-113.
Sartor, O. and Cutler, G.B.,Jr. 1996. Mifepristone: Treatment of cushing's syndrome.
Clinical Obstetrics and Gynecology, 39(2), pp.506-510.
Sauerwald, T.M., Betenbaugh, M.J. and Oyler, G.A. 2002. Inhibiting apoptosis in
mammalian cell culture using the caspase inhibitor XIAP and deletion mutants.
Biotechnology and Bioengineering, 77(6), pp.704-716.
Sauerwald, T.M., Figueroa, B.,Jr, Hardwick, J.M., Oyler, G.A. and Betenbaugh, M.J. 2006.
Combining caspase and mitochondrial dysfunction inhibitors of apoptosis to limit cell death
in mammalian cell cultures. Biotechnology and Bioengineering, 94(2), pp.362-372.
Schanen, B.C. and Li, X. 2011. Transcriptional regulation of mammalian miRNA genes.
Genomics, 97(1), pp.1-6.
Schattner, P. 2009. Genomics made easier: An introductory tutorial to genome datamining.
Genomics, 93(3), pp.187-195.
Schatz, S.M., Kerschbaumer, R.J., Gerstenbauer, G., Kral, M., Dorner, F. and Scheiflinger,
F. 2003. Higher expression of fab antibody fragments in a CHO cell line at reduced
temperature. Biotechnology and Bioengineering, 84(4), pp.433-438.
Schuster, V. and Kreth, H.W. 2000. X-linked lymphoproliferative disease is caused by
deficiency of a novel SH2 domain-containing signal transduction adaptor protein.
Immunological Reviews, 178pp.21-28.
Schwankhaus, N., Gathmann, C., Wicklein, D., Riecken, K., Schumacher, U. and
Valentiner, U. 2014. Cell adhesion molecules in metastatic neuroblastoma models. Clinical
& Experimental Metastasis,
Shi, R.X., Ong, C.N. and Shen, H.M. 2005. Protein kinase C inhibition and x-linked
inhibitor of apoptosis protein degradation contribute to the sensitization effect of luteolin on
tumor necrosis factor-related apoptosis-inducing ligand-induced apoptosis in cancer cells.
Cancer Research, 65(17), pp.7815-7823.
Shioda, N., Ishigami, T., Han, F., Moriguchi, S., Shibuya, M., Iwabuchi, Y. and Fukunaga,
K. 2007. Activation of phosphatidylinositol 3-kinase/protein kinase B pathway by a
vanadyl compound mediates its neuroprotective effect in mouse brain ischemia.
Neuroscience, 148(1), pp.221-229.
Sharathchandra, A., Katoch, A. and Das, S. 2014. IRES mediated translational regulation of
p53 isoforms. Wiley Interdisciplinary Reviews.RNA, 5(1), pp.131-139.

406
Shukla, G.C., Singh, J. and Barik, S. 2011. MicroRNAs: Processing, maturation, target
recognition and regulatory functions. Molecular and Cellular Pharmacology, 3(3), pp.83-
92.
Silber, J., Lim, D.A., Petritsch, C., Persson, A.I., Maunakea, A.K., Yu, M., Vandenberg,
S.R., Ginzinger, D.G., James, C.D., Costello, J.F., Bergers, G., Weiss, W.A., Alvarez-
Buylla, A. and Hodgson, J.G. 2008. miR-124 and miR-137 inhibit proliferation of
glioblastoma multiforme cells and induce differentiation of brain tumor stem cells. BMC
Medicine, 6pp.14-7015-6-14.
Siomi, H. and Siomi, M.C. 2009. On the road to reading the RNA-interference code.
Nature, 457(7228), pp.396-404.
Siomi, M.C., Sato, K., Pezic, D. and Aravin, A.A. 2011. PIWI-interacting small RNAs: The
vanguard of genome defence. Nature Reviews.Molecular Cell Biology, 12(4), pp.246-258.
Smith, A.J. and Humphries, S.E. 2009. Characterization of DNA-binding proteins using
multiplexed competitor EMSA. Journal of Molecular Biology, 385(3), pp.714-717.
Smolewski, P. and Robak, T. 2011. Inhibitors of apoptosis proteins (IAPs) as potential
molecular targets for therapy of hematological malignancies. Current Molecular Medicine,
11(8), pp.633-649.
Song, E., Lee, S.K., Wang, J., Ince, N., Ouyang, N., Min, J., Chen, J., Shankar, P. and
Lieberman, J. 2003. RNA interference targeting fas protects mice from fulminant hepatitis.
Nature Medicine, 9(3), pp.347-351.
Song, H.Y., Rothe, M. and Goeddel, D.V. 1996. The tumor necrosis factor-inducible zinc
finger protein A20 interacts with TRAF1/TRAF2 and inhibits NF-kappaB activation.
Proceedings of the National Academy of Sciences of the United States of America, 93(13),
pp.6721-6725.
Sonna, L.A., Fujita, J., Gaffin, S.L. and Lilly, C.M. 2002. Invited review: Effects of heat
and cold stress on mammalian gene expression. Journal of Applied Physiology (Bethesda,
Md.: 1985), 92(4), pp.1725-1742.
Spee, B., Jonkers, M.D., Arends, B., Rutteman, G.R., Rothuizen, J. and Penning, L.C.
2006. Specific down-regulation of XIAP with RNA interference enhances the sensitivity of
canine tumor cell-lines to TRAIL and doxorubicin. Molecular Cancer, 5pp.34.
Spenger, A., Ernst, W., Condreay, J.P., Kost, T.A. and Grabherr, R. 2004. Influence of
promoter choice and trichostatin A treatment on expression of baculovirus delivered genes
in mammalian cells. Protein Expression and Purification, 38(1), pp.17-23.
Sprengel, R. and Hasan, M.T. 2007. Tetracycline-controlled genetic switches. Handbook of
Experimental Pharmacology, (178)(178), pp.49-72.
407
Strid, T., Soderstrom, M. and Hammarstrom, S. 2008. Leukotriene C4 synthase promoter
driven expression of GFP reveals cell specificity. Biochemical and Biophysical Research
Communications, 366(1), pp.80-85.
Strotbek, M., Florin, L., Koenitzer, J., Tolstrup, A., Kaufmann, H., Hausser, A. and
Olayioye, M.A. 2013. Stable microRNA expression enhances therapeutic antibody
productivity of chinese hamster ovary cells. Metabolic Engineering, 20pp.157-166.
Stewart, A.J., Hannenhalli, S. and Plotkin, J.B. 2012. Why transcription factor binding sites
are ten nucleotides long. Genetics, 192(3), pp.973-985.
Sudbery, I., Enright, A.J., Fraser, A.G. and Dunham, I. 2010. Systematic analysis of off-
target effects in an RNAi screen reveals microRNAs affecting sensitivity to TRAIL-
induced apoptosis. BMC Genomics, 11pp.175-2164-11-175.
Sumitomo, Y., Higashitsuji, H., Higashitsuji, H., Liu, Y., Fujita, T., Sakurai, T., Candeias,
M.M., Itoh, K., Chiba, T. and Fujita, J. 2012. Identification of a novel enhancer that binds
Sp1 and contributes to induction of cold-inducible RNA-binding protein (cirp) expression
in mammalian cells. BMC Biotechnology, 12pp.72-6750-12-72.
Sunley, K. and Butler, M. 2010. Strategies for the enhancement of recombinant protein
production from mammalian cells by growth arrest. Biotechnology Advances, 28(3),
pp.385-394.
Sunley, K., Tharmalingam, T. and Butler, M. 2008. CHO cells adapted to hypothermic
growth produce high yields of recombinant beta-interferon. Biotechnology Progress, 24(4),
pp.898-906.
Sureshkumar, G.K. and Mutharasan, R. 1991. The influence of temperature on a mouse-
mouse hybridoma growth and monoclonal antibody production. Biotechnology and
Bioengineering, 37(3), pp.292-295.
Takeshita, F. and Ochiya, T. 2006. Therapeutic potential of RNA interference against
cancer. Cancer Science, 97(8), pp.689-696.
Tan, H.K., Lee, M.M., Yap, M.G. and Wang, D.I. 2008. Overexpression of cold-inducible
RNA-binding protein increases interferon-gamma production in chinese-hamster ovary
cells. Biotechnology and Applied Biochemistry, 49(Pt 4), pp.247-257.
Tanzer, A. and Stadler, P.F. 2004. Molecular evolution of a microRNA cluster. Journal of
Molecular Biology, 339(2), pp.327-335.
Teufel, A., Krupp, M., Weinmann, A. and Galle, P.R. 2006. Current bioinformatics tools in
genomic biomedical research (review). International Journal of Molecular Medicine, 17(6),
pp.967-973.

408
Teschendorf, C., Warrington, K.H.,Jr, Siemann, D.W. and Muzyczka, N. 2002.
Comparison of the EF-1 alpha and the CMV promoter for engineering stable tumor cell
lines using recombinant adeno-associated virus. Anticancer Research, 22(6A), pp.3325-
3330.
Tey, B.T., Singh, R.P., Piredda, L., Piacentini, M. and Al-Rubeai, M. 2000. Influence of
bcl-2 on cell death during the cultivation of a chinese hamster ovary cell line expressing a
chimeric antibody. Biotechnology and Bioengineering, 68(1), pp.31-43.
Thaisuchat, H., Baumann, M., Pontiller, J., Hesse, F. and Ernst, W. 2011. Identification of a
novel temperature sensitive promoter in CHO cells. BMC Biotechnology, 11(1), pp.51.
Thomas, M., Lange-Grunweller, K., Hartmann, D., Golde, L., Schlereth, J., Streng, D.,
Aigner, A., Grunweller, A. and Hartmann, R.K. 2013. Analysis of transcriptional regulation
of the human miR-17-92 cluster; evidence for involvement of pim-1. International Journal
of Molecular Sciences, 14(6), pp.12273-12296.
Thomas, M., Lieberman, J. and Lal, A. 2010. Desperately seeking microRNA targets.
Nature Structural & Molecular Biology, 17(10), pp.1169-1174.
Tigges, M. and Fussenegger, M. 2009. Recent advances in mammalian synthetic biology-
design of synthetic transgene control networks. Current Opinion in Biotechnology, 20(4),
pp.449-460.
Tuteja, G. and Kaestner, K.H. 2007. SnapShot: Forkhead transcription factors I. Cell,
130(6), pp.1160.
Trinklein, N.D., Aldred, S.F., Hartman, S.J., Schroeder, D.I., Otillar, R.P. and Myers, R.M.
2004. An abundance of bidirectional promoters in the human genome. Genome Research,
14(1), pp.62-66.
Underhill, M.F. and Smales, C.M. 2007. The cold-shock response in mammalian cells:
Investigating the HeLa cell cold-shock proteome. Cytotechnology, 53(1-3), pp.47-53.
Uhrinova, S., Uhrin, D., Powers, H., Watt, K., Zheleva, D., Fischer, P., McInnes, C. and
Barlow, P.N. 2005. Structure of free MDM2 N-terminal domain reveals conformational
adjustments that accompany p53-binding. Journal of Molecular Biology, 350(3), pp.587-
598.
Urlaub, G., Kas, E., Carothers, A.M. and Chasin, L.A. 1983. Deletion of the diploid
dihydrofolate reductase locus from cultured mammalian cells. Cell, 33(2), pp.405-412.
van der Horst, A. and Burgering, B.M. 2007. Stressing the role of FoxO proteins in lifespan
and disease. Nature Reviews.Molecular Cell Biology, 8(6), pp.440-450.

409
Valdez-Cruz, N.A., Caspeta, L., Perez, N.O., Ramirez, O.T. and Trujillo-Roldan, M.A.
2010. Production of recombinant proteins in E. coli by the heat inducible expression system
based on the phage lambda pL and/or pR promoters. Microbial Cell Factories, 9pp.18-
2859-9-18.
van Helden, J. 2003. Regulatory sequence analysis tools. Nucleic Acids Research, 31(13),
pp.3593-3596.
van Opstal, A., Bijvelt, J., van Donselaar, E., Humbel, B.M. and Boonstra, J. 2012.
Inhibition of protein kinase B activity induces cell cycle arrest and apoptosis during early
G(1) phase in CHO cells. Cell Biology International, 36(4), pp.357-365.
Vanden Berghe, T., Denecker, G., Brouckaert, G., Vadimovisch Krysko, D., D'Herde, K.
and Vandenabeele, P. 2004. More than one way to die: Methods to determine TNF-induced
apoptosis and necrosis. Methods in Molecular Medicine, 98pp.101-126.
Vesuna, F., Winnard, P.,Jr, Glackin, C. and Raman, V. 2006. Twist overexpression
promotes chromosomal instability in the breast cancer cell line MCF-7. Cancer Genetics
and Cytogenetics, 167(2), pp.189-191.
Vembar, S.S. and Brodsky, J.L. 2008. One step at a time: Endoplasmic reticulum-
associated degradation. Nature Reviews.Molecular Cell Biology, 9(12), pp.944-957.
Venter, M. 2007. Synthetic promoters: Genetic control through cis engineering. Trends in
Plant Science, 12(3), pp.118-124.
Vilaboa, N., Fenna, M., Munson, J., Roberts, S.M. and Voellmy, R. 2005. Novel gene
switches for targeted and timed expression of proteins of interest. Molecular Therapy : The
Journal of the American Society of Gene Therapy, 12(2), pp.290-298.
Vo, N.K., Dalton, R.P., Liu, N., Olson, E.N. and Goodman, R.H. 2010. Affinity
purification of microRNA-133a with the cardiac transcription factor, Hand2. Proceedings
of the National Academy of Sciences of the United States of America, 107(45), pp.19231-
19236.
Walsh, G. 2010. Biopharmaceutical benchmarks 2010. Nature Biotechnology, 28(9),
pp.917-924.
Wang, J., Xiao, X., Zhang, Y., Shi, D., Chen, W., Fu, L., Liu, L., Xie, F., Kang, T., Huang,
W. and Deng, W. 2012. Simultaneous modulation of COX-2, p300, akt, and apaf-1
signaling by melatonin to inhibit proliferation and induce apoptosis in breast cancer cells.
Journal of Pineal Research, 53(1), pp.77-90.

410
Wang, Q., Gao, F., May, W.S., Zhang, Y., Flagg, T. and Deng, X. 2008. Bcl2 negatively
regulates DNA double-strand-break repair through a nonhomologous end-joining pathway.
Molecular Cell, 29(4), pp.488-498.
Watanabe, Y., Tomita, M. and Kanai, A. 2007. Computational methods for microRNA
target prediction. Methods in Enzymology, 427pp.65-86.
Weber, W., Bacchus, W., Daoud-El Baba, M. and Fussenegger, M. 2007. Vitamin H-
regulated transgene expression in mammalian cells. Nucleic Acids Research, 35(17),
pp.e116.
Weber, W. and Fussenegger, M. 2011. Design of synthetic mammalian quorum-sensing
systems. Methods in Molecular Biology (Clifton, N.J.), 692pp.235-249.
Weber, W. and Fussenegger, M. 2010. Synthetic gene networks in mammalian cells.
Current Opinion in Biotechnology, 21(5), pp.690-696.
Weber, W. and Fussenegger, M. 2009. Engineering of synthetic mammalian gene networks.
Chemistry & Biology, 16(3), pp.287-297.
Weber, W. and Fussenegger, M. 2007. Novel gene switches. Handbook of Experimental
Pharmacology, (178)(178), pp.73-105.
Weber, W. and Fussenegger, M. 2004. Approaches for trigger-inducible viral transgene
regulation in gene-based tissue engineering. Current Opinion in Biotechnology, 15(5),
pp.383-391.
Weber, W., Kramer, B.P. and Fussenegger, M. 2007. A genetic time-delay circuitry in
mammalian cells. Biotechnology and Bioengineering, 98(4), pp.894-902.
Weber, W., Kramer, B.P., Fux, C., Keller, B. and Fussenegger, M. 2002. Novel
promoter/transactivator configurations for macrolide- and streptogramin-responsive
transgene expression in mammalian cells. The Journal of Gene Medicine, 4(6), pp.676-686.
Weber, W., Lienhart, C., Baba, M.D. and Fussenegger, M. 2009a. A biotin-triggered
genetic switch in mammalian cells and mice. Metabolic Engineering, 11(2), pp.117-124.
Weber, W., Lienhart, C., Daoud-El Baba, M. and Fussenegger, M. 2009b. A biotin-
triggered genetic switch in mammalian cells and mice. Metabolic Engineering,
Weber, W., Marty, R.R., Link, N., Ehrbar, M., Keller, B., Weber, C.C., Zisch, A.H.,
Heinzen, C., Djonov, V. and Fussenegger, M. 2003. Conditional human VEGF-mediated,
Weber, W. and Fussenegger, M. 2004a. Approaches for trigger-inducible viral transgene
regulation in gene-based tissue engineering. Current Opinion in Biotechnology, 15(5),
pp.383-391.

411
Weber, W. and Fussenegger, M. 2004b. Inducible gene expression in mammalian cells and
mice. Methods in Molecular Biology (Clifton, N.J.), 267pp.451-466.
Weber, W., Lienhart, C., Baba, M.D. and Fussenegger, M. 2009. A biotin-triggered genetic
switch in mammalian cells and mice. Metabolic Engineering, 11(2), pp.117-124.
Weber, W., Rimann, M., de Glutz, F.N., Weber, E., Memmert, K. and Fussenegger, M.
2005. Gas-inducible product gene expression in bioreactors. Metabolic Engineering, 7(3),
pp.174-181.
Weber, W., Schuetz, M., Denervaud, N. and Fussenegger, M. 2009. A synthetic metabolite-
based mammalian inter-cell signaling system. Molecular bioSystems, 5(7), pp.757-763.
Wei, Y.Y., Naderi, S., Meshram, M., Budman, H., Scharer, J.M., Ingalls, B.P. and
McConkey, B.J. 2011. Proteomics analysis of chinese hamster ovary cells undergoing
apoptosis during prolonged cultivation. Cytotechnology, 63(6), pp.663-677.
Werner, N.S., Weber, W., Fussenegger, M. and Geisse, S. 2007. A gas-inducible expression
system in HEK.EBNA cells applied to controlled proliferation studies by expression of
p27(Kip1). Biotechnology and Bioengineering, 96(6), pp.1155-1166.
Wieland, M. and Fussenegger, M. 2012. Engineering molecular circuits using synthetic
biology in mammalian cells. Annual Review of Chemical and Biomolecular Engineering,
3pp.209-234.
Wieser, R. 2007. The oncogene and developmental regulator EVI1: Expression,
biochemical properties, and biological functions. Gene, 396(2), pp.346-357.
Wierzbicki, A.T., Ream, T.S., Haag, J.R. and Pikaard, C.S. 2009. RNA polymerase V
transcription guides ARGONAUTE4 to chromatin. Nature Genetics, 41(5), pp.630-634.
Williams, S., Mustoe, T., Mulcahy, T., Griffiths, M., Simpson, D., Antoniou, M., Irvine,
A., Mountain, A. and Crombie, R. 2005. CpG-island fragments from the
HNRPA2B1/CBX3 genomic locus reduce silencing and enhance transgene expression from
the hCMV promoter/enhancer in mammalian cells. BMC Biotechnology, 5pp.17.
Winnard, P.,Jr, Glackin, C. and Raman, V. 2006. Stable integration of an empty vector in
MCF-7 cells greatly alters the karyotype. Cancer Genetics and Cytogenetics, 164(2),
pp.174-176.
Wilkinson, J.C., Cepero, E., Boise, L.H. and Duckett, C.S. 2004. Upstream regulatory role
for XIAP in receptor-mediated apoptosis. Molecular and Cellular Biology, 24(16),
pp.7003-7014.
Williams, K., Christensen, J. and Helin, K. 2011. DNA methylation: TET proteins-
guardians of CpG islands? EMBO Reports, 13(1), pp.28-35.

412
Wolff, L.J., Wolff, J.A. and Sebestyen, M.G. 2009. Effect of tissue-specific promoters and
microRNA recognition elements on stability of transgene expression after hydrodynamic
naked plasmid DNA delivery. Human Gene Therapy, 20(4), pp.374-388.
Wong, D.C., Wong, K.T., Nissom, P.M., Heng, C.K. and Yap, M.G. 2006. Targeting early
apoptotic genes in batch and fed-batch CHO cell cultures. Biotechnology and
Bioengineering, 95(3), pp.350-361.
Wu, S., Huang, S., Ding, J., Zhao, Y., Liang, L., Liu, T., Zhan, R. and He, X. 2010.
Multiple microRNAs modulate p21Cip1/Waf1 expression by directly targeting its 3'
untranslated region. Oncogene, 29(15), pp.2302-2308.
Wu, S.C. 2009. RNA interference technology to improve recombinant protein production in
chinese hamster ovary cells. Biotechnology Advances, 27(4), pp.417-422.
Wu, S.Y., Lopez-Berestein, G., Calin, G.A. and Sood, A.K. 2014. RNAi therapies:
Drugging the undruggable. Science Translational Medicine, 6(240), pp.240ps7.
Wuest, D.M., Harcum, S.W. and Lee, K.H. 2012. Genomics in mammalian cell culture
bioprocessing. Biotechnology Advances, 30(3), pp.629-638.
Wurm, F.M. 2004. Production of recombinant protein therapeutics in cultivated mammalian
cells. Nature Biotechnology, 22(11), pp.1393-1398.
Wulhfard, S., Tissot, S., Bouchet, S., Cevey, J., De Jesus, M., Hacker, D.L. and Wurm,
F.M. 2008. Mild hypothermia improves transient gene expression yields several fold in
chinese hamster ovary cells. Biotechnology Progress, 24(2), pp.458-465.
Xie, Y., Tobin, L.A., Camps, J., Wangsa, D., Yang, J., Rao, M., Witasp, E., Awad, K.S.,
Yoo, N., Ried, T. and Kwong, K.F. 2013. MicroRNA-24 regulates XIAP to reduce the
apoptosis threshold in cancer cells. Oncogene, 32(19), pp.2442-2451.
Xu, X., Nagarajan, H., Lewis, N.E., Pan, S., Cai, Z., Liu, X., Chen, W., Xie, M., Wang, W.,
Hammond, S., Andersen, M.R., Neff, N., Passarelli, B., Koh, W., Fan, H.C., Wang, J., Gui,
Y., Lee, K.H., Betenbaugh, M.J., Quake, S.R., Famili, I., Palsson, B.O. and Wang, J. 2011.
The genomic sequence of the chinese hamster ovary (CHO)-K1 cell line. Nature
Biotechnology, 29(8), pp.735-741.
Yekta, S., Shih, I.H. and Bartel, D.P. 2004. MicroRNA-directed cleavage of HOXB8
mRNA. Science (New York, N.Y.), 304(5670), pp.594-596.
Yan, H., Wang, S., Yu, H., Zhu, J. and Chen, C. 2013. Molecular pathways and functional
analysis of miRNA expression associated with paclitaxel-induced apoptosis in
hepatocellular carcinoma cells. Pharmacology, 92(3-4), pp.167-174.
413
Yang, J.H., Li, J.H., Shao, P., Zhou, H., Chen, Y.Q. and Qu, L.H. 2011. starBase: A
database for exploring microRNA-mRNA interaction maps from argonaute CLIP-seq and
degradome-seq data. Nucleic Acids Research, 39(Database issue), pp.D202-9.
Yang, W.C., Lu, J., Kwiatkowski, C., Yuan, H., Kshirsagar, R., Ryll, T. and Huang, Y.M.
2014. Perfusion seed cultures improve biopharmaceutical fed-batch production capacity
and product quality. Biotechnology Progress,
Yoon, S.K., Hong, J.K. and Lee, G.M. 2004. Effect of simultaneous application of stressful
culture conditions on specific productivity and heterogeneity of erythropoietin in chinese
hamster ovary cells. Biotechnology Progress, 20(4), pp.1293-1296.
Yoon, S.K., Hwang, S.O. and Lee, G.M. 2004. Enhancing effect of low culture temperature
on specific antibody productivity of recombinant chinese hamster ovary cells: Clonal
variation. Biotechnology Progress, 20(6), pp.1683-1688.
Yoon, S.K., Song, J.Y. and Lee, G.M. 2003. Effect of low culture temperature on specific
productivity, transcription level, and heterogeneity of erythropoietin in chinese hamster
ovary cells. Biotechnology and Bioengineering, 82(3), pp.289-298.
Yu, J., Wang, F., Yang, G.H., Wang, F.L., Ma, Y.N., Du, Z.W. and Zhang, J.W. 2006.
Human microRNA clusters: Genomic organization and expression profile in leukemia cell
lines. Biochemical and Biophysical Research Communications, 349(1), pp.59-68.
Zahn-Zabal, M., Kobr, M., Girod, P.A., Imhof, M., Chatellard, P., de Jesus, M., Wurm, F.
and Mermod, N. 2001. Development of stable cell lines for production or regulated
expression using matrix attachment regions. Journal of Biotechnology, 87(1), pp.29-42.
Zanghi, J.A., Fussenegger, M. and Bailey, J.E. 1999. Serum protects protein-free competent
chinese hamster ovary cells against apoptosis induced by nutrient deprivation in batch
culture. Biotechnology and Bioengineering, 64(1), pp.108-119.
Zaret, K.S. and Carroll, J.S. 2011. Pioneer transcription factors: Establishing competence
for gene expression. Genes & Development, 25(21), pp.2227-2241.
Zeitels, L.R. and Mendell, J.T. 2013. When 19 is greater than 92. ELife, 2pp.e01514.
Zahn-Zabal, M., Kobr, M., Girod, P.A., Imhof, M., Chatellard, P., de Jesus, M., Wurm, F.
and Mermod, N. 2001. Development of stable cell lines for production or regulated
expression using matrix attachment regions. Journal of Biotechnology, 87(1), pp.29-42.
Zanghi, J.A., Fussenegger, M. and Bailey, J.E. 1999. Serum protects protein-free competent
chinese hamster ovary cells against apoptosis induced by nutrient deprivation in batch
culture. Biotechnology and Bioengineering, 64(1), pp.108-119.

414
Zarrin, A.A., Malkin, L., Fong, I., Luk, K.D., Ghose, A. and Berinstein, N.L. 1999.
Comparison of CMV, RSV, SV40 viral and Vlambda1 cellular promoters in B and T
lymphoid and non-lymphoid cell lines. Biochimica Et Biophysica Acta, 1446(1-2), pp.135-
139.
Zeitels, L.R. and Mendell, J.T. 2013. When 19 is greater than 92. ELife, 2pp.e01514.
Zeng, A.P., Deckwer, W.D. and Hu, W.S. 1998. Determinants and rate laws of growth and
death of hybridoma cells in continuous culture. Biotechnology and Bioengineering, 57(6),
pp.642-654.
Zhang, Y.Q., Xiao, C.X., Lin, B.Y., Shi, Y., Liu, Y.P., Liu, J.J., Guleng, B. and Ren, J.L.
2013. Silencing of pokemon enhances caspase-dependent apoptosis via fas- and
mitochondria-mediated pathways in hepatocellular carcinoma cells. PloS One, 8(7),
pp.e68981.
Zheng, C. and Baum, B.J. 2008. Evaluation of promoters for use in tissue-specific gene
delivery. Methods in Molecular Biology (Clifton, N.J.), 434pp.205-219.
Zhou, W., Chen, C.C., Buckland, B. and Aunins, J. 1997. Fed-batch culture of recombinant
NS0 myeloma cells with high monoclonal antibody production. Biotechnology and
Bioengineering, 55(5), pp.783-792.
Zisoulis, D.G., Yeo, G.W. and Pasquinelli, A.E. 2011. Comprehensive identification of
miRNA target sites in live animals. Methods in Molecular Biology (Clifton, N.J.),
732pp.169-185.
Zou, C.G., Ma, Y.C., Dai, L.L. and Zhang, K.Q. 2014. Autophagy protects C. elegans
against necrosis during pseudomonas aeruginosa infection. Proceedings of the National
Academy of Sciences of the United States of America,

415
7.2: Appendix
Final Primer Design for functional promoters
Primer order name: Nucleotide sequence 5’-------3’
MdM2.370 F: aattggtaccGTTAACAGGTGCCTGTCTCC MdM2.370 R: aattctcgagTGGCCTACAAGTAGGGGAGAA SSu72.654 F: aattggtaccACAGGGTTTCTCCTGATGAGCT
SSu72.654 R: aattctcgagGACCGTCCGCGCTACCCA Cirbp.(828cho) F: aataggtaccCCTTCCATGGCATGCTTGAGAC
Cirbp.(828cho) R: attaagatctGTGCACACACCACAGATATTTGC Cirbp.(889mouse) F: aataggtaccCCTTCCATGGCATGCTTGAGAC Cirbp.(889mouse) R: ataaagatctGAGTCCCGCCTGATATACTCC miR17-92.733 (cho) F: aattggtaccTAGCAGCACCCGAAGCTTTGC miR17-92.733 (cho) R: aattctcgagTCCATCAGTCTCCAGTCTCACA miR17-92.992 (mouse) F: aattggtaccTTCCACCCAATACATTGTTGCC miR17-92.992 (mouse) R: attaagatctGTCACAGCTTCAGTCCCAAG *
Table 7.2.1: Designed primer sequences and order annotation for promoters used for
functional reporter assays. * denotes a Bglii site due to existence of a Xho1 site being
present within the 992bp sequence which would hinder cloning downstream otherwise.
Mouse (backup) primers
See supplementary CD (large file).
FACS sector breakdown:
GFP med + #Events GFP med + FITC-A Mean GFP med + FITC-A Median GFP top + #Events GFP top + FITC-A Mean GFP top + FITC-A Median Cells #Events
polyA_37 114 8847 7403 2 36550 36550 10488
polyA_31 691 10969 8695 56 43005 39594 10430
MDM_37 605 11556 9125 250 99225 81201 10621
MDM_31 1785 13285 11483 1348 96817 76647 10139
SSU-600_37 725 11272 8862 223 77062 59105 10289
SSU-600_31 827 13162 11308 580 95099 78151 7012
SSU-19_37 1181 11801 9427 411 86169 68126 10634
SSU-19_31 991 13736 12169 778 99066 78425 5923
Cir7-CHO_37 1555 12479 10249 712 82958 62600 10909
Cir7-CHO_31 715 13429 11345 660 104750 88985 5415
mir17-92M_37 275 11259 8810 116 87094 69770 6080
mir17-92M_31 654 12822 10804 363 94559 71786 5517
mir17-92C_37 129 10350 8003 11 40183 36737 6162
mir17-92C_31 434 11243 8999 44 43374 40080 5817
CMV_37 1047 12233 9762 490 77572 60498 10656
CMV_31 415 13244 11206 622 111499 96864 3740
Cir7-M_37 1318 12114 9672 543 86725 67638 11142
Cir7-M_31 851 12764 10223 683 102273 85866 5719
MED TOP

416
RT-qPCR – Actinomycin D experiments – mRNA stability
Table 7.2.2: Copy No. and CT calculations for 3 priority genes standard curves.
Cirbp SSu72 MDM2dil CT copy no dil CT copy no dil CT copy no
10 -1 95500000000 10 -1 61100000000 10 -1 1600000000010 -2 9550000000 10 -2 6110000000 10 -2 160000000010 -3 955000000 10 -3 611000000 10 -3 16000000010 -4 95500000 10 -4 61100000 10 -4 1600000010 -5 14.2 9550000 10 -5 15.7 6110000 10 -5 14.6 160000010 -6 17.2 955000 10 -6 18.7 611000 10 -6 17.8 16000010 -7 20.2 95500 10 -7 21.7 61100 10 -7 20.9 1600010 -8 23.2 9550 10 -8 24.7 6110 10 -8 24.0 160010 -9 26.2 955 10 -9 27.6 611 10 -9 27.2 160
10 -10 29.2 95.5 10 -10 30.6 61.1 10 -10 30.3 16

417
Figure 7.2.3: Logarithmic standard curves and line equation for each priority gene.

418
Figure 7.2.4: Copy number calculation via RT-qPCR for decay rate (-k) determination of 3
gene specific mRNAs tested over 3 timepoints [3, 6, 24h]. CHO-K1 cells cultured over 24
hours in 6-well plate format and subjected to treatment (W + W/O ActD). Note: The 24h
ActD samples do not reach zero, the values were calculated to be 668, 299 and 2 copies
respectively.

419
Table 7.2.5: Decay rates and half-life of gene transcripts between 3 timepoints post-
actinomycin D treatment of CHO-K1 cells. (A) Values estimated from figure 6.2.2.1
results.
Table 7.2.6: Details for GFP gene amplicon with standards used for calibration curve in red
(10^5-10^10). For investigating CMV viral promoter stability and mRNA transcript level at
31oC.

420
Figure 7.2.7: Standard curve generated by qPCR from primers specific to the GFP
amplicon (252bp) diluted by serial dilution (range from 105 to 10
10). Sample CT plots
measured in triplicate and averaged. The cycle difference between each order of magnitude
corresponds to ~2.81 CT.
p27 results appendices
Table 7.2.8: Attached p27 cell number reduction % results
Attached
% drop % of 100 % of pTATA
71.0 29.0 10.6
81.6 18.4 0.0
39.6 60.4 42.1
54.4 45.6 27.3
47.0 53.0 34.7
26.0 74.0 55.6
30.4 69.6 51.2
75.4 24.6 6.2
80.1 19.9 1.5

421
Table 7.2.9: Suspension p27 cell number reduction % results
Table 7.2.10: Single cell clonal population labels – from FACS sorting.
Suspension
% drop % of 100 % of pTATA
61.1 38.9 15.3
76.4 23.6 0.0
60.1 39.9 16.2
31.1 68.9 45.2
37.3 62.7 39.0
35.7 64.3 40.7
28.2 71.8 48.2
56.0 44.0 20.4
62.8 37.2 13.5

422
7.3: Project 2 - Appendices
XIAP sequences – Human and CHO:
CHO-scaffold 4366
>gi|350538686|ref|NM_001246801.1| Cricetulus griseus X-linked inhibitor
of apoptosis (Xiap), mRNA
GGTGGACAAGTCCTATTTTCAAGAGAAGATGACTTTTAACAGTTTTGAAGGATCTAGAACTTGTGTACCTGCA
GACACCAATAAGGATGAAGAATTTGTAGAAGAGTTTAATAGATTAAAAACATTTGCTAACTTTCCAAGTAGTA
GTCCTGTTTCAGCATCAACCTTGGCACGAGCAGGGTTTCTTTATACTGGTGAAGGAGATACTGTGCAGTGCTT
TAGTTGTCACGCGGCAGTGGATAGATGGCAGTACGGAGACTCAGCTGTTGGAAGACACAGGCAAATATCCCCA
AATTGCAGATTTATCAATGGTTTTTATTTTGAAAACAGTGCCACACAGGCTACAAATCCTGGTATCCAAAATG
GCCAGTACAAAGCTGAAAACTATGTGGGAAACAGAAATCATTTTGCTCTTGACAGGCCATCTGAGACTCATGC
AGATTATCTTTTGAGAACTGGACAGGTTGTAGATATTTCAGATACCATATACCCGAGGAACCCTGCCATGTGT
AGTGAAGAAGCCAGGCTGAAGTCCTTTCAGAACTGGCCAGACTATGCCCACTTAACCCCCAGAGAGTTGGCCA
GTGCTGGACTGTACTACACAGGGATTGATGATCAAGTGCAGTGCTTTTGCTGTGGTGGGAAACTGAAAAATTG
GGAACCCTGTGATCGTGCCTGGTCAGAACACAGGAGACACTTTCCCAATTGCTTCTTTGTTTTGGGCCGGAAT
GTTAATGTTCGGAGTGAATCTGGTGTGAGTTCTGATAGGAATTTCCCCAATTCGGCAAATTCTCCAAGAAATC
CAGCCATGGCAGAATATGAAGCACGGATCATTACTTTTGGAACATGGATATACTCAGTTAACAAGGAGCAGCT
TGCAAGAGCTGGATTTTATGCTTTAGGTGAAGGTGATAAGGTGAAGTGCTTTCACTGTGGAGGAGGGCTCACA
GATTGGAAGCCAAGTGAAGACCCTTGGGAACAGCATGCGAAGTGGTACCCAGGGTGTAAATATCTATTGGATG
AGAAGGGGCAAGAATATATAAATAATATTCATTTAACCCATTCACTTGGAGAATCTTTGGTAAGAACTGCTGA
AAAAACACCTTCACTAACTAAAAGAATTGATGATACCATCTTCCAGAATCCTATGGTACAAGAAGCTATACGA
ATGGGATTCAGTTTCAGGGACATTAAGAAAACAATGGAAGAAAAGATCCAAACATCTGGGAGCAGCTATCTGT
CCCTTGAGGTTCTGATTGCAGATCTAGTGAGTGCTCAGAAAGATAATACACAGGATGAGTCAAGTCAGACTTC
ATTGCAGAAAGACATCAGTACGGAAGAGCAGCTGAGGCGCCTACAAGAAGAGAAGCTTTGCAAAATCTGCATG
GATAGAAATATTGCTGTAGTTTTTGTTCCTTGTGGACATCTGGTCACTTGTAAACAGTGTGCTGAAGCAGTTG
ACAAATGTCCCATGTGCTACACAATCATTACCTTCAAACAAAAAATTTTTATGTCTTAA*TTGAGAGCAACAG
TAGGCATGTTATGTTC
Next scaffold…..
>gi|344164155|gb|JH000910.1|:604800-712033 Cricetulus griseus cell
line CHO-K1 unplaced genomic scaffold scaffold4333, whole genome
shotgun sequence – rev compl
miR-17 predicted binding site in Targetscan
CAGTGTTTGAATGAATTTAAACAACAAACCCTCAAACTAGTATATGTTGTTTTTCTCTTTGTGCAG
ACATCAGTACGGAAGAGCAGCTGAGGCGCCTACAAGAAGAGAAGCTTTGCAAAATCTGCATGGATA
GAAATATTGCTGTAGTTTTTGTTCCTTGTGGACATCTGGTCACTTGTAAACAGTGTGCTGAAGCAG
TTGACAAATGTCCCATGTGCTACACAATCATTACCTTCAAACAAAAAATTTTTATGTCTTAA*
....TTGAGAGCAACAGTAGGCATGTTATACTCTTCTTACTCTAATTGAATGTGTGATGTGAGCAA
ACTTTAAGTAATCAGCATTGCATTCCATTAGCATCTGCTGCCAAGTGGAAACAAATGTTAACAGCA
CTGGTACTGTCTAAACTTTGGATTTCTGGAACTTTCAGGTTATTAGCTATATCGTTTATCCAGTTT
TTTACTCAATTAAAGCCTTAGACAAAGAAGCATTTAATATTATAACTTTTCACCTTGTGTATTTGT
423
AGTACACTGACTTGATTTCTATGTGTAAGTGAATTAATCACTATCATTTTTCATTCCTTTTGGATA
AGCTTAACAAATGGAGTGTTCTGTATAAGCAGGGAGATTTGAGTTAATCTACCCATTCACTTGCTC
TGTTTATTGTGAACAGAGAATACACTGTTCCACACTGGTGGGAGGATAAACATTGGTTTGTAGATG
TTTGTGTCTGTGTTTTGGATTCTGTCCATTTTCTTTCAAATTTATAAACATACTTGTATGAATGGT
TTTTTAAGTGATTTTGCCATCTCCCAAAAGATATTTAATGGTAAACTGCTTATCTAACCAGCATAT
ACTAACATGGAAAGACAACAAAGATATATTAAGTGTAAATTACAAATGGCAAAACACTATGTATAG
TTTGAGCCAAATCAAGGTGTGAATTTTATATCTGTATAGGACAAAAAAGAGTTGGAAAGATATGCA
TCATACTCTTAAATATGTTTTTTTCTTGAGGGGGGTGGGGGTATGGGTCTTTGAGGGGCTTATAGG
AGCCCTTCTTTTTTCATTTTGTTCTGTTTGAAGTTTATATAAGTATGTATTACTTTTATATAATCA
GAATTTTTAGAAATATTGTACTGATTTAAAGGCTTAGGCATGTTCAAACGTCTGCAAAACTACTTA
TTGCTCAGTTTTAGTTTTTCTAATCCAAGAAGGCAGGCCAGTTGACTTTCTGGTGCCAATGTGAAA
TTTAAATGTTTTTGTTTTACCTGCTTTGTGGATAGAAAATATTTCTGAGTGGTAGTTTTCTGACAG
GTAGACCATGTCTTCTTATCTTGTTTCAAAATAAGTATTTCTGATTTTGTAAAATGAAATATAAAA
TATTGTCTCAGATCTTCCAATTAATTAGTAAGGATTCATCCTTAATCCTTGCTAGTTTAAGCCTGC
CTAAGTCACTTTACTAAAAGATCTTTGTTAACCCAGTATTTTAAACATTTGTCTGCTTATGTAGGT
AAAAGTAGAAGCATGTTTGTATGCTGCTTGTAGTTTTAGTGACAGCTTTCCATGTTGAAATTCTCA
TGTCATTTTGTGTCCTAAAAGTTTCATGTGAGTTTTTACTGTTAGGAAGATTAAGATGTATATAGT
ACAGAATGGTAAGTCTCTAATTGTTTTATGTTTGTTTGTTTCTTGACTAGTAATAGTAGTAAATAC
TTTAAAAATATTTTCTCAAGATCCTTAAGAACTCTTGGAAATTGTAACATACTGACAAGAGTAGTT
GTTTAAATACTTCTAACAACTTGTATAAGAGTCAATATGAATAAAATCCAGCTAAATGCTTCATAG
AACACAGGATTTACCCTAAACAATTATCATAATGGACCTCTTACAGAGACTCTAGTCTGTTTTACT
ACAGAGCACAGTTTGAGAGTGAAACTGTTACAATTTAGATTTTTGTTGTATTTTCTAAGAGAAAGA
ATATTGTTAGGTTCTCCTAACTTCTGTTGACTACTATGGTAAGTGGTGTCATTTTAATTGCAAATT
TAAATAGAAATTAACAGAATTAAGTACATTCCCTTTTTTTCTTTGCTTTTTCATGAAAATCCTTAG
TTCTTTACATTGTCTCCTACTTAGGTTCAGTTGTATAGTCGAACTTAATCTAAATTGACTAAGGTT
TAAATTTAAATTTACGTTTAAAGCATTCCACAGGGGATAAAAGTGTTAATTTAAAAAAAAAATGTT
CCCTAAGACACTTCAGGTACAAGTCACGTAGGTAGTGTGTTTAATCTAGCTGTTAGCCAAGGATTC
AAGGACTGAATTGTTTTTGAATAAGGCTTTTCTTGTTCTGGGAGCCTCAGTTCATTAAAACTCTCC
TTTTAAAACTTGTGTGCTGAGAGTTAAGCAAGACCTCTTTTTTTTTTTTTTTTTGTCTTCATGAGT
TGCGAAATTGAATTCATGAAGCTGATGTGGCTAACAAGTTTATTTTAAGAATTGTTTAGAAAATGC
TGTTGCTTCGGGTTCTTAAAATCACAGCATTCCAACTCTAATCAAGTTGTTGGAGACTTACCAGAG
TTGGACTGAGCTCACACTAAAATAAAAAAAACAAAACCAAAAAAAAAAAAAAAACCCTCACTGGAT
TCTTTCCATATAGCTGTGTAAAAAATTGGTCACTTGGAAGGTCAAAATATAACCAGATCCAAATCA
CCCACCCCAGACAGTTCTCAGCATCTGTGTATTGATGTTCTGTTCTGTATAAAGTTCACTCTAGGA
TTTTGAAGTAGCCATGTATTTTACTACTTATTAATTGTCATGTGAAATTTGAAGTTCTTCTGTAAT
AAATAGTTAATTTTATTTGTAATTTACTGTGCTAATCAAAATTTTTGTGTTTGGCATTAAGTAAAC
ACAGTTTATTTGATTAATGGCTTAGTATTCCCTTTCCTTCTAGATTTTTGCCTCTTCCTTTGGTTA
GGGGTAGAGGTGAGGTGAGTGTAGTAAGTGAATATAATGTGATTTGGCTATGTTGTTATGACATTT
GTTTTGTTGTTTAAAATGTGTATTCTTTTCTGTTTTAGTAGATAAAATCTATTATCTTGAGCTCTC
TGAATGGAAACTACCATCCCAGCATTAGCTGCATTTATTGTTCCCATTAGACCTAAATCGTTTTAC
TTGTGACTGCCCAGGTACTGAGTAAGAGAAGAGGAGAGATGAAATAGATTGCAGGTTGTTGCTGTT
AGAGGAATAAGAAAATGGAGAAATACTTGACGACATTTTAGTCAAATCTCTTTTTAAAAAGGTAGC
CATATAGGCTTCACAATCTGAGGTCATATCTCCAGAACCCACATAAAAGCTGGGTGCACTAGCCCC
AAGCATCTGTAATCCGGGAATGCCTCCATGAAACAGGAAGCAGATAGGAGACGGGCCAGAAGCTAA
CTTGGCTTAGGCATTAGCCAAGAGACCCTGTTAAGGTAGGAAGGTTGTCCTTTGGGTTATCTGCCC

424
TCTAATGTGCATCATGATAGGCATCCACCTATACTCGGACACACACACAAAAGAAAAAAAACAAAA
AGTAGCTATCTGTATAATAAGACTATTACCTTAACCATTTTATCCAAGGTGATGGAATTCAACTCA
AGGAGAACACACCTTAATTGTTTTAAATGTTAACTCTCAACCTAAAACTTTTTTTTTTTCCAGGAC
AGAGTTTCTCTATGTAGCCCAGGCTGTACTCAAACATCAGCAACCCTCTGCCTCTGCCTCTGCCTC
TGCCTCTGGAGTGCTGGGATTAAAGGTGCATGCCACTACAGCCCAGATTCATCCTAAAAACTCGTA
GGCCTTCCATGGGTTCTCCTTGATAGAGGACTTGGACTAAAGCTTAATAGACCGCCTGGAAAGATA
ACTCAGCCACTAAGAGTACTTGCTGCTTCTGCAGAGGACCAAAGTTCAGTTCCCAGCACCCAACGG
GGTGGCTTACAACTGCATATTAGCTCCAGCTTCAGTCTATCTAGTGCCCTCTTTTGGCCTCCATGG
GCACCTACATGCATGTGCATATATATAAACATACACACATTACACATAAAATAAAAATAATCCTTT
TTTTTTTTGGTTTTTCGAGACAGGGTTTCTCTGTGGCTTTGGAGACTGTCCTGGAACTAGCTCTTG
TAGACCAGGCTGGCCTCGAACTCACAGAGATCTGCCTCCCTCTGCCTCCCTGGAATTAAAGGCGTA
CGCCACCAACGCCCAGCAAATAAAAATAATCTTTAAAGCTTAAACAAAACTGGTATATTTACTTTT
TGTCACTGTTACTTGTTTCTCTGGATGCTTCTTAGAAAAGTTCCAGACTATCAGCTAGAAATGACC
TCGGAGAGTAGCTTATTCACAGCACACCACCCTCATTTTATCATTGCGATAGACCCTTTACTGGCA
CATGCTTTGAAGTTGGAAAACCCCTTACCACACCGGCTACCTGTCCTGGGAAGTCTCCGATGTTTA
TTTTTCAGCAGTTCATTCCATTATACTCGAATTTTCACTACACAGTAAATGATACTTTATAACTGT
TACAGTAGGACAACCCCTAATACTTTTAAATTAAGTAATATGCCGTTAATGCTTGAGTGGTAGAGT
TCTCATTTGGAGGCTCAGGTTTGTAGATGTTTGGCATTTACTGTGTGCTTATGTATCATGTAGCAT
TTAAGATTACTGTGTAAGTTTATTTTATCACTCTATCAATACCAACAAGCTTGCATTTTAAATTTG
ATGTTAATAATGGCTTTAATGTAGTTTCTGGTTTTGGATTTTTTTTTTATTATGCTTCACCTGACA
GAATGACCCATTCTTTTATCTTTGTGTTAGTTTTGTGAATACTTATGTTAAGAGTTTTGAGACAGA
ATACTATATTTGTGAATATAATTTTATGGCTTTTTTTCATTTAGTGGATACCTTTCAGTATGGAGA
TCTATGAAAATTGCTTTCTGCGCTATAATCTGTCCTTTGTTGTAGATTAAAGCTTATTTTTCTGTG
AATAAGACTTATCAATAAAGCACTATTCTTTAAA
>xiap-Human NM_001167.2
TTTCCAGATTGGGGCTCGGGCCGCGCCTCCTCCGGGACCCTCCCCTTGGACCGAGCCGATCGCCGCGGGG
CAGTTCGGGCCGGCTGTCCTGGCGCGAAAAGGTGGACAAGTCCTATTTTCAAGAGAAGATGACTTTTAAC
AGTTTTGAAGGATCTAAAACTTGTGTACCTGCAGACATCAATAAGGAAGAAGAATTTGTAGAAGAGTTTA
ATAGATTAAAAACTTTTGCTAATTTTCCAAGTGGTAGTCCTGTTTCAGCATCAACACTGGCACGAGCAGG
GTTTCTTTATACTGGTGAAGGAGATACCGTGCGGTGCTTTAGTTGTCATGCAGCTGTAGATAGATGGCAA
TATGGAGACTCAGCAGTTGGAAGACACAGGAAAGTATCCCCAAATTGCAGATTTATCAACGGCTTTTATC
TTGAAAATAGTGCCACGCAGTCTACAAATTCTGGTATCCAGAATGGTCAGTACAAAGTTGAAAACTATCT
GGGAAGCAGAGATCATTTTGCCTTAGACAGGCCATCTGAGACACATGCAGACTATCTTTTGAGAACTGGG
CAGGTTGTAGATATATCAGACACCATATACCCGAGGAACCCTGCCATGTATAGTGAAGAAGCTAGATTAA
AGTCCTTTCAGAACTGGCCAGACTATGCTCACCTAACCCCAAGAGAGTTAGCAAGTGCTGGACTCTACTA
CACAGGTATTGGTGACCAAGTGCAGTGCTTTTGTTGTGGTGGAAAACTGAAAAATTGGGAACCTTGTGAT

425
CGTGCCTGGTCAGAACACAGGCGACACTTTCCTAATTGCTTCTTTGTTTTGGGCCGGAATCTTAATATTC
GAAGTGAATCTGATGCTGTGAGTTCTGATAGGAATTTCCCAAATTCAACAAATCTTCCAAGAAATCCATC
CATGGCAGATTATGAAGCACGGATCTTTACTTTTGGGACATGGATATACTCAGTTAACAAGGAGCAGCTT
GCAAGAGCTGGATTTTATGCTTTAGGTGAAGGTGATAAAGTAAAGTGCTTTCACTGTGGAGGAGGGCTAA
CTGATTGGAAGCCCAGTGAAGACCCTTGGGAACAACATGCTAAATGGTATCCAGGGTGCAAATATCTGTT
AGAACAGAAGGGACAAGAATATATAAACAATATTCATTTAACTCATTCACTTGAGGAGTGTCTGGTAAGA
ACTACTGAGAAAACACCATCACTAACTAGAAGAATTGATGATACCATCTTCCAAAATCCTATGGTACAAG
AAGCTATACGAATGGGGTTCAGTTTCAAGGACATTAAGAAAATAATGGAGGAAAAAATTCAGATATCTGG
GAGCAACTATAAATCACTTGAGGTTCTGGTTGCAGATCTAGTGAATGCTCAGAAAGACAGTATGCAAGAT
GAGTCAAGTCAGACTTCATTACAGAAAGAGATTAGTACTGAAGAGCAGCTAAGGCGCCTGCAAGAGGAGA
AGCTTTGCAAAATCTGTATGGATAGAAATATTGCTATCGTTTTTGTTCCTTGTGGACATCTAGTCACTTG
TAAACAATGTGCTGAAGCAGTTGACAAGTGTCCCATGTGCTACACAGTCATTACTTTCAAGCAAAAAATT
TTTATGTCTTAA...stop codon 3'UTR--->
TCTAACTCTATAGTAGGCATGTTATGTTGTTCTTATTACCCTGATTGAATGTGTGATG
TGAACTGACTTTAAGTAATCAGGATTGAATTCCATTAGCATTTGCTACCAAGTAGGAAAAAAAATGTACA
TGGCAGTGTTTTAGTTGGCAATATAATCTTTGAATTTCTTGATTTTTCAGGGTATTAGCTGTATTATCCA
TTTTTTTTACTGTTATTTAATTGAAACCATAGACTAAGAATAAGAAGCATCATACTATAACTGAACACAA
TGTGTATTCATAGTATACTGATTTAATTTCTAAGTGTAAGTGAATTAATCATCTGGATTTTTTATTCTTT
TCAGATAGGCTTAACAAATGGAGCTTTCTGTATATAAATGTGGAGATTAGAGTTAATCTCCCCAATCACA
TAATTTGTTTTGTGTGAAAAAGGAATAAATTGTTCCATGCTGGTGGAAAGATAGAGATTGTTTTTAGAGG
TTGGTTGTTGTGTTTTAGGATTCTGTCCATTTTCTTTTAAAGTTATAAACACGTACTTGTGCGAATTATT
TTTTTAAAGTGATTTGCCATTTTTGAAAGCGTATTTAATGATAGAATACTATCGAGCCAACATGTACTGA
CATGGAAAGATGTCAAAGATATGTTAAGTGTAAAATGCAAGTGGCAAAACACTATGTATAGTCTGAGCCA
GATCAAAGTATGTATGTTTTTAATATGCATAGAACAAAAGATTTGGAAAGATATACACCAAACTGTTAAA
TGTGGTTTCTCTTCGGGGAGGGGGGGATTGGGGGAGGGGCCCCAGAGGGGTTTTATAGGGGCCTTTTCAC
TTTCTACTTTTTTCATTTTGTTCTGTTCGAATTTTTTATAAGTATGTATTACTTTTGTAATCAGAATTTT
TAGAAAGTATTTTGCTGATTTAAAGGCTTAGGCATGTTCAAACGCCTGCAAAACTACTTATCACTCAGCT
TTAGTTTTTCTAATCCAAGAAGGCAGGGCAGTTAACCTTTTTGGTGCCAATGTGAAATGTAAATGATTTT
ATGTTTTTCCTGCTTTGTGGATGAAAAATATTTCTGAGTGGTAGTTTTTTGACAGGTAGACCATGTCTTA
TCTTGTTTCAAAATAAGTATTTCTGATTTTGTAAAATGAAATATAAAATATGTCTCAGATCTTCCAATTA

426
ATTAGTAAGGATTCATCCTTAATCCTTGCTAGTTTAAGCCTGCCTAAGTCACTTTACTAAAAGATCTTTG
TTAACTCAGTATTTTAAACATCTGTCAGCTTATGTAGGTAAAAGTAGAAGCATGTTTGTACACTGCTTGT
AGTTATAGTGACAGCTTTCCATGTTGAGATTCTCATATCATCTTGTATCTTAAAGTTTCATGTGAGTTTT
TACCGTTAGGATGATTAAGATGTATATAGGACAAAATGTTAAGTCTTTCCTCTACCTACATTTGTTTTCT
TGGCTAGTAATAGTAGTAGATACTTCTGAAATAAATGTTCTCTCAAGATCCTTAAAACCTCTTGGAAATT
ATAAAAATATTGGCAAGAAAAGAAGAATAGTTGTTTAAATATTTTTTAAAAAACACTTGAATAAGAATCA
GTAGGGTATAAACTAGAAGTTTAAAAATGCTTCATAGAACGTCCAGGGTTTACATTACAAGATTCTCACA
ACAAACCTATTGTAGAGGTGAGTAAGGCATGTTACTACAGAGGAAAGTTTGAGAGTAAAACTGTAAAAAA
TTATATTTTTGTTGTACTTTCTAAGAGAAAGAGTATTGTTATGTTCTCCTAACTTCTGTTGATTACTACT
TTAAGTGATATTCATTTAAAACATTGCAAATTTATTTTATTTATTTAATTTTCTTTTTGAGATGGAGTCT
TGCTTGTCACCCAGGCTGGAGTGCAGTGGAGTGATCTCTGCTCACTGCAACCTCCGCCTTCTGGGTTCAA
GCGATTCTCGTGCCTCAGCTTCCTGAGTAGCTGGAATTACAGGCAGGTGCCACCATGCCCGACTAATTTT
TTTTTATTTTTAGTAGAGACGGGGTTTCACCATGTTGGCCAGGCTGGTATCAAACTCCTGACCTCAAGAG
ATCCACTCGCCTTGCCCTCCCAAAGTGCTGGGATTACAGGCTTGAGCCACCACGCCCGGCTAAAACATTG
CAAATTTAAATGAGAGTTTTAAAAATTAAATAATGACTGCCCTGTTTCTGTTTTAGTATGTAAATCCTCA
GTTCTTCACCTTTGCACTGTCTGCCACTTAGTTTGGTTATATAGTCATTAACTTGAATTTGGTCTGTATA
GTCTAGACTTTAAATTTAAAGTTTTCTACAAGGGGAGAAAAGTGTTAAAATTTTTAAAATATGTTTTCCA
GGACACTTCACTTCCAAGTCAGGTAGGTAGTTCAATCTAGTTGTTAGCCAAGGACTCAAGGACTGAATTG
TTTTAACATAAGGCTTTTCCTGTTCTGGGAGCCGCACTTCATTAAAATTCTTCTAAAACTTGTATGTTTA
GAGTTAAGCAAGACTTTTTTTCTTCCTCTCCATGAGTTGTGAAATTTAATGCACAACGCTGATGTGGCTA
ACAAGTTTATTTTAAGAATTGTTTAGAAATGCTGTTGCTTCAGGTTCTTAAAATCACTCAGCACTCCAAC
TTCTAATCAAATTTTTGGAGACTTAACAGCATTTGTCTGTGTTTGAACTATAAAAAGCACCGGATCTTTT
CCATCTAATTCCGCAAAAATTGATCATTTGCAAAGTCAAAACTATAGCCATATCCAAATCTTTTCCCCCT
CCCAAGAGTTCTCAGTGTCTACATGTAGACTATTCCTTTTCTGTATAAAGTTCACTCTAGGATTTCAAGT
CACCACTTATTTTACATTTTAGTCATGCAAAGATTCAAGTAGTTTTGCAATAAGTACTTATCTTTATTTG
TAATAATTTAGTCTGCTGATCAAAAGCATTGTCTTAATTTTTGAGAACTGGTTTTAGCATTTACAAACTA
AATTCCAGTTAATTAATTAATAGCTTTATATTGCCTTTCCTGCTACATTTGGTTTTTTCCCCTGTCCCTT
TGATTACGGGCTAAGGTAGGGTAGAGTGGGTGTAGTGAGTGTATATAATGTGATTTGGCCCTGTGTATTA
TGATATTTTGTTATTTTTGTTGTTATATTATTTACATTTCAGTAGTTGTTTTTTGTGTTTCCATTTTAGT
GGATAAAATTTGTATTTTGAACTATGAATGGAGACTACCGCCCCAGCATTAGTTTCACATGATATACCCT
427
TTAAACCCGAATCATTGTTTTATTTCCTGATTACACAGGTGTTGAATGGGGAAAGGGGCTAGTATATCAG
TAGGATATACTATGGGATGTATATATATCATTGCTGTTAGAGAAATGAAATAAAATGGGGCTGGGCTCAG
TGGCTCACGCCTGTAATCCCAGCACTTTGGGAGGCTGAGGCAGGTGGATCACGAGGTCAGGAGATCGAGA
CCATCCTGGCTAACACGGTGAAACCCCGTCTCTACTAAAAAACAGAAAATTAGCCGGGCGTGGTGGCGGG
CGCCTGTAGTCCCAGCTACTCGGGAGGCTGAGGCAGGAGAATGGTGTGAACCCGGGAGGCAGAGCTTGCA
GTGAGCCGAGATCTCGCCACTGCACTCCAGCCTGGGCAACAGAGCAAGACTCTGTCTCAAAAAAAAAAAA
AAAAGAAATAAGAAAATGGGAAGCAATATTTGACATAGTTCTTTTTAGTCAAATCTACTTGTTAAAAAAA
GGGTAGCAGTTTATTCATCTGTGAAAGGAAAATAATACTTATCTTACAAGGTTGCAAGAGCTCAAGGAGA
CCATGTATGTAAAGTTCCTGCTGTAAATATGAACTCCCATCCTAATACCCTTTTACCTCTCTGTGGGTTT
GTCTTGACCTGGAAATTTGGGCTAAAACTTAGAAAAAATTCTTACATGATAACTCAGTGATGCTTACTCA
TAGTTTTTGGTGTTTCTCATAGATAAGATATAAATCAGCTGGGCGCGGTGGCTCATGCCTGTAATCCCAG
CACTTTGGGAGGCCGAGGCGGGCAGATCACCTGAGGTCGGGAGGTCGAGACCAGCCTGACCAACATGGAG
AAACCCCGTCTCTACTAAAAATACAAAATTAGCTGGGCGTGGTGGCTCATGCCTGTAATCCCAGCTACTT
GGGAGGCTGAGGCAGGAGAATCGCTTGAACCCAGGAGGCGGAGGTTGTGGTGAGCGAAGATCGTGCCATT
GCACTCCAGCCTGGGCAACAAGAGCAAAACTCTGTCTCAAAAAAAAAAAAAGATATAAATCACAATAAAT
AAATAGGTCAATACAAATGTTAGCCAGGCGTGGTGGCACATGCCCATAGTCGCAGCTACTCTGGAGGCAG
AGGCAGGAGGATCACTTGAGCCCATGAATTTGAGGCAGCAGTGAGCTATGATTGTGCCACTGTACTCCAG
TCTGGGTGACAGAGTGAGACCCCATCTCTAAATAAATAGGTCAAACCCTTAAAAATATTTAAATTCTTAA
AAAATTGAAAAGATTATTCTTCTCAAATTTAGTTGAGCTTTCTAAGAGAAGCAATTGGCTTTTTCCCACT
TCAATAATCATTTTCAGTTTGACTCATACAGTTAACACAATGTGAATTTCTTCCTCAGCATAACAGAGTT
ATAGAATGACAGGGCTGGAAGTGACCTTAGAGAGTATCCAGTTCTTTCATTTTACAGGTGAGGCAACTGA
GACTCAAAGGTGATGTAATTTGTGCAAAGATTATAGCTAATTAGTAGCAGAGCCCTGACTGGGACATAGT
TTGAAGGTGAAAAACTTCACCAAGCTACCTTTCTTGAAAGGTCCAAATGTTTATGTTTTCAACTACTCTT
TCCACTGTACCATAACTTTCACTACATATTAAATGACACTTTATAACTAATATAATAGGACAATCATCAA
TGCATATATAGCCAGCCCTTCATATCTGTGGGTTTTGCATCCATGGATTCAACCAAGGAGGAATTGAAAA
CACTGAGAAAAAAAAAAAAGACCACACAATAAAAAAAAAAAATACAAAATAATACAAAGAAAAAGCCAA
A
ATTGTCATACTGTTGTTAAGCAACAGTATAACAACTATTTACATAGCATTAAGGTTGGTGCAAAAATGCA
AAAAAAAAAAAAGCAATTATTTTTAAACCAACCTAATATATTGTATTAGGTATTAAAGTCATCTGGACAT
GAATTAAAGTATATGATGCCAGCCTGGACAAAAGGCAAAACCCTGTCTCTACAAAAAATACAAAAATTAG
428
CTGGGCATGGTGGTGTGTGCCTGTAGTCCTGGCTACTCCGGAGCCTGAGGTGGGAGGATCGCTTGAGTCT
GGGAGGCAGAGGCTGCATTGAGCTATGATCATGGCACTGCATTCCAGCCTGGGTGACAGTGCAAGACCTT
GTCTCAGAATAAATAAAGTATGTGATGAAGATGTGCATACATTATATGCAAATACTGTTTTTTTTTTTTT
TAATTTAAACAGTCTCACTGTGTTGCCCAGGATGGAGTGCAATGGCACAATCTTGGCTCATGGCAAACTC
TGCCTCGCAAGCAGCTGGGACTACAGGCATGCTCCACGGTGCCCAGTTAATTTTTTTTGTATTCTTAGTA
GAGACAGGGTTTCACCATGTTGGCCAGGCTAGTCTTGAATTTCTGACCTCAAGTGATTCATCTCCCAAAG
TGCTGGGATTACAGGCGTGAGCCACCACGGCCGGCTAATTTTTGTATTTTTTAGTAGTGACTGGTTTCGC
GGTGTTGACCAGGCTGGTCTCGAACTCCTGATCTCAGGTGATCTGCCTGCCTCGGCCTCACAAAGTGCTG
GGATTACAGGTGTGAACCACTGCTCCCGGCCTTGTGTGATTTTATCTAAGGGACTTAAGCGTCCTCAGGT
CCTAGGGGGTCGTGAAACCAAAACCCCAGGGATAGCAAGGGACAATTGTATCTTCAAAGTAGACAAATGG
CGCCGGGCACGGTGGCTCACGCCTGTAATCCCAGCAGTTTCCGAGGCTGAGGCAGGCGGCTCACCTGAGG
TCAGGAGTTGGAGACCAGCCTGGCCAACATGCTGAAACCCTGTCTGTACAAAAATACAAAAATAGCTGGG
CATGGTGGCGCATGCCTGTAGTCCCAGCTACTAGAGCGACTGAGGCAGGAGAATTGCTTGAACCTGGGAG
GCGGAGGTTGCAGGGAGCCAAGATGGCGCCACCGCACTCCAGCCTAGGTGATAGAGTGAGACTCCCTCTC
AAAAACAAAACAAAACAAAAAAATTAGACAAATGCTACATTAATGTTTGGGTGGTCAGATTCTACTTTGA
ATCTGAAGTTTGCAGATATGCCTATAGATTTTTGGAGTTTACCACTTTCTTATTCTGTATCATTAATGTA
ATATTTTAAATTACTATATATGTTACCATTTTTCTGGATTTAGTAAGAAATTTGCAGTTTTGGTTTGATG
TAACAAGGGTTTTAATGTAATTTATGTTAGATTTTGCATTTTTTTCATTACTGTTATATTTTAACCTGAC
TGACTGATCTAATTGTATTAGTATTGTGAATAATCATGTGAAATGTTTTGAGACAGAGTACTATATTTGT
GAATATAATTTTATGGTTTTTTTCACTTAGAACCTTTCTGTGTGGAAAACTAAGAAAATTGCTTTCTGCT
GTATAATCTGGCATTCATTGTAGATTAAAGCTTATTTTTCTGTGAATAAAACGTATTCAATAAAATACTA
TTCTTTAAAATTA…end of transcript

429
Full Alignment: ClustalW: CHO v Human comparison
CHO=6300bp ---- Human=8413bp
Identity matrix % = 81.01%
CHO-XIAP ------------------------------------------------------------
human-XIAP TTTCCAGATTGGGGCTCGGGCCGCGCCTCCTCCGGGACCCTCCCCTTGGACCGAGCCGAT 60
CHO-XIAP ----------------------------------------GGTGGACAAGTCCTATTTTC 20
human-XIAP CGCCGCGGGGCAGTTCGGGCCGGCTGTCCTGGCGCGAAAAGGTGGACAAGTCCTATTTTC 120
********************
CHO-XIAP AAGAGAAGATGACTTTTAACAGTTTTGAAGGATCTAGAACTTGTGTACCTGCAGACACCA 80
human-XIAP AAGAGAAGATGACTTTTAACAGTTTTGAAGGATCTAAAACTTGTGTACCTGCAGACATCA 180
************************************ ******************** **
CHO-XIAP ATAAGGATGAAGAATTTGTAGAAGAGTTTAATAGATTAAAAACATTTGCTAACTTTCCAA 140
human-XIAP ATAAGGAAGAAGAATTTGTAGAAGAGTTTAATAGATTAAAAACTTTTGCTAATTTTCCAA 240
******* *********************************** ******** *******
CHO-XIAP GTAGTAGTCCTGTTTCAGCATCAACCTTGGCACGAGCAGGGTTTCTTTATACTGGTGAAG 200
human-XIAP GTGGTAGTCCTGTTTCAGCATCAACACTGGCACGAGCAGGGTTTCTTTATACTGGTGAAG 300
** ********************** *********************************
CHO-XIAP GAGATACTGTGCAGTGCTTTAGTTGTCACGCGGCAGTGGATAGATGGCAGTACGGAGACT 260
human-XIAP GAGATACCGTGCGGTGCTTTAGTTGTCATGCAGCTGTAGATAGATGGCAATATGGAGACT 360
******* **** *************** ** ** ** *********** ** *******
CHO-XIAP CAGCTGTTGGAAGACACAGGCAAATATCCCCAAATTGCAGATTTATCAATGGTTTTTATT 320
human-XIAP CAGCAGTTGGAAGACACAGGAAAGTATCCCCAAATTGCAGATTTATCAACGGCTTTTATC 420
**** *************** ** ************************* ** ******
CHO-XIAP TTGAAAACAGTGCCACACAGGCTACAAATCCTGGTATCCAAAATGGCCAGTACAAAGCTG 380
human-XIAP TTGAAAATAGTGCCACGCAGTCTACAAATTCTGGTATCCAGAATGGTCAGTACAAAGTTG 480
******* ******** *** ******** ********** ***** ********** **
CHO-XIAP AAAACTATGTGGGAAACAGAAATCATTTTGCTCTTGACAGGCCATCTGAGACTCATGCAG 440
human-XIAP AAAACTATCTGGGAAGCAGAGATCATTTTGCCTTAGACAGGCCATCTGAGACACATGCAG 540
******** ****** **** ********** * ***************** *******
CHO-XIAP ATTATCTTTTGAGAACTGGACAGGTTGTAGATATTTCAGATACCATATACCCGAGGAACC 500
human-XIAP ACTATCTTTTGAGAACTGGGCAGGTTGTAGATATATCAGACACCATATACCCGAGGAACC 600
* ***************** ************** ***** *******************
CHO-XIAP CTGCCATGTGTAGTGAAGAAGCCAGGCTGAAGTCCTTTCAGAACTGGCCAGACTATGCCC 560
human-XIAP CTGCCATGTATAGTGAAGAAGCTAGATTAAAGTCCTTTCAGAACTGGCCAGACTATGCTC 660
********* ************ ** * ***************************** *
CHO-XIAP ACTTAACCCCCAGAGAGTTGGCCAGTGCTGGACTGTACTACACAGGGATTGATGATCAAG 620
human-XIAP ACCTAACCCCAAGAGAGTTAGCAAGTGCTGGACTCTACTACACAGGTATTGGTGACCAAG 720
** ******* ******** ** *********** *********** **** *** ****
CHO-XIAP TGCAGTGCTTTTGCTGTGGTGGGAAACTGAAAAATTGGGAACCCTGTGATCGTGCCTGGT 680
human-XIAP TGCAGTGCTTTTGTTGTGGTGGAAAACTGAAAAATTGGGAACCTTGTGATCGTGCCTGGT 780
************* ******** ******************** ****************

430
CHO-XIAP CAGAACACAGGAGACACTTTCCCAATTGCTTCTTTGTTTTGGGCCGGAATGTTAATGTTC 740
human-XIAP CAGAACACAGGCGACACTTTCCTAATTGCTTCTTTGTTTTGGGCCGGAATCTTAATATTC 840
*********** ********** *************************** ***** ***
CHO-XIAP GGAGTGAATCTGGTG---TGAGTTCTGATAGGAATTTCCCCAATTCGGCAAATTCTCCAA 797
human-XIAP GAAGTGAATCTGATGCTGTGAGTTCTGATAGGAATTTCCCAAATTCAACAAATCTTCCAA 900
* ********** ** ********************** ***** ***** *****
CHO-XIAP GAAATCCAGCCATGGCAGAATATGAAGCACGGATCATTACTTTTGGAACATGGATATACT 857
human-XIAP GAAATCCATCCATGGCAGATTATGAAGCACGGATCTTTACTTTTGGGACATGGATATACT 960
******** ********** *************** ********** *************
CHO-XIAP CAGTTAACAAGGAGCAGCTTGCAAGAGCTGGATTTTATGCTTTAGGTGAAGGTGATAAGG 917
human-XIAP CAGTTAACAAGGAGCAGCTTGCAAGAGCTGGATTTTATGCTTTAGGTGAAGGTGATAAAG 1020
********************************************************** *
CHO-XIAP TGAAGTGCTTTCACTGTGGAGGAGGGCTCACAGATTGGAAGCCAAGTGAAGACCCTTGGG 977
human-XIAP TAAAGTGCTTTCACTGTGGAGGAGGGCTAACTGATTGGAAGCCCAGTGAAGACCCTTGGG 1080
* ************************** ** *********** ****************
CHO-XIAP AACAGCATGCGAAGTGGTACCCAGGGTGTAAATATCTATTGGATGAGAAGGGGCAAGAAT 1037
human-XIAP AACAACATGCTAAATGGTATCCAGGGTGCAAATATCTGTTAGAACAGAAGGGACAAGAAT 1140
**** ***** ** ***** ******** ******** ** ** ******* *******
CHO-XIAP ATATAAATAATATTCATTTAACCCATTCACTTGGAGAATCTTTGGTAAGAACTGCTGAAA 1097
human-XIAP ATATAAACAATATTCATTTAACTCATTCACTTGAGGAGTGTCTGGTAAGAACTACTGAGA 1200
******* ************** ********** ** * * *********** **** *
CHO-XIAP AAACACCTTCACTAACTAAAAGAATTGATGATACCATCTTCCAGAATCCTATGGTACAAG 1157
human-XIAP AAACACCATCACTAACTAGAAGAATTGATGATACCATCTTCCAAAATCCTATGGTACAAG 1260
******* ********** ************************ ****************
CHO-XIAP AAGCTATACGAATGGGATTCAGTTTCAGGGACATTAAGAAAACAATGGAAGAAAAGATCC 1217
human-XIAP AAGCTATACGAATGGGGTTCAGTTTCAAGGACATTAAGAAAATAATGGAGGAAAAAATTC 1320
**************** ********** ************** ****** ***** ** *
CHO-XIAP AAACATCTGGGAGCAGCTATCTGTCCCTTGAGGTTCTGATTGCAGATCTAGTGAGTGCTC 1277
human-XIAP AGATATCTGGGAGCAACTATAAATCACTTGAGGTTCTGGTTGCAGATCTAGTGAATGCTC 1380
* * *********** **** ** ************ *************** *****
CHO-XIAP AGAAAGATAATACACAGGATGAGTCAAGTCAGACTTCATTGCAGAAAGACATCAGTACGG 1337
human-XIAP AGAAAGACAGTATGCAAGATGAGTCAAGTCAGACTTCATTACAGAAAGAGATTAGTACTG 1440
******* * ** ** *********************** ******** ** ***** *
CHO-XIAP AAGAGCAGCTGAGGCGCCTACAAGAAGAGAAGCTTTGCAAAATCTGCATGGATAGAAATA 1397
human-XIAP AAGAGCAGCTAAGGCGCCTGCAAGAGGAGAAGCTTTGCAAAATCTGTATGGATAGAAATA 1500
********** ******** ***** ******************** *************
CHO-XIAP TTGCTGTAGTTTTTGTTCCTTGTGGACATCTGGTCACTTGTAAACAGTGTGCTGAAGCAG 1457
human-XIAP TTGCTATCGTTTTTGTTCCTTGTGGACATCTAGTCACTTGTAAACAATGTGCTGAAGCAG 1560
***** * *********************** ************** *************
CHO-XIAP TTGACAAATGTCCCATGTGCTACACAATCATTACCTTCAAACAAAAAATTTTTATGTCTT 1517
human-XIAP TTGACAAGTGTCCCATGTGCTACACAGTCATTACTTTCAAGCAAAAAATTTTTATGTCTT 1620
******* ****************** ******* ***** *******************
CHO-XIAP AATGAGAG-CAACAGTAGGCATGTTATACTCTTCTTACT---CTAATTGAATGTGTGATG 1573
human-XIAP AATCTAACTCTATAGTAGGCATGTTATGTTGTTCTTATTACCCTGATTGAATGTGTGATG 1680

431
*** * * * ************** * ****** * ** ***************
CHO-XIAP TGAGCAAACTTTAAGTAATCAGCATTGCATTCCATTAGCATCTGCTGCCAAGTGG--AAA 1631
human-XIAP TGAACTGACTTTAAGTAATCAGGATTGAATTCCATTAGCATTTGCTACCAAGTAGGAAAA 1740
*** * *************** **** ************* **** ****** * ***
CHO-XIAP CAAATGTTAACAGCACTGGTACTGTC-------TAAACTTTGGATTTCTGGAACTTTCAG 1684
human-XIAP AAAATGTACATGGCAGTGTTTTAGTTGGCAATATAATCTTTGAATTTCTTGATTTTTCAG 1800
****** * *** ** * ** *** ***** ****** ** ******
CHO-XIAP GTTATTAGCTATATCGTTTATCCAGTTTT---TTACTCAATTAAAGCCTTAGACAAAGAA 1741
human-XIAP GGTATTAGCTGTATTATCCATTTTTTTTACTGTTATTTAATTGAAACCATAGACTAAGAA 1860
* ******** *** * ** *** *** * **** ** ** ***** *****
CHO-XIAP ------GCATTTAATATTATAACTTTTCACCTTGTGTATTTGTAGTACACTGACTTGATT 1795
human-XIAP TAAGAAGCATC--ATACTATAACTGAACACAATGTGTATTCATAGTATACTGATTTAATT 1918
**** *** ******* *** ******** ***** ***** ** ***
CHO-XIAP TCTATGTGTAAGTGAATTAATCACTATCATTTTTCATTCCTTTTGGATAAGCTTAACAAA 1855
human-XIAP TCTAAGTGTAAGTGAATTAATCATCTGGATTTTTTATTCTTTTCAGATAGGCTTAACAAA 1978
**** ****************** ****** **** *** **** **********
CHO-XIAP TGGAGTGTTCTGTATA--AGCAGGGAGATTTGAGTTAATCTACCCATTCACTTGCTCTGT 1913
human-XIAP TGGAGCTTTCTGTATATAAATGTGGAGATTAGAGTTAATCTCCCCAATCACATAATTTGT 2038
***** ********* * ******* ********** **** **** * * ***
CHO-XIAP TTATTGTGAACAGAGAATACACTGTTCCACACTGGTGGGAGGATAAACATTGGTTTGTAG 1973
human-XIAP TTTGTGTGAAAAAGGAATAAATTGTTCCATGCTGGTGGAAAGATAGAGATTG-TTTTTAG 2097
** ****** * ***** * ******* ******* * **** * **** *** ***
CHO-XIAP ATGTTTGTGTCTGTGTTTT-GGATTCTGTCCATTTTCTTTCAAATTTATAAACA--TACT 2030
human-XIAP AGGTTGGTTGTTGTGTTTTAGGATTCTGTCCATTTTCTTTTAAAGTTATAAACACGTACT 2157
* *** ** ******** ******************** *** ********* ****
CHO-XIAP TGTATGAATGGTTTTTT--AAGTGATTTTGCCATCTCCCAAAAGATATTTAATGGTAAAC 2088
human-XIAP TGTGCGAATTATTTTTTTAAAGTGATTT-GCCATTTTTGAAAGCGTATTTAATGATAGAA 2216
*** **** ****** ********* ***** * *** ********* ** *
CHO-XIAP TGCTTATCTAACCAGCATATACTAACATGGAAAGACAACAAAGATATATTAAGTGTAAAT 2148
human-XIAP TACT-ATCGAGCCAACATGTACTGACATGGAAAGATGTCAAAGATATGTTAAGTGTAAAA 2275
* ** *** * *** *** **** *********** ********* ***********
CHO-XIAP TACAAATGGCAAAACACTATGTATAGTTTGAGCCAAATCAAGGTGTGAATTTTAT--ATC 2206
human-XIAP TGCAAGTGGCAAAACACTATGTATAGTCTGAGCCAGATCAAAGTATGTATGTTTTTAATA 2335
* *** ********************* ******* ***** ** ** ** ** * **
CHO-XIAP TGTATAGGACAAAAAAGAGTTGGAAAGATATGCATCATACTCTTAAATATGTTTTTTTCT 2266
human-XIAP TGCATAGAACAAAA--GATTTGGAAAGATATACACCAAACTGTTAAATGTGGTTTCTCTT 2393
** **** ****** ** ************ ** ** *** ****** ** *** * *
CHO-XIAP TGAGGGGGGTGGG-----GGTATGGGTCTTTGAGGGGCTT-ATAGGAGCCCTT------- 2313
human-XIAP CGGGGAGGGGGGGATTGGGGGAGGGGCCCCAGAGGGGTTTTATAGGGGCCTTTTCACTTT 2453
* ** *** *** ** * *** * ****** ** ***** *** **
CHO-XIAP ---CTTTTTTCATTTTGTTCTGTTTGAAGTTTATATAAGTATGTATTACTTTTATATAAT 2370
human-XIAP CTACTTTTTTCATTTTGTTCTGTTCGAATTTTTTATAAGTATGTATTACTTTTGTA--AT 2511
********************* *** *** ******************** ** **

432
CHO-XIAP CAGAATTTTTAGAAA-TATTGTACTGATTTAAAGGCTTAGGCATGTTCAAACGTCTGCAA 2429
human-XIAP CAGAATTTTTAGAAAGTATTTTGCTGATTTAAAGGCTTAGGCATGTTCAAACGCCTGCAA 2571
*************** **** * ****************************** ******
CHO-XIAP AACTACTTATTGCTCAGTTTTAGTTTTTCTAATCCAAGAAGGCAGGCCAGTTGAC-TTTC 2488
human-XIAP AACTACTTATCACTCAGCTTTAGTTTTTCTAATCCAAGAAGGCAGGGCAGTTAACCTTTT 2631
********** ***** **************************** ***** ** ***
CHO-XIAP TGGTGCCAATGTGAAATTTAAATGTTTTT--GTTTTACCTGCTTTGTGGATAGAAAATAT 2546
human-XIAP TGGTGCCAATGTGAAATGTAAATGATTTTATGTTTTTCCTGCTTTGTGGATGAAAAATAT 2691
***************** ****** **** ***** ************** *******
CHO-XIAP TTCTGAGTGGTAGTTTTCTGACAGGTAGACCATGTCTTCTTATCTTGTTTCAAAATAAGT 2606
human-XIAP TTCTGAGTGGTAGTTTTTTGACAGGTAGACCATGTCT---TATCTTGTTTCAAAATAAGT 2748
***************** ******************* ********************
CHO-XIAP ATTTCTGATTTTGTAAAATGAAATATAAAATATTGTCTCAGATCTTCCAATTAATTAGTA 2666
human-XIAP ATTTCTGATTTTGTAAAATGAAATATAAAATAT-GTCTCAGATCTTCCAATTAATTAGTA 2807
********************************* **************************
CHO-XIAP AGGATTCATCCTTAATCCTTGCTAGTTTAAGCCTGCCTAAGTCACTTTACTAAAAGATCT 2726
human-XIAP AGGATTCATCCTTAATCCTTGCTAGTTTAAGCCTGCCTAAGTCACTTTACTAAAAGATCT 2867
************************************************************
CHO-XIAP TTGTTAACCCAGTATTTTAAACATTTGTCTGCTTATGTAGGTAAAAGTAGAAGCATGTTT 2786
human-XIAP TTGTTAACTCAGTATTTTAAACATCTGTCAGCTTATGTAGGTAAAAGTAGAAGCATGTTT 2927
******** *************** **** ******************************
CHO-XIAP GTATGCTGCTTGTAGTTTTAGTGACAGCTTTCCATGTTGAAATTCTCATGTCATTTTGTG 2846
human-XIAP GTACACTGCTTGTAGTTATAGTGACAGCTTTCCATGTTGAGATTCTCATATCATCTTGTA 2987
*** ************ ********************** ******** **** ****
CHO-XIAP TCCTAAAAGTTTCATGTGAGTTTTTACTGTTAGGAAGATTAAGATGTATATAGTACAGAA 2906
human-XIAP TCTTAAA-GTTTCATGTGAGTTTTTACCGTTAGGATGATTAAGATGTATATAGGACAAAA 3046
** **** ******************* ******* ***************** *** **
CHO-XIAP TGGTAAGTCTCTAATTGTTTTATGTTTGTTTGTTTCTTGACTAGTAATAGTAGTAAATAC 2966
human-XIAP TGTTAAGTCTTTCCTCTACCTACATTTGTTT---TCTTGGCTAGTAATAGTAGTAGATAC 3103
** ******* * * ** ******* ***** *************** ****
CHO-XIAP TTTAAAAATA----TTTTCTCAAGATCCTTAAGAACTCTTGGAAATTGTAACA-TACTGA 3021
human-XIAP TTCTGAAATAAATGTTCTCTCAAGATCCTTAAAACCTCTTGGAAATTATAAAAATATTGG 3163
** ***** ** *************** * ************ *** * ** **
CHO-XIAP CAAGAG--------TAGTTGTTTAAATACTTCTAACAA----CTTGTATAAGAGTCAATA 3069
human-XIAP CAAGAAAAGAAGAATAGTTGTTTAAATATTTTTTAAAAAACACTTGAATAAGAATCAGTA 3223
***** ************** ** * * ** **** ****** *** **
CHO-XIAP TGA-ATAAAATCCAGCT----AAATGCTTCATAGAACA--CAGGATTTACCCTAAACAAT 3122
human-XIAP GGGTATAAACTAGAAGTTTAAAAATGCTTCATAGAACGTCCAGGGTTTACATTACAAGAT 3283
* ***** * * * **************** **** ***** ** * **
CHO-XIAP TATCATAATGGACCTCTTACAGAGACTC-TAGTCTGTTTTACTACAGAGCACAGTTTGAG 3181
human-XIAP TCTCACAACAAACCTATTGTAGAGGTGAGTAAGGCATGTTACTACAGAGGAAAGTTTGAG 3343
* *** ** **** ** **** ** * *********** * ********
CHO-XIAP AGTGAAACTGTTACAATTTAGATTTTTGTTGTATTTTCTAAGAGAAAGAATATTGTTAGG 3241
human-XIAP AGTAAAACTGTAAAAAATTATATTTTTGTTGTACTTTCTAAGAGAAAGAGTATTGTTATG 3403

433
*** ******* * ** *** ************ *************** ******** *
CHO-XIAP TTCTCCTAACTTCTGTTGACTACTATGGTAAGTGGTGT-CATTTTAA---TTGCAAATTT 3297
human-XIAP TTCTCCTAACTTCTGTTGATTACTACTTTAAGTGATATTCATTTAAAACATTGCAAATTT 3463
******************* ***** ****** * * ***** ** **********
CHO-XIAP A--------------------------AATAGAAATT----------------------- 3308
human-XIAP ATTTTATTTATTTAATTTTCTTTTTGAGATGGAGTCTTGCTTGTCACCCAGGCTGGAGTG 3523
* ** ** *
CHO-XIAP -AACAGAAT--------------------------------------------------- 3316
human-XIAP CAGTGGAGTGATCTCTGCTCACTGCAACCTCCGCCTTCTGGGTTCAAGCGATTCTCGTGC 3583
* ** *
CHO-XIAP ----------TAAGTA------------------------CATTCCC--------TTTTT 3334
human-XIAP CTCAGCTTCCTGAGTAGCTGGAATTACAGGCAGGTGCCACCATGCCCGACTAATTTTTTT 3643
* **** *** *** *****
CHO-XIAP TTCTTT------------------------------------------------------ 3340
human-XIAP TTATTTTTAGTAGAGACGGGGTTTCACCATGTTGGCCAGGCTGGTATCAAACTCCTGACC 3703
** ***
CHO-XIAP ----------------------------------------------GCTT---------- 3344
human-XIAP TCAAGAGATCCACTCGCCTTGCCCTCCCAAAGTGCTGGGATTACAGGCTTGAGCCACCAC 3763
****
CHO-XIAP ------------------------------------------------------------
human-XIAP GCCCGGCTAAAACATTGCAAATTTAAATGAGAGTTTTAAAAATTAAATAATGACTGCCCT 3823
CHO-XIAP -TTTC---------ATGAAAATCCTTAGTTCTTTAC------ATTGTCTCCTACTTAGGT 3388
human-XIAP GTTTCTGTTTTAGTATGTAAATCCTCAGTTCTTCACCTTTGCACTGTCTGCCACTTAG-T 3882
**** *** ******* ******* ** * ***** * ****** *
CHO-XIAP TCAGTTGTATAGTCGAACTTAATCTAAATT--GACTAAGGTTTAAATTTAAATTTACGTT 3446
human-XIAP TTGGTTATATAGTCA---TTAACTTGAATTTGGTCT---GTATAGTCTAGACTTTAAATT 3936
* *** ******* **** * **** * ** ** ** * * **** **
CHO-XIAP TAAAGCATTCCACA-GGGGATAAAAGTGTTAATTTAAAAAAAAAATGTTCCCTAAGACAC 3505
human-XIAP TAAAGTTTTCTACAAGGGGAGAAAAGTGTTAAAATTTTTAAAATATGTTTTCCAGGACAC 3996
***** *** *** ***** *********** * **** ***** * * *****
CHO-XIAP TTCAGGTACAAGTCACGTAGGTAGTGTGTTTAATCTAGCTGTTAGCCAAGGATTCAAGGA 3565
human-XIAP TTCACTTCCAAGTCAGGTAGGTAGT----TCAATCTAGTTGTTAGCCAAGGACTCAAGGA 4052
**** * ******* ********* * ******* ************* *******
CHO-XIAP CTGAATTGTTTTTGAATAAGGCTTTTCTTGTTCTGGGAGCCTCAGTTCATTAAAACTCTC 3625
human-XIAP CTGAATTGTTTTAACATAAGGCTTTTCCTGTTCTGGGAGCCGCACTTCATTAAAATT--- 4109
************ ************ ************* ** ********** *
CHO-XIAP CTTTTAAAACTTGTGTGCTGAGAGTTAAGCAAGACCTCTTTTTTTTTTTTTTTTTGTCTT 3685
human-XIAP CTTCTAAAACTTGTATGTTTAGAGTTAAGCAAGAC---------TTTTTTTCTTCCTCTC 4160
*** ********** ** * *************** ******* ** ***
CHO-XIAP CATGAGTTGCGAAATTGAATTCATGAAGCTGATGTGGCTAACAAGTTTATTTTAAGAATT 3745
human-XIAP CATGAGTTGTGAAATTTAATGCACAACGCTGATGTGGCTAACAAGTTTATTTTAAGAATT 4220
********* ****** *** ** * *********************************
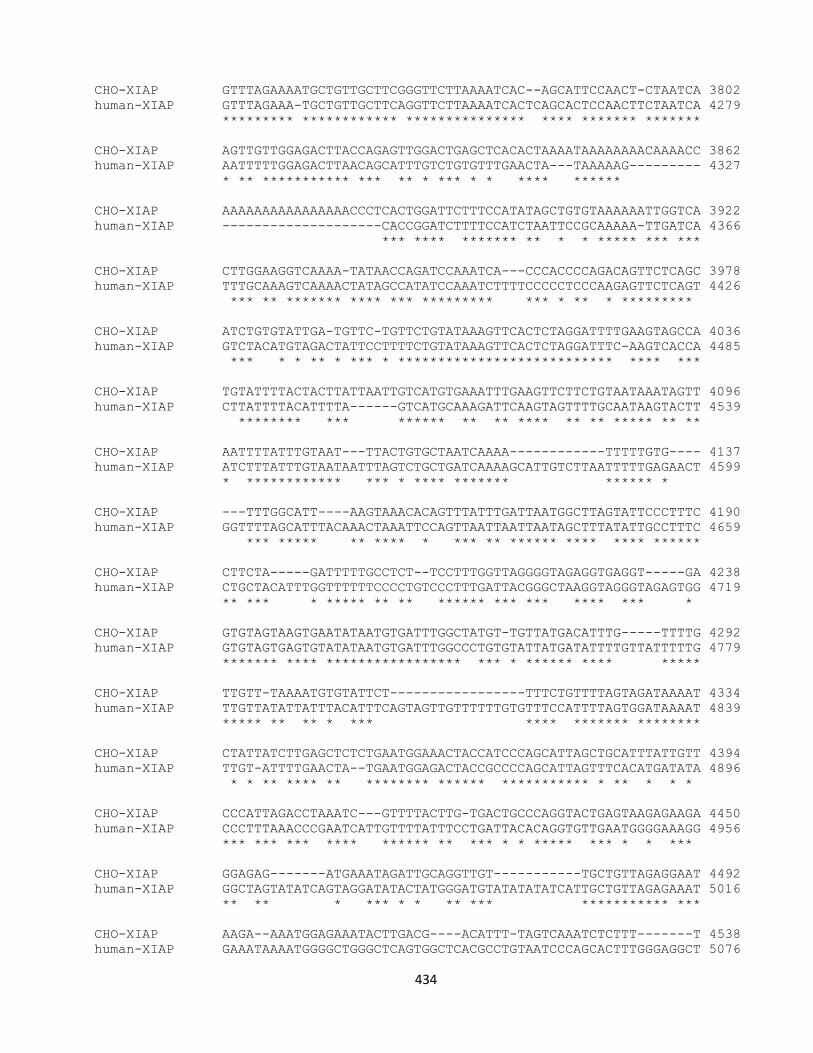
434
CHO-XIAP GTTTAGAAAATGCTGTTGCTTCGGGTTCTTAAAATCAC--AGCATTCCAACT-CTAATCA 3802
human-XIAP GTTTAGAAA-TGCTGTTGCTTCAGGTTCTTAAAATCACTCAGCACTCCAACTTCTAATCA 4279
********* ************ *************** **** ******* *******
CHO-XIAP AGTTGTTGGAGACTTACCAGAGTTGGACTGAGCTCACACTAAAATAAAAAAAACAAAACC 3862
human-XIAP AATTTTTGGAGACTTAACAGCATTTGTCTGTGTTTGAACTA---TAAAAAG--------- 4327
* ** *********** *** ** * *** * * **** ******
CHO-XIAP AAAAAAAAAAAAAAAACCCTCACTGGATTCTTTCCATATAGCTGTGTAAAAAATTGGTCA 3922
human-XIAP --------------------CACCGGATCTTTTCCATCTAATTCCGCAAAAA-TTGATCA 4366
*** **** ******* ** * * ***** *** ***
CHO-XIAP CTTGGAAGGTCAAAA-TATAACCAGATCCAAATCA---CCCACCCCAGACAGTTCTCAGC 3978
human-XIAP TTTGCAAAGTCAAAACTATAGCCATATCCAAATCTTTTCCCCCTCCCAAGAGTTCTCAGT 4426
*** ** ******* **** *** ********* *** * ** * *********
CHO-XIAP ATCTGTGTATTGA-TGTTC-TGTTCTGTATAAAGTTCACTCTAGGATTTTGAAGTAGCCA 4036
human-XIAP GTCTACATGTAGACTATTCCTTTTCTGTATAAAGTTCACTCTAGGATTTC-AAGTCACCA 4485
*** * * ** * *** * *************************** **** ***
CHO-XIAP TGTATTTTACTACTTATTAATTGTCATGTGAAATTTGAAGTTCTTCTGTAATAAATAGTT 4096
human-XIAP CTTATTTTACATTTTA------GTCATGCAAAGATTCAAGTAGTTTTGCAATAAGTACTT 4539
******** *** ****** ** ** **** ** ** ***** ** **
CHO-XIAP AATTTTATTTGTAAT---TTACTGTGCTAATCAAAA------------TTTTTGTG---- 4137
human-XIAP ATCTTTATTTGTAATAATTTAGTCTGCTGATCAAAAGCATTGTCTTAATTTTTGAGAACT 4599
* ************ *** * **** ******* ****** *
CHO-XIAP ---TTTGGCATT----AAGTAAACACAGTTTATTTGATTAATGGCTTAGTATTCCCTTTC 4190
human-XIAP GGTTTTAGCATTTACAAACTAAATTCCAGTTAATTAATTAATAGCTTTATATTGCCTTTC 4659
*** ***** ** **** * *** ** ****** **** **** ******
CHO-XIAP CTTCTA-----GATTTTTGCCTCT--TCCTTTGGTTAGGGGTAGAGGTGAGGT-----GA 4238
human-XIAP CTGCTACATTTGGTTTTTTCCCCTGTCCCTTTGATTACGGGCTAAGGTAGGGTAGAGTGG 4719
** *** * ***** ** ** ****** *** *** **** *** *
CHO-XIAP GTGTAGTAAGTGAATATAATGTGATTTGGCTATGT-TGTTATGACATTTG-----TTTTG 4292
human-XIAP GTGTAGTGAGTGTATATAATGTGATTTGGCCCTGTGTATTATGATATTTTGTTATTTTTG 4779
******* **** ***************** *** * ****** **** *****
CHO-XIAP TTGTT-TAAAATGTGTATTCT-----------------TTTCTGTTTTAGTAGATAAAAT 4334
human-XIAP TTGTTATATTATTTACATTTCAGTAGTTGTTTTTTGTGTTTCCATTTTAGTGGATAAAAT 4839
***** ** ** * *** **** ******* ********
CHO-XIAP CTATTATCTTGAGCTCTCTGAATGGAAACTACCATCCCAGCATTAGCTGCATTTATTGTT 4394
human-XIAP TTGT-ATTTTGAACTA--TGAATGGAGACTACCGCCCCAGCATTAGTTTCACATGATATA 4896
* * ** **** ** ******** ****** *********** * ** * * *
CHO-XIAP CCCATTAGACCTAAATC---GTTTTACTTG-TGACTGCCCAGGTACTGAGTAAGAGAAGA 4450
human-XIAP CCCTTTAAACCCGAATCATTGTTTTATTTCCTGATTACACAGGTGTTGAATGGGGAAAGG 4956
*** *** *** **** ****** ** *** * * ***** *** * * ***
CHO-XIAP GGAGAG-------ATGAAATAGATTGCAGGTTGT-----------TGCTGTTAGAGGAAT 4492
human-XIAP GGCTAGTATATCAGTAGGATATACTATGGGATGTATATATATCATTGCTGTTAGAGAAAT 5016
** ** * *** * * ** *** *********** ***
CHO-XIAP AAGA--AAATGGAGAAATACTTGACG----ACATTT-TAGTCAAATCTCTTT-------T 4538
human-XIAP GAAATAAAATGGGGCTGGGCTCAGTGGCTCACGCCTGTAATCCCAGCACTTTGGGAGGCT 5076

435
* * ****** * ** * ** * ** ** * * **** *
CHO-XIAP TAAAAAGGTAG-----------------------CCATATAGGCTTCACAATCTGAGGTC 4575
human-XIAP GAGGCAGGTGGATCACGAGGTCAGGAGATCGAGACCATCCTGGCTA-ACACGGTGAAACC 5135
* **** * **** **** *** *** *
CHO-XIAP ATATCTCCAG-AACCCACATAAAA---GCTGGGTG----------CAC---TAGCCCCAA 4618
human-XIAP CCGTCTCTACTAAAAAACAGAAAATTAGCCGGGCGTGGTGGCGGGCGCCTGTAGTCCCAG 5195
**** * ** *** **** ** *** * * * *** ****
CHO-XIAP GCATC------------------------TGT-AATCCGGGAA--------TGC------ 4639
human-XIAP CTACTCGGGAGGCTGAGGCAGGAGAATGGTGTGAACCCGGGAGGCAGAGCTTGCAGTGAG 5255
* *** ** ****** ***
CHO-XIAP -------------------CTCCA---TGA--AACAGG---------------------A 4654
human-XIAP CCGAGATCTCGCCACTGCACTCCAGCCTGGGCAACAGAGCAAGACTCTGTCTCAAAAAAA 5315
***** ** ***** *
CHO-XIAP AGCAGATAGGAGACGGGCCA----GAAGCTA-ACTTGGCTTAGGCATT---AGCCAAGAG 4706
human-XIAP AAAAAAAAAGAAATAAGAAAATGGGAAGCAATATTTGACATAGTTCTTTTTAGTCAAATC 5375
* * * * ** * * * ***** * * *** * *** ** ** ***
CHO-XIAP ACCCTGTTAA------GGTAG----------------GAAGG-----------TTGTCCT 4733
human-XIAP TACTTGTTAAAAAAAGGGTAGCAGTTTATTCATCTGTGAAAGGAAAATAATACTTATCTT 5435
* ****** ***** *** * ** ** *
CHO-XIAP ------TTG--------------GGTTATCTG---------CCCTCT---AATGTG---- 4757
human-XIAP ACAAGGTTGCAAGAGCTCAAGGAGACCATGTATGTAAAGTTCCTGCTGTAAATATGAACT 5495
*** * ** * ** ** *** **
CHO-XIAP --CATCATGATAGGCATCCACCTAT----------------ACTCGGACACACACACAAA 4799
human-XIAP CCCATCCTAATACCCTTTTACCTCTCTGTGGGTTTGTCTTGACCTGGAAATTTGGGCTAA 5555
**** * *** * * **** * ** *** * * **
CHO-XIAP AG---AAAAAAAAC--------AAAAA-----------------GTAGCTATCTGTAT-- 4829
human-XIAP AACTTAGAAAAAATTCTTACATGATAACTCAGTGATGCTTACTCATAGTTTTTGGTGTTT 5615
* * ****** * ** *** * * ** *
CHO-XIAP ------AATAAGA-----------------------CTATTACCT-TAACC-----ATTT 4854
human-XIAP CTCATAGATAAGATATAAATCAGCTGGGCGCGGTGGCTCATGCCTGTAATCCCAGCACTT 5675
****** ** * *** *** * * **
CHO-XIAP T----------------------ATCCAAGGT-----GATGGAATTCAACTCAA------ 4881
human-XIAP TGGGAGGCCGAGGCGGGCAGATCACCTGAGGTCGGGAGGTCGAGACCAGCCTGACCAACA 5735
* * * **** * * ** ** * *
CHO-XIAP -GGAGAACACACCTTAATTGTTTTAAATG-----TTAACT-----------CTCA-ACCT 4923
human-XIAP TGGAGAA-ACCCCGTCTCTACTAAAAATACAAAATTAGCTGGGCGTGGTGGCTCATGCCT 5794
****** ** ** * * * **** *** ** **** ***
CHO-XIAP AAAA------CTTTTT--------------------TTTTTT----CCAGGA--CAGAGT 4951
human-XIAP GTAATCCCAGCTACTTGGGAGGCTGAGGCAGGAGAATCGCTTGAACCCAGGAGGCGGAGG 5854
** ** ** * ** ****** * ***
CHO-XIAP TTCT-----------------CTAT-GTAGCCCAGGCTGTACTCAAACATCAGCAACCCT 4993
human-XIAP TTGTGGTGAGCGAAGATCGTGCCATTGCACTCCAGCCTGGGC---AACAAGAGCAAAACT 5911
** * * ** * * **** *** * **** ***** **

436
CHO-XIAP CTGCCTC----------------------------------------------------- 5000
human-XIAP CTGTCTCAAAAAAAAAAAAAGATATAAATCACAATAAATAAATAGGTCAATACAAATGTT 5971
*** ***
CHO-XIAP -------------------TGCCTCT-GCCTCTGC--CTCTGGAGT-----GCTGGG--- 5030
human-XIAP AGCCAGGCGTGGTGGCACATGCCCATAGTCGCAGCTACTCTGGAGGCAGAGGCAGGAGGA 6031
**** * * * * ** ******** ** **
CHO-XIAP ----------------ATTAAAGGT-GCA--------------TGCCACTACAGCCCAG- 5058
human-XIAP TCACTTGAGCCCATGAATTTGAGGCAGCAGTGAGCTATGATTGTGCCACTGTACTCCAGT 6091
*** *** *** ******* * ****
CHO-XIAP -------------------------------------------------------ATTCA 5063
human-XIAP CTGGGTGACAGAGTGAGACCCCATCTCTAAATAAATAGGTCAAACCCTTAAAAATATTTA 6151
*** *
CHO-XIAP ---TCCTAAAAACTCG--------------------------TAGGCCTTCCA------- 5087
human-XIAP AATTCTTAAAAAATTGAAAAGATTATTCTTCTCAAATTTAGTTGAGCTTTCTAAGAGAAG 6211
** ****** * * * ** *** *
CHO-XIAP ----TGGGTTCTCC-----TTGATAG--------AG---GACTTGGAC---TAA------ 5118
human-XIAP CAATTGGCTTTTTCCCACTTCAATAATCATTTTCAGTTTGACTCATACAGTTAACACAAT 6271
*** ** * * * *** ** **** ** ***
CHO-XIAP ---------------AGCTTAATAGACC-------------GCCTGGAA----------- 5139
human-XIAP GTGAATTTCTTCCTCAGCATAACAGAGTTATAGAATGACAGGGCTGGAAGTGACCTTAGA 6331
*** *** *** * ******
CHO-XIAP -----------------------------AGATAACTCAGCCACTAAG------------ 5158
human-XIAP GAGTATCCAGTTCTTTCATTTTACAGGTGAGGCAACTGAGACTCAAAGGTGATGTAATTT 6391
** **** ** * * ***
CHO-XIAP ---------------------AGTA----------------------------------- 5162
human-XIAP GTGCAAAGATTATAGCTAATTAGTAGCAGAGCCCTGACTGGGACATAGTTTGAAGGTGAA 6451
****
CHO-XIAP ---CTT------GCTGC--TTCTGCAGAGGACCAAA-GTTCA-GTTCCCAGC-AC----- 5203
human-XIAP AAACTTCACCAAGCTACCTTTCTTGAAAGGTCCAAATGTTTATGTTTTCAACTACTCTTT 6511
*** *** * **** * *** ***** *** * *** ** * **
CHO-XIAP CCAACG-----------------------GGGTGGC---TTACAACTG-CATATTAGCTC 5236
human-XIAP CCACTGTACCATAACTTTCACTACATATTAAATGACACTTTATAACTAATATAATAGGAC 6571
*** * ** * *** **** *** *** *
CHO-XIAP CAGCTTCAGTC--TATCTAGT--GCCCTCT-----------TTTGGCCTCCATGGG---- 5277
human-XIAP AATCATCAATGCATATATAGCCAGCCCTTCATATCTGTGGGTTTTGCATCCATGGATTCA 6631
* * *** * *** *** ***** *** ** *******
CHO-XIAP -------------------CAC------------------CTACA--------------- 5285
human-XIAP ACCAAGGAGGAATTGAAAACACTGAGAAAAAAAAAAAAGACCACACAATAAAAAAAAAAA 6691
*** * ***
CHO-XIAP -TGCA--------------------------TGTGCATAT---------------ATATA 5303
human-XIAP ATACAAAATAATACAAAGAAAAAGCCAAAATTGT-CATACTGTTGTTAAGCAACAGTATA 6750
* ** *** **** ****
CHO-XIAP A-----ACATACACA-CATTA-----------------CACATAAAATAAAAATAATCCT 5340
human-XIAP ACAACTATTTACATAGCATTAAGGTTGGTGCAAAAATGCAAAAAAAAAAAAAGCAATTAT 6810

437
* * **** * ***** ** * **** **** *** *
CHO-XIAP TTTTT------------------TTTTTGGTTTT-------TCGAGACAGGGTTTC---T 5372
human-XIAP TTTTAAACCAACCTAATATATTGTATTAGGTATTAAAGTCATCTGGACATGAATTAAAGT 6870
**** * ** *** ** ** **** * ** *
CHO-XIAP CTGTGGC-----TTTGGAGA------------CTGTCCT-------------GGAACTAG 5402
human-XIAP ATATGATGCCAGCCTGGACAAAAGGCAAAACCCTGTCTCTACAAAAAATACAAAAATTAG 6930
* ** **** * ***** ** ***
CHO-XIAP CT-----------------CTTGTAGACCAGGCTGGCCTCGAACTCA------------- 5432
human-XIAP CTGGGCATGGTGGTGTGTGCCTGTAGTCCTGGCTACTCCGGAGCCTGAGGTGGGAGGATC 6990
** * ***** ** **** * ** *
CHO-XIAP ----------------CAGAGAT-----------------------CTGCCTCCC--TCT 5451
human-XIAP GCTTGAGTCTGGGAGGCAGAGGCTGCATTGAGCTATGATCATGGCACTGCATTCCAGCCT 7050
***** **** * ** **
CHO-XIAP G---------------CCTC--CCTGGAAT---TAAAG----------------GCGTAC 5475
human-XIAP GGGTGACAGTGCAAGACCTTGTCTCAGAATAAATAAAGTATGTGATGAAGATGTGCATAC 7110
* *** * **** ***** ** ***
CHO-XIAP GCCAC---CAA------------------------------------------CGCCCAG 5490
human-XIAP ATTATATGCAAATACTGTTTTTTTTTTTTTTAATTTAAACAGTCTCACTGTGTTGCCCAG 7170
* *** ******
CHO-XIAP CA---AATAAAA----ATAATCTT---------TAAA----GCTT---AAACAA----AA 5523
human-XIAP GATGGAGTGCAATGGCACAATCTTGGCTCATGGCAAACTCTGCCTCGCAAGCAGCTGGGA 7230
* * * ** * ****** *** ** * ** ** *
CHO-XIAP CT---GGTATATT-----------------TACTTTTTGT-------------------- 5543
human-XIAP CTACAGGCATGCTCCACGGTGCCCAGTTAATTTTTTTTGTATTCTTAGTAGAGACAGGGT 7290
** ** ** * * *******
CHO-XIAP --CAC--TGTTA-----------CTTG--TTTCT-------------------------- 5560
human-XIAP TTCACCATGTTGGCCAGGCTAGTCTTGAATTTCTGACCTCAAGTGATTCATCTCCCAAAG 7350
*** **** **** *****
CHO-XIAP --CTGGA-------------------------------------TGCTTCTTAGAAA--- 5578
human-XIAP TGCTGGGATTACAGGCGTGAGCCACCACGGCCGGCTAATTTTTGTATTTTTTAGTAGTGA 7410
**** * ** **** *
CHO-XIAP --AGTTCCAGACTATCAGCTAGA---------AA----TGACCTCGGA-GAGTAGCTTAT 5622
human-XIAP CTGGTTTCGCGGTGTTGACCAGGCTGGTCTCGAACTCCTGATCTCAGGTGATCTGCCTGC 7470
*** * * * * ** ** *** *** * ** ** *
CHO-XIAP -------TCACA-------------------GCACACCACC-CTC-------------AT 5642
human-XIAP CTCGGCCTCACAAAGTGCTGGGATTACAGGTGTGAACCACTGCTCCCGGCCTTGTGTGAT 7530
***** * ***** *** **
CHO-XIAP TTTATC--------------------------------ATTGCGA---TAGACCCTT--- 5664
human-XIAP TTTATCTAAGGGACTTAAGCGTCCTCAGGTCCTAGGGGGTCGTGAAACCAAAACCCCAGG 7590
****** * * ** * * **
CHO-XIAP --TACT--GGCACA--TG---CTTTGAAGTTGGAAAAC--CCCTTACCACACCGGCT--- 5710
human-XIAP GATAGCAAGGGACAATTGTATCTTCAAAGTAGACAAATGGCGCCGGGCACGGTGGCTCAC 7650
** ** *** ** *** **** * *** * * *** ****

438
CHO-XIAP ACCTGT--CCTGGGAAGTCTCCGATGTT-------------TATTTT---TCAGCAGTT- 5751
human-XIAP GCCTGTAATCCCAGCAGTTTCCGAGGCTGAGGCAGGCGGCTCACCTGAGGTCAGGAGTTG 7710
***** * * *** ***** * * * * **** ****
CHO-XIAP -----CATTC----CATTATACTCGAATTTTCACTACACAGTAA---------------- 5786
human-XIAP GAGACCAGCCTGGCCAACATGCTGAAACCCTGTCTGTACAAAAATACAAAAATAGCTGGG 7770
** * ** ** ** ** * ** *** **
CHO-XIAP -ATGATA--------CTTTA----TAACTGTTA------------CAGTAGGAC------ 5815
human-XIAP CATGGTGGCGCATGCCTGTAGTCCCAGCTACTAGAGCGACTGAGGCAGGAGAATTGCTTG 7830
*** * ** ** * ** ** *** ** *
CHO-XIAP AACC------------------------------------------------CCTA---- 5823
human-XIAP AACCTGGGAGGCGGAGGTTGCAGGGAGCCAAGATGGCGCCACCGCACTCCAGCCTAGGTG 7890
**** ****
CHO-XIAP ATA-----------CTTTT---------------------AAATTAAGTAATATGC--CG 5849
human-XIAP ATAGAGTGAGACTCCCTCTCAAAAACAAAACAAAACAAAAAAATTAGACAA-ATGCTACA 7949
*** * * * ****** ** **** *
CHO-XIAP TTAATGCTTGAGTGGTAGAGTTCTCATTTGGAGGCTCAGGTTTGTAGATGT--------- 5900
human-XIAP TTAATGTTTGGGTGGTCAGATTCT-ACTTTGAATCTGAAGTTTGCAGATATGCCTATAGA 8008
****** *** ***** **** * ** ** ** * ***** **** *
CHO-XIAP ---TTGGCATTTACTGTGTGCTTAT---GTATCAT----GTAGCATTTAAGATTACTGTG 5950
human-XIAP TTTTTGGAGTTTACCACTTTCTTATTCTGTATCATTAATGTAATATTTTAAATTACTATA 8068
**** ***** * ***** ******* *** **** * ****** *
CHO-XIAP TAAGTTTATTTTATCACTCTATCAATACCAACAAGCTTGCATTTTAAATTTGATGTTAAT 6010
human-XIAP TATGTT-ACCATTTTTCTGGATT--TAGTAAGAAATTTGCAGTTTTGGTTTGATGT-AAC 8124
** *** * * * ** ** ** ** ** ***** *** ******** **
CHO-XIAP AATGGCTTTAATGTAGTTTCTG----GTTTTGGATTTTTTTT----TTATTATGCTTCA- 6061
human-XIAP AAGGGTTTTAATGTAATTTATGTTAGATTTTGCATTTTTTTCATTACTGTTATATTTTAA 8184
** ** ********* *** ** ***** ******** * **** ** *
CHO-XIAP CCTGACAGAATGACCCATTCTTTTATCTTTGTGTTAGTTTTGTGAATACTTATGTTAAGA 6121
human-XIAP CCTGACTGACTGATCTAAT----------TGTATTAGTATTGTGAATAATCATGTGAAAT 8234
****** ** *** * * * *** ***** ********* * **** **
CHO-XIAP GTTTTGAGACAGAATACTATATTTGTGAATATAATTTTATGGCTTTTTTTCATTTAGTGG 6181
human-XIAP GTTTTGAGACAGAGTACTATATTTGTGAATATAATTTTATGG-TTTTTTTCACTTAG--- 8290
************* **************************** ********* ****
CHO-XIAP ATACCTTTCAGTATGGAGATCTATGAAAATTGCTTTCTGCGCTATAATCTGTCCTTTGTT 6241
human-XIAP -AACCTTTCTGTGTGGAAAACTAAGAAAATTGCTTTCTGCTGTATAATCTGGCATTCATT 8349
******* ** **** * *** **************** ********* * ** **
CHO-XIAP GTAGATTAAAGCTTATTTTTCTGTGAATAAGACTTAT-CAATAAAGCACTATTCTTTAAA 6300
human-XIAP GTAGATTAAAGCTTATTTTTCTGTGAATAAAACGTATTCAATAAAATACTATTCTTTAAA 8409
****************************** ** *** ******* *************
CHO-XIAP ----
human-XIAP ATTA 8413
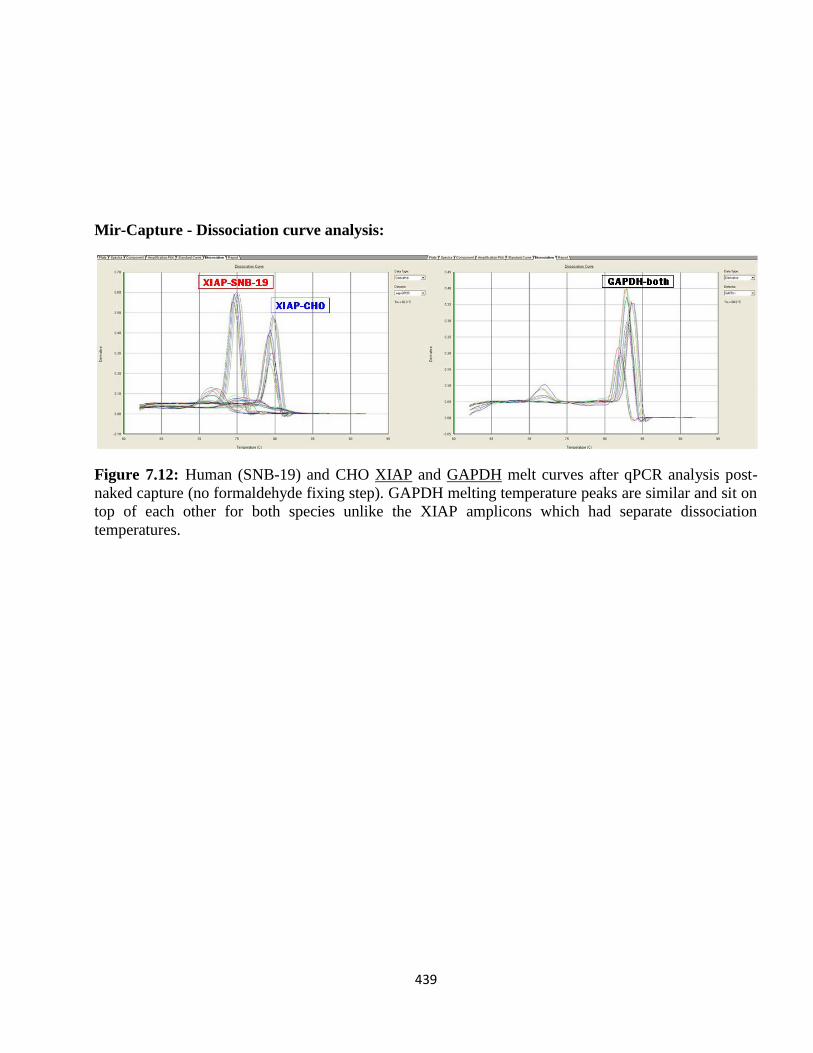
439
Mir-Capture - Dissociation curve analysis:
Figure 7.12: Human (SNB-19) and CHO XIAP and GAPDH melt curves after qPCR analysis post-
naked capture (no formaldehyde fixing step). GAPDH melting temperature peaks are similar and sit on
top of each other for both species unlike the XIAP amplicons which had separate dissociation
temperatures.

440
Figure 7.13: (A) Human (SNB-19 and CHO) XIAP melt curves after qPCR analysis post-full capture.
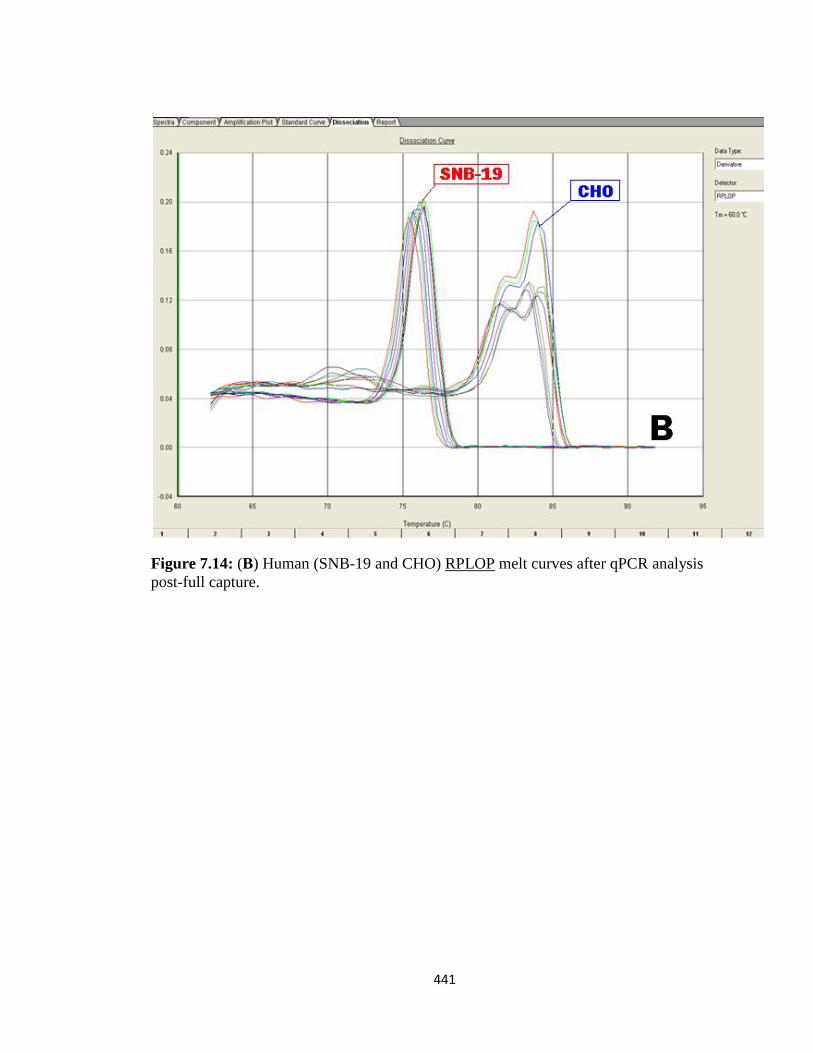
441
Figure 7.14: (B) Human (SNB-19 and CHO) RPLOP melt curves after qPCR analysis
post-full capture.