Embed Size (px)
Citation preview

AN INVESTIGATION OF GEOPOLYMERS FOR USE IN
HIGH TEMPERATURE APPLICATIONS
A THESIS
SUBMITTED TO THE FACULTY OF
THE UNIVERSITY OF MINNESOTA
BY
CASEY SUNDBERG
IN PARTIAL FULFILLMENT OF THE REQUIREMENTS
FOR THE DEGREE OF
MASTER OF SCIENCE
DR. MARY CHRISTIANSEN, DR. ANDREA SCHOKKER,
DR. BRIAN HINDERLITER,
AUGUST 2018

© 2017 Casey Sundberg

i
Table of Contents
List of Tables .................................................................................................................... vii
List of Figures ..................................................................................................................... x
Chapter 1: Introduction ....................................................................................................... 1
1.1 Motivation ................................................................................................................. 1
1.2 Project Goals ............................................................................................................. 4
1.3 Organization .............................................................................................................. 7
Chapter 2: Literature Review .............................................................................................. 8
2.1 Nuclear Power Plants .............................................................................................. 10
2.1.1 Mechanisms of a core meltdown ...................................................................... 12
2.1.2 Challenges in cooling a core meltdown ............................................................ 14
2.2 Ordinary Portland Cement ...................................................................................... 16
2.2.1 Cement chemist notation .................................................................................. 17
2.2.2 Portland cement production .............................................................................. 17
2.2.3 Portland cement hydration ................................................................................ 18
2.3 Effect of Elevated Temperature on Ordinary Portland Cement .............................. 21
2.4 Geopolymer Cement ............................................................................................... 24
2.4.1 Geopolymerization ........................................................................................... 26
2.5 Geopolymer Stoichiometry for High Temperature Applications ............................ 28

ii
2.5.1 Effect of precursor material on thermal performance ...................................... 28
2.5.1.1 Fly ash ........................................................................................................ 29
2.5.1.2 Metakaolin ................................................................................................. 31
2.5.1.3 Ground glass .............................................................................................. 33
2.5.2 Effect of activator solution and stoichiometry on thermal performance .......... 35
2.5.2.1 Activator types ........................................................................................... 35
2.5.2.2 Molar concentration ................................................................................... 36
2.5.2.3 Activator/precursor ratio ............................................................................ 36
2.5.2.4 Water/solids (w/s) ratio .............................................................................. 37
2.5.2.5 Silica/alumina (SiO�/Al�O�) ratio ............................................................. 37
2.5.2.6 Sodium/alumina (Na�O/Al�O�) ratio ........................................................ 38
2.5.2.7 Alumina content ......................................................................................... 39
2.6 Thermal Conductivity of Geopolymer Cement ....................................................... 40
2.6.1 Effects of thermal conductivity on materials under thermal loading ............... 40
2.6.2 Effect of aggregate material on thermal conductivity ...................................... 43
2.7 Effect of Elevated Temperatures on Geopolymer Cement ..................................... 44
2.7.1 Thermal loading conditions .............................................................................. 47
Chapter 3: Materials and Experimental Methods ............................................................. 48
3.1 Material Selection and Characterization ................................................................. 48

iii
3.1.1 Fly ash............................................................................................................... 48
3.1.2 Metakaolin ........................................................................................................ 49
3.1.3 Ground Waste Glass ......................................................................................... 51
3.1.4 Activator solution ............................................................................................. 53
3.1.5 Fine aggregate ................................................................................................... 55
3.1.6 Coarse aggregate ............................................................................................... 55
3.2 Mixture Design and Development .......................................................................... 55
3.2.1 Stoichiometry.................................................................................................... 56
3.2.2 Mixture proportioning and water content ......................................................... 57
3.2.3 Mixing procedure ............................................................................................. 58
3.2.4 Fresh properties ................................................................................................ 59
3.2.5 Mortar cube and cylinder preparation .............................................................. 60
3.2.6 Curing ............................................................................................................... 61
3.3 High Temperature Durability Testing ..................................................................... 61
3.3.1 Phase 1 thermal durability testing .................................................................... 63
3.3.2 Phase 2 thermal durability and hardness testing ............................................... 64
3.4 Thermal Transport Properties.................................................................................. 66
3.4.1 Thermal conductivity testing ............................................................................ 68
3.4.2 Molten metal testing ......................................................................................... 69

iv
Chapter 4: Results and Discussion .................................................................................... 71
4.1 Mixture Design ........................................................................................................ 71
4.1.1 Mixture naming convention.............................................................................. 71
4.1.2 Stoichiometric ratios ......................................................................................... 72
4.1.2.1 Sodium equivalent/alumina (Na�O(eq)/Al�O�) ratio ............................... 73
4.1.2.2 Water/solids (w/s) ratio .............................................................................. 73
4.1.2.3 Activator/precursor ratio ............................................................................ 74
4.1.2.4 Silica/alumina (SiO�/Al�O�) ratio ............................................................ 74
4.1.3 Fly ash-based mixtures ..................................................................................... 75
4.1.3.1 Baseline fly ash-based mixture .................................................................. 75
4.1.3.2 Variations of the baseline fly ash-based mixture ....................................... 76
4.1.4 Ground glass-based mixtures............................................................................ 79
4.1.4.1 Baseline ground glass-based mixture......................................................... 79
4.1.4.2 Variations of the baseline ground glass-based mixture ............................. 80
4.2 Phase 1 Compressive Strengths .............................................................................. 83
4.2.1 Phase 1 fly ash-based geopolymer compressive strengths ............................... 83
4.2.2 Phase 1 ground glass-based geopolymer compressive strengths...................... 85
4.2.3 Discussion of Phase 1 geopolymer compressive strengths .............................. 86
4.3 Phase 1 Thermal Durability Testing ....................................................................... 94

v
4.3.1 Phase 1 thermal durability testing at 600°C ..................................................... 94
4.3.2 Phase 1 thermal durability testing at 1100°C ................................................... 95
4.3.3 Discussion of Phase 1 high temperature durability tests ................................ 103
4.3.3.1 Fly ash-based geopolymer high temperature durability tests .................. 104
4.3.3.2 Ground glass-based geopolymer high temperature durability tests ......... 105
4.3.3.3 Mixtures selected for further study in Phase 2 ......................................... 107
4.4 Phase 2 High Temperature Thermal Durability Tests ........................................... 107
4.4.1 Impulse thermal loading tests ......................................................................... 107
4.4.1.1 OPC and CAC exposed to impulse thermal loading ................................ 109
4.4.1.2 Fly ash-based geopolymers exposed to impulse thermal loading ............ 110
4.4.1.3 Ground glass-based geopolymers exposed to impulse thermal loading .. 111
4.4.2 Quenching after impulse thermal loading ...................................................... 113
4.4.2.1 Quenching OPC and CAC after exposure to impulse thermal loading….127
4.4.2.2 Quenching fly ash-based mixtures after impulse thermal loading ........... 119
4.4.2.3 Quenching glass-based mixtures after impulse thermal loading ............. 120
4.4.2.4 Mass loss upon exposure to impulse thermal load ................................... 122
4.4.2.5 Residual thermal expansion upon exposure to impulse thermal loading . 123
4.4.2.6 Discussion of Phase 2 impulse thermal loading and quenching tests ...... 132
4.4.3 Ramped thermal loading tests......................................................................... 135

vi
4.4.3.1 OPC and CAC exposed to ramped thermal loading ................................ 136
4.4.3.2 Fly ash-based geopolymers exposed to ramped thermal loading ............ 138
4.4.3.3 Ground glass-based geopolymers exposed to ramped thermal loading ... 139
4.4.4 Phase 2 quenching after ramped thermal loading ........................................... 146
4.4.4.1 Quenching OPC and CAC after exposure to ramped thermal loading .... 146
4.4.4.2 Quenching fly ash-based mixtures after exposure to ramped loading ..... 148
4.4.4.3 Quenching glass-based mixtures after exposure to ramped loading ........ 149
4.4.4.4 Mass loss upon exposure to ramped thermal loading .............................. 151
4.4.4.5 Residual thermal expansion upon exposure to impulse thermal loading . 152
4.4.2.6 Discussion of Phase 2 ramped thermal loading and quenching tests....... 153
4.5 Thermal Conductivity Testing .............................................................................. 165
4.5.1 Thermal conductivity of Phase 2 mixtures ..................................................... 165
4.5.1.1 Discussion of thermal conductivities ....................................................... 167
4.5.2 Effect of taconite tailing coarse aggregate on thermal conductivity .............. 169
4.6 Molten Metal Testing ............................................................................................ 171
4.6.1 OPC exposed to molten metal ........................................................................ 171
4.6.2 Fly ash-based geopolymer exposed to molten metal ...................................... 173
4.6.3 Discussion of molten metal testing ................................................................. 174
4.7 Hardness Testing ................................................................................................... 175

vii
4.7.1 Hardness testing of impulse loaded OPC and CAC ....................................... 176
4.7.2 Hardness testing of impulse loaded ground glass-based mixtures ................. 177
4.7.3 Hardness testing of impulse loaded fly ash-based mixtures ........................... 180
4.7.4 Discussion of Rockwell superficial surface hardness tests ............................ 181
Chapter 5: Conclusions and Recommendations ............................................................. 182
5.1 Compressive Strength ........................................................................................... 182
5.2 High Temperature Durability Under Impulse Thermal Loading and Quenching . 184
5.3 High Temperature Durability Under Ramped Thermal Loading and Quenching 185
5.4 Thermal Conductivity, Molten Metal, and Surface Hardness Tests ..................... 187
5.5 Recommendations for Use in Future Applications ............................................... 188
5.5.1 Application as safety barriers in nuclear power plants ................................... 188
5.5.2 Application as protection against thermal damage in structural fires ............ 192
5.6 Recommendations for Future Research ................................................................ 193
References ....................................................................................................................... 195

viii
List of Tables
Table 1: Oxides with their common names and equivalent cement chemist notation ...... 17
Table 2: Chemical compositions of common geopolymer activators ............................... 36
Table 3: Chemical compositions of geopolymer precursors used in this study ................ 54
Table 4: Chemical compositions of geopolymer activators used in this study ................. 55
Table 5: Precursor and activator abbreviations and their common names ....................... 72
Table 6: Variations of fly ash-based mixtures .................................................................. 79
Table 7: Variations of ground glass-based mixtures......................................................... 83
Table 8: Compressive strengths of all Phase 1 geopolymer mortars at 28 days ............... 86
Table 9: Stoichiometric ratios of Phase 1 mixture designs ............................................... 89
Table 10: Compressive strengths of Phase 1 geopolymer mortars after exposure to 600°C
and quenching ................................................................................................................... 95
Table 11: Residual compressive strength after exposure to impulse thermal loading .... 109
Table 12: Residual compressive strength after exposure to impulse thermal loading and
quenching ........................................................................................................................ 118
Table 13: Change in residual compressive strength due to quenching after exposure to
impulse thermal loading and quenching ......................................................................... 122
Table 14:Residual compressive strength after exposure to ramped thermal loading ..... 136
Table 15: Residual compressive strength after exposure to ramped thermal loading and
quenching ........................................................................................................................ 146
Table 16: Change in residual compressive strength due to quenching after exposure to
ramped thermal loading and quenching .......................................................................... 151

ix
Table 17: Differences in thermal conductivity of tested mixtures from that of OPC ..... 166

x
List of Figures
Figure 1: Cross section diagram of a boiling water reactor (BWR) and a pressurized water
reactor (PWR) ................................................................................................................... 12
Figure 2: Forms of water present in hydrated portland cement ........................................ 21
Figure 3: Mortars made with different types of geopolymer cements .............................. 25
Figure 4: Geopolymerization process ............................................................................... 27
Figure 5: Core meltdown with PCC and with thermally conductive concrete ................. 42
Figure 6: SEM micrograph of fly ash particles at 1000x and 200x .................................. 49
Figure 7: SEM micrograph of metakaolin particles at a magnification of 1000x and 200x
........................................................................................................................................... 51
Figure 8: SEM micrograph of glass particles at a magnification of 1000x and 200x ..... 53
Figure 9: Nodules formed from an insufficient amount of water in the mixture .............. 58
Figure 10: The tabletop mixers used to mix geopolymers and the mixing area ............... 59
Figure 11: Flow test drop table and 2”x4” cylinders used for unit weight measurements 60
Figure 12: Vibratory consolidation table with a mold containing fresh geopolymer mortar
........................................................................................................................................... 61
Figure 13: Humboldt hydraulic ram used in compressive strength tests .......................... 62
Figure 14: Heated specimens in muffle furnace ............................................................... 64
Figure 15: Rockwell hardness tester with geopolymer mortar ......................................... 66
Figure 16: Thermal conductivity testing apparatus .......................................................... 67
Figure 17: IOTech PersonalDAQ 3001 data acquisition module and DaqView software.
........................................................................................................................................... 68

xi
Figure 18: Molten metal testing apparatus........................................................................ 70
Figure 19: Compressive strengths of all geopolymer mortars designed in Phase 1 ......... 90
Figure 20: Compressive strengths of fly ash-based geopolymer mortars designed in
Phase 1 .............................................................................................................................. 91
Figure 21:Compressive strengths of glass-based geopolymer mortars designed in Phase 1
........................................................................................................................................... 92
Figure 22: Compressive strengths of geopolymer mortars made with mixtures chosen for
Phase 2 .............................................................................................................................. 93
Figure 23: Compressive strengths of Phase 1 geopolymer mortars at room temperature at
28 days, after heating to 600°C, and after quenching ....................................................... 96
Figure 24: Compressive strength gains and losses after heating and quenching Phase 1
geopolymer mortars .......................................................................................................... 97
Figure 25: 100F(10N-1:1) after exposure to 1100°C ........................................................ 98
Figure 26: Surface condition and visible porosity of 100F(10N-1:1)............................... 98
Figure 27: 100F(10N-1:0) after exposure to 1100°C ........................................................ 99
Figure 28: Cracks visible on 100F(10N-1:0) after exposure to 1100°C ........................... 99
Figure 29: Surface conditions and visible porosity in 100F(10N-1:0) ........................... 100
Figure 30: 100GA(10N-1:1) after exposure to 1100°C .................................................. 100
Figure 31: Surface conditions and visible porosity in 100GA(10N-1:1) ........................ 101
Figure 32: 60F/40GA(10N-1:1) after exposure to 1100°C ............................................. 101
Figure 33: Surface conditions and visible porosity in 60F/40GA(10N-1:1) .................. 102
Figure 34: 60F/40GC(10N-1:1) after exposure to 1100°C ............................................. 102
Figure 35: Surface conditions and visible porosity in 40F/60GC(10N-1:1)................... 103

xii
Figure 36: Impulse thermal loading regimen for Phase 2 geopolymers ......................... 108
Figure 37: CAC and OPC upon exposure to impulse thermal loading at, from left to right,
to 300°C, 600°C, 900°C, and 1100°C ............................................................................. 110
Figure 38: 100F(10N-1:1) and 100F(10N-1:2) upon exposure to impulse thermal loading
at, from left to right, to 300°C, 600°C, 900°C, and 1100°C ........................................... 111
Figure 39: 50F/50GA(10N-1:2) upon exposure to impulse thermal loading at, from left to
right, to 300°C, 600°C, 900°C, and 1100°C ................................................................... 112
Figure 40: 100GA(10N-1:1) and 100GA(10N-1:2) upon exposure to impulse thermal
loading at, from left to right, 300°C, 600°C, 900°C, and 1100°C .................................. 113
Figure 41: Residual compressive strengths of all Phase 2 mixtures after exposure to
impulse thermal loading .................................................................................................. 114
Figure 42: Residual compressive strengths of OPC and CAC mixtures after exposure to
impulse thermal loading .................................................................................................. 115
Figure 43: Residual compressive strengths of Phase 2 fly ash-based mixtures after
exposure to impulse thermal loading .............................................................................. 116
Figure 44: Residual compressive strengths of Phase 2 ground glass-based mixtures after
exposure to impulse thermal loading .............................................................................. 117
Figure 45: OPC upon exposure to impulse thermal loading and quenching at, from left to
right, 300°C, 600°C, 900°C, and 1100°C ....................................................................... 118
Figure 46: : CAC upon exposure to impulse thermal loading and quenching at, from left
to right, 300°C, 600°C, 900°C, and 1100°C ................................................................... 119
Figure 47: 100F(10N-1:1) and 100F(10N-1:2) upon exposure to impulse thermal loading
and quenching, from left to right, 300°C, 600°C, 900°C, and 1100°C .......................... 120

xiii
Figure 48: 100GA(10N-1:1) and 100GA(10N-1:2) upon exposure to impulse thermal
loading and quenching at, from left to right, 300°C, 600°C, 900°C, and 1100°C ......... 121
Figure 49: 50F/50GA(10N-1:2) upon exposure to impulse thermal loading and quenching
at, from left to right, 300°C, 600°C, 900°C, and 1100°C .............................................. 122
Figure 50: Residual compressive strengths of all Phase 2 mixtures after exposure to
impulse thermal loading and quenching ......................................................................... 124
Figure 51: Residual compressive strengths of Phase 2 OPC and CAC mixtures after
exposure to impulse thermal loading and quenching ...................................................... 125
Figure 52: Residual compressive strengths of Phase 2 fly ash-based mixtures after
exposure to impulse thermal loading and quenching ...................................................... 126
Figure 53: Residual compressive strengths of Phase 2 ground glass-based mixtures after
exposure to impulse thermal loading and quenching ...................................................... 127
Figure 54: Weight percent mass loss of all Phase 2 mixture designs upon exposure to
impulse thermal loading .................................................................................................. 128
Figure 55: Residual thermal expansion of all Phase 2 mixture designs upon exposure to
impulse thermal loading .................................................................................................. 130
Figure 56: Residual thermal expansion of all Phase 2 mixture designs upon exposure to
impulse thermal loading and quenching ......................................................................... 131
Figure 57: Ramped thermal loading regimen for Phase 2 geopolymers ......................... 136
Figure 58: CAC and OPC upon exposure to impulse ramped loading at, from left to right,
to 300°C, 600°C, 900°C, and 1100°C ............................................................................. 137
Figure 59: 100F(10N-1:1) and 100F(10N-1:2) upon exposure to ramped thermal loading
at, from left to right, to 300°C, 600°C, 900°C, and 1100°C ........................................... 139

xiv
Figure 60: 50F/50GA(10N-1:2) upon exposure to ramped thermal loading at, from left to
right, to 300°C, 600°C, 900°C, and 1100°C ................................................................... 140
Figure 61: 50GA/50GB(10N-1:2) upon exposure to ramped thermal loading at, from left
to right, 300°C, 600°C, 900°C, and 1100°C ................................................................... 141
Figure 62: 100GA(10N-1:1) upon exposure to ramped thermal loading at, from left to
right, 600°C, 900°C, and 1100°C ................................................................................... 141
Figure 63: 100GA(10N-1:2) upon exposure to ramped thermal loading at, from left to
right, 300°C, 600°C, 900°C, and 1100°C ....................................................................... 141
Figure 64: Residual compressive strengths of all Phase 2 mixtures after exposure to
ramped thermal loading .................................................................................................. 142
Figure 65: Residual compressive strengths of OPC and CAC mixtures after exposure to
ramped thermal loading .................................................................................................. 143
Figure 66: Residual compressive strengths of Phase 2 fly ash-based mixtures after
exposure to ramped thermal loading ............................................................................... 144
Figure 67: Residual compressive strengths of Phase 2 ground glass-based mixtures after
exposure to ramped thermal loading ............................................................................... 145
Figure 68: OPC upon exposure to ramped thermal loading and quenching at, from left to
right, 300°C, 600°C, 900°C, and 1100°C ....................................................................... 147
Figure 69: CAC upon exposure to ramped thermal loading and quenching at, from left to
right, 300°C, 600°C, 900°C, and 1100°C ....................................................................... 148
Figure 70: 100F(10N-1:1) and 100F(10N-1:2) upon exposure to ramped thermal loading
and quenching, from left to right, 300°C, 600°C, 900°C, and 1100°C .......................... 149

xv
Figure 71:100GA(10N-1:1) and 100GA(10N-1:2) upon exposure to impulse loading and
quenching at, from left to right, 300°C, 600°C, 900°C, and 1100°C ............................ 150
Figure 72: 50GA/50GB(10N-1:2) upon exposure to impulse thermal loading and
quenching at, from left to right, 300°C, 600°C, 900°C, and 1100°C ............................ 151
Figure 73: Residual compressive strengths of all Phase 2 mixtures after exposure to
ramped thermal loading and quenching .......................................................................... 155
Figure 74: Residual compressive strengths of Phase 2 OPC and CAC mixtures after
exposure to ramped thermal loading and quenching ...................................................... 156
Figure 75: Residual compressive strengths of Phase 2 fly ash-based mixtures after
exposure to ramped thermal loading and quenching ...................................................... 157
Figure 76: Residual compressive strengths of Phase 2 ground glass-based mixtures after
exposure to ramped thermal loading and quenching ...................................................... 158
Figure 77: Mass loss of all Phase 2 mixture designs upon exposure to ramped thermal
loading............................................................................................................................. 159
Figure 78: Residual thermal expansion of all Phase 2 mixture designs upon exposure to
ramped thermal loading .................................................................................................. 160
Figure 79: Residual thermal expansion of all Phase 2 mixture designs upon exposure to
ramped thermal loading and quenching .......................................................................... 161
Figure 80: Thermal conductivity testing apparatus ........................................................ 165
Figure 81: Thermal gradient of OPC measured in 2" increments over six hours ........... 167
Figure 82: Thermal gradient of 100F(10N-1:1) measured in 2" increments over six hours
......................................................................................................................................... 168

xvi
Figure 83:Thermal gradient of 100F(10N-1:2) measured in 2" increments over six hours
......................................................................................................................................... 168
Figure 84: Thermal gradient of 50F/50GA(10N-1:1) measured in 2" increments over six
hours ................................................................................................................................ 169
Figure 85: Thermal gradient of OPC with gravel aggregate measured in 2" increments
over six hours .................................................................................................................. 170
Figure 86: Thermal gradient of OPC with taconite tailing aggregate measured in 2"
increments over six hours ............................................................................................... 170
Figure 87: Cross section of OPC specimen after exposure to molten aluminum ........... 172
Figure 88: Pieces of spalled OPC concrete immobilized in molten aluminum .............. 173
Figure 89: Top surface and cavity of OPC sample after exposure to molten metal ....... 173
Figure 90: Top surface and cavity of geopolymer specimen after exposure to molten
metal ................................................................................................................................ 174
Figure 91: Compressive strength of OPC and the adjusted hardness curve ................... 176
Figure 92: Compressive strength of CAC and the adjusted hardness curve ................... 177
Figure 93: Compressive strength of 100GA(10N-1:1) and the adjusted hardness curve 178
Figure 94: Compressive strength of 100GA(10N-1:2) and the adjusted hardness curve 179
Figure 95: Compressive strength of 50GB/50GA(10N-1:2) and adjusted hardness curve
......................................................................................................................................... 179
Figure 96: Compressive strength of 100F(10N-1:1) and the adjusted hardness curve ... 180
Figure 97: Compressive strength of 100F(10N-1:1) and the adjusted hardness curve ... 181
Figure 98: Current (left) and conceptual composite (right) barrier safety system .......... 191

1
Chapter 1: Introduction
1.1 Motivation
It is important that modern structures have reliable safety systems to guard against fires
and other situations in which high thermal loads are experienced. In highly sensitive
structures, such as nuclear power plants, it is imperative that the material comprising the
containment structure does not fail. The nuclear accidents at Fukushima and Chernobyl
demonstrate that current materials are not sufficient for extreme cases of thermal loading.
In such a case, a core meltdown at a nuclear power plant, the containment structure can
be exposed to temperatures in excess of 2800°C, far beyond the failure limit of
conventional concretes. Furthermore, this high temperature is applied almost
immediately, as the molten corium falls onto the basemat, causing an extreme thermal
shock loading condition locally. In most modern nuclear power plants, the structures
guarding against the release of nuclear material and gases in case of an accident are
primarily made of high strength reinforced portland cement concrete (PCC). Although
portland cement has beneficial thermal properties, it tends to disintegrate before reaching
the temperatures that exist during a nuclear core meltdown, allowing for a potential
breach in the structure designed to contain radioactive materials. There is a clear need for
an alternative binder with superior thermal properties to combat this problem.
Geopolymer cement concretes (GCC) offer a potential solution. They have advantageous
thermal properties and can be used as a binder in place of portland cement in concrete.

2
In order to maintain the structural integrity of PCC, water must be retained in its
microstructure. Additional free water is introduced to the bulk material during the
production and curing processes as well. Being a hydraulic material, it contains
chemically bound water, as well as interlayer and pore water. This causes problems in
extreme temperature conditions. Evaporation of water in the microstructure and internal
pressure buildup, due to the heating of water in closed pores, contributes to the
destruction of PCC at extreme temperatures. This water also can cause hydrogen gas to
build up in the containment structure through exothermic oxidation of the zircalloy
cladding, elevating the risk of an explosion, and can contribute to the release of fission
products through gaseous entrainment. The steam produced under the molten core melt
exacerbates zircalloy oxidation, leading to hydrogen gas production. Geopolymers do not
require water to maintain their structure, so they are much less susceptible to damage at
elevated temperatures and are less likely to contribute to hydrogen gas production than
PCC.
Geopolymers maintain their structural integrity well at high temperatures, partly due to
the nature of the materials used to produce them. The solid precursor materials normally
used in their production are extremely resistant to high temperatures. The precursor is
typically an aluminosilicate material composed largely of alumina (Al�O�) and silica
(SiO�). Alumina has a melting point of 2072°C and silica has a melting point of 1710°C.
Although heat treatment is required to produce some precursors, such as metakaolin, the
energy expenditure is significantly lower than that of portland cement production. Most
precursors, such as ground glass and fly ash, are recycled materials or unwanted

3
byproducts of production processes. The primary reason geopolymers are resilient at high
temperature is that their precursors do not react strongly with water or other chemicals
that are volatile at high temperatures. In many cases, the compressive strength of
geopolymers increases as the temperature increases. This is contrary to the compressive
strength properties of PCC, which almost always decreases to the point of failure as the
temperature increases. This is primarily the result of dehydration of structural water and
the boiling of pore water in PCC.
Thermal conductivity is a measure of how efficiently a material can transfer heat from
one point to another. The thermal conductivity of GCC can be modified more easily than
that of PCC. This is mainly due the wider array of materials that can be used to produce
geopolymers. If a higher thermal conductivity is desired in a geopolymer concrete,
materials with higher thermal conductivity, such as alumina, can be included in greater
proportions in the mixture design. If a low thermal conductivity is required, insulative
materials can be used as a precursor or aggregate. During a core meltdown at a nuclear
power plant it is beneficial to have concrete with a high thermal conductivity in strategic
locations, so the heat can travel freely away from the source of thermal energy. One way
to accomplish this in GCC or PCC is to include thermally conductive aggregate, like
taconite tailings. Taconite tailings are a byproduct of iron mining and are a waste material
that is difficult to dispose of. They have a high thermal conductivity relative to
conventional aggregates due to the iron content in the material. Considering that
aggregate often comprises the majority of bulk concrete, using an aggregate with high
thermal conductivity is significantly beneficial.

4
Using geopolymer materials and increasing thermal conductivity may also be beneficial
in the case of a structural fire. By increasing resiliency to high temperatures, they allow
additional time to identify a fire and to evacuate dangerous areas before structural failure
occurs or may prevent failure altogether. This is extremely important in minimizing
casualties from a fire, whether it is in a concrete skyscraper or a large transportation
structure, like the I-85 bridge that collapsed in Atlanta, Georgia in 2017 due to thermal
loading.
As an added benefit, geopolymers often require less energy to produce than portland
cement, since they are primarily composed of waste materials, such as fly ash (FA),
granulated blast furnace slag (GBFS), metakaolin (MK), silica fume (SF), or ground
glass. Geopolymer binders eliminate the need for portland cement in concrete production
as they can replace portland cement directly, one-to-one, in concrete. Although some of
these materials can be used as pozzolans in PCC, the proportions are much smaller than
that of GCC, which is generally composed solely of these materials mixed with an
activator.
1.2 Project Goals
The primary goal of this research was to investigate the thermal and mechanical
properties of several types of geopolymer concretes at high temperatures to determine
which materials are most resistant to thermal loading. Specifically, this research sought to
answer the following questions:

5
1. Can geopolymer concrete be used to improve a structure’s durability under
extreme thermal loading conditions, such as those present during a structural fire
or at a nuclear power plant during a core meltdown?
2. Which types of materials are beneficial to the performance of geopolymer
concrete at elevated temperatures?
3. Can the thermal properties of geopolymer concrete be improved by using
thermally conductive or otherwise beneficial materials in the mixture design?
These questions were answered through careful research and experimentation. The initial
step in this research was a thorough review of the available literature pertaining to this
study. This included a review of studies regarding the thermal and mechanical properties
of geopolymers at high temperatures, the effects of high temperatures on the
microstructure and phase composition of geopolymers, the effects of chemical
composition on durability at high temperatures, and other relevant subjects, which are
presented in Chapter 2. Through the literature review, the most suitable types of
geopolymers capable of withstanding high heat were selected to be tested. It also
informed the development of new geopolymer mixtures, some of which have never been
studied at high temperatures. A calcium aluminate cement (CAC) and an original
portland cement (OPC) binder were included in the tests for comparison to the status quo.
In the initial trials, 2”x 2” test cubes of all binder mixtures were produced and tested for
compressive strength. The binders that maintained a compressive strength of at least 1500
psi after 28 days were then selected for further testing. Testing throughout the study was
divided into Phases 1, 2, and 3, which are mentioned briefly:

6
• Phase 1: Performance Based Design Selection – Mixture designs were produced
based on previous research and a thorough review of the literature. Specimens
created from these mixture designs were exposed to temperatures of 600°C and
1100°C. Four specimens of each mixture design were exposed to thermal shock
loading by immediate exposure to these temperatures and two of the specimens
were additionally exposed to quenching in water. The compressive strengths of all
specimens were measured, and the mixture designs with the best performance
were selected for further study in Phase 2.
• Phase 2: Analysis of High Temperature Behavior – Specimens were created with
the binders selected in Phase 1 and were heated up to 1100°C in 300°C
increments. At each increment, the steps outlined in Phase 1 were performed.
Specimens were subjected to both impulse and ramped thermal loading. In
addition, Rockwell hardness tests were carried out on the surface of heated
specimens. These tests were carried out on mortars comprised of the selected
binders mixed with silica sand fine aggregate.
• Phase 3: Thermal Conductivity Testing – Thermal conductivity tests were
performed on specimens from Phase 2. For each relevant mixture, the thermal
conductivity was measured at 125°C. These tests were carried out on both mortars
and concrete containing taconite tailings or gravel. Additionally, molten
aluminum was poured onto a GCC specimen and a PPC specimen and the effects
were observed.

7
These phases were not all carried out in a specific order, as they are not all dependent
upon one another. Phases 2 and 3 were often performed concurrently, while Phases 1 and
2 were carried out consecutively.
1.3 Organization
This thesis is presented in 5 chapters. Chapter 2 contains a thorough review of relevant
literature and basic knowledge required to understand the material and its applications.
Chapter 3 covers the selection of materials and mixture designs. This includes all
procedures and experiments carried out, as well as the equipment used. Chapter 4
presents the 3 phases of experimentation and discusses their results. Chapter 5
summarizes the research and offers conclusions and recommendations for future
research. An introduction is included before each chapter to aid the reader.

8
Chapter 2: Literature Review
This chapter provides an explanation of all the necessary information and rationale
behind the research. The literature review is presented in seven sections. These sections
are:
• 2.1 Nuclear power plants.
Explains how a nuclear power plant works and covers the basic safety systems
currently in use in U.S. Generation 3 nuclear reactors.
• 2.2 Ordinary portland cement.
Covers the production process and raw materials required to produce ordinary
Portland cement, as well as the hydration process.
• 2.3 Effect of elevated temperatures on ordinary portland cement.
Describes the dehydration process and the effects of elevated temperatures on the
microstructure and composition of ordinary portland cement.
• 2.4 Geopolymer cement.
Offers an overview of geopolymer cement production, along with a description of
the mechanics of its formation.

9
• 2.5 Geopolymer Stoichiometry for High Temperature Applications.
Discusses the effects of precursor material, activator solution, and aggregate on
the thermal properties of geopolymer cement. Characterizes the effects of high
temperatures on geopolymer cement.
• 2.6 Thermal conductivity of geopolymer cements.
Provides information pertaining to the thermal conductivity of geopolymer
cements and concretes. Includes the effects of aggregate type on thermal
conductivity.
• 2.7 Effect of elevated temperatures on geopolymer cement.
Presents the effects of elevated temperatures on the microstructural properties
and chemical composition of geopolymer concretes.

10
2.1 Nuclear Power Plants
Currently, there are 99 nuclear power plants in the United States that generate almost 20
percent of the nation’s electricity while emitting no carbon dioxide or controlled
pollutants [1]. With many of these plants aging and nearing the end of their life cycle,
new Generation IV reactors are being developed to replace and supplement them. Six
new reactor technologies are being developed internationally and are slated for
deployment between 2020 and 2030 [2]. Since these new reactors will operate at higher
temperatures than current reactors, it is more crucial now than ever that these new
reactors have effective safety barriers. In addition, as existing reactors are being
relicensed for another 20-40 years, improved materials that can be retrofit into existing
plants are needed to improve the outcome in the unlikely event of a severe accident.
A nuclear power plant produces power in much the same way as any other thermal power
plant. The primary difference between nuclear power plants and other thermal power
plants is the source of the thermal energy. In a nuclear power plant, the thermal energy
comes from the fission of uranium, typically U-238, rather than the combustion of coal or
natural gas, as it would in a traditional fossil fuel power plant. In addition to a large
increase in energy density, using uranium fuel instead of fossil fuels has the added benefit
of producing no carbon dioxide or controlled pollution emissions.
The rest of the power generation system at the plant works the same as in a traditional
Rankine cycle power plant; thermal energy is carried by water in a closed loop to produce
electricity. The water is heated and converts to steam, which drives a steam turbine. The

11
steam turbine is connected to an electric generator by a drive shaft, so electricity is
produced as the turbine is driven. The steam then passes through a condenser, where it is
converted back into water and the cycle starts over again. There are different types of
nuclear power plants, such as a pressurized water reactor (PWR) and a boiling water
reactor (BWR), but they predominantly work on the same principle with variations that
are insignificant in this context.
The heart of a nuclear power plant is the core. It consists of long vertical fuel rods, which
are surrounded by water that is continually pumped through the core. This water serves as
both a coolant and a means of thermal energy transfer. The fuel rods produce heat by
nuclear fission, or the splitting of atoms, particularly uranium. The rate of fission is
controlled by rods, called control rods, which are inserted between the fuel rods. These
control rods absorb neutrons, preventing them from reaching nearby fuel rods and
creating further fission reactions. The control rods are inserted or withdrawn to varying
degrees, depending on the level of power production desired. They can be fully inserted
to stop the reaction and shut down the reactor. However, this must be done properly to be
effective.
Three protective layers surround the core and its cooling water. First, they are contained
inside a steel structure called the pressure vessel (PV). Next, the pressure vessel is housed
inside the primary containment vessel, which is an enclosed structure made of concrete
and lined with steel. This is intended to catch the molten corium in the case of a severe
core meltdown, where it has melted through the pressure vessel. The third layer, the
containment structure, completely encloses the primary containment vessel and all of the

12
components that come into contact with radioactive material. This structure is typically
cylindrical with a domed or flat roof and is meant to contain all radioactive material and
gasses if the primary containment vessel is breached or there is an explosion near the
core. An illustration of these protective layers in a BWR and a PWR power plant is
shown in Figure 1.
Figure 1: Cross section diagram of a boiling water reactor (BWR) similar to those present
at Fukushima (left) [45]. Cross section diagram of a pressurized water reactor (PWR)
[49]. Both contain wet/drywells in which corium can be captured.
2.1.1 Mechanisms of a core meltdown.
A nuclear core meltdown happens when the heat produced by a nuclear reactor exceeds
the heat being removed. This is typically caused by a loss of coolant, loss of coolant flow,
or loss of coolant pressure. This, in turn, causes the uncooled fuel rods to heat themselves
and other core elements beyond their melting point, resulting in a core meltdown. It can

13
also be caused by a sudden unexpected power spike, a fire near the core, or a failure of
equipment, although these events are less likely causes. For a complete core meltdown to
occur, the primary failure must also be accompanied by a failure of backup systems. This
is rare but possible, as demonstrated by the accident at Fukushima.
The first layer of defense against the release of radioactive material during a core
meltdown is the zirconium alloy cladding that makes up the outer layer of the fuel rods
and houses the nuclear fuel. Zirconium melts at 1852˚C [3], so it may be necessary for
the core to exceed this temperature for a complete core meltdown to occur. If the fuel
rods are not cooled sufficiently they rise above this temperature, causing the cladding to
melt, releasing the fuel that is inside of them. The uranium dioxide fuel may contribute to
further core material heating, to temperatures in excess of 2805°C, which is the reported
disintegration temperature of uranium dioxide [4]. The concrete basemat below the core
may be exposed to temperatures of this magnitude if the corium reaches the containment
structure.
The fuel may be released into the core at even lower temperatures, depending on the
length of time over which excessive heating occurs. If there is ample time for heat to
diffuse through the cladding in sufficient quantities to cause the fuel to expand
significantly, it may cause the cladding to burst at a lower temperature than its melting
point. This problem is largely mitigated in newer reactors, but still may pose a threat in
older reactors that do not provide sufficient room for expansion in their fuel rods.

14
As the core material melts, it forms a molten mass of corium at the bottom of the pressure
vessel. If the corium is hot enough, it melts through the wall of the pressure vessel and
falls into the primary containment vessel. If it is not cooled sufficiently at that point, it
continues to melt through the primary containment vessel and falls onto the concrete pad
at the base of the containment structure. Typically, there is a drywell, wetwell, or similar
structure, to catch the corium as it falls onto the basemat. Upon reaching the basemat, the
corium begins to erode the sacrificial concrete, which may lead to an eventual breach of
the containment structure. This type of breach may occur if the corium erodes all of the
sacrificial concrete or if large cracks are formed due to a temperature gradient or loss of
binding strength in the material. Fracture, or cracking, poses a significant risk in this
situation if a brittle material, such as PCC, is the sole material used in the basemat, even
if ductile steel reinforcement is present. The difference in thermal expansion between the
steel reinforcement and the concrete can also contribute to spalling and cracking upon
heating. It is crucial that this basemat is made of a material that is resistant to high
temperatures, and of a sufficient depth. Any breach of the structure at this location would
lead to the release of radioactive material and potentially contaminate the groundwater
below the structure and the atmosphere around it.
2.1.2 Challenges in cooling a core meltdown.
Even though the most severe accidents are usually a result of a failure of the backup
safety systems, a core meltdown can be difficult to control even with a functioning
backup system. If sufficient supplies of standby water are available, water can be
introduced to the core in an attempt to cool the corium, but the corium-water interaction

15
is a very complex phenomenon and will only slow or halt the reaction under certain
conditions [5]. On the contrary, introducing water to the corium may increase hydrogen
production, leading to the further release of fission products and increasing the chance of
a hydrogen gas explosion. Water vapor lost during the dehydration of portland cement
may also further agitate the corium, leading to an increase in heat production through
exothermic oxidation of zirconium.
Fuel-coolant interactions (FCIs) can produce conditions that are even more dangerous
than those produced by the initial core meltdown and should be handled with extreme
care. For example, if there is water in the reactor pit prior to the release of corium from
the primary containment vessel, it can lead to an FCI, followed by an even more violent
steam explosion. This would create projectiles and a pressure spike that could lead to a
breach in the containment structure. The extreme temperatures and dangerous effects of
FCIs are two of the primary reasons why it is difficult to cool a core meltdown in its
initial phases using water. Although some modern plants incorporate measures such as
hydrogen igniters and recombiners, these require backup power or are vulnerable being
blocked and breached. Therefore, it is extremely important to have reliable physical
barriers that are completely passive, can withstand high temperatures, and can contribute
to the cooling process by moving heat away from the molten mass of corium.
After a period of time in which the temperature has decreased sufficiently, water can be
used to cool the corium if it has not been introduced prior. Typically, this is carried out
by flooding the drywell and base of the containment structure with any available water.
This is problematic with portland cement concrete, since introducing water to the process

16
leads to the rehydration of CaO and other products formed during the dehydration of the
concrete. This results in a significant volume expansion and further degradation of the
portland cement binder [6]. The cooling process continues for many years as the corium
continues to produce low amounts of decay heat. During this time, the cooling water can
diffuse through the affected concrete and reach large volumes of dehydrated CaO,
causing significant expansion damage to the concrete beyond what has been caused by
thermal loading. This same problem arises, to a lesser extent, when water is used to
extinguish a fire in a concrete structure. The problem can be mitigated by using a material
that does not rely on hydration to maintain its integrity, such as a geopolymer.
2.2 Ordinary Portland Cement
Currently, 4.2 billion tons of masonry and portland cement are produced on a yearly basis
worldwide. The clear majority (97% in the U.S.) is portland cement [7]. Portland cement
is the primary binder in most concrete used in modern construction. Unfortunately, a
significant amount of CO� is emitted in its production, an issue not present in geopolymer
binders. Concrete is typically composed of a binder, fine aggregate, and coarse aggregate.
The aggregate typically provides a large portion of the compressive strength and is
composed of particulate material such as sand, gravel, and crushed rock, coarse and fine
denoting the size. The primary function of portland cement (PC) binder in PCC is to hold
the aggregate together and provide additional compressive strength to support the
structure.

17
2.2.1 Cement chemist notation.
Cement chemistry has a unique nomenclature denoting chemical oxides commonly
encountered. Cement chemist notation for common oxides is shown in Table 1. This
notation can be used interchangeably in cement chemistry.
Oxide Common Names Cement Chemist Notation
CaO Lime, Calcium Oxide, Calcia C
SiO2 Silica, Silicon Oxide S
Al2O3 Alumina, Aluminum Oxide A
Fe2O3 Ferric Oxide, Iron Oxide F
MgO Magnesia, Periclase M
K2O Potassium Oxide K
Na2O Sodium Oxide N
SO3 Sulfur Trioxide S�
CO2 Carbon Dioxide C�
H2O Water H
Table 1: Oxides with their common names and equivalent cement chemist notation.
2.2.2 Portland cement production.
The production of portland cement begins with the extraction of raw materials. These
materials are primarily composed of calcium and silica, the main components of portland
cement, as well as iron and alumina, which are used as fluxing agents. Limestone, clay,
marl, shale, sand, and iron ore are all examples of raw materials that are commonly used.
After they are extracted, these materials are proportioned and ground into a fine powder.
They are then thoroughly blended and sent to a rotary kiln to be made into clinker.
Clinker is composed of small nodules of calcium silicate material that are formed when
the raw materials are heated in a rotary kiln. It is produced through the process of
calcination. During calcination, the raw materials are heated up to approximately 1450°C.

18
This drives off the free water and excess CO� and causes the raw materials to fuse
together, forming clinker.
Prior to completing calcination in the rotary kiln, the raw material is sent through a
preheater and a flash furnace where it is pre-calcined up to 85-95% using exhaust heat.
Even with the reuse of exhaust heat the calcination process is energy intensive and
releases a large amount of CO�. It is estimated that portland cement production accounts
for 5-8% of all anthropogenic CO� emissions worldwide [8].
After exiting the rotary kiln, the clinker is cooled and then mixed with ground gypsum to
prevent flash setting. It is then sent through a final grinding process, resulting a fine gray
powder known as portland cement. This powder must then be mixed with water to create
the portland cement binder that is used in concrete.
The typical composition of ordinary portland cement, by weight, is approximately 55%
C3S (alite), 18% C2S (belite), 10% C3A (aluminate), 8% C4AF (ferrite), and 6% CS�H2.
M, N, and K are common impurities. Although these proportions are typical,
compositions vary according to cement type. Specifications and compositions of various
cement types are outlined in ASTM C150 Standard Specification for Portland Cement.
2.2.3 Portland cement hydration.
Hardened portland cement is formed through the process of hydration. The primary
reaction products formed are calcium silicate hydrates (C-S-H) and calcium hydroxide
(CH). CH is less desirable than C-S-H because it has a weaker structure. In addition,

19
ettringite (AF�) and monosulfate (AF�) form, which are not desirable due to their
expansive properties and weak crystal structure.
There are five stages in the hydration process. In stage 1, sulfates in the gypsum dissolve
immediately in water, producing an alkaline, sulfate-rich solution. A calcium-aluminate-
sulfate-hydrate (CAS�H) gel forms around the C3A particles. A small portion of C3A
reacts with sulfate ions in solution, leading to the precipitation of ettringite and, to a
lesser extent, monosulfate crystals. There is also dissolution of calcium, silica, and
hydroxide ions into solution, and C3S begins initial hydrolysis. As more ettringite
crystals form on the surface of C3S, there is less surface area to react with and the rate of
hydrolysis slows.
Stage 2 is the dormancy period. This is a period of relatively low reaction, which allows
for the material to be transported and placed. During this period, the concentration of
calcium and hydroxyl ions continues to increase and the hydration of C3S continues. This
period lasts until most of the sulfate in solution has reacted. The end of this period marks
initial set.
In stage 3, the concentration of calcium and hydroxyl ions reaches its critical value and
CH crystallizes into solution. As the reactive sulfate concentration decreases, ettringite
crystals become unstable and break down, exposing the surface of C3S particles. This
allows C-S-H to form on these surfaces. There are two forms of C-S-H that form, outer
product and inner product. Outer product forms outward from the surface of the C3S,

20
while inner product forms inward from the surface of the particle. The end of this period
determines final set.
In stage 4, hydration begins to slow. As more C-S-H forms on the surface of C3S, the rate
of reaction begins to decrease. This is because the C-S-H forms a shell around the C3S
particle, and any further hydration must include diffusion through this barrier. This
causes the number of hydration reactions to decrease and the time required per reaction to
increase. In stage 5, hydration has essentially reached 100% and the cement is at steady
state, although a low degree of hydration continues to occur.
Hydration of C2S is similar to that of C3S but occurs at a much slower rate. It is less
reactive, beginning hydration after approximately one week. Likewise, C4AF reacts
similarly to C3A but at a slower rate due to its iron content.
It is clear that hydration is essential to the formation PC. Hydration can only be achieved
through the addition of water. This leads to the inclusion of water in the structure of
finished portland cement. This water can be classified into five categories:
1. Chemically combined water: Water that is a chemical part of the structure of the
hydration product.
2. Interlayer water: Water that lies between layers of C-S-H.
3. Physically adsorbed water: Water held close to the solid surface by hydrogen
bonds.
4. Capillary water: Water held in small capillaries by capillary tension.
5. Free water: Water trapped in large voids.

21
Interlayer, capillary, physically adsorbed, and free water may stay in the structure in the
form of vapor or liquid water or they may leave behind pores and voids as they react with
unhydrated product. Forms of water present in the microstructure are illustrated in Figure
2.
Figure 2: Forms of water present in hydrated portland cement. [46]
This water contributes to the favorable thermal properties of PCC at moderately high
temperatures but is problematic at extremely high temperatures, when concrete begins to
dehydrate. In addition, this water ensures that one of the key elements of a corrosion
reaction is present, increasing the risk of damage to reinforcement steel, wiring, and other
metal components.
2.3 Effect of Elevated Temperature on Ordinary Portland Cement
Although portland cement has favorable thermal properties under normal operating
conditions, when severe thermal loading occurs it often experiences failure because of the
water inherent in its microstructure. Since water boils at 100˚C, extremely high
temperatures cause it to evaporate and expand. The expansion of water vapor causes the

22
pressure to rise in capillaries and voids. This creates an internal force, which is exerted
outward on the internal structure, often resulting in cracking and spalling. The result is a
loss of integrity and often complete failure, especially at extreme temperatures.
The water in the structure of the C-S-H, CH, and other hydration products is lost at
extreme temperatures. This happens at temperatures in excess of 100˚C since additional
energy is needed to break the chemical bonds. The dehydration of the hydration products
leads to complete failure of the material.
Under extreme thermal loading hydration products, such as C-S-H, dehydrate by the
following process [9]:
(���)�����(���)���� !"# (���)�����(���)�$% + ' ∗ ���)�*+,
Similarly, CH dehydrates by the following process [9]:
��(��)���� !"# ��� + ���)�*+,
When this happens, PC loses most of its binding strength.
Several authors have described the reactions that occur as Portland concrete is thermally
loaded. Due to the complexity of the reactions and time dependence, there is some
disagreement over specific points. The evolution of phases as temperature increases is
briefly described in general terms using the published literature as follows:
• 100˚C – While heating up to 100˚C, there is a loss of free water from the pores of
the cement, causing an increase in the precipitation of portlandite (��(��)�) and

23
calcite (�����). Ettringite decomposes, releasing Ca2+
, which further enables
these reactions [9-11]. Additionally, chemically bound water in C-S-H begins
separating and C-S-H begins to decompose [11-13].
• 200˚C – A new anhydrous nesosilicate phase forms to replace the portion of C-S-
H that decomposes [11,14]. C-S-H and carboaluminate hydrates continue to
decompose as they dehydrate [12]. Concentrations of larnite (C2S, or belite) and
calcite increase [11].
• 300˚C – The morphology shows deformed portlandite crystals, voids, and the
transformation of portlandite into calcite [15]. Portions of C-S-H gel are still
present.
• 400˚C – C-S-H decomposition contributes to the continued increase in calcite and
larnite [10,12]. C-S-H is largely decomposed.
• 500˚C – The initial C-S-H gel has disappeared [10-11]. Portlandite and calcite
decompose into lime [10,12]. Portlandite disappears completely, being
transformed into lime [13-14]. Microcracks and voids become more prevalent due
to the increased porosity and the dehydration of hydration products.
• 600˚C – β-C2S and quartz concentrations increase [14]. Calcite concentrations
continue to decrease [11].
• 700˚C – Most of the calcite decomposes into lime. Large amounts of lime are
present from the decomposition of calcite and portlandite [11-12].
• 800˚C – Calcite disappears completely, being transformed into lime. Quartz and
β-C2S are still present. A new α′-C2S phase is formed by the transformation of a

24
portion of the β-C2S phase [12,13]. Concrete is usually crumbled at this point
[12].
• 900˚C – Similar hydration phases are present to those at 800 ˚C [13]. There may
be a generation of new phases due to the extremely high temperatures [13].
• 1100˚C – Feldspars and other minerals of the cement paste melt and form a glass
phase [12-13].
• 1200˚C – All concrete has completely decomposed at this point [13].
It is apparent that large amounts of CaO are produced during the dehydration process.
When water is used to extinguish a fire or cool concrete after extreme thermal loading, an
expansive reaction occurs, which leads to cracking and crumbling of the concrete. This is,
in part, due to the transformation of CaO to Ca(OH)� through hydration [13].
The problems associated with the dehydration and rehydration of calcium in concrete are
not as prevalent in a geopolymer, as the calcium content can be significantly reduced or
eliminated. This results in a material that is more robust under thermal loading.
2.4 Geopolymer Cement
The term “geopolymer” was first introduced by Dr. Joseph Davidovits in 1979 to
describe the amorphous aluminosilicate material he created by transforming kaolinite into
hydrosodalite [16]. Since then, the study of geopolymers has expanded significantly.
Today, researchers across the globe are exploring the mechanical, chemical, and thermal
properties of different types of geopolymer binders.

25
Figure 3: Mortars made with different types of geopolymer cements.
Geopolymers are made of two primary constituents, a powder precursor and a liquid
activator. The precursor is a material typically high in silica and alumina content with an
amorphous microstructure. The most commonly used precursors are fly ash, metakaolin,
and ground granulated blast furnace slag, but additives such as silica fume and rice hull
ash are also used to adjust the chemical composition [17]. Ground glass is another
precursor material that has been researched in recent years and shows great potential. The
activator is a highly-alkaline solution typically composed of sodium hydroxide and
sodium silicate, but other activators, such as potassium hydroxide, potassium silicate,
calcium hydroxide, and calcium carbonate can be used as well [18]. Sodium aluminate is
rarely used. The precursor and activator are combined to form a synthetic alkali
aluminosilicate material known as a geopolymer. Water can also be added to the mixture
if the desired workability properties are not obtained by mixing the precursor and
activator.

26
It has been established that geopolymers have excellent thermal properties if designed
properly. This is partially due to the fact that water is not necessary to maintain their
structure. Water is often used to increase workability, but this water is not chemically
bonded and can be evaporated out of the structure. In addition, geopolymers have a wider
range of ingredient options, meaning they can be customized to include materials with
beneficial thermal, and other, properties more readily than portland cement. Although
many of the precursor materials used in geopolymers can be used as pozzolans in PPC,
the proportions and the thermal effects that come with them will always be limited by the
OPC in the mixture. This is not true of geopolymers, as they can be composed entirely of
materials or mixtures of materials engineered to specific thermal applications, since the
geopolymerization reaction does not have the same requirements as a pozzolanic
reaction.
2.4.1 Geopolymerization.
Geopolymers are an example of what is more widely known as an “inorganic polymer”.
They are synthesized through polycondensation reactions in a process known as
“geopolymerization”. This process is described in a linear fashion for the sake of
simplicity, although many of the processes are coupled or occur concurrently [19].
When a precursor is mixed with an activator, alkaline hydrolysis takes place and there is
dissolution of aluminosilicates into the alkaline solution. This results in an aqueous phase
composed largely of aluminate and silicate species. Due to the high pH in the alkali
solution and the addition of heat to the system, dissolution of aluminosilicates is rapid

27
and a supersaturated aluminosilicate solution is formed. A series of rapid
polycondensation reactions occur, which results in the formation of a gel. During this
process, the water that was consumed by hydrolysis during dissolution is released. This
water is captured in the pores of the gel. As the system continues to reorganize, the
connectivity of the gel structure increases. This results in the formation of a three-
dimensional aluminosilicate network primarily composed of silica and reactive alumina.
Water is continually driven off as polymerization and crystallization continues, resulting
in a solid microstructure that constitutes the macrostructure of the hardened geopolymer.
This reaction is illustrated in Figure 4.
Figure 4: Geopolymerization process. [47]
This process can be described on a molecular level in an analogous manner. In a sodium
hydroxide activator Na1 and OH$ ions are in solution with H�O (water). Most
aluminosilicate precursors contain covalently bonded Al1� and Si12. As the precursor is
introduced into the solution, the Si12 ions attract OH$ ions. When the attraction of these
hydroxyl ions is enough to pull the Si away from the aluminosilicate, a tetrahedrally

28
coordinated silicate is formed in solution (Si(OH)2). Similarly, the Al1� combines with
OH$ ions and is dissolved into solution, forming reactive alumina with a tetrahedral
structure.
When supersaturation is reached, the OH$ ions in the alumina molecules begin to
combine with the OH$ ions in the silica molecules through condensation reactions,
forming polymer chains. This process results in chains of Al and Si atoms connected by
oxygen bridges to form a gel, as well as excess water molecules. This excess water is
driven away as more connections are made and the network of polymer chains condenses.
The Na1 ions in solution are attracted to the polymer network by the negative charge of
the resultant aluminosilicates. As connectivity of the network continues to increase, the
gel forms a three-dimensional nanocrystalline structure. The Na1 ions are included in the
matrix to maintain chemical stability. The resulting binder is a geopolymer, which can be
used in place of portland cement in a concrete mix.
2.5 Geopolymer Stoichiometry for High Temperature Applications
Several variables can be changed to affect how geopolymers react at high temperatures.
These include precursor material, activator solution, and aggregate. They often have an
effect on both the physical characteristics and the thermal transport properties at high
temperatures.
2.5.1 Effect of precursor material on thermal performance.
As previously mentioned, the precursor is the main constituent in a geopolymer. It is
typically a material with a high silica and alumina content and a reactive amorphous

29
microstructure. When combined with an alkaline activator, the amorphous components
react, creating the aluminosilicate structure of the geopolymer. The most commonly used
precursors are fly ash (FA), metakaolin (MK), and ground blast furnace slag (GBS), but
additives such as silica fume and rice hull ash are also used to adjust the chemical
composition. Ground glass is another material that has come into greater prominence in
recent years. These materials are chosen, not only for their chemical properties, but also
because they are byproducts, recycled waste, or require less energy to produce. Ground
blast furnace slag is not suitable for high temperature applications because it has a high
calcium content (30-50%), making it a largely hydraulic cement. Class C fly ash is
typically not used for the same reason, as is discussed in the following section.
2.5.1.1 Fly ash.
The most common precursor used in geopolymers in high temperature applications is fly
ash. Fly ash is a byproduct of coal combustion energy production. When coal is burned, a
very fine ash is driven out of the boiler with the flue gasses. This fly ash is collected in a
filtration system before it can reach the chimney. Fly ash particles are generally spherical
and range in size from 10-15 µm. Because they cool rapidly after leaving the boiler, they
are largely amorphous, which improves the degree of reaction and is conducive to
geopolymer formation. The spherical structure facilitates superior workability in
comparison to most precursors, as there are no rough edges to impede the movement of
the particles. This means there are no practical limits on the amount of fly ash that can be
used. A properly designed geopolymer with a 100% fly ash precursor can be placed
without difficulty. This is not true of all precursor materials.

30
Depending on the source of the coal fuel and the efficiency of the power plant that burns
it, the chemical composition of the fly ash can vary, but in general it is composed of SiO�,
Al�O�, Fe�O�, and CaO, along with other minor constituents. It normally contains some
amount of unburned carbon due to inefficiencies inherent in power plants but is generally
not used unless this amount is very low. ASTM C618 “Standard Specification for Coal
Fly Ash and Raw or Calcined Natural Pozzolan for Use in Concrete” limits unburned
carbon content, or loss on ignition (LOI), to 6%, although many customers require limits
even lower than this. LOI can be problematic when using admixtures, such as air
entrainers.
Fly ash is divided into two categories Class C and Class F. According to ASTM C618,
the summation of SiO�, Al�O�, and Fe�O� must equal 70% of the total composition to be
considered Class F fly ash and 50% to be considered Class C fly ash. This means that
Class C fly ash generally has a high calcium content, while the calcium content of Class
F fly ash is generally low. A low calcium content is desired in high temperature
applications because calcium tends to hydrate upon contact with moisture in the
atmosphere and water in the activator solution. The dehydration of calcium phases at high
temperatures leads to a loss of structural integrity. If less calcium is present, the overall
structure suffers less from the effects of dehydration. This is the primary reason why
Class F fly ash is preferred to Class C fly ash for high temperature applications.
Abdulkareem, Bakri, Kamarudin & Nizar (2013) observed thermal shrinkage and
cracking in geopolymers exposed to high temperatures made with Class C fly ash. They

31
determined this was due to a loss of structural water through the dehydration of calcium
phases. This led to a complete loss of structure by 800°C [20].
A high calcium content also leads to a significant reduction in thermal shock loading
resistance. Patil, Badar, Dakhal & Allouche (2014) subjected geopolymers made with
Class C and Class F fly ashes to heating and quenching in water. They found that the
geopolymers made with Class C fly ash were destroyed immediately, while the Class F
geopolymers generally survived intact, some with no visible cracking [21]. Class F fly
ash-based geopolymers also maintain high compressive strengths after exposure to high
temperatures. Several studies have reported a continuous increase in compressive
strength as exposure temperature increased [22-24]. These studies have also reported a
decrease in compressive strength when coal fly ash is mixed with another precursor, such
as metakaolin or palm oil fly ash. In general, there is a negative correlation between the
amount of alternative precursor mixed with fly ash and the compressive strength of the
geopolymer after exposure to extreme temperatures. However, this does not mean that a
100% fly ash based geopolymer will always provide the best resistance to high
temperatures. There are instances where metakaolin or another precursor must be added
to fly ash so that the correct chemical ratios exist to produce a robust geopolymer. These
ratios will be discussed further in the upcoming sections.
2.5.1.2 Metakaolin.
Metakaolin is another common precursor. It is produced by heating kaolinite clay in a
rotary kiln up to 650-700°C, causing dehydroxylation. This process is called calcination,

32
and it produces an amorphous aluminosilicate material that can be used to produce
geopolymers. The particle size of metakaolin is usually smaller than that of fly ash, at 1-
2µm. This means that the water demand is higher, since there is a larger amount of
surface area to react with. Generally, an increase in water content results in a decrease in
compressive strength. At high temperatures, an increase in water content also produces an
increased risk of hydrogen gas production. Increasing the proportion of water in the
structure of the geopolymer causes an increase in internal pressure at high temperatures
as the water evaporates and expands the in closed pores. This leads to an increased
chance of spalling and cracking, which decreases compressive strength and increases the
risk of a structural failure. Even so, metakaolin may be used to some degree in
geopolymers subjected to high temperatures. Zhang, Kodur, Wu, Cao, & Qi (2015)
exposed geopolymers composed of 100% fly ash, 100% metakaolin, and mixtures thereof
to temperatures up to 800°C. They found that 100% metakaolin geopolymer performed
well at ambient temperatures, but experienced high mass loss, strength loss, and thermal
shrinkage when exposed to high temperatures. On the contrary, the 100% fly ash
geopolymer had lower compressive strengths at room temperature but exhibited good
strength retention upon exposure to high temperatures. They also found that metakaolin
may have beneficial properties when added to fly ash if the amount does not exceed 25%
[25]. Although the compressive strength of metakaolin-based geopolymers typically
decreases with increasing temperature, the thermal properties are still better than that of
ground blast furnace slag or portland cement, so it is beneficial to use when balancing the
stoichiometry of a geopolymer made with fly ash or another precursor [26-28].

33
Metakaolin has a platy microstructure, which leads to a low workability. In a mixture
with a large amount of metakaolin, the particles are hindered by this geometry. This
results in a mixture that is “sticky” and difficult to place and finish. Although a
geopolymer can be made with 100% metakaolin, the low workability means that it is not
practical on a large scale. Experimentation at the University of Minnesota Duluth by the
Christiansen Concrete Research Group showed that a mixture with 15% metakaolin, or
less, provided acceptable workability. Above 15%, the beneficial thermal properties of
metakaolin are outweighed by the impracticality of its low workability. At 15% and
below, there is a sufficient amount of freely flowing particles to separate large groups of
metakaolin particles and prevent them from impeding each other significantly. If a
geopolymer concrete is to be developed for large scale use, it is important that it can be
placed with relative ease by the average concrete worker.
2.5.1.3 Ground glass.
Ground glass is another precursor that is used to produce geopolymers. It has not been
studied as extensively as other precursor materials but appears to have great potential
[29]. There are three main types of glass; soda-lime silica, borosilicate, and phosphate
glass, as well as multiple specialized categories. Soda-lime is the most common type of
glass, constituting nearly 90% of the glass manufactured worldwide. Because of its
prevalence, it is preferable to develop a geopolymer using soda-lime glass. This ensures
that there will be an abundant supply of material for large scale use. A typical soda-lime
container glass is composed, by weight percent, of approximately 70-73% SiO�, 1.7-2%
Al�O�, 9.1-9.8% CaO, 13.8-14.4% Na�O, and, 1.1-1.7% MgO, as well as other minor

34
constituents [30]. Because of its low alumina content, soda-lime glass often must be
supplemented with a high alumina precursor, such as metakaolin, to reach the chemical
stoichiometry required for a robust geopolymer. There are many additional subcategories
of specialized glass types. One such category is aluminosilicate glass. It is commonly
used in halogen lights, boiler gauges and other high temperature applications. This glass
contains a higher amount of alumina than most glasses, which is beneficial both to
geopolymer formation and resistance to high temperatures. A typical aluminosilicate
glass has a composition of approximately 60% SiO�, 16% Al�O�, and 7% CaO, along
with other less relevant constituents [31]. Because of its high alumina and silica content,
it can be used as the sole precursor in a geopolymer without requiring additional
supplements. The high alumina content also contributes to its resistance to thermal shock
loading.
Glass has a melting point of 1400-1600°C. This is beneficial in high temperature
applications, especially in the case of a core meltdown. In order to reach the temperatures
required to melt glass, a significant amount of thermal energy must be applied to the
material. By displacing a large amount of thermal energy from the corium, it decreases
the depth to which the thermal energy can damage the structure. The melting of a certain
portion of the glass, as can be expected, also may play a role in the immobilization of
radioactive waste through vitrification. When the glass melts, it mixes with the waste
material that it is in contact with. As the fluid glass solidifies, or vitrifies, the radioactive
waste is bound in the glass matrix. Through this process, the waste material may be
partially or fully stabilized. In addition, non-glass based geopolymers, such as fly ash,

35
often exhibit glass transition behavior that may be useful in this application [32]. Further
experimentation is required to verify this. Currently, there are no studies that incorporate
glass based geopolymers in high temperature applications.
2.5.2 Effect of activator solution and stoichiometry on thermal performance.
Several different activators can be used to trigger a geopolymer reaction. Since they have
different chemical compositions, the effect they have on thermal performance can vary.
2.5.2.1 Activator types.
The activator is the catalyst for the geopolymerization reaction. It is typically a highly
alkaline solution of hydroxides and silicates, although other formulations have been used.
The most common activator is a mixture of sodium hydroxide and sodium silicate.
Potassium hydroxide and potassium silicate are the next most common activators. The
compositions of these activators are shown in Table 2. Pan & Sanjayan (2011) prepared
fly ash based geopolymers activated with sodium hydroxide, sodium silicate, potassium
hydroxide, potassium silicate, and mixtures thereof, and exposed them to elevated
temperatures. They found that using potassium-based activators increased the softening
temperature, the temperature at which large deformations occur, from 610°C to 800°C.
Alternatively, mixing sodium and potassium activators lowered the softening temperature
to 570°C [33]. The primary reason that potassium-based activators are not as prevalent as
sodium-based activators, is the increase in cost to produce them. In sensitive structures,
such as nuclear power plants, the additional benefits may outweigh the added cost.
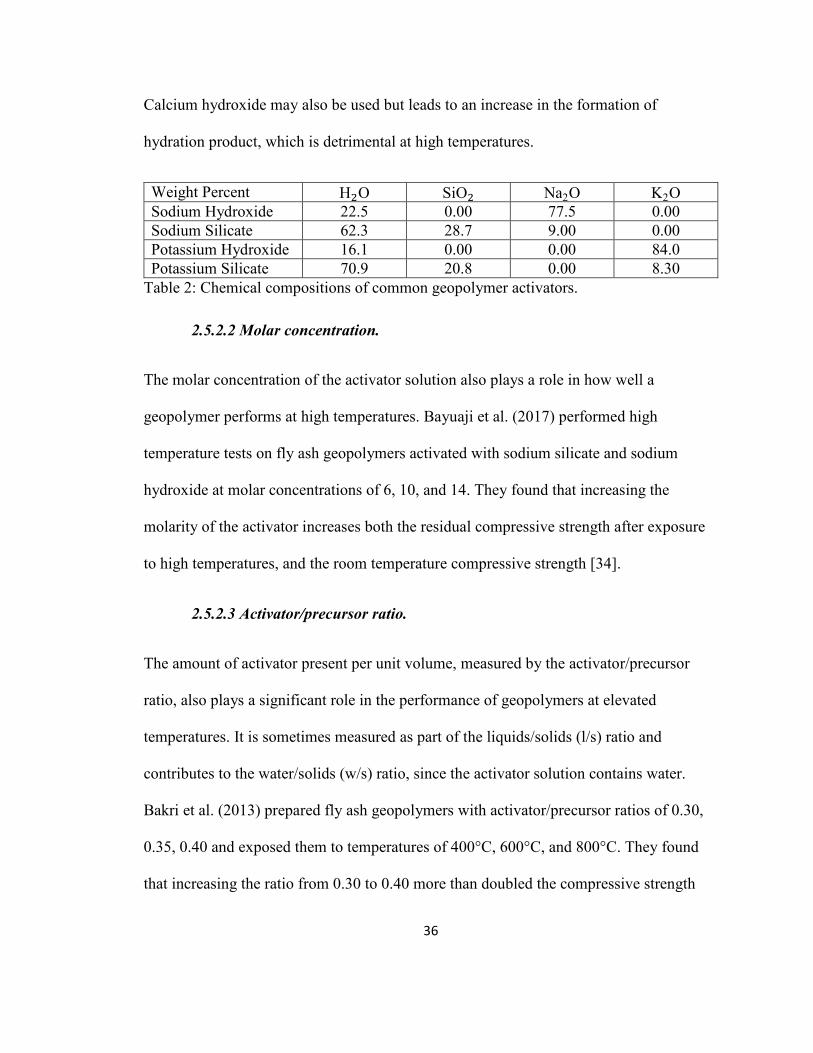
36
Calcium hydroxide may also be used but leads to an increase in the formation of
hydration product, which is detrimental at high temperatures.
Weight Percent H�O SiO� Na2O K2O
Sodium Hydroxide 22.5 0.00 77.5 0.00
Sodium Silicate 62.3 28.7 9.00 0.00
Potassium Hydroxide 16.1 0.00 0.00 84.0
Potassium Silicate 70.9 20.8 0.00 8.30
Table 2: Chemical compositions of common geopolymer activators.
2.5.2.2 Molar concentration.
The molar concentration of the activator solution also plays a role in how well a
geopolymer performs at high temperatures. Bayuaji et al. (2017) performed high
temperature tests on fly ash geopolymers activated with sodium silicate and sodium
hydroxide at molar concentrations of 6, 10, and 14. They found that increasing the
molarity of the activator increases both the residual compressive strength after exposure
to high temperatures, and the room temperature compressive strength [34].
2.5.2.3 Activator/precursor ratio.
The amount of activator present per unit volume, measured by the activator/precursor
ratio, also plays a significant role in the performance of geopolymers at elevated
temperatures. It is sometimes measured as part of the liquids/solids (l/s) ratio and
contributes to the water/solids (w/s) ratio, since the activator solution contains water.
Bakri et al. (2013) prepared fly ash geopolymers with activator/precursor ratios of 0.30,
0.35, 0.40 and exposed them to temperatures of 400°C, 600°C, and 800°C. They found
that increasing the ratio from 0.30 to 0.40 more than doubled the compressive strength

37
[34]. This is attributed to the increase in the silica/alumina ratio provided by the silica-
rich activator. The silica/alumina ratio will be discussed in an upcoming section.
2.5.2.4 Water/solids (w/s) ratio.
As in portland cement, increasing the w/s ratio typically results in a lower compressive
strength. In geopolymers a high w/s increases the size and number of pores in the
microstructure. This is the primary reason why increasing the w/s ratio decreases the
initial compressive strength in geopolymers. Increasing the w/s ratio is especially harmful
to materials in high temperature environments, as the trapped water vapor leads to an
increase in internal pressure. When the internal pressure reaches a point beyond the
tensile strength of the material surrounding it, spalling and structural failure occur.
Increasing the l/s ratio can have a similar effect, depending on what portion of the liquid
is composed of water. Increasing the w/s ratio also increases the risk of corrosion to
reinforcement and other metal parts, since more water is available to contribute to
corrosion.
2.5.2.5 Silica/alumina (3456/78659) ratio.
The silica/alumina ratio plays an important role in the performance of a geopolymers at
elevated temperatures. An increase in silica/alumina ratio increases the content of silica
species in the geopolymer. This results in the formation of more Si-O-Si bonds, which are
stronger than Si-O-Al bonds [35]. This can be achieved by increasing the silicate in the
activator solution and/or by using a precursor with a high silica content, such as ground
glass. Rickard, Williams, Temuujin, & Riessen (2011) carried out a study in which they

38
synthesized geopolymers with fly ash from three different power plants. For each fly ash,
they varied the silica/alumina ratio from 2.0 to 3.0, and in each case found a higher
retention or increase in compressive strength as the silica/alumina ratio increased [36]. In
a follow-up study, they determined that fly ashes with a high silica/alumina ratio (≥5)
produced geopolymers with low to moderate compressive strengths at room temperature,
but greater compressive strengths after heating and high dimensional stability. Fly ashes
with a low silica/alumina ratio (<2) produced geopolymers with high room temperature
compressive strengths, but greatly reduced compressive strengths after heating and poor
dimensional stability [37].
2.5.2.6 Sodium/alumina (:;65/78659) ratio.
The sodium/alumina ratio is a good indicator of whether or not a geopolymer will form
successfully, especially in the case of ground glass. Investigations carried out at the
University of Minnesota Duluth by Corey Schloesser of the Christiansen Research Team
determined that the sodium/alumina ratio must not exceed 2.2 for a geopolymer to
maintain its structural integrity [50]. Potassium can be substituted for sodium in this ratio
if potassium hydroxide and potassium silicate are used. The primary means of controlling
this ratio is by adjusting the amount and/or concentration of the activator solution. The
composition of the precursor material also affects this ratio, but typically to a lesser
extent. Changing this ratio also affects the w/s and activator/precursor ratios. It is often
the case, that when one ratio is changed other ratios change, according to their
correlations.

39
2.5.2.7 Alumina content.
Alumina content plays an important role in the durability of a geopolymer at high
temperatures and its resistance to thermal shock loading. The size of the alumina particles
determines what effects the addition of alumina will have on these properties. Lin, Jia, He
& Wang (2009) added α-Al2O3 particles, with an average diameter of 0.75µm, to a
metakaolin geopolymer and subjected it to temperatures up to 1400°C in 200°C
increments. When the particles are this small, they affect the chemistry of the bulk
geopolymer binder. They found that adding particles of this size had no effect on the
flexural strength after heating. However, they did determine that thermal shrinkage was
reduced as the alumina concentration increased [38]. When alumina is used as an
aggregate, it has a different effect. Patil, Badar, Dhakil & Allouche (2014) used white
fused alumina with a nominal size of 5mm, as coarse aggregate, and tabular alumina with
a nominal size of 2.36mm, as fine aggregate, in fly ash based geopolymers. They used
eleven types of fly ash from four countries and made two samples with different fine
aggregates for each type; one sample with silica sand and one sample with alumina. The
samples were then subjected to five thermal shock cycles by heating them to 1093°C and
quenching them in water. They found that samples made with alumina fine aggregate
outperformed samples made with silica sand fine aggregate. The only samples to show no
signs of cracking or expansion at the end of five thermal shock cycles used alumina as a
fine aggregate, while many of the samples with silica sand failed immediately upon
quenching [21].

40
2.6 Thermal Conductivity of Geopolymer Cement
In basic terms, thermal conductivity is the rate of heat flow through a material subject to
a temperature gradient. It is expressed in units of watts per meter-kelvin (>
�∗?). A
material with a high thermal conductivity conducts heat well, while a material with a low
thermal conductivity acts as an insulator and does not conduct heat well. Thermal
conductivity takes into account the flow of heat through an area of material and the
thermal gradient as a function of length through the material. The thermal gradient is the
change in temperature per unit length. On a basic level, it can be thought of as the
difference in temperature between two points inside of a material.
Portland cement has a thermal conductivity of approximately 0.29 >
�∗? , which is
relatively low. For comparison, copper has a thermal conductivity of 401 >
�∗? . This
indicates that portland cement acts as an insulator. The thermal conductivity of a
geopolymer cement can vary much more widely than portland cement and is largely
dependent upon the materials used in creating the geopolymer. Geopolymer cement with
a higher thermal conductivity than that of portland cement has been produced in previous
research [43].
2.6.1 Effects of thermal conductivity on materials under thermal loading.
If molten corium drops from the reactor onto the basemat during a core meltdown, it
creates a scenario in which there is thermal shock loading in the material that it falls onto.
If that material has a low thermal conductivity, like portland cement, the heat in the

41
corium will not be able to efficiently transfer away from it, resulting in extreme
temperatures in the local area around the corium. Since all of the thermal energy is
concentrated in a relatively small area, the material must be able to withstand extreme
temperatures over a long period of time to preserve the integrity of the containment
structure. In the case of portland cement-based concrete, this extreme heat causes the
hydrated phases to dehydrate and the cement to begin to disintegrate. This damage may
reach considerable depths if the corium cannot be cooled by some other means. Such a
failure could lead to a breach in the containment structure and the release of radioactive
materials into the groundwater and the atmosphere.
On the contrary, if the material has a higher thermal conductivity heat can flow more
efficiently throughout the structure. In this way, the heat from the corium will be drawn
away from the heat source and dispersed over a larger volume of material. This would
lead to less extreme localized heating and reduce the damage to the containment
structure. The depth of damage below the corium also would be reduced, which would
reduce the risk of a containment structure breach. Material further away from the heat
source would receive higher levels of heat loading than it otherwise would have, but if
the thermal conductivity, material properties, and volume of material are sufficient, the
temperature of the material would not rise to a level that causes failure in that material.
By spreading the thermal energy over a larger area and sharing the thermal load with a
larger volume of material, the depth and magnitude of damage to the material in general
would be reduced. This concept is illustrated in Figure 5.

42
Figure 5: Core meltdown with PCC (left) and with thermally conductive concrete (right).
In addition, the thermal conductivity of the geopolymer has an effect on the development
of thermal expansion over time. If the GCC has a different rate of thermal expansion than
the reinforcing bars supporting it, cracks can form due to the differences in thermal
expansion. By adjusting the thermal conductivity of the GCC, the rate of thermal
expansion between the concrete and reinforcement can potentially be reduced, reducing
the chance of cracking.

43
The same concept applies to any structure that is on fire. If the heat from the fire is
dispersed throughout the structure, it decreases the chance of structural failure as long as
the material the structure is made of has sufficient volume and material properties,
including sufficiently high thermal conductivity. Unfortunately, many of the materials
with high thermal conductivities are not practical replacements for portland cement or
other binders with low thermal conductivity. However, there is much room for
improvement in binders that are currently being used, and any increase in thermal
conductivity is beneficial to the resilience of the structure. It would, at the least, provide
additional time until failure, potentially reducing the number of casualties in an accident
by allowing more people to evacuate areas of danger before the structure fails.
2.6.2 Effect of aggregate material on thermal conductivity.
The type of aggregate used in a geopolymer concrete can have a significant effect on its
thermal conductivity. To create a geopolymer concrete with a high thermal conductivity,
it is important that the aggregate is thermally conductive, since it typically constitutes 60-
75% of the material by volume. Taconite tailings contain iron, which is known to have a
high thermal conductivity (80B
C∗D). Using these tailings as an aggregate likely would
significantly increase the thermal conductivity of the geopolymer concrete, since the
thermal conductivity of aggregate normally used is low in comparison (< 10B
C∗D).
Currently, there is no literature pertaining to the use of taconite tailings as an aggregate in
high temperature applications.

44
2.7 Effect of Elevated Temperatures on Geopolymer Cement
Geopolymers have an inhomogeneous microstructure and may contain many
intermingled phases, so the effects that exposure to high temperatures have on them are
often of a complex nature and difficult to observe. The characteristics of a geopolymer
and the reactions that take place within it can change significantly, depending on which
type precursor or mixture of precursor materials is used. These also may vary depending
on the type of activator or combination of activators used and the molar concentration of
the activator. Physical measurements are often convoluted by the varying levels of
influence that each phase has at a specific temperature and/or time in the heating or
cooling cycle. This is further complicated by the presence of secondary phases that are
inherent in most precursors, such as unburnt carbon, quartz, mullite, and iron species
[40]. Further research into the effects of high temperatures on geopolymers will increase
the understanding of these materials and contribute to optimizing their use in high
temperature conditions.
Rickard et al. (2012) exposed geopolymers made with five different fly ashes to
temperatures up to 1000°C and examined their microstructures. Although they observed
many phase changes simultaneously to varying degrees, each phase is described
separately to avoid convolution:
After heating to 1000°C, sodium-based feldspars were detected. These high temperature
phases included nepheline, albite, and tridymite. The high melting temperatures of these
phases (1257°C, 1118°C, and 1670°C, respectively) is believed to contribute to the

45
thermal resistance of geopolymers [37]. Quartz and mullite intensities decreased with
increasing temperature. This was unexpected, since mullite melts at approximately
1830°C. The authors believed that the presence of free sodium in the geopolymer led to
the low temperature dissolution or melting of mullite, since alkalis are known to be
excellent sintering agents. The reduction in quartz was believed to be the result of a
partial phase change to tridymite.
Several iron phases present were observed to behave differently from one another.
Maghemite-C was destroyed or drastically reduced in all samples, while magnetite was
not observed to change at all after exposure to 1000°C. However, hematite was observed
to increase, especially in fly ashes with higher iron concentrations. It is likely that the
hematite crystallized from the amorphous iron in fly ash, as well as from the
transformation of maghemite-C, which takes place between 370°C and 600°C. The
presence of small amounts of maghemite in some samples is likely due to substitutions in
the maghemites, which can retard phase transformation.
It was not possible to determine if the phases were formed from changes in the original
crystalline structure or crystallization of amorphous material in unreacted fly ash and the
geopolymer gel. It is believed by the authors, that most of the crystallization observed in
this study is derived from free Na, Si, and Al species after zeolitic phases decomposed at
high temperatures. Barbosa & MacKenzie reported that the geopolymer gel remains
completely amorphous when heated to 1200°C [41], while Duxson et al. (2007) report
crystallization starting as low as 600°C [19]. The zeolitic phases may be tested for use as
selective ion filters in future research.

46
Although the complexity of geopolymer chemistry can lead to conflicting observations,
general trends can be observed for geopolymers with similar constituent materials in most
cases [42]. For a fly ash based geopolymer, a general reaction sequence can be observed
upon heating. All values are approximate, and reactions may vary depending on the
constitution of the geopolymer and preparation methods. A general sequence of events is
as follows:
Up to approximately 100°C, a small degree of expansion occurs as pore water and
adsorbed water begin to dehydrate and exert pressure on pore walls. Bound water from
Si-OH groups also begins to dehydrate. From 100°C to 300°C, rapid shrinkage occurs as
capillaries narrow, releasing pore solution from the geopolymer gel. This causes the
structure of the geopolymer gel to rearrange. Pores in the structure begin to collapse as all
evaporable water is driven off. From 300°C to 550°C, bound hydroxyls are slowly
dehydroxylated, causing small amounts of shrinkage due to the physical contraction of
the gel. This is a period of relative thermal stability. From 550°Cto 650°C, the
geopolymer gel is densified into a glass, or ceramic, state through viscous sintering.
Beyond this temperature, the behavior is largely dependent upon the specific material
used. Various fly ashes have shown continued thermal shrinkage, or thermal expansion
followed by thermal shrinkage. At this point the geopolymer is in a viscous state, so there
is no brittle failure. Beyond 800°C it continues to shrink and densify.
Although the behavior of geopolymers at high temperatures is largely case specific, the
primary cause of damage is typically water content. Geopolymers are superior to portland
cements in this respect since they require no water to maintain structural integrity. Even

47
if water is required to improve workability, the amount is typically far lower than that
required for portland cement to maintain its structural integrity. Also, little or none of the
water is chemically bound, so it is escapes more readily without harming the material’s
structure. This is one of the reasons why geopolymers perform better than portland
cement at elevated temperatures.
2.7.1 Thermal loading conditions.
Although research has been carried out pertaining to the properties of various
geopolymers at high temperatures, most of it is far better suited to the conditions that
exist in a structural fire rather than conditions that exist in nuclear power plant during a
core meltdown. In most of these studies the material is heated by ramping up the
temperature relatively gradually. This closely models a structural fire, which starts out
small and typically grows larger over a period of time.
This condition does not exist during a core meltdown. In a core meltdown, the material
below the reactor experiences thermal shock loading as the molten corium falls from the
reactor and lands on its surface. This can be simulated by introducing the material to high
temperature conditions in a very short period of time, almost immediately. No studies
have been found that expose geopolymers to this type of impulse thermal loading.

48
Chapter 3: Materials and Experimental Methods
Chapter 3 encompasses the selection and characterization of materials used in mixture
designs, as well as procedures and experiments carried out and equipment used. The
mixture designs developed for each phase and experimental data collected are presented
in Chapter 4.
3.1 Material Selection and Characterization
The chemical compositions of all materials were characterized using X-ray fluorescence
(XRF) to perform elemental composition analysis. Ground glass particles were also
characterized by particle size distribution using a CILAS 1180 laser diffraction particle
size analyzer to ensure that the proper size glass particles were used.
3.1.1 Fly ash.
A locally-sourced Class F fly ash was selected based on the chemical properties it
contained that have been proven to be beneficial in high temperature applications. A
thorough review of the literature shows that Class F fly ash geopolymers outperform
Class C fly ash geopolymers at elevated temperatures. This is largely due to the higher
calcium content in Class C fly ash, which forms hydration products and leads to
dehydration and structural decomposition at high temperatures. Previous studies also
show that a high silica/alumina ratio is desirable at high temperatures and that the
alumina content contributes to structural resiliency under thermal shock loading. For
these reasons, out of the fly ashes considered, the one with the lowest calcium content

49
and the highest silica and alumina content was chosen. The silica/alumina ratio was fairly
high in this fly ash and was further supplemented by silica in the activator solution. The
chemical composition of this fly ash is shown in Table 3.
By studying the microstructure of fly ash and by experimentation, it was determined that
there is no upper limit on the proportion of fly ash that can be used in a mixture design.
This is largely due to the smooth, spherical geometry of fly ash particles, as can be seen
in Figure 6. This geometry gives it good workability properties since particles encounter
little flow resistance due to the absence of sharp corners or irregular shapes that would
otherwise impede their movement during mixing.
Figure 6: SEM micrograph of fly ash particles at 1000x (left) and 200x (right). The
spherical nature of the particles is apparent in the cenospheres and plerospheres present.
[29]
3.1.2 Metakaolin.
Burgess Optipozz high reactivity metakaolin was used in some of the mix designs to raise
the alumina and silica content. It has an average particle size of 1.4µm and a specific
gravity of 2.2. Although previous studies have found that metakaolin geopolymers

50
experienced mass loss, strength loss, and thermal shrinkage when exposed to high
temperatures, it was theorized by previous authors that metakaolin may have beneficial
properties when added to fly ash geopolymers so long as the proportion does not exceed
25% [24]. Metakaolin also has a high alumina content, which is beneficial to thermal
shock loading and is useful in balancing chemical stoichiometry in mixtures with high
silica precursors. For these reasons, small amounts of metakaolin were used in some of
the mixture designs, either to lower the sodium/alumina ratio to an acceptable range or to
increase the overall alumina content in a mixture. The chemical composition of the
metakaolin used in this study, as determined by XRF, is shown in Table 3.
Through previous experimentation, it was determined that the practical upper limit on the
amount of metakaolin that can be used in a mixture design is 15% by mass. This is due to
the decrease in workability that corresponds to an increase in metakaolin content. As can
be seen in Figure 7 metakaolin has a platy microstructure, which impedes its movement
in a mixture. The particle size distribution of metakaolin is very small, approximately 1-
2µm, which leads to an increase in water demand. A low water demand is desired for
high temperature applications due to the increase in risk of spalling and the potential for
increased formation of hydration products that corresponds to an increase in water
content.

51
Figure 7: SEM micrograph of metakaolin particles at a magnification of 1000x (left) and
200x (right). The platy structure of the particles can be clearly identified. [29]
3.1.3 Ground Waste Glass.
There have been no studies found regarding the behavior of ground waste glass-based
geopolymers at high temperatures, but they exhibit great potential. Waste glasses can
have different compositions depending on where they are sourced from, but commonly
recycled single waste streams can typically be identified as having similar compositions.
In selecting glass types to be used in this study, 19 different ground glasses were
examined. They had compositional differences and were sourced from various recycled
glass producers throughout the United States. Glasses A, B, and C were chosen to be
tested. Glass A is an aluminosilicate glass with an alumina content of 13.45%. This is
very high compared to the average of less than 2% typical in soda-lime glasses. The
chemical composition of glass A is shown in Table 3. This type of glass is typically used
in situations where high temperature durability and thermal shock resistance is required,
such as in combustion tubes, gauge glasses for high-pressure steam boilers, and in
halogen lamps. A high alumina content has been shown to be beneficial in fly ash

52
geopolymers, especially in contributing resistance to thermal shock loading [21]. For
these reasons, glass A was selected to be tested. Glass B was chosen because it is a
borosilicate glass. This type of glass is currently to immobilize nuclear waste material
through the vitrification process. It exhibits good chemical stability at high temperatures
and is an effective neutron absorber due to its boron content. In addition, it has a high
silica content, which is beneficial at high temperatures. The chemical composition of
glass B, as per the manufacturer, is shown in Table 3. Glass C was selected because it is
representative of soda-lime glass, which makes up almost 90% of glass produced
globally. It is also a container glass, which is the most commonly recycled type of glass.
Additionally, glass C has a high silica content, which leads to a high silica/alumina ratio
and is beneficial in high temperature applications. The chemical composition of glass C is
shown in Table 3. However, because of its low alumina content, this glass should not be
used on its own as a precursor, but as a supplement to fly ash or another precursor that is
high in alumina. The same is true of glass B. Glass A, however, can be used as the sole
precursor in a geopolymer because of its high alumina content.
All glasses used were procured pre-ground at a production facility to a sand or flour-like
consistency, depending on which manufacturer it originated from. In order for the glass
to have a sufficient degree of reaction, 90% of the particles needed to be under 45µm.
Glass A, which was sourced from Vitro Minerals in Jackson, Tennessee, came pre-
ground with a D90 of 29.48µm. Glass C, which was sourced from Strategic Materials in
St. Paul, Minnesota, came with a D90 of 834.24µm. This glass was ground further in a
ball mill until a D90 of 37.57µm was achieved. Glass B, which also was sourced from

53
Vitro Minerals, was also ground with a ball mill until a D90 of 43.99µm was reached.
The chemical composition of all three glasses are shown in Table 3. Due to the sharp
angles present in the microstructure, as seen in Figure 8, ground glass has a workability
slightly lower than fly ash, but much higher metakaolin. The increased surface area also
leads to a water demand that is slightly higher than that of fly ash, but much lower than
that of metakaolin. The increase in water demand is not high enough to be considered
significantly detrimental at high temperatures, although it can lead to lower compressive
strengths.
Figure 8: SEM micrograph of glass particles at a magnification of 1000x (left) and 200x
(right). [29]
3.1.4 Activator solution.
Sodium hydroxide flake and sodium silicate from Spectrum Chemical Manufacturing Co.
were used as activators in most of the geopolymer mixes. Sodium hydroxide flake was
mixed with filtered and deionized water to reach the desired molarity for each mixture
design. A baseline of 10M sodium hydroxide was used in 14 of the mixtures. Two of the
mixtures substituted potassium hydroxide pellets from Spectrum Chemical

54
Weight % Fly Ash Metakaolin Glass A Glass B Glass C
SiO2 54.8 51.5 65.4 80.6 72.7
Al�O� 16.8 43.9 13.5 2.3 1.3
Fe�O� 5.9 0.4 0.2 0.0 0.6
CaO 12.6 0.6 7.6 0.0 11.5
Na�O 1.5 0.3 5.6 0.0 10.8
MgO 4.3 0.1 1.8 4.0 0.4
K�O 2.7 0.2 0.1 0.0 0.5
TiO2 0.7 1.4 0.1 0.0 0.1
Na2O (eq.) 3.3 0.4 5.6 0.0 11.1
LOI 0.7 1.6 0.6 0.0 0.7
Table 3: Chemical compositions of geopolymer precursors used in this study. Minor
constituents (<1%) are not included.
Manufacturing Co. for the sodium hydroxide flake in solution. Previous research
suggested that an activator solution with a higher molarity leads to increased performance
at high temperatures, so a glass-based mixture and a fly ash-based mixture were created
with 15M sodium hydroxide to verify this assertion. Mixtures were also created with
10M and 15M potassium hydroxide to determine if this assertion holds true independent
of activator type.
Based on the literature, a sodium hydroxide/sodium silicate ratio of 1:1 was selected for
the baseline activator solution [48]. Mixtures with sodium hydroxide/sodium silicate
ratios of 2:1, 1:2, and 1:0 were also created to determine the effects of activator
composition on high temperature performance.
Additionally, two mixtures were produced with 100% potassium hydroxide as the
activator. This was done to verify previous research that suggested using potassium in
place of sodium in the activator solution increases the softening temperature [33].

55
Potassium silicate was not used, because it was found to be prohibitively expensive and
difficult to obtain, therefore making impractical for use on a large scale. The chemical
compositions of the activators used are shown in Table 4.
Weight Percent H�O SiO� Na2O K2O
Sodium Hydroxide 22.5 0.00 77.5 0.00
Sodium Silicate 62.3 28.7 8.99 0.00
Potassium Hydroxide 16.1 0.00 0.00 84.0
Table 4: Chemical compositions of geopolymer activators used in this study.
3.1.5 Fine aggregate.
Pre-packaged fine silica sand from U.S. Silica was used as a fine aggregate in all
geopolymer mixes. It is composed of 95-99.9% crystalline silica, or quartz, with a
specific gravity of 2.65.
3.1.6 Coarse aggregate.
In Phase 3, 3/8” taconite tailings from taconite mines in northern Minnesota were used as
coarse aggregate to increase the thermal conductivity of the geopolymer cement. In the
control mixtures, 3/8” gravel was used as a coarse aggregate.
3.2 Mixture Design and Development
Mortar mixtures were produced during the first phases of this research to determine what
mixture designs produce the most robust binders for high temperature applications. In
Phase 3, concrete mixtures were created to determine if the thermal conductivity could be
increased by using taconite tailings as course aggregate in place of conventional gravel.

56
There are several variables that are important to consider in creating a new geopolymer
for high temperature applications, in addition to those that are important to the creation of
any new geopolymer. These variables were determined by previous research and a review
of applicable literature. They are listed as follows:
• Stoichiometry
• Mixture proportions and water content
• Mixing procedure
• Curing conditions
3.2.1 Stoichiometry.
Stoichiometry is very important to the proper design of a geopolymer mixture. It can be
altered by the selection of activator and precursor material types, as well as the
proportions of each that are included in the mixture. Although this seems to provide a
wide range of options in designing a geopolymer mixture, these options are often limited
by the correlations that exist between various stoichiometric ratios.
Constraints were set on several stoichiometric ratios based on a review of the literature
and previous research. Previous research demonstrated that, for a geopolymer to be
successful, its sodium/alumina ratio must not exceed 2.2 [50].
Several constraints apply specifically to high temperature applications. The most relevant
constraints for high temperature applications are:
• Activator/precursor ratio of 2.5

57
• Silica/alumina ratio ≥ 5
• High alumina content
Often, changing one of these ratios caused one or more of the remaining ratios to change.
In an effort to provide consistency, the activator/precursor ratio was held constant for all
mixtures. The sodium/alumina and silica/alumina ratios were inherently connected by the
nature of the materials and activators used in the mixtures. The precursor and activator
types and proportions were used to adjust the stoichiometry. Each mixture was specified
to contain specific precursors and activators, as is explained in the following section, so
the proportions of these precursors and activators could be changed but not the type of
precursor and activator used. Typically, if ratios needed to be raised or lowered, the
amount of metakaolin or fly ash was raised or lowered, but in some cases other methods
were used in addition to this.
3.2.2 Mixture proportioning and water content.
As mentioned earlier, previous researchers found that an activator/precursor ratio of 2.5
produced a geopolymer with the best performance at high temperatures. This ratio, along
with an aggregate/precursor ratio of 3, was found to create a mixture with good
workability in fly ash and glass-based geopolymers. When ground glass and metakaolin
were used in a mixture, the water demand increased due to the increase in reaction
surface area. If additional mixing water was not added to the mixture, small nodules were
formed that separated from one another and created an unworkable mixture that would
not consolidate. This is shown in Figure 9. Since excess water can have negative effects

58
at high temperatures, each mixture was created with the least amount of water needed to
provide sufficient workability. As a result, every mixture did not have the same
water/solids ratio. However, the water/solids ratio was generally kept the same or similar
across geopolymers with the same precursors.
Figure 9: Nodules formed from an insufficient amount of water in the mixture.
3.2.3 Mixing procedure.
The NaOH or KOH solution used in each mixture was prepared at least 24 hours in
advance and allowed to reach thermal equilibrium at room temperature. Sodium silicate
and extra mixing water were also kept at room temperature until mixing.
In the first step, the dry precursor was placed in the mixing bowl of a Hobart tabletop
mixer. If multiple precursors were used, they were mixed for 2 minutes at mixing speed 1
in order to sufficiently blend them without losing light particulate material. The activator
solution was created by combining NaOH and sodium silicate in a separate container.

59
Then, while remaining at speed 1, the activator solution was slowly added over the course
of one minute and was allowed to mix with the dry precursor for an additional three
minutes. This allowed the NaOH sufficient time to dissolve the precursor material. Any
additional mixing water was then added over the course of one minute and mixing was
continued for one more minute at speed 1. This additional water was not added until this
time so as not to dilute the activator solution. Silica sand was then added over two
minutes and mixing was continued for three minutes at speed 1. When all components of
the mortar were sufficiently blended, the mixing speed was increased to speed 2 to
increase shear energy, and the mortar was mixed for an additional three minutes. The
mixer and mixing area are shown in Figure 10.
Figure 10: The tabletop mixers used to mix geopolymers and the mixing area.
3.2.4 Fresh properties.
After mixing, fresh mortar flow tests were carried out in accordance with ASTM C1437
Standard Test Method for Flow of Hydraulic Cement Mortar using a drop table and an

60
electronic caliper. Unit weight measurements were taken using 2”x 4” cylinders. The
flow test and unit weight apparatuses are shown in Figure 11.
Figure 11: Flow test drop table (left) and 2”x4” cylinders used for unit weight
measurements (right).
3.2.5 Mortar cube and cylinder preparation.
Mortar cubes were prepared by thinly coating 2”x 2” cube molds with a releasing agent
and filling them with mortar. The molds were filled in 2 lifts and tamped at each lift in
accordance with ASTM C109 - Standard Test Method for Compressive Strength of
Hydraulic Cement Mortars (Using 2-in. or [50-mm] Cube Specimens). The tops were
struck flat with a straight edge and the molds were placed in a sealed container for curing.
Mortar cylinders were prepared by thinly coating 3”x 6” cylinder molds with a releasing
agent and filling them with mortar. The molds were filled in two lifts and consolidated
using a vibratory table and a steel tamping rod. The vibratory table with a cylindrical
mold is shown in Figure 12.

61
Figure 12: Vibratory consolidation table with a mold containing fresh geopolymer
mortar.
3.2.6 Curing.
Preliminary tests were carried out to determine optimal curing conditions. It was
determined that heat curing in a moisture rich environment produced geopolymers with
the highest compressive strength. All specimens were cured at 80°C for 24 hours in a
closed container with evaporable water available. The specimens were then demolded
and placed in an environmental chamber at 23°C and 94% relative humidity.
3.3 High Temperature Durability Testing
To simulate the conditions that exist in a core meltdown at a nuclear power plant and
those of a structural fire, the specimens were subjected to two different loading
conditions. In a core meltdown, the material is exposed to a large impulse thermal load

62
very suddenly, while in a structural fire, the material is exposed to a ramped thermal load
at a more gradual rate. Both thermal conditions were simulated using a Thermo Scientific
Lindberg Blue M BF51828C-1 muffle furnace over a range of 22°C-1100°C. The
specimens were evaluated by measuring residual properties, including compressive
strength, thermal expansion, mass loss, and surface hardness. Visual observation also
proved to be valuable in the evaluation process. All compressive strength testing was
carried out using a Humboldt hydraulic ram compressive tester in accordance with
ASTM C109 Standard Test Method for Compressive Strength of Hydraulic Cement
Mortars (Using 2-in. or [50-mm] Cube Specimens) and ASTM C570 Standard Test
Methods for Compressive Strength of Chemical-Resistant Mortars, Grouts, Monolithic
Surfacings, and Polymer Concretes. The compressive strength testing apparatus is shown
in Figure 13.
Figure 13: Humboldt hydraulic ram used in compressive strength tests.

63
3.3.1 Phase 1 thermal durability testing.
In Phase 1, fifteen different geopolymer mixes were evaluated for resilience in high
temperature applications. This phase was designed to eliminate any unsuitable mixtures
before devoting resources to study them in more depth. Preliminary research was carried
out to determine if impulse or ramped thermal loading was more damaging to
geopolymers. Since impulse loading was found to be more damaging, emulating the
worst-case exposure condition, it was chosen as the loading condition for Phase 1. For
each mixture design, the following procedure was carried out:
The muffle furnace was heated to 600°C and four cubes of one mixture design were
quickly placed in the furnace to simulate the thermal loading that occurs in the early
stages of a core meltdown in a nuclear power plant. All of the cubes were then held at a
constant temperature of 600°C for one hour in order to reach thermal equilibrium. Two
cubes were then removed from the muffle furnace and allowed to cool to room
temperature before they were tested for compressive strength. The remaining two cubes
were removed from the muffle furnace and immediately placed into a container filled
with room temperature water to test their resistance to thermal shock. They were then
removed from the water after one half hour and tested for compressive strength. This
process was repeated for each mixture design.
All of the cubes tested at high temperatures were compared against cubes tested at room
temperature at 28 days. If the compressive strength of the geopolymer did not exceed
1,000 psi before exposure to thermal loading, if visible cracking or erosion occurred, or if

64
Figure 14: Heated specimens in muffle furnace.
the geopolymer was severely damaged upon being heated, it was eliminated from further
testing. The same process was repeated at 1100°C. If the mixture design survived
exposure to 1100°C without significant damage, it was selected for further testing.
3.3.2 Phase 2 thermal durability and hardness testing.
In Phase 2, the mixture designs that were selected from Phase 1 were studied in more
detail. Many of the steps were similar to that of Phase 1, but instead of simply testing the
durability at high temperatures, additional properties were measured and the mixture
designs were studied over a more detailed range of temperatures.

65
To simulate conditions present immediately after a core meltdown and during quenching
and cooling stages, the following procedure was performed for each mixture design:
First, all cubes were weighed using a digital tabletop scale so that mass loss could later be
determined. The muffle furnace was then heated to 300°C and six mortar cubes were
quickly placed into it to expose them to an impulse thermal load. These cubes were
allowed to reach thermal equilibrium by remaining in the muffle furnace at 300°C for one
hour. After one hour, two cubes were removed, weighed, and quickly placed into two
containers holding 5 quarts of water at room temperature. The water temperature was
measured before placing the cubes and after one-half hour, when the cubes were removed
from the water and allowed to dry. The remaining four cubes were removed, weighed and
allowed to cool at room temperature. Two of these cubes were later used in surface
hardness measurements. This process was repeated at 600°C, 900°C, and 1100°C. Tests
were limited to 1100°C by the capabilities of the muffle furnace.
To simulate conditions present throughout a building during a structural fire and during
quenching and cooling after the fire, the following procedure was performed for each
mixture design:
24 cubes were weighed, set on a pan, and placed into the muffle furnace. The furnace was
then heated to 300°C at an average rate of 7.5°C/min. Upon reaching 300°C, the same
procedures were followed in removing and quenching the cubes as described above. This
same process was repeated upon reaching 600°C, 900°C, and 1100°C.

66
Rockwell surface hardness tests were performed on all heated specimens to determine if a
correlation could be established between surface hardness and change in compressive
strength with temperature. Successful development of this measuring method would
expand capabilities in forensic analysis. A 1/2” tungsten carbide ball indenter was used in
a Fowler 320 superficial hardness tester for all measurements. Tests were carried out on
the HR15Y scale with a dwell loading time of three seconds and a dwell reading time of
two seconds. This scale uses a minor load of 3kg. and a major load of 12kg. for a total
load of 15kg. The Rockwell Surface Hardness tester is shown in Figure 15.
Figure 15: Rockwell hardness tester with geopolymer mortar.
3.4 Thermal Transport Properties
In Phase 3, the thermal conductivities of relevant mixture designs from Phase 2 were
determined. Additionally, the use of taconite tailings as a coarse aggregate to increase
thermal conductivity was investigated. Thermal conductivity tests were carried out to

67
determine how well geopolymer binders transport thermal energy and were compared
against the thermal conductivity of portland cement binder. The thermal conductivity of a
gap graded PPC mixture containing taconite tailings as coarse aggregate was measured
and directly compared to the thermal conductivity of an identical mixture containing
conventional gravel coarse aggregate. In addition, molten metal was poured onto a
geopolymer mortar and an OPC mortar to determine what effect it would have on the
materials. This was meant to emulate conditions similar to those that would exist when
molten corium falls onto the materials.
Thermal conductivity tests were carried out in a testing apparatus based on ASTM C1044
Standard Practice for Using a Guarded-Hot-Plate Apparatus or Thin-Heater Apparatus
in the Single-Sided Mode. This thermal conductivity apparatus consisted of an adjustable
temperature hot plate, on top of which lay a 1” thick cylinder of 1060 aluminum alloy
surrounded on the sides and above by 6 inches of insulation with a cavity at its center for
the test specimen. This test apparatus, shown in Figure 16, was developed with help from
Undergraduate Research Opportunities Program (UROP) student Matt Garfield .
Figure 16: Thermal conductivity testing apparatus.

68
The 3”x 4” cylindrical specimen used in this test was placed on the aluminum cylinder,
both of which lie on top of the hot plate with their axis oriented vertically. The specimen
was covered with 6 inches of insulation on all sides to prevent any radial heat flow, so
that the heat flow was essentially one-dimensional. It was also covered with insulation on
its top surface to provide an insulated boundary condition. Type K thermocouples were
attached to the specimen on the top and bottom surfaces and every 2 inches in the axial
direction to measure the thermal gradient. This setup allowed for a one-dimensional
thermal analysis with heat flow in the axial direction. All data values were collected
using an IOTech PersonalDAQ 3001 data acquisition module and uploaded to a computer
using DaqView software. Data was read into Microsoft Excel using ViewXL software.
Figure 17: IOTech PersonalDAQ 3001 data acquisition module and DaqView software.
3.4.1 Thermal conductivity testing.
To carry out the thermal conductivity tests, the hot plate and specimen were heated to
125°C, with thermocouples attached to the specimen, and covered by the insulating

69
shield. Upon triggering, the data acquisition module immediately began collecting
temperature measurements every 30 seconds. After 12 hours, the hot plate automatically
turned off and the specimen was allowed to cool. The temperature values were recorded
over the heating cycle and were collected and imported into Excel, where they were
plotted against time. These values were used to determine the thermal conductivity of the
specimen. This test relied on the measurement of the temperature gradient at steady state
once a temperature of 125°C was reached. It was carried out on mortars and concretes.
3.4.2 Molten metal testing.
To test the durability of the geopolymer concrete in an environment similar to that which
exists in an actual core meltdown or industrial accident, molten aluminum was poured
onto the specimens at about 700°C, compared to a nuclear accident where temperatures
are many times higher.
To perform this test, a wooden box was lined with fire brick and filled with green casting
sand. A 6”x 4” cylindrical specimen with a 2-inch diameter hemispherical indent in the
center of the top surface was used in this test. The specimen was placed in a cavity
created in the greensand equidistant to all surfaces of the box. A 2-inch high cylindrical
cavity was created in the green sand with the top surface of the specimen as its base. The
edges of this cavity were even with the edges of the specimen. A runner was created in
the greensand leading from the edge of the box to the surface of the specimen. The lid of
the box had an opening in the center to view the specimen, as well as a notch in the side

70
through which the molten aluminum was poured. It was fastened over the opening on top
of the box using wood screws. This apparatus is shown in Figure 18.
To begin this test, 50 grams of 319 aluminum alloy was placed in a ceramic crucible and
heated to 700°C in a melting furnace. Upon reaching 700°C, the molten aluminum was
immediately removed from the furnace and poured into the runner leading to the
specimen. Observations were made through the viewing hole in the box lid and by post-
test inspection.
Figure 18: Cross section diagram of molten aluminum testing apparatus.

71
Chapter 4: Results and Discussion
Chapter 4 presents the mixture designs used in each phase and the results of experimental
data collected. Included is a discussion of all analyses and experiments performed and
their results.
4.1 Mixture Design
To reach the specified goal of creating geopolymers that are resistant to extreme heats,
the mixtures of materials going into these geopolymers had to be determined correctly. In
order to maximize the potential for heat resistance, all available materials were
considered for use in mixture designs. Practicality was an important criterion in
determining which materials could be used. For this reason, several materials that are rare
or difficult to obtain were excluded from consideration. Where available, the existing
literature was used to help guide mixture design.
4.1.1 Mixture naming convention.
Throughout the remainder of this report the mixtures follow a specific naming convention
with the following format; #X/#Y(#Z-#:#), where #X is the percentage of the first
precursor in integer form (#) followed by an abbreviation for the first precursor (X), #Y is
the percentage of the second precursor in integer form (#) followed by an abbreviation for
the second precursor (Y), #Z is the molarity of the hydroxide activator (#) followed by an
abbreviation for the type of hydroxide activator (Z), and #:# is the ratio of hydroxide to

72
silicate used in the activator solution. The abbreviations used to denote the type of
precursor or activator are shown in Table 5.
Precursor Common Name
F Class F Fly Ash
GA Aluminosilicate Glass
GB Borosilicate Glass
GC Soda-Lime Container Glass
M Metakaolin
Activator Common Name
N Sodium Hydroxide
K Potassium Hydroxide
Table 5: Precursor and activator abbreviations and their common names.
For example, 50GB/50GA(10N-1:2) is a mixture containing a precursor of 50%
borosilicate glass and 50% aluminosilicate glass with an activator of 10 molar sodium
hydroxide and sodium silicate at a ratio of 1 to 2 in solution.
4.1.2 Stoichiometric ratios.
Through previous research carried out at the University of Minnesota Duluth and a
review of the literature, it was determined that several stoichiometric ratios are important
to the formation of a robust geopolymer. These ratios are often strongly correlated and
changing one typically caused the others to change as well. These ratios were
manipulated by varying the types and proportions of materials in the precursors and
activator solutions. This complex design process was aided using an Excel spreadsheet.

73
4.1.2.1 Sodium equivalent/alumina (:;65(GH)/78659) ratio.
The sodium equivalent/alumina ratio is perhaps the most important stoichiometric ratio in
determining whether a geopolymer will be successful or not, especially in the case of
ground glass. Previous research at the University of Minnesota Duluth determined that
the sodium equivalent/alumina ratio must not exceed 2.2 for a geopolymer to perform
well [50]. The primary means of controlling this ratio is adjusting the proportions and
molar concentrations in the activator solution. It also is affected, typically to a lesser
extent, by changing the types and proportions of precursors. In determining mix designs,
a sodium equivalent/alumina ratio of 2.2 or lower was used.
4.1.2.2 Water/solids (w/s) ratio.
The water/solids (w/s) ratio is important in considering how to create geopolymers that
will not fail at high temperatures. The water in the w/s ratio includes water used in the
activator solution and any additional water needed to increase workability. The solids in
the w/s ratio include the solid precursor and any solid-state materials used in the activator
solution, such as sodium hydroxide flakes or potassium hydroxide pellets. A low
water/solids (w/s) ratio is desirable, since water expands and evaporates at high
temperatures, leading to cracking, spalling, and the production of flammable hydrogen
gasses. It also increases the number and size of pores in a geopolymer and contributes to
the formation of hydration products, both of which are detrimental to the performance of
a geopolymer at high temperatures. Taking these factors into consideration, the w/s ratio
was kept as low as possible. It was often limited by chemical stoichiometry or

74
workability. If techniques can be developed in the future that will remove water content
post-processing the w/s ratio may not be such a limiting factor in future mixture designs.
4.1.2.3 Activator/precursor ratio.
The amount of activator present per unit volume, measured by the activator/precursor
ratio contributes to the water/solids (w/s) ratio, since the activator solution contains
water. However, the amount of water it carries is typically minimal and is largely offset
by the positive effects of increasing the amount of silica-rich activator. In a study
performed by Bakri et al. (2013) it was found that increasing the activator/precursor ratio
from 0.3 to 0.4 more than doubled the compressive strength of fly ash geopolymers. This
was attributed to the increase in the silica/alumina ratio provided by the silica-rich
activator [35]. An activator/precursor ratio of 0.4 was used across all mixes for the
duration of this study
4.1.2.4 Silica/alumina (3456/78659) ratio.
Increasing the silica/alumina ratio increases the strength of a geopolymer by creating
more Si-O-Si bonds, which are stronger than Si-O-Al bonds. This can be achieved by
increasing the silicate in the activator solution and/or by using a precursor with a high
silica content, such as ground glass. In a study by Rickard, Williams, Temuujin, &
Riessen (2011) it was determined that fly ashes with a high silica/alumina ratio (≥5)
produced geopolymers with greater compressive strengths and higher dimensional
stability after heating compared to fly ashes with a low silica/alumina ratio (<2) [37]. In
the present study the silica/alumina ratio was kept as high as possible without sacrificing

75
other stoichiometric ratios. A ratio of 5 or higher was reached in all cases, except for in
the mixtures created with potassium-based activators where no silicate was added.
4.1.3 Fly ash-based mixtures.
Fly ash-based mixtures were designed largely based upon previous research and the
existing literature. Class F fly ash was chosen as the precursor for these mixtures because
of its low calcium content. Since calcium hydrates and forms hydration products that
disintegrate at high temperatures, it is desirable to have a low calcium content. Previous
studies also have shown that Class F fly ash outperforms Class C fly ash at elevated
temperatures [20, 21].
4.1.3.1 Baseline fly ash-based mixture: 100F(10N-1:1).
The baseline fly ash-based mixture, denoted 100F(10N-1:1), contained a precursor of
100% Class F fly ash with an activator comprised of 10 molar sodium hydroxide and
sodium silicate at a ratio of 1:1. Class F fly ash is considered a good precursor for high
temperature applications because of its high silica and alumina content, and relatively
low calcium content. Previous studies have shown Class F fly ash geopolymers to
perform well at high temperatures, although no studies were found that subjected them to
impulse thermal loading. The fly ash used in this study had a weight percentage of 54.8%
silica, 16.8% alumina, and 12.6% calcia.
A sodium-based activator was chosen over a potassium-based activator in the baseline
mixture because it is more readily available and less expensive, and therefore more

76
practical to use on a large scale. Calcium hydroxide was avoided due to its high calcium
content, which contributes to the formation of hydration products.
In previous research at the University of Minnesota Duluth by the Christiansen Concrete
Research Group it was determined that a solution of 10N sodium hydroxide created
successful geopolymers when used in combination with sodium silicate. This was the
molarity chosen for the sodium hydroxide in the activator solution for the baseline fly ash
mixture. In a study by Morsy, Alsayed, Alsalloum & Almusallam (2014) it was
discovered that varying the sodium hydroxide/sodium silicate ratio from 1:2 to 1:1 in
geopolymers resulted in a rise in compressive strength, followed by decreases in
compressive strength at higher values [48]. A hydroxide to silicate ratio of 1:1 was used
in creating the baseline fly ash-based mixture.
4.1.3.2 Variations of the baseline fly ash-based mixture.
Several variations of the baseline fly ash-based mixture were created to determine what
effect changing relevant variables would have on the performance at high temperatures.
Some of these variable adjustments were based on previous research and were tested to
determine if they were also valid under impulse thermal loading, and some were new
adjustments that had not been researched previously. A new mixture was created for each
of the controlling variables and only one variable was changed per new mixture so that it
was clear which variable could be correlated to the corresponding change in performance
of the material. The relevant variables that were adjusted were: activator type, molarity of
activator, and activator proportions. The type of precursor was held constant throughout

77
all of the fly ash-based mixtures, except in one special case which will be discussed in an
upcoming section. The mixtures created are shown in Table 6.
4.1.3.2.1 Activator type.
In a study by Pan & Sanjayan (2011) fly ash based geopolymers activated with sodium
hydroxide, sodium silicate, potassium hydroxide, potassium silicate, and mixtures
thereof, were exposed to elevated temperatures. It was found that potassium-based
activators increased the softening temperature, while mixing sodium and potassium
activators lowered the softening temperature [33]. To determine if this holds true under
impulse thermal loading, potassium activators were used in two of the mixtures.
However, it was found that potassium silicate was not readily available in large supply
and was prohibitively expensive for large scale projects. So, for the sake of practicality,
only potassium hydroxide was used in the activator solution. The two mixtures created
with potassium hydroxide are 100F(10K-1:1) and 100F(15K-1:1). The only difference
between these two mixtures is the molarity, which is discussed in the next section.
4.1.3.2.2 Molarity.
In a study by Bayuaji et al. (2017) it was determined that increasing the molarity of the
activator solution increases both the residual compressive strength after exposure to high
temperatures and the room temperature compressive strength [34]. To determine if this
holds true under impulse thermal loading, a mixture was created with 15N sodium
hydroxide in the activator solution. Similarly, a mixture was made with 15M potassium
hydroxide. These mixtures are denoted by 100F(15N-1:1) and 100F(15K-1:1).

78
4.1.3.2.3 Activator Proportions.
In a study by Morsy, Alsayed, Alsalloum, & Almusallam (2014) it was determined that a
sodium hydroxide to sodium silicate ratio of 1:1 performed the best when exposed to high
temperatures [48]. However, these tests were not carried out under impulse thermal
loading. To determine whether this still holds true under this load type, three new
mixtures were created with proportions above and below 1:1. These mixtures are denoted
by 100F(10N-2:1), 100F(10N-1:2), and 100F(10N-1:0).
4.1.3.2.4 Precursor Type.
In a study by Zhang, Kodur, Wu, Cao, & Qi (2015) it was found that, although a 100%
metakaolin mixture experienced high mass loss, strength loss, and thermal shrinkage
when exposed to high temperatures, it still may have beneficial properties when added to
fly ash if the amount does not exceed 25% [25]. Metakaolin has a high alumina content,
44% in this study, which increases resistance to thermal shock loading, but it also has a
high water requirement, which decreases performance at high temperatures. In order to
keep water demand down and still have a workable mixture, metakaolin content was
limited to 15%. This limit was based on previous workability research carried out at the
University of Minnesota Duluth. To determine whether the results of the study hold true
under impulse thermal loading, one mixture was created with metakaolin as a partial
replacement for fly ash in the precursor. The amount of metakaolin was limited to 10%
by weight and the activator proportions were adjusted to 2:1 due to stoichiometry
constraints. This binary mixture is denoted by 90F/10M(10N-2:1).

79
Fly Ash Mixtures Precursor Activator Molarity Activator
Proportions
100F(10N-1:1) 100F N 10 1:1
100F(15N-1:1) 100F N 15 1:1
100F(10N-2:1) 100F N 10 2:1
100F(10N-1:2) 100F N 10 1:2
100F(10N-1:0) 100F N 10 1:0
100F(10K-1:1) 100F K 10 1:0
100F(15K-1:1) 100F K 15 1:0
90F/10M(10N-2:1) 90F/10M N 10 2:1
Table 6: Variations of fly ash-based mixtures. Variables differing from the baseline
mixture are highlighted in green.
4.1.4 Ground glass-based mixtures.
No previous research was found pertaining to ground glass-based geopolymers at high
temperatures, so no literature was available to guide the design of these mixtures
specifically. Much of the design process was guided by the review of geopolymers at
high temperatures in general, as well as extensive research previously carried out by Dr.
Mary Christiansen and at the University of Minnesota Duluth by the Christiansen
Concrete Research Group on glass-based geopolymers at room temperature.
4.1.4.1 Baseline ground glass-based mixture 100GA(10N-1:1).
The baseline glass mixture, denoted 100GA(10N-1:1), contained a precursor of 100%
aluminosilicate glass with an activator comprised of 10 molar sodium hydroxide and
sodium silicate at a ratio of 1:1. Aluminosilicate glass is considered a good precursor for
high temperature applications because of its high silica and alumina content and low
calcium content. The aluminosilicate glass powder used in this study had a weight
percentage of 65.4% silica, 13.5% alumina, and 7.6% calcia.

80
A sodium-based activator was chosen over a potassium-based activator because it is more
readily available and less expensive, and therefore more practical to use on a large scale.
It is also the most commonly used activator in geopolymers. Potassium hydroxide
activators did not perform well with ground glass-based geopolymers in preliminary
testing. Calcium hydroxide was avoided due to its high calcium content, which
contributes to the formation of hydration products.
In preliminary research it was determined that a solution of 10N sodium hydroxide
created successful geopolymers at room temperature when used in combination with
sodium silicate. This was the molarity chosen for the sodium hydroxide in the activator
solution for the baseline ground glass mixture. A hydroxide to silicate ratio of 1:1 was
used in creating the baseline ground glass-based mixture as a starting point based on the
performance of fly ash-based mixtures with this ratio.
4.1.4.2 Variations of the baseline ground glass-based mixture.
Several variations of the baseline ground glass-based mixture were created to determine
what effect changing variables would have on the performance at high temperatures.
Since no research has previously been carried out on glass-based geopolymers at high
temperatures, the variables chosen were based on knowledge of the state-of-the-art of
geopolymer research at high temperatures in general, as well as extensive research
previously performed at the University of Minnesota Duluth by the Christiansen Concrete
Research Group. The variables determined to be the most relevant to high temperature
applications were precursor type, activator molarity, and activator proportions. The

81
activator type was held constant through all mixes as a result of preliminary research. The
mixtures created are shown in Table 7.
4.1.4.2.1 Molarity.
The molarity of the activator solution in one mixture was increased to 15N to determine
what effect, if any, molarity has on performance at high temperatures. This mixture is
denoted by 100GA(15N-1:1). The only variable changed from the baseline mixture is the
molarity.
4.1.4.2.2 Activator proportions.
Since no previous research has been performed on glass at high temperatures, the
behavior of fly ash geopolymers at high temperatures was used as a guideline in
determining activator proportions. Two mixes with ratios above and below the baseline
mixture were created to determine what effect activator proportions would have on
performance at high temperatures. These mixes are denoted by 100GA(10N-2:1) and
100GA(10N-1:2).
4.1.4.2.3 Precursor type.
Precursors were varied in several mixes. To directly compare the performance of
aluminosilicate and soda-lime container glass in geopolymers at high temperatures, two
mixtures were made with these two glasses where all variables were held identical except
the type of glass used. These mixes are denoted by 60F/40GA(10N-1:1) and
60F/40GC(10N-1:1). The proportions of 60% fly ash and 40% glass were made

82
necessary by the constraints of the stoichiometric ratios, which could only be
manipulated by changing precursor proportions in this case.
In addition, a binary and ternary mix were created. The binary mix incorporated
metakaolin in order to raise the alumina content, which has been shown to be beneficial
at high temperatures under thermal shock loading or quenching in fly ash geopolymers.
The amount of metakaolin was limit to 15% by workability. This mixture is denoted by
85GA/15M(10N-1:1). The ternary mixture included 10% fly ash, 10% metakaolin, and
80% aluminosilicate glass. These proportions were controlled by stoichiometric
constraints. The ternary mixture is denoted by 80GA/10F/10M(10N-1:1). All variables
except precursor type were kept consistent with the baseline mixture in both the binary
and ternary mixtures.
An additional mix containing borosilicate glass was also created. Borosilicate glass was
chosen for its usefulness in nuclear applications. This glass serves as a better criticality
control than other glasses because the boron it contains has a large neutron capture cross
section. It is also chemically stable at high temperatures and in the presence of radiation.
This type of glass is already used in immobilizing nuclear waste during the vitrification
process. It was chosen for this application due to its potential for in-situ vitrification and
nuclear waste encapsulation during a nuclear core meltdown. This mixture is denoted by
50GB/50GA(10N-1:2). The variables in this mixture were limited by stoichiometric
constraints. It was not tested in Phase 1 due to scheduling constraints but was tested and
studied in greater detail in Phase 2.

83
Ground Glass Mixtures Precursor Molarity Activator
Proportions
100GA(10N-1:1) 100GA 10N 1:1
100GA(15N-1:1) 100GA 15N 1:1
100GA(10N-2:1) 100GA 10N 2:1
100GA(10N-1:2) 100GA 10N 1:2
60F/40GA(10N-1:1) 60F/40GA 10N 1:1
60F/40GC(10N-1:1) 60F/40GC 10N 1:1
85GA/15M(10N-1:1) 85GA/15M 10N 1:1
80GA/10F/10M(10N-1:1) 80GA/10F/10M 10N 1:1
50GB/50GA(10N-1:2) 50GB/50GA 10N 1:2
Table 7: Variations of ground glass-based mixtures. Variables differing from the baseline
mixture are highlighted in green.
4.2 Phase 1 Compressive Strengths
After geopolymer mortars were mixed for each mixture, they were cast in 2”x2” molds
and cured for 24 hours at 80°C in a lab oven in a moisture rich environment. They were
then taken from the oven and placed in an environmental chamber at 23°C and 94%
relative humidity to complete the curing process. Compressive strengths were measured
at 1, 7, 28, and 56 days. Any mixtures that were below 1500psi after 28 days were
eliminated from further testing. Mortars with compressive strengths this low were
considered impractical for this application. The results of compressive strength tests for
all mixture designs are shown in Figure 19.
4.2.1 Phase 1 fly ash-based geopolymer compressive strengths.
The 100F(10N-1:1) baseline mixture performed well under compression at room
temperature. It followed the expected strength gain curve over time and reached a
compressive strength of 4760psi at 28 days. Increasing and decreasing the proportion of
sodium hydroxide to sodium silicate caused a corresponding strength gain or loss.

84
Increasing the sodium hydroxide content so that the proportions were 2:1 caused an
848psi strength loss at 28 days, while increasing the sodium silicate content so that the
proportions were 1:2 caused a 260psi strength gain. The 28-day compressive strengths of
100F(10N-2:1) and 100F(10N-1:2) were 3912psi and 5020psi, respectively. Using only
sodium hydroxide and no sodium silicate in the activator solution led to a 2644psi
strength decrease. Increasing the molarity of the sodium hydroxide in the baseline
mixture to 15N led to a corresponding drop in 28-day compressive strength of 642psi.
The compressive strengths of 100F(10N-1:0) and 100F(15N-1:1) at 28 days were 2116psi
and 4118psi respectively.
The 28-day compressive strength of the binary mixture 90F/10M(10N-2:1) was 3194psi.
This corresponds to a strength loss of 1556psi compared to the baseline mixture. This
mixture exhibited continued strength loss over time and therefore was not selected for
further study.
Both mixtures made with potassium activators, 100F(10K-1:1) and 100F(15K-1:1), fared
poorly, reaching compressive strengths of 293psi and 890psi respectively at 28 days.
Neither mixture was selected for further study, as they both fell well below the minimum
strength requirement of 1500psi.
The 28-day compressive strengths for all fly ash-based geopolymer mortars are displayed
in Table 8 and compressive strength curves are shown in Figure 20.

85
4.2.2 Phase 1 ground glass-based geopolymer compressive strengths.
The compressive strength of the 100GA(10N-1:1) baseline mixture for glass-based
geopolymers followed a behavior that was different from most fly ash-based
geopolymers. At one day the compressive strength was 1600psi before dropping to
1336psi at seven days and then rebounding to 1718 psi at 28 days. This behavior has
often been observed in glass-based geopolymers and there is no evidence of long term
effects due to this temporary strength loss. The mechanism of this behavior should be
investigated in future research.
The effects of several variables were tested to determine how they affect the performance
of ground glass-based geopolymers at high temperatures. The proportions of sodium
hydroxide to sodium silicate were varied from the baseline mixture in two alternate
mixtures, 100GA(10N-2:1) and 100GA(10N-1:2). Similar to fly ash-based geopolymers,
a strength gain of 620psi was observed when the amount of sodium silicate was increased
so that the proportions were 1:2, and a strength loss of 488psi was observed when the
amount of sodium hydroxide was increased so that the proportions were 2:1. The 28-day
compressive strengths of 100GA(10N-1:2) and 100GA(10N-2:1) were 2338psi and
1230psi respectively. Increasing the molarity of sodium hydroxide from 10N to 15N led
to a compressive strength loss of 648psi at 28 days, so that the compressive strength of
100GA(15N-1:1) was 1070psi.
Aluminosilicate glass and soda-lime container glass precursors were directly compared
by creating two mixtures where the only variable was the type of glass, 60F/40GA(10N-

86
1:1) and 60F/40GC(10N-1:1). Both mixtures displayed a significant increase in
compressive strength compared to the baseline mixture. However, the 60F/40GC(10N-
1:1) mixture exhibited significant strength loss at 7 days, falling 390psi from 5339psi at 1
day to 4949psi at 7 days, before rising to 4656 at 28 days. The compressive strengths of
60F/40GA(10N-1:1) and 60F/40GC(10N-1:1) at 28 days were 3110psi and 4656 psi
respectively.
Both the binary and ternary mixtures containing metakaolin, 85GA/15M(10N-1:1) and
80GA/10F/10M(10N-1:1), had compressive strengths below the 1500psi threshold, at
419psi and 917psi respectively, and were not considered for further study.
The 28-day compressive strengths for all ground glass-based geopolymer mortars are
displayed in Table 8 and compressive strength curves are shown in Figure 21.
Fly Ash Mixtures Compressive
Strength (psi) Ground Glass Mixtures
Compressive
Strength (psi)
100F(10N-1:1) 4760 100GA(10N-1:1) 1718
100F(15N-1:1) 4118 100GA(15N-1:1) 1070
100F(10N-2:1) 3912 100GA(10N-2:1) 1230
100F(10N-1:2) 5020 100GA(10N-1:2) 2338
100F(10N-1:0) 2116 60F/40GA(10N-1:1) 3110
100F(10K-1:1) 293 60F/40GC(10N-1:1) 4656
100F(15K-1:1) 890 85GA/15M(10N-1:1) 419
90F/10M(10N-2:1) 3194 80GA/10F/10M(10N-1:1) 979
Table 8: Compressive strengths, in psi, of all Phase 1 geopolymer mortars at 28 days.
4.2.3 Discussion of Phase 1 geopolymer compressive strengths.
Several observations can be made regarding the effects of different variables on the room
temperature compressive strengths of Phase 1 geopolymers. Some of these effects are

87
apparent throughout all mixtures, while some are specific to precursor type. In all
mixtures, increasing the proportion of sodium silicate in the precursor solution
corresponded to an increase in compressive strength. Mixtures that used a larger
proportion of sodium hydroxide or increased the concentration of sodium hydroxide did
not fare as well. This was also true of mixtures that solely contained potassium hydroxide
activator. This suggests that a higher silica/sodium ratio leads to a higher compressive
strength in both fly ash and ground glass-based geopolymers. Sodium/alumina and
silica/alumina ratios do not appear to be correlated to compressive strength. Several
stoichiometric ratios are shown for each mixture design in Table 9. All mixtures that
fared well have a silica/sodium ratio of 6.2 or higher. Although the silica/alumina ratio of
the most successful mixtures is generally high, as can be expected if the silica/sodium
ratio is high, there are also mixtures that did not perform well with high silica/alumina
ratios. It does not appear that the weight percent of silica or sodium alone plays a
significant role, as all mixtures have comparable amounts of each and the differences that
exist do not correlate to differences in compressive strength. This also appears to be true
of the weight percent of alumina and calcium.
This behavior suggests that there may be free unreacted sodium ions in mixtures with
higher amounts of sodium, while mixtures with higher amounts of silica have a higher
degree of geopolymerization. With higher proportions of silica more of the sodium ions
can react, increasing the amount of O-Si-O bonds and strengthening the geopolymer. A
smaller number of free sodium ions also may lead to a stronger matrix, since unreacted
ions may act as inclusions and create discontinuities in the matrix. A greater number of

88
O-Si-O bonds combined with a smaller number of free ions may lead to a stronger matrix
in the microstructure.
There are two anomalous mixtures, 85GA/15MK(10N-1:1) and 80GA/10F/10MK(10N-
1:1), that did not fare well even though their silica/sodium ratios are high, but these
mixtures both contain metakaolin. Considering none of the five mixtures containing
metakaolin fared well, this decrease in compressive can be attributed to the metakaolin
present in the precursor.
The lower compressive strengths associated with the inclusion of metakaolin in mixtures
may be due to several factors. Metakaolin generally reacts at a faster rate than other
precursors like fly ash. The differing rates of reaction may lead to a buildup of internal
stresses, causing metakaolin-based phases to separate from fly ash or ground glass-based
phases. This would explain the continued strength loss over time in 90F/10MK(10N-2:1),
as the slow reacting fly ash gains a higher degree of geopolymerization over time and has
a corresponding phase separation. Differing degrees or timelines of shrinkage or
expansion between the precursors may also produce a similar effect. It may also be that
metakaolin and ground glass do not mix well or bond well, as none of the ground glass-
based mixtures that contained metakaolin fared well. Further study of the microstructure
is required to gain a more complete understanding.

89
Mixture Silica/Alumina Sodium/Alumina Silica/Sodium
100F(10N-1:1) 6.1 0.9 6.6
100F(15N-1:1) 6.1 1.1 5.7
100F(10N-1:0) 5.6 1.2 4.7
100F(10N-2:1) 5.9 1.0 5.8
100F(10N-1:2) 6.3 0.8 7.5
90F/10MK(10N-2:1) 5.1 0.9 6.0
85F/15MK(10K-1:0) 4.4 2.0 2.3
85F/15MK(15K-1:0) 4.4 2.0 2.3
100GA(10N-1:1) 9.0 1.5 6.2
100GA(15N-1:1) 9.0 1.6 5.6
100GA(10N-2:1) 8.7 1.6 5.6
100GA(10N-1:2) 9.2 1.3 6.9
85GA/15MK(10N-1:1) 6.5 1.0 6.4
80GA/10F/10MK(10N-1:1) 6.9 1.1 6.4
40F/60GA(10N-1:1) 7.1 1.1 6.4
40F/60GC(10N-1:1) 10.9 2.0 5.5
Table 9: Stoichiometric ratios of Phase 1 mixture designs.

90
Figure 19: Compressive strengths of all geopolymer mortars designed in Phase 1.
0
1000
2000
3000
4000
5000
6000
0 7 14 21 28 35 42 49 56
Co
mp
ress
ive
Str
ength
(p
si)
Curing Time (Days)
Phase 1 Geopolymer Mortar Compressive Strengths
100F(10N-1:1) 100F(15N-1:1) 100F(10N-1:0) 100GA(10N-1:1)
85GA/15M(10N-1:1) 60F/40GA(10N-1:1) 80GA/10F/10M(10N-1:1) 100F(10K-1:0)
100F(15K-1:0) 100GA(15N-1:1) 100F(10N-2:1) 100F(10N-1:2)
100GA(10N-2:1) 100GA(10N-1:2) 90F/10M(10N-2:1) 60F/40GC(10N-1:1)

91
Figure 20: Compressive strengths of all fly ash-based geopolymer mortars designed in Phase 1.
0
1000
2000
3000
4000
5000
6000
0 7 14 21 28 35 42 49 56
Com
pre
ssiv
e S
tren
gth
(p
si)
Curing Time (Days)
Phase 1 Fly Ash-Based Geopolymer Mortar Compressive Strengths
100F(10N-1:1) 100F(15N-1:1) 100F(10N-1:0) 100F(10K-1:0)
100F(15K-1:0) 100F(10N-2:1) 100F(10N-1:2) 90F/10M(10N-2:1)

92
Figure 21:Compressive strengths of all glass-based geopolymer mortars designed in Phase 1.
0
1000
2000
3000
4000
5000
6000
1 8 15 22 29 36 43 50 57
Com
pre
ssiv
e S
tren
gth
(p
si)
Curing Time (Days)
Phase 1 Glass-Based Geopolymer Mortar Compressive Strengths
100GA(10N-1:1) 85GA/15M(10N-1:1) 60F/40GA(10N-1:1) 80GA/10F/10M(10N-1:1)
100GA(15N-1:1) 100GA(10N-2:1) 100GA(10N-1:2) 60F/40GC(10N-1:1)

93
Figure 22: Compressive strengths of geopolymer mortars made with mixtures chosen for Phase 2.
0
1000
2000
3000
4000
5000
6000
0 7 14 21 28 35 42 49 56
Com
pre
ssiv
e S
tren
gth
(p
si)
Curing Time (Days)
Phase 1 Geopolymer Mortar Mixtures Selected for Phase 2
100F(10N-1:1) 100GA(10N-1:1) 60F/40GA(10N-1:1) 100F(10N-1:2) 100GA(10N-1:2)

94
4.3 Phase 1 Thermal Durability Testing
In Phase 1, eleven different geopolymer mixes were chosen to be evaluated for resilience
in high temperature applications. All specimens were tested at 28 days. This phase was
designed to eliminate any unsuitable mixtures before devoting resources to study them in
more depth. Preliminary research determined that an impulse thermal load was more
damaging to the materials than a ramped thermal loading, so it was chosen as the loading
condition, since it was the worst-case scenario. Specimens were exposed to temperatures
of 600°C and 1100°C under this loading condition in separate tests.
4.3.1 Phase 1 thermal durability testing at 600°C.
Four geopolymer mortars from each mixture design were cast in 2”x2” cubes, cured, and
exposed impulse thermal loading at 600°C. After reaching thermal equilibrium over the
course of one hour in a muffle furnace, half of the cubes were quenched in room
temperature water and the other half were air cooled at room temperature. The
compressive strengths of all quenched and air-cooled specimens were then measured and
recorded. The 28-day compressive strengths at room temperature, after heating to 600°C,
and after quenching in room temperature water are shown in Figure 23 and Table 10. The
gains and losses in compressive strength due to heating and quenching are shown in
Figure 24 and Table 10.

95
Compressive
Strength (psi) 28 Days
After
600°C
Exposure
After
Quench
Δ Due to
Heating
Δ Due to
Quench
100F(10N-1:1) 4720 3178 2975 -1542 -203
100F(10N-1:2) 5020 3389 2540 -1631 -849
100F(10N-2:1) 3913 2568 2568 -1345 0
100F(10N-1:0) 2116 3261 1466 1145 -1795
100F(15N-1:1) 4118 3096 1601 -1022 -1495
90F/10M(10N-2:1) 3194 3180 2800 -14 -380
100GA(10N-1:1) 1718 2453 2139 735 -43
100GA(10N-1:2) 2338 2648 2395 310 -253
100GA(10N-2:1) 1230 1449 1159 219 -290
60F/40GA(10N-1:1) 3110 3277 2056 167 -1221
60F/40GC(10N-1:1) 4656 3357 2844 -1299 -513
Table 10: Compressive strengths of Phase 1 geopolymer mortars after exposure to 600°C
and quenching.
4.3.2 Phase 1 thermal durability testing at 1100°C.
Two cubes of each geopolymer mix design were also subjected to impulse thermal
loading at 1100°C in a muffle furnace. After allowing them to come to thermal
equilibrium over the course of an hour, they were removed from the furnace and allowed
to cool at room temperature. Qualitative observations were then made pertaining to
visible porosity, malleability, thermal expansion, and deformation shape. Compressive
strength tests could not be performed on many samples due to excessive deformation that
occurred upon heating.
The 100F(10N-1:1) baseline fly ash mixture appeared to have excellent dimensional
stability, outperforming any other mixture in this respect. It appeared the same as when it

96
Figure 23: Compressive strengths of Phase 1 geopolymer mortars at room temperature at 28 days (blue), after heating to 600°C
(orange), and after quenching (gray).
0
1000
2000
3000
4000
5000
6000
Com
pre
ssiv
e S
tren
gth
(p
si)
Compressive Strength After Heating and Quenching
28 Day Strength Heated Quenched
100F(10N-1:1) 100F(10N-1:2) 100F(10N-2:1) 100F(10N-1:0) 100F(15N-1:1) 90F/10M(10N-2:1) 100GA(10N-1:1) 100GA(10N-1:2)
Fly Ash-Based Ground Glass-Based Mixed

97
Figure 24: Compressive strength gains and losses after heating (orange) and quenching (blue) Phase 1 geopolymer mortars.
-2800
-2300
-1800
-1300
-800
-300
200
700
1200
1700
Δ C
om
pre
ssiv
e S
tren
gth
(p
si)
Compressive Strength Gain/Loss Due to Heating and Quenching
Heating Quenching

98
entered the furnace, albeit lighter in color. The appearance after exposure to 1100°C is
shown in Figure 25.
Figure 25: 100F(10N-1:1) after exposure to 1100°C.
It exhibited no visible cracking beyond what was already present before heating and its
porosity appeared to be lower than any other mixture. The porosity is visible in Figure 26
(black pieces are parts of the pan that held the specimens).
Figure 26: Surface condition and visible porosity of 100F(10N-1:1).

99
The 100F(10N-1:0) mixture exhibited less dimensional stability than the fly ash-based
baseline mixture, and some porosity was visible on the surface. The appearance is
displayed in Figure 27.
Figure 27: 100F(10N-1:0) after exposure to 1100°C.
Bulging was visible on the finished face and large cracks were visible on the cube edges.
This is displayed in Figure 28.
Figure 28: Cracks visible on 100F(10N-1:0) after exposure to 1100°C.

100
This mixture was also more porous than the baseline mixture, as shown in Figure 29.
Figure 29: Surface conditions and visible porosity in 100F(10N-1:0).
100GA(10N-1:1) flowed more easily than any other mixture. It appeared to have
deformed and “melted” to a degree. This is apparent in its appearance after exposure to
1100°C, shown in Figure 30.
Figure 30: 100GA(10N-1:1) after exposure to 1100°C.
There was some porosity visible on the surface of the specimens, and it appeared to be
the most porous of any mixture. This is exhibited in Figure 31.

101
Figure 31: Surface conditions and visible porosity in 100GA(10N-1:1).
60F/40GA(10N-1:1) showed fair dimensional stability. The top and bottom surfaces were
bowed in and showed signs of thermal shrinkage. The sides bulged out and showed signs
of thermal shrinkage followed by thermal expansion. Shrinkage cracks were visible on all
surfaces. Figure 32 shows the appearance of 60F/40GA(10N-1:1) after exposure to
1100°C.
Figure 32: 60F/40GA(10N-1:1) after exposure to 1100°C.
Specimens made with this mixture appeared to have fairly low porosity, second only to
the baseline fly ash mixture 100F(10N-1:1). The visible porosity is shown in Figure 33.

102
Figure 33: Surface conditions and visible porosity in 60F/40GA(10N-1:1).
60F/40GC(10N-1:1) exhibited slightly less dimensional stability than the baseline fly ash
mixture with slight bulging on all sides. This is shown in Figure 34.
Figure 34: 60F/40GC(10N-1:1) after exposure to 1100°C.
This mixture appears to have high porosity, second only to the baseline glass-based
mixture 100GA(10N-1:1) and small surface pores were visible. The visible porosity is
shown in Figure 35.

103
Figure 35: Surface conditions and visible porosity in 40F/60GC(10N-1:1).
4.3.3 Discussion of Phase 1 high temperature durability tests.
The results of the high temperature durability tests at 600°C and 1100°C were compared
against one another and used to determine which mixtures would be selected to be
studied in more detail in Phase 2. It was clear from the results that all mixtures exhibited
plasticity and could be deformed by physical pressure, to varying degrees, at 1100°C.
Some mixture designs exhibited negative plasticity, particularly the fly ash-based
mixtures, and some exhibited positive plasticity, particularly the ground glass-based
mixtures. This suggests that fly ash-based mixtures are well suited for structural
applications, while ground glass-based mixtures are better suited for other functions, such
as a barrier to the transport of nuclear waste material.

104
4.3.3.1 Fly ash-based geopolymer high temperature durability tests.
The six fly ash mixtures tested in Phase 1 were: 100F(10N-1:1), 100F(10N-1:2),
100F(10N-2:1), 100F(10N-1:0), 100F(15N-1:1), and 90F/10M(10N-2:1).
100F(10N-1:1) lost 1525psi upon heating to 600°C and 203psi upon quenching.
100F(10N-1:2) lost a similar amount, 1631psi, upon heating to 600°C and slightly more,
849psi, upon quenching. However, the initial compressive strength of 100F(10N-1:2) was
higher than that of 100F(10N-1:1), at 5020psi compared to 4720psi. These similarities in
behavior warranted further study, and it was decided that both mixtures would move on
to Phase 2 to be studied in greater detail. In addition, the baseline 100F(10N-1:1) mixture
exhibited excellent dimensional stability and low porosity upon heating to 1100°C.
100F(10N-2:1) lost 1345psi upon heating to 600°C, which is slightly lower than the
previously mentioned mixtures. However, the initial compressive strength is significantly
lower than either of those mixtures, at 3913psi. The behavior upon heating was not
considered beneficial enough in comparison to other fly ash mixtures to offset the
reduction in initial compressive strength, and this mixture was eliminated from further
study
100F(10N-1:0) gained 1145 psi upon heating to 600°C and lost 1795psi upon quenching.
Although this was the highest loss due to quenching, it was also the highest strength gain
upon heating to 600°C. Unfortunately, this mixture exhibited excessive cracking upon
heating to 1100°C and had to be eliminated from further study. It also exhibited less

105
dimensional stability and higher visible porosity than the baseline mixture when heated to
1100°C.
100F(15N-1:1) lost 1022psi upon heating to 600°C and lost 1495psi upon quenching,
resulting in a net compressive strength loss of 2517psi, the highest of any geopolymer
tested. Considering this mixture also had a lower initial strength than the baseline
mixture, at 4118psi, it was concluded that there was no benefit to increasing the molarity
of the activator solution from 10 to 15, and this mixture was eliminated from further
study.
The 90F/10M(10N-2:1) mixture was eliminated from further testing after compressive
strength tests at 56 days confirmed a continuous loss in compressive strength over time at
room temperature.
Overall, two fly ash-based mixtures were selected for further study in Phase 2. These
were the baseline 100F(10N-1:1) mixture and the 100F(10N-1:2) mixture.
4.3.3.2 Ground glass-based geopolymer high temperature durability tests.
The five ground glass-based mixtures tested in Phase 1 were: 100GA(10N-1:1),
100GA(10N-1:2), 100GA(10N-2:1), 60F/40GA(10N-1:1), and 60F/40GC(10N-1:1). All
mixtures containing aluminosilicate glass gained strength upon heating.
100GA(10N-1:1) gained 735psi upon heating to 600°C and lost 43psi upon quenching,
for a net gain of 693psi. 100GA(10N-1:2) gained 310 psi upon heating to 600°C and lost
253psi upon quenching, for a net gain of 57psi. However, the initial compressive strength

106
of 100GA(10N-1:2) was 620psi higher than that of 100GA(10N-1:1), leaving the residual
compressive strength nearly the same for both mixtures after heating and quenching. This
similarity in behavior warranted further investigation, and both mixtures were selected
for further study in Phase 2.
Upon heating to 1100°C, 100GA(10N-1:1) exhibited semifluid behavior and began to
“flow” to a degree. This provides potential for its use in the vitrification and
encapsulation of corium, a process already used to immobilize nuclear waste. This
formulation could potentially be used in composite with a more dimensionally stable
mixture to capture and immobilize the molten corium.
100GA(10N-2:1) gained 219psi upon heating to 600°C and lost 290psi upon quenching,
for a net loss of 71psi. Considering that the initial compressive strength of this mixture
was lower than that of the previously mentioned glass-based mixtures, and it had a net
loss in compressive strength, it was eliminated from further study. No benefits were
found in increasing the amount of sodium hydroxide.
60F/40GA(10N-1:1) and 60F/40GC(10N-1:1) were developed to directly compare an
aluminosilicate glass against a soda-lime container glass. 60F/40GA(10N-1:1) gained
167psi upon heating to 600°C and lost 1221psi upon quenching. 60F/40GC(10N-1:1) lost
1299psi upon heating to 600°C and lost an additional 513psi upon quenching. Upon
heating to 1100°C 60F/40GA(10N-1:1) showed fair dimensional stability and low visible
porosity, second only to the baseline fly ash-based mixture. 60F/40GC(10N-1:1)
exhibited slightly less dimensional stability and the second highest visible porosity of all

107
mixes tested. Since 60F/40GC(10N-1:1) showed a significant strength loss upon heating
and had a high visible porosity, while 60F/40GA(10N-1:1) had a strength gain upon
heating and low visible porosity, 60F/40GA(10N-1:1) was selected for further study,
while 60F/40GC(10N-1:1) was not.
Overall, three ground glass-based mixtures were selected for further study in Phase 2.
They were 100GA(10N-1:1), 100GA(10N-1:2), and 60F/40GA(10N-1:1).
4.3.3.3 Mixtures selected for further study in Phase 2.
Two fly ash-based mixtures and three ground glass-based mixtures were selected for
further study in Phase 2. They were 100F(10N-1:1), 100F(10N-1:2), 100GA(10N-1:1),
100GA(10N-1:2), and 60F/40GA(10N-1:1).
4.4 Phase 2 High Temperature Thermal Durability Tests
In Phase 2, the five mixtures selected for further study in round one were subjected to a
more detailed study of their resiliency at high temperatures. All specimens were tested
after curing for 28 days. Specimens were exposed to ramped and impulse thermal loading
in separate tests at temperatures of 300°C, 600°C, 900°C, and 1100°C.
4.4.1 Impulse thermal loading tests.
For the impulse thermal loading tests, 16 specimens were made from each of the five
mixture designs in 2”x2” cube molds. After curing for 28 days, 16 specimens of one
mixture design were removed from the environmental chamber for testing. The muffle
furnace was preheated to 300°C and four specimens were quickly placed inside it,

108
exposing them to a 278+°C temperature change in less than three seconds. They were
then allowed to reach thermal equilibrium inside the muffle furnace over the course of an
hour. Two samples were then removed and allowed to cool at room temperature and the
other two were quenched in water for one-half hour. This process was repeated at 600°C,
900°C, and 1100°C. The heating regimen for the impulse thermal loading tests is shown
in Figure 36. The entire process was carried out on all five mixture designs and residual
compressive strength tests were performed on all specimens.
Figure 36: Impulse thermal loading regimen for Phase 2 geopolymers.
In addition to the five mixtures selected from Phase 1, a Type 1 ordinary portland cement
(OPC) mortar mixture and a calcium aluminate cement (CAC) mixture were used as
reference materials and tested in the same manner. Also, a mixture was tested that was
composed of 50% borosilicate glass and 50% aluminosilicate glass with an activator of
10 molar sodium hydroxide and sodium silicate at a ratio of 1:2. The proportions were
determined based on stoichiometry, as previously mentioned. Borosilicate glass is used in
the vitrification and immobilization of nuclear waste in many modern processes. The
300
600
900
1100
0
200
400
600
800
1000
1200
0 1 2 3 4
Tem
per
ature
(C
)
Time (hr)
Impulse Loading Phase 2
Furnace Heating 1/4 of Samples Heating

109
residual compressive strengths of the materials after being subject to impulse thermal
loading is shown in Figure 41 and Table 11.
Residual Compressive Strength After Impulse Thermal Loading (psi)
Mixture 22°C 300°C 600°C 900°C 1100°C
100F(10N-1:1) 4138 6949 3384 349 859
100F(10N-1:2) 2988 2981 1870 794 1053
100GA(10N-1:1) 2909 4060 2991 460 0
100GA(10N-1:2) 4259 5876 3985 379 220
50F/50GA(10N-1:2) 1816 3091 2163 254 96
50GA/50GB(10N-1:2) 2706 3339 1974 324 145
OPC 3443 3011 2288 499 296
CAC 2951 3503 1848 1754 1446
Table 11: Residual compressive strength after exposure to impulse thermal loading.
4.4.1.1 OPC and CAC exposed to impulse thermal loading.
OPC was used as the control mixture because it is currently being used in the basemat of
most nuclear power plants. CAC was also used for comparison to the geopolymer
mixtures since it is a refractory cement specifically used in high temperature applications.
CAC gained strength upon exposure to 300°C, although of a relatively small magnitude,
rising from 2951psi to 3503psi for a gain of 552psi, while OPC lost 432psi, falling from
3443psi to 3011psi. At this temperature CAC began to show signs of cracking, as shown
in Figure 37. Both OPC and CAC lost strength upon exposure to 600°C falling to 2288psi
and 1848 psi respectively. Although the compressive strength was higher in CAC at this
temperature, it fractured completely, while OPC began to show signs of macrocracking.
The progression of visible cracking from 300°C to 1100°C in CAC and OPC is shown in
Figure 37. Upon exposure to 900°C CAC showed a similar strength loss as exposure to
600°C, falling to 1754psi, while OPC showed a significant strength loss, falling to

110
499psi. This corresponded to significant cracking in both mixtures. Both mixtures lost a
similar amount of strength upon exposure to 1100°C as at 900°C with OPC falling to
296psi and CAC falling to 1446psi. Both mixtures had significant cracking at this
temperature, with OPC also exhibiting significant signs of spalling. The progression of
residual compressive strength gains and losses is shown in Figure 42.
Figure 37: CAC (top) and OPC (bottom) upon exposure to impulse thermal loading at,
from left to right, to 300°C, 600°C, 900°C, and 1100°C.
4.4.1.2 Fly ash-based geopolymers exposed to impulse thermal loading.
There was a significant difference in compressive strength between the fly ash-based
mixtures tested in Phase 2 when exposed to impulse thermal loading. 100F(10N-1:1)
gained 2811psi, from 4138psi to 6949psi, upon exposure to 300°C, while 100F(10N-1:2)
had a lower initial strength, 2988psi, and maintained relative stability, falling 8psi to
2981, upon exposure to the same temperature. The strength of both mixtures decreased
upon exposure to 600°C and 900°C. 100F(10N-1:1) fell in a fairly linear manner to
3384psi at 600°C and to a low of 349psi at 900°C. 100F(10N1:2) fell to 1870psi and

111
749psi at these temperatures, respectively. At 1100°C, both 100F(10N-1:1) and
100F(10N-1:2) gained strength, reaching 859psi and 1053 psi respectively. Neither
mixture showed signs of macrocracking, although thermal expansion was apparent at
900°C and shrinkage at 1100°C, as shown in Figure 38. The change in residual
compressive strengths with temperature of fly ash-based mixtures is shown in Figure 43.
Figure 38: 100F(10N-1:1) (top) and 100F(10N-1:2) (bottom) upon exposure to impulse
thermal loading at, from left to right, to 300°C, 600°C, 900°C, and 1100°C.
Both fly ash-based mixtures exhibit mildly elastic behavior, as they could be deformed by
metal tongs upon removal from the muffle furnace if sufficient force was applied. Upon
cooling the specimens became rigid again.
4.4.1.3 Ground glass-based geopolymers exposed to impulse thermal loading.
All of the ground glass-based mixtures exhibited similar strength curves upon exposure to
impulse thermal loading. 100GA(10N-1:2) exhibited the greatest overall compressive

112
strength. Upon exposure to 300°C all mixtures gained strength. From 300°C to 900°C all
mixtures exhibited continued strength loss, falling under 1000psi. The rate of strength
loss appeared to increase with increased temperatures. 100GA(10N-1:1) exhibited the
highest residual compressive strength, 460psi, at 900°C. However, it fell to 0psi at
1100°C. All mixtures continued to lose strength upon exposure to 1100°C, with
100GA(10N-1:2) having the highest compressive strength at 220psi. The residual
compressive strength gains and losses with temperature are shown in Figure 44.
None of the mixtures exhibited signs of macrocracking upon exposure to impulse thermal
loading. Rather, they exhibited elastic behavior and began to flow, starting at 900°C and
continuing to deform to a greater degree at 1100°C. The largest amount of deformation
took place in 100GA(10N-1:1), followed by, in order of most to least, 100GA(10N-1:2),
50GA/50GB(10N-1:2), and 50F/50GA(10N-1:2). The changes in macrostructure with
exposure to impulse thermal loading at 300°C, 600°C, 900°C, and 1100°C are shown in
Figure 39, and Figure 40.
Figure 39: 50F/50GA(10N-1:2) upon exposure to impulse thermal loading at, from left to
right, to 300°C, 600°C, 900°C, and 1100°C.

113
Figure 40: 100GA(10N-1:1) (top) and 100GA(10N-1:2) (bottom) upon exposure to
impulse thermal loading at, from left to right, 300°C, 600°C, 900°C, and 1100°C.
4.4.2 Quenching after impulse thermal loading.
Half of the specimens exposed to impulse thermal loading were quenched in water to
determine their resiliency to thermal shock. Immediately upon removal from the muffle
furnace they were quickly weighed and set in room temperature water. After one-half
hour the specimens were removed from the water, allowed to dry, and their compressive
strengths were measured. The residual compressive strengths after exposure to impulse
thermal loading and quenching of all Phase 2 mixtures at 300°C, 600°C, 900°C, and
1100°C is shown in Figure 50 and Table 12.
4.4.2.1 Quenching OPC and CAC after exposure to impulse thermal loading.
The residual compressive strengths after exposure to impulse thermal loading and
quenching of OPC and CAC at 300°C, 600°C, 900°C, and 1100°C is shown in Figure 51.
The residual compressive strength curve for OPC after exposure to impulse thermal
loading and quenching followed much the same behavior as the unquenched sample up to

114
Figure 41: Residual compressive strengths of all Phase 2 mixtures after exposure to impulse thermal loading.
0
1000
2000
3000
4000
5000
6000
7000
8000
RT 300 600 900 1100
Co
mp
ress
ive
Str
ength
(p
si)
Temperature (°C)
Residual Compressive Strength After Impulse Thermal Loading
100F(10N-1:1) 100F(10N-1:2) 100GA(10N-1:1) 100GA(10N-1:2)
50F/50GA(10N-1:1) OPC 50GA/50GB(10N-1:2) CAC

115
Figure 42: Residual compressive strengths of OPC and CAC mixtures after exposure to impulse thermal loading.
0
1000
2000
3000
4000
5000
6000
7000
8000
RT 300 600 900 1100
Co
mp
ress
ive
Str
ength
(p
si)
Temperature (°C)
Residual Compressive Strength After Impulse Thermal Loading
OPC CAC

116
Figure 43: Residual compressive strengths of Phase 2 fly ash-based mixtures after exposure to impulse thermal loading.
0
1000
2000
3000
4000
5000
6000
7000
8000
RT 300 600 900 1100
Co
mp
ress
ive
Str
ength
(p
si)
Temperature (°C)
Residual Compressive Strength After Impulse Thermal Loading
100F(10N-1:1) 100F(10N-1:2)

117
Figure 44: Residual compressive strengths of Phase 2 ground glass-based mixtures after exposure to impulse thermal loading.
0
1000
2000
3000
4000
5000
6000
7000
8000
RT 300 600 900 1100
Co
mp
ress
ive
Str
ength
(p
si)
Temperature (°C)
Residual Compressive Strength After Impulse Thermal Loading
100GA(10N-1:1) 100GA(10N-1:2) 50F/50GA(10N-1:1) 50GA/50GB(10N-1:2)

118
Residual Compressive Strength After Impulse Thermal Loading and Quenching (psi)
Mixture 22°C 300°C 600°C 900°C 1100°C
100F(10N-1:1) 3586 6723 3284 348 830
100F(10N-1:2) 2898 1756 2598 596 1011
100GA(10N-1:1) 2776 3561 3155 0 0
100GA(10N-1:2) 4068 5675 3761 258 133
50F/50GA(10N-1:2) 1763 2890 1985 245 81
50GA/50GB(10N-1:2) 2359 3590 2266 314 73
OPC 3394 2745 1751 0 0
CAC 2738 1450 1533 1513 1553
Table 12: Residual compressive strength after exposure to impulse thermal loading and
quenching.
600°C, with slightly lower compressive strengths in the quenched samples. The major
difference occurred at 900°C and 1100°C. At 900°C there was a violent steam explosion
upon quenching in water and the specimen broke into multiple pieces. At 1100°C the
specimen completely disintegrated, turning into a powder with small cement pieces
intermingled. Complete fracture also occurred earlier, at 600°C, and some cracking was
visible at 300°C. The progression of the macrostructure upon quenching after impulse
thermal loading at 300°C, 600°C, 900°C, and 1100°C is shown in Figure 45.
Figure 45: OPC upon exposure to impulse thermal loading and quenching at, from left to
right, 300°C, 600°C, 900°C, and 1100°C.
The behavior of the quenched CAC specimens was different than that of the unquenched
specimens. Rather than gaining strength before losing it and remaining steady, it dropped
from 2738psi to 1450psi at 300°C before remaining relatively stable around 1500psi for

119
the remainder of the testing. This means there was a strength loss of 2053psi in CAC at
300°C due to quenching. In general, quenching resulted in a loss of compressive strength
not exceeding 315psi, with the exception of 1100°C where it gained 106psi. Small
amounts of visible cracking were observed at 300°C, slightly increasing at 600°C. At
900°C complete fracture occurred, followed by complete fracture and erosion of material
at 1100°C. These effects are shown in Figure 46.
Figure 46: : CAC upon exposure to impulse thermal loading and quenching at, from left
to right, 300°C, 600°C, 900°C, and 1100°C.
4.4.2.2 Quenching fly ash-based mixtures after impulse thermal loading.
The residual compressive strength curve for both of the fly ash-based geopolymers upon
quenching is very similar to that of the unquenched samples, except in 100F(10N-1:2) at
300°C. The strength of the quenched samples is consistently lower than the unquenched
samples, but by no more than 551psi in 100F(10N-1:1). In 100F(10N-1:2), there was a
loss of 1225psi at 300°C and 728psi at 900°C. The residual compressive strengths of both
fly ash-based geopolymers after exposure to impulse thermal loading and quenching is
shown in Figure 52. Strength gains and losses due to quenching are shown in Table 13.
Both fly ash-based mixtures showed good dimensional stability, but exhibited some
thermal expansion at 900°C, followed by shrinkage at 1100°C. Surface microcracks
began to form at 600°C and 900°C, but disappeared at 1100°C when shrinkage occurred.

120
These cracks never appeared to penetrate deeply into the surface. At 300°C a thin layer of
effervescence was observed in both mixture designs, suggesting that some leaching
occurred while submerged. This was not the case at any of the higher temperatures. These
effects are visible in Figure 52.
Figure 47: 100F(10N-1:1) (top) and 100F(10N-1:2) (bottom) upon exposure to impulse
thermal loading and quenching, from left to right, 300°C, 600°C, 900°C, and 1100°C.
4.4.2.3 Quenching glass-based mixtures after impulse thermal loading.
The residual compressive strength of ground glass-based geopolymers after quenching
was very similar to that of unquenched specimens after exposure to the same
temperatures under impulse thermal loading. The residual compressive strengths of
ground glass-based geopolymers after exposure to impulse thermal loading and
quenching at all tested temperatures is shown in Figure 53. Generally, the compressive
strength of the quenched specimen was no more than 449psi lower than that of the
unquenched, although there were a few special cases where this was not true. There were

121
strength increases at 300°C and 600°C in 50GA/50GB(10N-1:2), although none of these
strength increases exceeded 293 psi. Strength gains and losses upon quenching are shown
in Table 13 and Figure 53.
Both 100% aluminosilicate glass mixtures exhibited similar physical characteristics to
their unquenched counterparts. The only difference was that a thin film of effervescence
was observed on the 100GA(10N-1:1) specimens exposed to 300°C and 600°C,
suggesting minor leaching may have occurred while quenching in water. These
characteristics are exhibited in Figure 48.
Similarly, both 50GA/50GB(10N-1:2) and 50F/50GA(10N-1:2) exhibited similar
characteristics to their unquenched counterparts, with the exception of small amounts of
visible effervescence in the specimens exposed to 300°C. This is shown in Figure 49.
Figure 48: 100GA(10N-1:1) (top) and 100GA(10N-1:2) (bottom) upon exposure to
impulse thermal loading and quenching at, from left to right, 300°C, 600°C, 900°C, and
1100°C .

122
Figure 49: 50F/50GA(10N-1:2) upon exposure to impulse thermal loading and quenching
at, from left to right, 300°C, 600°C, 900°C, and 1100°C .
Gains/Losses in Compressive Strength After Impulse Loading and Quenching (psi)
Mixture 22°C 300°C 600°C 900°C 1100°C
100F(10N-1:1) -551 -226 -100 -1 -29
100F(10N-1:2) -90 -1225 -224 -728 -42
100GA(10N-1:1) -133 -499 164 -460 0
100GA(10N-1:2) -191 -201 -224 -121 -87
50F/50GA(10N-1:2) -54 -201 -178 -9 -15
50GA/50GB(10N-1:2) -384 251 293 -10 -73
CAC -214 -2053 -315 -241 106
OPC -49 -266 -536 -499 -296
Table 13: Change in residual compressive strength due to quenching after exposure to
impulse thermal loading and quenching.
4.4.2.4 Mass loss upon exposure to impulse thermal load.
All samples experience mass loss upon exposure to impulse thermal loading at all
temperatures. To measure mass loss, specimens were weighed before entering and again
after exiting the muffle furnace. These results are shown in Figure 54. Specimens with
pieces missing or metal scale fused to them were not included in the measurements, so
some data points are not available. All of the geopolymer mixtures lost approximately the
same amount of mass at higher temperatures as they did at 300°C on a consistent basis.
Although additional mass loss was observed with increasing temperatures, it was always
less than one percent for a 300°C increase in temperature. The mass lost generally ranged

123
from 4-7%, depending on the mixture, but each mixture consistently lost the same
amount of mass regardless of temperature. This is likely due to the evaporation of
evaporable water deposited on the specimens in the environmental chamber during the
curing process. OPC lost a similar amount of mass upon exposure to 300°C but continued
to experience additional mass loss as the temperature rose. This additional mass loss is
likely due to the dehydration and decomposition of hydration products, which
corresponds to its continued strength loss. CAC experienced more mass loss than OPC
upon exposure to 600°C and continued to lose mass at a similar rate to OPC as
temperatures increased. The additional decline in mass up to 600°C is likely due to the
dehydration and decomposition of the low refractory phases in CAC. The continued
strength loss after 600°C is likely due to the decomposition of low refractory phases
remaining deeper in the specimen as heat diffuses inward as well as the decomposition of
some of the high refractory phases.
4.4.2.5 Residual thermal expansion upon exposure to impulse thermal loading.
Residual thermal expansion was measured from face to face of the 2”x2” cube specimens
in all three dimensions and averaged at each test temperature. All of the geopolymers
tested in Phase 2 exhibited similar thermal expansion behavior upon exposure to impulse
thermal loading. Generally, they increased in size by a small amount, no more than
0.02in/in, from 300°C to 600°C. This was followed by a larger thermal expansion from
600°C to 900°C over a range of 0.04in/in to 0.13in/in depending on the mixture. This
corresponds to the residual strength losses in each mixture design at this temperature.
From 900°C to 1100°C all mixtures exhibited lower thermal expansion. 100GA(10N-

124
Figure 50: Residual compressive strengths of all Phase 2 mixtures after exposure to impulse thermal loading and quenching.
0
1000
2000
3000
4000
5000
6000
7000
8000
RT 300 600 900 1100
Co
mp
ress
ive
Str
ength
(p
si)
Temperature (°C)
Residual Compressive Strength After Impulse Thermal Loading and Quenching
100F(10N-1:1) 100F(10N-1:2) 100GA(10N-1:1) 100GA(10N-1:2)
50F/50GA(10N-1:1) OPC 50GA/50GB(10N-1:2) CAC

125
Figure 51: Residual compressive strengths of Phase 2 OPC and CAC mixtures after exposure to impulse thermal loading and
quenching.
0
1000
2000
3000
4000
5000
6000
7000
8000
RT 300 600 900 1100
Co
mp
ress
ive
Str
ength
(p
si)
Temperature (°C)
Residual Compressive Strength After Impulse Thermal Loading and Quenching
OPC CAC

126
Figure 52: Residual compressive strengths of Phase 2 fly ash-based mixtures after exposure to impulse thermal loading and
quenching.
0
1000
2000
3000
4000
5000
6000
7000
8000
RT 300 600 900 1100
Co
mp
ress
ive
Str
ength
(p
si)
Temperature (°C)
Residual Compressive Strength After Impulse Thermal Loading and Quenching
100F(10N-1:1) 100F(10N-1:2)

127
Figure 53: Residual compressive strengths of Phase 2 ground glass-based mixtures after exposure to impulse thermal loading and
quenching.
0
1000
2000
3000
4000
5000
6000
7000
8000
RT 300 600 900 1100
Co
mp
ress
ive
Str
ength
(p
si)
Temperature (°C)
Residual Compressive Strength After Impulse Thermal Loading and Quenching
100GA(10N-1:1) 100GA(10N-1:2) 50F/50GA(10N-1:1) 50GA/50GB(10N-1:2)

128
Figure 54: Weight percent mass loss of all Phase 2 mixture designs upon exposure to impulse thermal loading.
88
90
92
94
96
98
100
RT 300 600 900 1100
Wei
ght
%
Temperature (°C)
Weight Percent Mass Loss on Impulse Thermal Loading
100F(10N-1:1) 100F(10N-1:2) 100GA(10N-1:1) 100GA(10N-1:2)
50GA/50GB(10N-1:2) CAC OPC 50F/50GA(10N-1:2)

129
1:2), 50GA/50GB(10N-1:2), and 50F/50GA(10N-1:2) fell to 0.03, 0.02, and 0.02 inches
per inch respectively. 100GA(10N-1:1) was too deformed to record an accurate
measurement at 1100°C. 100F(10N-1:1) and 100F(10N1:2) fell to -0.04in/in and
-0.02in/in respectively. The changes in thermal expansion after exposure to impulse
thermal loading are shown in Figure 55. The maximum thermal expansion for OPC was
0.01in/in and 0in/in for CAC. The thermal expansion for carbon steel, which concrete
reinforcement is made from, is also shown in Figure 55. It is similar to all of the tested
mixtures up to 600°C, but is significantly lower than the geopolymer mixtures between
600°C and 1100°C. This is a major concern when using a brittle material, like PPC,
because a mismatch in thermal expansion will cause cracking as one material expands
more than the other. In the case of GCCs, this is not as much of a concern since the
binder is malleable at high temperatures and plastic deformation occurs rather than brittle
fracture. However, it is still desirable that thermal expansions match as closely as
possible, particularly at low temperatures when the materials exhibit less plasticity.
When exposed to impulse thermal loading followed by quenching the resulting thermal
expansions for all mixtures did not significantly vary from that of their unquenched
counterparts. This suggests that most or all of the thermal expansion takes place upon
heating and very little or contraction takes place upon cooling. The changes in thermal
expansion after exposure to impulse thermal loading and quenching are shown in Figure
56. Measurements of OPC could not be taken at 900°C and 1100°C because it
disintegrated upon quenching. All of the mixtures exhibit thermal expansion
corresponding to a loss in compressive strength at 900°C. This is to be expected since

130
Figure 55: Residual thermal expansion of all Phase 2 mixture designs upon exposure to impulse thermal loading.
-0.06
-0.01
0.04
0.09
0.14
300 600 900 1100
εth
(in/i
n)
Temperature (°C)
Residual Thermal Expansion Upon Exposure to Impulse Thermal Loading
100F(10N-1:1) 100F(10N-1:2) 100GA(10N-1:1) 100GA(10N-1:2) 50GB/50GA(10N-1:2)
CAC OPC 50F/50GA(10N-1:2) Carbon Steel

131
Figure 56: Residual thermal expansion of all Phase 2 mixture designs upon exposure to impulse thermal loading and quenching.
-0.06
-0.01
0.04
0.09
0.14
300 600 900 1100
εth
(in/i
n)
Temperature (°C)
Residual Thermal Expansion Upon Exposure to Impulse Thermal Loading and Quenching
100F(10N-1:1) 100F(10N-1:2) 100GA(10N-1:1) 100GA(10N-1:2)
50GB/50GA(10N-1:2) CAC OPC 50F/50GA(10N-1:2)

132
thermal expansion leads to an increase in porosity. Increasing the porosity leads to a loss
in compressive strength, since there is less material per unit area to support a given load.
4.4.2.6 Discussion of Phase 2 impulse thermal loading and quenching tests.
After conducting impulse thermal loading and quenching tests it became apparent that the
two types of geopolymers, ground glass-based and fly ash-based, serve two different
purposes in the application they are being studied for. To provide the most effective
barrier possible and to utilize the characteristic of each type to its full potential, it became
apparent that a ground glass- based geopolymer should be used in composite with a fly
ash-based geopolymer.
When considering all of the Phase 2 data as a whole, the best ground glass-based mixture
to use in this application is 100GA(10N-1:2). It exhibits higher residual compressive
strengths than other ground glass-based mixtures at all temperatures upon impulse
heating. More importantly, this mixture outperforms the other ground glass-based
mixtures at higher temperatures. Between the crucial temperatures of 900°C and 1100°C
it maintains the highest compressive strength of all ground glass-based mixtures and is
relatively stable when compared to the other mixtures at these high temperatures. This
mixture also exhibits the greatest thermal expansion, which is desirable in some
applications as is explained further along. In addition, its mass loss is constant regardless
of temperature, suggesting its microstructure is not significantly affected by it. It is also
not significantly affected by quenching, with nearly identical behavior whether it is
quenched or not. The resistance to thermal shock loading upon quenching may be aided

133
by the alumina content and its contribution to the formation of N-A-S-H gel, which is
beneficial to durability. This mixture is also likely benefitted by its high silica content
and corresponding O-Si-O bonds, which are stronger than O-Al-O bonds, but further
study of the microstructure is required to determine what phases are present and how
those phases evolved.
The best fly ash-based mixture for this application is 100F(10N-1:1). It maintains the
highest compressive strength overall when exposed to impulse thermal loading. More
importantly, it maintains compressive strength at the critical temperature of 900°C and
begins to gain compressive strength upon exposure to 1100°C. It also exhibits a low
thermal expansion in comparison to most other mixtures and has a constant mass loss. In
addition, is also not significantly affected by quenching, with nearly identical behavior
whether it is quenched or not. This is not entirely true of 100F(10N-1:2). The strength
gain at 1100°C suggests that hydrothermal reaction of the fly ash particles occurred. In
addition, since the sodium hydroxide/sodium silicate ratio is 1:1, there are likely free
sodium ions in the geopolymer matrix, which leads to crystallization of phases that
contribute to strength at high temperatures. As suggested by the thermal shrinkage at
1100°C, it appears that there may be fusion between the fly ash particles due to the high
alkali content, forming a ceramic material. Further study of the microstructure is required
to verify these assertions and to determine all of the underlying mechanisms that
contribute to strength gain at high temperatures.
Since the ground glass-based geopolymers become malleable and “melt” at high
temperatures, there is great potential for their use in the encapsulation and vitrification of

134
molten corium when it breaches the reactor pressure vessel and drops onto the material
below. As the molten corium drops onto the glass-based geopolymer it will melt the
portion that is in contact with it and a portion in the radial direction up to the point at
which its heat energy is no longer effective in melting the material. Aided by the
expansive properties of the geopolymer and natural convection the two materials can mix
together, entrapping volatile and radioactive materials in the corium. A cavity for the
corium to fall into that is large enough to account for the volume of the corium and the
thermal expansion of the geopolymer would ensure no structural damage occurs and
would aid in the mixing process. This form of in-situ mixing would also likely isolate
reactive materials and aid in the cooling process by creating distance and some degree of
shielding between portions of reactive materials. As the mixture cools it would
immobilize much of the nuclear waste in a potentially waterproof medium. Strategic
placement of the geopolymer material would ensure that no corium melts through the
edge of the containment.
As a precaution and as a container, a fly ash-based geopolymer could surround the
ground glass-based geopolymer, effectively creating a basin to hold it. The fly ash-based
mixture is well suited for this purpose for a number of reasons. When it is exposed to
high temperatures, it exhibits excellent dimensional stability and low thermal expansion.
In addition, it behaves in an increasingly elastic manner as temperatures increase. This
allows for some thermal expansion and adjustments at the interface of materials without
causing brittle fracturing. This mixture also exhibits potential to act as a molecular sieve
in case leaching occurs or corium reaches it. Fly ash-based geopolymers are known to

135
form zeolites at high temperatures, which could be used in ion exchange and filtration of
radioactive or hazardous materials. Further research is required to optimize the formation
of zeolites in the proper locations.
To ease the transition at the interface of 100GA(10N-1:2) and 100FA(10N-1:1), a layer
of 50F/50GA(10N-1:1) could be placed between them. Since this mixture exhibits
properties of both mixtures but to a milder degree, it would help in minimizing damage at
the interface.
In addition, a layer of impermeable ultra-high-performance concrete (UHPC) could
surround the fly ash-based geopolymer, creating an added layer of protection against a
breach in containment. This layer is beneficial both for its high strength and low
permeability, which would be important in containing any material in the unlikely event
that the inner layers were breached. Ideally, this layer would be placed far enough away
from the heat source that it would not be significantly affected by it.
4.4.3 Ramped thermal loading tests.
For the ramped thermal loading tests, 16 specimens were made from each of the seven
mixture designs in 2”x2” cube molds. After curing for 28 days, 24 specimens of one
mixture design were removed from the environmental chamber and placed in the muffle
furnace for testing. The furnace was then set to 1100°C. Upon reaching 300°C six
specimens were removed. Four were allowed to cool at room temperature and the other
two were quenched in water for one-half hour. This process was repeated at 600°C,
900°C, and 1100°C. The heating regimen for the ramped thermal loading tests is shown

136
in Figure 57. The entire process was carried out on all five mixture designs and residual
compressive strength tests were performed on all specimens. Surface hardness, mass, and
thermal expansion measurements were also taken.
Figure 57: Ramped thermal loading regimen for Phase 2 geopolymers.
The residual compressive strengths of the materials after being subjected to ramped
thermal loading is shown in Figure 64 and Table 14.
Residual Compressive Strength After Ramped Thermal Loading (psi)
Mixture 22°C 300°C 600°C 900°C 1100°C
100F(10N-1:1) 4138 3979 3738 898 1934
100F(10N-1:2) 3790 3308 3633 1321 1870
100GA(10N-1:1) 3020 3955 3708 0 0
100GA(10N-1:2) 4259 4010 4731 508 471
50F/50GA(10N-1:2) 1816 1708 2451 300 193
50GA/50GB(10N-1:2) 2706 2748 2544 950 556
OPC 3443 3104 1125 316 230
CAC 2951 3421 2509 1755 1539
Table 14:Residual compressive strength after exposure to ramped thermal loading.
4.4.3.1 OPC and CAC exposed to ramped thermal loading.
CAC gained strength upon exposure to 300°C, rising from 2951psi to 3421psi for a gain
of 5470psi, while OPC lost 339psi, falling from 3443psi to 3104psi. At this temperature
300
600
9001100
0
200
400
600
800
1000
1200
0 1 2 3
Tem
per
ature
(C
)
Time (hr)
Ramped Loading Phase 2
Sample/Furnace Heating Remove 1/4 of Samples

137
CAC began to show signs of cracking, as shown in Figure 58. Both OPC and CAC lost
strength upon exposure to 600°C, falling to 1125psi and 2509psi respectively. OPC and
CAC both fractured completely at this temperature, with OPC showing signs of extensive
microcracking as well. The progression of visible cracking from 300°C to 1100°C in
CAC and OPC is shown in Figure 58. Upon exposure to 900°C CAC showed a similar
strength loss as exposure to 600°C, falling to 2509psi, while OPC showed a similar
strength loss as CAC, falling to 316psi. This corresponded to significant cracking in both
mixtures. Both mixtures lost a similar amount of strength upon exposure to 1100°C with
OPC falling to 230psi and CAC falling to 1539psi. Significant cracking appeared in both
mixtures at this temperature, with OPC also exhibiting significant signs of spalling. The
progression of residual compressive strength gains and losses for OPC and CAC upon
exposure to ramped thermal loading is shown in Figure 65.
Figure 58: CAC (top) and OPC (bottom) upon exposure to impulse ramped loading at,
from left to right, to 300°C, 600°C, 900°C, and 1100°C.

138
4.4.3.2 Fly ash-based geopolymers exposed to ramped thermal loading.
Both fly ash-based mixtures followed a similar strength curve, with the exception of
between 600°C and 900°C, when exposed to ramped thermal loading. 100F(10N-1:1) lost
159psi, from 4138psi to 3979psi, upon exposure to 300°C, while 100F(10N-1:2) had a
higher strength loss, losing 482psi to fall to 3308psi upon exposure to the same
temperature. 100F(10N-1:1) continued to lose strength, falling to 3738psi, upon exposure
to 600°C, while 100F(10N-1:2) gained strength, reaching 3633psi. Both mixtures lost
strength upon exposure to 900°C with 100F(10N-1:1) falling to 898psi and 100F(10N-
1:2) falling to 1321psi. At 1100°C both mixtures gained strength with 100F(10N-1:2)
reaching 1870psi and 100F(10N-1:1) reaching 1934psi. Neither mixture showed signs of
macrocracking, although some thermal expansion was visible at 900°C and shrinkage at
1100°C, especially in 100F(10N-1:1). 100F(10N-1:1) showed signs of elastic stretching
at 900°C, but this disappeared at 1100°C. This is shown in Figure 59. The change in
residual compressive strengths with temperature of fly ash-based mixtures upon exposure
to ramped thermal loading is shown in Figure 66.

139
Figure 59: 100F(10N-1:1) (top)and 100F(10N-1:2) (bottom) upon exposure to ramped
thermal loading at, from left to right, to 300°C, 600°C, 900°C, and 1100°C.
Both fly ash-based mixtures exhibit mildly elastic behavior, as they could be deformed by
metal tongs upon removal from the muffle furnace if sufficient force was applied. Upon
cooling the specimens became rigid again.
4.4.3.3 Ground glass-based geopolymers exposed to ramped thermal loading.
The ground glass-based mixtures exhibited differing strength curves upon exposure to
ramped thermal loading, although they allow followed a similar trend. Upon exposure to
300°C 50F/50GA(10N-1:2) and 100GA(10N-1:2) lost 108psi and 249psi respectively,
while 50GA/50GB(10N-1:2) and 100GA(10N-1:1) gained 43psi and 935psi respectively.
From 300°C to 600°C the two mixtures that had gained strength lost strength, losing
204psi and 247psi respectively, while the two mixtures that had lost strength gained
strength, gaining 743psi and 721psi respectively. All mixtures exhibited continued
strength loss upon exposure to 900°C, falling under 1000psi. Upon exposure to 1100°C

140
all mixtures continued to lose strength, although 100GA(10N-1:2) remained relatively
stable. The residual compressive strength gains and losses with temperature of ground
glass-based geopolymers upon exposure to ramped thermal loading are shown in Figure
67.
At 900°C microcracking was visible on the surface of 50F/50GA(10N-1:2) along with
larger cracks along the cube edges which grew upon exposure to 1100°C. Microcracking
was also visible to a lesser degree on the surface of 100GA(10N-1:1) at 900°C, although
none of the cracks appeared to be more than surface deep. These cracks are likely a result
of differences in thermal expansion as the outside of the specimen that is exposed to air
cools more quickly than the inside of the specimen. 50GA/50GB(10N-1:2) and
100GA(10N-1:2) did not exhibit signs of cracking. Rather, they exhibited elastic
behavior and began to flow, starting at 900°C and continuing to deform to a greater
degree at 1100°C. 100GA(10N-1:1) exhibited the same behavior at 1100°C. The largest
amount of deformation of all ground glass-based mixtures took place in 100GA(10N-
1:1). The changes in macrostructure with exposure to ramped thermal loading at 300°C,
600°C, 900°C, and 1100°C are shown in Figures 60-63.
Figure 60: 50F/50GA(10N-1:2) upon exposure to ramped thermal loading at, from left to
right, to 300°C, 600°C, 900°C, and 1100°C.

141
Figure 61: 50GA/50GB(10N-1:2) upon exposure to ramped thermal loading at, from left
to right, 300°C, 600°C, 900°C, and 1100°C.
Figure 62: 100GA(10N-1:1) upon exposure to ramped thermal loading at, from left to
right, 600°C, 900°C, and 1100°C.
Figure 63: 100GA(10N-1:2) upon exposure to ramped thermal loading at, from left to
right, 300°C, 600°C, 900°C, and 1100°C.

142
Figure 64: Residual compressive strengths of all Phase 2 mixtures after exposure to ramped thermal loading.
0
1000
2000
3000
4000
5000
RT 300 600 900 1100
Co
mp
ress
ive
Str
ength
(p
si)
Temperature (°C)
Residual Compressive Strength After Ramped Thermal Loading
100F(10N-1:1) 100F(10N-1:2) 100GA(10N-1:1) 100GA(10N-1:2)
50F/50GA(10N-1:1) OPC 50GA/50GB(10N-1:2) CAC

143
Figure 65: Residual compressive strengths of OPC and CAC mixtures after exposure to ramped thermal loading.
0
1000
2000
3000
4000
5000
RT 300 600 900 1100
Co
mp
ress
ive
Str
ength
(p
si)
Temperature (°C)
Residual Compressive Strength After Ramped Thermal Loading
OPC CAC

144
Figure 66: Residual compressive strengths of Phase 2 fly ash-based mixtures after exposure to ramped thermal loading.
0
1000
2000
3000
4000
5000
RT 300 600 900 1100
Co
mp
ress
ive
Str
ength
(p
si)
Temperature (°C)
Residual Compressive Strength After Ramped Thermal Loading
100F(10N-1:1) 100F(10N-1:2)

145
Figure 67: Residual compressive strengths of Phase 2 ground glass-based mixtures after exposure to ramped thermal loading.
0
1000
2000
3000
4000
5000
RT 300 600 900 1100
Co
mp
ress
ive
Str
ength
(p
si)
Temperature (°C)
Residual Compressive Strength After Ramped Thermal Loading
100GA(10N-1:1) 100GA(10N-1:2) 50F/50GA(10N-1:1) 50GA/50GB(10N-1:2)

146
4.4.4 Phase 2 quenching after ramped thermal loading.
Half of the specimens exposed to ramped thermal loading were quenched in water to
determine their resiliency to thermal shock. The residual compressive strengths after
exposure to ramped thermal loading and quenching of all Phase 2 mixtures at is shown in
Figure 73 and Table 15.
Residual Compressive Strength After Ramped Thermal Loading and Quenching (psi)
Mixture 22°C 300°C 600°C 900°C 1100°C
100F(10N-1:1) 3511 3331 3304 761 1871
100F(10N-1:2) 2988 2601 2819 1074 1866
100GA(10N-1:1) 2778 3248 2246 0 0
100GA(10N-1:2) 4023 4456 3854 95 150
50F/50GA(10N-1:2) 1941 3144 3033 326 86
50GA/50GB(10N-1:2) 2359 2909 2246 444 124
OPC 3228 3818 2470 0 0
CAC 2735 3519 2320 1836 1831
Table 15: Residual compressive strength after exposure to ramped thermal loading and
quenching.
4.4.4.1 Quenching OPC and CAC after exposure to ramped thermal loading.
The residual compressive strengths after exposure to ramped thermal loading and
quenching of OPC and CAC at 300°C, 600°C, 900°C, and 1100°C is shown in Figure 74.
The residual compressive strength curve for CAC after exposure to ramped thermal
loading and quenching followed much the same behavior as the unquenched sample with
some variations. There were variations in compressive strength above and below that of
the unquenched specimen, but it followed a similar general trend. Strength losses of
216psi and 189psi were observed at 300°C and 600°C respectively, but all other
temperatures showed strength gains in the quenched samples compared to the
unquenched samples. OPC exhibited similar behavior upon quenching as CAC did up to

147
600°C, which is different than the behavior of unquenched OPC samples. The strength
curves followed the same trend, with OPC having a slightly higher compressive strength
than that of CAC by a maximum of 493psi. The increase in residual compressive
strengths observed upon quenching in both CAC and OPC samples is likely due to
additional hydration or rehydration that occurred during the drying period. Another
difference between quenched and unquenched OPC samples occurred at 900°C and
1100°C. Similar to the impulse loaded quenched OPC specimens, at 900°C there was a
violent steam explosion upon quenching in water and the specimen broke into multiple
pieces. At 1100°C the specimen completely disintegrated, turning into a powder with
small cement pieces intermingled. Complete fracture also occurred earlier, at 600°C, and
some cracking was visible at 300°C. The progression of the macrostructure upon
quenching at 300°C, 600°C, 900°C, and 1100°C is shown in Figure 68.
Figure 68: OPC upon exposure to ramped thermal loading and quenching at, from left to
right, 300°C, 600°C, 900°C, and 1100°C.
In CAC, small amounts of visible cracking were observed at 300°C , slightly increasing
at 600°C. At 900°C complete fracture occurred, followed by complete fracture and
erosion of material at 1100°C. Effervescence was also visible on the surface of the
specimen exposed to 300°C, suggesting leaching had occurred in the quench water. These
effects are shown in Figure 69.

148
Figure 69: CAC upon exposure to ramped thermal loading and quenching at, from left to
right, 300°C, 600°C, 900°C, and 1100°C.
4.4.4.2 Quenching fly ash-based mixtures after exposure to ramped loading.
The residual compressive strength curve for both of the fly ash-based geopolymers upon
quenching is similar to that of the unquenched samples. The strength of the quenched
samples is consistently lower than the unquenched samples, but by no more than 814psi
at any of the temperatures tested. The residual compressive strengths of both fly ash-
based geopolymers after exposure to impulse thermal loading and quenching is shown in
Figure 75. Strength gains and losses due to quenching are shown in Table 15.
Both fly ash-based mixtures showed fairly good dimensional stability but exhibited some
thermal expansion at 600°C and 900°C, followed by shrinkage at 1100°C. Surface
microcracks began to form at 600°C and 900°C, but disappeared at 1100°C when
shrinkage occurred. These cracks never appeared to penetrate deeply into the surface. At
300°C, 600°C, and 900°C a thin layer of effervescence was observed in both mixture
designs, suggesting that leaching occurred while submerged. These effects are visible in
Figure 70.

149
Figure 70: 100F(10N-1:1) (top) and 100F(10N-1:2) (bottom) upon exposure to ramped
thermal loading and quenching, from left to right, 300°C, 600°C, 900°C, and 1100°C.
4.4.4.3 Quenching glass-based mixtures after exposure to ramped loading.
The residual compressive strength curves of ground glass-based geopolymers after
quenching was very similar to that of both quenched and unquenched specimens
subjected to impulse thermal loading. In general, there was a strength increase at 300°C,
followed by a similar strength decrease at 600°C, and a much greater strength decrease at
900°C. It was not as similar to unquenched specimens exposed to ramped loading,
although a similar trend could be discerned between the two. This suggests that it is
thermal shock loading the leads to this type of behavior. The residual compressive
strengths of ground glass-based geopolymers after exposure to ramped thermal loading
and quenching at all tested temperatures is shown in Figure 76. Strength gains and losses
upon quenching are shown in Table 16.

150
Both 100% aluminosilicate glass mixtures exhibited similar physical characteristics as
their unquenched counterparts. The biggest difference was that a large amount of
effervescence was found on the 100GA(10N-1:1) specimens exposed to 300°C,
suggesting major leaching may have occurred while quenching in water. Effervescence
was also found on the 100GA(10N-1:2) specimen exposed to 300°C, although to much
smaller degree. No cracking was observed on these specimens. These characteristics are
exhibited in Figure 71.
Figure 71:100GA(10N-1:1) (top) and 100GA(10N-1:2) (bottom) upon exposure to
impulse loading and quenching at, from left to right, 300°C, 600°C, 900°C, and 1100°C .
Similarly, 50F/50GA(10N-1:2) exhibited comparable characteristics to its unquenched
counterpart, with the exception of small amounts of visible effervescence on specimens
exposed to 300°C. 50GA/50GB(10N-1:2) exhibited a different behavior upon heating.
Upon heating to 600°C and 900°C and quenching the outer layer began to come off in
flakes. The parts of the inner structure exposed by this flaking also showed significant
erosion. This is shown in Figure 72.

151
Figure 72: 50GA/50GB(10N-1:2) upon exposure to impulse thermal loading and
quenching at, from left to right, 300°C, 600°C, 900°C, and 1100°C .
Gains/Losses in Compressive Strength After Ramped Loading and Quenching (psi)
Mixture 22°C 300°C 600°C 900°C 1100°C
100F(10N-1:1) -627 -648 -434 -137 -63
100F(10N-1:2) -802 -707 -814 -247 -4
100GA(10N-1:1) -242 -707 -1462 0 0
100GA(10N-1:2) -236 446 -877 -413 -321
50F/50GA(10N-1:2) 125 1436 582 26 -107
50GA/50GB(10N-1:2) -347 161 -298 -506 -432
OPC -215 -201 -178 -9 -15
CAC -216 98 -189 81 292
Table 16: Change in residual compressive strength due to quenching after exposure to
ramped thermal loading and quenching.
4.4.4.4 Mass loss upon exposure to ramped thermal loading.
All samples experienced mass loss upon exposure to ramped thermal loading at all
temperatures, except for 100GA(10N-1:1) and 100GA(10N-1:2) between 600°C and
900°C. To measure mass loss, specimens were weighed before entering and again after
exiting the muffle furnace. These results are shown in Figure 77. Specimens with pieces

152
missing or metal scale fused to them were not included in the measurements, so some
data points are not available. While heating to 300°C all specimens exhibited a small
amount of mass loss, typically 2% or less weight percent. This is likely due to a loss of
evaporable water from the surface and open pores. From 300°C to 600°C all of the
geopolymer mixtures experienced a mass loss of 3-6%. OPC and CAC lost 7.5% and 9%
respectively over this temperature range. This likely corresponds to the dehydration of
hydration products and the disappearance of low refractory phases. From 600°C to 900°C
most mixtures again experience a small mass loss of less than 2%. This may be due to the
evaporation of pore water as new pores are exposed upon thermal expansion. From
900°C to 1100°C the mass stays fairly consistent in the mixtures that were measured.
This corresponds to a thermal contraction in most geopolymer specimens, which would
cause many opened pores to close again. Also, specimens may have lost all of their pore
solution by this temperature, which is where the majority of the mass loss originates.
CAC exhibits the greatest mass loss, while 100F(10N-1:2) appears to exhibit the least.
4.4.4.5 Residual thermal expansion upon exposure to impulse thermal loading.
All of the geopolymers tested in Phase 2 exhibited similar thermal expansion behavior
upon exposure to ramped thermal loading as to impulse thermal loading, although
typically of a lower magnitude. Generally, all mixtures remained within 0.05 inches of
the original dimension from 300°C to 600°C. This was followed by a larger thermal
expansion from 600°C to 900°C, up to a maximum 0.3 inches depending on the mixture.
This corresponds to residual strength loss in each mixture design. From 900°C to 1100°C
all mixtures exhibited thermal shrinkage, falling to within 0.01 inches of the original

153
dimensions, with the exception on 100F(10N-1:1). 100F(10N-1:1) fell to 0.05 inches
below the original dimensions, corresponding to an increase in residual compressive
strength. The changes in thermal expansion after exposure to ramped thermal loading are
shown in Figure 78. The changes in thermal expansion after exposure to ramped thermal
loading and quenching are shown in Figure 79. When exposed to ramped thermal loading
followed by quenching the resulting thermal expansions for all mixtures did not
significantly vary from that of their unquenched counterparts. This suggests that most or
all of the thermal expansion takes place upon heating and very little or none takes place
upon cooling. Measurements of OPC could not be taken at 900°C and 1100°C because it
disintegrated upon quenching. All of the mixtures exhibit thermal expansion
corresponding to a loss in compressive strength at 900°C.
4.4.2.6 Discussion of Phase 2 ramped thermal loading and quenching tests.
When considering all of the data from the Phase 2 ramped thermal loading and quenching
tests it again becomes apparent that the fly ash-based mixtures and ground glass-based
mixtures should be used for different purposes.
The fly ash-based mixture that is most suitable for this loading condition is 100F(10N-
1:2). Although it exhibits lower strengths than 100F(10N-1:1) at lower temperatures, it
exhibits a higher minimum strength, at 900°C. It also outperforms OPC in this loading
condition. More importantly, it begins to gain strength upon exposure to 1100°C, while
all other mixtures continue to lose strength, with the exception of 100F(10N-1:1) and
100GA(10N-1:2). This mixture may be used as structural material or as a fireproof

154
coating in a structure. Exposing this type of geopolymer to quenching during the
extinguishing of a fire would not have a significant effect upon it, as is demonstrated by
its strength curve upon quenching. This mixture is preferable to 100F(10N-1:1) because it
has a lower thermal expansion and a higher minimum compressive strength. It likely
maintains many of the same benefits as its impulse loaded counterpart, but further
microstructural study is required to gain a better understanding.
The ground glass-based mixture with the best performance under this loading condition is
100GA(10N-1:2). It outperforms all other mixtures up to 600°C and maintains its
strength upon exposure to 1100°C. Quenching also does not have a significant effect on
it, and in fact leads to an increase in compressive strength at 300°C. This mixture is best
used as a fireproof coating due to its large thermal expansion. A large thermal expansion
is beneficial when used in this application. By increasing the distance between the outer
surface of the fireproofing and the component being protected, it further insulates the
component. It is apparent that multiple phase changes are taking place during ramped
thermal loading, but further study of the microstructure is required to determine what
they are.

155
Figure 73: Residual compressive strengths of all Phase 2 mixtures after exposure to ramped thermal loading and quenching.
0
500
1000
1500
2000
2500
3000
3500
4000
4500
5000
RT 300 600 900 1100
Co
mp
ress
ive
Str
ength
(p
si)
Temperature (°C)
Residual Compressive Strength After Ramped Thermal Loading and Quenching
100F(10N-1:1) 100F(10N-1:2) 100GA(10N-1:1) 100GA(10N-1:2)
50F/50GA(10N-1:1) OPC 50GA/50GB(10N-1:2) CAC

156
Figure 74: Residual compressive strengths of Phase 2 OPC and CAC mixtures after exposure to ramped thermal loading and
quenching.
0
500
1000
1500
2000
2500
3000
3500
4000
4500
5000
RT 300 600 900 1100
Co
mp
ress
ive
Str
ength
(p
si)
Temperature (°C)
Residual Compressive Strength After Ramped Thermal Loading and Quenching
OPC CAC

157
Figure 75: Residual compressive strengths of Phase 2 fly ash-based mixtures after exposure to ramped thermal loading and quenching.
0
500
1000
1500
2000
2500
3000
3500
4000
4500
5000
RT 300 600 900 1100
Co
mp
ress
ive
Str
ength
(p
si)
Temperature (°C)
Residual Compressive Strength After Ramped Thermal Loading and Quenching
100F(10N-1:1) 100F(10N-1:2)

158
Figure 76: Residual compressive strengths of Phase 2 ground glass-based mixtures after exposure to ramped thermal loading and
quenching.
0
500
1000
1500
2000
2500
3000
3500
4000
4500
5000
RT 300 600 900 1100
Co
mp
ress
ive
Str
ength
(p
si)
Temperature (°C)
Residual Compressive Strength After Ramped Thermal Loading and Quenching
100GA(10N-1:1) 100GA(10N-1:2) 50F/50GA(10N-1:1) 50GA/50GB(10N-1:2)

159
Figure 77: Mass loss of all Phase 2 mixture designs upon exposure to ramped thermal loading.
90
91
92
93
94
95
96
97
98
99
100
RT 300 600 900 1100
Wei
ght
%
Temperature (°C)
Weight Percent Mass Loss on Ramped Thermal Loading
100F(10N-1:1) 100F(10N-1:2) 100GA(10N-1:1) 100GA(10N-1:2)
50GA/50GB(10N-1:2) CAC OPC 50F/50GA(10N-1:2)

160
Figure 78: Residual thermal expansion of all Phase 2 mixture designs upon exposure to ramped thermal loading.
-0.04
0.01
0.06
0.11
0.16
300 600 900 1100
εth
(in/i
n)
Temperature (°C)
Residual Thermal Expansion Upon Exposure to Ramped Thermal Loading
100F(10N-1:1) 100F(10N-1:2) 100GA(10N-1:1)100GA(10N-1:2) 50GB/50GA(10N-1:2) CACOPC 50F/50GA(10N-1:2) Carbon Steel

161
Figure 79: Residual thermal expansion of all Phase 2 mixture designs upon exposure to ramped thermal loading and quenching.
-0.04
0.01
0.06
0.11
0.16
300 600 900 1100
εth
(in/i
n)
Temperature (°C)
Residual Thermal Expansion Upon Exposure to Ramped Thermal Loading and Quenching
100F(10N-1:1) 100F(10N-1:2) 100GA(10N-1:1) 100GA(10N-1:2)
50GB/50GA(10N-1:2) CAC OPC 50F/50GA(10N-1:2)

165
4.5 Thermal Conductivity Testing
Thermal conductivity tests were carried out on relevant Phase 2 mixtures to determine
how efficiently they can transport heat away from the corium compared to OPC. The
thermal conductivity of PPC samples containing taconite tailings and gravel were also
compared against each other to determine if taconite tailing can be effective in increasing
thermal conductivity. The thermal conductivity testing apparatus is shown in Figure 80.
Figure 80: Thermal conductivity testing apparatus.
4.5.1 Thermal conductivity of Phase 2 mixtures.
Phase 2 mixtures were tested to determine what effect variables had on thermal
conductivity. The thermal conductivity of ground glass-based mixtures were not
considered relevant since their purpose is not to transport heat, but to retain enough heat

166
to melt a sufficient portion for in-situ vitrification. The thermal conductivities of fly ash-
based mixtures were considered important, because part of its function is to transport
excess heat away from the corium-glass matrix so that the local thermal loading does not
reach a point where it can fail structural material.
The equation for the coefficient of thermal conductivity is as follows.
I =KL
M∆O , where P = QRSTUV SX ℎZ�V V[�U\XZ[ Vℎ[ST]ℎ VℎZ R�VZ[��^,
` = `ZU]Vℎ SX R�VZ[��^ Vℎ[ST]ℎ aℎ�'ℎ VℎZ ℎZ�V V[�bZ^\,
Q = Q[Z� SX VℎZ cSde US[R�^ VS VℎZ d�[Z'V�SU SX ℎZ�V X^Sa,
�Ud ∆f = �ℎ�U]Z �U VZRgZ[�VT[Z.
In this study Q, L, and A were held constant. ∆f depended on the thermal transport
properties of the material being tested. For the sake of comparison, the ∆fs for each
mixture can be compared against one another and the percent increase or decrease will be
the same as the percent increase or decrease of the thermal conductivities of the
materials. All comparisons were made against the baseline OPC mortar. The decrease or
increase in thermal conductivity for each mixture tested is shown in Table 17. The
progressions of the thermal gradients of each mixture over the last six hours of the 12-
hour heating cycle are shown in Figures 81-84.
Mixture T (°C) at
Bottom T (°C) at Top ∆f (°C) % Difference
OPC 122.6 83.3 39.3 0
100F(10N-1:1) 119.6 82.1 37.5 +5%
100F(10N-1:2) 123.8 83.6 40.2 -2%
50F/50GA(10N-1:1) 128.6 79.5 49.1 -25%
Table 17: Differences in thermal conductivity of tested mixtures from that of OPC.

167
4.5.1.1 Discussion of thermal conductivities.
The single biggest influence on thermal conductivity was silica content. The silica
contents of 100F(10N-1:1), 100F(10N-1:2), and 50F/50GA(10N-1:1), were 22.4%,
23.1%, and 25.1% respectively. None of the other constituents or stoichiometric ratios
appeared to be related to changes in thermal conductivity. The only difference between
100F(10N-1:1) and 100F(10N-1:2) was silica content. The mixture with additional silica
showed a decrease in thermal conductivity compared to the mixture with less silica. The
decreases in thermal conductivity apparent in some of the geopolymers tested may be
offset by using a thermally conductive aggregate.
Figure 81: Thermal gradient of OPC measured in 2" increments over six hours.
60.0
70.0
80.0
90.0
100.0
110.0
120.0
130.0
1
23
45
67
89
11
1
13
3
15
5
17
7
19
9
22
1
24
3
26
5
28
7
30
9
33
1
35
3
37
5
39
7
41
9
44
1
46
3
48
5
50
7
52
9
55
1
57
3
59
5
61
7
63
9
66
1
68
3
70
5
Tem
per
ature
(°C
)
Time (1/2 min)
Thermal Gradient of OPC Mortar at 125°C
Bottom 2" 4" 6"

168
Figure 82: Thermal gradient of 100F(10N-1:1) measured in 2" increments over six hours.
Figure 83:Thermal gradient of 100F(10N-1:2) measured in 2" increments over six hours.
60.0
70.0
80.0
90.0
100.0
110.0
120.0
130.0
12
14
16
18
11
01
121
141
161
181
201
221
241
261
281
301
321
341
361
381
401
421
441
461
481
501
521
541
561
581
601
621
641
661
681
701
Tem
per
ature
(°C
)
Time (1/2 min)
Thermal Gradient of 100F(10N-1:1) Mortar at 125°C
Bottom 2" 4" 6"
60
70
80
90
100
110
120
130
1
21
41
61
81
101
121
141
161
181
201
221
241
261
281
301
321
341
361
381
401
421
441
461
481
501
521
541
561
581
601
621
641
661
681
701
Tem
per
ature
(°C
)
Time (1/2 min)
Thermal Gradient of 100F(10N-1:2) Mortar at 125°C
Bottom 2" 4" 6"

169
Figure 84: Thermal gradient of 50F/50GA(10N-1:1) measured in 2" increments over six
hours.
4.5.2 Effect of taconite tailing coarse aggregate on thermal conductivity.
Taconite tailings were chosen as a coarse aggregate because of their iron content, which
is known to have a high thermal conductivity. It was compared against conventional
gravel aggregate to determine if thermal conductivity could be increased with its use. The
results are shown in Figures 85 and 86. Both mixtures were gap graded with 3/8” coarse
aggregate to ensure that the aggregate type was the only variable. The aggregate
constituted 48% of the mixture by weight. The OPC with taconite tailings had a ∆f of
24.2°C, while the OPC with conventional gravel had a ∆f of 33.4°C. This is equivalent
to a 28% increase in thermal conductivity. This is most likely due to the iron content in
taconite tailings, which does not exist in as large amounts in conventional gravel
aggregate.
60
70
80
90
100
110
120
130
140
1
21
41
61
81
101
121
141
161
181
201
221
241
261
281
301
321
341
361
381
401
421
441
461
481
501
521
541
561
581
601
621
641
661
681
701
Tem
per
ature
(°C
)
Time (1/2 min)
Thermal Gradient of 50F/50GA(10N-1:1) Mortar at 125°C
Bottom 2" 4" 6"

170
Figure 85: Thermal gradient of OPC with gravel aggregate measured in 2" increments
over six hours.
Figure 86: Thermal gradient of OPC with taconite tailing aggregate measured in 2"
increments over six hours.
70
80
90
100
110
120
130
1
21
41
61
81
101
121
141
161
181
201
221
241
261
281
301
321
341
361
381
401
421
441
461
481
501
521
541
561
581
601
621
641
661
681
701
Tem
per
ature
(°C
)
Time (1/2 min)
Thermal Gradient of PPC with Gravel at 125°C
Bottom 2" 4" 6"
70
80
90
100
110
120
130
1
21
41
61
81
101
121
141
161
181
201
221
241
261
281
301
321
341
361
381
401
421
441
461
481
501
521
541
561
581
601
621
641
661
681
701
Tem
per
ature
(°C
)
Time (1/2 min)
Thermal Gradient of PPC with Taconite at 125°C
Bottom 2" 4" 6"

171
4.6 Molten Metal Testing
A geopolymer specimen and an OPC specimen were both exposed to molten metal to
simulate the effects of molten corium falling onto their surfaces. A 100F(10N-1:1) mortar
was tested against an OPC mortar for comparison. Samples were 6 inches in diameter and
four inches tall with a 2-inch diameter hemisphere indented into their top surfaces,
creating a cavity to catch the molten metal. Specimens were placed in a plywood box
lined with firebrick and covered on all surfaces with metal casting greensand. A runner
was created in the greensand leading to the surface of each specimen. A cover was placed
on the box with a notch cut out for pouring metal into the runner and a 2-inch viewing
hole in the center. This cover created a splashguard in case of sputtering and spalling. To
begin, 319 aluminum alloy was heated to approximately 700°C in a melting furnace and
transported in a ceramic crucible to the box. The molten metal was then poured into the
runner until the cavity in the specimen was completely full. Observations were made
through visual inspection during the test and by post-test investigation.
4.6.1 OPC exposed to molten metal.
When molten aluminum was poured onto the OPC specimen large amounts of steam
were produced. The specimen could not be viewed shortly after exposure due to the large
volume of dense steam. After the steam cleared, water continued to boil in the cavity
between the specimen and the mass of metal. This continued until the metal was
sufficiently cooled to the point where it could no longer sustain natural convection in the
surrounding layer of water. Upon cutting the specimen in half, dehydrated cement could

172
be observed radiating outward from the surface cavity and downward from the surface
that came into contact with molten metal during pouring. This effect is visible in Figure
87.
Spalling was observed on the flat top surface of the OPC sample as well. This can be seen
in Figure 89 and Figure 88, where pieces of spalled concrete were captured in the molten
metal after hitting the lid of the box. Dehydration into free lime was also observed,
especially along the rim of the cavity. Microcracks were extremely abundant within the
cavity. Both of these effects can be seen in Figure 89.
Figure 87: Cross section of OPC specimen after exposure to molten aluminum.

173
Figure 88: Pieces of spalled OPC concrete immobilized in molten aluminum.
Figure 89: Top surface and cavity of OPC sample after exposure to molten metal.
4.6.2 Fly ash-based geopolymer exposed to molten metal.
When molten aluminum was poured onto the geopolymer specimen a small puff of steam
was observed, which disappeared within seconds. Upon close observation, a thin film of
liquid was observed circulating around the mass of metal, between it and the specimen
surface. It was a clear liquid but did not appear to be water as no steam was generated. It

174
is likely that this fluid was a mixture of sodium hydroxide and sodium silicate. The initial
puff of steam may have been the water content in the solution boiling away. The liquid
continued to circulate until the metal was cooled, after which it was no longer visible.
Upon cutting the specimen in half, darkly discolored material could be seen radiating
outward from the surface of the cavity to approximately 1/8 inch. No spalling or cracking
was observed, but the surface of the cavity became darkly discolored. The can be seen in
Figure 90.
Figure 90: Top surface and cavity of geopolymer specimen after exposure to molten
metal.
4.6.3 Discussion of molten metal testing.
The geopolymer specimen responded to contact with molten metal much better than the
OPC specimen. The OPC specimen gave off large amounts of steam and showed signs of
decomposition and extensive cracking. This was likely due to the dehydration of

175
hydration products in the OPC. Large amount of steam can be problematic in a nuclear
power plant, since it can agitate the corium leading to further heat production and it can
contribute to zirconium oxidation and hydrogen production, as happened at Fukushima.
Spalling is also dangerous since it shoots projectiles away from the surface of the
concrete. These projectiles can agitate the corium and lead to increased heat production,
and they can damage other parts of the structure or equipment in the area nearby,
including components of the active safety systems. Cracking is also dangerous, especially
in a brittle material like OPC where the cracks tend to be more extensive and run deeper
than in a more ductile material. This can lead to a breach in containment and the release
of radioactive material into the atmosphere and groundwater.
The geopolymer specimen showed no signs of spalling or cracking and created only a
miniscule amount of steam. These are all improvements over OPC. In addition, the extent
of visible damage appeared to be much smaller in the OPC sample. In addition to these
properties, the geopolymer specimen appeared to contribute to natural convective cooling
of the molten metal as observed by the clear liquid naturally circulating around and over
top of the mass of molten metal.
4.7 Hardness Testing
Hardness tests were carried out on every mixture from Phase 2 to determine if a
correlation between surface hardness, compressive strength, and temperature could be
determined. This was successful to varying degrees.

176
4.7.1 Hardness testing of impulse loaded OPC and CAC.
The Rockwell superficial hardness measurements showed a good correlation to the
compressive strength of impulse loaded OPC from room temperature to 1100°C. At
lower temperatures, when OPC is at its highest strengths, the correlation is nearly exact.
As OPC is exposed to higher temperatures, the surface hardness measurements
underestimate the compressive strength to a greater degree. This is necessary due to the
increasing uncertainty that comes with a rise in temperature. If the surface hardness is out
of range of the HR15Y scale, it can be assumed that the compressive strength of the OPC
is 500psi or less. The correlation is shown in Figure 91.
Figure 91: Compressive strength of OPC and the adjusted hardness curve.
Using the correlation � =(hijkl)m
j.n∗jop , where C is the compressive strength of the specimen
and HR15Y is the Rockwell superficial hardness number measured on the surface of the
0
1000
2000
3000
4000
22 300 600 900 1100
Com
pre
ssiv
e S
tren
gth
(p
si)
Temperature (°C)
OPC Impulse
Hardness Compressive Strength

177
material results in a coefficient of correlation of R = 0.998. The temperature that the
material has been exposed to can also be determined using these values.
CAC did not show as strong of a correlation to surface hardness as OPC, but compressive
strength can still be approximated using the Rockwell superficial hardness test. Using the
correlation � =(hijkl)q
�.k+ 1000, a coefficient of correlation R = 0.964 can be obtained.
The compressive strength and adjusted surface hardness values are shown in Figure 92.
Figure 92: Compressive strength of CAC and the adjusted hardness curve.
4.7.2 Hardness testing of impulse loaded ground glass-based mixtures.
A good correlation was found between Rockwell superficial hardness test values and
compressive strength for 100GA(10N-1:1). The adjusted hardness and compressive
0
500
1000
1500
2000
2500
3000
3500
4000
22 300 600 900 1100
Com
pre
ssiv
e S
tren
gth
(p
si)
Temperature (°C)
CAC Impulse
Hardness Compressive Strength

178
strength curves are shown in Figure 93. The correlation is � =(hijkl)q
j.rjk results in a
correlation coefficient R = 0.998.
Figure 93: Compressive strength of 100GA(10N-1:1) and the adjusted hardness curve.
100GA(10N-1:2) can be correlated by � = 38(�s15u), resulting in R = 0.984. It can be
assumed that the compressive strength of 100GA(10N-1:2) is less than 1500psi if it does
not register on the hardness scale. The correlation is shown in Figure 94.
0
1000
2000
3000
4000
5000
22 300 600 900 1100Com
pre
ssiv
e S
tren
gth
(p
si)
Temperature (°C)
100GA(10N-1:1) Impulse
Hardness Compressive Strength

179
Figure 94: Compressive strength of 100GA(10N-1:2) and the adjusted hardness curve.
50GB/50GA(10N-1:2) can be correlated by � =(hijkl)q
�.k resulting in R = 0.996. It can be
assumed that the compressive strength of 100GA(10N-1:2) is less than 500psi if it does
not register on the hardness scale. The correlation is shown in Figure 95.
Figure 95: Compressive strength of 50GB/50GA(10N-1:2) and adjusted hardness curve.
0
500
1000
1500
2000
2500
3000
3500
22 300 600 900 1100
Co
mp
ress
ive
Str
ength
(p
si)
Temperature (°C)
100GA(10N-1:2) Impulse
Hardness Compressive Strength
0
1000
2000
3000
4000
22 300 600 900 1100Co
mp
ress
ive
Str
ength
(p
si)
Temperature (°C)
50GB/50GA(10N-1:2) Impulse
Hardness Compressive Strength

180
4.7.3 Hardness testing of impulse loaded fly ash-based mixtures.
Using the equation � = 400√�s15u to adjust surface hardness provides a good
correlation for 100F(10N-1:1) at room temperature, 600°C, and 900°C, but not at 300°C
and 1100°C. This test may be useful as a guide up to 900°C, but significantly
underestimates the compressive strength at 300°C. Above 900°C the hardness does not
rise proportionally to the compressive strength, so any measurement carried out in this
temperature range may lead to false results. The correlation is illustrated in Figure 96.
The correlation coefficient is r = 0.65.
Figure 96: Compressive strength of 100F(10N-1:1) and the adjusted hardness curve.
Using the equation � = log(�s15u) +(hijkl)q
�− 3500 to adjust hardness
measurements gives a correlation coefficient of r = 0.76. This is illustrated in Figure 97.
This test may be used as a guide in the range 300°C-900°C but will underestimate the
0
1000
2000
3000
4000
5000
6000
7000
8000
22 300 600 900 1100
Com
pre
ssiv
e S
tren
gth
(p
si)
Temperature (°C)
100F(10N-1:1) Impulse
Hardness Compressive Strength

181
compressive strength by an increasing amount. At room temperature and 1100°C this test
will lead to false readings.
Figure 97: Compressive strength of 100F(10N-1:1) and the adjusted hardness curve.
4.7.4 Discussion of Rockwell superficial surface hardness tests.
In general, the compressive strength of ground glass-based geopolymers and OPC
exposed to impulse loading exhibited a good correlation to Rockwell superficial hardness
test measurements, while fly ash-based geopolymers did not. This surface hardness test
may be used, not only to determine the compressive strength of materials, but also to gain
an understanding of an accident situation by determining the temperature profile. This
may help investigators determine the source of an accident and give them a clearer
understanding of what transpired during the accident.
0
1000
2000
3000
4000
5000
6000
7000
22 300 600 900 1100
Co
mp
ress
ive
Str
ength
(p
si)
Temperature (°C)
100F(10N-1:2) Impulse
100F(10N-1:2) Compressive Strength

182
Chapter 5: Conclusions and Recommendations
Chapter 5 contains conclusions drawn from this research and recommendations for future
use of this research and suggestions for additional research related to this research.
Over the course of this study, all of the questions that this research set out to answer were
answered. Several conclusions can be drawn regarding these questions:
Geopolymer concrete can be used to improve a structure’s durability under both ramped
and impulse thermal loading up to at least 1100°C, outperforming OPC and CAC in both
loading conditions. Fly ash and ground glass both are beneficial to the performance of
geopolymers at elevated temperatures. The specifics as to what materials are beneficial to
each type of geopolymer are discussed in the upcoming sections. The thermal properties
of geopolymer concrete were enhanced by material selection, particularly thermal
conductivity by the use of taconite tailings as coarse aggregate. Further discussion of
thermal properties is included in the following sections.
5.1 Compressive Strength
In all mixtures, increasing the proportion of sodium silicate in the precursor solution
corresponded to an increase in compressive strength. Mixtures that used a larger
proportion of sodium hydroxide or increased the concentration of sodium hydroxide did
not fare as well as those with larger proportions of sodium silicate. Potassium hydroxide
alone was found to be an ineffective activator without the inclusion of a silicate in
solution. This suggests that a higher silica/sodium ratio leads to a higher compressive

183
strength in both fly ash and ground glass-based geopolymers. All mixtures that fared well
have a silica/sodium ratio of 6.2 or higher.
Several conclusions can be obtained from the compressive strength data collected:
• Fly ash-based mixtures 100F(10N-1:1) and 100F(10N-1:2) had higher room
temperature compressive strengths than their ground glass-based counterparts
100F(10N-1:1) and 100F(10N-1:2).
• Fly ash-based mixtures with potassium hydroxide activators maintained low
compressive strengths.
• Increasing the molarity of sodium hydroxide in the activator solution from 10N
to 15N lead to a decrease in compressive strength in both fly ash-based and
ground glass-based geopolymers.
• Increasing the molarity of potassium hydroxide activator from 10M to 15M lead
to an increase in compressive strength in fly ash-based geopolymers.
• Changing the proportions of sodium hydroxide/sodium silicate from 1:1 to 1:2
resulted in compressive strength gains in both fly ash-based and ground glass-
based geopolymers.
• Changing the proportions of sodium hydroxide/sodium silicate from 1:1 to 2:1 led
to a decrease in compressive strength in both fly ash-based and ground glass-
based geopolymers.
• Using sodium hydroxide as the sole activator ingredient led to a decrease in
compressive strength in fly ash-based geopolymers.

184
• Mixing metakaolin with ground glass and/or fly ash in the precursor led to low
compressive strengths. This is likely due to the higher rate of reaction of
metakaolin compared to the other precursors.
• Mixing ground glass with fly ash in the precursor led to an increase in
compressive strength from that of ground glass-based geopolymers, but a
decrease in compressive strength from that of fly ash-based geopolymers.
• Geopolymers made with a precursor containing soda-lime glass had higher room
temperature compressive strengths than geopolymers made with a precursor
containing aluminosilicate glass. This is likely due to the higher calcium content
in soda-lime glass.
5.2 High Temperature Durability Under Impulse Thermal Loading and Quenching
The mixtures that exhibited the best overall performance for use in a safety system at a
nuclear power plant were 100GA(10N-1:2) and 100F(10N-1:1).
Several conclusions can be drawn from the data collected in this phase of the research:
• Changing the sodium hydroxide/sodium silicate ratio from 1:1 to 1:2 resulted in
lowering the maximum compressive strength at 300°C in fly ash-based and
ground glass-based geopolymers.
• Mixing other precursors with fly ash led to mixtures with lower compressive
strengths than that of mixtures created solely using fly ash precursors.
• All geopolymer mixtures exhibited strength gains upon exposure to 300°C,
followed by continued strength loss at 600°C and 900°C.

185
• 100GA(10N-1:2) and 100F(10N-1:1) both gained strength upon exposure to
1100°C, while all other mixtures continued to lose strength.
• 100GA(10N-1:2) maintained the highest minimum compressive strength.
• Fly ash-based mixtures maintained the highest compressive strength up to 600°C.
• 100GA(10N-1:2) had the highest compressive strength from 900°C to 1100°C.
• OPC and CAC exhibited fracturing and spalling at temperatures of 600°C and
above.
• Fly ash-based geopolymers exhibited less thermal expansion than ground glass-
based geopolymers, both upon heating and after quenching.
• Geopolymer mixtures did not exhibit significant cracking or visible damage.
• Ground glass-based mixtures began to “melt” and deform at temperatures of
900°C and above.
• Quenching did not have a significant effect on the compressive strength or
thermal expansion of geopolymers.
• OPC completely disintegrated upon quenching at high temperatures, while CAC
fractured and eroded.
• All geopolymers outperformed the OPC and CAC control mixtures upon both
heating and quenching.
5.3 High Temperature Durability Under Ramped Thermal Loading and Quenching
The mixtures that exhibited the best overall performance for use in a protecting against
damage in a structural fire were 100GA(10N-1:2) and 100F(10N-1:2).

186
Several conclusions can be drawn from the data collected in this phase of the research:
• Changing the sodium hydroxide/sodium silicate ratio from 1:1 to 1:2 resulted in
higher compressive strengths overall in ground glass-based geopolymers.
• Changing the sodium hydroxide/sodium silicate ratio from 1:1 to 1:2 resulted in
lower compressive strengths in fly ash-based geopolymers, except at 900°C.
• Mixing other precursors with fly ash led to mixtures with lower compressive
strengths than that of mixtures created solely using fly ash precursors.
• 100F(10N-1:2) maintained the highest minimum compressive strength.
• All geopolymer mixtures exhibited strength loss between 600°C and 900°C.
• 100F(10N-1:2) and 100F(10N-1:1) both gained strength and 100GA(10N-1:2)
maintained strength upon exposure to 1100°C, while all other mixtures continued
to lose strength.
• OPC and CAC exhibited fracturing and spalling at temperatures of 600°C and
above.
• Fly ash-based geopolymers exhibited less thermal expansion than ground glass-
based geopolymers, both upon heating and after quenching.
• Geopolymer mixtures with unmixed precursors did not exhibit significant
cracking or visible damage.
• Ground glass-based mixtures began to “melt” and deform at high temperatures.
• Quenching did not have a significant effect on the compressive strength or
thermal expansion of fly ash-based geopolymers.

187
• Ground glass-based geopolymers exhibited similar behavior upon quenching as
both quenched and unquenched impulse thermal loaded specimens, suggesting
thermal shock loading causes this behavior.
• OPC completely disintegrated upon quenching at high temperatures, while CAC
fractured and eroded.
• Geopolymers outperformed the OPC and CAC control mixtures upon both
heating and quenching.
5.4 Thermal Conductivity, Molten Metal, and Surface Hardness Tests
Several conclusions can be drawn from the molten metal, thermal conductivity, and
hardness tests:
• Thermal conductivity testing.
o Thermal conductivity of geopolymer mortars decreased with increases in
weight percent of silica.
o There was a 28% increase in thermal conductivity when taconite tailings
were used as a coarse aggregate in place of conventional gravel aggregate.
• Molten metal testing.
o The OPC sample produced large amounts of steam, while the geopolymers
specimen produced almost no steam.
o Natural convection occurred in the clear liquid that rose to surround the
molten metal. This was not effective in OPC because the liquid was water
and it continued to boil away upon contact.

188
o The extent of visible damage was much greater in the OPC specimen than
in the geopolymer specimen.
o Extensive cracking, spalling, and degradation of surface material occurred
in the OPC sample, while the geopolymer showed none of these effects.
• Hardness testing.
o HR15Y Rockwell Superficial Hardness test values can be used to obtain
approximate compressive strength values in ground glass-based
geopolymers and OPC exposed to impulse thermal loads.
o The compressive strength of fly ash-based geopolymers exposed to
impulse thermal loading is not as closely related to HR15Y test values but
can be used as a guide in some cases.
5.5 Recommendations for Use in Future Applications
The results of this study suggest that geopolymers can be useful in high temperature
applications. This includes their use as passive safety barriers against the release of
radioactive material in a nuclear power plant during a core meltdown and as a protection
against thermal damage in structural fire.
5.5.1 Application as safety barriers in nuclear power plants.
Both fly ash and ground glass-based geopolymers exhibit great potential for use as
barriers to prevent the release of radioactive material in the event of a core meltdown at a
nuclear power plant. Using both types of geopolymer in composite provides the
opportunity to not only contain the corium, but also to potentially immobilize it. This

189
would likely aid in the cooling and removal of the radioactive material and protect the
public from the harmful effects of exposure to it. It exhibits the potential to greatly
improve the reliability of containment and improve the public perception of the safety of
nuclear power plants.
This research has found that ground glass-based geopolymers exhibit potential for in-situ
vitrification and immobilization of corium, while fly ash-based geopolymers demonstrate
advanced resistance against high temperatures and may act as a zeolitic filter, providing
further protection against the release of leachant or other harmful materials over time.
Both types maintain a high resistance to thermal shock loading upon heating and cooling,
including quenching in water. In a system using both of these geopolymer types in
composite, it is recommended that the glass-based mixture line the edge of a cavity
designed to catch the molten corium as it falls from the bottom of the pressure vessel
during a core meltdown. The cavity must provide sufficient space to account for the
volume of the corium and the thermal expansion of the geopolymers. It is also
recommended that a sufficient amount of glass based-geopolymer material is included so
that the edges of the volume will not melt in most accident scenarios. This would likely
provide a waterproof barrier as the geopolymer transitions from a solid to molten state
and vitrification occurs, leading to a transition zone containing uncontaminated glasslike
material. It is recommended that a layer of fly ash-based geopolymer surround the ground
glass-based geopolymer on all sides except the top. Although this layer exhibits the
potential to contain the corium on its own, as long as there is a sufficient volume of
ground glass-based geopolymer contained within it then it should only have to act in this

190
capacity if anomalies or hot spots appear that cause excess thermal loading. The primary
function of this layer would be to provide additional heat resistance protection to the
concrete surrounding it and to capture any leachant or stray radioactive material that may
have flowed through the ground glass-based layer by zeolitic filtration. Between the
ground glass-based and fly ash-based layers it is recommended that a geopolymer with
50% fly ash and 50% ground glass precursor be used. This would help ease the transition
at the interface and minimize the effects of different strengths and thermal expansions
between the two types of geopolymers. As a final precaution, it is recommended that a
layer of impermeable, high density UHPC surround the fly ash mixture to protect against
intrusion from exterior material and as a final measure to ensure no material escapes
containment. This layer should be placed far enough away from the corium catcher cavity
to ensure it is not significantly affected by high temperatures. Beyond this layer the
structure of the nuclear power plant could be made of PPC just as it currently is. In this
system the PPC will not be exposed to high enough temperatures to cause a significant
loss of capacity. A conceptual illustration of what this system could look like along with
the current system is shown in Figure 98.
In this system molten corium would fall onto the ground glass-based geopolymer and
begin to melt it, mixing with it in the process. The corium would continue to melt
through, falling into the cavity below. The geopolymer blocks on either side of the melted
hole would continue to press against the molten corium and provide it with mixing
material as they slide down the inclined ramps. In the cavity the corium would continue
to melt material in the radial direction and continue mixing by natural convection flow.

191
Figure 98: Current (left) and conceptual composite (right) barrier safety system.
At some distance in the radial direction the temperature would no longer be high enough
to melt the ground glass-based geopolymer and cooling would begin, forming a glass
zone that could potentially be waterproof. As cooling continues inwardly it would
immobilize the corium within a glass matrix. During heating the fly ash-based layer
would be exposed to high enough temperatures to enable zeolite formation at some
distance from the corium. This would create a zeolite zone, which would provide further
immobilization of any radioactive materials that may leech out of the ground glass-based
geopolymer. The UHPC layer would prevent ground water or other materials from
leaking in and potentially disrupting the system. Taconite tailings may be used as a
coarse aggregate in any of the mixtures to increase thermal conductivity and draw
thermal energy away from the heat source.

192
5.5.2 Application as protection against thermal damage in structural fires.
Fly ash-based and ground glass-based geopolymers exhibit potential for use as protection
against thermal damage in a structural fire. Ground glass-based geopolymers show
promise as a foaming fireproof coating due to their relatively high thermal expansion. By
creating distance between the face of the geopolymer and the structure it provides added
protection against exposure to fire. Fly ash-geopolymers may be used as fireproof
coatings or as structural materials that are more resistant to fire than OPC since they have
a relatively low thermal expansion and a high compressive strength. Both of these
materials exhibit potential to improve the safety of buildings and their occupants and to
minimize damage due to structural fires. Taconite tailings may be used as a coarse
aggregate in any of the mixtures to increase thermal conductivity and draw thermal
energy away from the heat source.
These geopolymers also may potentially be used in the construction of wildfire shelters.
Since they are much more resistant to heat than OPC and do not lose as much structural
capacity upon exposure to heat, fly ash-based geopolymers may be used as the primary
material in wildfire shelters for residents or firefighters that become trapped in a wildfire.
These materials are more insulative than OPC as well, so the heat will not be able to
travel through the material as fast, protecting the people inside. Ground glass-based
geopolymers could provide further insulation as an outside coating on the shelter. As a
fire approaches the shelter, the ground glass-based geopolymer would begin to expand,
providing additional insulation to protect the shelter seekers inside. In addition, taconite
tailings could be strategically placed in the outer layers and designed to help draw heat

193
into the ground, delaying or decreasing the amount of heat travelling into the walls of the
shelter.
Similarly, fly ash-based geopolymers can potentially be used to increase the insulating
effectiveness of walls in residential and commercial buildings. Since they are naturally
more insulative than PPC, they would decrease heat flow into a building on a hot day and
decrease heat flow out of a building on a cold day. Taconite tailings may also be useful in
redirecting thermal energy in a building. By including taconite tailings in the outer layer
of the outside walls of a building, heat from the sun could be redirected into the ground
more efficiently and less heat energy would be available to travel inwardly through the
walls. This would increase the energy efficiency of the building.
5.6 Recommendations for Future Research
Although this research has revealed important information pertaining to the use of
geopolymers in high temperature applications, further research is required to gain a full
understanding of these materials and to optimize their use. Recommendations for future
research include:
• Microstructural study of both types of geopolymers to determine what phases are
present, how these phases evolve, and their relation to material performance. The
effect that variables have on the microstructure also need to be determined.
• Study of the pore structural, connectivity, and evolution of porosity.
• Determination of the ion exchange and fluid transport capabilities for potential
use as a filter on a large scale.

194
• Study of the transition zone between geopolymer types.
• Establishment of the effects of taconite tailings on thermal expansion and
compressive strength.
• Computational thermal analysis to determine strategic material placement.
• Additional thermal properties like specific heat capacity, thermal stress, etc. need
to be determined.
• Study and optimization of zeolite formation in fly ash-based geopolymers.
• Study and optimization of mixing and vitrification abilities in ground glass-based
geopolymers.
• The mechanisms behind the strength decrease observed at 7 days in many
geopolymers needs to be researched
• Study of interaction with carbon steel and other types of reinforcement. Chemical
attack and corrosion protection capabilities, differences in thermal expansions,
and interface bond strength need to be determined, among other properties.
• Determine the effects of long term aging under various conditions. The effects of
cyclic thermal loading over time, long-term exposure to salts, chlorides, and other
potentially damaging chemicals, and long-term exposure to hot and wet
environments needs to be determined.
• The sensitivity of geopolymers to changes in compositions of the same types of
precursors needs to be evaluated.

195
References
[1] Nuclear Energy Institute. (2017). Knowledge center.https://www.nei.org/Knowledge-
Center/How-Nuclear-Reactors-Work
[2] World Nuclear Association. (2017). Generation IV nuclear
reactors.http://www.world-nuclear.org/information-library/nuclear-fuel-
cycle/nuclear-power-reactors/generation-iv-nuclear-reactors.aspx
[3] Angstrom Sciences. (2007). Zirconium Metal [Material Safety Data Sheet].
http://www.angstromsciences.com/sites/angstromsciences.com/files/files/msds/Zirco
nium.pdf
[4] Hausner, H. (1965). Determination of the melting point of uranium dioxide. Journal
of Nuclear Materials, 15(3), 179–183. https://doi.org/10.1016/0022-3115(65)90178-
9
[5] Van Dorsselaere, J., Albiol, T., & Micaelli, J. (2011). Research on severe accidents in
nuclear power plants. In P. Tsvetkov (Ed.), Nuclear power - operation, safety and
environment (pp. 155-182) InTech.
[6] Hager, I. (2013). Behaviour of cement concrete at high temperature. Bulletin of the
Polish Academy of Sciences, Technical Sciences, 61(1). doi:10.2478/bpasts-2013-
0013
[7] VanOss, H. G. (2017). U.S. geological survey, mineral commodity summaries. United
States Geological Survey.
[8] Habert, G., & Ouellet-Plamondon, C. (2016). Recent update on the environmental
impact of geopolymers. RILEM Technical Letters, 1, 17–23. Retrieved from
https://letters.rilem.net/index.php/rilem/article/view/6/9

196
[9] Zhang, Q., & Ye, G. (2012). Dehydration kinetics of Portland cement paste at high
temperature. Journal of Thermal Analysis and Calorimetry, 110(1), 153-158.
doi:10.1007/s10973-012-2303-9
[10] Castellote, M., Alonso, C., Andrade, C., Turrillas, X., & Campo, J. (2004).
Composition and microstructural changes of cement pastes upon heating, as studied
by neutron diffraction. Cement and Concrete Research, 34(9), 1633-1644.
doi:https://doi.org/10.1016/S0008-8846(03)00229-1
[11] Alonso, C., & Fernandez, L. (2004). Dehydration and rehydration processes of
cement paste exposed to high temperature environments. Journal of Materials
Science, 39(9), 3015-3024.
[12] Alarcon-Ruiz, L., Platret, G., Massieu, E., & Ehrlacher, A. (2005). The use of
thermal analysis in assessing the effect of temperature on a cement paste. Cement
and Concrete Research, 35(3), 609-613.
doi:https://doi.org/10.1016/j.cemconres.2004.06.015
[13] Arioz, O. (2007). Effects of elevated temperatures on properties of concrete. Fire
Safety Journal, 42(8), 516-522. doi:https://doi.org/10.1016/j.firesaf.2007.01.003
[14] Dehydration process of calcium silicate hydrate during heating in the air. Trans Tech
Publications. doi:- 10.4028/www.scientific.net/AMR.287-290.785
[15] Handoo, S. K., Agarwal, S., & Agarwal, S. K. (2002). Physicochemical,
mineralogical, and morphological characteristics of concrete exposed to elevated
temperatures. Cement and Concrete Research, 32(7), 1009-1018.
doi:https://doi.org/10.1016/S0008-8846(01)00736-0
[16] Davidovits, J. (2002). 30 years of successes and failures in geopolymer applications.
Melbourne, Australia: Geopolymer 2002 Conference.

197
[17] Vickers, L., VanRiessen, A., & Rickard, W. D. (2015). Precursors and additives for
geopolymer synthesis. Fire-resistant geopolymers (8th ed., pp. 17-23). Singapore:
Springer.
[18] Joshi, S. V., & Kadu, M. S. (2013). Role of alkaline activator in development of eco-
friendly fly ash based geopolymer concrete. International Journal of Environmental
Science and Development, 3(5), 417-421.
[19] Duxson, P., Fernandez-Jimenez, A., & Provis, J. L. (2007). Geopolymer technology:
The current state of the art. Journal of Materials Science, 42, 2917-2933.
[20] Abdulkareem, O. A., & Bakri, A. M. (2013). Alteration in the microstructure of fly
ash geopolymers upon exposure to elevated temperatures. Advanced Materials
Research, 795, 201-205. doi:10.4028/www.scientific.net/AMR.795.201
[21] Patil, K. K., & Badar, M. S. (2014). Evaluation of geopolymer concretes at elevated
temperature. Developments in Strategic Materials and Computational Design IV, 79-
95.
[22] Rovnanak, P., & Afrankova, K. (2016). Thermal behaviour of Metakaolin/Fly ash
geopolymers with chamotte aggregate doi:10.3390/ma9070535
[23] Lin, T. S., Jia, D. C., He, P. G., & Wang, M. R. (2009). Thermo-mechanical and
microstructural characterization of geopolymers with Al2O3 particle
filler. International Journal of Thermophysics, 30(5), 1568. doi:10.1007/s10765-
009-0636-9
[24] Ranjbar, N., Mehrali, M., Alengaram, U. J., Metselaar, H. S. C., & Jumaat, M. Z.
(2014). Compressive strength and microstructural analysis of fly ash/palm oil fuel
ash based geopolymer mortar under elevated temperatures. Construction and
Building Materials, 65, 114-121. doi:10.1016/j.conbuildmat.2014. 04.064

198
[25] Zhang, H. Y., & Kodur, V. (2016). Comparative thermal and mechanical
performance of geopolymers derived from metakaolin and fly ash. Journal of
Materials in Civil Engineering, 28(2), 1-12. doi:10.1061/(ASCE)MT.1943-5533
.0001359
[26] Kong, D. L. Y., & Sanjayan, J. G. (2010). Effect of elevated temperatures on
geopolymer paste, mortar and concrete. Cement and Concrete Research, 40(2), 334-
339. doi:10.1016/j.cemconres.2009.10.017
[27] Nimiri, A., Yazoghli-Marzouk, O., & Duc, M. (2016). Temperature effect on
mechanical and physical proprieties of Na or k alkaline silicate activated metakaolin-
based geopolymers. Italian Journal of Engineering Geology and Environment,
15(1), 5-15. doi:10.4408/IJEGE.2016-01.O-01
[28] Kong, D. L. Y., Sanjayan, J. G., & Sagoe-Crentsil, K. (2008). Factors affecting the
performance of metakaolin geopolymers exposed to elevated temperatures. Journal
of Materials Science, 43(3), 824-831. doi:10.1007/s10853-007-2205-6
[29] Christiansen, M. U. (2013). An Investigation of Waste Glass-Based Geopolymers
Supplemented with Alumina (Unpublished doctoral dissertation). Michigan
Technical University, Houghton, MI.
[30] Ahmed, I. (1991). Use of waste materials in highway Construction. ( No.
FHWA/INJHRP-91/3). Purdue University
[31] Aluminosilicate glass. (2017). Retrieved from
https://www.continentaltrade.com.pl/aluminosilicate-glass
[32] Pan, Z., & Sanjayan, J. G. (2010). Stress–strain behaviour and abrupt loss of
stiffness of geopolymer at elevated temperatures
doi:10.1016/j.cemconcomp.2010.07.010

199
[33] Pan, Z., & Sanjayan, J. G. (2012). Factors influencing softening temperature and
hot-strength of geopolymers. Cement and Concrete Composites, 34(2), 261-264.
doi:10.1016/j.cemconcomp.2011.09.019
[34] Bayuaji, R., Darmawan, S., Husin, N. A., Wibowo, B., Subekti, S., Ekaputri, J., Ruki
Biyanto, T. (2017). The effect of high temperature on compression strength of
geopolymer paste. MATEC Web Conf., 97. doi:10.1051/matecconf/20179701020
[35] Abdullah, M. M., & Kamarudin, H. (2013). Microstructure studies on the effect of
the alkaline activators of fly ash-based geopolymer at elevated heat
treatment. Applied Mechanics and Materials, 421, 342-348.
doi:10.4028/www.scientific.net/AMM.421.342
[36] Rickard, W. D. A., Williams, R., Temuujin, J., & van Riessen, A. (2011). Assessing
the suitability of three australian fly ashes as an aluminosilicate source for
geopolymers in high temperature applications. Materials Science and Engineering:
A, 528(9), 3390-3397. doi:10.1016/j.msea.2011.01.005
[37] Rickard, W. D. A., Temuujin, J., & van Riessen, A. (2012). Thermal analysis of
geopolymer pastes synthesised from five fly ashes of variable composition. Journal
of Non-Crystalline Solids, 358(15), 1830-1839.
doi:10.1016/j.jnoncrysol.2012.05.032
[38] Bernal, S. A., Rodraguez, E. D., Meja, d. G., Gordillo, M., & Provis, J. L. (2011).
Mechanical and thermal characterisation of geopolymers based on silicate-activated
metakaolin/slag blends. Journal of Materials Science, 46(16), 5477.
doi:10.1007/s10853-011-5490-z
[39] Zhang, H. Y., Kodur, V., Qi, S. L., Cao, L., & Wu, B. (2014). Development of
metakaolin–fly ash based geopolymers for fire resistance applications. Construction
and Building Materials, 55, 38-45. doi:10.1016/j.conbuildmat.2014.01.040

200
[40] Rickard, W. D. A., Kealley, C. S., & van Riessen, A. (2015). Thermally induced
microstructural changes in fly ash geopolymers: Experimental results and proposed
model. Journal of the American Ceramic Society, 98(3), 929-939.
doi:10.1111/jace.13370
[41] Barbosa, V. F. F., & MacKenzie, K. J. D. (2003). Thermal behaviour of inorganic
geopolymers and composites derived from sodium polysialate. Materials Research
Bulletin, 38(2), 319-331. doi:10.1016/S0025-5408(02)01022-X
[42] Mohd Salahuddin, M. B., Norkhairunnisa, M., & Mustapha, F. (2015). A review on
thermophysical evaluation of alkali-activated geopolymers
doi:10.1016/j.ceramint.2014.11.119
[43] Villaquirán-Caicedo, M. A., de Gutiérrez, R. M., Sulekar, S., Davis, C., & Nino, J.
C. (2015). Thermal properties of novel binary geopolymers based on metakaolin and
alternative silica sources. Applied Clay Science, 118, 276-282.
doi:https://doi.org/10.1016/j.clay.2015.10.005
[44] Rickard, W. D. A., Borstel, C. D., & van Riessen, A. (2013). The effect of pre-
treatment on the thermal performance of fly ash geopolymers. Thermochimica
Acta, 573, 130-137. doi:10.1016/j.tca.2013.09.030
[45] Containment Building - Nuclear Power. Retrieved from http://www.nuclear-
power.net/nuclear-power-plant/containment-building/
[46] Hydration II. Retrieved from https://ay16.moodle.umn.edu/pluginfile.php/1304752
/mod_resource/content/0/7.5 - CE 5027 - Hydration II.pdf
[47] Liew, Y.-M., Heah, C.-Y., Mohd Mustafa, A. B., & Kamarudin, H. (2016). Structure
and properties of clay-based geopolymer cements: A review. Progress in Materials
Science, 83, 595–629. https://doi.org/10.1016/j.pmatsci.2016.08.002

201
[48] Morsy, M. S., Alsayed, S. H., Al-Salloum, Y., & Almusallam, T. (2014). Effect of
Sodium Silicate to Sodium Hydroxide Ratios on Strength and Microstructure of Fly
Ash Geopolymer Binder. Arabian Journal for Science and Engineering, 39(6),
4333–4339. https://doi.org/10.1007/s13369-014-1093-8
[49] Westinghouse Electric Company LLC (2011). AP1000 Overview [PDF Document].
Retrieved from https://www.iaea.org/NuclearPower/Downloads/Technology/
meetings/2011-Jul-4-8-ANRT-WS/2_USA_UK_AP1000_Westinghouse_Pfister.pdf
[50] Schloesser, C. & Christiansen, M. U. (2017). [Alkali Leaching of Glass Based-
Geopolymers]. Unpublished raw data.