Embed Size (px)
Citation preview

University of Missouri, St. LouisIRL @ UMSL
Dissertations UMSL Graduate Works
10-28-2008
An Investigation of Career and TechnicalEducation in Local School Districts and the SpecialSchool District of St. Louis County, MissouriDavid P. BakerUniversity of Missouri-St. Louis, [email protected]
Follow this and additional works at: https://irl.umsl.edu/dissertation
Part of the Education Commons
This Dissertation is brought to you for free and open access by the UMSL Graduate Works at IRL @ UMSL. It has been accepted for inclusion inDissertations by an authorized administrator of IRL @ UMSL. For more information, please contact [email protected].
Recommended CitationBaker, David P., "An Investigation of Career and Technical Education in Local School Districts and the Special School District of St.Louis County, Missouri" (2008). Dissertations. 532.https://irl.umsl.edu/dissertation/532
An Investigation of Career and Technical Education in Local School Districts and the Special School District of St. Louis County, Missouri
A Dissertation
July 2008
Submitted to the Faculty of
The University of Missouri - St. Louis in partial fulfillment of
the requirements for the degree of Doctor of Education
David P. Baker
12285247
M.Ed. University of Missouri – St. Louis M.B.A. Fontbonne University B.S. Missouri State University
University of Missouri – St. Louis
Committee Carole Murphy, Ed.D – Chair Lloyd Richardson, Ph.D Kenneth Owen, Ed.D William Rebore, Ph.D

Baker, David, 2008, UMSL, p. 2
Dr. Carole Murphy and Dr. Lloyd Richardson, I sincerely thank you for your time, patience and encouragement in this endeavor. Dr. Chris Baldwin, my friend and colleague, I could not have accomplished this without your help. I recognize four mentors who have assisted me in forming my leadership skills and who have helped me to understand the necessity of being prepared: Dr. David Cramp, Mr. David Skillman, Dr. James Sandfort, and Dr. Peter Kachris. I was wise to trust your advice and I will always appreciate the guidance you have provided me. “…the really great make you feel that you, too, can become great.” G. Maclaren I thank my mother, Rosemary, for her complete and constant devotion. Your accomplishments have been my inspiration. I love you, mom. I thank my father, Ron, whose life and work have helped me understand the importance of Career and Technical Education. I love you, dad. I thank my uncle, Jimmy, for his love and support. Thanks for not hiring me. Dominic and Caroline, I love you more than you can comprehend. I hope you take pride in your dad’s work. Angela, thank you for your confidence in me. I love you. Thank you to the faculty and staff of South Technical High School for your hard work each day. I especially thank George Neimeyer, Eric Wilhelm, and Dennis Mix for your collegiality and support. Thank you to Eric Carriker for your technical support.

Baker, David, 2008, UMSL, p. 3
Abstract
This investigation focuses on the perceptions of knowledge held by public high
school guidance counselors in St. Louis County, Missouri regarding career and technical
education (CTE), particularly North and South Technical High Schools, a division of the
Special School District (SSD). At the time of this investigation 153 high school guidance
counselors were identified in public high schools in St. Louis County. Each counselor
was given a 35 item survey, which provided the investigator with demographic
information and information regarding the counselor’s perceptions in three subsets of
counselor knowledge: CTE candidates, CTE reform and post-secondary opportunities,
and CTE program development and instruction.
Three univariate three-factor ANOVAs were conducted in order to determine
whether the factors impacted counselors’ perceptions in the subsets of counselor
knowledge; these three factors were region (north, south, or west), special education
teacher training, and a personal connection to CTE as a student or through CTE teacher
training. Chi-square tests were conducted to see if equal representation of other
demographic information across these three factors existed. Because it was determined
that there was unequal representation in two categories, age and gender, three-factor
ANCOVAs were conducted with the original three factors and counselor knowledge
subsets using age and gender as covariates. It was determined that there were no
significant differences in the means of the counselors’ perceptions in regard to region,
special education teacher training, and a personal connection to CTE.
The three ANOVA factors were chosen based upon student population in the two
CTE high schools and the region(s) each serves, association with SSD, and the affect of a
Baker, David, 2008, UMSL, p. 4
personal connection to CTE. Guidance counselors are presumably the most influential
educators in determining whether students receive information and encouragement
regarding CTE. It is of utmost importance to SSD and its CTE division to determine
what impacts counselors’ perceptions of CTE and their decisions to recommend CTE to
students.

Baker, David, 2008, UMSL, p. 5
TABLE OF CONTENTS
CHAPTER 1: INTRODUCTION TO THE INVESTIGATION ………... 7 Overview of Career and Technical Education …………………... 7 Problem Background ……………………………………………. 10 The Problem ……………………………………………………... 12 Statement of the Problem ………………………………………... 12 Research Questions ……………………………………………… 13 Null Research Hypotheses ……………………………………… 14 Limitations of the Investigation ………………………………… 14 Assumptions of the Investigation ………………………………. 14 Importance of the Investigation …………………………………. 15 Definition of Terms ……………………………………………… 15 CHAPTER 2: REVIEW OF LITERATURE…………………………… 17 CTE Past and Present ………………………………………........ 17 The Carl Perkins Act and High Schools That Work ……………. 19 Societal Needs ………………………………………………….. 21 Not All Students Should Pursue a Bachelor’s Degree …………. 25 CTE Mistakes …………………………………………………... 27 Conclusion ……………………………………………………… 28 CHAPTER 3: METHODOLOGY …………………………………….. 31 Overview ………………………………………………………. 31 Rationale ………………………………………………………. 31 Survey of Counselors ………………………………………….. 33 Procedure ………………………………………………………. 35 CHAPTER 4: RESULTS ……………………………………………... 37 Design ………………………………………………………… 37 Univariate ANOVA Results …………………………………... 40 Univariate ANOVA Results …………………………………... 42 Univariate ANOVA Results …………………………………... 44 Chi-Square Results ……………………………………………. 60 One-Way ANOVA Results …………………………………… 62 One-Way ANOVA Results …………………………………… 64 One-Way ANOVA Results …………………………………… 66

Baker, David, 2008, UMSL, p. 6
CHAPTER 5: LIMITATIONS, FINDINGS, IMPLICATIONS ….. 67 Discussion ………………………………………………….. 67 Assumptions and Limitations ………………………………. 68 Findings and Conclusions …………………………………... 71 Practical Implications ………………………………………. 72 REFERENCES ……………………………………………………... 75 APPENDICES ……………………………………………………… 81 A: Correspondence ………………………………………… 81 B: Survey ………………………………………………….. 82 C: ANCOVA Results and Data Analysis …………………. 85 D: Frequency Tables ………………………………………. 103 E: Counselor Comments …………………………………... 114 F: SIS Data® - 2006-2007 Program Participation ………… 116

Baker, David, 2008, UMSL, p. 7
Chapter 1
Introduction to the Investigation
Overview of Career and Technical Education Since 1900
Recently there has been indication of a resurgence of secondary career and
technical education (CTE) throughout the United States. Comprehensive high schools,
which have made standardized testing a primary focus as a result of reports such as A
Nation at Risk and legislation such as No Child Left Behind (NCLB), are struggling to
engage many students with traditional forms of instruction and subject matter.
Automotive shops and machining technology programs are making their way back into
traditional high schools while computer hardware and information systems programs are
being expanded and in some cases transformed into academies. Lynch wrote, “Thus,
according to federal reports, vocational education courses or programs are offered in
93 percent of the nation’s 15,200 comprehensive, grade 9-12 high schools” (2000,
Abstract, para. 3). Project Lead the Way – Engineering is a nationally recognized
engineering academy, which has been instituted at the secondary level. This academy
focuses on preparing students to enter engineering programs by enhancing mathematics
and physics courses in high school (Project Lead The Way, 2006). This trend of renewed
interest in programs that provide specific skills, not necessarily beneficial to the
acquisition of a bachelor’s degree, is an indicator that career and technical education is
receiving renewed attention.
The beginning of the 20th Century was witness to significant discontent regarding
the state of public education in the United States. The Horace Mann model, which had
been the standard since the early part of the previous century, was not sufficiently

Baker, David, 2008, UMSL, p. 8
meeting the needs of an increasingly industrialized nation (Brouillette, 1999). The goal
of the Mann model had been to provide a common education with common content to all
students since instruction was provided with public funds; public education should teach
the basic skills needed to function in a democratic society. There was more than one idea
about how public education should be changed; however, the common indication was
that it should extend beyond the traditional core curriculum to add instruction, which was
practical and included activities that were hands-on. Even in the early 1900s much public
high school education was geared toward preparation for college, so a formal system of
job preparation was not readily available. Calvin Woodward of the St. Louis Manual
Training School was vocal about the sincere need to create skilled labor training for a
significant number of the nation’s youth (Greenwood, 1983).
Other voices were more critical than Mr. Woodward’s regarding their demand for
the incorporation of vocational training in America’s public high schools. Charles
Prosser, executive secretary of the National Society for the Promotion of Industrial
Education (NSPIE), and Ellen Richards, an early leader in home economics, both deemed
vocational education as essential for many families across the United States. The result
of their work and the movement they led was federal legislation in the form of the Smith-
Hughes Act of 1917 (Greenwood, 1983). This legislation designated authority and
guidelines for vocational teacher certification, funding, and an administrative structure
separate from the existing structure to deal with the oversight of vocational education in
individual states. Public education needed to prepare youth for jobs that were created by
the industrial revolution (Swanson, 1951).

Baker, David, 2008, UMSL, p. 9
The Soviet launch of the Sputnik satellite in 1957 again prompted a refocus of
America’s view of public education. The launch created anxiety among Americans and
sparked renewed interest in general science education and science intensive vocational
education. The National Defense Education Act (NDEA) of 1958 was another boost to
vocational education. Title VII of this act increased funding for vocational education,
which specifically provided instruction that would contribute to national defense. The
syntax in this act overrode and updated most of that in the Smith-Hughes Act of 1917
(Oklahoma Department of Career and Technical Education [ODCTE], 2007).
A 1963 study commissioned by the Department of Health, Education, and
Welfare resulted in a report entitled Education for a Changing World. This report was
critical of much of the occupational training that was out of date. This report likely
influenced the National Vocational Education Act (NVEA) of the same year (ODCTE,
2007). The most significant contribution of this act still being utilized today was the
money directed toward construction of area vocational schools throughout the United
States. This act provided federal funding focused on building new facilities for
secondary vocational instruction throughout the United States. Throughout the 1960s
Area Vocational Technical Schools (AVTS) were constructed including North and South
Technical High Schools in St. Louis County. Additionally, the NVEA broadened the
concept of vocational education into non-traditional areas such as health profession
occupations and business and office education. The act also established the concept of
advisory committees to provide guidance and insight for vocational education at state and
local levels (Federal Legislation and Vocational Education, 2006). Two years later the
Vocational Industrial Clubs of America (VICA) was founded as a national club for

Baker, David, 2008, UMSL, p. 10
students involved in vocational education. This club promotes CTE by providing
opportunities for its students to have a role in the development of existing and future
programs and to engage in competitions in their chosen fields; in 1999 the name of this
organization was officially changed to SkillsUSA (SkillsUSA, 2007). In 1968 numerous
amendments were made to the NVEA, which broadened both the definition and the
various curricula of vocational education programs.
Between 1968 and 1984 there was little movement on the national vocational
education front. However, in 1984 the Carl D. Perkins Vocational and Technical
Education Act was passed and there was once again a national spotlight on vocational
education. This legislation was intended to create new interest and raise the standards of
vocational and technical education in the United States at the secondary and post-
secondary levels (Exceptional Family Member Program (EFMP), 2004). In the 2007-
2008 school year the Carl D. Perkins Act was in its third reauthorization. The fourth
reauthorization had been approved by Congress; however, funding was yet to be
determined.
Problem Background
In the early 1970s special education advocates indicated that the special education
population, those with an individualized education plan (IEP), may be well served by
vocational education and insisted that students with special needs have opportunity to
take full advantage of vocational education and training. Because there was less concern
at this time for mainstreaming students with special needs, many vocational high schools
began to see special needs populations in their buildings grow rapidly. “There is an
almost irresistible tendency to consign the slow, the poor, and the difficult students as
Baker, David, 2008, UMSL, p. 11
well as those from certain ethnic groups to programs of occupational preparation” (King
and Brownwell, 1966, p. 54). The reputation of technical schools as institutions with
rigorous instruction was in decline. Many educators and parents did not see vocational
high schools as viable for students who were average to above in academic ability.
Throughout the remainder of the 1970s and into the early 1980s the reputation of
vocational education continued its descent and decreases in its non-IEP student
population was the result (Lynch, 2000).
In 1982 A Nation at Risk indicated that public education in the United States was
underachieving and that there was little accountability for public school officials. In
1984 the first Carl D. Perkins Vocational and Technical Education Act I was authorized
and intended to assist in providing young adults with academic and technical skills
needed to succeed in a transforming economy (EFMP, 2004). This first authorization,
which lasted through 1990, focused on the improvement of teachers and instruction.
There was a significant special education influence evident in this first authorization.
In 1990 The Carl D. Perkins Vocational Education Act II was authorized. This
authorization shifted focus to the improvement of technical and vocational programs
themselves. This focus included equipment, supplies and an enhancement of facilities.
This authorization also included a terminology shift from “vocational” to “applied.”
Vocational and special education advocates had a diminished influence in this first
reauthorization. Focus on program improvement brought renewed but tempered respect
to the field. Also in the early 1990s a shift in political power at the federal level
demanded accountability from public education. The Carl D. Perkins Vocational
Education Act was literally the first federal funding of public CTE that held recipients
Baker, David, 2008, UMSL, p. 12
accountable for outcomes. This legislation’s intent was to revitalize CTE through rigor
and expectation. Whether or not this improvement is manifested to high school guidance
counselors in St. Louis County, Missouri has been unclear.
The Problem
The prosperity of CTE in St. Louis County, Missouri is subject to numerous
challenges including the cooperation of home schools, the selection and relevance of
CTE programs and the effectiveness of instruction in CTE programs. Changes in
graduation requirements including an increase in the number of core requirements may
work against the effectiveness of all Missouri Area Vocational Technical Schools
(AVTS). If North and South Technical High Schools are to continue to provide high
quality CTE programs and attract the number of interested students needed to remain
viable, they must investigate the perceptions that high school guidance counselors have
of the quality and viability of their programs and what factors impact that perception.
Statement of the Problem
The purpose of this study is to evaluate what impacts the perception of knowledge
of CTE in St. Louis County held by high school guidance counselors, the educators who
primarily make decisions regarding student attendance in CTE programs at Special
School District’s (SSD) North and South Technical High Schools.
Baker, David, 2008, UMSL, p. 13
Research Questions
Question One
North Technical High School does not struggle for adequate student population;
South Technical High School does struggle to maintain adequate student population.
North Technical High School draws primarily from public high schools located in the
north region of St. Louis County, Missouri while South Technical High School draws
students primarily from the south and west regions of St. Louis County, Missouri.
Therefore, does the St. Louis County, Missouri region in which a public high school
counselor advises impact his or her perception of knowledge of CTE?
Question Two
North, South, and formerly West Technical High Schools make up the CTE
division of the SSD of St. Louis County, Missouri; the overwhelming majority of SSD’s
certified staff has special education teacher training, serving students with learning,
physical, emotional, and mental disabilities. Therefore, does the fact that a public high
school guidance counselor possesses special education teacher training impact his or her
perception of knowledge of CTE in St. Louis County, Missouri?
Question Three
CTE serves fewer students and utilizes fewer certified staff than does
comprehensive education, which may impact its reputation and acceptance as
mainstream. Therefore, does a personal connection with CTE as a student or through
CTE teacher training impact a high school guidance counselor’s perception of knowledge
of CTE in St. Louis County, Missouri?

Baker, David, 2008, UMSL, p. 14
Null Research Hypotheses
H1: There is no significant difference in perception of knowledge of CTE among high
school guidance counselors in the three regions of St. Louis County, Missouri: north,
south, and west.
H2: There is no significant difference in perception of knowledge of CTE between high
school guidance counselors in St. Louis County, Missouri who possess special education
teacher training and those who do not.
H3: There is no significant difference in perception of knowledge of CTE between high
school guidance counselors in St. Louis County, Missouri who have a personal
connection with CTE as a student or through CTE teacher training and those who do not.
Limitations of the Investigation
The study has been limited to the following:
1. Only public high school guidance counselors will be surveyed regarding
perception of knowledge of CTE in St. Louis County, Missouri.
2. Perception regarding and knowledge of CTE may have been formed/acquired due
to prior experiences and information unrelated to that in St. Louis County,
Missouri.
Assumptions of the Investigation
The investigation makes the following assumptions:
1. The researcher assumes that all counselors will answer questions honestly.
2. The researcher assumes that counselors surveyed will have a perception of CTE.
Baker, David, 2008, UMSL, p. 15
Importance of the Investigation
CTE has received a renewed respect and focus in the United States’ education
landscape. Its ability to engage students in relevant, hands-on instruction assists in the
reduction of drop-out rates and steers students into effective post-secondary education.
The demand for skilled labor in the United States continually increases while supply
dwindles. CTE at the secondary level is key in addressing this shortage. Effective
promotion and funding of CTE is essential to its success. Determining how and why
educators view CTE as they do will assist those who provide this specialized instruction
with knowledge that will enhance it. High school guidance counselors have the ability to
persuade or dissuade students and parents to pursue CTE. Therefore, it is prudent to
establish their perceptions of knowledge of current programs and post-secondary
opportunities, and what factors influence perception.
Definition of Terms
Admissions Representative – employees of SSD, CTE division, who work in conjunction
with home schools to recruit, interview, and place prospective students in CTE programs
at the county’s two technical high schools, North and South.
Articulation Agreement – an agreement between the CTE division of SSD and a post-
secondary institution. This agreement allows students to earn post-secondary credit while
in high school. Credit is transcripted after the student completes a successful semester at
the institution issuing that credit.
Career and Technical Education (CTE) – provides secondary and post-secondary students
with contextual learning, job-related skills, and opportunities for students to explore
career options (ACTE, 2006).

Baker, David, 2008, UMSL, p. 16
Home School – any public or private high school, which participates with a local AVTS
by sending its students for CTE.
Individualized Education Plan (IEP) – a specific plan that identifies deficiencies,
strengths, and needs of a student and is intended to assist educators in providing
appropriate placement and strategies to promote the student’s success. This plan is
agreed upon by the IEP team, which likely consists of a special education teacher, subject
or grade level teachers, parents, administrators, and other specialized personnel. The IEP
is a legal document and is reviewed at least once each year.
Prospective Student – any student of high school age who lives in St. Louis County,
Missouri and attends a public or private high school.
Region – because two technical high schools serve all of St. Louis County, Missouri, the
county has been divided into three regions. The north region consists of the county area
which is west of the Mississippi River or St. Louis City and north of Page Avenue. The
west region consists of the county area which is west of St. Louis City between Page
Avenue and Manchester Road. The west region extends into the county area west of
Interstates 270, north of Dougherty Ferry Road, and south of Page Avenue. The south
region consists of the county area west of the Mississippi River or St. Louis City and
south of Dougherty Ferry Road.

Baker, David, 2008, UMSL, p. 17
Chapter 2
Review of Literature
CTE Past and Present
Career and Technical Education’s (CTE) reputation, support and popularity
cycled through the 20th Century like those of many other education movements. In the
1930s John Dewey indicated that education must be practical and relevant for students.
In the late 1950s American citizens and their government wanted to assure that the
United States kept pace with the Soviet Union and their ventures into space, so they
demanded emphasis be placed on science and technical education. Special education
advocates in the 1970s demanded inclusion for students with disabilities. The multi-
sensory, hands-on approach of CTE manifested it as effective instruction for teaching
students with disabilities (Gaona, 2004). The Nixon administration believed that CTE
would be significant in helping to calm the civil unrest of the early 1970s. If youth could
see importance and relevance in education, they would be less rebellious and focus on
achieving future success (Herschbach, 2001). Because CTE integrates thinking and
doing, cornerstones of the philosophy of the American middle class, it will continue to
receive attention from citizens, educators, and legislators.
The best employers the world over will be looking for the most competent, most
creative and most innovative people on the face of the Earth and will be willing to
pay them top dollar for their services. This will be true not just for the top
professionals and managers, but up and down the length and breadth of the
workforce. Those countries that produce the most important new products and
services can capture a premium in world markets that will enable them to pay
Baker, David, 2008, UMSL, p. 18
high wages to their citizens (New Commission on the Skills of the American
Workforce, 2006 p. 7).
In 2007 CTE was supported by The Carl D. Perkins Career and Technical
Education Improvement Act entering its fourth reauthorization, which demands more
accountability from states and local recipients in accordance with No Child Left Behind
requirements (Career and Technical Education Advisor, 2006). The 21st Century will be
witness to continuing technological advances that will change the methods by which
individuals communicate, travel, and learn. How educators prepare high school students
to participate in the creation of this century is important and will require a break from the
comprehensive high school model, which directs the majority of students toward a
traditional bachelor’s degree (Gray, 2000b). Our national interest dictates the importance
of creating a new and effective model for educating most high schoolers.
Since 1980 the fastest growing group in the United States labor force has been
that of “Technologist,” which includes occupations such as computer technician, x-ray
technician, medical lab technician, pulmonary technician, etc. These technical positions
require extensive technical training, but they do not require four year bachelor degrees
(Drucker, 1994). CTE has the ability and potential to provide high school students with
instruction and exploration that will establish preliminary skills and a basic knowledge of
what careers may be available to them in this new millennium. CTE may also be the best
advocate for a system of progressive and strong community colleges throughout the
United States that offer quality education at a fraction of the cost of most four-year
colleges and universities (Useem, 1986).
Baker, David, 2008, UMSL, p. 19
The Carl Perkins Act and High Schools That Work
Those who already have a vested interest in CTE are clear that the most
immediate challenge is public perception. CTE is too often identified with blue collar,
physical labor and thought to require little mental challenge or problem solving skill.
Even programs that once may have fit this profile have become sophisticated and require
advanced reading and math capabilities: auto technology, welding, machining
technology, etc. CTE students work with expensive and complicated equipment and are
required to apply mathematical and science concepts they learn in the classroom. The
Association for Career and Technical Education (ACTE) has sought to reverse this
negative perception by creating partnerships with industry and post-secondary education
leaders throughout the country (ACTEonline, 2007).
There has been an assumption that students from lower socio-economic
backgrounds are better served by CTE than comprehensive education because it better
prepares them for the careers which they will likely pursue. “Career education, with its
immediate practicality and extended options, offers the best chance to make a secondary
education more responsive to the economic and social needs of minorities” (National
Commission on the Reform of Secondary Education, 1973, p. 55). CTE instructors took
much stock in this assumption and it negatively impacted their preparation and
performance in the classroom. Reform movements such as High Schools That Work
(HSTW), sponsored by the Southern Regional Education Board (SREB), and the Carl
Perkins Career and Technical Education Improvement Act have placed emphasis on CTE
and raised expectations for it. In response to A Nation at Risk in 1983 most school
districts across the United States increased students’ academic course loads and the
Baker, David, 2008, UMSL, p. 20
number of credits required for high school graduation. Initially this improved
competency of students in college preparatory programs, but had little impact on students
not on that track.
The SREB recognized that CTE must be a partner to academics if there was to be
real comprehensive improvement among the majority of the high school student
population; in 1985 the HSTW network was formed (Bottoms, Presson, and Johnson,
1992). SREB initiatives are supported by public monies, but also receive substantial
funding from private foundations including the Carnegie Corporation, the Wachovia
Foundation, and the Bill and Melinda Gates Foundation. HSTW has based its movement
on ten key practices. These key practices are common sensical and although they work
together, they are not interdependent, so not all have to be adopted simultaneously
(Bottoms, Presson, and Han, 2007). The HSTW 2nd key practice stresses the importance
of increasing rigor in CTE courses. High-level science, math, and language arts should
be injected into courses that provide students with real-world work experience. The
HSTW movement, in its 22nd year, has spread through much of the continental United
States and continues to add middle and high school members each year.
The original Carl D. Perkins Vocational Education Act of 1984 was directed at
the training of adults and high school students. Special education advocates, A Nation at
Risk, and advances in technology were all influential in the passage of this legislation.
The Carl D. Perkins Act brought renewed interest and necessary funds to CTE at both the
secondary and post-secondary levels. The first Carl D. Perkins Act reauthorization of
1990 promoted the integration of academic and CTE curricula to enhance learning and
career opportunities. There are several themes that are common in programs funded by
Baker, David, 2008, UMSL, p. 21
The Carl D. Perkins Act: interdisciplinary cooperation, focus on skills necessary to
transition to employment or post-secondary education, developing engaging curriculum,
and activity and project-based instruction (Vocational Education, 2007). The Carl D.
Perkins Act was reauthorized again in 1998 and in the 2007-2008 school year was
entering into its fourth reauthorization.
The Carl D. Perkins Act is key in the continued success of CTE at both the
secondary and post-secondary level and in the new legislation there is indication that
Congress does understand this. A new purposte to the Act reads, “Providing individuals
with opportunities throughout their lifetimes to develop, in conjunction with other
education and training programs, the knowledge and skills needed to keep the United
States competitive” (U.S. Congress, 2006 p. 2). The United States faces tremendous
social and economic challenges in this new century and CTE should be instrumental in
addressing these.
Societal Needs
In a U.S. News and World Report editorial Mortimer Zuckerman stated, “We have
to reduce inequality while expanding economic opportunity. We must have an education
system that a much larger proportion of the middle class can afford. It has to equip
Americans with the skills to make them mobile and give them greater economic security”
(2007, p.72). A college education has become attainable for many of the young men and
women in the United States, but whether it is the correct option for most of them is
debatable. Will a traditional college education make one more mobile and give him or
her economic security? The economy is strong according to typical indicators, but terms
like “outsourcing” and “offshoring” cause middle class Americans to be concerned about

Baker, David, 2008, UMSL, p. 22
job security. In a February 2007 article in Money magazine Princeton’s Alan Blinder
suggests parents guide their children into careers that require personal contact. “An
electrician cannot be offshored” (Regnier, 2007, p. 100). Research indicates that in the
mid-1990s approximately one-third of Americans who held bachelors degrees were
underemployed while many high-skill, high-wage technical jobs were unfilled (Gray,
2000a). Many programs at area career and technical centers promote these careers:
electrical trades, machining technology, automotive technology, heating-ventilation-air
conditioning and refrigeration (HVAC/R), etc.
Employers require new skills of today’s workforce. Workers are asked to be
creative and have the self-discipline to continue to think throughout their tenure. Most
need strong reading and math skills to accompany strong interpersonal skills that allow
them to be part of a team. Because so many industries have downsized their workforces,
workers must have a competitive instinct; employers are also quick to remind educators
that workers must be punctual, have excellent attendance, and have a positive attitude in
the workplace (Lankard, 1994). The comprehensive high school focus on standardized
testing and college-prep is failing to bridge the gap between academic coursework and
work. Overwhelmingly employers are indicating that the “secondary school system in
the United States is too oriented toward college, thereby neglecting the majority of
students who will never receive a baccalaureate degree” (Bailey 1993, p. 15).
State Departments of Education and Departments of Labor and other departments
associated with the economy rarely work together to create solutions that will serve both.
It is rare that states seek input from business and industry or from post-secondary
institutions prior to creating standards and grade level expectations (GLEs), so it is not
Baker, David, 2008, UMSL, p. 23
illogical that students are frequently unprepared for success in either college or work
related or specialized training (Achieve, 2004). This lack of communication also means
that any educational responses to changes in the economy and the needs of the workforce
are too slow or never occur. State standards and assessment are also uncooperative with
CTE and industry because workplace and industry-specific skills are not measured; “As a
result, too many American youth leave high school with a diploma in hand but largely
unprepared for the opportunities and challenges that await them in college and the
workplace" (Achieve, 2004 p. 5). The end result is that high school curricula rarely
connect with those standards and assessments (National Governors Association, 2007).
This lack of connection between education and what occurs in the world of work
is not lost on students. The high school drop-out rate in the United States is rising
because more young men and women fail to link classroom work and work for financial
compensation. In March of 2006 John Bridgeland, John Dilulio, and Karen Morison
authored a report entitled The Silent Epidemic: Perspectives of High School Dropouts.
The report explains that students drop out of high school for a variety of reasons, but a
common thread among dropouts is a lack of interest and lack of connection with what is
being taught and who it is doing the teaching. “Eighty-one percent of survey respondents
said that if schools provided opportunities for real-world learning (internships, service
learning projects, and other opportunities), it would have improved the students’ chances
of graduating from high school” (2006, p. 12). These opportunities are typically
hallmarks of CTE programs. Of the nation’s high school students who do remain in high
school and choose to pursue a college degree more than 40% are forced to take at least
one no–credit remedial course in math or English as part of their course load. This is
Baker, David, 2008, UMSL, p. 24
indicative of a comprehensive high school model that does not account for students who
are often not engaged and need to see a connection between important core subjects and
their relevance to real-world experiences in order to effectively learn and retain material
(Achieve, 2004).
There are signs that significant progress is being made toward the goal of
combining rigorous academics and CTE. ConnectEd: The California Center for College
and Career is currently piloting its program in as many as 12 high schools throughout the
state. ConnectEd provides teachers and administrators with strategies that team academic
and CTE teachers to create project-based, real-world experiences for students in order to
consistently engage them. ConnectEd believes that combining the best of CTE with
rigorous academic work will improve performance, attendance, and graduation.
According to Gary Hoachlander, president of MPR Associates Inc. who is spearheading
the ConnectEd effort, “We can prepare young people for college and career; it’s not an
either/or choice” (The James Irvine Foundation, 2006, p. 2). Creating authentic curricula
is important to improving the quality of learning at the high school level. Too many
students are placed at a disadvantage when core subject material is not related to a
concept about which students care and with which they connect. Learning for learning’s
sake is not sufficient and does not reflect well in standardized test scores (Brendefur and
Hernández, 2003).
Many high schools in suburban United States areas, including a majority of those
in St. Louis County, Missouri, are larger that 2000 students. Anonymity in a large high
school is common regardless of whether or not it is the desire of the student. Counselors
have caseloads that often require students or parents to be assertive with requests for

Baker, David, 2008, UMSL, p. 25
assistance, and teachers have a difficult time keeping students on tasks intended to assure
that required standardized test scores are achieved. Students who become disinterested in
high school or who fall behind due to poor attendance or lack of structure at home easily
become anonymous. CTE programs are able to provide smaller teacher to student ratios
due to the nature of the programs, potential safety issues, and the need for significant
individual interaction between instructors and students. Students often indicate that they
desire one-on-one attention from teachers and when they receive it, their self-esteem
improves and they become involved in class (Bridgeland, Dululio, and Morison, 2006).
A problem continues in the first decade of the 21st Century as parents and
comprehensive high school educators still impress upon students the need to obtain a
bachelor’s degree. A bachelor’s degree is expensive and cannot guarantee what it did
prior to the recession that took place in the 1980s. “Too many college graduates receive
degrees but have nowhere to go upon graduation” (Gaul, 2005 p. 34).
Not All Students Should Pursue a Bachelor’s Degree
Our economy is now truly global and our public education system is key to
ensuring that we will be competitive in the future. “The long-term opportunities and
challenges that the flattening of the world puts before the United States are profound.
Therefore, our ability to get by doing things the way we’ve been doing them … will not
suffice any more” (Friedman 2005, p. 5). High school dropout rates in the United States
are incredibly high with large urban school districts leading the way. A high school
dropout is less likely to take personal responsibility for his or her own career
development, which is essential in our economy (Kerka, 1993). The traditional high
school method of educating teens is not working for many and CTE may be a solution for

Baker, David, 2008, UMSL, p. 26
the many teens who are disconnected, bored, and see little relevance in the subject matter
and the method in which it is presented. CTE is expensive and requires a lower teacher
to student ratio than has become acceptable in public high school classrooms.
In 2008 NCLB is up for reauthorization and Americans must decide if this nation is
committed to ensuring the success of all students. If they are, they must be willing to
commit the resources to do so (Tough, 2006).
Often students lack focus as they proceed through high school and simply move
with the flow of other students. This includes the idea that success in later life can only
be achieved with a traditional college education. Unfortunately, this lack of focus,
accompanied by poor study habits and lack of self-discipline, typically results in failure
in college. Educators at the secondary level must teach students to take charge of their
future employability. Students will likely have to reinvent their professional selves at
least once during the course of their working lives; it is the responsibility of education to
provide students with opportunities to achieve some type of employment security (Herr &
Gray, 1998).
More than half of high school students lack academic skills needed to achieve
success in a four year degree program (Gray, 2000a). Few of the barriers to higher
education that have existed still remain. Scholarships, a multitude of student loan options
and open admissions policies make it seem reasonable that high school graduates should
go on to a four-year college to pursue a bachelor’s degree; college matriculation rates
have benefited from this reasoning. However, as college enrollment has increased, so has
the college drop-out rate and the number of remedial college courses necessary. Most
college graduates take much longer than the traditional four years to complete a

Baker, David, 2008, UMSL, p. 27
bachelor’s degree and as many as half who enter will not persist to graduation (Gray,
2000a). This begs the question; Why isn’t CTE thriving?
CTE’s Mistakes
There is much terminology associated with CTE and the confusion that surrounds
this multitude of terminology is detrimental to image and effectiveness; the marketing of
CTE is a process of association and the association is too often negative. CTE, as to
which it is now commonly referred, has been called or identified by a number of other
terms: vocational education, career education, school-to-work, apprenticeships, trade
school, tech prep, and industrial arts education. This is not a complete list, but it does
indicate a likelihood for confusion and possibly a lack of focus. “You ‘burn’ your way
into the mind by narrowing the focus to a single word or concept” (Ries and Trout, 1993,
p. 27). This confusion in terminology is a symptom of CTE’s lack of focus throughout
the 20th century; as a result, it did not reach its full potential. The American Vocational
Association has detailed the problem of image for CTE in numerous journal articles since
the late 1980s; the misconceptions and negativity are consistent. Parents and students do
indicate that they have heard of CTE or one of its pseudonyms; they also indicate that
they are unclear of its purpose and importance (Catri, 1998).
School officials, guidance counselors and principals specifically, see CTE as a
path only for students who are not going to college. “Increasing the number of college
admissions is the unquestioned priority of the nation, its states, and local school boards as
well” (Gray, 2000a, p. 3). This group also has the idea that CTE is not rigorous, does not
engage students in critical thinking and does not ask them to engage in the late stages of
Bloom’s Taxonomy, which is simply not true (Guskey, 2006). CTE has suffered from
Baker, David, 2008, UMSL, p. 28
low enrollment during the last twenty-five years due to fewer numbers of students
available and to perception. With the continued importance of standardized testing and
federal and state government objectives students have been pushed toward better
academic performance and pursuing a four-year college degree. Already negative
attitudes about the rigor of CTE, which are prevalent among so many home school
officials, have been fostered by these developments (Naylor, 1987).
Much of this criticism and negative perception has been deserved because CTE
educators have not kept pace with changing technology and in many cases have not been
concerned with appearance and reputation. Administrators and instructors in CTE have
not made the necessary effort to reach out to comprehensive high school educators. They
have not embraced partnerships with sending schools and they have not done enough to
make academic subject matter a high priority in CTE programs. This lack of partnership
may be most noticeable with counselors, which has likely impacted their knowledge of
CTE and their willingness to direct students toward it.
Conclusion
At the start of the 20th century John Dewey saw the necessity of a pragmatic
approach to education; education should be practical and relative. Workers in the 20th
century needed to become problem solvers who were able to engage in teamwork.
Contributing to the growth of industry and establishing oneself as a contributing member
of society was essential to self-worth (1938). In the 21st century workers must continue
to problem solve at a very high level and to engage in teamwork. They must also be able
to continually educate themselves and to re-invent themselves as necessary to stay
competitive in markets that can literally change daily.

Baker, David, 2008, UMSL, p. 29
The major controversy seems to focus on educational retrenchment and the re-
emphasis upon the traditional academic subjects. “Historically, this sort of modification
often follows a pattern in which retrenchment of one group eventually leads to a new
solution promulgated by another group” (Baker, Boser, and Householder, 1992, p. 5).
Hands-on and academic instruction should co-exist; one makes the other more effective
and beneficial. When instructional activities are practical and can be applied to real-
world projects, they are effective. A kinesthetic approach to instruction is more effective
than an approach grounded in lecture or reading and note-taking alone (Reid, 1988). The
onset of complete investment in standardized testing has increased the focus on academic
performance and the thought that all students should pursue a college education. High
school guidance counselors are the most influential high school personnel regarding
students choosing or not choosing to participate in
versatile CTE programs.
For years educators have seen the statistics about the increased wages of those
who have a college degree over those who do not possess one. If students are going to
college, it is only logical that each pursues a college preparatory track while in high
school. Unfortunately, this plan does not serve the majority of students because the
majority will never receive a baccalaureate degree (Bailey, 1993). Where does CTE fit
into this plan? The idea of integrating academics and CTE was conceived in the 1970s
and has regained popularity. The blending of academics into career and technical classes
will provide students with practical application and assist them in understanding the
relevance of courses that may otherwise escape them.
Baker, David, 2008, UMSL, p. 30
The Institute of Education Sciences (IES) is set to sponsor a curricular
competition held by the Mathematica Policy Research of Princeton, N.J. in an attempt to
promote creative ideas of mathematics integration into career and technical courses
(Career and Technical Education Advisor, 2006). The latest reauthorization of the Carl
D. Perkins Career and Technical Education Improvement Act does address the rigor of
CTE courses and IES hopes that creative and integrative curriculum will be a positive
response to this. Unfortunately, school administrators and counselors often indicate that
time in CTE will be detrimental to academic coursework and standardized assessment
even if the CTE courses are rigorous. Therefore, it is the responsibility of CTE to
establish relationships, counteract negative perceptions and myths, and ultimately to
determine what factors actually impact high school educators’, counselors in particular,
perceptions of knowledge regarding CTE.
Baker, David, 2008, UMSL, p. 31
Chapter 3
Methodology
Overview
This investigation examined the perceptions of knowledge of career and technical
education (CTE) held by high school guidance counselors in St. Louis County, Missouri
in three subsets: CTE candidates, CTE reform and post-secondary opportunities, and
CTE program development and instruction. The investigation focused on the
relationship of these dependent variables and three factors (region, special education
teacher training, and a personal connection with CTE as a student or through CTE teacher
training) to determine if these factors significantly impact guidance counselors’
perceptions of knowledge of CTE.
Rationale
The intent of this investigation was to explore perception of knowledge of the
competency and viability of CTE in the Special School District (SSD) of St. Louis
County, Missouri. According to Richard Carver, SSD Chief Financial Officer, the CTE
Division of SSD represents approximately 6% of total SSD staff and approximately 7.5%
of yearly expenditures. In the 2006-2007 school year SSD spent approximately
$279,384,000 on personnel related expenses and $47,147,000 on non-personnel related
expenses; $17,285,000 and $7,269,000 are dedicated to the CTE division respectively;
these ratios have been consistent since the 2002-2003 school year (Personal
communication, November 28, 2007). SSD had particular interest in investigating and
analyzing the understanding and perception that high school guidance counselors in St.
Louis County, Missouri have regarding their CTE division and its two technical high
Baker, David, 2008, UMSL, p. 32
schools, North and South, due to the expense of the programs and a desire to maintain
high enrollment at both schools.
High school guidance counselors are integral in determining whether or not a
prospective student attends North or South Technical High School. Often it is a guidance
counselor who determines if a student receives information about the existence of the
technical high schools, if a student completes an application, and finally if a student
makes contact with an admissions representative. Therefore, it is important to begin to
determine what factors influence high school guidance counselors’ perceptions of CTE.
North and South Technical High Schools are both members of the High Schools
That Work (HSTW) network, a high school reform movement sponsored by the Southern
Regional Education Board (SREB). Curriculum in all duplicated programs is shared
along with business and post-secondary education advisory councils. SSD completes
performance based evaluations on all teacher level staff and a mentoring program for all
first through third year teachers is in place. Each year the CTE Division completes a
Program Performance Review, which includes a variety of student data and survey results
from students, parents, and program advisory council members.
The investigator is an employee of SSD’s CTE Division and had access to the
district’s Auto Data System®, which was utilized to conduct the counselor survey. The
researcher supervises four admissions representatives who work closely with high school
guidance counselors.

Baker, David, 2008, UMSL, p. 33
Survey of Counselors
An original survey was developed to solicit personal information along with
perceptions of knowledge of CTE. The survey was created by the investigator (the
principal of South Technical High School), the director of the CTE division of SSD, an
admissions representative for the CTE division of SSD, and the director of training and
workforce development for the Carpenter’s District Council of Greater St. Louis and
Vicinity in order to ensure face and content validity. Ideas for survey questions were
derived from a similar study conducted by Gina M. Mateka: The Perceived Impact of
Vocational Career Academies on Comprehensive High Schools in the State of New
Jersey. Although this study surveyed both principals and counselors, the intent was to
determine their knowledge and opinions of CTE and how cooperation with an Area
Career and Technical Center affects cooperating high schools (2001). A copy of the
survey instrument utilized for this investigation is located in Appendix B.
Each guidance counselor working in a public high school in St. Louis County,
Missouri was sent an e-mail link in order to complete the survey. A disclosure letter,
located in Appendix A, was part of this e-mail; this explained that the survey was
voluntary and anonymous. Guidance counselors were asked to complete the survey via
SSD’s Auto Data System®. Two follow-up e-mails of request were sent to improve the
return rate.
To provide for anonymity counselors were asked to identify themselves only by
St. Louis County region: north, central, west, and south. These regions were determined
to ensure ease in survey completion. Prior to data analysis the central region was
combined with the west region; there were two reasons for this combination. 1) Several

Baker, David, 2008, UMSL, p. 34
of the schools located in the determined central region are relatively small and in turn
have small counseling staffs; combining the two regions created a larger sample size for a
single region, the west region. 2) West Technical High School was opened in order to
draw from what was deemed the Central/West Corridor. This corridor included schools
listed on the counselor survey as located in the west and central regions. Because a
majority of the schools in these two regions represent the same demographic, the
combination was logical. Additionally, question numbers seven and eight were
combined to represent a personal connection with CTE whether as a student or through
CTE teacher training.
The final draft of the survey instrument included a total of 35 items; there was an
opportunity for counselors to write original comments about the technical high schools.
The first nine items were used to determine the guidance counselors’ gender, age range, if
the guidance counselor received formal training as a special educator, and if the guidance
counselor had personal experience with CTE as a student or educator. The next 23
questions required responses on a five-point Likert-type scale. The final three questions
were dichotomous requiring a yes or no response. Questions 10 through 32 were
stratified into three subsets listed in Table 3.1. Statistical Package for the Social Sciences
(SPSS®) 16.0 software was utilized for all descriptive statistics and analyses.
Significance was set at the .05 level. All Institutional Review Board (IRB) requirements
and guidelines were observed.

Baker, David, 2008, UMSL, p. 35
Table 3.1 – ANOVA Subsets
Subsets Statements Regarding Survey Question Number
1 CTE Candidates 16, 28, 29, 30, 31, 32
2 CTE Reform and Post-Secondary Opportunities
11, 12, 13, 17, 20, 24, 25
3 CTE Program Development and Instruction
14, 18, 19, 22, 23, 26, 27
Procedure
The research design for this study was causal-comparative. Three univariate
three-factor (3 x 2 x 2) analyses of variance (ANOVA) were used to determine whether
the counselors surveyed differed significantly on the independent variables determined.
The first factor of analysis was region (north, west or south). The second factor of
analysis was possession of training as a special education teacher (yes or no). The third
factor of analysis was personal connection with CTE as a student or through receipt of
CTE teacher training (yes or no). The dependent variables consisted of the three subsets
listed in Table 1. All means and interactions were tested for statistical significance. A
Cronbach Coefficient Alpha correlation was conducted to determine the reliability of
each of the subsets; the coefficient correlation of each subset was above .60, the
acceptable minimum for experimental research (Reliability Analysis, 2008). It is
unlikely that a reliable factor analysis could have been completed in regard to this survey
if the coefficient correlation or corresponding Spearman Brown prophesy formula
adjustment had not yielded a satisfactory result due to a small population size
(Tabachnick & Fidell, 2007). Because multiple ANOVAs were conducted using the
same independent variables, a Bonferroni correction was utilized to reduce the likelihood
Baker, David, 2008, UMSL, p. 36
of a Type 1 Error. A test for homogeneity of independent variances was completed
within each ANOVA.
Next, three one-way ANOVAs were conducted using questions 33, 34, and 35 as
the factors for each respectively. Subset 1, subset 2, and subset 3 were utilized as
dependent variables in each of the three ANOVAs. All means and interactions were
tested for statistical significance.
While there may be turnover in guidance counselor positions in specific high
schools throughout the county from year to year, there is no reason to believe that there is
significant change in perception of knowledge of CTE due to possible turnover.
Baker, David, 2008, UMSL, p. 37
Chapter 4
Results
Design
The purpose of the investigation was to measure the perceptions of knowledge of
career and technical education (CTE) in St. Louis County, Missouri and the Special
School District (SSD) held by public high school guidance counselors. This investigation
utilized three univariate three-factor analyses of variance (ANOVA). The first factor
consisted of three regions: south, west, and north. The second factor, training as a
special education teacher, consisted of two levels: yes or no. The third factor, exposure
to CTE as a student or through CTE teacher training consisted of two levels: yes or no.
The dependent variable in each analysis of variance was a subset representing one of
three categories of CTE knowledge in St. Louis County, Missouri: CTE candidates, CTE
reform and post-secondary opportunities, and CTE program development and instruction.
All public high school guidance counselors in St. Louis County, Missouri were
provided the survey through SSD’s Auto Data® system. At the time the survey was
administered there were 153 public high school counselors identified in 23 St. Louis
County, Missouri school districts; this number is subject to change from year to year
dependent upon student population and caseload. The survey consisted of nine
demographic questions and 26 questions regarding each counselor’s perception of
knowledge regarding CTE in St. Louis County, Missouri and SSD. Questions 10 through
32 were based on a five-point Likert Scale while questions 33, 34, and 35 required only
yes/no responses.

Baker, David, 2008, UMSL, p. 38
Questions 10, 15, and 21 were removed from analysis due to the Cronbach
Coefficient Alpha score. Subset 1 attained a Cronbach Alpha score of .62 with a
Spearman Brown adjustment of .77. Subset 2 attained a Cronbach Alpha score of .78
with a Spearman Brown adjustment of .88. Subset 3 attained a Cronbach Alpha score of
.66 with a Spearman Brown adjustment of .80. The driving principle behind the
establishment of the subsets was interpretability of the factor. Regardless of the
combinations of questions 10, 15, and 21 into any of the established subsets, the
Cronbach Alpha scores were significantly reduced.

Baker, David, 2008, UMSL, p. 39
Table 4.1 – Descriptive Statistics - ANOVA (Subset 1 - Candidates) Dependent Variable: Subset 1 – Means and Standard Deviations
Region CTE Connection SPED Training Yes No N Mean Sd N Mean Sd North Yes 2 2.50 1.18 4 3.25 .69 No 3 3.39 .35 9 3.20 .47 South Yes 1 3.17 - 3 2.72 .35 No 3 2.78 .10 11 3.24 .35 West Yes - - - 4 3.71 1.12 No 3 3.44 .19 17 3.52 .69 Table 4.2 – Data Analysis – ANOVA (Subset 1 – Candidates)
Tests of Between-Subjects Effects
Dependent Variable: Subset 1 - Candidates
Source Type III Sum of Squares
df Mean Square
F Sig.
Corrected Model 4.807a 10 .481 1.319 .247 Intercept 282.486 1 282.486 775.011 .000 Region 1.689 2 .844 2.317 .109 combcte .120 1 .120 .329 .569 SpedTeach .109 1 .109 .300 .586 Region * combcte .540 2 .270 .741 .482 Region * SpedTeach .107 2 .053 .147 .864 combcte * SpedTeach .000 1 .000 .001 .980 Region * combcte * SpedTeach
1.152 1 1.152 3.161 .082
Error 17.860 49 .364
Total 671.631 60
Corrected Total 22.668 59
a. R Squared = .212 (Adjusted R Squared = .051)

Baker, David, 2008, UMSL, p. 40
Results
There were no significant main effects and no significant interaction effects
observed based upon p < .05. Refer to table 4.2.
Item analysis of the survey revealed that counselors do believe that parents are
open to the idea of their students attending North or South Technical High School, which
makes those students potential CTE candidates. However, according to counselors, it is
difficult for students in advanced placement courses or honors courses to attend due to
scheduling conflicts. 39.3 % of participants responded agreed with statement number 16.
47.5 % of participants disagreed with statement number 28. 32.8 % of participants
disagreed with statement number 29. 37.7 % of participants responded disagreed with
statement number 30. 52.2 % of participants agreed with statement number 31. 73.8 %
of participants agreed with statement number 32.

Baker, David, 2008, UMSL, p. 41
Table 4.3 – Descriptive Statistics – ANOVA (Subset 2 – Reform and Post-Sec. Oppor.) Dependent Variable: Subset 2 – Means and Standard Deviations
Region CTE Connection SPED Training Yes No N Mean Sd N Mean Sd North Yes 2 4.00 - 4 4.21 .36 No 3 3.50 .80 9 3.90 .45 South Yes 1 4.00 - 3 4.33 .58 No 3 3.81 .73 11 3.94 .45 West Yes - - - 4 3.90 .71 No 3 3.90 .80 17 3.90 .51 Table 4.4 – Data Analysis – ANOVA (Subset 2 – Reform and Post-Sec. Oppor.)
Tests of Between-Subjects Effects
Dependent Variable: Subset 2 – Reform/Post Sec.
Source Type III Sum of Squares
df Mean Square
F Sig.
Corrected Model 1.354a 10 .135 .522 .866 Intercept 430.701 1 430.701 1661.545 .000 Region .108 2 .054 .209 .812 combcte .394 1 .394 1.520 .223 SpedTeach .208 1 .208 .804 .374 Region * combcte .310 2 .155 .598 .554 Region * SpedTeach .099 2 .049 .191 .827 combcte * SpedTeach .005 1 .005 .019 .891 Region * combcte * SpedTeach
.029 1 .029 .114 .737
Error 12.702 49 .259
Total 935.592 60
Corrected Total 14.056 59
a. R Squared = .096 (Adjusted R Squared = -.088)

Baker, David, 2008, UMSL, p. 42
Results
There were no significant main effects and no significant interaction effects
observed based upon p < .05. Refer to Table 4.4.
Item analysis of the survey revealed that most counselors believe that North and
South Technical High Schools offer challenging programs that lead to good post-
secondary opportunities. However, the analysis also revealed that most have little
knowledge of the Carl Perkins Act that is intended to improve programs and
opportunities in CTE. 50.8 % of the participants agreed with statement number 11.
47.5 % of the participants had no opinion regarding statement number 12. 47.5 % of
participants agreed with statement number 13. 42.6 % of participants had no opinion
regarding statement number 17. 52.5 % of participants agreed with statement number 20.
55.7 % of participants agreed with statement number 24. 55.7 % of participants agreed
with statement number 25.
Baker, David, 2008, UMSL, p. 43
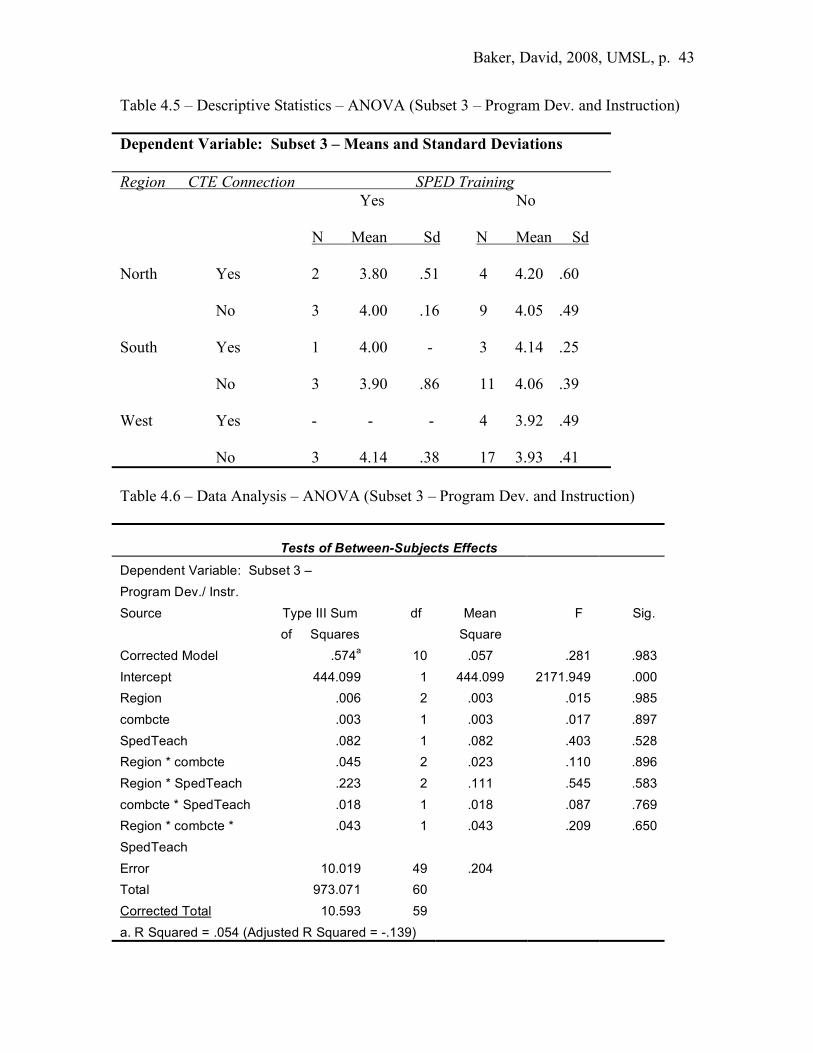
Table 4.5 – Descriptive Statistics – ANOVA (Subset 3 – Program Dev. and Instruction) Dependent Variable: Subset 3 – Means and Standard Deviations
Region CTE Connection SPED Training Yes No N Mean Sd N Mean Sd North Yes 2 3.80 .51 4 4.20 .60 No 3 4.00 .16 9 4.05 .49 South Yes 1 4.00 - 3 4.14 .25 No 3 3.90 .86 11 4.06 .39 West Yes - - - 4 3.92 .49 No 3 4.14 .38 17 3.93 .41 Table 4.6 – Data Analysis – ANOVA (Subset 3 – Program Dev. and Instruction)
Tests of Between-Subjects Effects
Dependent Variable: Subset 3 – Program Dev./ Instr.
Source Type III Sum of Squares
df Mean Square
F Sig.
Corrected Model .574a 10 .057 .281 .983 Intercept 444.099 1 444.099 2171.949 .000 Region .006 2 .003 .015 .985 combcte .003 1 .003 .017 .897 SpedTeach .082 1 .082 .403 .528 Region * combcte .045 2 .023 .110 .896 Region * SpedTeach .223 2 .111 .545 .583 combcte * SpedTeach .018 1 .018 .087 .769 Region * combcte * SpedTeach
.043 1 .043 .209 .650
Error 10.019 49 .204
Total 973.071 60
Corrected Total 10.593 59
a. R Squared = .054 (Adjusted R Squared = -.139)
Baker, David, 2008, UMSL, p. 44
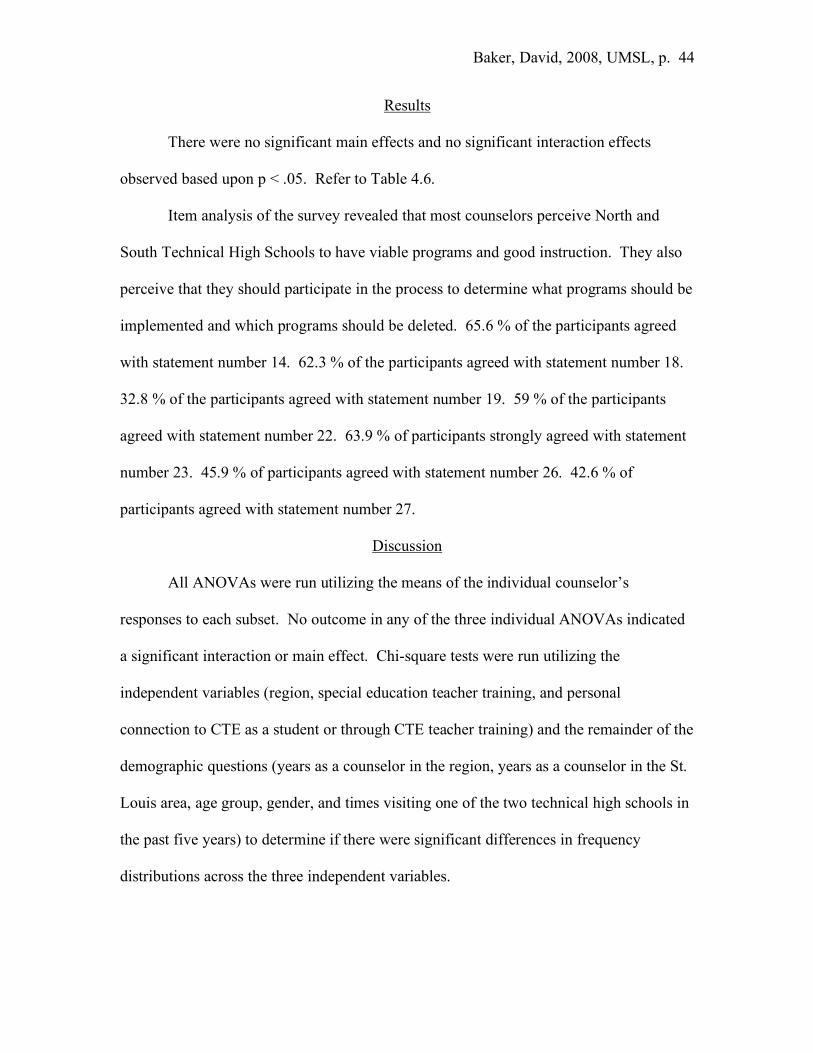
Results
There were no significant main effects and no significant interaction effects
observed based upon p < .05. Refer to Table 4.6.
Item analysis of the survey revealed that most counselors perceive North and
South Technical High Schools to have viable programs and good instruction. They also
perceive that they should participate in the process to determine what programs should be
implemented and which programs should be deleted. 65.6 % of the participants agreed
with statement number 14. 62.3 % of the participants agreed with statement number 18.
32.8 % of the participants agreed with statement number 19. 59 % of the participants
agreed with statement number 22. 63.9 % of participants strongly agreed with statement
number 23. 45.9 % of participants agreed with statement number 26. 42.6 % of
participants agreed with statement number 27.
Discussion
All ANOVAs were run utilizing the means of the individual counselor’s
responses to each subset. No outcome in any of the three individual ANOVAs indicated
a significant interaction or main effect. Chi-square tests were run utilizing the
independent variables (region, special education teacher training, and personal
connection to CTE as a student or through CTE teacher training) and the remainder of the
demographic questions (years as a counselor in the region, years as a counselor in the St.
Louis area, age group, gender, and times visiting one of the two technical high schools in
the past five years) to determine if there were significant differences in frequency
distributions across the three independent variables.
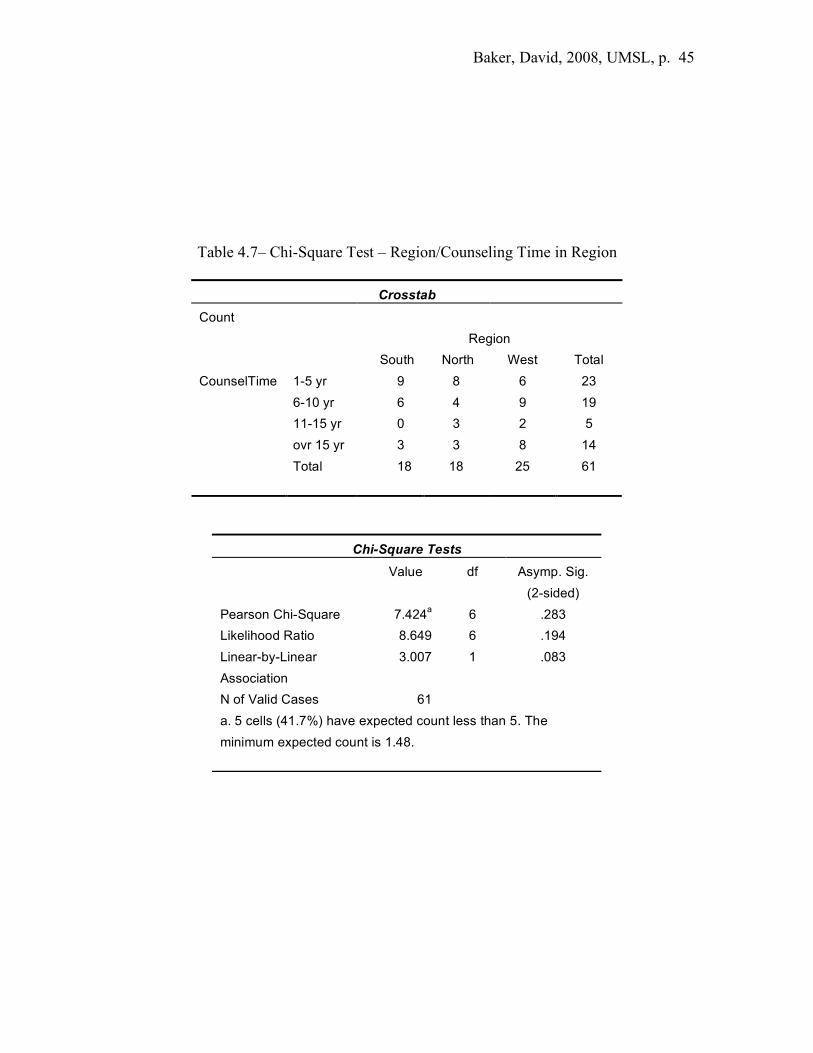
Baker, David, 2008, UMSL, p. 45
Table 4.7– Chi-Square Test – Region/Counseling Time in Region
Crosstab
Count Region South North West Total
1-5 yr 9 8 6 23 6-10 yr 6 4 9 19 11-15 yr 0 3 2 5 ovr 15 yr 3 3 8 14
CounselTime
Total 18 18 25 61
Chi-Square Tests Value df Asymp. Sig.
(2-sided) Pearson Chi-Square 7.424a 6 .283 Likelihood Ratio 8.649 6 .194 Linear-by-Linear Association
3.007 1 .083
N of Valid Cases 61
a. 5 cells (41.7%) have expected count less than 5. The minimum expected count is 1.48.
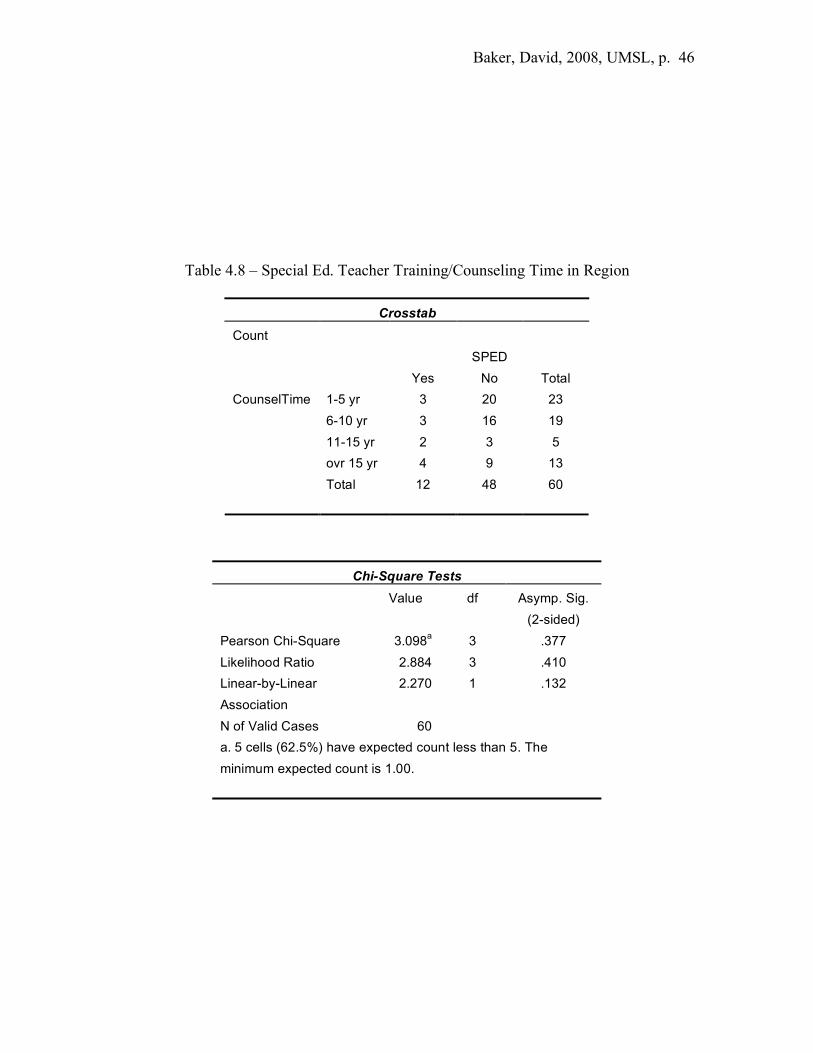
Baker, David, 2008, UMSL, p. 46
Table 4.8 – Special Ed. Teacher Training/Counseling Time in Region
Crosstab
Count SPED Yes No Total
1-5 yr 3 20 23 6-10 yr 3 16 19 11-15 yr 2 3 5 ovr 15 yr 4 9 13
CounselTime
Total 12 48 60
Chi-Square Tests Value df Asymp. Sig.
(2-sided) Pearson Chi-Square 3.098a 3 .377 Likelihood Ratio 2.884 3 .410 Linear-by-Linear Association
2.270 1 .132
N of Valid Cases 60
a. 5 cells (62.5%) have expected count less than 5. The minimum expected count is 1.00.
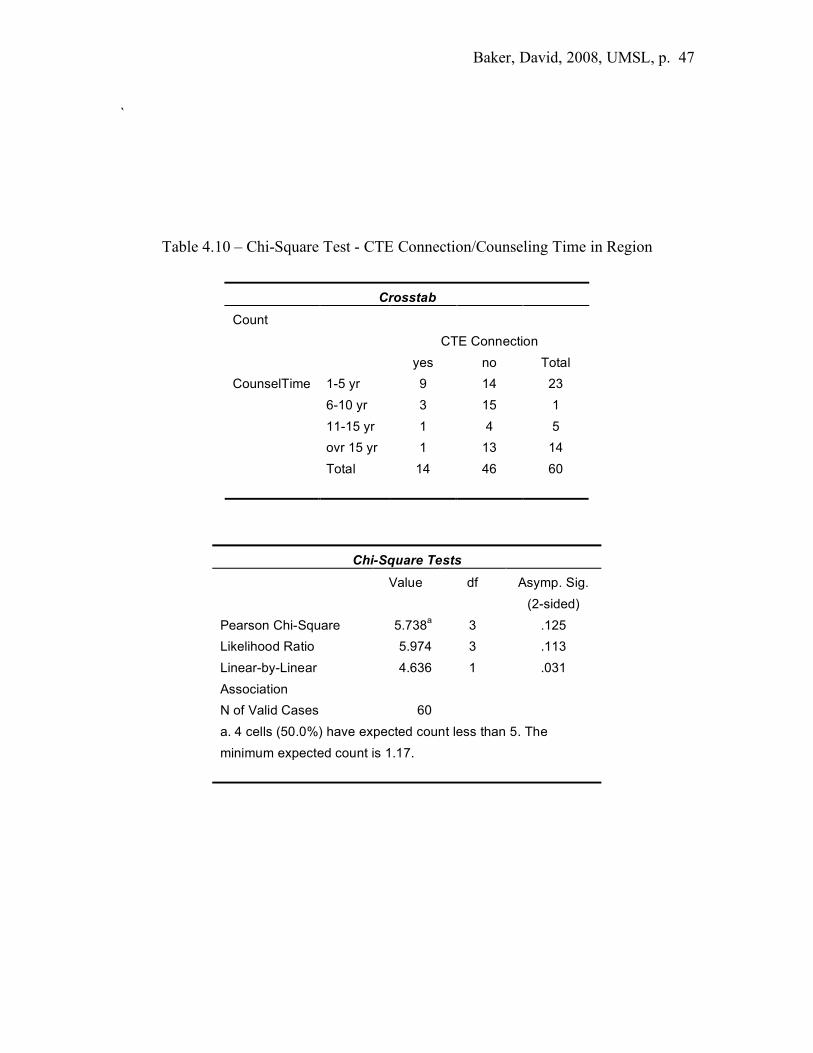
Baker, David, 2008, UMSL, p. 47
`
Table 4.10 – Chi-Square Test - CTE Connection/Counseling Time in Region
Crosstab
Count CTE Connection yes no Total
1-5 yr 9 14 23 6-10 yr 3 15 1 11-15 yr 1 4 5 ovr 15 yr 1 13 14
CounselTime
Total 14 46 60
Chi-Square Tests Value df Asymp. Sig.
(2-sided) Pearson Chi-Square 5.738a 3 .125 Likelihood Ratio 5.974 3 .113 Linear-by-Linear Association
4.636 1 .031
N of Valid Cases 60
a. 4 cells (50.0%) have expected count less than 5. The minimum expected count is 1.17.
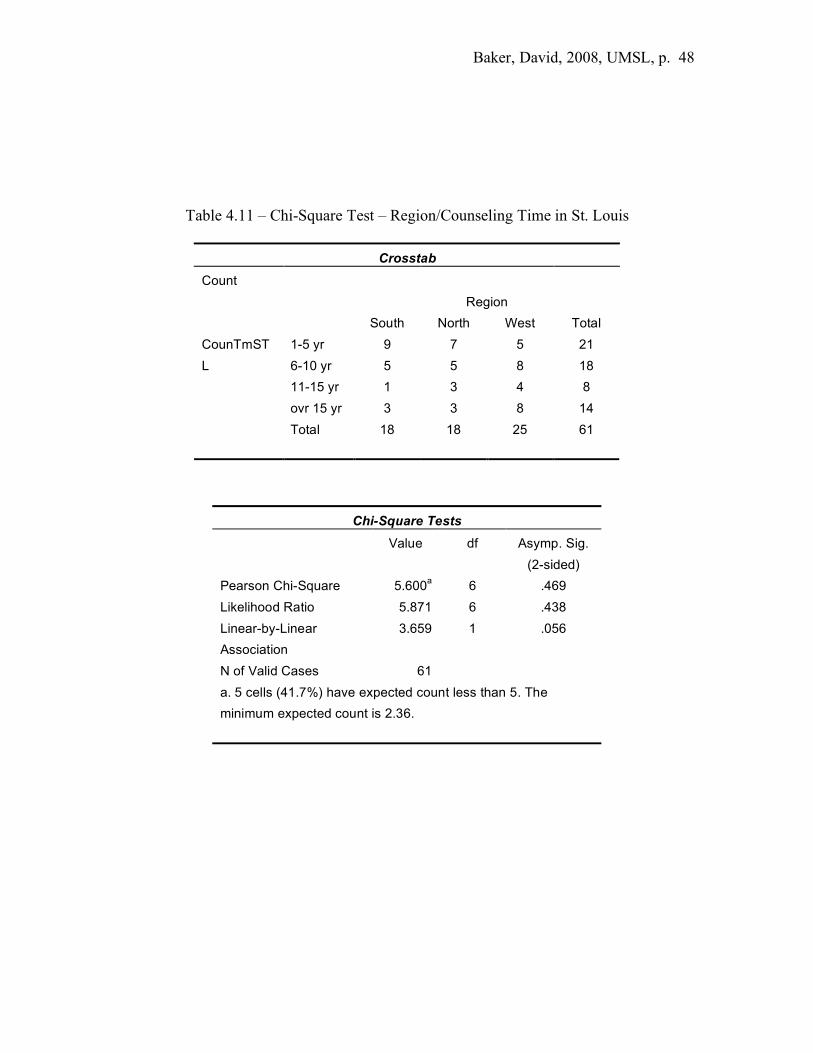
Baker, David, 2008, UMSL, p. 48
Table 4.11 – Chi-Square Test – Region/Counseling Time in St. Louis
Crosstab
Count Region South North West Total
1-5 yr 9 7 5 21 6-10 yr 5 5 8 18 11-15 yr 1 3 4 8 ovr 15 yr 3 3 8 14
CounTmSTL
Total 18 18 25 61
Chi-Square Tests Value df Asymp. Sig.
(2-sided) Pearson Chi-Square 5.600a 6 .469 Likelihood Ratio 5.871 6 .438 Linear-by-Linear Association
3.659 1 .056
N of Valid Cases 61
a. 5 cells (41.7%) have expected count less than 5. The minimum expected count is 2.36.

Baker, David, 2008, UMSL, p. 49
Table 4.12 – Chi-Square Test – Special Ed. Teacher Train/Counseling Time in St. Louis
Crosstab
Count SPED Yes No Total
1-5 yr 2 19 21 6-10 yr 5 13 18 11-15 yr 2 6 8 ovr 15 yr 3 10 13
CounTmSTL
Total 12 48 60
Chi-Square Tests Value df Asymp. Sig.
(2-sided) Pearson Chi-Square 2.323a 3 .508 Likelihood Ratio 2.527 3 .470 Linear-by-Linear Association
.909 1 .340
N of Valid Cases 60
a. 4 cells (50.0%) have expected count less than 5. The minimum expected count is 1.60.
Baker, David, 2008, UMSL, p. 50
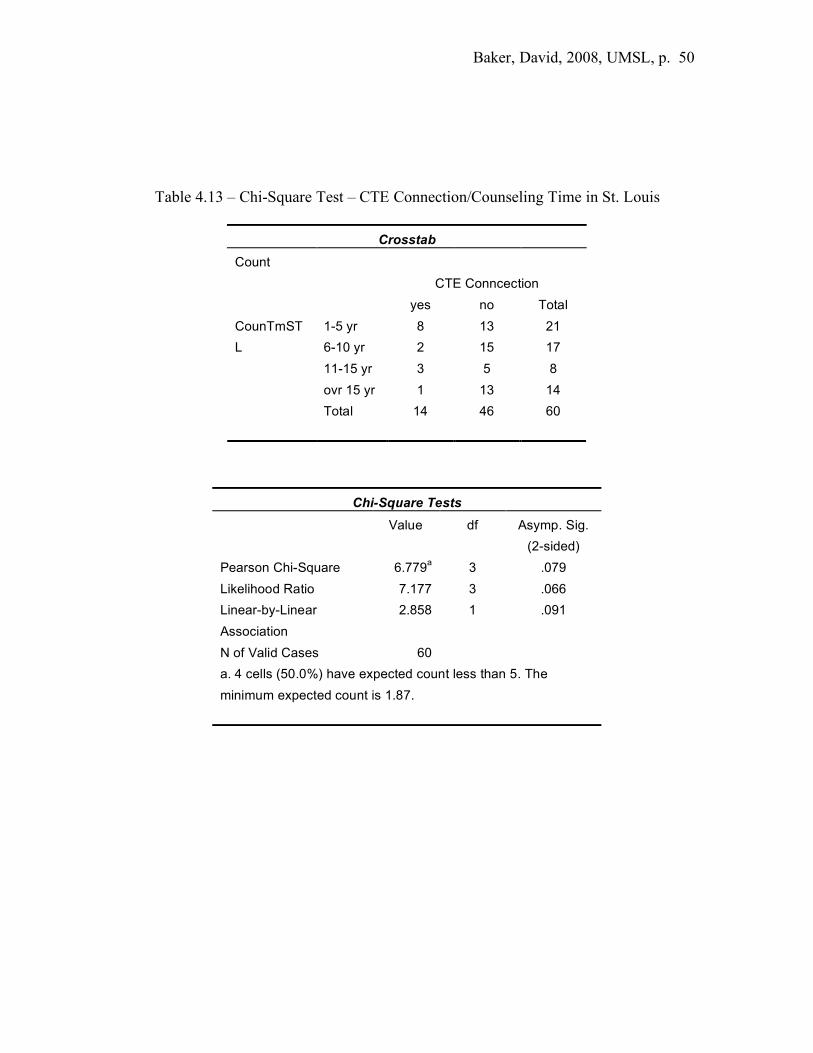
Table 4.13 – Chi-Square Test – CTE Connection/Counseling Time in St. Louis
Crosstab
Count CTE Conncection yes no Total
1-5 yr 8 13 21 6-10 yr 2 15 17 11-15 yr 3 5 8 ovr 15 yr 1 13 14
CounTmSTL
Total 14 46 60
Chi-Square Tests Value df Asymp. Sig.
(2-sided) Pearson Chi-Square 6.779a 3 .079 Likelihood Ratio 7.177 3 .066 Linear-by-Linear Association
2.858 1 .091
N of Valid Cases 60
a. 4 cells (50.0%) have expected count less than 5. The minimum expected count is 1.87.

Baker, David, 2008, UMSL, p. 51
Table 4.14 – Chi-Square Test – Region/Age Range
Crosstab
Count Region South North West Total
25-35 yr 10 4 1 15 36-45 yr 2 4 7 13 46-56 yr 4 7 10 21 ovr 56 yr 2 2 7 11
Age
Total 18 17 25 60
Chi-Square Tests Value df Asymp. Sig.
(2-sided) Pearson Chi-Square 15.953a 6 .014 Likelihood Ratio 16.862 6 .010 Linear-by-Linear Association
9.582 1 .002
N of Valid Cases 60
a. 7 cells (58.3%) have expected count less than 5. The minimum expected count is 3.12.

Baker, David, 2008, UMSL, p. 52
Table 4.15 – Chi-Square Test – Special Ed. Teacher Training/Age Range
Crosstab
Count SPED Yes No Total
25-35 yr 2 13 15 36-45 yr 1 12 13 46-56 yr 7 14 21 ovr 56 yr 2 8 10
Age
Total 12 47 59
Chi-Square Tests Value df Asymp. Sig.
(2-sided) Pearson Chi-Square 3.927a 3 .269 Likelihood Ratio 4.025 3 .259 Linear-by-Linear Association
1.295 1 .255
N of Valid Cases 59
a. 4 cells (50.0%) have expected count less than 5. The minimum expected count is 2.03.
Baker, David, 2008, UMSL, p. 53
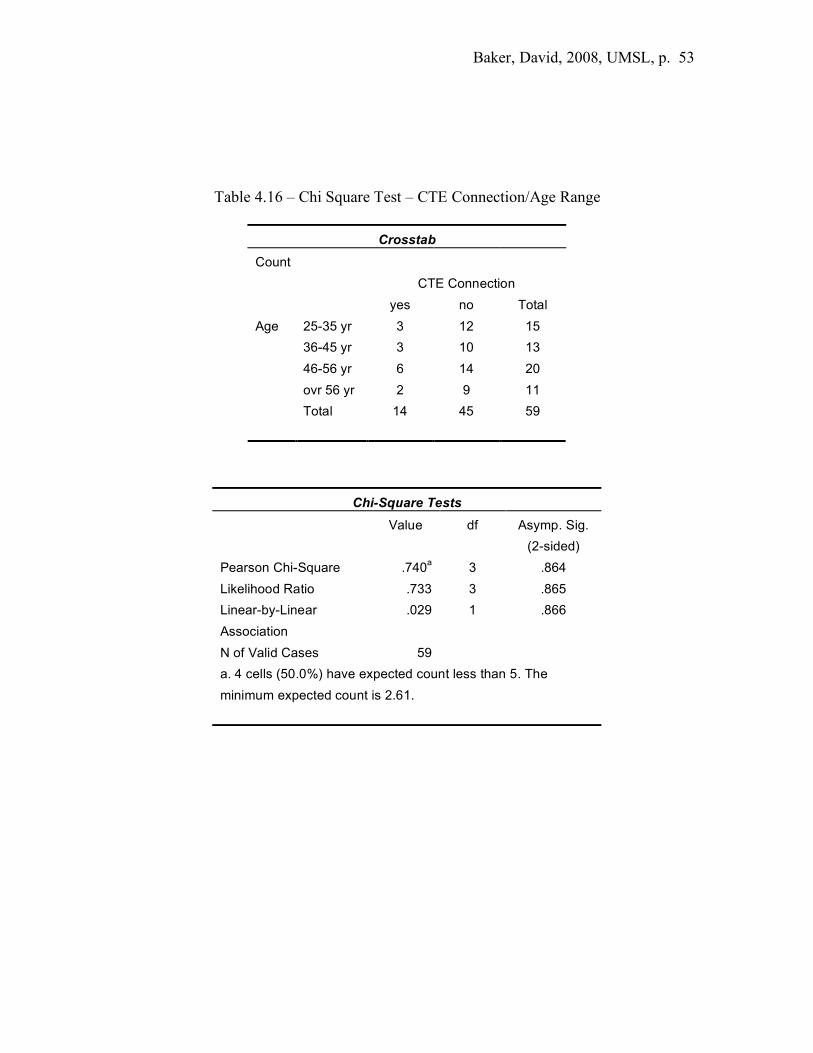
Table 4.16 – Chi Square Test – CTE Connection/Age Range
Crosstab
Count CTE Connection yes no Total
25-35 yr 3 12 15 36-45 yr 3 10 13 46-56 yr 6 14 20 ovr 56 yr 2 9 11
Age
Total 14 45 59
Chi-Square Tests Value df Asymp. Sig.
(2-sided) Pearson Chi-Square .740a 3 .864 Likelihood Ratio .733 3 .865 Linear-by-Linear Association
.029 1 .866
N of Valid Cases 59
a. 4 cells (50.0%) have expected count less than 5. The minimum expected count is 2.61.
Baker, David, 2008, UMSL, p. 54
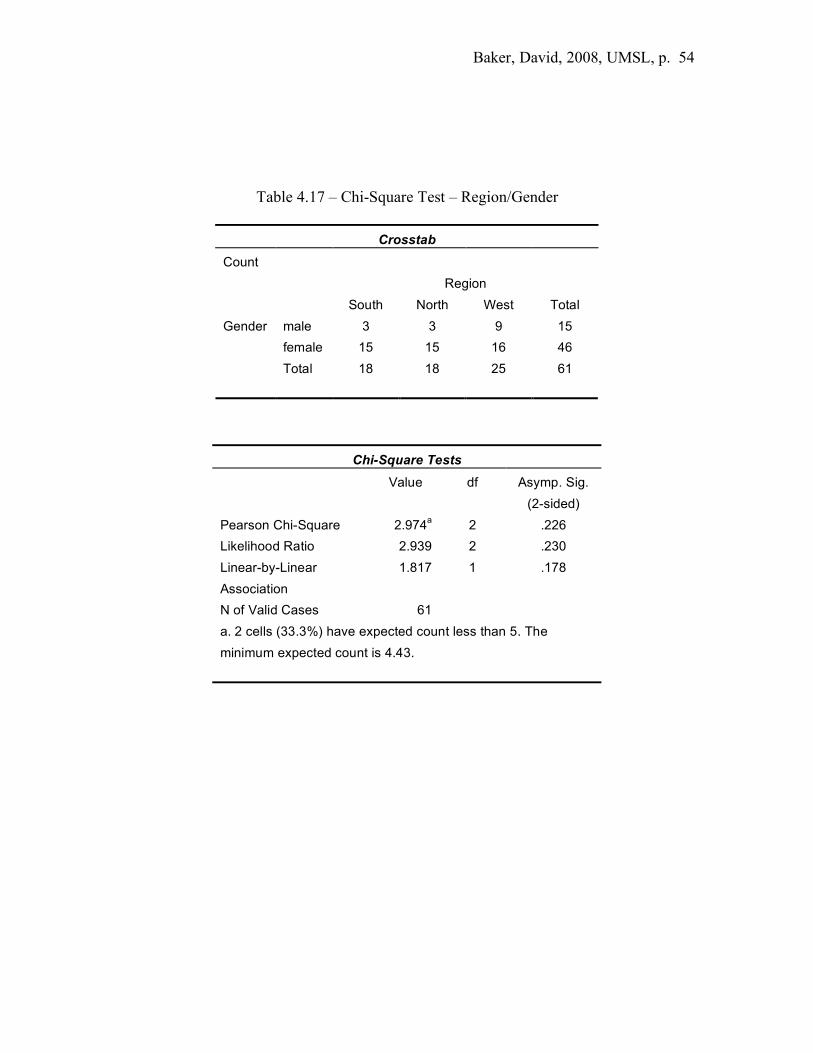
Table 4.17 – Chi-Square Test – Region/Gender
Crosstab
Count Region South North West Total
male 3 3 9 15 female 15 15 16 46
Gender
Total 18 18 25 61
Chi-Square Tests Value df Asymp. Sig.
(2-sided) Pearson Chi-Square 2.974a 2 .226 Likelihood Ratio 2.939 2 .230 Linear-by-Linear Association
1.817 1 .178
N of Valid Cases 61
a. 2 cells (33.3%) have expected count less than 5. The minimum expected count is 4.43.

Baker, David, 2008, UMSL, p. 55
Table 4.18 – Chi Square Test – Special Ed. Teacher Training/Gender
Crosstab
Count SPED Yes No Total
male 0 15 15 female 12 33 45
Gender
Total 12 48 60
Chi-Square Tests Value df Asymp. Sig.
(2-sided) Exact Sig. (2-
sided) Exact Sig. (1-
sided) Pearson Chi-Square 5.000a 1 .025
Continuity Correctionb 3.472 1 .062
Likelihood Ratio 7.856 1 .005
Fisher's Exact Test .027 .021 Linear-by-Linear Association
4.917 1 .027
N of Valid Cases 60
a. 1 cells (25.0%) have expected count less than 5. The minimum expected count is 3.00. b. Computed only for a 2x2 table

Baker, David, 2008, UMSL, p. 56
Table 4.19 – Chi-Square Test – CTE Connection/Gender
Crosstab
Count CTE Connection yes no Total
male 4 11 15 female 10 35 45
Gender
Total 14 46 60
Chi-Square Tests Value df Asymp. Sig.
(2-sided) Exact Sig. (2-
sided) Exact Sig. (1-
sided) Pearson Chi-Square .124a 1 .724
Continuity Correctionb .000 1 1.000
Likelihood Ratio .122 1 .727
Fisher's Exact Test .734 .487 Linear-by-Linear Association
.122 1 .727
N of Valid Cases 60
a. 1 cells (25.0%) have expected count less than 5. The minimum expected count is 3.50. b. Computed only for a 2x2 table

Baker, David, 2008, UMSL, p. 57
Table 4.20 – Chi-Square Test – Region/Number of Visits
Crosstab
Count Region South North West Total
0-1 time 3 5 8 16 2-5 times 13 10 12 35 more than 5 times
2 3 5 10
Visits
Total 18 18 25 61
Chi-Square Tests Value df Asymp. Sig.
(2-sided) Pearson Chi-Square 2.552a 4 .635 Likelihood Ratio 2.621 4 .623 Linear-by-Linear Association
.108 1 .743
N of Valid Cases 61
Expected count less than 5. The minimum expected count is 2.95.
Baker, David, 2008, UMSL, p. 58
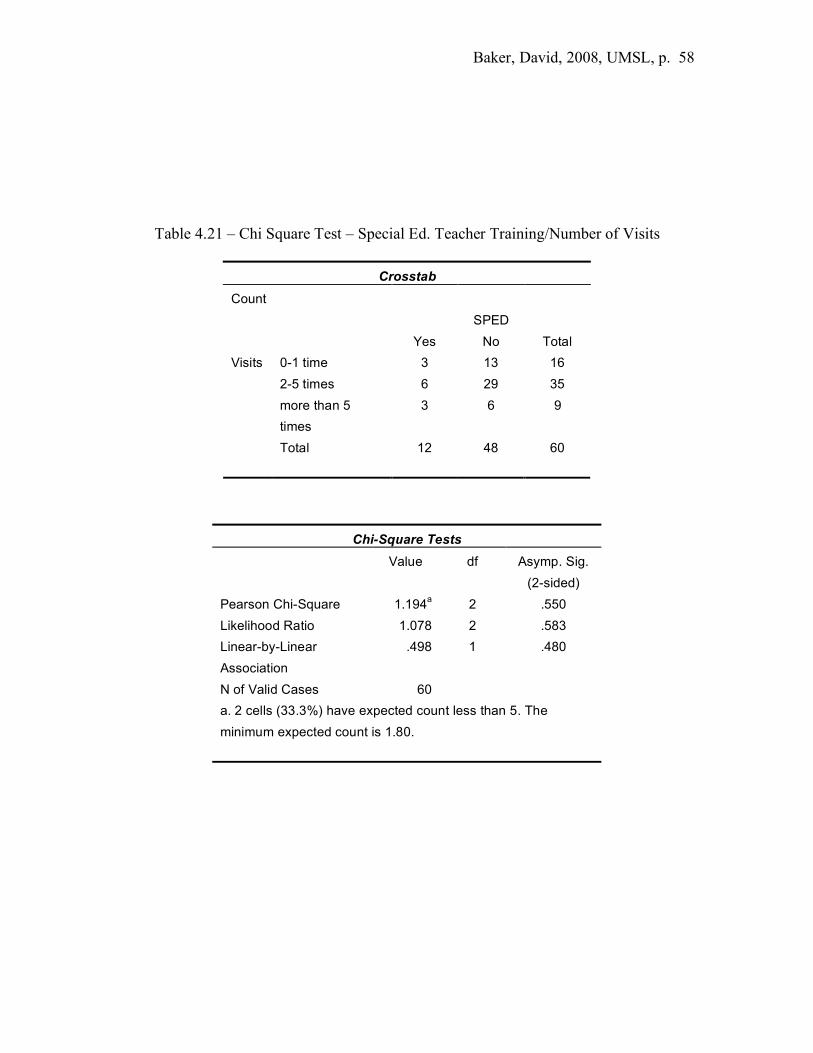
Table 4.21 – Chi Square Test – Special Ed. Teacher Training/Number of Visits
Crosstab
Count SPED Yes No Total
0-1 time 3 13 16 2-5 times 6 29 35 more than 5 times
3 6 9
Visits
Total 12 48 60
Chi-Square Tests Value df Asymp. Sig.
(2-sided) Pearson Chi-Square 1.194a 2 .550 Likelihood Ratio 1.078 2 .583 Linear-by-Linear Association
.498 1 .480
N of Valid Cases 60
a. 2 cells (33.3%) have expected count less than 5. The minimum expected count is 1.80.
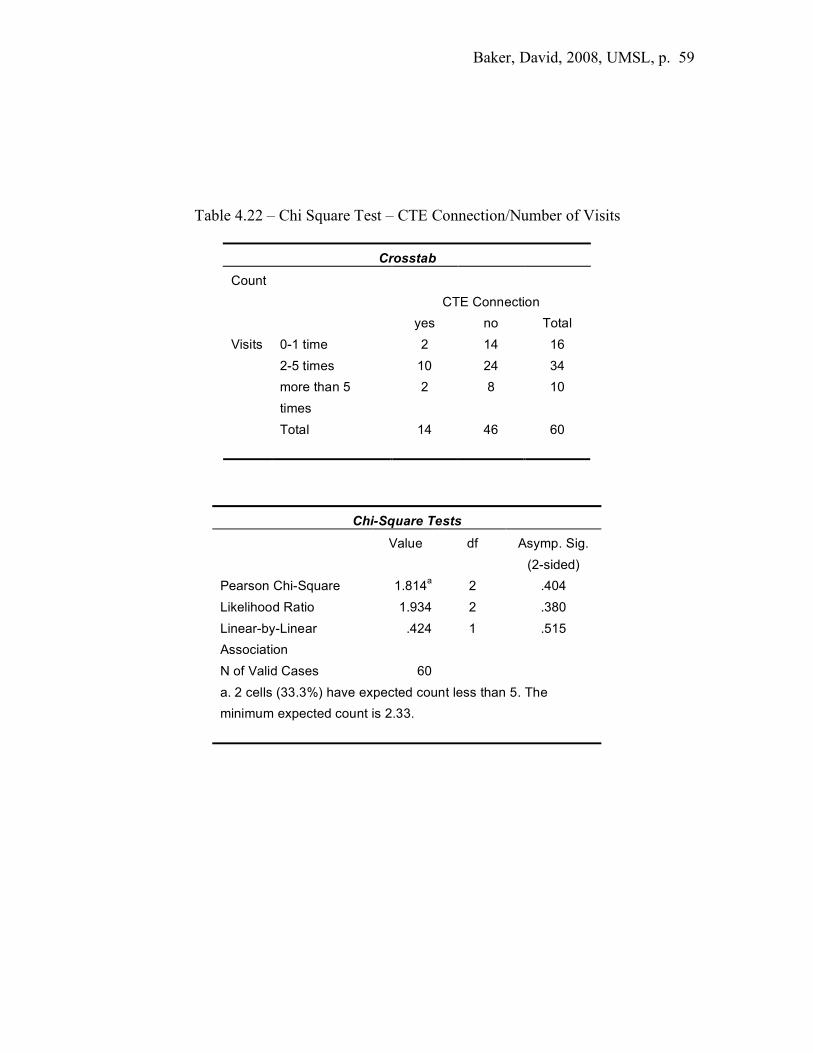
Baker, David, 2008, UMSL, p. 59
Table 4.22 – Chi Square Test – CTE Connection/Number of Visits
Crosstab
Count CTE Connection yes no Total
0-1 time 2 14 16 2-5 times 10 24 34 more than 5 times
2 8 10
Visits
Total 14 46 60
Chi-Square Tests Value df Asymp. Sig.
(2-sided) Pearson Chi-Square 1.814a 2 .404 Likelihood Ratio 1.934 2 .380 Linear-by-Linear Association
.424 1 .515
N of Valid Cases 60
a. 2 cells (33.3%) have expected count less than 5. The minimum expected count is 2.33.

Baker, David, 2008, UMSL, p. 60
Results
The chi-square tests revealed that there was unequal representation of age across
regions. There was a significant difference in the ratio of counselors under 35 years of
age in the south region. The chi-square tests also revealed that no male counselors who
completed the survey had special education teacher training. That is, the 15 counselors
who indicated they received special education teacher training were females. Based on
these results ANCOVAs were conducted utilizing the same independent and dependent
variables with both age and gender utilized as co-variates together and separately. These
ANCOVAs revealed no significant interaction or main effects. Data analysis of these
ANCOVAs are found in Appendix C.
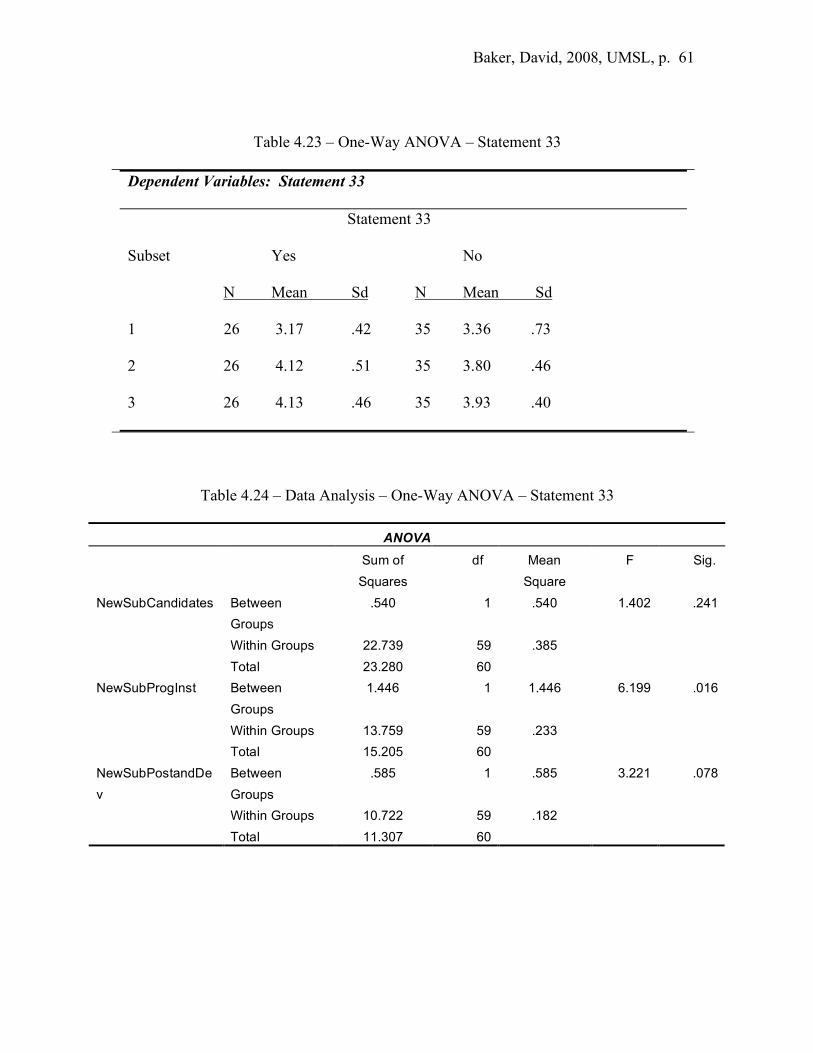
Baker, David, 2008, UMSL, p. 61
Table 4.23 – One-Way ANOVA – Statement 33
Dependent Variables: Statement 33
Statement 33
Subset Yes No
N Mean Sd N Mean Sd
1 26 3.17 .42 35 3.36 .73
2 26 4.12 .51 35 3.80 .46
3 26 4.13 .46 35 3.93 .40
Table 4.24 – Data Analysis – One-Way ANOVA – Statement 33
ANOVA Sum of
Squares df Mean
Square F Sig.
Between Groups
.540 1 .540 1.402 .241
Within Groups 22.739 59 .385
NewSubCandidates
Total 23.280 60
Between Groups
1.446 1 1.446 6.199 .016
Within Groups 13.759 59 .233
NewSubProgInst
Total 15.205 60
Between Groups
.585 1 .585 3.221 .078
Within Groups 10.722 59 .182
NewSubPostandDev
Total 11.307 60

Baker, David, 2008, UMSL, p. 62
Results
Statement 33 dealt with counselors’ awareness that North and South Technical
High Schools belong to the High Schools That Work school improvement movement,
which is intended to improve instruction. There were no significant differences in the
means for subsets 1 and 3. However, the mean of subset 2 for those who responded
“yes” was 4.12, which was significantly different from the mean of those who responded
“no,” 3.80. Therefore, whether or not a counselor was aware that North and South
Technical High Schools belong to the High Schools That Work school improvement
movement impacted responses to the survey statements in subset 2.
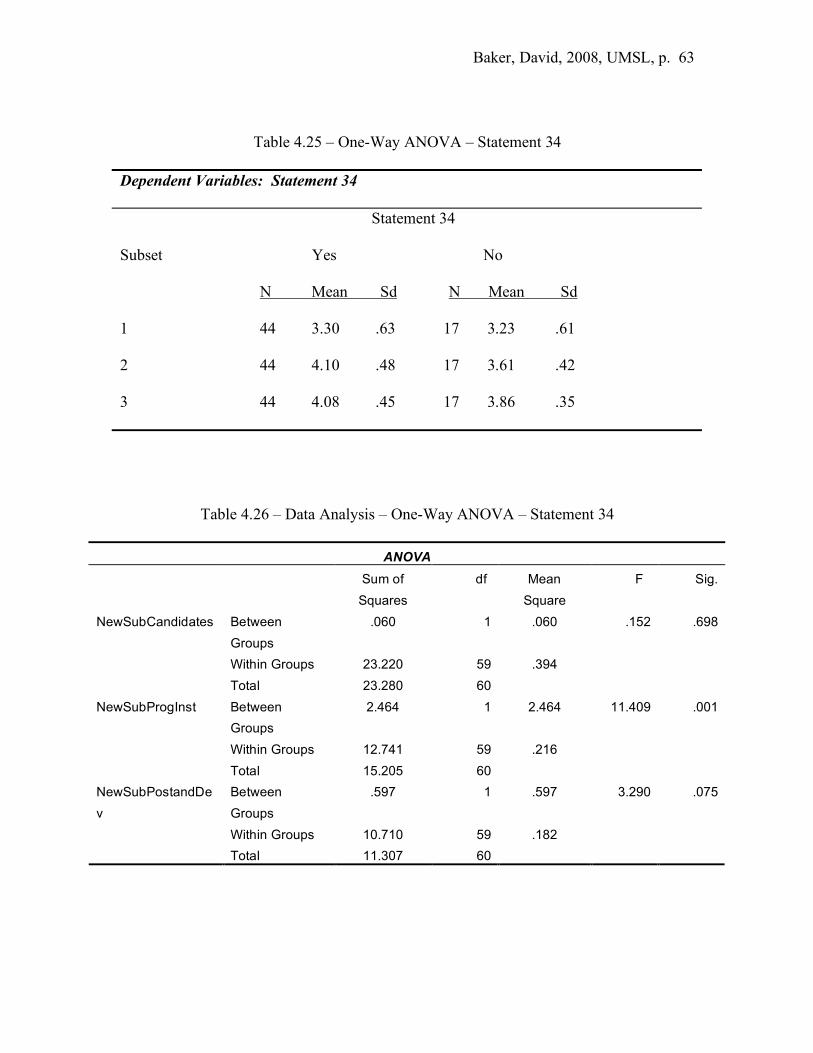
Baker, David, 2008, UMSL, p. 63
Table 4.25 – One-Way ANOVA – Statement 34
Dependent Variables: Statement 34
Statement 34
Subset Yes No
N Mean Sd N Mean Sd
1 44 3.30 .63 17 3.23 .61
2 44 4.10 .48 17 3.61 .42
3 44 4.08 .45 17 3.86 .35
Table 4.26 – Data Analysis – One-Way ANOVA – Statement 34
ANOVA Sum of
Squares df Mean
Square F Sig.
Between Groups
.060 1 .060 .152 .698
Within Groups 23.220 59 .394
NewSubCandidates
Total 23.280 60
Between Groups
2.464 1 2.464 11.409 .001
Within Groups 12.741 59 .216
NewSubProgInst
Total 15.205 60
Between Groups
.597 1 .597 3.290 .075
Within Groups 10.710 59 .182
NewSubPostandDev
Total 11.307 60
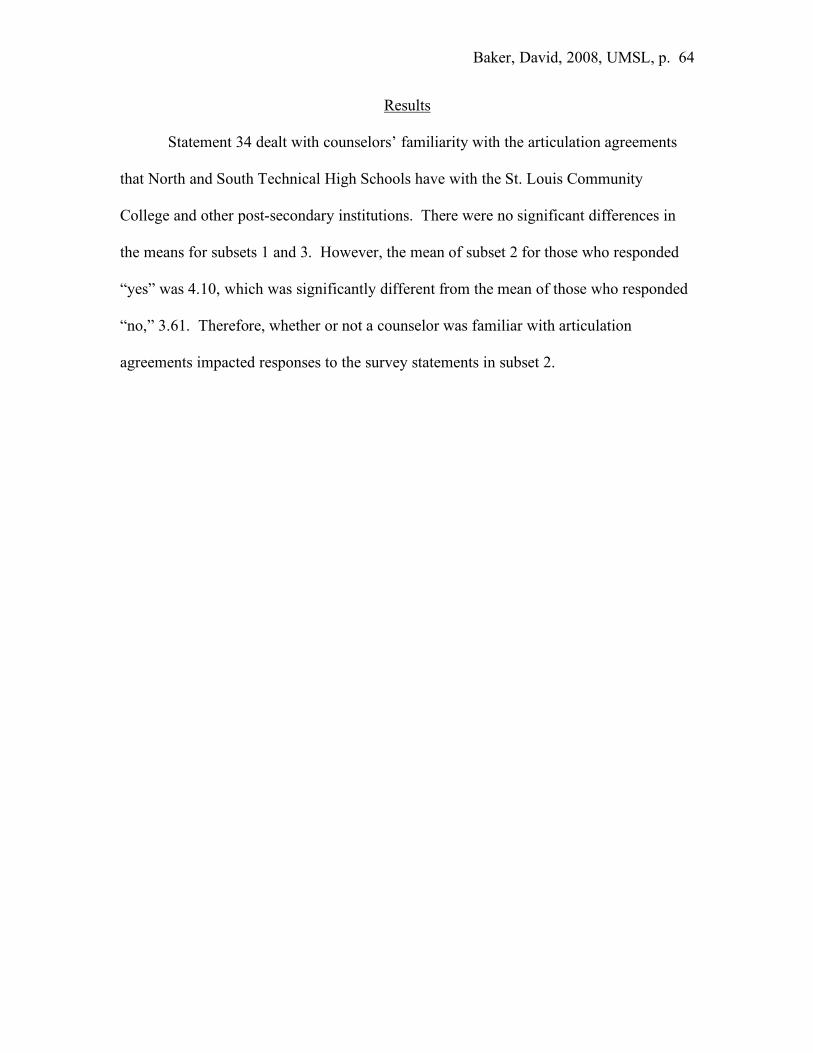
Baker, David, 2008, UMSL, p. 64
Results
Statement 34 dealt with counselors’ familiarity with the articulation agreements
that North and South Technical High Schools have with the St. Louis Community
College and other post-secondary institutions. There were no significant differences in
the means for subsets 1 and 3. However, the mean of subset 2 for those who responded
“yes” was 4.10, which was significantly different from the mean of those who responded
“no,” 3.61. Therefore, whether or not a counselor was familiar with articulation
agreements impacted responses to the survey statements in subset 2.

Baker, David, 2008, UMSL, p. 65
Table 4.27 – One-Way ANOVA – Statement 35
Dependent Variables: Statement 35
Statement 35
Subset Yes No
N Mean Sd N Mean Sd
1 58 3.30 .63 3 3.22 .38
2 58 4.00 .47 3 3.05 .38
3 58 4.02 .44 3 3.94 .17
Table 4.28 – Data Analysis – One-Way ANOVA – Statement 35
ANOVA
Sum of Squares
df Mean Square
F Sig.
Between Groups
.009 1 .009 .023 .880
Within Groups 23.270 59 .394
NewSubCandidates
Total 23.280 60
Between Groups
2.494 1 2.494 11.579 .001
Within Groups 12.711 59 .215
NewSubProgInst
Total 15.205 60
Between Groups
.018 1 .018 .092 .763
Within Groups 11.289 59 .191
NewSubPostandDev
Total 11.307 60
Baker, David, 2008, UMSL, p. 66
Results
Statement 35 dealt with counselors’ willingness to recommend either North or
South Technical High School to a college-prep student if attending would not interfere
with with the ability to meet college entrance requirements. There were no significant
differences in the means for subsets 1 and 3. However, the mean of subset 2 for those
who responded “yes” was 4.00, which was significantly different from the mean of those
who responded “no,” 3.05. Therefore, whether or not a counselor would recommend
CTE to a college-prep student impacted responses to the survey statements in subset 2.

Baker, David, 2008, UMSL, p. 67
Chapter 5
Limitations, Findings, and Implications
Discussion
This investigation was conducted so that the investigator, the principal of South
Technical High School, as part of the career and technical education (CTE) division of
Special School District (SSD) would gain knowledge of how public high school guidance
counselors perceive their knowledge of CTE in St. Louis County, Missouri as part of
SSD. This was based on the region where counselors advise, whether they possess
special education teacher training, and whether they have a personal connection with
CTE as a student or through training as a CTE teacher. It is believed that guidance
counselors are the most influential of all educators in a comprehensive high school as it
pertains to student exposure to all scholarly choice including CTE.
The majority of counselors indicated on statement number 32 of the survey
instrument that they believe there are more students in their schools who should be
attending North or South Technical High School. If the counselors were sincere in their
responses to this statement, it is important that this belief be investigated to determine
how to make it come to fruition. CTE often carries the stigma of being suitable only for
those who cannot or do not succeed in the comprehensive high school setting. In St.
Louis County, Missouri there seems to be an underlying assumption that students will
pursue a four-year degree upon graduation from high school, which might be hindered by
participation in CTE while in high school. This assumption seems to exist regardless of
an individual student’s success or motivation during high school. “The supreme

Baker, David, 2008, UMSL, p. 68
benchmark of the effectiveness of local school systems is the number of their teens who
go on to college, not academic achievement or workplace readiness” (Gray, 2000a, p. 3).
Assumptions and Limitations
This investigation was concerned with the perceptions of knowledge of public
high school counselors in St. Louis County, Missouri. Although this was believed to be a
worthwhile endeavor, it did present a sample size problem. At the time of this
investigation there were 153 guidance counselors identified in this total population and
the investigator made attempts to include each counselor. 62 of the counselors (41%) did
respond and the regions from which they responded were equally represented. However,
this response from an initially small population may have effected statistical data
(Tabachnick & Fidell, 2007).
North Technical High School, which serves all of north St. Louis County,
Missouri, consistently maintains a student population of approximately 95% capacity
based upon a maximum student population of 1200. South Technical High School,
which serves all of south and west St. Louis County consistently struggles to maintain
75% capacity based upon a maximum student population of 1200 (SIS Data® –
Appendix F). Therefore, it was assumed that there were significant differences in
perceptions of knowledge of CTE among counselors in the north region and those in the
south and west regions.
Approximately 93% of SSDs certified personnel have special education teacher
training and serve students with learning, physical, emotional, and mental disabilities.
Often, at times erroneously, special education teachers see CTE as an option for students
with disabilities because of a multi-sensory approach or because they feel these students

Baker, David, 2008, UMSL, p. 69
should learn a trade or skill in order to become employable adults (Gaona, 2004).
Therefore, it was assumed that there would be significant differences in perceptions of
knowledge of CTE between counselors with and without special education teacher
training.
Students often come to North or South Technical High School because a relative
or family friend participated in CTE and reported a positive experience; in interviews and
on survey cards CTE students often indicate that they were made aware of the technical
high schools by someone who had a personal connection with CTE. Therefore, it was
assumed that there would be a significant difference in the perceptions of knowledge of
CTE between counselors who had a personal connection with CTE and those who did
not.
The survey tool utilized in this investigation was created with the assistance of
individuals who have knowledge of CTE and of the investigation participants. The
survey did have face validity, but a pilot study was not conducted to more scientifically
determine the validity of survey statements. In case of further investigation it is
suggested that final survey items be developed based on face validity and also be
subjected to a pilot study. Lack of a pilot study may have contributed to no incidences of
main or interaction effects in the ANOVAs conducted.
This investigation utilized a short survey; the Cronbach Alpha correlation
coefficient and Spearman-Brown prophesy formula adjustment indicated that the
instrument did have internal validity. If these results are utilized in future investigations,
performance of a factor analysis on questions 10 through 35 could be done to determine
if the survey subgroups should be modified. However, survey length and population size
Baker, David, 2008, UMSL, p. 70
both present practical problems in conducting a factor analysis (Tabachnick & Fidell,
2007). A longer, more involved survey may yield more legitimate results, but this
decision would likely mean fewer responses to the survey creating other deficiencies.
The chi-square results revealed that the voluntary sample was such that it did not
have an adequate representation of males with special education teacher training. In any
future investigation this should be taken into consideration.
Survey statements 33, 34, and 35 were similar in context to statements 10-32.
However, they were dichotomous and did not follow the Likert Scale model used in the
first 23 survey statements. Due to this discrepancy in the survey construction these three
statements were not incorporated into the three counselor knowledge subsets. Because
they were part of the survey, three one-way ANOVAs were conducted using statements
33, 34, and 35 as independent variables and the three counselor knowledge subsets as
dependent variables. These ANOVAs did yield a result that is a basis for future
investigation into counselors’ perceptions of CTE.
The results of these one-way ANOVAs denote that counselors who responded
“yes” to familiarity with the High Schools That Work reform movement, to knowledge of
CTE’s articulation agreements with post-secondary institutions, or to college bound
students being viable candidates for CTE did have a significantly higher mean on
counselor knowledge subset 2, CTE reform and post-secondary opportunities, than those
who responded “no” to these statements. It is then plausible that factors influencing
counselors may be less likely demographic and more likely related to information about
CTE and North and South Technical High Schools with which they are provided.

Baker, David, 2008, UMSL, p. 71
Findings and Conclusions
Three research questions were presented in the introductory chapter of this
investigation. The first questioned whether region impacts a high school guidance
counselor’s perception of knowledge of CTE in St. Louis County, Missouri and the SSD.
The results of the three-factor univariate ANOVAs completed in this investigation did not
yield results (no significant main effect or interaction effect) that indicated there is
significant difference in the means of the three subsets (CTE candidates, CTE Programs
and Instruction, and CTE Program Development and Post-Secondary Opportunities) in
regard to counselor region. Therefore, Null Hypothesis number one could not be
rejected: There is no significant difference in perception of knowledge of CTE among
public high school guidance counselors in the three regions in St. Louis County,
Missouri.
The second questioned whether possession of training as a special education
teacher impacts a high school guidance counselor’s perception of knowledge of CTE in
St. Louis County, Missouri. The results of the three-factor univariate ANOVAs
completed in this investigation did not yield results (no significant main effect or
interaction effect) that indicated there is a significant difference in the means of the three
subsets (CTE Candidates, CTE Programs and Instruction, and CTE Program
Development and Post-Secondary Opportunities) in regard to a counselor’s possession of
special education teacher training. Therefore, Null Hypothesis number two could not be
rejected: There is no significant difference in perception of knowledge of CTE between
high school guidance counselors in St. Louis County, Missouri who possess special
education teacher training and those who do not.
Baker, David, 2008, UMSL, p. 72
The third questioned whether personal experience with CTE as a student or
through CTE teacher training impacts a high school guidance counselor’s perception of
knowledge of CTE. The results of the three-factor univariate ANOVAs completed in this
investigation did not yield results (no significant main effect or interaction effect) that
indicated there is a significant difference in the means of the three subsets (CTE
Candidates, CTE Programs and Instruction, and CTE Program Development and Post-
Secondary Opportunities) in regard to personal connection with CTE. Therefore, Null
Hypothesis number three could not be rejected: There is no significant difference in
perception of knowledge of CTE between high school guidance counselors in St. Louis
County, Missouri who have a personal connection with CTE as a student or through CTE
teacher training and those who do not.
It was somewhat surprising that not one of the three factors was observed to have
an impact on counselor’s perceptions. However, this can be a commencement for further
investigation to determine what does impact counselors’ perceptions. It seems that
surveys of this type are often more inviting to individuals who have a positive attitude
toward the subject of the survey than those who are neutral, dismissive, or even negative
toward the subject. The letter that accompanied the survey indicated that the results
would be used to assist SSD in bettering its programs. Counselors who feel CTE does
not and should not serve their student population may not have completed the survey.
Practical Implications
The important role that CTE plays in our educational system should be made
more evident to educators, parents, boards of education and lawmakers. Many students
who languish in high school maintaining between a 1.00 and a 2.50 grade point average,
Baker, David, 2008, UMSL, p. 73
regardless of the socio-economic status of the region surrounding the high school that
they attend, can and must do better. The cooperation between comprehensive high
schools and CTE centers can help to ensure that students reach their maximum potential
and that they have a feasible plan for education and/or career after high school.
Just like a savvy politician, you can use your time in high school to set up a
“campaign” that will help you achieve your future career goals. This campaign
includes increasing your awareness of the work world, developing job-search
skills, creating a career portfolio, and considering whether you want or need to go
to college (Bolles and Christen, 2006, p. 55).
Because counselors are instrumental in the promotion of CTE, their perceptions
regarding, their advocacy of, and their biases about students participating in non-college
preparatory courses must be continually explored. This investigation indicated that
region, special education teacher training, and a personal connection with CTE as a
student or through CTE teacher training does not have a significant impact on how high
school guidance counselors perceive their knowledge of CTE in St. Louis County,
Missouri. Further investigation should attempt to determine what factors do significantly
impact their perceptions of CTE and in turn their willingness to promote it.
For the purposes of this investigation the frequency of responses were not of
ultimate importance; instead it was the determination of whether the three chosen factors
impacted those responses. The frequency distributions (Appendix C) that were a result of
this survey will be compiled and analyzed by a marketing and admissions task force that
was initiated in the fall of 2007 to study the effectiveness of marketing strategies and
admissions policies and procedures practiced by the CTE division of SSD. These
Baker, David, 2008, UMSL, p. 74
distributions and this investigation will be presented to the Superintendent and the
Director of CTE of the SSD for their edification.

Baker, David, 2008, UMSL, p. 75
References
Achieve, Inc. (2004). The expectations gap: A 50-state review of high school
graduation requirements. Washington, D.C. Retrieved June 19, 2007 from
http://www.achieve.org/node/549
ACTEonline. (2007). Changing the image of career and technical education. Retrieved
February 12, 2007 from
http://www.acteonline.org./members/news/frontpage_news/frontpage62703.cfm?
renderforp
Bailey, T. (1993, April). Can youth apprenticeship thrive in the United States?
Educational Researcher. 22, 11-16.
Baker, G. E., Boser, R. A., & Householder, D. L. (1992). Coping at the
crossroads: Societal and educational transformation in the United States.
Journal of Technology Education. 4, 5-17.
Brendefur, J. L., & Hernández, V. M. (2003). Developing authentic, integrated,
standards-based mathematics curriculum: More than just an
interdisciplinary collaborative approach. Journal of Vocational Education
Research, 28(3), 259-283.
Bolles, R. N., & Christen, C. (2006). What color is your parachute? For teens:
Discovering yourself, defining your future. Berkeley, CA: Ten Speed Press.
Bottoms, G., Presson, A., & Johnson, M. (1992). Making high schools work. Atlanta:
Southern Regional Education Board.
Bottoms, G. and Presson, H., & Han, L. (2007). Students can’t wait: High schools must
turn knowledge into action. Atlanta: Southern Regional Education Board.
Baker, David, 2008, UMSL, p. 76
Bridgeland, J. M., Dilulio, J. J., & Morison, K. B. (2006, March). The silent epidemic:
perspectives of high school dropouts. Civic Enterprises/Peter D. Hart Research
Associates for the Bill and Melinda Gates Foundation.
Brouillette, Matthew J. (1999) The 1830s and 40s: Horace Mann, the end of free-market
education, and the rise of government schools. Retrieved February 19, 2007,
from http://www.mackinac.org/article.aspx?ID=2035
Career and Technical Education Advisor. (2006, December). IES curriculum
competition will measure academic rigor in CTE. 2(10), p. 6.
Catri, D. B. (1998). Vocational education’s image for the 21st century. Retrieved June
22, 2007, from http://www.ericdigests.org/1999-2/21st.htm
Dewey, J. (1938). Experience and education. New York: Collier.
Drucker, P. F. (1994, November). The age of social transformation. Atlantic Monthly,
53-80. Retrieved August 22, 2007 from
http://www.theatlantic.com/ideastour/markets-morals/drucker-full.mhtml
Exceptional Family Member Program. (2004, August 26). Federal laws affecting
individuals with disabilities. Retrieved February 1, 2007, from
http://walterreed.army.mil/departments/Pediatrics/EFMP/handbook/CH2.htm
Federal Legislation and Vocational Education (FLVE). (2006, November 11).
Vocational education act of 1963. Retrieved November 11, 2006 from
http://www.auburn.edu/academic/classes/voed/0346/Legislation/sld006.htm
Friedman, T. L. (2005, April 3). It’s a flat world, after all. New York Times Magazine.
Retrieved April 7, 2005 from http://www.nytimes.com/pages/magazine
Baker, David, 2008, UMSL, p. 77
Gaona, J. (2004, Summer). The effects of the no child left behind act on career and
technical education: Implications for students with special needs. Journal of
Industrial Teacher Education. 41(2). Retrieved 6/22/07 from
http://www.scholar.lib.vt.edu/ejournals/JITE/v41n2/gaona.html
Gaul, J. (2005, September). Educational rigor and relevance: An interview with
Willard Daggett. Techniques, 34-37.
Gray, K. (2000a). Getting real: Helping teens find their future. Thousand Oaks, CA:
Corwin Press.
Gray, K. (2000b). Other ways to win: Creating alternatives for high school
graduates. (2nd ed.). Thousand Oaks, CA: Corwin Press.
Greenwood, K. B. (1983). An historical look at politics in vocational education.
In R. Seivers (Ed.), Yearbook of the American vocational association: The
politics of vocational education (YAVA). Arlington, VA: American Vocational
Association, Inc.
Guskey, T. R. (2006). Benjamin S. Bloom: Portaits of an educator. Lanham,
Maryland: Rowan and Littlefield Education.
Herr, E., & Gray, K. (1998). Workforce education: The basics. Needam Heights, MA:
Allyn & Bacon
Herschbach, D. R. (2001, Fall). The 1970s. Journal of Industrial Education, 39.
Retrieved January 4, 2007 from
http://scholar.lib.vt.edu/ejournals/JITE?v39n1/1070.html
Kerka, S. (1993). Career education for a global economy. Retrieved on 2/12/07 from
http://www.ericdigest.org/1993/global.htm

Baker, David, 2008, UMSL, p. 78
King, A. R., Jr., & Brownwell, J. A. (1979). The claim of occupational man on the
curriculum. In J. Fuller & T. Whealon (Eds.), Career education: A lifelong
process. Chicago: Nelson Hall.
Lankard, B. A. (1994). Employers’ expectations of vocational education: Eric Digest
No. 149. Retrieved on 6/22/07 from
http://www.ericdigests.org/1995-2/vocational.htm
Lynch, R. L. (2000). High school career and technical education for the first decade
of the 21st century. Journal of Vocational Education Research, 25.
Retrieved January 4, 2007 from
http://www.scholar.lib.vt.edu/ejournals/JVER/v25n2/lynch.html
Mateka, G. M. (2001, March). The perceived impact of vocational career
academies on comprehensive high schools in the state of New Jersey.
Retrieved February 12, 2007.
http://muse.widener.edu/~egrozyck/Dissertations/MatekaW.html
National Commission on the Reform of Secondary Education – The Charles Kettering
Foundation. (1973). The reform of secondary education. New York: McGraw
Hill.
National Governors Association. (2007, June 14). Retooling career and technical
education. Retrieved July 16, 2007, from
http://www.nga.org/Files/pdf/0706TECHED.PDF
Naylor, M. (1987). Effective and ethical recruitment of vocational students.
Retrieved February 12, 2007, from http://www.ericdigests.org/pre-925/ethical.htm

Baker, David, 2008, UMSL, p. 79
New Commission on the Skills of the American Workforce. (2006). Tough times or
tough choices – executive summary. National Center on Education and the
Economy.
Oklahoma Department of Career and Technology Education (ODCTE).
(2007, January 2). A selected chronology of the history of vocational and
technical education in the United States in general. Retrieved January 2, 2007
from
http://www.auburn.edu/academic/classes/voed/0346/Legislation/sld006.htm
Project Lead The Way. (2006). About project lead the way. Retrieved April 2, 2007
from http://www.pltw.org/about/about-us.html
Regnier, P. (2007, February). Is it time for a new new deal? Money. 36(2), 94-100.
Reid, K. (1988). Teaching the learning disabled: A cognitive developmental approach.
Needham, MA: Allyn & Bacon.
Reliability Analysis: Statnotes from North Carolina State University, Public
Administration. (n.d.). Retrieved May 30, 2008 from
http://www2.chass.ncsu.edu/garson/pa765/reliab.htm
Ries, A. & Trout, J. (1993). The 22 immutable laws of marketing. New York:
Harper Business
SkillsUSA: Champions at Work. (n.d). SkillsUSA history. Retrieved January 15, 2007
from http://www.skillsusa.org/about/history.shtml
Swanson, J. C. (1951). Development off federal legislation for vocational education.
Chicago, IL: American Technical Society.
Baker, David, 2008, UMSL, p. 80
Tabachnick, B. A., & Fidell, L.S. (2007). Using multivariate statistics. (5th ed.). Boston:
Allyn and Bacon.
The James Irvine Foundation. (2006, Summer). Blending academic and real-world
learning: An interview with Gary Hoachlander. IQ: Irvine Quarterly, 6.
Retrieved July 22, 2007, from
http://www.irvine.org/publications/iq/archive/vol6_issue1youth.shtml
Tough, P. (2006, November, 26). What it takes to make a student. New York Times
Retrieved November 29, 2007 from
http://nytimes.com/2006/11/26/magazine/26tough.html
U. S. Congress. (2006). The Carl D. Perkins Career and Technical Education
Improvement Act. Retrieved on June 5, 2007 from
http://frwebgate.access.gpo.gov/cgibin/getdoc.cgi?dbname=109congbills&doci
d=f:s250enr.txt.pdf
Useem, E. L. (1986). Low tech education in a high tech world. New York: The Free
Press.
Vocational Education – History and Background. Retrieved April 10, 2007 from
http://www.referenceforbusiness.com/encyclopedia/Val-Z/Vocational
Education.html
Zuckerman, M. B. (2007, June 11). Uneasy in the middle. U.S. News and World Report.
142(21), 72.
Baker, David, 2008, UMSL, p. 81
Appendix A
Primary Investigator: David P. Baker, Principal South Technical High School 12721 West Watson Sunset Hills, MO 63127 314-989-7490 [email protected] Public High School Guidance Counselors of St. Louis County, Missouri: I am conducting an investigation in conjunction with the University of Missouri-St. Louis and the Special School District of St. Louis County, Technical Education Division in order to fulfill the requirements for the degree of Doctor of Education. High school guidance counselors are essential to student success at both the secondary and post-secondary levels, and this questionnaire was developed to help us better understand your perception of Career and Technical Education’s role in creating opportunities for students. Insight into your knowledge of North and/or South Technical High School(s) will assist us in development of a strategic plan to serve St. Louis County effectively. Please, respond to questions based upon your personal knowledge of either or both schools. Confidentiality: All data received during the course of this investigation will be securely stored and no names will appear on questionnaires, therefore, there will be no connections made to questionnaire completers during the investigation and/or reporting of data. Completion of this questionnaire is strictly voluntary and you may choose not answer any specific question(s). Completion of this questionnaire will be the extent of your participation in this investigation. Completing the questionnaire and submitting it to the investigator indicates your willingness to have your responses utilized in this investigation. If you choose not to complete the questionnaire, simply delete it from your e-mail inbox. Contact the primary investigator with questions. Please, click on the link below to complete the 35 question online survey; the survey should take fewer than 7 minutes to complete. Thank you. http://www.expertscan.autodata.com/Default.aspx?webid=45822A87-13FC-4225-A60D-07F328F0D039
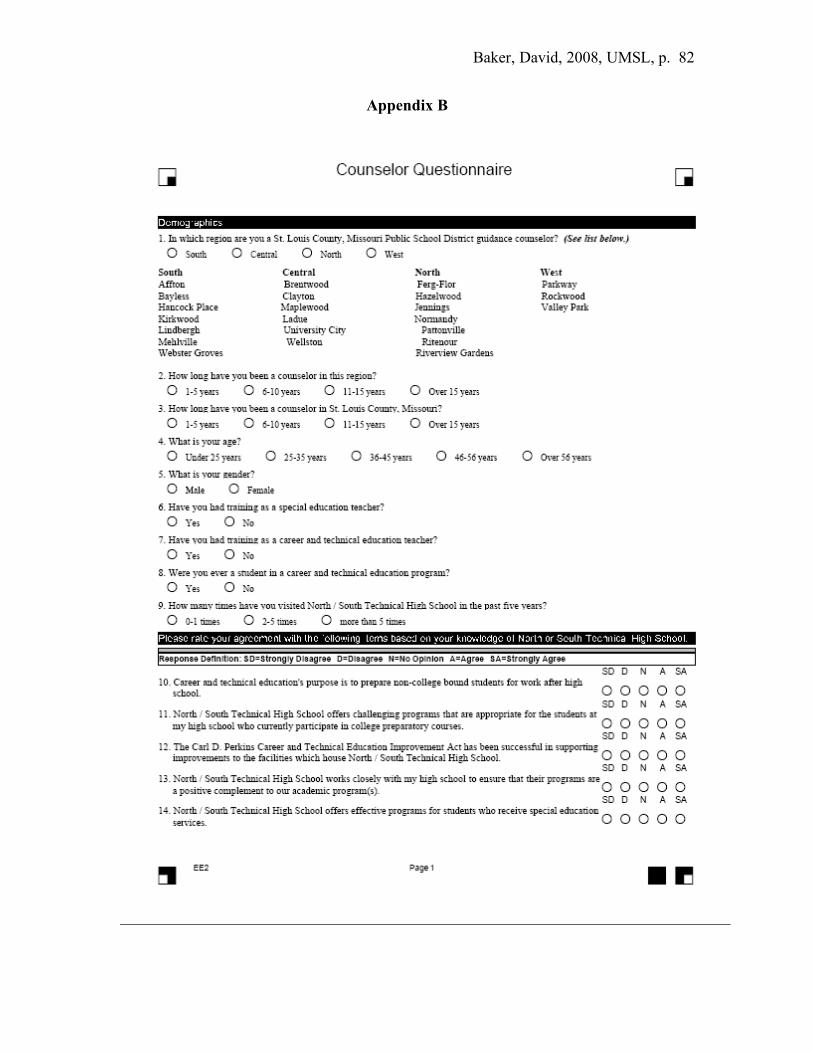
Baker, David, 2008, UMSL, p. 82
Appendix B

Baker, David, 2008, UMSL, p. 83

Baker, David, 2008, UMSL, p. 84
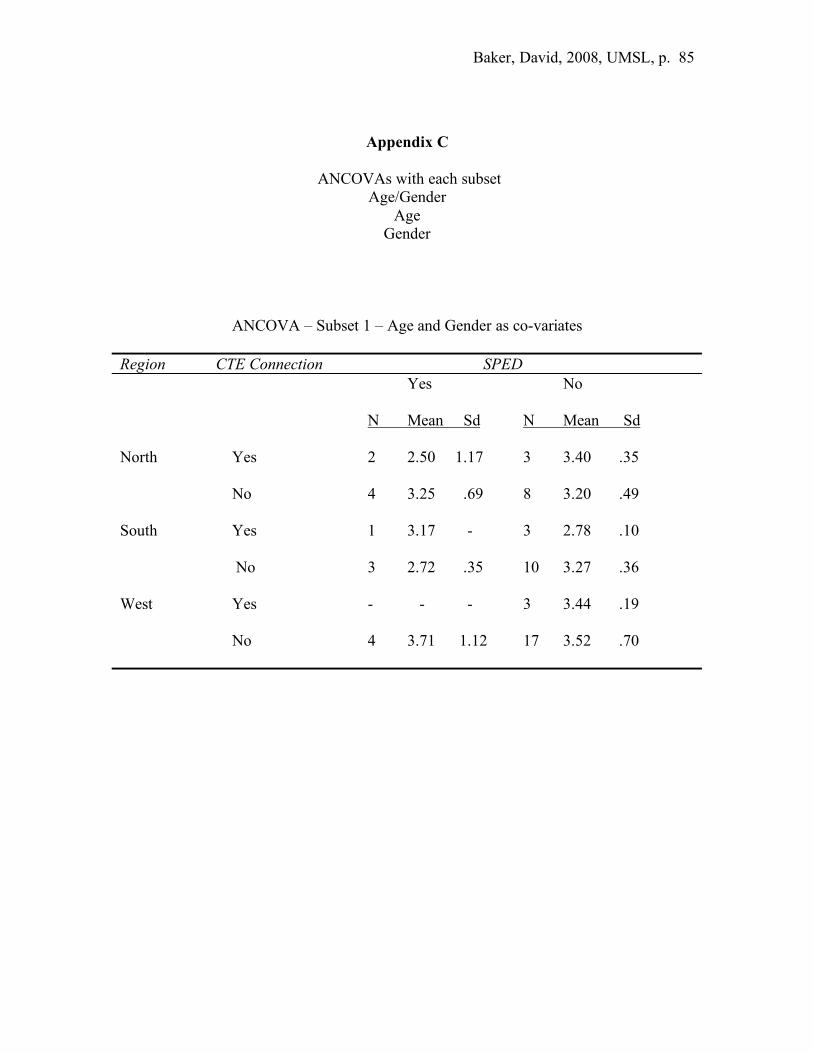
Baker, David, 2008, UMSL, p. 85
Appendix C
ANCOVAs with each subset Age/Gender
Age Gender
ANCOVA – Subset 1 – Age and Gender as co-variates Region CTE Connection SPED Yes No N Mean Sd N Mean Sd North Yes 2 2.50 1.17 3 3.40 .35 No 4 3.25 .69 8 3.20 .49 South Yes 1 3.17 - 3 2.78 .10 No 3 2.72 .35 10 3.27 .36 West Yes - - - 3 3.44 .19 No 4 3.71 1.12 17 3.52 .70
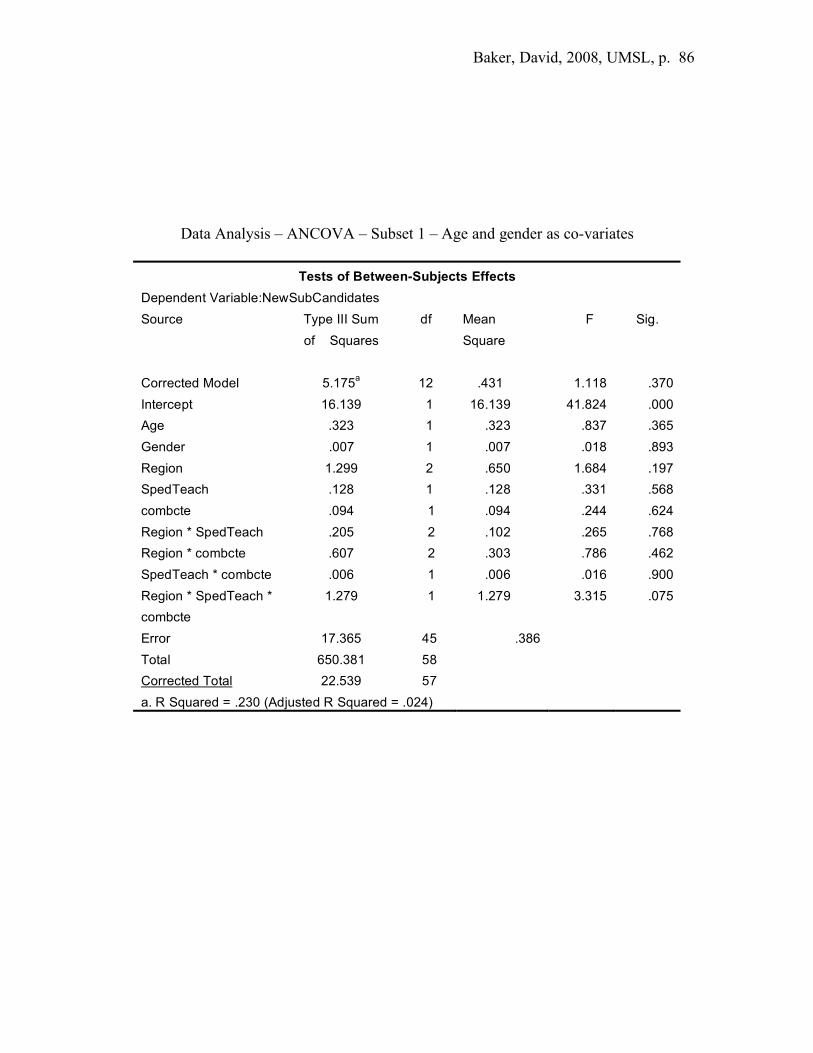
Baker, David, 2008, UMSL, p. 86
Data Analysis – ANCOVA – Subset 1 – Age and gender as co-variates
Tests of Between-Subjects Effects Dependent Variable:NewSubCandidates
Source Type III Sum of Squares
df Mean Square
F Sig.
Corrected Model 5.175a 12 .431 1.118 .370 Intercept 16.139 1 16.139 41.824 .000 Age .323 1 .323 .837 .365 Gender .007 1 .007 .018 .893 Region 1.299 2 .650 1.684 .197 SpedTeach .128 1 .128 .331 .568 combcte .094 1 .094 .244 .624 Region * SpedTeach .205 2 .102 .265 .768 Region * combcte .607 2 .303 .786 .462 SpedTeach * combcte .006 1 .006 .016 .900 Region * SpedTeach * combcte
1.279 1 1.279 3.315 .075
Error 17.365 45 .386
Total 650.381 58
Corrected Total 22.539 57
a. R Squared = .230 (Adjusted R Squared = .024)
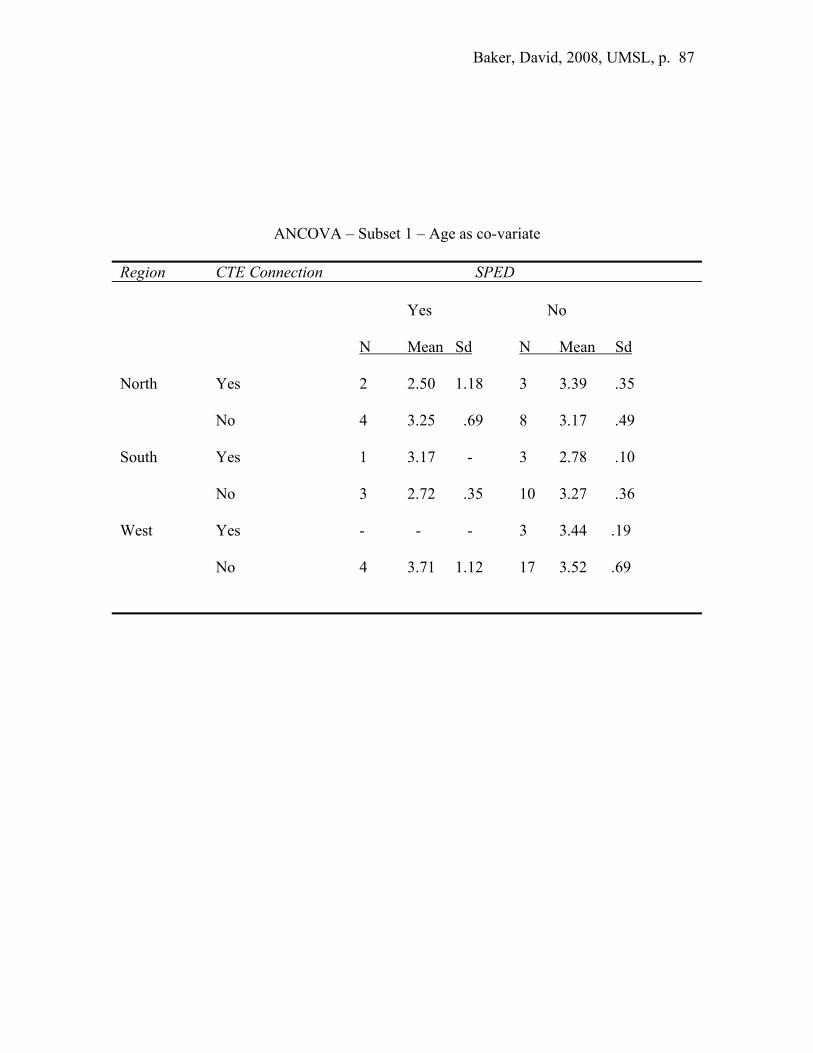
Baker, David, 2008, UMSL, p. 87
ANCOVA – Subset 1 – Age as co-variate Region CTE Connection SPED Yes No N Mean Sd N Mean Sd North Yes 2 2.50 1.18 3 3.39 .35 No 4 3.25 .69 8 3.17 .49 South Yes 1 3.17 - 3 2.78 .10 No 3 2.72 .35 10 3.27 .36 West Yes - - - 3 3.44 .19 No 4 3.71 1.12 17 3.52 .69

Baker, David, 2008, UMSL, p. 88
Data Analysis – ANCOVA – Subset 1 – Age as co-variate
Tests of Between-Subjects Effects Dependent Variable:NewSubCandidates
Source Type III Sum of Squares
df Mean Square
F Sig.
Corrected Model 5.168a 11 .470 1.244 .287 Intercept 27.335 1 27.335 72.383 .000 Age .325 1 .325 .860 .358 Region 1.312 2 .656 1.737 .187 SpedTeach .155 1 .155 .411 .525 combcte .094 1 .094 .250 .620 Region * SpedTeach .198 2 .099 .262 .771 Region * combcte .614 2 .307 .812 .450 SpedTeach * combcte .004 1 .004 .012 .914 Region * SpedTeach * combcte
1.286 1 1.286 3.406 .071
Error 17.372 46 .378
Total 650.381 58
Corrected Total 22.539 57
a. R Squared = .229 (Adjusted R Squared = .045)
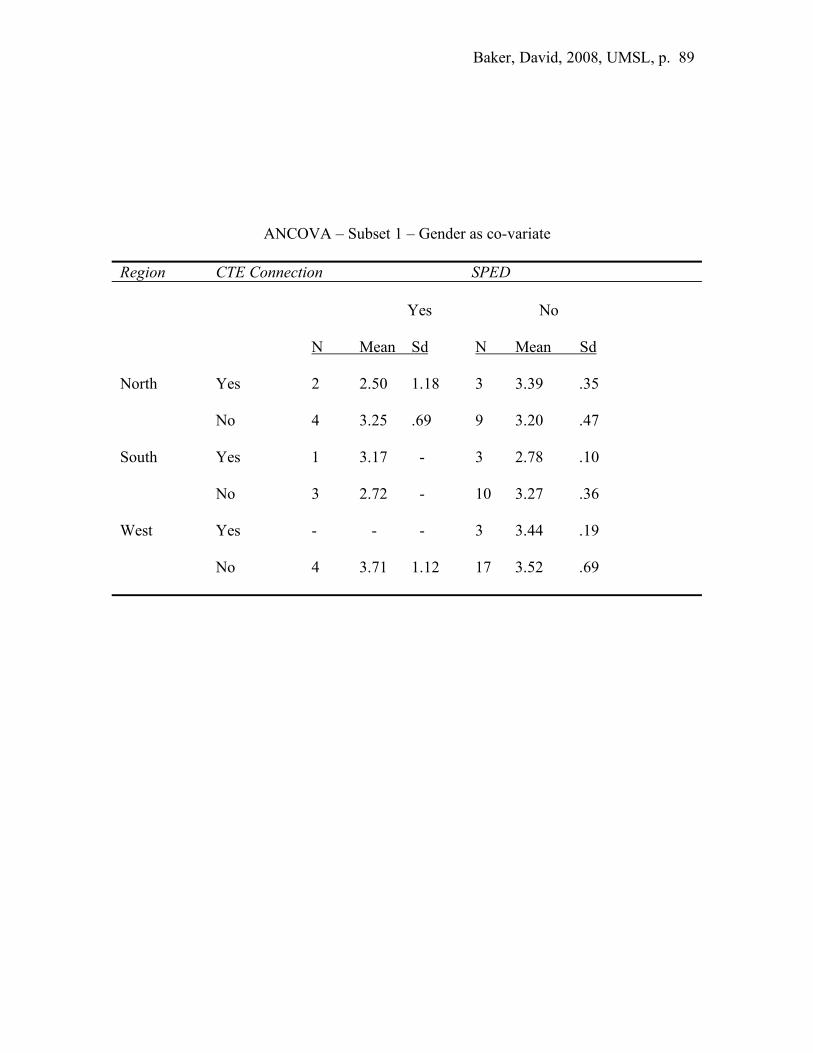
Baker, David, 2008, UMSL, p. 89
ANCOVA – Subset 1 – Gender as co-variate Region CTE Connection SPED Yes No N Mean Sd N Mean Sd North Yes 2 2.50 1.18 3 3.39 .35 No 4 3.25 .69 9 3.20 .47 South Yes 1 3.17 - 3 2.78 .10 No 3 2.72 - 10 3.27 .36 West Yes - - - 3 3.44 .19 No 4 3.71 1.12 17 3.52 .69
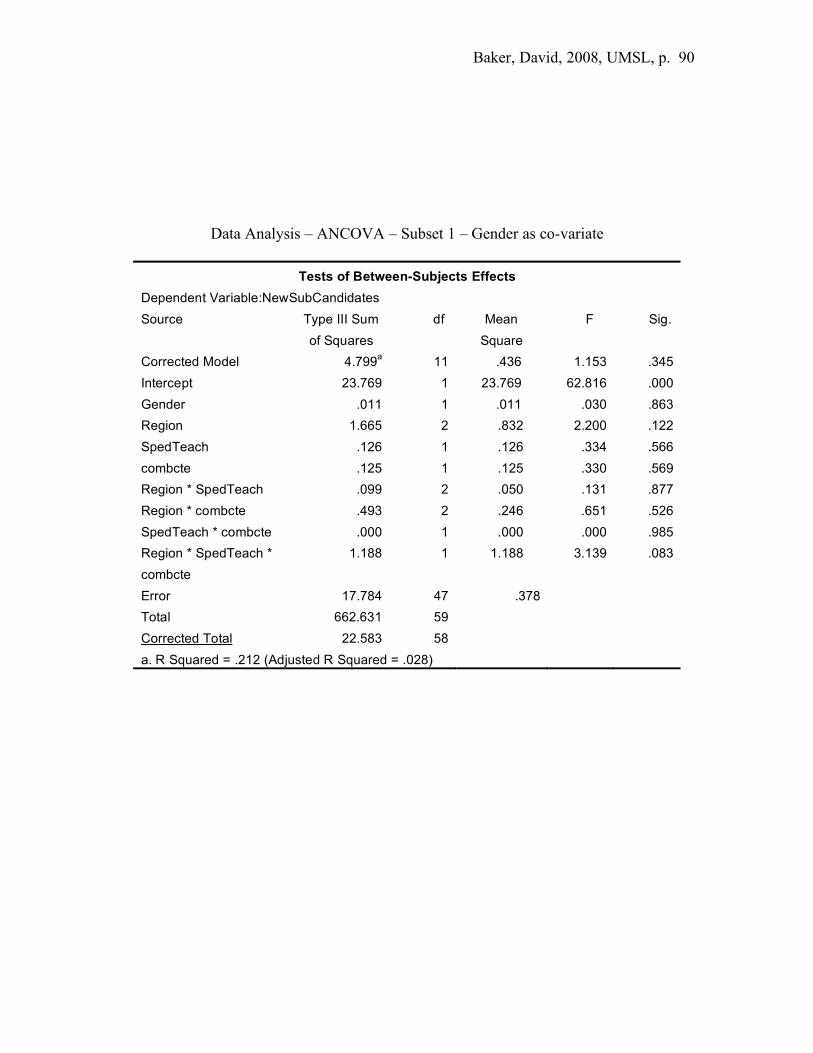
Baker, David, 2008, UMSL, p. 90
Data Analysis – ANCOVA – Subset 1 – Gender as co-variate
Tests of Between-Subjects Effects Dependent Variable:NewSubCandidates
Source Type III Sum of Squares
df Mean Square
F Sig.
Corrected Model 4.799a 11 .436 1.153 .345 Intercept 23.769 1 23.769 62.816 .000 Gender .011 1 .011 .030 .863 Region 1.665 2 .832 2.200 .122 SpedTeach .126 1 .126 .334 .566 combcte .125 1 .125 .330 .569 Region * SpedTeach .099 2 .050 .131 .877 Region * combcte .493 2 .246 .651 .526 SpedTeach * combcte .000 1 .000 .000 .985 Region * SpedTeach * combcte
1.188 1 1.188 3.139 .083
Error 17.784 47 .378
Total 662.631 59
Corrected Total 22.583 58
a. R Squared = .212 (Adjusted R Squared = .028)
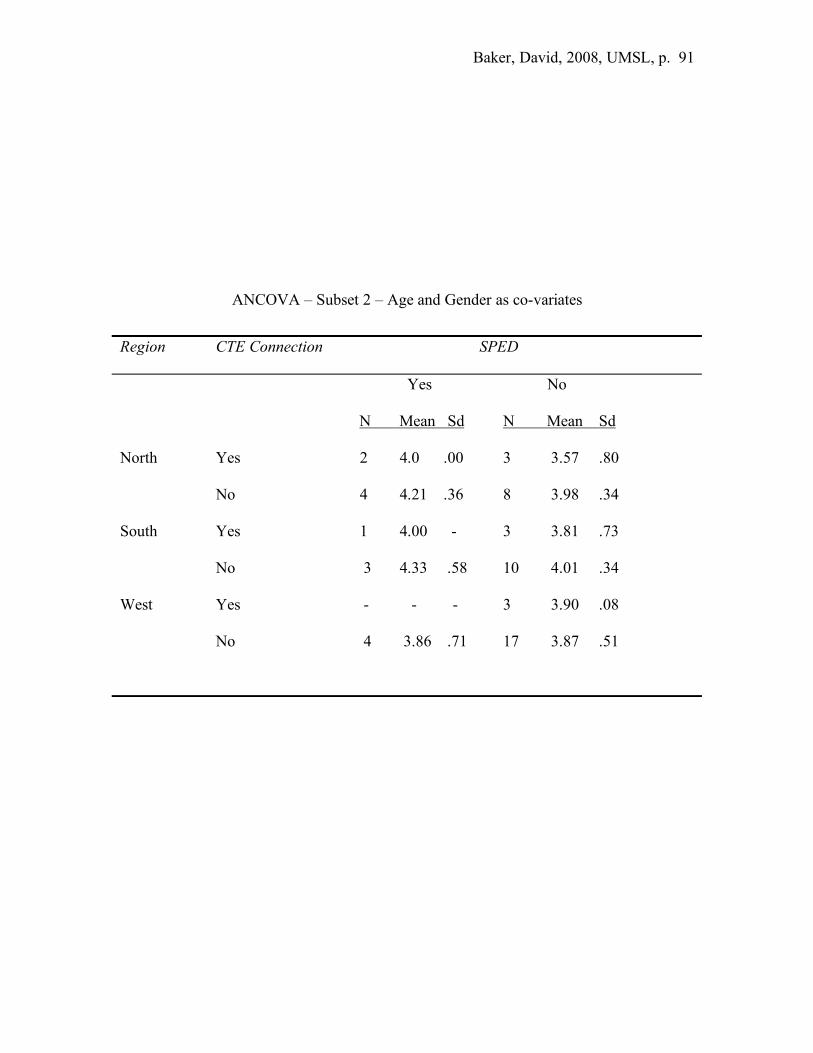
Baker, David, 2008, UMSL, p. 91
ANCOVA – Subset 2 – Age and Gender as co-variates
Region CTE Connection SPED
Yes No
N Mean Sd N Mean Sd
North Yes 2 4.0 .00 3 3.57 .80
No 4 4.21 .36 8 3.98 .34
South Yes 1 4.00 - 3 3.81 .73
No 3 4.33 .58 10 4.01 .34
West Yes - - - 3 3.90 .08
No 4 3.86 .71 17 3.87 .51
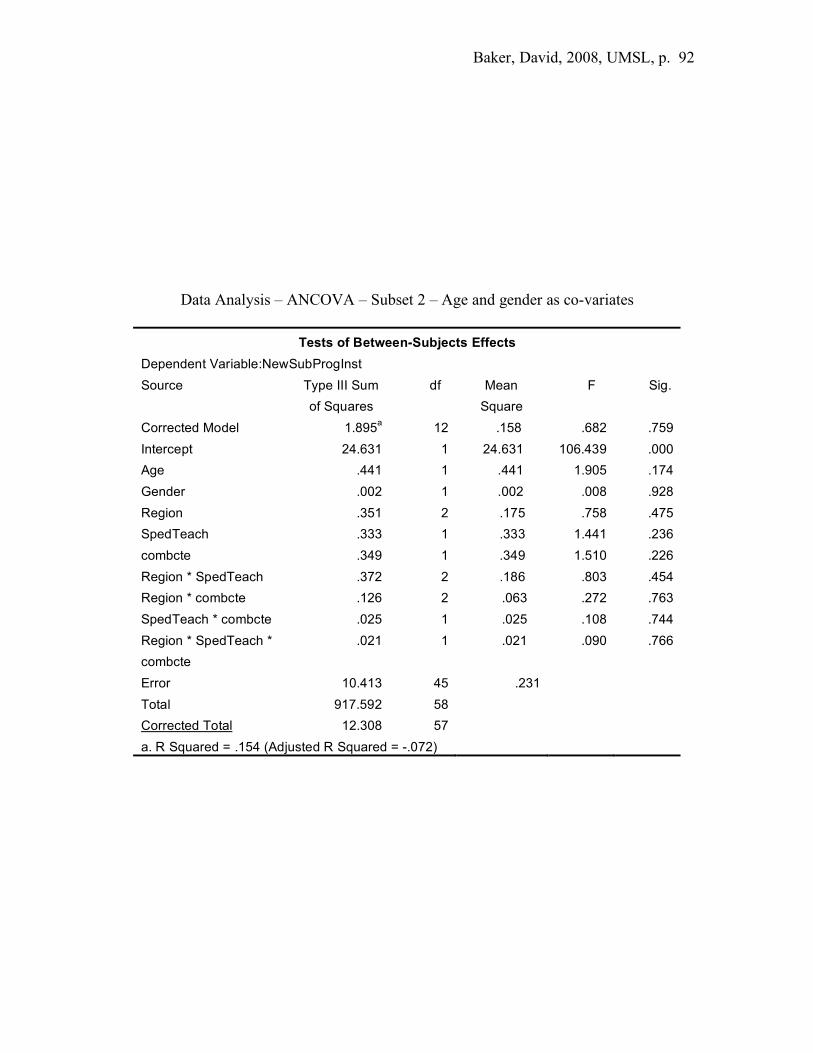
Baker, David, 2008, UMSL, p. 92
Data Analysis – ANCOVA – Subset 2 – Age and gender as co-variates
Tests of Between-Subjects Effects Dependent Variable:NewSubProgInst
Source Type III Sum of Squares
df Mean Square
F Sig.
Corrected Model 1.895a 12 .158 .682 .759 Intercept 24.631 1 24.631 106.439 .000 Age .441 1 .441 1.905 .174 Gender .002 1 .002 .008 .928 Region .351 2 .175 .758 .475 SpedTeach .333 1 .333 1.441 .236 combcte .349 1 .349 1.510 .226 Region * SpedTeach .372 2 .186 .803 .454 Region * combcte .126 2 .063 .272 .763 SpedTeach * combcte .025 1 .025 .108 .744 Region * SpedTeach * combcte
.021 1 .021 .090 .766
Error 10.413 45 .231
Total 917.592 58
Corrected Total 12.308 57
a. R Squared = .154 (Adjusted R Squared = -.072)
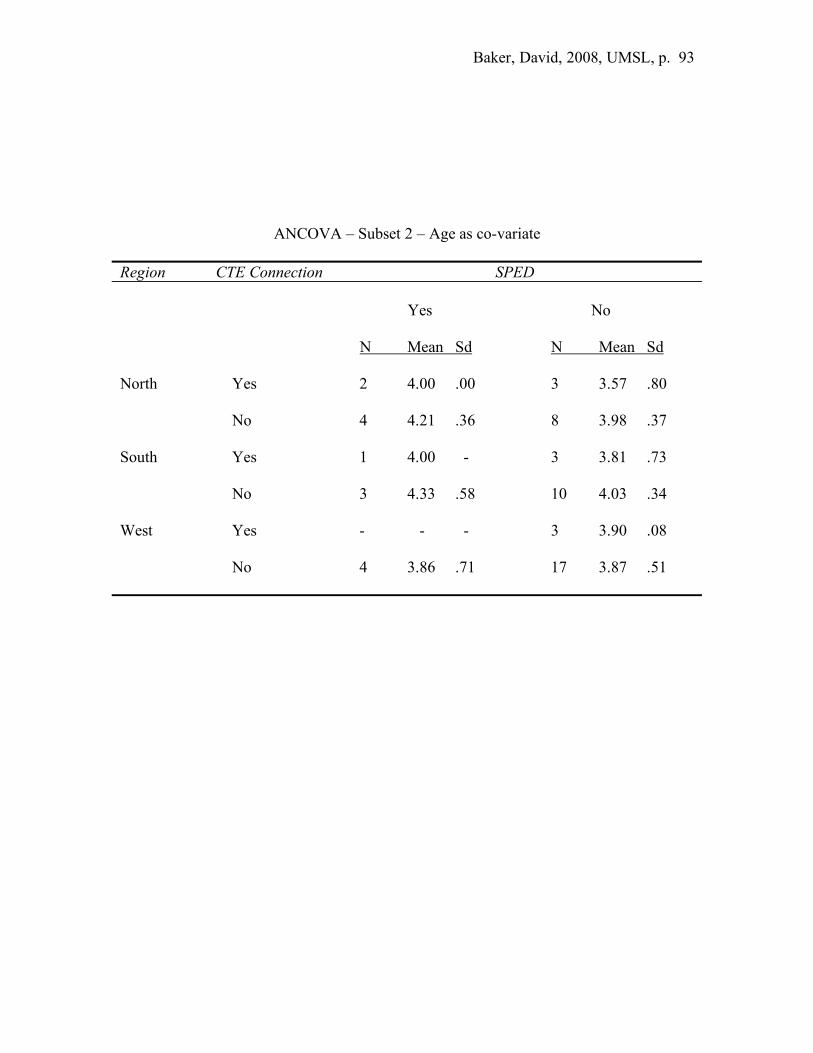
Baker, David, 2008, UMSL, p. 93
ANCOVA – Subset 2 – Age as co-variate Region CTE Connection SPED Yes No N Mean Sd N Mean Sd North Yes 2 4.00 .00 3 3.57 .80 No 4 4.21 .36 8 3.98 .37 South Yes 1 4.00 - 3 3.81 .73 No 3 4.33 .58 10 4.03 .34 West Yes - - - 3 3.90 .08 No 4 3.86 .71 17 3.87 .51
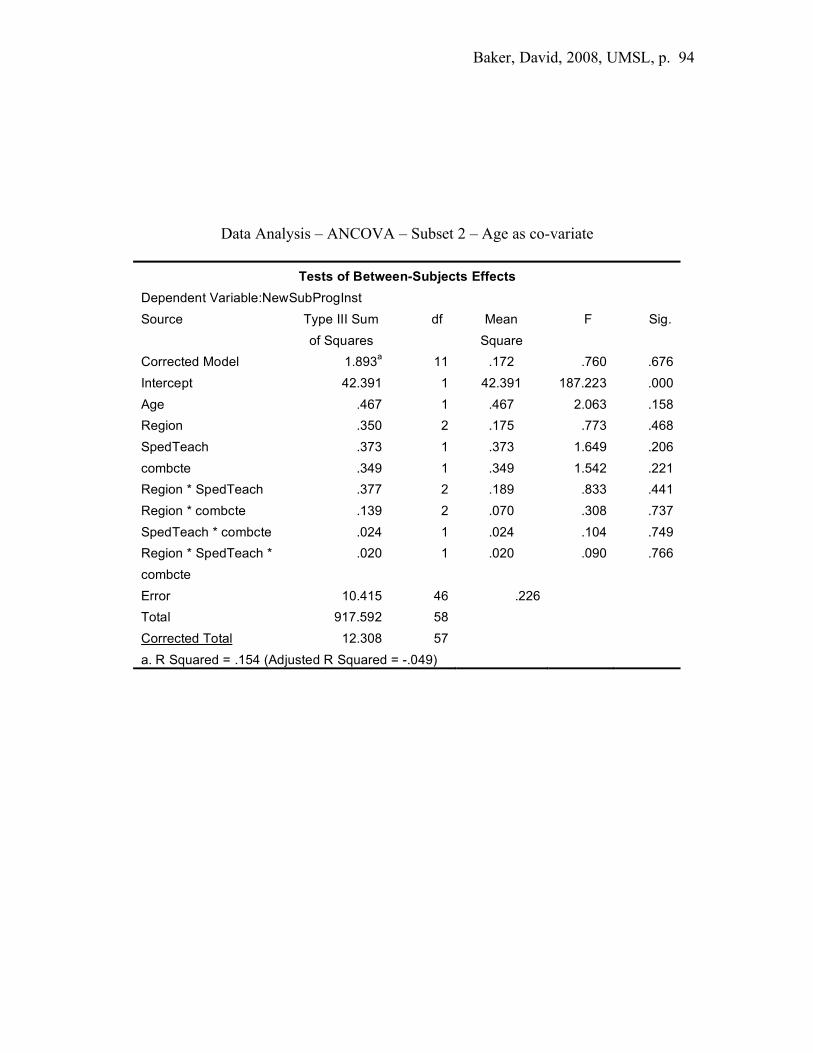
Baker, David, 2008, UMSL, p. 94
Data Analysis – ANCOVA – Subset 2 – Age as co-variate
Tests of Between-Subjects Effects Dependent Variable:NewSubProgInst
Source Type III Sum of Squares
df Mean Square
F Sig.
Corrected Model 1.893a 11 .172 .760 .676 Intercept 42.391 1 42.391 187.223 .000 Age .467 1 .467 2.063 .158 Region .350 2 .175 .773 .468 SpedTeach .373 1 .373 1.649 .206 combcte .349 1 .349 1.542 .221 Region * SpedTeach .377 2 .189 .833 .441 Region * combcte .139 2 .070 .308 .737 SpedTeach * combcte .024 1 .024 .104 .749 Region * SpedTeach * combcte
.020 1 .020 .090 .766
Error 10.415 46 .226
Total 917.592 58
Corrected Total 12.308 57
a. R Squared = .154 (Adjusted R Squared = -.049)
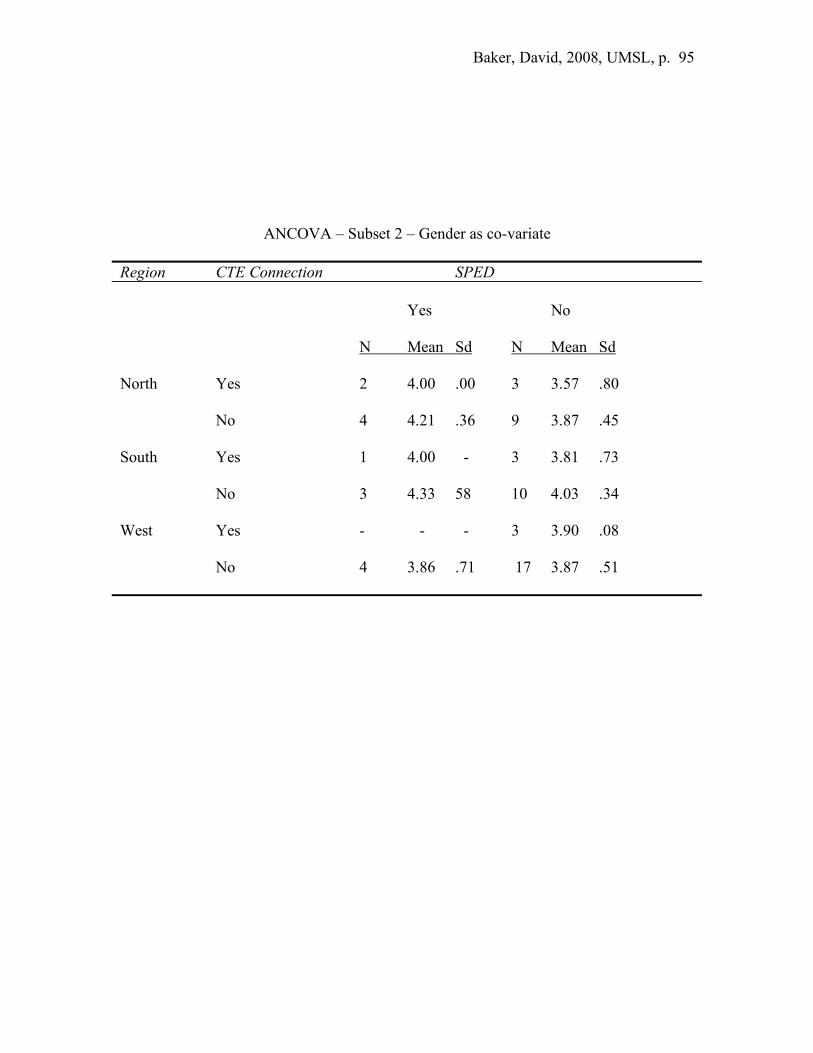
Baker, David, 2008, UMSL, p. 95
ANCOVA – Subset 2 – Gender as co-variate Region CTE Connection SPED Yes No N Mean Sd N Mean Sd North Yes 2 4.00 .00 3 3.57 .80 No 4 4.21 .36 9 3.87 .45 South Yes 1 4.00 - 3 3.81 .73 No 3 4.33 58 10 4.03 .34 West Yes - - - 3 3.90 .08 No 4 3.86 .71 17 3.87 .51

Baker, David, 2008, UMSL, p. 96
Data Analysis – ANCOVA – Subset 2 – Gender as co-variate
Tests of Between-Subjects Effects Dependent Variable:NewSubProgInst
Source Type III Sum of Squares
df Mean Square
F Sig.
Corrected Model 1.474a 11 .134 .537 .868 Intercept 36.351 1 36.351 145.743 .000 Gender .017 1 .017 .069 .793 Region .147 2 .074 .295 .746 SpedTeach .258 1 .258 1.033 .315 combcte .354 1 .354 1.418 .240 Region * SpedTeach .124 2 .062 .249 .781 Region * combcte .275 2 .137 .551 .580 SpedTeach * combcte .001 1 .001 .003 .954 Region * SpedTeach * combcte
.012 1 .012 .049 .826
Error 11.723 47 .249
Total 926.592 59
Corrected Total 13.197 58
a. R Squared = .112 (Adjusted R Squared = -.096)
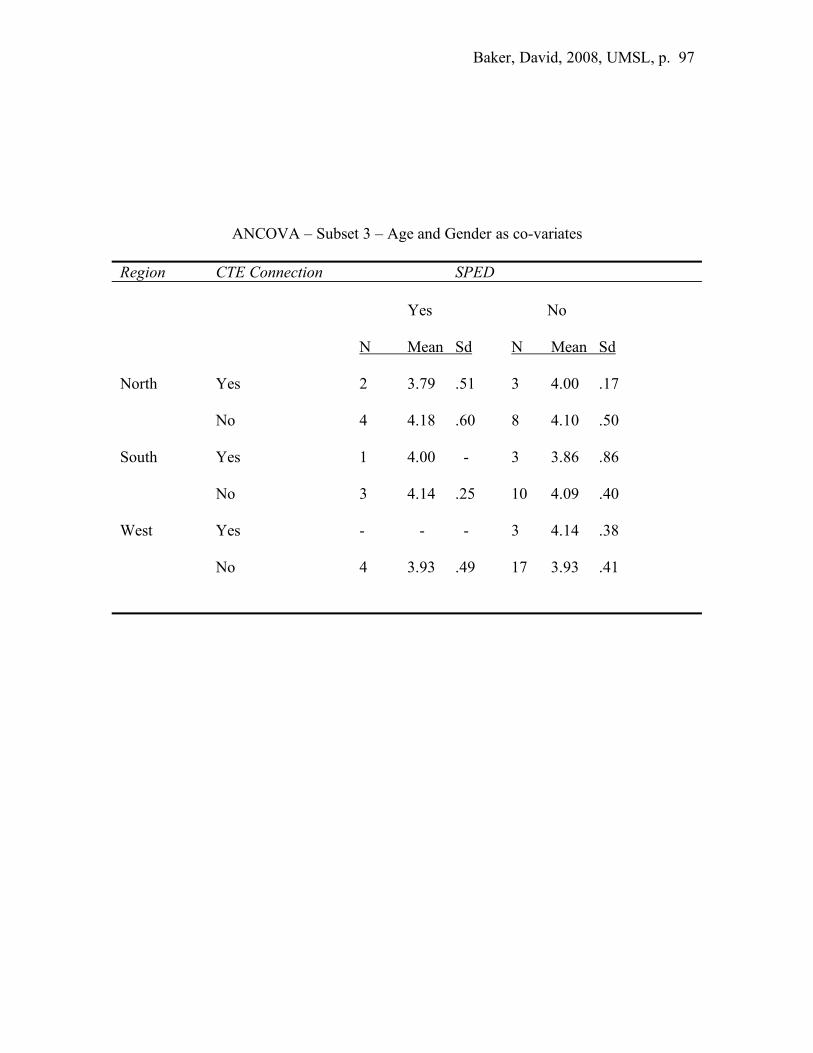
Baker, David, 2008, UMSL, p. 97
ANCOVA – Subset 3 – Age and Gender as co-variates Region CTE Connection SPED Yes No N Mean Sd N Mean Sd North Yes 2 3.79 .51 3 4.00 .17 No 4 4.18 .60 8 4.10 .50 South Yes 1 4.00 - 3 3.86 .86 No 3 4.14 .25 10 4.09 .40 West Yes - - - 3 4.14 .38 No 4 3.93 .49 17 3.93 .41
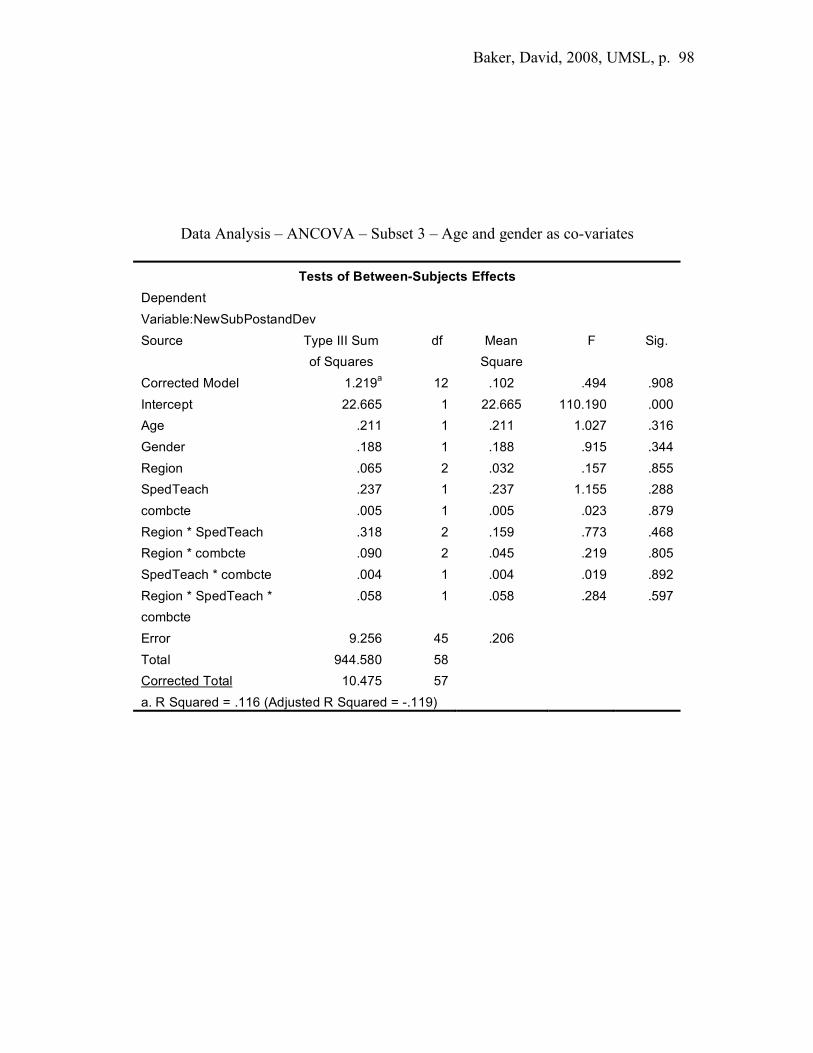
Baker, David, 2008, UMSL, p. 98
Data Analysis – ANCOVA – Subset 3 – Age and gender as co-variates
Tests of Between-Subjects Effects Dependent Variable:NewSubPostandDev
Source Type III Sum of Squares
df Mean Square
F Sig.
Corrected Model 1.219a 12 .102 .494 .908 Intercept 22.665 1 22.665 110.190 .000 Age .211 1 .211 1.027 .316 Gender .188 1 .188 .915 .344 Region .065 2 .032 .157 .855 SpedTeach .237 1 .237 1.155 .288 combcte .005 1 .005 .023 .879 Region * SpedTeach .318 2 .159 .773 .468 Region * combcte .090 2 .045 .219 .805 SpedTeach * combcte .004 1 .004 .019 .892 Region * SpedTeach * combcte
.058 1 .058 .284 .597
Error 9.256 45 .206
Total 944.580 58
Corrected Total 10.475 57
a. R Squared = .116 (Adjusted R Squared = -.119)

Baker, David, 2008, UMSL, p. 99
ANCOVA – Subset 3 – Age as co-variate Region CTE Connection SPED Yes No N Mean Sd N Mean Sd North Yes 2 3.80 .51 3 4.00 .16 No 4 4.18 .60 8 4.10 .50 South Yes 1 4.00 - 3 3.86 .86 No 3 4.14 .25 10 4.10 .40 West Yes - - - 3 4.14 .38 No 4 3.93 .49 17 3.93 .41

Baker, David, 2008, UMSL, p. 100
Data Analysis – ANCOVA – Subset 3 – Age as co-variate
Tests of Between-Subjects Effects Dependent Variable:NewSubPostandDev
Source Type III Sum of Squares
df Mean Square
F Sig.
Corrected Model 1.031a 11 .094 .456 .920 Intercept 44.293 1 44.293 215.731 .000 Age .388 1 .388 1.888 .176 Region .099 2 .050 .242 .786 SpedTeach .149 1 .149 .726 .399 combcte .005 1 .005 .025 .876 Region * SpedTeach .448 2 .224 1.091 .345 Region * combcte .089 2 .045 .217 .806 SpedTeach * combcte 8.169E-6 1 8.169E-6 .000 .995 Region * SpedTeach * combcte
.052 1 .052 .254 .617
Error 9.444 46 .205
Total 944.580 58
Corrected Total 10.475 57
a. R Squared = .098 (Adjusted R Squared = -.117)
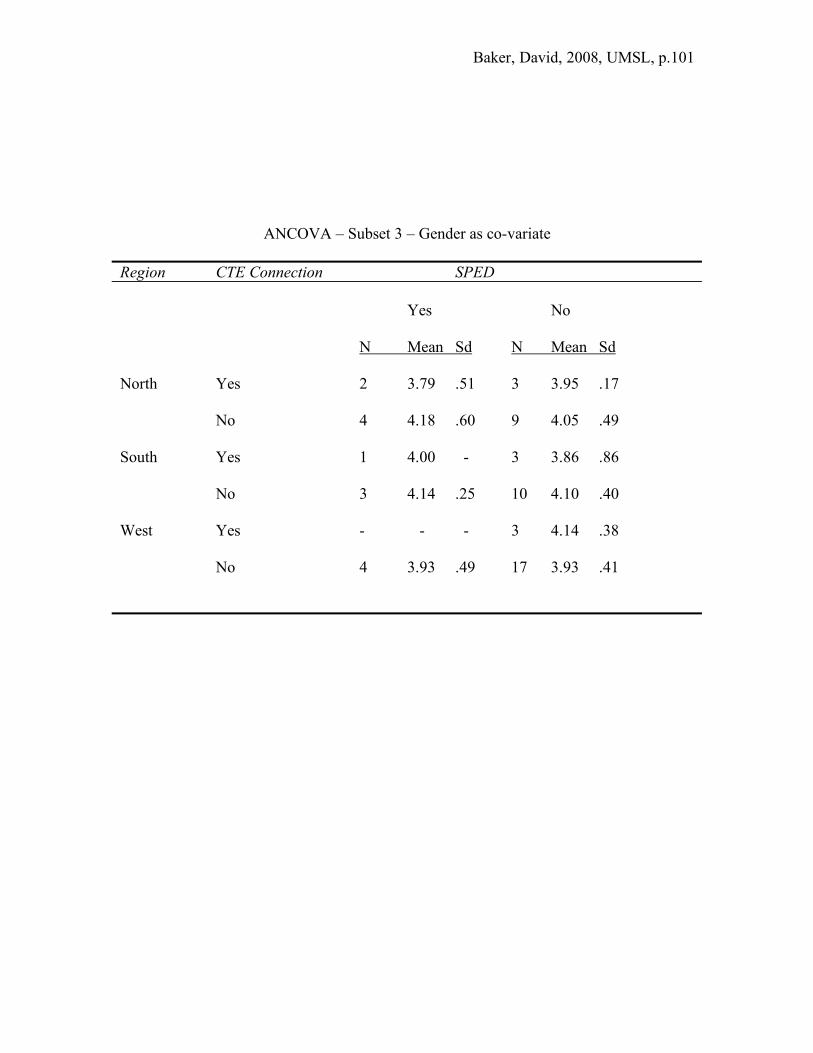
Baker, David, 2008, UMSL, p. 101
ANCOVA – Subset 3 – Gender as co-variate Region CTE Connection SPED Yes No N Mean Sd N Mean Sd North Yes 2 3.79 .51 3 3.95 .17 No 4 4.18 .60 9 4.05 .49 South Yes 1 4.00 - 3 3.86 .86 No 3 4.14 .25 10 4.10 .40 West Yes - - - 3 4.14 .38 No 4 3.93 .49 17 3.93 .41
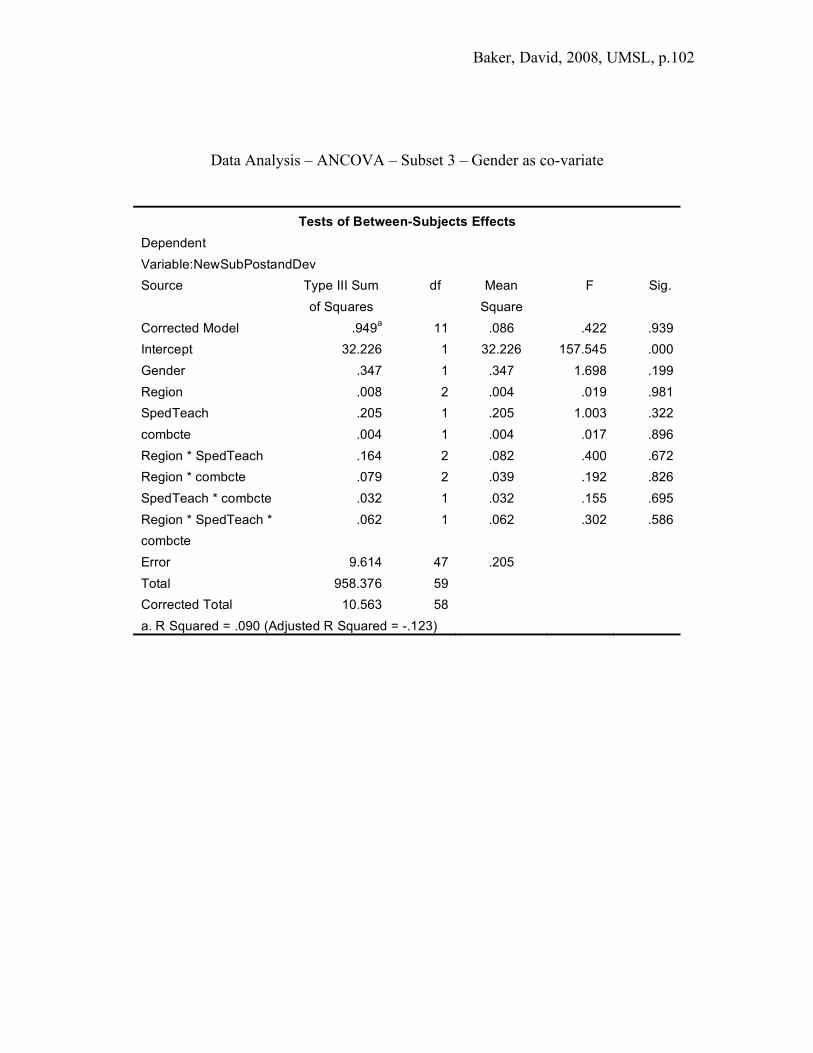
Baker, David, 2008, UMSL, p. 102
Data Analysis – ANCOVA – Subset 3 – Gender as co-variate
Tests of Between-Subjects Effects Dependent Variable:NewSubPostandDev
Source Type III Sum of Squares
df Mean Square
F Sig.
Corrected Model .949a 11 .086 .422 .939 Intercept 32.226 1 32.226 157.545 .000 Gender .347 1 .347 1.698 .199 Region .008 2 .004 .019 .981 SpedTeach .205 1 .205 1.003 .322 combcte .004 1 .004 .017 .896 Region * SpedTeach .164 2 .082 .400 .672 Region * combcte .079 2 .039 .192 .826 SpedTeach * combcte .032 1 .032 .155 .695 Region * SpedTeach * combcte
.062 1 .062 .302 .586
Error 9.614 47 .205
Total 958.376 59
Corrected Total 10.563 58
a. R Squared = .090 (Adjusted R Squared = -.123)
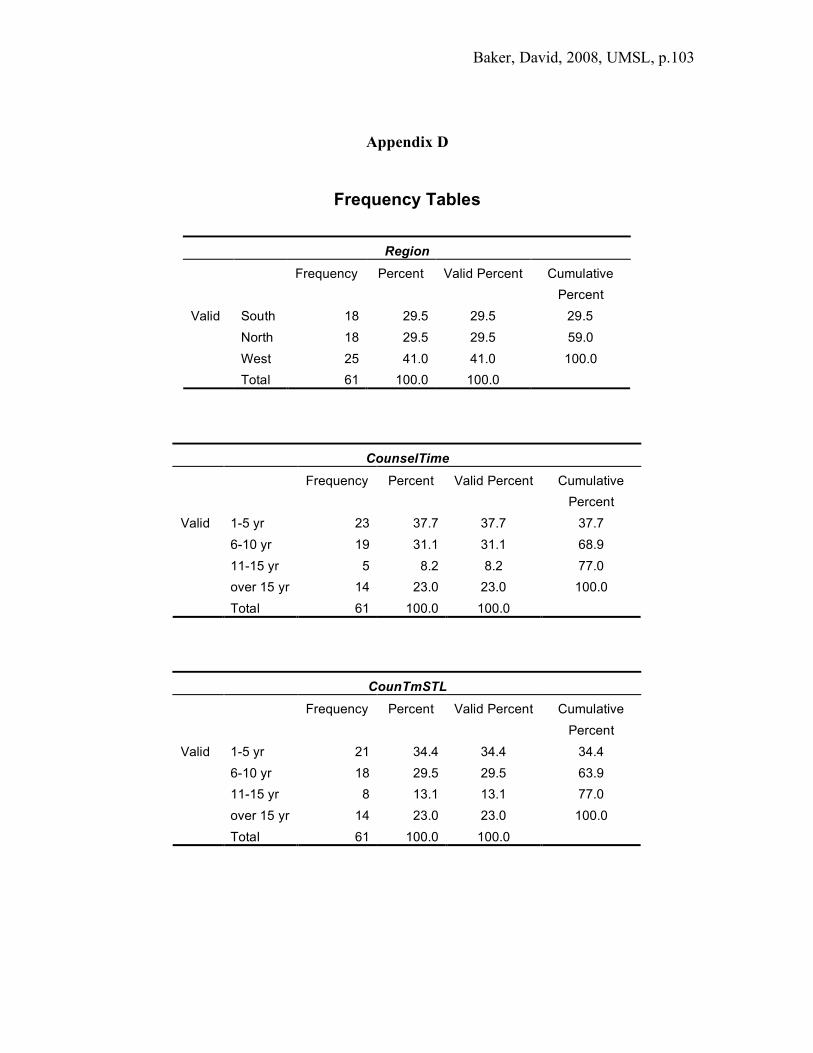
Baker, David, 2008, UMSL, p. 103
Appendix D
Frequency Tables
Region
Frequency Percent Valid Percent Cumulative Percent
South 18 29.5 29.5 29.5 North 18 29.5 29.5 59.0 West 25 41.0 41.0 100.0
Valid
Total 61 100.0 100.0
CounselTime Frequency Percent Valid Percent Cumulative
Percent 1-5 yr 23 37.7 37.7 37.7 6-10 yr 19 31.1 31.1 68.9 11-15 yr 5 8.2 8.2 77.0 over 15 yr 14 23.0 23.0 100.0
Valid
Total 61 100.0 100.0
CounTmSTL Frequency Percent Valid Percent Cumulative
Percent 1-5 yr 21 34.4 34.4 34.4 6-10 yr 18 29.5 29.5 63.9 11-15 yr 8 13.1 13.1 77.0 over 15 yr 14 23.0 23.0 100.0
Valid
Total 61 100.0 100.0
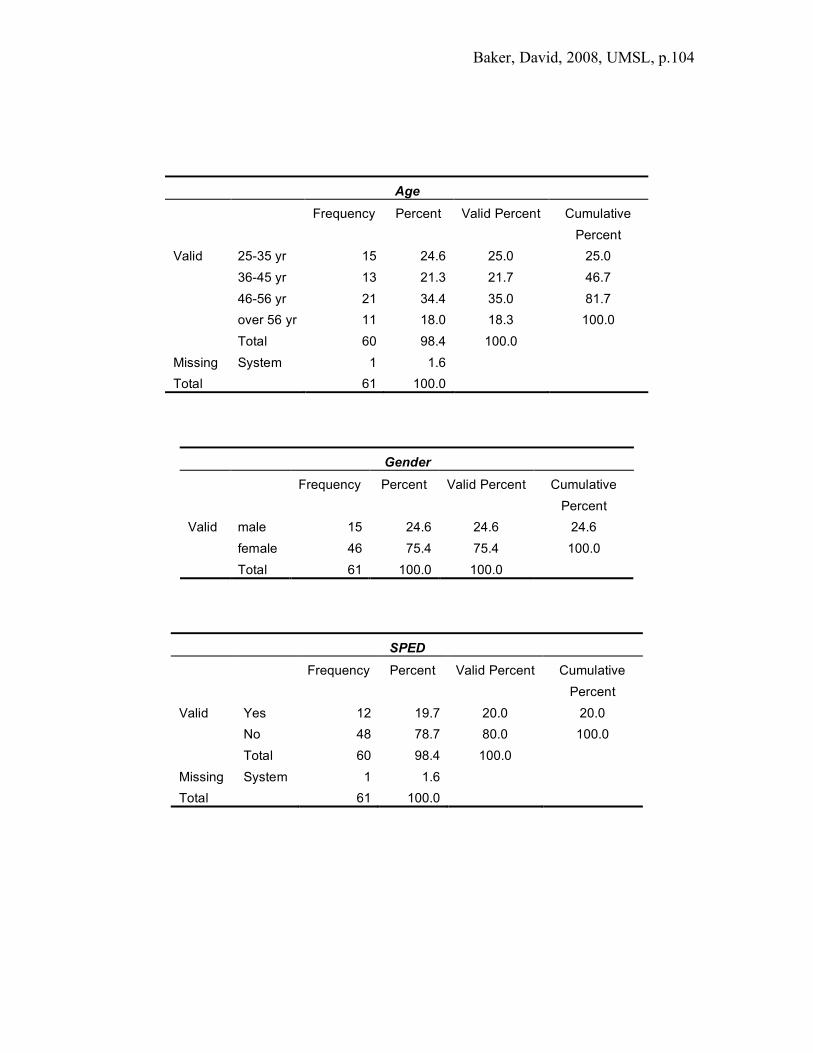
Baker, David, 2008, UMSL, p. 104
Age Frequency Percent Valid Percent Cumulative
Percent 25-35 yr 15 24.6 25.0 25.0 36-45 yr 13 21.3 21.7 46.7 46-56 yr 21 34.4 35.0 81.7 over 56 yr 11 18.0 18.3 100.0
Valid
Total 60 98.4 100.0
Missing System 1 1.6
Total 61 100.0
Gender Frequency Percent Valid Percent Cumulative
Percent male 15 24.6 24.6 24.6 female 46 75.4 75.4 100.0
Valid
Total 61 100.0 100.0
SPED Frequency Percent Valid Percent Cumulative
Percent Yes 12 19.7 20.0 20.0 No 48 78.7 80.0 100.0
Valid
Total 60 98.4 100.0
Missing System 1 1.6
Total 61 100.0

Baker, David, 2008, UMSL, p. 105
CTE Connection Frequency Percent Valid Percent Cumulative
Percent yes 14 23.0 23.3 23.3 no 46 75.4 76.7 100.0
Valid
Total 60 98.4 100.0
Missing System 1 1.6
Total 61 100.0
Visits Frequency Percent Valid Percent Cumulative
Percent 0-1 time 16 26.2 26.2 26.2 2-5 times 35 57.4 57.4 83.6 more than 5 times 10 16.4 16.4 100.0
Valid
Total 61 100.0 100.0
Item 10 Frequency Percent Valid Percent Cumulative
Percent 1 5 8.2 8.2 8.2 2 21 34.4 34.4 42.6 3 1 1.6 1.6 44.3 4 23 37.7 37.7 82.0 5 11 18.0 18.0 100.0
Valid
Total 61 100.0 100.0
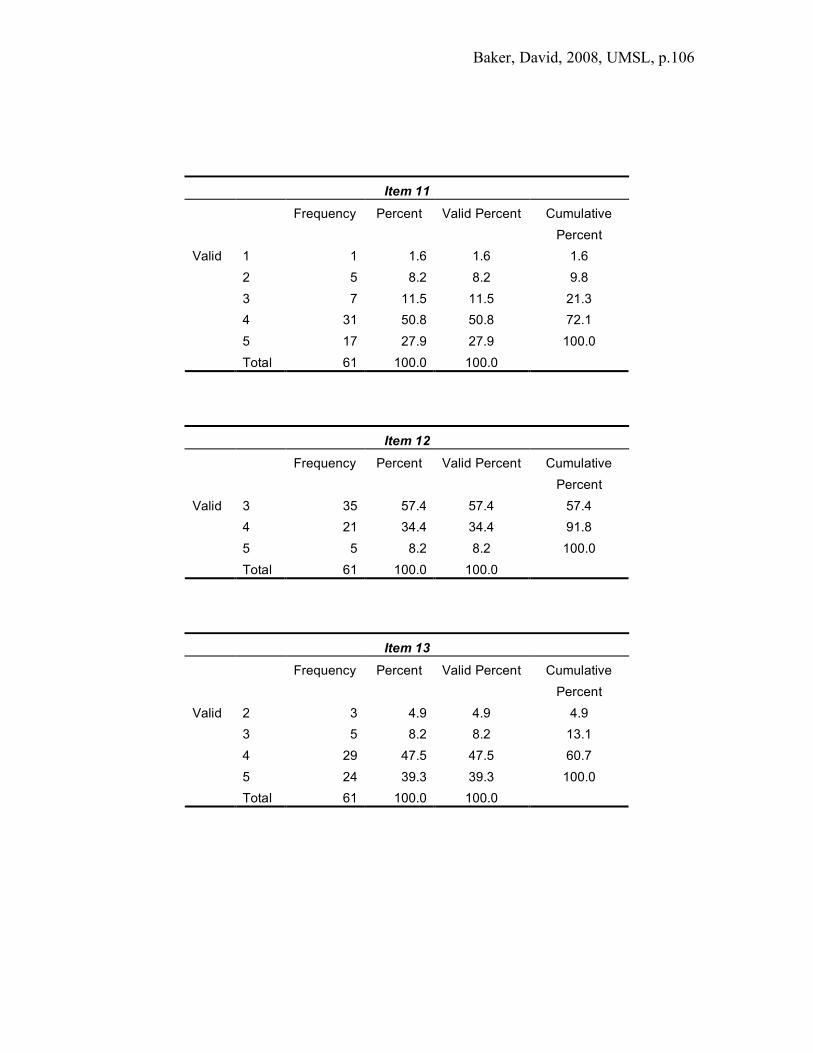
Baker, David, 2008, UMSL, p. 106
Item 11 Frequency Percent Valid Percent Cumulative
Percent 1 1 1.6 1.6 1.6 2 5 8.2 8.2 9.8 3 7 11.5 11.5 21.3 4 31 50.8 50.8 72.1 5 17 27.9 27.9 100.0
Valid
Total 61 100.0 100.0
Item 12 Frequency Percent Valid Percent Cumulative
Percent 3 35 57.4 57.4 57.4 4 21 34.4 34.4 91.8 5 5 8.2 8.2 100.0
Valid
Total 61 100.0 100.0
Item 13 Frequency Percent Valid Percent Cumulative
Percent 2 3 4.9 4.9 4.9 3 5 8.2 8.2 13.1 4 29 47.5 47.5 60.7 5 24 39.3 39.3 100.0
Valid
Total 61 100.0 100.0

Baker, David, 2008, UMSL, p. 107
Item 14 Frequency Percent Valid Percent Cumulative
Percent 1 1 1.6 1.6 1.6 2 5 8.2 8.2 9.8 3 5 8.2 8.2 18.0 4 40 65.6 65.6 83.6 5 10 16.4 16.4 100.0
Valid
Total 61 100.0 100.0
Item 15 Frequency Percent Valid Percent Cumulative
Percent 1 8 13.1 13.1 13.1 2 27 44.3 44.3 57.4 3 23 37.7 37.7 95.1 4 3 4.9 4.9 100.0
Valid
Total 61 100.0 100.0
Item 16 Frequency Percent Valid Percent Cumulative
Percent 1 5 8.2 8.2 8.2 2 21 34.4 34.4 42.6 3 4 6.6 6.6 49.2 4 24 39.3 39.3 88.5 5 7 11.5 11.5 100.0
Valid
Total 61 100.0 100.0

Baker, David, 2008, UMSL, p. 108
Item 17 Frequency Percent Valid Percent Cumulative
Percent 2 4 6.6 6.6 6.6 3 26 42.6 42.6 49.2 4 24 39.3 39.3 88.5 5 7 11.5 11.5 100.0
Valid
Total 61 100.0 100.0
Item 18 Frequency Percent Valid Percent Cumulative
Percent 2 4 6.6 6.7 6.7 3 8 13.1 13.3 20.0 4 38 62.3 63.3 83.3 5 10 16.4 16.7 100.0
Valid
Total 60 98.4 100.0
Missing System 1 1.6
Total 61 100.0
Item 19 Frequency Percent Valid Percent Cumulative
Percent 3 10 16.4 16.9 16.9 4 29 47.5 49.2 66.1 5 20 32.8 33.9 100.0
Valid
Total 59 96.7 100.0
Missing System 2 3.3
Total 61 100.0

Baker, David, 2008, UMSL, p. 109
Item 20 Frequency Percent Valid Percent Cumulative
Percent 2 1 1.6 1.6 1.6 3 7 11.5 11.5 13.1 4 32 52.5 52.5 65.6 5 21 34.4 34.4 100.0
Valid
Total 61 100.0 100.0
Item 21 Frequency Percent Valid Percent Cumulative
Percent 0 1 1.6 1.6 1.6 1 1 1.6 1.6 3.3 2 13 21.3 21.3 24.6 3 2 3.3 3.3 27.9 4 30 49.2 49.2 77.0 5 14 23.0 23.0 100.0
Valid
Total 61 100.0 100.0
Item 22 Frequency Percent Valid Percent Cumulative
Percent 2 1 1.6 1.6 1.6 3 14 23.0 23.0 24.6 4 36 59.0 59.0 83.6 5 10 16.4 16.4 100.0
Valid
Total 61 100.0 100.0
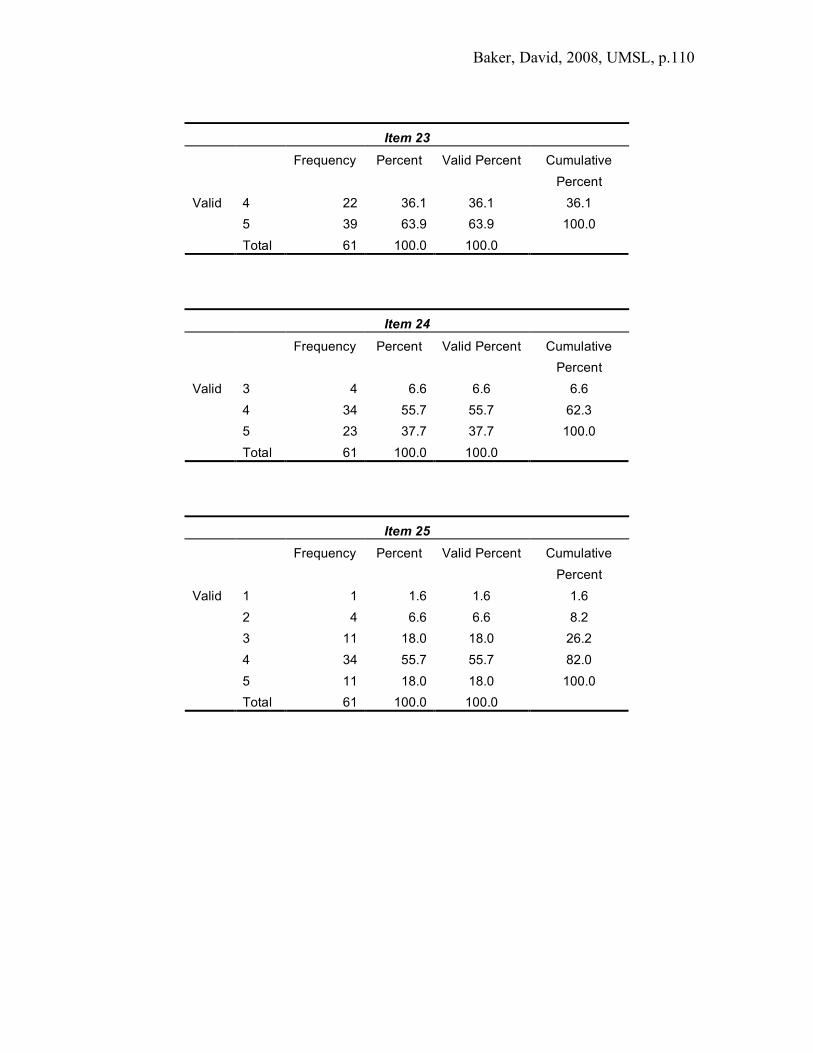
Baker, David, 2008, UMSL, p. 110
Item 23 Frequency Percent Valid Percent Cumulative
Percent 4 22 36.1 36.1 36.1 5 39 63.9 63.9 100.0
Valid
Total 61 100.0 100.0
Item 24 Frequency Percent Valid Percent Cumulative
Percent 3 4 6.6 6.6 6.6 4 34 55.7 55.7 62.3 5 23 37.7 37.7 100.0
Valid
Total 61 100.0 100.0
Item 25 Frequency Percent Valid Percent Cumulative
Percent 1 1 1.6 1.6 1.6 2 4 6.6 6.6 8.2 3 11 18.0 18.0 26.2 4 34 55.7 55.7 82.0 5 11 18.0 18.0 100.0
Valid
Total 61 100.0 100.0

Baker, David, 2008, UMSL, p. 111
Item 26 Frequency Percent Valid Percent Cumulative
Percent 1 1 1.6 1.6 1.6 2 5 8.2 8.2 9.8 3 5 8.2 8.2 18.0 4 28 45.9 45.9 63.9 5 22 36.1 36.1 100.0
Valid
Total 61 100.0 100.0
Item 27 Frequency Percent Valid Percent Cumulative
Percent 2 6 9.8 10.0 10.0 3 20 32.8 33.3 43.3 4 26 42.6 43.3 86.7 5 8 13.1 13.3 100.0
Valid
Total 60 98.4 100.0
Missing System 1 1.6
Total 61 100.0
Item 28 Frequency Percent Valid Percent Cumulative
Percent 1 3 4.9 4.9 4.9 2 29 47.5 47.5 52.5 3 8 13.1 13.1 65.6 4 14 23.0 23.0 88.5 5 7 11.5 11.5 100.0
Valid
Total 61 100.0 100.0

Baker, David, 2008, UMSL, p. 112
Item 29 Frequency Percent Valid Percent Cumulative
Percent 1 4 6.6 6.6 6.6 2 20 32.8 32.8 39.3 3 8 13.1 13.1 52.5 4 19 31.1 31.1 83.6 5 10 16.4 16.4 100.0
Valid
Total 61 100.0 100.0
Item 30 Frequency Percent Valid Percent Cumulative
Percent 1 8 13.1 13.1 13.1 2 23 37.7 37.7 50.8 3 14 23.0 23.0 73.8 4 13 21.3 21.3 95.1 5 3 4.9 4.9 100.0
Valid
Total 61 100.0 100.0
Item 31 Frequency Percent Valid Percent Cumulative
Percent 2 8 13.1 13.3 13.3 3 12 19.7 20.0 33.3 4 32 52.5 53.3 86.7 5 8 13.1 13.3 100.0
Valid
Total 60 98.4 100.0
Missing System 1 1.6
Total 61 100.0
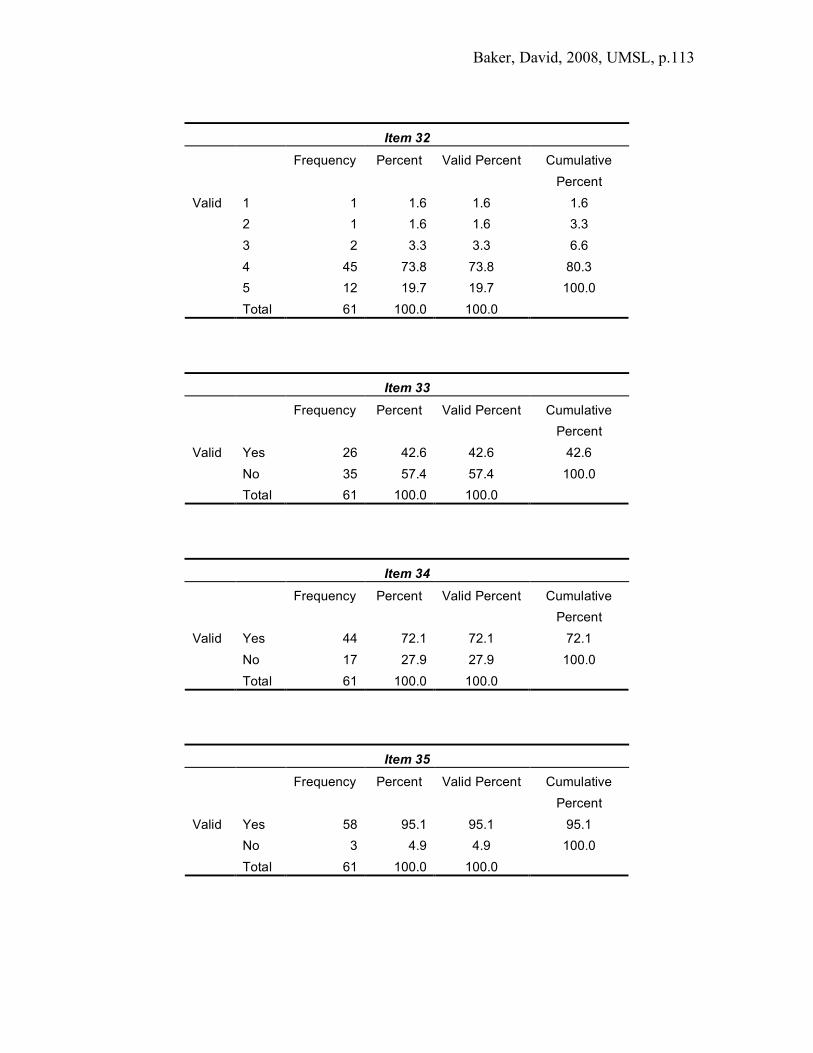
Baker, David, 2008, UMSL, p. 113
Item 32 Frequency Percent Valid Percent Cumulative
Percent 1 1 1.6 1.6 1.6 2 1 1.6 1.6 3.3 3 2 3.3 3.3 6.6 4 45 73.8 73.8 80.3 5 12 19.7 19.7 100.0
Valid
Total 61 100.0 100.0
Item 33 Frequency Percent Valid Percent Cumulative
Percent Yes 26 42.6 42.6 42.6 No 35 57.4 57.4 100.0
Valid
Total 61 100.0 100.0
Item 34 Frequency Percent Valid Percent Cumulative
Percent Yes 44 72.1 72.1 72.1 No 17 27.9 27.9 100.0
Valid
Total 61 100.0 100.0
Item 35 Frequency Percent Valid Percent Cumulative
Percent Yes 58 95.1 95.1 95.1 No 3 4.9 4.9 100.0
Valid
Total 61 100.0 100.0

Baker, David, 2008, UMSL, p. 114
Appendix E
Due to extended travel time and the increased number of credits required to graduate, many of our kids cannot participate in the tech school programs because they lose one credit each year. The program offerings are an invaluable resource that I wish more kids could access. I am very concerned with the ability of my students to attend the tech schools because it is near impossible to earn 24 credits in four years and participate in the tech programs. I have 5 students interested in attending their sophomore year but have advised them to wait until their junior year because of this reason. This credit situation must be rectified or there will be no students attending from Clayton High School. I support and believe the programs and benefits of attending the tech schools is amazing and regret the fact that so few of my students will be able to attend. I think the tech school counselor assigned to our school should have regular hours at each home school -- say, for 1.5 hours every three weeks -- to answer questions for current or prospective students, parents, teachers, etc.. I am a long advocate of voc. education and former com. college adm. in the area of voc. ed. I want more for N and S County Tech but their "old" politics get in the way of success. In addition, everyone wants to attract the best and the brightest these days. There is a large population of underachieving kids that need to be served and a program tied to sending high schools would serve us all well. N. and S Co Tech need to understand that the new state wide graduation req. limit their time with students. Sophomore year is no longer viable and some 1 year programs would be very desirable. The perception from my students is that the vocational aspect of tech is exemplary, but the academic focus is somewhat deficient. One of the questions said that tech is an alternative for non-college bound students. I do agree, but there was no where to indicate that I also believe it is an alternative for college bound students as well. Our entire educational system needs to put much more emphasis and funding into technical and career ed. programs rather than the "one-size-fits-all" approach we currently fail at. I am a very strong supporter of career and technical education. The tech schools have undergone a major positive shift in focus and quality over the past 25 years. Keep up the good work! Transportation is always an issue--as well as different spring break and final exam days. First, I am a fan; I worked at West Tech when with SSD. There are several problems: you can not and do not accept anywhere near the # of students who both qualify and would benefit from your programs. What is the point of promoting them when you turn so many students down; kids attending tech part time are indeed limited in the elective
Baker, David, 2008, UMSL, p. 115
and advanced courses they can take here due to time/schedule limitations. For example, they can not fit foreign language into their day; for you to pretend otherwise is disingenuous. Finally, you are not appropriate for kids in honors and AP classes - if you begin targeting them to make your own numbers and data look great, you do a grave dis-service to the kids who truly need your program for career preparation. While I understand that students can attend college coming through your program, you need to be either a technical preparation high school or a college prep program. The need for the first is great; we already provide the latter. Focus on what you really do and do it well.
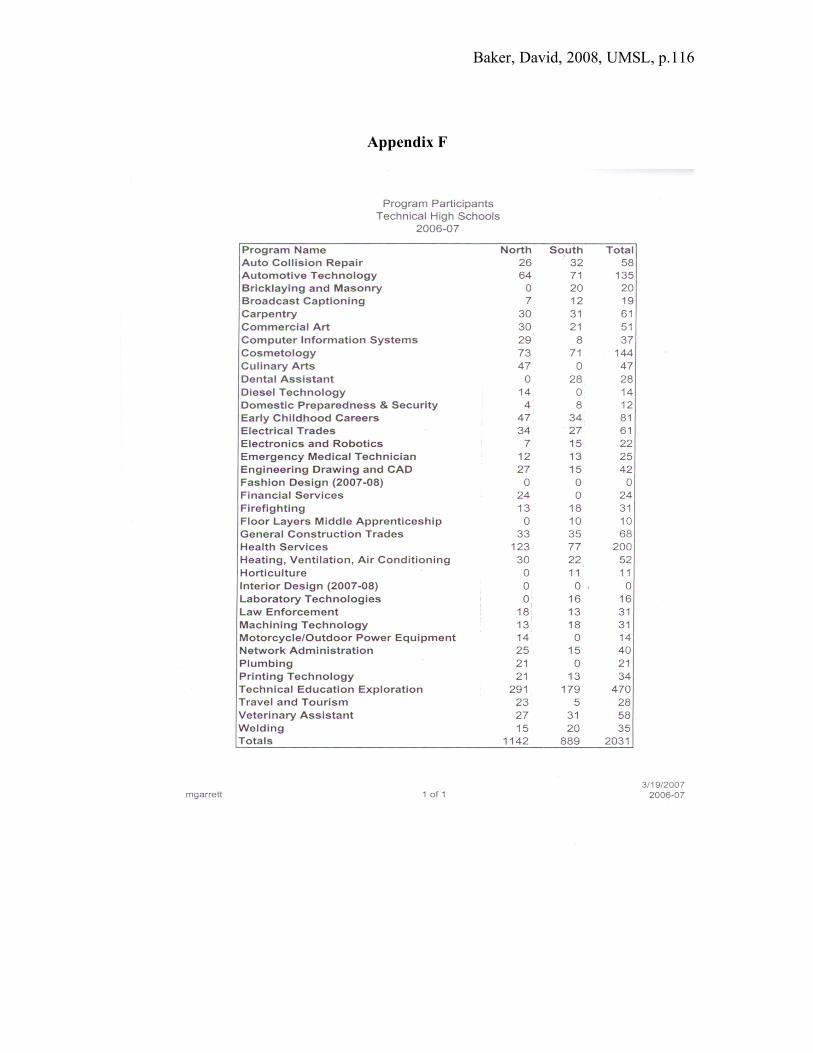
Baker, David, 2008, UMSL, p. 116
Appendix F