Embed Size (px)
Citation preview

i
An investigation into Relationship
Marketing in South African Family
Businesses
Rolland Eboru
A research report submitted to the faculty of Business Administration, University of the Witwatersrand, Johannesburg, in partial fulfilment of the requirements for the degree in Master in Management of Strategic Marketing.
February 2014

ii
Abstract
According to the Department of Trade and Industry (DTI) (2004), it is estimated
that there is a total of 1.42 million active businesses in South Africa, 84 per cent of
which are classified as “family business”. Internationally, family businesses
account for 70 per cent of all international businesses and 35 per cent of Fortune
500 companies (Balshaw, 2004). Despite their economic importance, family
businesses still find marketing to be a challenge.
Relationships are at the heart of family businesses (Petzinger, 1999; Cooper,
Upton and Seaman, 2005). This is because the fundamental DNA
(Deoxyribonucleic Acid) a family business is based on a symbiotic relationship
between the family and the business. Families, by virtue of their DNA, cultivate
deep relationships with people, which include customers, suppliers and even
competitors. Hence, in a family business context, these values are transferred into
the business by the associated family. This relational approach is often utilised in
the marketing strategies that they adopt. This study investigates some of the
characteristics of relationship marketing that exist in South African family
businesses.
The results from the family businesses surveyed, indicates that they cultivate
deep relationship with customers. This characteristic enables these businesses to
be highly proficient at both satisfying and retaining customers. However, despite a
culture of customer centricity, further findings indicate that such businesses are
less proficient regarding their orientation with competitors, as they are often slow
to respond to competition, in the market place.
Lastly, the study indicates that family businesses cultivate and maintain a healthy
relationship with employees; as such relationships is a prerequisite for customer
satisfaction.
Keywords: Family Business, Relationship Marketing, Market Orientation,
Development Cycle.

iii
DECLARATION
I, Rolland Eboru, declare that this research report is my own work, except as
indicated in the references and acknowledgements. It is submitted in partial
fulfilment if the requirements for the degree of Master of Management in Strategic
Marketing at the University of the Witwatersrand, Johannesburg. It has not been
submitted before for any degree or examination in this or any other university.
.................................
Rolland Eboru
February 2014

iv
ACKNOWLEDGEMENTS
Thanks to Yvonne Sani, my supervisor, for her wise guidance and commitment to
this research.
I would also like to thank the family business owners that I interviewed for giving
me the opportunity to interview them and for sharing their insights regarding the
topic. Particularly, I would like to give special thanks to the Directors of
FredFootwear.co.za for largely supporting this research, as without them the
research would not have been possible.
Lastly and most importantly, I would like to thank God, for giving me the desire
and support to complete the course.

v
TABLE OF CONTENTS
1 INTRODUCTION........................................................................ 1
1.1 PURPOSE OF THE STUDY ................................................................................... 1
1.2 CONTEXT OF THE STUDY.................................................................................... 1
1.3 PROBLEM STATEMENT ....................................................................................... 3
1.4 SIGNIFICANCE OF THE STUDY ............................................................................. 4
1.5 DELIMITATIONS OF THE STUDY ........................................................................... 4
1.6 DEFINITION OF TERMS ....................................................................................... 5
1.7 ASSUMPTIONS .................................................................................................. 6
1.8 STRUCTURE OF STUDY ...................................................................................... 6
2 LITERATURE REVIEW ............................................................. 8
2.1 INTRODUCTION ................................................................................................. 8
2.2 CONCEPTUAL MODELS OF FAMILY BUSINESS ...................................................... 8
2.3 MARKET ORIENTATION IN FAMILY BUSINESS ..................................................... 12
2.4 STAGES OF MARKETING DEVELOPMENT IN FAMILY BUSINESS ............................. 14
2.5 RELATIONSHIP MARKETING .............................................................................. 18 2.5.1 CUSTOMER RETENTION ............................................................................................. 21 2.5.2 CUSTOMER SATISFACTION ........................................................................................ 22 2.5.3 EMPLOYEE RELATIONSHIP ......................................................................................... 23
2.6 RELATIONSHIP MARKETING IN FAMILY BUSINESS ............................................... 24
2.7 SUMMARY ...................................................................................................... 26
2.8 SUMMARY OF RESEARCH PROPOSITIONS .......................................................... 27 2.8.1 PROPOSITION ONE: SOUTH AFRICAN FAMILY BUSINESSES HAVE A LOW MARKET
ORIENTATION ........................................................................................................................ 27 2.8.2 PROPOSITION TWO: SOUTH AFRICAN FAMILY BUSINESSES HAVE A HIGH CUSTOMER
RETENTION RATE ................................................................................................................... 27 2.8.3 PROPOSITION THREE: SOUTH AFRICAN FAMILY BUSINESSES HAVE A HIGH CUSTOMER
SATISFACTION LEVELS ........................................................................................................... 28 2.8.4 PROPOSITION FOUR: SOUTH AFRICAN FAMILY BUSINESSES HAVE GOOD EMPLOYEE
RELATIONS ............................................................................................................................ 28
3 RESEARCH METHODOLOGY ................................................ 29
3.1 QUALITATIVE RESEARCH ................................................................................. 29
3.2 DESCRIPTIVE RESEARCH DESIGN .................................................................... 29
3.3 POPULATION AND SAMPLE ............................................................................... 33
3.4 DATA COLLECTION .......................................................................................... 34
3.5 DATA ANALYSIS .............................................................................................. 35
3.6 VALIDITY AND RELIABILITY ............................................................................... 37 3.6.1 VALIDITY .................................................................................................................. 38 3.6.2 RELIABILITY .............................................................................................................. 38 3.6.3 PRACTICALITY ........................................................................................................... 39

vi
3.7 SUMMARY ...................................................................................................... 39
4 PRESENTATION OF RESULTS .............................................. 40
4.1 INTRODUCTION ............................................................................................... 40
4.2 SAMPLE DESCRIPTION .................................................................................... 40
4.3 KEY RESEARCH THEMES ................................................................................. 46
4.4 SUMMARY ...................................................................................................... 60
5 ANALYSIS OF RESULTS ....................................................... 61
5.1 INTRODUCTION ............................................................................................... 61
5.2 PERCEPTION OF MARKETING ........................................................................... 61
5.3 PERCEPTION OF RELATIONSHIP MARKETING ..................................................... 62
5.4 VALIDATION OF PROPOSITIONS ........................................................................ 63 5.4.1 PROPOSITION ONE: MARKET ORIENTATION ................................................................ 63 5.4.2 PROPOSITION TWO: CUSTOMER RETENTION .............................................................. 65 5.4.3 PROPOSITION THREE: CUSTOMER SATISFACTION ....................................................... 68 5.4.4 PROPOSITION FOUR: EMPLOYEE RELATIONS .............................................................. 71
5.5 OTHER FINDINGS OF RELATIONSHIP MARKETING ............................................... 74
5.6 SUMMARY ...................................................................................................... 74
6 CONCLUSION AND RECOMMENDATIONS .......................... 76
6.1 INTRODUCTION ............................................................................................... 76
6.2 STRENGTH OF SUPPORT FOR PROPOSITION ONE: SOUTH AFRICAN FAMILY
BUSINESSES HAVE A LOW MARKET ORIENTATION ................................................ 76
6.3 STRENGTH OF SUPPORT FOR PROPOSITION TWO: SOUTH AFRICAN FAMILY
BUSINESS HAVE A HIGH RETENTION OF THEIR CUSTOMERS .................................. 77
6.4 STRENGTH OF SUPPORT FOR PROPOSITION THREE: SOUTH AFRICAN FAMILY
BUSINESSES HAVE A HIGH CUSTOMER SATISFACTION LEVELS .............................. 78
6.5 STRENGTH OF SUPPORT FOR PROPOSITION FOUR: SOUTH AFRICAN FAMILY
BUSINESS HAVE A GOOD EMPLOYEE RELATIONS ................................................. 78
6.6 RECOMMENDATIONS TO MANAGEMENT ............................................................. 79
6.7 SUGGESTIONS FOR FURTHER RESEARCH ......................................................... 80
vii
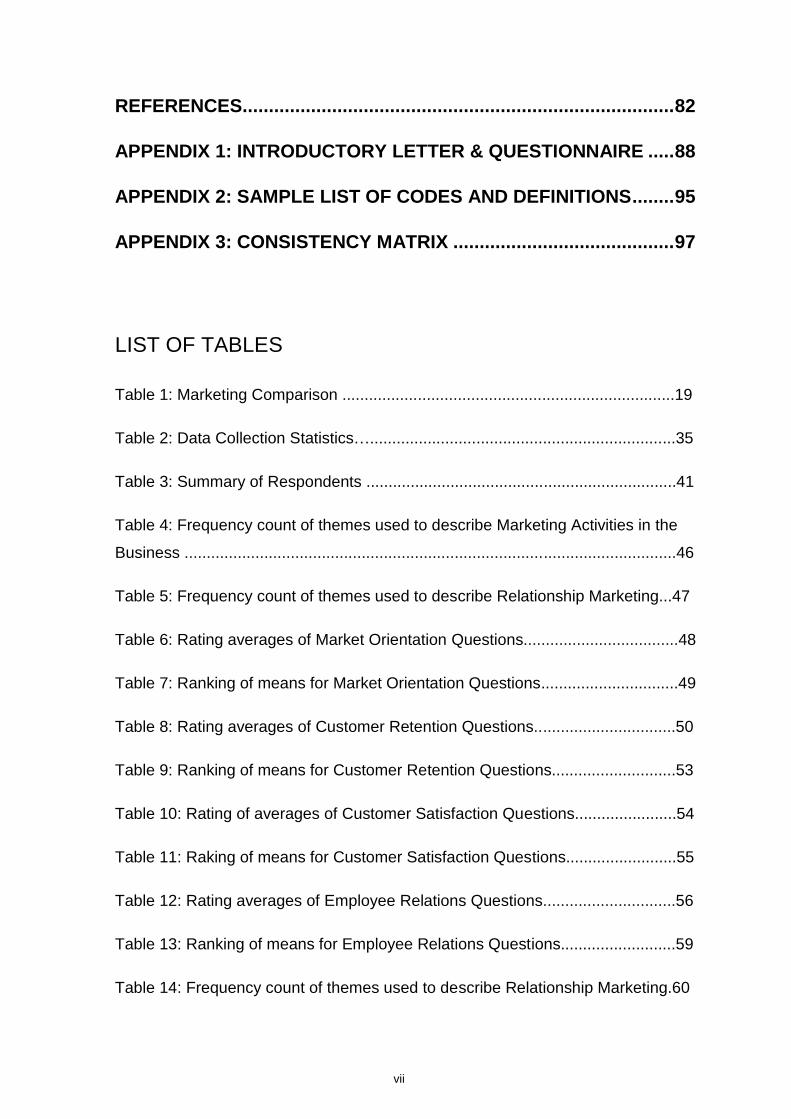
REFERENCES .................................................................................. 82
APPENDIX 1: INTRODUCTORY LETTER & QUESTIONNAIRE ..... 88
APPENDIX 2: SAMPLE LIST OF CODES AND DEFINITIONS ........ 95
APPENDIX 3: CONSISTENCY MATRIX .......................................... 97
LIST OF TABLES
Table 1: Marketing Comparison ...........................................................................19
Table 2: Data Collection Statistics….....................................................................35
Table 3: Summary of Respondents ......................................................................41
Table 4: Frequency count of themes used to describe Marketing Activities in the
Business ...............................................................................................................46
Table 5: Frequency count of themes used to describe Relationship Marketing...47
Table 6: Rating averages of Market Orientation Questions...................................48
Table 7: Ranking of means for Market Orientation Questions...............................49
Table 8: Rating averages of Customer Retention Questions................................50
Table 9: Ranking of means for Customer Retention Questions............................53
Table 10: Rating of averages of Customer Satisfaction Questions.......................54
Table 11: Raking of means for Customer Satisfaction Questions.........................55
Table 12: Rating averages of Employee Relations Questions..............................56
Table 13: Ranking of means for Employee Relations Questions..........................59
Table 14: Frequency count of themes used to describe Relationship Marketing.60

viii
LIST OF FIGURES
Figure 1: The dual identity Family Business model................................................9
Figure 2: Development Model...............................................................................10
Figure 3: Relationship Exchange...........................................................................21
Figure 4: The generational stage of Family Business respondents.......................43
Figure 5: The roles of respondents in the surveyed business...............................44
Figure 6: Analysis of turnover of business surveyed.............................................45
Figure 7: Industry analysis of respondents............................................................46
Figure 8: The managerial time spent discuss and making decisions about
customer relationships, in meeting........................................................................52
Figure 9: The frequency of communication to all employees................................58

1
1 INTRODUCTION
1.1 Purpose of the study
Literature has detailed that marketing practices are critical to the success of a business
(Kotler, Keller, Brady, Goodman and Hansen, 2009; Baker and Saren, 2010; Ward,
1997; Drucker, 2001). It has been proposed that family businesses adopt relationship
marketing techniques, in their marketing strategy. The purpose of this study is to
investigate some of the characteristics of relationship marketing that exist in South
African family businesses.
1.2 Context of the study
Christopher, Payne and Ballantyne (2001) define relationship marketing as the type of
marketing that focuses on building long-term relationships with customers, individually.
According to Blomqvist, Dahl and Haeger (1993), some of the key characteristics of
relationship marketing include:
Individualisation of customers, by treating each customer as an individual;
Customer retention, with a view to building long term relationships with customers
through a process of interaction and communication. Several studies have proven
that a higher retention of customers leads to higher profitability (Ang and Butte, 2006;
Hansemark and Albinsson, 2004);
Customer satisfaction, through the provision of high quality service and products that
create value for the customer. Whilst good selling to customers is necessary to be
profitable, good service is necessary to retain those relationships.
Fostering long-term relationships with employees, who in turn maintain and manage
relationships with customers.
Kotler et al (2009) expand on the definition of relationship marketing, by stating that it is
also about building long-term relationships with key stakeholders, not just customers.
This is achieved through a process of mutually beneficial exchanges and the fulfilment of
promises by parties in the relationship. Both the exchange and fulfilment occur over the
lifetime of the relationship, on the basis of trust (Grönroos, 1994). Hence, both trust and

2
commitment concepts are important principles of relationship marketing. Morgan and
Hunt (1994) define trust as the confidence of one party to rely on the other partner’s
reliability and integrity, while, commitment is defined as an enduring desire to maintain a
valued relationship with a partner. Morgan and Hunt (1994) further state that both of
these factors are key, for the following reasons:
Firstly, they encourage marketers to work at preserving the relationship, by
cooperating with the exchange partner;
Secondly, they encourage marketers to adopt a more long-term relational approach,
with the exchange partner; and
Thirdly, they encourage marketers to be prudent in their decisions regarding the
exchange partner, as this is reciprocated by the partner.
It is for these reasons that more businesses are migrating away from the traditional style
of marketing that focuses on fulfilling a transaction towards adopting a more relational
approach, in their marketing. One of such segment of businesses is family businesses.
According to the Department of Trade and Industry (DTI) (2004), it is estimated that there
is a total of 1.42 million active businesses in South Africa, 84 per cent of which are
classified as “family business”. Internationally, family businesses account for 70 per cent
of all international businesses and 35 per cent of Fortune 500 companies (Balshaw,
2004). Despite their economic importance, family businesses still find marketing to be a
challenge.
Bork (1993) defines a family business as a privately owned business, where the
shareholders are related to each other. The shareholders are often descendants of the
original founders, as the business has been passed to succeeding generations of the
family. These family members not only own and benefit from the business, they also
participate in its management. Furthermore, family members are defined as anyone
related to the family, by birth or marriage, or related to the officers of the business (Bork,
1993). Hence, many family businesses are small, private and generational (Ward, 1997).
Relationships are at the heart of family businesses (Petzinger, 1999; Cooper, Upton and
Seaman, 2005). This is because the fundamental DNA of a family business is based on
a symbiotic relationship between the family and the business. This argument is
supported by Tokarczyk, Hansen, Green and Down (2007), who found empirical

3
evidence that further supports customer orientation as a major theme amongst family
businesses. Families, by virtue of their DNA, cultivate deep relationships with people,
who include customers, suppliers and even competitors. Hence, in a family business
context, these values are transferred into business by the associated family. This results
in a close dialogue with customers in particular, which often affords such businesses the
opportunity to assess and better understands their needs. This relational attribute is
further augmented by the generational nature of the business, as the business is able to
maintain relationships across multiple generations (Zachary et al., 2011). Collectively,
these factors create a formidable advantage for family businesses that supports their
survival in the marketplace (Dyer, 2001).
Furthermore, family businesses strive to achieve a high level of satisfaction amongst
their customers, as poor customer satisfaction adversely affects the family’s reputation.
In a family business; the reputation of the family and the business are intertwined
(Copper et al., 2005). Hence there is a greater sensitivity amongst the family to maintain
the integrity of their name. This often motivates the family to strive for high customer
service in the business (Ward, 1988) and in so doing the business develops a good
reputation of service delivery amongst its customers. This, in turn, further fosters a
deeper relationship with customers and other stakeholders, in the value chain.
1.3 Problem statement
Despite the economic importance of family businesses, there is insufficient information
on the marketing techniques adopted by such businesses (Reuber and Fischer, 2011).
Furthermore, the availability of information is even worse for South African family
businesses.
This study aims to contribute to the limited information by investigating some of the
characteristics of relationship marketing that exist in family businesses. The investigation
involves assessing the following factors:
The level of customer retention
The level of customer satisfaction
The employee relationship with the business.

4
1.4 Significance of the study
It is estimated that South Africa has a population of 44.6 million people and an
unemployment rate of approximately 35 per cent (DTI, 2004). Since family businesses
represent 84 per cent of active businesses in South Africa, they employ a significant
majority of the South African labour force.
The following are some of the significant reasons for obtaining an in-depth understanding
on how family businesses implement relationship marketing:
It will assist Government and other agencies in creating appropriate marketing
solutions for family businesses.
Furthermore, it will assist families with family businesses to better understand how
marketing contributes to the success of the business.
Lastly, it will contribute towards the limited literature that currently exists on marketing
practices adopted by family businesses.
1.5 Delimitations of the study
The scope of the study is limited to identifying the characteristics of relationship
marketing that exist in South African family businesses and in so doing contribute
towards the limited literature on the marketing techniques adopted by such businesses.
The sample for this study is purposive. Surveyed respondents were selected based on
their experience and their ability to appropriately answer the research questions.
Furthermore, surveyed family businesses meet the following criteria:
Medium-sized businesses with an annual turnover of between R6 million and R100
million. The DTI (2004) defines medium-size businesses according to this turnover
criterion;
Businesses where more than 50 per cent of the voting shares are owned by a family;
Businesses which are currently owned or managed by at least the second-
generation family members; and

5
The questionnaire was completed by CEOs and senior executives.
The rationale for delimiting the surveyed family businesses to the above criteria is as
follows:
It is assumed that CEOs and executives alike make the strategic decisions regarding
marketing. Hence, they are in a better position to assess the extent to which
relationship marketing techniques are adopted in the business.
For a company to be family-owned, a family needs to own a least 51 per cent of the
equity interest in the company. This study adopted this definition when selecting
appropriate businesses to be surveyed.
Businesses which are currently owned or managed by at least the second-
generation family members were predominately included in the study.
This study is delimited toward identifying the characteristics of relationship marketing that
exist in South African family businesses. No attempt was made to ascertain whether
there is any relationship between these factors.
1.6 Definition of terms
There are several definitions of family businesses in literature; these definitions revolve
around two main factors: ownership and management.
According to Friedman (1998), a family business is a company that is owned,
controlled and operated by the members of one or several families; this can include
siblings, children, grandchildren, cousins, aunts and uncles. For a company to be
family-owned, a family needs to own a least 51 per cent of the equity interest in the
company (Ibrahim and Ellis, 2003).
Furthermore, there has to be an involvement from the family, in managing the
business.
These factors have been utilised to classify family businesses, in this study.

6
1.7 Assumptions
The following assumptions are inherent in this study:
The respondents provide normal perceptions and perspectives;
The comparison of different marketing practices adopted by different businesses can
clearly be made; and
The research methodology adopted in this study is appropriate for the context of the
topic. Furthermore, the methodology allows for consistent results.
1.8 Structure of study
The study is structure as follows:
Chapter 1: This chapter introduces the background as well as the nature of the study.
This introduction is then followed by the problem statement, which is despite the
economic importance of family businesses; there is insufficient information on the
marketing techniques adopted by such businesses (Reuber and Fischer, 2011).
Furthermore, the availability of information is even worse for South African family
businesses.
It then concludes with the assumptions that underpin the study.
Chapter 2: This chapter introduces the existing literature on family business. The chapter
focuses on literature relevant to the study, i.e. marketing in family businesses. A
conceptual model is presented and forms the basis of the issues discussed in the study.
During the course of the literature, different propositions are presented for the purposes
of investigating.
Chapter 3: This chapter focuses on the research methodology of the study. Although the
research paradigm for this study is qualitative, certain aspects of the data are analysed
using a qualitative methodology, in order to solidify the findings. The researcher is of the
opinion that such a combined approach provides a more holistic conclusion.
Furthermore, both the research questionnaire and the data collection process are
discussed in detail, in this chapter.

7
Chapter 4: This chapter describes in detail the demographics of the sample. Through the
technique of convenience sampling a pool of 60 candidates was identified from within
industry. From this pool, 30 completed questionnaires were received from respondents
operating is different industries. Results from these respondents are presented, for
further analysis in Chapter 5.
Chapter 5: This chapter builds on the empirical data from respondents, presented in
Chapter 4. It analyses and discusses the results in the context of the relationship
marketing propositions presented in Chapter 2. Both qualitative and quantitative
techniques were utilised to analyse data for each category of proposition. This is followed
by a summary of other characteristics of relationship marketing identified by respondents
that were not identified in literature.
Chapter 6: This is the final section of study. It summaries the findings of the study and in
so doing further validates each proposition. The study found substantial evidence to
support two propositions, whilst evidence for the other two propositions was fair. The
chapter concludes with recommendations to family business executives as well as
suggestions for further research.

8
2 LITERATURE REVIEW
2.1 Introduction
This chapter outlines the literature used to derive the proposition against which the
research is conducted. Conceptual models of family business were examined in
conjunction with the vast amounts of literature on family businesses. Furthermore, the
literature review examines the following:
Aspects of market orientation in family businesses;
The stages of marketing development in family businesses; and
Lastly, examines the characteristics of relationship marketing in family businesses.
2.2 Conceptual Models of Family Business
Ibrahim et al (2003) presents the dual identity family business model, which builds on the
foundation of the two system model presented by Tagiuri and Davis (1992), as depicted
in Figure 1. In the dual identity framework, an overlap exists between the family and the
business system. The focus of the family system is to satisfy the social and emotional
needs of the family, while the purpose of the business (system) is to create wealth for the
family. This dual identity also illustrates the continuous sharing of resources (i.e. human,
financial and social capital) between the two systems.

9
Figure 1: The dual identity family business model [Source: Ibrahim et al (2003)]
The dual identity is a source of the business’s competitive advantage; it is also a source
of various problems in the family business. Ibrahim et al. (2003) outline some of the
problems experienced in a family business, which are caused by its dual identity as
being:
Rivalry between family members; for example, rivalry between founder and siblings;
Differences in the power and status among family and non-family employees; and
Emotional frustrations particularly during the succession process because family
members are more emotionally involved in their family business, such businesses
tend to operate on a higher emotional basis than public companies.
The dual identity, however, creates the following advantages in family businesses
(Ibrahim et al., 2003):
A high level of employee commitment and motivation;
Faster decision making; and
Family Business
-Tasked based -Performance driven -Inwardly focused -Requires continuous change & development
Family
-Emotionally based -Averse to change -Caring & Sharing - Inwardly focused
Ownership & Management

10
A reduction in agency costs which leads to higher economic efficiency.
Stafford et al. (1999) present a sustainable family business model which illustrates that
the sustainability of family businesses is a function of both family and business
achievements. In addition, the model suggests that there are two important variables:
resources and constraints, which should be taken into consideration in the study of family
businesses. The definition of resources is presented by the model as follows: the human
capital of its family members and employees, the relational capital between the various
stakeholders and the assets of the firm (Stafford et al., 1999). Constraints, on the other
hand, are defined by the model as the liabilities and debts of the business. According to
Ibrahim et al. (2003), the major source of constraints is the dual identity system of
ownership and management that exists in family businesses.
The implication of this model is two-fold: firstly, both the business’s success and the
functionality of the family are important aspects of the sustainability or viability of family
businesses; secondly, sustainability depends on the ability of the family and business to
cooperate in a manner that does not impede the success of each.
The third family business model considered in this study is the research that describes
the development or life cycle of the business and its founder, as depicted in Figure 2
(Neubauer, 2003).
Figure 2: Development Model [Source: Neubauer (2003)]
Start-up Growth Maturity
Business Cycle
Decline
Founder’s Cycle
A1
A2
B2
B1

11
The first part of the model describes the different developmental stages of a family
business, as illustrated by B in Figure 2. The following section describes the stages in
detail.
Start-up
This is the earliest stage in a family business. The founder is at the centre of the
business and is solely responsible for energising and driving the business to success.
The founder invests a great deal of time and resources in the business (Lewis-Enright,
2006). According to Swartz (2006), the business development can be characterised by
an opportunistic and intuitive trial-and-error initiative of the founder’s dreams and visions.
It is for this reason that this stage is also referred to as the pioneering phase. The key
challenges that the business faces during this stage are the following: issues regarding
survival post its entry into the market, planning, financing and dealing with rational versus
the irrational business objectives (Dickinson, 2000).
Expansion
At this stage the growth potential of the business becomes more evident, as it
establishes and develops a broad spectrum of activities. It is also at this stage that the
business experiences an increased level of complexity in its organisational structure as it
expands. Furthermore, the founder’s managerial limitations may become more evident,
as he/she is unable to cope with the complexities of growing the business (Swartz,
2006). It is for this reason that the founder often considers recruiting a professional
manager to assist in the running of the business. Hence, the key challenges for the
business during this stage are as follows: the evolution of the owner-manager’s role,
professionalism, the implementation of organisational systems and policies, and cash
management (Dickinson, 2000).
Maturity
The business at this stage is characterised by a professional structure, a stable customer
base, a modest growth or decline in its sales, increased competition, and established
processes. Key challenges during this stage include achieving a sustainable growth in
the business. It is for this reason that succession now becomes crucial, particularly for

12
the successor and the fresh ideas that he/she brings into the business (Balshaw, 2003),
as illustrated by curve B2 in figure 2 (Neubauer, 2003).
The second part of the model describes the different developmental phases that the
founder or the incumbent (the current CEO) goes through, as illustrated by A in Figure 2.
At the start-up stage of the business, the entrepreneur is highly energised and is driven
by his/her personal vision for the business. However, over time the founder’s mental and
physical mobility deteriorates, as does, their motivation for the business, as illustrated in
Figure 2.
As the business becomes increasingly complex, in terms of its organisational structure,
the founder’s limitations regarding managing the growth in the business becomes
increasingly evident. According to Neubauer (2003), this may not present an immediate
danger for the business during its expansion or maturity stages, as the business may
have built-up sufficient internal reserves to sustain the founder’s limitations. Over time,
this potential risk may become more detrimental to the business and, if succession
planning is further postponed or not carried out, this could cause the business to fail.
2.3 Market Orientation in Family Business
Despite their economic importance, family business scholars and practitioners have
found the study of marketing in family businesses to be intriguing. This is the case,
primarily for two reasons:
Firstly, although there is sufficient literature on general issues relating to family
business, there is insufficient information on the marketing techniques adopted by
such businesses (Reuber and Fischer, 2011). Furthermore, the availability of
information is even worse for South African family businesses, with regards to the
techniques they adopt.
The second reason is that such businesses have a unique ownership, governance
and decision making process in comparison to non-family businesses. According to
Tokarczyk et al. (2007), these unique attributes often influences their orientation
towards marketing.

13
In examining differences in the marketing strategies adopted by family businesses and
non-family business, Zachary et al. (2011) suggests commencing with an understanding
of the differences in market orientation between the two types of businesses.
According to McDonald (2002), market orientation deals with the total alignment of a
company’s business function towards the satisfaction of a consumer need. It determines
how responsive an organisation is to their customers (Kohli, Jaworski and Kumar, 1993),
this responsiveness is determined by the culture and values in the organisation (Narver
and Slater, 1990). Kotler et al. (2009) further states that an organisation cannot survive
without customers; therefore it makes business sense to place customers at the centre of
the company. This notion emphasises two main points:
Focusing on the customer and identifying their needs.
Establishing a customer centricity culture; this ensures that all the functions are
aligned towards achieving this goal.
Market orientation is also not just about the customer, it also involves simultaneously
focusing on the competition. The continuous monitoring of the competition enables
organisations to shift their operations, in order to continuously exploit weaknesses
exhibited by competitors, in the market (Tokarczyk et al., 2007). This in turn, enables the
organisation to meet the needs of its customers better than its competitors. Companies
that implement a market orientated strategy are able to unlock three main benefits, which
are as follows (Kotler et al., 2009):
They are able to deliver the right product required by customers, which leads to
greater production efficiencies.
The satisfaction of customer needs leads to greater customer retention, which leads
to long-term profit maximisation.
The level of customer-centricity enables the organisation to compete with competitors
in a sustainable manner.
The level of market orientation differs for different organisations; this difference can be
attributable to many factors (Morgan and Strong, 1998). According to Kohli, Jaworski and
Kumar (1993), most organisations lack the resources and systems to support a market
orientated approach. Another reason could be attributable to organised resistance or

14
inter-departmental rivalry within an organisation, which may hinder the delivery of a
customer centric solution (Fisher et al., 1997).
Family businesses have a lower market orientation than non-family businesses; this is
according to a quantitative examination by Zachary et al (2011). The reason for this
finding is the organisational DNA of family businesses.
The nature of ownership of a family business necessitates that the business has an
orientation towards the family. This notion is further supported by Tagiuri and Davis
(1992), who state that family businesses tend to support family-orient goals, which
include providing jobs and financial security to the members of the family. These
responsibilities are borne by family businesses as priorities, sometimes to the
detriment of the business.
Family businesses can be too inwardly focused and in so doing, do not give sufficient
attention to external factors, such as competitors (Harris, Martinez and Ward, 1994).
According to Zahra et al. (2008), family businesses are often characterised as being
conventional and slow to respond to competition in the market place. Furthermore,
they have inefficient decision making processes, as key decisions are generally made
by the family with the exclusion of non-family members in the business. Research
conducted by Short et al. (2009) found evidence to support this notion that family
businesses are less competitively aggressive than non-family businesses. This
suggests that family businesses may be less orient towards competitive rivalry than
non-family businesses.
Based on the literature above, the following proposition is formally proposed, in order to
investigate:
Proposition 1: South African family businesses have a low market orientation.
2.4 Stages of Marketing Development in Family Business
Churchhill and Lewis (1983), Scott and Bruce (1987), use growth models to explain the
evolution of business activities in a company. According to classical management
theories, marketing, like finance or operations, is a subset of range of business functions,
and its evolution is correlated with the growth of the business. Hence, it is for this reason

15
that these models have been adapted to illustrate the marketing challenges encountered
at each stage and the solutions adopted by owner-managers to overcome these
challenges (Hill, 2001). Furthermore, the models involve five different stages; however
only three stages are relevant to the family business discussion. These are as follows:
survival, success and resource mature. There is consensus amongst family business
scholars and practitioners that the importance of marketing in a business changes as the
business passes through these different stages of growth.
The subsequent section of this report explains the nature of marketing that occurs at
each growth stage of the business, as illustrated in Figure 2.
Survival - Reactive Marketing
Marketing as a function, does not formally exist at this stage of the business; if it does
exist it is often related to the personal characteristics of the founder, who, according to
Siu and Kirby (1998), assumes responsibility for all marketing and sales activities in the
business. Hooley and Saunders (1993) argue that in particular, the founder’s
entrepreneurial and market orientation characteristics are important factors that shape
marketing functions in a business. Furthermore, Carson (1990) states that the size and
the developmental stage of the business can also influence the characteristics of the
marketing activities in a business. This stage of the business corresponds with the start-
up stage in Figure 2.
Carson (1985) presents three factors that contribute to the lack of marketing at the
survive stage of the business cycle; these are as follows:
Limited resources, which include both finances and time. Most of the founder’s
resources are dedicated to daily operations and founders are often reluctant to recruit
a specialist because of the financial implications. Scase and Goffee (1982) add to this
debate by stating that the general life of a small business is based on day-to-day
survival rather than following a well though-out marketing plan. This means that,
when conditions of uncertainty prevail, a small business will focus on doing activities,
instead of engaging in formal strategic planning (Bhide, 1994). Hence, these
conditions and limitations manifest themselves in simplistic and informal marketing
activities that the founder can manage.
16
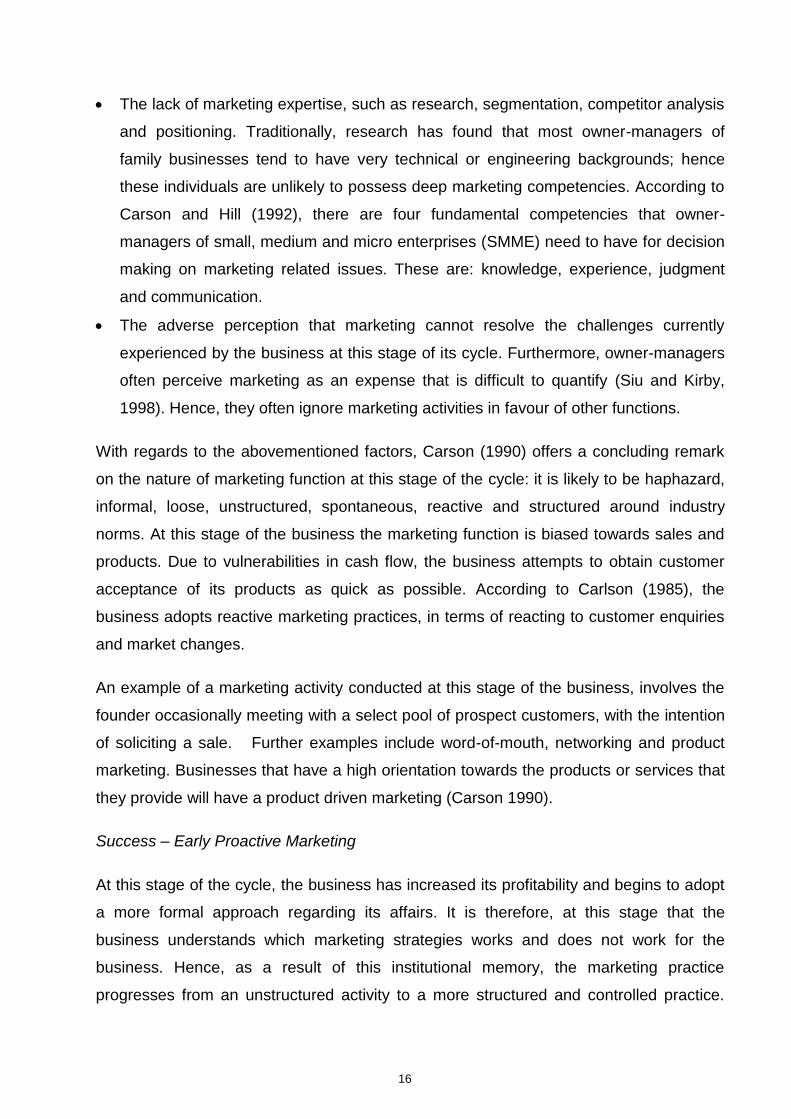
The lack of marketing expertise, such as research, segmentation, competitor analysis
and positioning. Traditionally, research has found that most owner-managers of
family businesses tend to have very technical or engineering backgrounds; hence
these individuals are unlikely to possess deep marketing competencies. According to
Carson and Hill (1992), there are four fundamental competencies that owner-
managers of small, medium and micro enterprises (SMME) need to have for decision
making on marketing related issues. These are: knowledge, experience, judgment
and communication.
The adverse perception that marketing cannot resolve the challenges currently
experienced by the business at this stage of its cycle. Furthermore, owner-managers
often perceive marketing as an expense that is difficult to quantify (Siu and Kirby,
1998). Hence, they often ignore marketing activities in favour of other functions.
With regards to the abovementioned factors, Carson (1990) offers a concluding remark
on the nature of marketing function at this stage of the cycle: it is likely to be haphazard,
informal, loose, unstructured, spontaneous, reactive and structured around industry
norms. At this stage of the business the marketing function is biased towards sales and
products. Due to vulnerabilities in cash flow, the business attempts to obtain customer
acceptance of its products as quick as possible. According to Carlson (1985), the
business adopts reactive marketing practices, in terms of reacting to customer enquiries
and market changes.
An example of a marketing activity conducted at this stage of the business, involves the
founder occasionally meeting with a select pool of prospect customers, with the intention
of soliciting a sale. Further examples include word-of-mouth, networking and product
marketing. Businesses that have a high orientation towards the products or services that
they provide will have a product driven marketing (Carson 1990).
Success – Early Proactive Marketing
At this stage of the cycle, the business has increased its profitability and begins to adopt
a more formal approach regarding its affairs. It is therefore, at this stage that the
business understands which marketing strategies works and does not work for the
business. Hence, as a result of this institutional memory, the marketing practice
progresses from an unstructured activity to a more structured and controlled practice.

17
Therefore, a more proactive approach to marketing begins to emerge. Furthermore,
marketing is identified as a key ingredient for growth (Levitt, 1983), by the founder and as
a result, professionals are brought into the business to manage the marketing activities.
It is important to note that this is the stage when the business has the necessary
resources to afford these professionals.
According to Siu and Kirby (1998), at this stage the primary objective of the marketing
function, is to develop market share, better understand the competitor landscape, direct
selling activities, provide product support and customer service.
Resource Mature – Integrated Proactive Marketing
At this stage of growth, the business is mature and may already be anticipating a decline
in market share. Therefore, at this stage the marketing function is fully integrated into the
business and becomes inseparable from its strategy. The business develops both market
and customer orientation principles that are robust in the organisation. This is further
supported by the acknowledgement of managers across the organisation, that marketing
is a strategic capability that influences the success of the business. This stage
corresponds with the maturity stage, as illustrated in Figure 2.
Furthermore, the marketing functions are focused on developing a new set of products
and services that will enable the business to survive the next generation (Siu and Kirby,
1998). In order to achieve this, the marketing adopted has to be proactive and is aligned
to achieving a clear objective (Carson, 1985). Therefore, both technical and strategic
marketing skills such as marketing research, price determination methodologies, product
mix management, advertising planning, proposition positioning and reputation
management becomes evident in the business.
Examples of the types of marketing disciplines evident at this growth stage include
corporate, digital and consumer marketing.
In summary, marketing in family business is influenced by three main factors, namely:
The growth stage of the business, as this influences the nature of resources that can
be directed towards developing the capability in the business.
The characteristics of the owner/manager, both in terms of their entrepreneurial
aptitude and prior experience in marketing related functions. Both of these factors are

18
critical for shaping marketing in a business. By virtue of the owner/manager’s position
in the business, they can adopt a passive or a proactive approach to marketing.
The environment, which encompasses factors such as industry norms,
macroeconomic issues and the competitive landscape that the business operates in.
This can also influence the nature of marketing adopted in the business.
2.5 Relationship Marketing
Kotler et al. (2009) define relationship marketing, as marketing that is oriented towards
building long-term relationships with key parties. This is achieved by a mutual exchange
and fulfilment of promises, based on trust by both parties in a series of interactions over
the lifetime of the relationship (Grönroos, 1994). Hence, both trust and commitment
constructs are important aspects of relationship marketing. Morgan and Hunt (1994)
define trust as the confidence of one party to rely on another party’s reliability and
integrity, while, commitment is defined as an enduring desire to maintain a valued
relationship with a partner. Morgan and Hunt (1994) further state that both of these
factors are key for the following reasons:
Firstly, they encourage marketers to work at preserving the relationship, by
cooperating with the exchange partner;
Secondly, they encourage marketers to adopt a more long-term relational approach,
with the exchange partner;
Thirdly, they encourage marketers to be prudent in their decisions regarding the
exchange partner, as this is reciprocated by the partner.
In summary the presence of these factors leads to a better cooperation and higher
productivity, amongst all parties, although for most marketers the primary focus of any
business relationship is customers. However, Gummesson (2002) states that inherent in
the definition of relationship marketing, is the relationship with all stakeholders in the
value chain. Therefore, relationship marketing encompasses not only customers but also
includes suppliers, intermediaries and other agents in the industry.
In comparison to the traditional forms of marketing, relationship marketing represents a
shift away from the pure transactional approach that most traditional forms of marketing
are based. According to Venetis and Ghauri (2004), in a transaction based relationship

19
the customer buys products and services on the basis of a price that they source from
multiple suppliers offering similar services. This approach leads to frequent switching
between suppliers over time. In this context the traditional marketing approach, aims to
attract and satisfy mass customers, in the short term, using elements of the marketing
mix (Kotler et al., 2009). Relationship marketing, on the other hand, takes a long-term
approach, when developing relationships with customers. It focuses on a relational
exchange with continuity and emphasis on the benefits that customers derive from the
relationship. Table 1 below; further emphasises the differences between the two forms of
marketing.
Table 1: Marketing Comparison [Source: adapted from Grönroos (1994)]
Traditional Marketing Relationship Marketing
Transactional based Focus on customer relations
Discontinuous customer contact Continuous customer contact
Aim is to seek new customers Aims to retain existing, whilst attracting
new customers
Importance of product benefits Importance of customer benefits
Short time scale Longer time scale
Less emphasis on service Higher customer service
The production team takes accountability
for quality
Everybody takes accountability for
quality
Persuasive communication Regular communication
Relationship marketing is a cross-functional discipline (Gummesson, 2002). It is
interwoven with different processes and transcends the boundaries between specialist
and generalist functions in the business. These include sales, products, customer service
and leadership. Relationship marketing is dynamic, because it is process oriented
(Grönroos, 1994). According to Baker and Saren (2010), business relationships, in
particular are long and often takes a lot of effort to manage. Hence, the marketing
approach when managing these relationships has to be flexible, in order to
accommodate the different seasons in the relationship. Furthermore, the primary focus

20
for managers, in this context is to keep customers loyal and profitable in an efficient
manner.
Gummesson (2002) provides an interesting dimension to the relationship debate, by
stating that relationships can be divided into three types:
Nano relationships: This refers to internal relationships with every department and
employee in the organisation. Communication to internal stakeholders is critical
because it ensures that employees are informed and prepared to achieve the
organisational goals. Furthermore, all employees are part-time marketers and hence
have to be motivated to serve customers. The principle of internal communication
gives rise to internal marketing strategies. George (1990) claims that an effective
internal marketing programme is a prerequisite for a successful marketing strategy
with external stakeholders.
Market relationships: This refers to external stakeholders that the organisation has a
primary relationship with. This segment of stakeholders includes customers, suppliers
and competitors. The relationship between the organisation and these stakeholders is
critical as it has a direct impact on the success of the organisation. For example an
organisation must continuously attract and retain customers. In addition, its products
and services must also be competitive to exceed the benefits derived from other
competitive propositions. In order to achieve this it must also manage the cost of
materials that it procures from suppliers. Therefore, collectively these factors have a
direct impact on the organisation’s profitability.
Mega-relationships: This refers to relationships with stakeholders with political
affiliations, i.e. government, regulators and industry bodies. These stakeholders have
the power to influence the regulatory framework, consumer behaviour and
competitive dynamics. Although vital, these relationships are partially beyond the
control of sales and marketing departments.

21
Figure 3: Relationship Exchange [Source: adapted from Morgan and Hunt
(1994)]
According to Blomqvist, Dahl and Haeger (1993), some of the key characteristics of
relationship marketing include:
Individualization of customers, by treating each customer as an individual;
Customer retention, with a view to building a long term relationships with customers
through a process of interaction and communication. Several studies have proven
that a higher retention of customers leads to higher profitability (Kotler et al., 2009);
Customer satisfaction, through the provision of high quality service and products that
create value for the customer. Whilst, good selling to customers is necessary for
profitability, the provision of good services is necessary to retain those relationships.
Fostering long term relationships with employees, who in turn maintain and manage
relationships with customers.
The subsequent section of this study further explains each of these factors and provides
a methodology for measuring them.
2.5.1 Customer Retention
The notion of customer retention refers to the extent to which an organisation is able to
maintain a relationship with its existing customers (Hansemark and Albinsson, 2004).
According to Kotler et al. (2009), it has been proven by both academics and practitioners
Family
Business
Mega
Relationships
Market
Relationships
Nano Relationships
Government
Industry Regulator
Customers
Competitors
Suppliers
Employees Departments

22
that it is more expensive to attract new customers than it is to retain existing customers.
The opposite of customer retention is customer churn. Ang and Butter (2006) contribute
to the debate by stating that customer churn is a major value destroyer in an organization
and the key towards preventing it, is to avoid the attrition of the right customers by
establishing a long term relationships with them. The right customers are those that
contribute to the achievement of the company’s objectives.
In assessing the level of customer retention in an organisation, Ang and Buttler (2006)
present the following key processes that contribute to better retention of customers:
Customer-compliant handling process: studies have shown that companies that
effectively manage their complaints process enjoy two benefits. Firstly, they are better
placed to resolve customer problems and in so doing retain their customers.
Secondly, the process enables them to identify problems that are systematic or
repetitive in the organisation and in so doing they can develop solutions to resolve
these problems.
Quality assurance and customer satisfaction measurement process; this process
provides insights into whether or not customer expectations are being met.
Customer retention plans: which can involve the segmentation of customers based on
retention efforts similar to the type of segmentation conducted for the acquisition of
customers. Post segmentation, specific resources in terms of managerial time and
finances can be dedicated towards retaining the right customers.
Based on the literature above, the following proposition is formally proposed, in order to
investigate:
Proposition 2: South African family businesses have a high customer retention
rate.
2.5.2 Customer Satisfaction
Hansemark and Albinsson (2004) define satisfaction meeting the expectations of a
customer through the product or services rendered. Hence, it is this meeting or
exceeding expectations that influences the attitude that the customer may have towards
a service provider. Customer satisfaction is intertwined with customer retention, as
satisfaction increases the ability of an organisation to retain customers. However, not all

23
retained customers are satisfied customers; according to Eriksson et al (cited in
Hansemark and Albinsson, 2004) customer may stay with a particular service provider
because there are no other alternatives. Therefore, organisations need to be cognisant
that satisfaction on its own does not always lead to retention.
The following characteristics are important when assessing the level of customer
satisfaction in an organisation (Kotler et al, 2009):
Good customer relations: this refers to the existence of trust, transparency and
personal contact with customers.
Quality assurance measures: this ensures that the best quality products and services
are delivered consistently to customers. This reinforces the confidence that the
customer has in the service provider.
Customer satisfaction measures: this ensures that the voice of the customer is heard
and incorporated into all the processes in the organisation.
Based on the literature above, the following proposition is formally proposed, in order to
investigate:
Proposition 3: South African family businesses have high customer satisfaction
levels.
2.5.3 Employee Relationship
A good indicator of an organisation’s relationship with customers can be determined by
the health of the relationship that it has with its employees. Employees are a vital
resource in any organisation; not only are they a source of manual and intellectual
capital but they also manage and retain relationships with customers. According to
Gummesson (2002), a good employee relationship is an antecedent for customer
satisfaction.
Characteristics of a healthy employee relationship include the following:
Long-standing relationship with employees; this can often can transcend multiple
generations.
Multiple levels of relationship with employees, both personal and professional.

24
An effective internal marketing programme that provides communication to
employees.
Based on the literature above, the following proposition is formally proposed, in order to
investigate:
Proposition 4: South African family businesses have good employee relations.
2.6 Relationship Marketing in Family Business
According to Petzinger (1999) and Cooper et al (2005), relationships are at the heart of
family businesses. This is because the fundamental DNA of a family business is based
on a symbiotic relationship between the family and the business. This argument is
supported by Tokarczyk et al. (2007), who found empirical evidence that further supports
customer orientation as a major theme amongst family businesses. Families, by virtue of
their DNA, cultivate deep relationships with people, which include customers, suppliers
and even competitors. Hence, in a family business context, these values are transferred
into the business by the associated family. This results in a close dialogue with
customers in particular, which often affords family businesses the opportunity to assess
and better understands their needs. This relational attribute is further augmented by the
generational nature of the business, as the business is able to maintain relationships
across multiple generations (Zachary et al., 2011). Collectively, these factors create a
formidable advantage for family businesses that supports their survival in the
marketplace (Dyer, 2001).
Copper et al. (2005) further builds on this view and identify two types of interaction-
oriented factors that family business possess which also contribute to their high
orientation of deep customer relationships. These are namely:
Quick customer response: by virtue of their size and less complex management
structure, family businesses are able to respond quickly to customers. Furthermore,
some family businesses are able to make decisions quicker than non-family
businesses, which have more rigorous decision making processes. The ability to
respond quickly to needs, further builds trust and loyalty with customers, which
provides an advantage over non-family businesses.

25
Family reputation: in a family business the reputation of the family and the business is
intertwined. Hence, there is a greater sensitivity amongst the family to maintain the
integrity of their good name. This often motivates the family to strive for high
customer service in the business (Ward, 1988). In so doing the business develops a
good reputation for service delivery amongst its customers. This in turn, further
fosters a deeper relationship with customers.
Therefore, these attributes collectively contribute to the competitive advantage that family
businesses often leverage over non-family businesses.
With regards to employee relationships, Dyer (2006) suggests that family businesses
may have advantages in developing social capital with different stakeholders which
include employees, than nonfamily businesses. Family businesses typically cultivate and
nurture long-standing relationships with employees across multiple generations (Zachary
et al, 2011). A typical case is when an employee joins the business during its start-up
phase by the founder. As the business grows, so does the relationship between the
founder and the employee. Often the relationship between the two transcends into their
personal lives and respective families. The family connection fosters a deeper
relationship between the two parties. Furthermore, because of this deep relationship and
the institutional knowledge of the business such employees are often entrusted with
coaching the successor or the next generation of family executives. Alternatively, other
family members of the employee could be employed in the business. Therefore, such
ties to the family and the generational factor of the business enable family businesses to
maintain a bond with its employees at multiple levels that include both personal and
professional aspects.
However, despite the strong bond that family businesses have with employees; such
businesses lack an effective internal marketing programme that provides regular
communication to all employees. According to Habbershon and Williams (1999) family
businesses can be very exclusive when making key decisions in the business. This
approach limits the ability of non-family employees to contribute in the business. This in
turn influences their ability to be optimal part-time marketers when managing
relationships with customers. Therefore, an ineffective internal marketing programme
leads to an unsuccessful marketing strategy with external stakeholders.

26
2.7 Summary
This chapter presents literature on family businesses, with specific reference to the
marketing strategies that they adopt. Furthermore, the aim of the chapter was to discuss
relationship marketing attributes in such businesses.
After careful consideration of existing literature, the following were identified:
Family businesses have a dual identity: the family and the business. This dual identity is
a source of such a business’s competitive advantage; it is also a source of various
problems in family businesses. Further implications of this identity are two-fold: firstly,
both the business’s success and the functionality of the family are important aspects of
the sustainability or viability of family businesses; secondly, sustainability depends on the
ability of the family and business to cooperate in a manner that does not impede the
success of each.
These implications are linked to the developmental stages of family businesses, as
illustrated in Figure 2. Insights from the figure indicate that both the founder’s cycle as
well as the business cycle are interwoven. Successful family businesses passes through
different stages of development and each stage changes the nature of the business.
Therefore, each stage requires a new style of management and strategic thrust (Ward,
1997). Similarly, marketing in family business evolves with the business. It is usually
influenced by three main factors, namely:
The growth stage of the business, as this influences the nature of resources that can
be dictated towards developing the capability in the business.
The characteristics of the owner/manager, both in terms of their entrepreneurial
aptitude and prior experience in marketing related functions. By virtue of the
owner/manager’s position in the business, they can either adopt a passive or a
proactive approach to marketing.
The environment or industry in which the business operates. This can influence the
nature of marketing adopted in the business.
Despite literature detailing that marketing practices are critical to the success of a
business, family businesses have a lower market orientation than non-family businesses,
by virtue of their DNA (Zachary et al, 2011). Conversely, relationships are at the heart of

27
family businesses (Copper et al, 2005). This is because the fundamental DNA of a family
business is based on a symbiotic relationship between the family and the business.
Families, by virtue of their DNA, cultivate deep relationships with people, which include
customers, suppliers and even competitors. Hence, in a family business context, these
values are transferred into the business by the associated family. This results in a close
dialogue with customers in particular, which often affords family businesses the
opportunity to assess and better understands their needs. These factors create a
formidable advantage for family businesses that supports their survival in the market
place (Dyer, 2001).
Therefore, despite having a low market orientation, family businesses are good at
satisfying and retaining customers. Their DNA also supports cultivating a healthy
relationship with employees. In so doing, such businesses are better oriented towards
relationship marketing.
2.8 Summary of Research Propositions
On the basis of the literature review, the following is a summary of the main and sub-
propositions put forward. The purpose of these propositions is to investigate the
characteristics of relationship marketing that exists in South African family businesses.
2.8.1 Proposition One: South African family businesses have a low market
orientation
1. South African family businesses have a low customer orientation.
2. South African family businesses have a low competitor orientation.
3. South African family businesses have a low inter-departmental coordination.
2.8.2 Proposition Two: South African family businesses have a high customer
retention rate
4. South African family businesses cultivate long term relationship with customers.
5. South African family businesses have a high customer retention rate.

28
2.8.3 Proposition Three: South African family businesses have a high customer
satisfaction levels
6. South African family businesses cultivate and maintain good relations with
customers.
7. South African family businesses measure the level of satisfaction of their
customers.
2.8.4 Proposition Four: South African family businesses have good employee
relations
8. South African family businesses cultivate good relations with their employees.
9. South African family businesses have a long standing relationship with their
employees.
10. South African family businesses cultivate multiple levels of relationship with their
employees; this includes both professional and personal bonds.

29
3 RESEARCH METHODOLOGY
3.1 Qualitative Research
The purpose of the study is to investigate some of the characteristics of relationship
marketing that exist in South African family businesses. This chapter describes the
research methodology that will be utilised in this study, to examine the relationship
marketing characteristics in family businesses.
The research paradigm for this study is qualitative in nature. Although, a qualitative
technique was primarily utilised to analyse the empirical data, a quantitative technique
was also utilised to analyse certain aspects of the data. The rationale for the combination
in methodologies is to enable the researcher to triangulate the results of the study and in
so doing solidify its conclusions.
A qualitative research is a field of inquiry that involves an interpretative, naturalistic
approach to the world (Denzin and Lincoln, 2000). This means that the qualitative
researcher studies things in their natural setting, attempting to make sense of or to
interpret phenomena in terms of the meaning people bring to them. Such research
encompasses the following methods: case study, participatory enquiry, interviewing,
participant observation, visual methods and interpretative analysis (Denzin and Lincoln,
2000). Given the characteristics of a qualitative methodology presented in literature
(Denzin and Lincoln, 2000; Leedy and Ormrod, 2001), the methodology was considered
appropriate for this study, for the following reasons:
The sample size is small;
The purpose of the research was to examine and explore; and
The research was context bound and encompassed personal perceptive.
3.2 Descriptive Research Design
The qualitative design took the form of a content analysis. Content analysis is the
detailed and systematic examination of the contents of a particular body of material for
the purpose of identifying patterns, themes or biases (Leedy and Ormrod, 2001). An In-
depth, semi-structured questionnaire was utilised to collect data. Denzin and Lincoln

30
(2000) define interviews as a conversation; it is the art of asking questions and listening.
The reality in an interview session is created by at least two people. Interviews provide
the following benefits:
Interviews generate useful information about practical experience and its meaning;
and
Interviews allow the researcher to adjust the line of questioning for an immediate
follow up. This makes it a dynamic process which permits the researcher to pursue
productive and appropriate lines of enquiry (Schmitt and Klimoski, 1991); other forms
of data gathering do not provide this advantage.
The researcher took advantage of these benefits during the interview session with
various respondents of family businesses, so as to identify and explore the perceptions
of the respondents about the nature of relationship marketing adopted in family
businesses.
For the quantitative aspect of the study, an algorithm was utilised to analyse the ordinal
data. The distribution fitting algorithm assesses the level of important that respondents
assign to each surveyed item by algorithmically estimating their respective frequencies
(Stacey, 2005). For this technique, structured questions in the questionnaire were utilised
to collect data (see Appendix 1).
Questionnaire Design and Instruments
The questionnaire comprise of five different sections.
Section A: General
This is the first is section of the questionnaire and it contains questions relating to the
demographics of both the respondent and the business, as this aided the analysis of the
results. Some examples of questions in this section include the respondent’s age, the
nature of the business, its age, the number of employees employed, percentage of family
shareholding and the generational stage of the business (1st, 2nd, 3rd or 4th).

31
Section B: Market Orientation
Kohli, Jaworski and Kumar (1993) as well as Narver and Slater (1990) presents a
methodology for measuring market orientation, through the use of a 7 point MARKOR
scale. The study utilises a similar scale and inputs were obtained through the
questionnaire. This section of the questionnaire consists of three subscales used to
measure customer orientation, competitor orientation, and inter-functional coordination.
The purpose of which is to measure the extent to which the surveyed business practice
the principles of market orientation. Respondents were asked to rate a range of
questions on a 7-point scale. More specifically, respondents were asked to indicate the
extent to which their business engages in the practice of market orientation or does not,
i.e. the scale ranges from ‘Very high extent’ (7), to ‘No extent at all’ (1).
Section C: Customer Retention
As a metric for measuring customer relationship strategies in an organisation, Crosby
(2002) suggests assessing the following in the company:
The amount of time spent discussing and making decisions about customer
relationships in meetings;
How frequent are customer data reviewed; and
The existence of a customer complaint–handling process or policy.
Furthermore, Du Plessis, Strydom and Jooste (2011) present additional metrics for
measuring customer retention in a company, this includes the following:
Calculating the average length of its customer relationships.
Calculating the retention rate, which is the number of customer retained in a period
versus the total number of customers, at the start of a period.
Calculating the ratio of customer churn, which is the percentage of existing customers
who stop purchasing a company’s product or service.
Comparing the marketing expense incurred for retaining and that incurred for
acquiring customers.

32
Therefore, section C of the questionnaire contains additional questions used to calculate
the above metrics, in order to measure the extent to which the business surveyed adopts
the principles of customer retention.
Section D: Customer Satisfaction
This section also contains a 7 point MARKOR scale used to measure the level of
customer satisfaction. The purpose of the scale will be to measure the respondent’s
opinion on the level in which customers are satisfied with the organisation. Furthermore,
Du Plessis et al. (2011) present additional metrics for measuring customer satisfaction in
a company; this includes the following:
Calculating the ratio of repeat purchases by existing customers: this indicates the
level of satisfaction amongst existing customers.
Calculating the referral rate: this is the percentage of customers who recommend the
company’s product and services to acquaintances.
Calculating the number of complaints lodged by customers, in a given period.
Assessing the extent of company resources dedicated towards satisfying customers.
Therefore, section D of the questionnaire contains additional questions used to calculate
the above metrics. The result thereof was utilised to assess the extent to which the
business surveyed, adopts the principles of customer satisfaction.
Section E: Employee Relationship
This section contains a 7 point MARKOR scale used to measure the level of employee
relationship. The purpose of the scale will be to measure the respondent’s opinion on the
level in which employees are satisfied with the organisation. Furthermore, the following
additional metrics for measuring employee relationship were utilised:
Employee turnover rate.
The average employment period of retained staff.
The frequency with which formal communication is disseminated to employees, on
issues regarding business strategy, market performance, customer relationships, etc.
Evidence of a personal bond with employees, beyond the professional relationship.

33
Section F: Other Information & Ranking
This is the last section of the questionnaire; this section contains both open-end and
semi-structured questions, the purpose of which is to identify factors (which are not
necessarily raised in literature) that the respondents feel are important factors for
relationship marketing. For each factor or variable identified, respondents will further be
asked to clarify, how the factor actually contributes (or could possibly contribute) towards
the business.
3.3 Population and Sample
This study was conducted with respondents, from 30 different family-run and owned
businesses in South Africa. The purpose of the study is to explore the perceptions of
both current chief executives and previous incumbents of family businesses with respect
to characteristics of relationship marketing in South African family businesses.
The population was identified using the following criteria:
Medium-sized businesses with a turnover of between R6 million and R100 million.
The DTI (2004) defines this turnover as a criterion for medium-sized businesses.
Large-size businesses were also considered;
Businesses where more than 50 per cent of the voting shares is owned by a family;
Businesses which are currently owned or managed by at least the second generation
family members.
The following details the sampling process that was adopted for the study:
1. Initially, a total of 70 candidates, were randomly identified from a database of surveys
previously conducted on family businesses. Some of these surveys include Lewis-
Enright (2006) and Eboru (2007). In addition, prospective candidates were sourced
from industry practitioners, who currently render services to family businesses in
South Africa.
2. The prospective candidates were validated against the criteria for family business as
stated in section 3.3 as well as to distinguish between suitable and non-suitable
candidates for the study. Furthermore, this process enabled the researcher to select

34
candidates who had the required experience to adequately the research questions
adequately. According to Saunders and Lewis (2012) purposive sampling is ideal
when collecting qualitative data from a small sample. This sampling strategy enables
the researcher to identify or select information that provide the most insight to the
research question and in so doing meet the research objectives (Devers and Frankel,
2000).
3. Post the filtering process, the prospective sample was reduced to 60 candidates. The
questionnaire was sent to this pool of 60 candidates, of which only 30 respondents
completed the questionnaire.
4. A few respondents provided additional comments over and above completing the 7
point MARKOR scale questions, in the questionnaire.
3.4 Data Collection
Prospective candidates were contacted electronically prior to the interviews. This prior
communication was utilised to confirm certain family details. In cases where interviews
cannot be secured, the questionnaire was sent to the respondent, along with a detailed
explanation of the questionnaire.
Upon receipt, all of the completed questionnaires were inspected for missing data. In the
event that a questionnaire with missing information was identified, respondents were
contacted telephonically to obtain the missing information. The received information was
then inserted into the questionnaire on behalf of the respondent.
The primary batch of completed questionnaires was received between August and
September 2013. Through a follow-up phone call by the researcher, the second batch of
questionnaire was received during the course of October 2013. In cases where
respondents requested a personal interview, in order to better understand the study, the
necessary interviews were scheduled and completed.
The researcher was mindful at all times of the time taken by the respondents to complete
the interview and displayed appreciation for the respondents’ contributions. In addition,
the questionnaire was sent to each respondent prior to the interview and they were each
offered a copy of the findings on completion of the study, on request.

35
The researcher adopted the following approach towards each personal interview
conducted:
Where possible, the interviews were taped;
Written notes were taken during all interviews; and
All interviews were conducted by the researcher.
Table 2: Data Collection Statistics
Questionnaire Activity Number
Number of questionnaires mailed (email, Survey Monkey etc.) 60
Number of questionnaires returned 30
Usable questionnaires 30
Number of conducted interviews 10
Response rate 50%
3.5 Data Analysis
As stated in section 3.1, two different types of analytical techniques were utilised to
analyse the data collected. The first is a content analysis (which is a qualitative
technique), whilst the second is a distribution fitting algorithm (which is a quantitative
technique).
Content Analysis

36
The content analysis is the first technique used to analyse the data. Such analysis
measures the frequency and variety of messages as well as key words from
communication. This is further utilized to characterise and compare documents (Merriam,
1998). The following procedure was deployed to analyse the data using this
methodology:
Descriptive codes were created in order to classify the words (Miles and Huberman,
1984). Therefore, each proposition stated in section 2.7, was assigned a master and
a sub-code. The sub-codes were used to capture issues raised that were related to a
master code. For new factors raised by respondents, new codes were created and
assigned to these factors (see Appendix 2).
Each factor or concept raised by a respondent was assigned a code and the related
issues to the code were clustered together. These codes were used to organise the
data, thereby facilitating consistent analysis.
A frequency count for each category of questions was conducted and tabulated. This
informed the researcher as to the perceived importance of the identifiable factors for
each category.
The numeric data collected from each business was utilised to arithmetically calculate
ratios.
Distribution Fitting Algorithm
There have been several critics about the conversion of verbal responses, from ordinal
scales (i.e. MARKOR scale) into interval data (Labovitz, 1970; Bendixen and Sandler,
1995; Stacey, 2005). According to Bendixen and Sandler (1995), the assignment of
numeric values to ordinal responses is incorrect and can lead to unsubstantiated
assumptions. Therefore, in order to avoid this shortcoming, Stacey (2005), suggest the
use of an algorithm, which involves the fitting of distributions to the ordinal survey data
using the X2 statistic.
Through the use of a 7 point MARKOR scale, in section B of the questionnaire,
respondents rated the level of each surveyed item in their respective businesses.
Therefore, these scales provided ordinal data, the distribution fitting algorithm was then

37
utilised to algorithmically assess the level of importance for each surveyed item, relative
to each other. The process includes the following activities (Stacey, 2005):
Firstly, an estimation of parameters of the survey data. These parameters include the
means, standard deviations and the threshold values.
Secondly, these parameters are then utilised to calculate the expected frequencies
for each category of survey items or factors.
Lastly, the X2 value is then calculated which measures the goodness of fit between
the survey data and a numerical model. The X2 is calculated through the use of the
‘Solver’ in Microsoft Excel and the objective is to determine the parameters that will
minimise the value of X2. The reduction of the X2 value increases the ρ-value. Should
the ρ-value be significant then the model parameters are deemed to be a good fit for
the survey data. In order words the bigger the p-value above 0.05, there is
insignificant difference between the model and the survey data.
The mean for each surveyed item was summarised in a tabulate manner. The item
with the highest mean indicated that it is the most important factor, perceived by
respondents.
3.6 Validity and Reliability
According to Riege (2003) reliability refers to the demonstration that the operations and
procedures of the research enquiry can be repeated by other researchers, who then
achieve similar findings; that is, the extent of findings can be replicated assuming that,
for example, interviewing techniques and procedures remain consistent. In other words,
reliability refers to the extent that a measure is error-free (Zikmund, 2003). Validity refers
to the degree to which a study accurately reflects or assesses the specific concept that
the researcher is attempting to measure (Colorado State University, 2007). Practicality is
concerned with issues such as convenience, economy and interpretability (Cooper and
Schindler, 2007).
The techniques utilise to ensure validity, reliability and practicality in the study are
discussed in the subsequent sections.

38
3.6.1 Validity
The primary concern of validity is to ascertain that a test measures what the researcher
actually intends to measure. The following forms of validity can be measured: external
validity, internal validity and construct validity.
External validity refers to the extent to which a general conclusion can be made from the
results of a study (Colorado State University, 2007). Construct validity is determined by
the extent to which a measure confirms various related hypotheses, generated from
theory founded on the concepts (Zikmund, 2003), whilst, internal validity refers to the
extent to which the research findings match reality (Merriam, 1998).
In order to achieve validity in the study, the following were conducted:
External validity was achieved by using a sample of family business validated by the
family business pre-selection criteria, as stated in section 3.3. In addition, all stated
company information on the questionnaire was verified with the company’s secretary
or auditors where possible.
Internal validity was achieved by presenting the results of the questionnaire to the
interviewees and confirming with them the accuracy of the recorded results. Both
dependent and independent variables, from the results were presented for
confirmation. Furthermore, the results from the content analysis where then
triangulated with those of the distribution fitting algorithm.
Construct validity was achieved by utilising measurement instruments from existing
literature that has been utilized to measure the same surveyed item.
3.6.2 Reliability
The primary concern of reliability is to determine the extent to which a measurement is
free of random or unstable errors. A measure is therefore considered reliable, if it
generates consistent results (Eybers, 2010). Internal consistency is a measure of
reliability, on the assumption that items on a measurement scale should measure same
construct (Copper and Schindler, 2007). In order to achieve consistency in the study, the
following were conducted:
Both the interviews and the interpretation of the findings were personally
administered by the researcher.

39
Respondents, irrespective of the medium utilised to complete the survey (i.e. Survey
Monkey, Word document) completed identical scales and questions for each category
of propositions being investigated.
3.6.3 Practicality
The primary concern with practicality is to determine whether the test is effective (Cooper
and Schindler, 2007). It also involves understanding the ease of administrating the test as
well as the interpretation of the results. In order to achieve consistency in the study, the
following was conducted:
Presenting the results of the study to some of the respondents and industry
practitioners, in order to confirm with them the accuracy of the findings.
Before finalising the questionnaire, it was tested amongst a sample of mock
respondents. Feedback received from these respondents was utilised to refine the
final version circulated for completion.
Respondents were offered multiple methods of completing the questionnaire, in order
to make the completion process more convenient.
3.7 Summary
This chapter describes the research methodology adopted in the study. Although the
research paradigm for this study is qualitative, a qualitative methodology will be utilised
to analyse certain aspects of the data. The researcher is of the opinion that such
combination in methodologies solidifies the findings and provides a more holistic
conclusion.
The chapter articulates how the above approach will be achieved through design of the
questionnaire. The questionnaire has been divided into six different sections. Each of
these sections is aligned with a particular category of proposition that will be
investigated. The data collected in each section will support the analytical
methodologies, namely the content analysis and the distribution fitting algorithm.
Furthermore, the process of data collection from the respondents is presented. This, in
conjunction with the processes to ensure validity and reliability of the data, is also
presented.

40
4 PRESENTATION OF RESULTS
4.1 Introduction
The objective of this chapter is to present results from the collected data. The purpose of
the literature review is to establish the characteristics of relationship marketing that exists
in South African family businesses. This aligns with the survey process, which is aimed
at validating these characteristics, by obtaining perceptions and beliefs from respondents
regarding them.
The chapter begins by presenting the demographics of the sample. This is followed by
the results from the survey questions, which were used to identify relationship marketing
characteristics evident in the surveyed businesses. The results from the content analysis
are presented first, followed by the results from the distribution fitting algorithm.
4.2 Sample Description
Initially, a total of 70 candidates, were randomly identified from a database of surveys
previously conducted on family businesses. Some of these surveys include Lewis-
Enright (2006) and Eboru (2007). In addition, prospective candidates were sourced from
industry practitioners, who currently render services to family businesses in South Africa.
The prospective candidates were validated against the criteria for family business as
stated in the above section and in order to distinguish between suitable and non-suitable
candidates for the study. Furthermore, this process enabled the researcher to select
candidates who had the required experience in business strategy and marketing, to
answer the research questions adequately. Post this filtering process, the total
prospective sample was reduced to 60 candidates and the questionnaire was sent to this
pool of candidates. From this pool, 30 completed questionnaires were received from
respondents, operating in different industries. Table 3 below provides details on the
respondents.

41
Table 3: Summary of Respondents
Name of Business Business
Tenure
Generational status
of respondents
Ethnicity - Race
OneCom Digital 12 years 1st Generation (2) White
Ninos Group N/A 1st Generation White
Parvalux SA 20 years 1st Generation White
Transman 30 years 1st Generation White
Fred Footwear 11 years 2nd Generation (2) Black
Kunene Brothers Holdings 35 years 2nd Generation Black
Kupane Funerals 30 years 2nd Generation Black
Ruby Boutique Hotel N/A 2nd Generation Black
Amka Products 56 years 2nd Generation Indian
Smollan Group SA 82 years 2nd Generation White
Kloppers 46 years 2nd Generation White
Trafalgar Group 40 years 2nd Generation White
Giuricich Brothers 73 years 2nd Generation White

42
Apex Cordset
Technologies
25 years 2nd Generation White
Jawitz Properties 44 years 2nd Generation White
Olitzki Property Holdings 25 years 2nd Generation White
Alasil Farms 11 years 2nd Generation White
Organisation &
Management Technology
33 years 2nd Generation White
Ullman Bros 117 years 2nd Generation
3rd Generation
White
Western Refinishers 40 years 3rd Generation White
Supreme Printers 54 years 3rd Generation White
Norman Goodfellows 35 years 3rd Generation White
Duys Group 53 years 3rd Generation White
Vineyard Hotel Group 30 years 3rd Generation White
McCullagh & Bothwell 117 years 3rd Generation
4th Generation
White
Dickinson Group 103 years 4th Generation White

43
Further analysis of the ethnicity of the sample indicates that 83 per cent of the
businesses and respondents who were interviewed were white, 14 per cent were black
and 3 per cent were Indian, therefore, indicating that the sample was not racially and
culturally diverse. However, the researcher found it extremely difficult to identify black
family businesses that had survived the first generation. This situation reflects the
country’s political history, which prohibited certain racial classes from entering into
business.
Figure 4 below illustrates the generational demographics of family business respondents
surveyed:
Figure 4: The generational stage of family business respondents
The majority of companies surveyed were currently being managed by second-
generation family members. This confirms the literature review, which states that about
30 per cent of family businesses globally, are transferred to second-generation family
ownership, and only 13 per cent of such businesses survive to the third generation family
owners (Ward, 1988).
These respondents occupy different roles in the organisation; Figure 5 provides a
detailed illustration. The majority of the respondents were not solely fulfilling a marketing
1st 23%
2nd 47%
3rd 20%
4th 10%
5th 0%

44
role, because the function was relatively small in comparison to other functions, in the
businesses.
Figure 5: The roles of respondents in the surveyed businesses
Respondents were asked to provide an indication of the annual turnover of their
business, and Figure 6 illustrates the turnover analysis. Based on the information
received, an analysis was conducted in order to ascertain if a relationship exists between
the age of the business and its financial position. Findings from the analysis indicate that
there was a positive relationship between the age of the businesses and its turnover. It is
the research’s opinion that the older businesses had an establish business strategy and
model, which attributes to a better financial position, in comparison to the younger
businesses.
CEO/Managing Director
57%
Marketing Director
0%
General Manager
23%
Other 20%

45
Figure 6: Analysis of turnover of bonus surveyed Forty six per cent of the surveyed companies operate in the following sectors;
manufacturing, wholesale/retail and construction. Figure 7, below provides the full
breakdown of the sectors, from the analysis there was no company operating in the
financial service sector amongst the surveyed businesses. The sector titled ‘Other’ in the
figure predominantly comprises of companies providing other services, such as logistics,
engineering and IT solutions.
Figure 7: Industry analysis of respondents
13%
23%
10%
3%
0%
7%
7%
3%
33%
Manufacturing
Wholesale/Retail
Construction
Agriculture
Financial services
Mining & utilities
Hospitality
Consulting
Other
< R10m 11%
R10m - R50m 30%
R51m - R150m 22%
R151m - R350m 26%
R351m - R500m 4%
R501m - R1bn 7%

46
4.3 Key Research Themes
Perceptions of Marketing
In order to understand the marketing strategies adopted by businesses surveyed,
respondents were asked to describe the type of marketing strategies conducted by the
business. Furthermore, this information was also utilised to assess the development
stage of the marketing function in the business, as explained in section 2.4 of this study.
Table 4: Frequency counts of themes used to describe marketing activities in the
business
Themes mentioned by respondents N = 31 Percentage
Trade marketing (trade exhibitions, product demonstrations,
account management)
8 26%
Word-of-mouth marketing (client referrals, networking) 8 26%
Direct marketing (client presentations, one-to-one promotions) 6 19%
Outdoor marketing (billboard, event sponsorship) 6 19%
Digital marketing (online, mobile, email) 3 10%
Based on the analysis, 26 per cent of the businesses surveyed conducted activities
relating to trade marketing. The rationale for this finding amongst the businesses
surveyed is that the majority of the business’s customers are companies and not retail
customers.
Perceptions of Relationship Marketing

47
In order to obtain opinions from respondents regarding relationship marketing,
respondents were asked to define relationship marketing, within the context of their
business. Table 5 depicts the key themes that were utilized by respondents to describe
relationship marketing.
Table 5: Frequency counts of themes used to describe Relationship Marketing
Themes mentioned by respondents N = 16 Percentage
Cultivating long term relationships with customers and utilising
this relational platform to promote services/products
8 50%
Satisfying the needs of your customer, in a manner that
ensures high referrals
2 13%
Building a personal and consistent contact with customers 3 19%
Developing a long term, mutually beneficial relationship with all
stakeholders (not only customers) that are involved in the
business
3 19%
The analysis indicates that 50 per cent if respondents define relationship marketing as a
process that involves the developing a long-term relationship with customers. Only, 19
per cent of respondents broaden their definition of relationship marketing beyond
customers.
Perceptions of Market Orientation
In order to obtain perceptions regarding market orientation, respondents were asked to
rate a series of questions relating to the characteristic of market orientation evident in the
business. Table 6 depicts the responses to the questions.

48
Table 6: Rating averages of Market Orientation Questions (30 respondents)
Related Questions Rating average from individual
rating scale (1 - low to 7 – high)
Q1: The extent to which customers are encouraged
to complain about product & services received from
the company
5.47
Q2: The extent to which customer centricity is
encouraged in the company 5.77
Q3: The extent to which competitive factors are
considered in strategy formulation 5.43
Q4: The extent to which environmental scanning is
conducted in the company 5.3
Q5: The extent to which findings from the scanning
the environment is utilised in decision making. 4.3
Q6: The extent to which inter-departmental co-
ordination takes place in the company 4.3
The results from the table indicate that the distribution of ratings is negatively skewed, for
this category of questions. This is because most respondents assigned a high rating (5
and above) to the surveyed questions. However, distribution for both question 5 and 6
were more normal. Ninety per cent of respondents (5 and above rating) indicated that
their business has a high level of customer centricity. In addition, seventy-three per cent
of respondents (5 and above rating) indicated that their business conducts some sort of
competitive and industry analysis when formulating their business strategy.

49
The following are some of the additional comments made by respondents:
“Market orientation is about understanding the environment, which includes influencing
factors, industry players as well as customers. Most businesses then to just focus on one
aspect of the orientation; which is just the customer and neglect the other aspects”.
“The orientation process should be continuous, as things change and hence, one’s
understanding of the market should reflect the change. Market orientation informs a
variety of decisions made in the business, hence an orientation that is outdated leads to
suboptimal decisions”
Algorithmic ranking test
In order to test the importance of above factors relative to each other, the ‘Solver’
algorithm in excel was utilised to determine the parameters of the mean (X2), where the
ρ-value is insignificant thus ensuring a goodness-of-fit between the surveyed data and
model. The table below illustrates the results from the algorithm, which have been
ranked in descending order. The result indicates that customer centricity is the factor with
the highest mean thus indicating that is the most important factor, perceived by
respondents.
Table 7: Ranking of Means for Market Orientation Questions
Related Questions Means
Customer centricity is an important aspect in our
organisational strategy
0.2585
We encourage customers’ comments and complaints
because they help us to do a better job
0.2341
We take into consideration competitive factors, when
developing our strategy
0.0386
We frequently monitor environmental factors influencing 0.0176

50
the industry, we operate in
The level of inter-departmental coordination in the
company
-0.2411
Decisions taken within our firm, are informed by
environmental factors
-0.3079
ρ-value 0.4520
Perceptions of Customer Retention
In order to obtain perceptions regarding customer retention, respondents were asked to
rate a series of questions relating to the characteristic of customer retention evident in
the business. Table 8 depicts the responses to the questions.
Table 8: Rating averages of Customer Retention Questions (30 respondents)
Related Questions Rating average from
individual rating scale (1 -
low to 7 – high)
Q1: Level of commitment to customers 6.27
Q2: Customer commitment reflected in marketing
budget
4.37
Q3: Length of relationship with high value customers 6.17
Q4: Percentage of customers retained annually 6

51
Q5: Retention of customer is key for the business 6.3
Q6: Level of managerial time spent on customer
related issues in meetings
5.17
Q7: Firm better off if more customers were retained 4.53
Q8: Level of continuous value creating culture for
customers
6.10
The results from the table indicate that the distribution of rating is negatively skewed, for
this category of questions. This is because most respondents assigned a high rating (5
and above) to the surveyed questions. Eighty six per cent of respondents (5 and above)
indicated that their business has a high level of commitment to customers.
In order to further investigate this perception of commitment, respondents were asked
how much managerial time, in the business is allocated to making decision about its
customers. Eighty per cent of the business surveyed allocated a lot of time (medium to
high) to such activities. This is illustrated in Figure 8 below.

52
Figure 8: The managerial time spent discussing and making decisions about
customer relationships, in meetings
Some respondents make the following comments about customer retention:
“The retention of customers is often a good indicator on how well the business’s
customers are satisfied. However, our business has come to realise that not all retained
customers are satisfied customers. Hence, it is incumbent upon owners of family
businesses to truly validate their assumption of satisfaction amongst their customers”.
“Every business, including family businesses should strive to retain a healthy ratio of
their customer base. In our organisation we strive to retain 40% of existing customers, as
they contributed 80% of the business’s total revenue. Customer retention also creates an
annuity income that becomes the foundation for the business”.
Algorithmic ranking test
In order to test the importance of the customer retention factors relative to each other,
the ‘Solver’ algorithm in excel was utilised to determine the parameters of the mean (X2),
where the ρ-value is insignificant thus ensuring a goodness-of-fit between the surveyed
data and model. The table below illustrates the results from the algorithm, which have
been ranked in descending order. The result indicates that the retention of customers
being a critical component of the business strategy is the factor with the highest mean
thus indicating that this is the most important factor, perceived by respondents.
Low 20%
Medium 47%
High 33%

53
Table 9: Ranking of Means for Customer Retention Questions
Related Questions Means
Retaining customer is an important part of our business
strategy
0.4437
In our firm, we have a strong commitment to our customers 0.3683
Our firm on average, has a long standing relationship with its
high value customers
0.2962
We are always looking at ways to create customer value in
our products
0.2277
In our firm, a good percentage of our customer base is
retained annually
0.1449
In our firm, the level of managerial time spent on discussing
and making decisions about the customer is meetings is
-0.3461
Our firm would be a lot better off if the sales team, retained
more clients
-0.5189
The commitment to customers, is also reflected in the
marketing budget allocated to segment relationship with
existing customers
-0.6159
ρ-value 1.00

54
Perceptions of Customer Satisfaction
In order to obtain perceptions regarding customer satisfaction, respondents were asked
to rate a series of questions relating to the characteristic of customer satisfaction evident
in the business. Table 10 depicts the responses to the questions.
Table 10: Rating averages of Customer Satisfaction Questions (30 respondents)
Related Questions
Rating average from individual
rating scale (1 - low to 7 – high)
Q1: Regular assessment conducted on customer
complaints 5.3
Q2: Quality is defined as the extent to which customers
are satisfied with company’s products 6.03
Q3: Current level of customer satisfaction for
company’s products & services 5.63
Q4: Level of which new customers are referred by
existing customers 5.3
Q5: Level of repeat purchases made existing customers 5.9
Q6: Quarterly assessment is conducted on customer
satisfaction with company 4.2
The results (with the exception of question 6) from the table indicate that the distribution
of rating is negatively skewed, for this category of questions. This is because most
respondents assigned a high rating (5 and above) to the surveyed questions.

55
Based on the analysis of responses, 94 per cent of respondents (5 and above rating)
agreed with the definition of quality, suggested in the questionnaire. Aligned with this
definition, 97 per cent of respondents (5 and above rating) perceived the level of
customer satisfaction on the products and services that their business provides to be
high.
The following are additional comments made by respondents on customer satisfaction:
“In order for any organisation to be successful in satisfying its customers, it has to be
entrenched in the values and DNA of the organisation. This way it forms part of how the
organisation as a whole operates. Secondly, organisations that are successful in
satisfying external customers are good at satisfying the needs of internal customers.
Internal customers are employees in an organisation who provide services to one
another”.
“Repeat purchases of services and products, by existing customers are a good indication
of their satisfaction”.
Algorithmic ranking test
In order to test the importance of customer satisfaction factors relative to each other, the
‘Solver’ algorithm in excel was utilised to determine the parameters of the mean (X2),
where the ρ-value is insignificant thus ensuring a goodness-of-fit between the surveyed
data and model. Table 11 below illustrates the results from the algorithm, which have
been ranked in descending order. The result indicates that the level of repeat purchases
made by existing customer is the factor with the highest mean thus indicating that it is the
most important factor, perceived by respondents.
Table 11: Ranking of Means for Customer Satisfaction Questions
Related Questions Means
We define quality as an extent to which our customers are
satisfied with our products and services
0.299

56
The level of repeat purchases by existing customers in our
firm is
0.192
The current level of satisfaction for our product and service is 0.074
We assess the complaints received from our customers on a
regular basis
-0.014
The level of repeat purchases by existing customers in our
firm is
-0.078
Our firm assess/measures the level of satisfaction of our
customers, at least once every three months
-0.472
ρ-value 0.99
Perceptions of Employee Relations
In order to obtain perceptions regarding employee relation, respondents were asked to
rate a series of questions relating to the characteristic of the relationship evident in the
business. Table 12 depicts the responses to the questions.
Table 12: Rating averages of Employee Relation Questions (30 respondents)
Related Questions
Rating average from
individual rating scale
(1 - low to 7 – high)
Q1: The extent to which employees remain with firm 6.17
Q2: The extent to which both professional and social levels 5.1

57
of relationship is developed with employees
Q3: The extent to which a family connection is developed
with employees 5.47
Q4: The extent to which of interaction take place with the
family members of the employees 3.83
Q5: The extent to which the company’s culture supports the
development of employee relationship 4.47
Q6: The extent to which employees are valued in the
company 5.77
The results from the table indicate that the distribution of ratings is negatively skewed, for
this category of questions. This is because most respondents assigned a high rating (5
and above) to the surveyed questions. However, distribution for both question 4 and 5
were more normal. Based on the analysis of responses, 97 per cent of respondents (5
and above rating) indicated that their business, generally has long standing relationship
with its employees.
In order to further investigate the level of interaction that exists between the business
and its employees, respondents were asked about the nature of internal marketing
programs that exists in the business. Only 30 per cent of respondents indicated that their
business has a formal internal marketing programme that provides information to all
employees. However, despite not having a formal programme, 60 per cent of
respondents indicated that their business communicates with employees on a daily to
monthly basis as illustrated in Figure 9, below.

58
Figure 9: The frequency of communication to all employees
Respondents stated the following about their employee relations:
“As a family business, we invest heavily in the professional and social relationship with
our employees, as they are a valuable resource”.
“Next to the family, our employees are the next important stakeholder. In fact in certain
situations the needs of the employees supersede those of the shareholder”.
“Our employees are family, some have been with the organisation since its inception and
they have a better institutional memory about the business. This characteristic is
important for transferring knowledge to new family members, who join the company”.
Algorithmic ranking test
In order to test the importance of employee relationship factors relative to each other, the
‘Solver’ algorithm in excel was utilised to determine the parameters of the mean (X2),
where the ρ-value is significant thus ensuring a goodness-of-fit between the surveyed
data and model. The table below illustrates the results from the algorithm, which have
been ranked in descending order. The result indicates that the long length of employee
relationship is the factor with the highest mean thus indicating that is the most important
factor, perceived by respondents.
Daily 20%
Monthly 40%
Quarterly 17%
Bi-annually 10%
Annually 3%
Not at all 10%

59
Table 13: Ranking of Means for Employee Relation Questions
Related Questions Means
In our firm, we have long standing relationships with
employees
0.578
In our firm, we regard employees as our best asset 0.336
Our employees are regarded as an extension of the family 0.138
In our firm, we encourage to develop both social and
professional levels of relationship with employees
-0.065
In our firm, we actively seek to develop both social and
professional employee relationship
-0.39
In our firm, we interact with the family members of our
employees
-0.594
ρ-value 0.99
Other Findings on Relationship Marketing
In order to ascertain, characteristics of relationship marketing not necessary in literature,
respondents were asked to describe relationship marketing, outside the context of
existing literature. Table 14 depicts a summary on the response to the question.

60
Table 14: Frequency counts of themes used to describe Relationship Marketing
Themes mentioned by respondents N = 17 Percentage
Thorough understanding of the client’s needs 3 18%
Personalised interaction (face-to-face engagements) 9 53%
Ensuring high levels of client satisfaction 5 29%
Some respondents highlighted that “the corner stone of any relationship marketing
strategy should be a good understanding of customer needs”.
4.4 Summary
This chapter presents the empirical data collected from respondents. It further describes,
in detail, the demographics of the respondents. This description includes ethnicity, the
age of the business, its generational stage as well as the industry in which the business
operates.
Data for each section of the questionnaire are presented. This was organised in such a
manner that aligns with each category of proposition being investigated. The last section
of the chapter presents findings from the respondents’ prospective that are not identified
in literature.
The subsequent chapter, Chapter 5, will analyse the data with the intension of deriving
insights on relationship marketing characteristics in family businesses.

61
5 ANALYSIS OF RESULTS
5.1 Introduction
The objective of this chapter is to discuss the key themes emulating from the collected
data. The purpose of the literature review is to establish the characteristics of relationship
marketing that exists in South African family businesses. This aligns with the survey
process, which is aimed at validating these characteristics, by obtaining perceptions and
beliefs from respondents regarding them.
The chapter begins by a brief presentation of the results from respondents on the
characteristics of marketing and relationship marketing, evident in their business. This is
followed by the interpretation of the results using both the qualitative and quantitative
methodologies. Comments from the transcribed interviews, was also utilised to provide
additional insight into each factor.
The chapter concludes by summarising the findings of the study.
5.2 Perception of Marketing
Table 4 depicts the key themes that were utilised by respondents to describe the type of
marketing strategies conducted by the business.
Qualitative Methodology
The description of marketing strategies provided by respondents suggests that the
majority of the businesses are either in the process of developing or have already
developed the capability in the business. Therefore, according to the developmental
cycle (section 2.4), the majority of the businesses surveyed are currently between the
early proactive marketing to the integrated proactive stages of the marketing cycle.
Further analysis indicates that the developmental stage is predominantly influenced by
three main factors, as follows:
The nature of the business;
The size of the business; and
The age of the business.

62
The industry that the business operates in provides an important context, as certain
sectors require a particular type of marketing. For example the nature of product
marketing conducted in the FMCG industry differs from the marketing conducted in the
banking sector. There is also a positive correlation between the age of the business (i.e.
3rd, 4th generation) and the level in which the marketing capability is established, in the
business. Hence, the longer the generation stage of the business the better developed
the marketing function in the business.
Based on the analysis, 26 per cent of the businesses surveyed conducted activities
relating to trade marketing. The rationale for this finding amongst the businesses
surveyed is that the majority of the business’s customers are companies and not retail
customers.
Another common strategy amongst the businesses is the use of word-of-mouth
marketing, particularly to attract new customers for the business. Most respondents
indicated that their business strives to provide a high quality of service to their
customers. Therefore, their reputation of providing a good service and customer
satisfaction is often shared by existing customers to prospective customers.
Furthermore, a respondent stated that “from a reputational prospective, the family and
business reputation are intertwined, hence a positive family reputation creates a platform
for the business to leverage”.
5.3 Perception of Relationship Marketing
Table 5 (on page 47) depicts the key themes that were utilized by respondents to
describe relationship marketing.
Qualitative Methodology
Fifty per cent of respondents define relationship marketing as a process that involves the
developing a long-term relationship with customers. The emphasis of the definition was
placed on the customer, this is supported by the following statement from a respondent
“the focus should be on the customer and seeing the customer as a partner. The
partnership creates the platform, for promoting products and services”.
Other definitions emulating from respondents include strategies that involve acquiring
and maintaining clients. Furthermore, some respondents believed that “clients can only

63
be retained if their needs have been satisfied”. Hence, this segment of respondent
centred the definition of relationship marketing on customer satisfaction.
Nineteen per cent of respondents broaden their definition of relationship marketing
beyond customers. These respondents emphasised that the principles of relationship
marketing are applicable to other stakeholders with whom business engages. For
example, developing a mutual relationship among employees and suppliers is critical for
the survival of the business.
These findings on the definition of relationship marketing are consistent with those
provided in literature (Kotler et al 2009; Grönroos, 1994; Morgan and Hunt, 1994).
However, not all respondents believed that the definition encompasses all stakeholders;
only a few respondents broadly defined relationship marketing in this context.
5.4 Validation of Propositions
5.4.1 Proposition One: Market Orientation
The following propositions identified in literature were put forward in this study.
1. South African family businesses have a low customer orientation.
2. South African family businesses have a low competitor orientation.
3. South African family businesses have a low inter-departmental coordination.
Table 6 depicts the rating averages in response to the market orientation questions and
in so doing, investigates the above propositions.
Qualitative Methodology
Narver and Slater (1990) provide three behavioural characteristic that a company should
incorporate into its decision making process that will ensure a better orientated
organisation, this includes: customer orientation, competitor orientation and inter-
departmental coordination. The analysis indicates that the business surveyed adopt a
selective approach to market orientation, as most of the business place an emphasis on
just the customer. The comments provided by a respondent below further substantiate
the finding.

64
“Market orientation is about understanding the environment, which includes influencing
factors, industry players as well as the customers. Most businesses then to just focus on
one aspect of the orientation; which is just the customer and neglect the other aspects”.
The researcher is of the opinion that the singular approach amongst the business
surveyed is attributable to a lack of resources and the systems required to support a
holistic market orientation approach. This corresponds with the literature provided by
Kohli et al. (1993) that resources, which includes money, managerial skill and time often
hinders the implementation of orientation in businesses. Hence, family businesses are no
different.
Customer centricity and complaints
Based on the analysis of responses, 90 per cent of respondents (5 and above rating)
indicated that their business has a high level of customer centricity. This finding is further
supported by 66 per cent of respondents, who agreed (5 and above rating) that their
business does encourage customers to complain. Interestingly, only 33 per cent of
respondents indicated that their business has a formal customer complains policy, which
is contradictory.
Hence, these finding suggests that although the surveyed businesses adopt practices
that support customer centricity, however such practices are not formally documented in
the business. The lack of an established formal process regarding customers relates to
governance. Family businesses, particularly the younger business, lack good
governance. However, this improves as the business becomes more institutionalised.
Competitive factors and environmental scanning
Seventy-three per cent of respondents (5 and above rating) indicated that their business
conducts some sort of competitive and industry analysis when formulating their business
strategy. However, despite this high citation, only 43 per cent of respondents agreed that
the decision taken within the business is informed by the results of the analysis. This
finding may be interpreted that the businesses surveyed do not fully adopt the
competitive aspects of market orientation.
This finding supports the quantitative examination by Zachary et al (2011), who found
that family businesses have a lower market orientation than non-family businesses.
65
Furthermore, they are conventional to respond to competition in the market place (Zahra
et al., 2008).
Quantitative Methodology
Algorithmic ranking test
In order to further test the findings from the content analysis, an algorithmic ranking test
was conducted on the survey data. Table 7 (on page 49) depicts the highest market
orientation factor ranked by respondents. The result indicates that customer centricity is
the factor with the highest mean, thus indicating that is the most important factor, as
perceived by respondents. This supports the findings from the content analysis
conducted.
Summary
In summary, the results from both methodologies are consistent, as they suggest that the
businesses surveyed have a high orientation towards their customers. This substantiates
the literature provided by Tokarczyk et al (2007) and Cooper et al (2005) that family
businesses cultivate deep relationships with customers. Conversely, the combined
analysis also suggests that family businesses have a neutral to low competitor
orientation as well as inter-departmental coordination, which appears to be consistent
with other literature.
5.4.2 Proposition Two: Customer Retention
The following propositions identified in literature were put forward in this study.
4. South African family businesses cultivate long term relationship with customers.
5. South African family businesses have a high customer retention rate.
Table 8 (on page 50) depicts the rating averages in response to the customer retention
questions and in so doing, investigates the above propositions.

66
Qualitative Methodology
The analysis suggests that the retention of customers is a key component, amongst the
surveyed businesses. Family business, in particular the younger businesses (i.e. below
2nd generation) rely on retention strategies to survive. Often such businesses are
founded with a small segment of customers that contribute significantly to the profitability
of the business. Hence, the culture of retention is built into the DNA of the business at
the start-up phase of the business, which carries through to its maturity. The comments
provided by a respondent below further substantiate the finding.
“Every business, including family businesses should strive to retain a healthy ratio of
their customer base. In our organisation we strive to retain 40% of existing customers, as
they contributed 80% of the business’s total revenue. Customer retention also creates an
annuity income that becomes the foundation for the business”.
The comment emphasizes the focus on retention and how it creates value for the
business in the long term. This finding is supported by the literature suggested by Ang
and Butter (2006) which states that customer churn is a major value destroyer in an
organization and the key towards preventing it, is to avoid the attrition of the right
customers by establishing a long term relationships with them.
Customer commitment
Based on the analysis of the responses, 96 per cent of respondents (5 and above rating)
indicated that their business maintains a long term relationships with their customers. In
certain cases the length of the relationship spans over 10 years. Furthermore, 86 per
cent of respondents (5 and above rating) indicated that their business has a high level of
commitment to customers. This finding is supported by the medium to high allocation of
managerial time towards making decisions on customer relationship, as illustrated in
Figure 8 (on page 52). This indicates that the culture of commitment towards the
customer translates into how managers in the surveyed businesses spend their time.
Customer retention

67
Ninety-six per cent of respondents (5 and above rating) agreed that customer retention is
a critical component of their business strategy. This is consistent with the average
customer retention rate amongst the surveyed businesses of 75 per cent. With regard to
the allocation of marketing resources between attracting and retaining existing
customers, the analysis indicates that 77 per cent of the marketing budget of the
businesses surveyed is spent on retaining versus attracting. Some of the common
strategic levers utilised for retention, as stated by respondents includes:
Relationship pricing;
High service and product quality; and
Personalised interactions.
Interestingly, only 33 per cent of respondents indicated that their business has a formal
customer complaints policy. The researcher is of the opinion that this low percentage
may be attributable to the size and organisational maturity of the businesses.
Customer value creation
Ninety-six per cent of respondents (5 and above rating) agreed that their business is
continuously looking for ways to create customer value in the products and services that
they provide to customers. Respondents also “indicated that continuous value creation is
achieved through various factors, depending on the nature of the business”. However,
the following are important ingredients for value creation:
An intimate understanding of customers and their needs. This not only involves
satisfying the present needs of the customer but also anticipating what the future
needs will be.
Product and service innovation, as a service provider must continuous improve on the
value delivered to customers.
A proactive relationship management approach with customers.
68
Quantitative Methodology
Algorithmic ranking test
In order to further test the findings from the content analysis, an algorithmic ranking test
was conducted on the survey data. Table 9 (on page 53) depicts the highest customer
retention factor ranked by respondents. The result indicates that the retention of
customers being a critical component of the business strategy is the factor with the
highest mean, thus indicating that this is the most important factor, as perceived by
respondents. This supports the findings from the content analysis conducted.
Furthermore, the high evidence of commitment towards customers and retention of
customers through value creation, amongst the surveyed business, suggests that such
businesses believe in the principles presented by Kotler et al (2009) that it is more
expensive to attract new customers than it is to retain existing customers. Hence,
retention creates value whilst customer churn destroys organisational value.
Summary
In summary, the results from both methodologies are consistent: they suggest that the
businesses surveyed have a high retention of their customers. This supports the
literature provided by Tokarczyk et al. (2007) and Cooper et al. (2005) that family
business cultivate deep relationships with customers. This customer centric culture
translates into a high level of commitment that the surveyed business exhibit towards
customers.
Great emphasis is being placed on retention because it is perceived that it creates value
for the business in the long term.
5.4.3 Proposition Three: Customer Satisfaction
The following propositions identified in literature were put forward in section 2.8 of this
study.
6. South African family businesses cultivate and maintain good relations with
customers.
7. South African family businesses measure the level of satisfaction of their
customers.

69
Table 10 (on page 54) depicts the rating averages in response to the market orientation
questions and in so doing, investigates the above propositions.
Qualitative Methodology
“In order for any organisation to be successful in satisfying its customers, it has to be
entrenched in the values and DNA of the organisation. This way it forms part of how the
organisation as a whole operates. Secondly, organisations that are successful in
satisfying external customers are good at satisfying the needs of internal customers.
Internal customers are employees in an organisation who provide services to one
another”.
The comment above from a respondent emphasizes two key points, which is firstly the
culture of an organisation contributes to the level of satisfaction that customers
experience from an organisation. Secondly, culture of satisfaction should be evident in
the manner that employees interact with each other, in the organisation. By adopting
these principles, family businesses are able to distinguish themselves from non-family
businesses.
Customer satisfaction
Based on the analysis of responses, 94 per cent of respondents (5 and above rating)
agreed with the definition of quality, suggested in the questionnaire, which is ‘quality is
the extent to which our customers are satisfied with our products and services’. Some
respondents even stated that “service and product quality should be the cornerstone of
any customer retention strategy”. Aligned with this definition, 97 per cent of respondents
(5 and above rating) perceived the level of customer satisfaction on the products and
services that their business provides is high. This finding is further supported by the
following:
The high level of repeat purchases made by existing customers of the surveyed
businesses (as 97 per cent of respondents assigned a 5 and above rating, when
asked the question).

70
The high referral rate of new clients made by existing customers in the surveyed
business (as 97 per cent of respondents assigned a 5 and above rating, when asked
the question).
Hence, collectively these findings suggest that the level of customer satisfaction in the
business surveyed is high.
Level of satisfaction assessment
Only 46 per cent of respondents (5 and above rating) indicated that their business
conducts an assessment on the level of customer satisfaction, at least quarterly. Some
respondents stated that “their assessment is normally conducted, annually”. Albeit, a low
per cent the researcher is of the opinion that this may be attributable to the size and
organisational maturity of the businesses surveyed. The low per cent suggest that the
surveyed businesses are not proactive enough in meeting the needs of their customers.
Conversely, 73 per cent of respondents (5 and above rating) indicated they regularly
assess complaints received by customers. This high percentage suggests that the
surveyed businesses are proactive during the course of resolving of complaints from
customers.
These findings suggest that the businesses surveyed adopt a more reactionary
approach, when assessing issues that influence customer satisfaction and only become
more proactive during the course of resolving complaints. The researcher is of the
opinion that such an approach could hinder their ability to retain customers in the long
run.
Quantitative Methodology
Algorithmic ranking test
In order to further test the findings from the content analysis, an algorithmic ranking test
was conducted on the survey data. Table 11 (on page 55) depicts the highest customer
satisfaction factor ranked by respondents. The result indicates that the level of repeat
purchases made by existing customers is the factor with the highest mean, thus
indicating that it is the most important factor, as perceived by respondents. This supports
the findings from the content analysis conducted.

71
Summary
In summary, the results from both methodologies are consistent; they suggest that the
customer satisfaction level amongst the businesses surveyed is high. This supports the
literature provided by Tokarczyk et al. (2007) and Cooper et al (2005) that family
businesses cultivate deep relationships with customers. Conversely, the combined
results in this section, also suggests that family businesses are reactive in managing the
relationship with customers. A more proactive approach is predominantly adopted during
the process of resolving a complaint. In order words, outside of a situation that involves a
complaint by a customer, family businesses are reactive when managing the relationship
with customers.
5.4.4 Proposition Four: Employee Relations
The following propositions identified in literature were put forward in section 2.8 of this
study.
8. South African family businesses cultivate good relations with their employees.
9. South African family businesses have a long standing relationship with their
employees.
10. South African family businesses cultivate multiple levels of relationship with their
employees; this includes both professional and personal bonds.
Table 12 (on page 56) depicts the rating averages in response to the employee
relationship questions and in so doing, investigates the above propositions.
Quantitative Methodology
According to Zachary et al. (2011), family business typically cultivates and nurtures long-
standing relationship with employees that spans across multiple generations. The
analysis indicates that the businesses surveyed value the contributions that employees
make to the business. In addition, the relationship between the two is often viewed as a
beneficial partnership. The comments provided by respondents below further
substantiate the finding.
“Next to the family, our employees are the next important stakeholder. In fact in certain
situations the needs of the employees supersede those of the shareholder”.

72
“Our employees are family, some have been with the organisation since its inception and
they have a better institutional memory about the business. This characteristic is
important for transferring knowledge to new family members, who join the company”.
The comments suggest that a family relationship is often established with employees,
particularly those that have employed by the business, for long time. Furthermore, in a
family business, employees are regarded just as important as shareholders.
Length of relationship
Based on the frequency counts of responses, 97 per cent of respondents (5 and above
rating) indicated that their business, generally has long standing relationship with its
employees. This finding is further supported by the following:
The average employee turnover ratio for the businesses surveyed is 20 per cent.
Further analysis indicates the turnover ratio for the large-sized businesses surveyed
was generally lower than those of the small and medium-sized businesses.
The total average employment period for full-time employees amongst the
businesses surveyed is 9 years.
Hence, collectively these findings suggest that the businesses surveyed maintain a long-
term relationship with their employees. According to Gummesson (2002), a good
indicator of an organisation’s relationship with customers can be determined by the
health of the relationship that it has with its employees. Furthermore, a good employee
relationship is an antecedent for customer satisfaction.
Multiple levels of relationship
Seventy-three per cent of respondent (5 and above rating) indicated that their business
develops both professional and social relationships with its employees. According to a
respondent, “this approach enables the business to foster a stronger bond with its
employees”. Furthermore, 53 per cent of respondents indicated that the culture of the
organisation supports establishing multiple levels of relationship with employees. This
finding is also consistent with 77 per cent of respondents (5 and above rating), who
agreed that employees are regarded as an extension of the family. The multiple levels of
relationship ensure that there is commitment between the business and its employees.
This often motivates both parties to strive for a high customer service.

73
The ability of family businesses to develop deep social capital with employees is a
competitive advantage that family businesses have over non-family business.
Employee communication
George (1990) claims that an effective internal marketing program is a perquisite for a
successful marketing strategy with external stakeholders. Findings from the surveyed
businesses does not support this claim as only 30 per cent of respondents indicated that
their business has a formal internal marketing programme that provides information to all
employees. Further analysis indicates a formal programme was more prevalent with the
larger size of businesses surveyed, whilst, the smaller businesses rely more on informal
programmes to communicate with employees. However, despite not having a formal
programme, 60 per cent of respondents indicated that their business communicates with
employees on a daily to monthly basis as illustrated in Figure 9 (on page 58).
Quantitative Methodology
Algorithmic ranking test
In order to further test the findings from the content analysis, an algorithmic ranking test
was conducted on the survey data. Table 13 (on page 59) depicts the highest employee
relationship factor ranked by respondents. The result indicates that the long length of
employee relationship is the factor with the highest mean, thus indicating that is the most
important factor, as perceived by respondents. This supports the findings from the
content analysis conducted.
Summary
In summary the results from both methodologies are consistent; they suggest that
employee relationship amongst the surveyed family businesses is good. This supports
the literature provided by Zachary et al. (2011) and Dyer (2006) that family business
cultivates deep relationships with employees. However, the lack of a formal internal
marketing programme appears to be consistent with the literature provided by
Habbershon and Williams (1999) that such businesses may not be very inclusive, when
making decisions in the business.

74
Further practical observation indicates that older family businesses (i.e. beyond 3rd
generation) have more formal internal marketing programs established in the business.
This is because at this stage of its evolution, the business is different to when it was
founded. It may still have some family business characteristics but it has transformed into
a hybrid of both family business and a professional institution.
5.5 Other findings of Relationship Marketing
Table 14 (on page 60) presents other characteristics of relationship marketing, identified
by respondents but was not necessarily raised in literature.
Respondents highlighted that the corner stone of any relationship marketing strategy
should be a good understanding of customer needs. A respondent stated that “too often
businesses are not close enough to their customers, this leads to unmet expectations in
the service or products that they deliver”. Hence, a good understanding is required on
both the short-term as well as the long-term needs of customers. This ensures that there
is continuous improvement on what is delivered to the customer.
Subsequent to obtaining a strategic understanding on the needs of the customer,
respondents indicated that the insight should lead to the tailoring of engagements with
the customer. This is particularly important in the context of relationship marketing. Some
respondents stated that the “use of customer relationship management (CRM) tools have
better enabled their business to personalise their marketing to customers”. Therefore,
this leads to a high level of customer satisfaction from the products and services that
their business provides.
5.6 Summary
This chapter analysed the empirical data from respondents, presented in chapter 4. The
results of the analysis were discussed in the context of the relationship marketing
propositions presented in Chapter 2.
After careful consideration of the analysis, the following is a summary of the findings:

75
According to the developmental cycle (explained in section 2.4, of study), the majority
of the businesses surveyed are currently between the early proactive marketing and
the integrated proactive stages of the marketing cycle.
The definition of relationship marketing utilised by respondents, is consistent with the
definitions in literature.
With regard to customer orientation, results from both methodologies utilised in the
study indicates that the businesses surveyed have a high orientation towards
satisfying and retaining customers.
With regards to employee relationships, results from both methodologies utilised in
the study, indicate that such relationships amongst the surveyed businesses are
good.

76
6 CONCLUSION AND RECOMMENDATIONS
6.1 Introduction
According to the Department of Trade and Industry (DTI) (2004), it is estimated that there
is a total of 1.42 million active businesses in South Africa, 84 per cent of which are
classified as ‘family businesses’. Internationally, family businesses account for 70 per
cent of all international businesses and 35 per cent of Fortune 500 companies (Balshaw,
2004). Despite their economic importance, family businesses still find marketing to be a
challenge.
Relationships are at the heart of family businesses (Petzinger, 1999; Cooper et al.,
2005). This is because the fundamental DNA of a family business is based on a
symbiotic relationship between the family and the business. Families, by virtue of their
DNA, cultivate deep relationships with people, which include customers, suppliers and
even competitors. Hence, in a family business context, these values are transferred into
business by the associated family. This relational approach is often utilised in the
marketing strategies that they adopt.
The purpose of this study is to investigate some of the characteristics of relationship
marketing that exist in South African family businesses. In order to achieve this objective
a range of propositions were presented and investigated with respondents from various
South African family businesses.
The chapter summarises the results of the propositions investigated. These findings are
then followed by recommendations which are centred on the insights obtained from
interaction with the businesses surveyed. The chapter closes by listing areas for further
research.
6.2 Strength of Support for Proposition One: South African family
businesses have a low market orientation
With regards to proposition one, the study found the following:

77
The businesses surveyed have a high orientation towards their customers. This
supports the literature provided by Tokarczyk et al. (2007) and Cooper et al (2005)
that family businesses cultivate deep relationships with customers.
The businesses surveyed had a low competitor orientation as well as inter-
departmental co-ordination, which appear to be consistent with the literature provided
by Zachary et al. (2011) and Short et al. (2008).
Hence, based on the combined findings, there was no substantial evidence from the
study to disqualify proposition one, therefore suggesting that despite their high
orientation towards customers, in general, South African family businesses may have a
low market orientation.
6.3 Strength of Support for Proposition Two: South African family
business have a high retention of their customers
The study found substantial support for this proposition from respondents. This
conclusion was deduced from the following:
Amongst the businesses surveyed, there was evidence of a high level of commitment
towards their customers. This evidence was inferred from 96 per cent of the surveyed
businesses that maintained a long term relationship with their customers. Furthermore,
86 per cent of the surveyed businesses had high level of commitment towards their
customers. This commitment was reflected in the process of continuous value creation,
through the products and services that they provide to customers.
In addition there was evidence of a high level of customer retention amongst the
businesses surveyed. This evidence was inferred from the average customer retention
rate amongst the surveyed businesses of 75 per cent and the 77 per cent allocation of
their marketing resources towards retaining versus attracting customers.
This finding is consistent with several literatures which state that relationships are at the
heart of family businesses and they cultivate deep relationships with customers (Copper
et al. 2005; Tokarczyk et al. 2007; Ward 1988).

78
6.4 Strength of Support for Proposition Three: South African family
businesses have a high customer satisfaction levels
With regards to proposition three, the study found the following:
The businesses surveyed had a high level of repeat purchases by existing customers.
Furthermore, the study found a high level of referrals made by existing customers to
prospective customers. Hence, from these findings it may be inferred that there is a
high level of satisfaction amongst their customers.
A few of the businesses surveyed had a formal customer complaints policy and
conduct a formal assessment on the level of customer satisfaction, at least quarterly.
Therefore, the combination of delayed assessment on satisfaction levels as well as
the lack of a complaints policy, suggests that family businesses maybe reactive in
managing relationship with customers.
Hence, based on the combined findings, the study found a fair amount of support for this
proposition, therefore suggesting that although South African family businesses, in
general possess a high level of customer satisfaction. However, this can vary depending
on the business. In other words, certain businesses operating in one sector may have a
different level of customer satisfaction than other family businesses operating in another
sector.
6.5 Strength of Support for Proposition Four: South African family
business have a good employee relations
The study found substantial support for this proposition from respondents, as there was a
healthy relationship between business surveyed and their employees. This conclusion
was deduced from the following:
Amongst the surveyed business there was evidence of a long standing relationship with
employees. This evidence was inferred from 97 per cent of the surveyed businesses that
have a long standing relationship with their employees, which was further, supported by
a low employer turnover rate.
There was evidence of both professional and social levels of relationship being
developed with employees amongst the surveyed businesses. This evidence was

79
inferred from the 73 per cent of the surveyed business that adopt such approach with
regards to their employees. Furthermore, 53 per cent of the businesses stated that such
relational approach was entrenched in the culture of their organisation.
However, there was limited evidence of a formal internal marketing programme that
provides information to all employees. This conclusion was reached because only 30 per
cent of the surveyed business had formal internal marketing programme that provide
information to all employees.
These findings are consistent with several literatures which state that relationships are at
the heart family businesses and they cultivate deep relationships with stakeholders
involved in the business.
6.6 Recommendations to Management
The contents of this study would assist owners and managers of family businesses,
when developing appropriate marketing strategies for their businesses.
The results of the study indicates that family businesses have a high orientation towards
their customers but are less proficient regarding competitor orientation and inter-
departmental co-ordination. Hence, family businesses should be cognisant that although
market orientation deals with the total alignment of a company’s business function
towards the satisfaction of a consumer need; however, it is not just about customers. For
example, a good orientation on competitors enables companies to identify and exploit
weaknesses exhibited by competitors, in the market. This, in turn, enables the
organisation to meet customer needs and wants better than its competitors. Therefore, it
makes sense to adopt a holistic approach when satisfying the needs of customers.
Despite having an organisational culture that is customer centric, the findings from the
study indicate that a lot of customer related policies are often not formalised and
documented, in family businesses. This shortcoming makes it difficult to make customer
related decisions that are consistent and most importantly, aligned with the
organisational strategy. Therefore, such misalignment could potentially threaten the
sustainability of the business. Hence, it is important to note that as the business
transitions into multiple generations of owners, instilling appropriate governance in the
business becomes critical for its success.

80
Family businesses cultivate and maintain a healthy relationship with employees; as such
relationships is an antecedent for customer satisfaction. However, family businesses are
still perceived be exclusive when making key decisions in the business. This approach
limits the ability of nonfamily employees to contribute in the business. This in turn
influences their ability to be optimal part-time marketers when managing relationships
with customers. Therefore, an ineffective internal marketing programme leads to an
unsuccessful marketing strategy with external stakeholders. Family businesses should
strive towards formalising their communication to all employees and in so doing, create
an environment of inclusiveness.
Lastly, the study highlights that family businesses who currently are adopting relationship
marketing strategies are benefiting. As businesses that adopt this approach to marketing
benefit from high levels of customer satisfaction, which leads to retention. Furthermore,
the more customers that are retained, the more referrals they make. This observation
presents an opportunity for those businesses who haven’t adopted relationship
marketing. Hence, businesses seeking to adopt this approach, should consider the
following (Juttner and Wehrli, 1994):
Knowing the customer well;
Focus on providing service quality; and
Developing value-add services.
Having highlighted the importance of relationship marketing in family businesses, there is
still a place for other forms of marketing in the overall strategy. Therefore, a combination
of marketing strategies (i.e. transactional and relationship marketing) should be
considered, in order to create a solution that is appropriate for the business.
6.7 Suggestions for Further Research
The current sample of 30 respondents could be perceived as a limitation. Further
research could be conducted on a wider sample of family businesses in a particular
sector. In order to obtain in-depth knowledge of the methodologies common to the sector
being assessed

81
This study can be replicated only on certain generations of respondents. It would be
interesting to obtain an in-depth knowledge regarding the perceptions of just second- or
third-generation respondents.
This study can be replicated only on certain cultural groups in South Africa. It would be
interesting to analyse and compare best practices identified by respondents from
different cultural groups (i.e. Indian and Jewish cultures).
This exploratory study employed mainly qualitative methods. Further research employing
more quantitative techniques could provide valuable insights.

82
REFERENCES
Ang, L. and Buttle, F. (2006). “Customer Retention Management Processes: A
quantitative study”, European Journal of Marketing, Vol. 40, No 1, pp. 83 – 99.
Balshaw, T. (2004). Family Businesses in South Africa: Where family business is a
diamond forever, Retrieved 1 January, 2012 from http://www.familybizz.net/res-
southafrica.asp.
Baker, M.J. and Saren, M. (2010). Marketing Theory: A Student Text, 2nd Edition, Sage
Publications, London.
Bendixen, M. and Sandler, M. (1995). “Converting verbal scales to interval using
correspondence analysis”, Journal of management dynamics, Vol. 4, No 1, pp. 32 – 50.
Bhide, A. (1994). “How entrepreneurs craft strategies that work”, Harvard Business
Review, March, pp. 150 – 161.
Blomqvist, R. Dahl, J. and Haeger, T. (1993). Relationship Marketing: strategy, and
methods for service competition, IHM Förlag, Göteborg.
Bork, D. (1993). Family Business, Risky Business: How to make it work, Bork Institute for
Family Business.
Carson, D. (1990). “Some Exploratory Models for Assessing Small Firms’ Marketing
Performance: A Qualitative Approach”, European Journal of Marketing, Vol. 24, No 11,
pp. 8 – 51.
Carson, D. (1985). “The evolution of marketing in small firms”, European Journal of
Marketing, Vol. 19, No 5, pp. 7 – 16.
Carson, D. and Hill, J. (1992). Marketing education for entrepreneurs. Proceedings of
The International Council For Small Business 37th World Conference, Toronto, June, pp.
607–631.
Christopher, M. Payne, A.F.T. and Ballantyne, D. (1991). Relationship Marketing: bring
quality, customer service and marketing together, Oxford Butterworth-Heinemann.

83
Churchill, N.C. and Lewis V.L. (1983). “The five stages of small business growth”,
Harvard Business Review, May, pp. 30 – 49.
Cooper, M.J. Upton, N. and Seaman, S. (2005). “Customer Relationship Management: A
comparative analysis of family and nonfamily business practices”, Journal of small
business management, Vol. 43, No 3, pp. 242 – 256.
Cooper, D.R. and Schindler, P.S (2007). Business Research Methods, 9thEdition,
McGraw-Hill.
Colorado State University (CSU), Retrieved 23 December 2013 from
http://writing.colostate.edu/guides/research/relval
Crosby, L.A. (2002). “Exploding some myths about customer relationship management”,
Managing Service Quality, Vol. 12, No 5, pp. 271 – 277.
Department of Trade and Industry (DTI). retrieved 1 January 2012 from
http://www.dti.gov.za.
Denzin, N.K. and Lincoln, Y.S. (2000). Handbook of Qualitative Research, 2nd Edition,
Sage Publications Inc.
Devers, K.G. and Frankel, R.M. (2000). “Study design in qualitative research 2: Sampling
and data collections strategies”, Education for Health, Vol. 12, pp.263 – 271.
Dickinson, T.M. (2000): Critical success for succession planning in family businesses,
Master of Business Administration Thesis, University of Witwatersrand, Johannesburg.
Drucker, P.F. (2001). The Essential Drucker, 1st Edition, HarperCollins Publishers.
Du Plessis, P.J. Strydom, J.W. and Jooste, C.J. (2011). Marketing Management, 6th
Edition, Juta Publishers.
Dyer, W.G. (2001). “Network marketing: An effective business model for family-owned
businesses?”, Family Business Review, Vol. 14, pp. 97 – 104.
Eboru, R. (2007): Factors influencing intergenerational succession in South African
family businesses, Master of Business Administration Thesis, University of
Witwatersrand, Johannesburg

84
Eybers, C. (2010). Copreneurships in South African Small and Medium-Sized Family
Businesses, Master of Commerce Thesis, Nelson Mandela Metropolitan University, Port
Elizabeth.
Fisher, R.J. Maltz, E. and Jaworski, B.J. (1997). “Enhancing communication between
marketing and engineering: the moderating role of relative functional identification”,
Journal of Marketing, Vol. 61, pp. 54 – 70.
Friedman, S.E. (1998). The successful family business. Dearborn Financial Publishing.
Chicago.
George, W. (1990). “Internal marketing and organizational behaviour: A partnership in
developing customer-conscious employees at every level”, Journal of Business
Research, Vol. 20, No 1, pp. 63 – 70.
Grönroos, C. (1994). “From Marketing Mix to Relationship Marketing: Towards a
paradigm shift in marketing”, Management Decision, Vol. 32, pp. 4 – 20.
Gummesson, E. (2002). “Relationship Marketing in the New Economy”, Journal of
Relationship Marketing, Vol. 1, pp. 37 – 57.
Habbershon, T.G. and Williams, M.L. (1999). “A resource-based framework for
assessing the strategic advantages of family firms”, Family Business Review, Vol. 12, pp.
1 – 22.
Hansemark, O.C. and Albinsson, A. (2004). “Customer satisfaction and retention: the
experience of individual employees”, Managing Service Quality, Vol. 14, pp. 40 – 57.
Harris, D. Martinez, J.I. and Ward, J.L. (1994). “Is strategy different for the family-owned
business?”, Family Business Review, Vol. 7, pp. 159 – 174.
Hill, J. (2001). “A Multidimensional study of the key determinants of effective SME
marketing activity: Part 1”, International Journal of Entrepreneurial Behaviour &
Research, Vol. 7, No 5, pp. 171 – 204.
Hooley, G. and Saunders, J. (1993). Competitive positioning: A key to marketing
success, Prentice Hall, London.

85
Ibrahim, A.B. and Ellis, W. (2003). Family Business Management: Concepts and
Practice, Kendall/Hunt, Dubuque, IA.
Juttner, U. and Wehrli, H.P. (1994). “Relationship marketing from a value system
perspective”, Industrial Journal of Service Industry Management, Vol. 5, pp. 54 – 73.
Kohli, A.K. Jaworski, B.J. and Kumar, A. (1993). “MARKOR: a measure of market
orientation”, Journal of Marketing Research, Vol. 30 No 4, pp. 467 – 477.
Kolter, P. and Keller, K.L. and Brady, M. and Goodman, M. and Hansen, T. (2009).
Marketing Management, 1st Edition, Pearson Education Limited.
Labovitz, S. (1970). “The assignment of numbers to rank order categories”, The
American Sociological Review, Vol. 35, pp. 515 – 524.
Leedy, P.D. and Ormrod, J.E. (2001). Practical Research: Planning and Design, 7th
Edition, Merill Prentice Hall, New Jersey.
Levitt, T. (1983). “After the sale is over”, Harvard Business Review, Vol. 61, pp. 87 – 93.
Lewis-Enright, C. (2006). Determinants of success for medium-sized family-run
businesses in South Africa, Master of Business Administration Thesis, University of
Witwatersrand, Johannesburg.
McDonald, M. (2002). Marketing Plans, 5th Edition, Elsevier Publishers.
Merriam, S.B. (1998). Qualitative Research and Case Study Applications in Education,
2nd Edition, Wiley.
Miles, M.B. and Huberman, A.M. (1984). Qualitative Data Analysis, Sage Publications
Inc, London.
Morgan, R.M. and Hunt, S.D. (1994). “The commitment-trust theory of relationship
marketing”, Journal of Marketing, Vol. 58, pp. 20 – 38.
Morgan, R.E. and Strong C.A., (1998). “Market orientation and dimensions of strategic
orientation”, European Journal of Marketing, Vol. 32 No 11, pp. 1051 – 1073.

86
Narver, J.C. and Slater, S.F. (1990). “The effect of a market orientation on business
profitability”, Journal of Marketing, Vol. 54, pp. 20 – 35.
Neubauer, H. (2003). "The dynamics of succession in family businesses in Western
European countries", Family Business Review, Vol.16, No.4, pp.269-281.
Petzinger, T.Jr. (1999). The New Pioneers: The man and women who are transforming
the workplace and marketplace, Simon & Schuster.
Reuber, A.R. and Fischer, E. (2011). “Marketing (in) the Family Firm”, Family Business
Review, Vol. 24, pp. 193 – 194.
Saunders, M. and Lewis, P. (2012). Doing Research in Business & Management: An
essential guide to planning your project, Pearson Education Limited.
Scase, R. and Goffee, R. (1982). The Entrepreneurial Middle Class, Croom Helm,
London.
Schmitt, N. and Klimoski, R.J. (1991). Research Methods in Human Resources
Management, Ohio, Cincinnati.
Scott, M. and Bruce, R. (1987), “Five stages of growth in small businesses”, Long Range
Planning, Vol. 20, No 3, pp. 45 – 52.
Short, J.C. Payne, G.T. Brigham, K.H. Lumpkin, G. and Broberg, J.C. (2009). “Family
firms and entrepreneurial orientation in publicly traded firms: A comparative analysis of
the S&P 500”, Family Business Review, Vol. 22, pp. 9 – 24.
Siu, W. and Kirby, D.A. (1998). “Approached to small firm marketing: A critique”,
European Journal of Marketing, Vol. 32, pp. 40 – 60.
Stacey, A.G. (2005). "The reliability and validity of the item means and standard
deviations of ordinal level response data", Journal of Management Dynamics, Vol.14,
No.3, pp.2 - 25.
Stafford, K. Duncan, K.A. Dane, S. and Winter, M. (1999). "A research model of
sustainable family businesses", Family Business Review: Journal of family firm institute,
Vol.12, No.3, pp.197.

87
Swartz, S. (2006). The Challenge of Family Owned Business: It’s not just about the
family, Retrieved January 10, 2007 from http://www.icfib.com/fb_library.php
Tagiuri, R. and Davis, J.A. (1992). "On the goals of successful family companies", Family
Business Review: Journal of family firm institute, Vol.5, No.1, pp.43.
Tokarczyk, J. Hansen, E. Green, M. and Down, J. (2007). “A resource-based view and
market orientation theory examination of the role of ‘families’ in family business success”,
Family Business Review, Vol. 20, pp. 17 – 31.
Venetis, K.A. and Ghauri, P.N. (2004). “Service quality and customer retention: building
long-term relationships”, European Journal of Marketing, Vol. 38 No 11, pp. 1577 – 1598.
Ward, J. (1988). “The special role of strategic planning for family business”, Family
Business Review, Vol. 1, pp. 105 – 118.
Ward, J.L. (1997) Keeping the Family Business Healthy: How to plan for continuing
growth, profitability and family leadership, Family Enterprise Publishers.
Zachary, M.A. Mckenny, A. Short, C.J. and Payne, G.T. (2011). “Family Business and
Market Orientation: Construct Validation and Comparative Analysis”, Family Business
Review, Vol. 24, pp. 233 – 251.
Zahra, S.A. Hayton, J.C. Neubaum, D.O. Dibrell, C. and Craig, J. (2008). “Culture of
family commitment and strategic flexibility: The moderating effect of stewardship”,
Entrepreneurship Theory and Practice, Vol. 32, pp. 1035 – 1054.
Zikmund, W.G. (2003). Business Research Methods, 7th Edition, South Western
Thomson.

88
APPENDIX 1: INTRODUCTORY LETTER & QUESTIONNAIRE
Dear Sir/Madam
MMSM Project Report for Graduate School of Management
I am an MMSM student at the Graduate School of Management, University of
Witwatersrand. I am currently undertaking a Project Report in partial fulfilment of
requirements for the degree. The School places great emphasis on this type of research,
which forms a significant part of the course.
I am investigating Family Business in South Africa and would like to include your family
controlled business in my research. This will entail the completion of a questionnaire,
which should take no longer than 30 minutes to complete. I have attached a copy of the
questionnaire, which can be returned to me via email ([email protected]) or post.
My project report is titled: “An investigation into Relationship Marketing in South
African Family Businesses”. I understand that some of the information supplied may
be of a confidential nature and as such, all information will be dealt with on a strictly
confidential basis.
I thank in advance, for your assistance and cooperation with the above request.
Yours Sincerely
Rolland Eboru

89
Relationship marketing is defined as the type of marketing that focuses on building long
term relationships with customers, individually. Some of the key characteristics of
relationship marketing include; customer retention, customer satisfaction, and fostering
long term relationships with employees. The purpose of this questionnaire is to
investigate these characteristics in family businesses in South Africa.
SECTION A
Please complete this section of the questionnaire to aid in the analysis of the results.
Responses are confidential.
Name of contact: ______________________________________
Name of business: _____________________________________
Address: _____________________________________________
Email Address: ________________________________________
Telephone no: ________________________________________
Gender: Male ______ Female ________
AGE GROUP
18-24
25-34
35-49
50+
TITLE/DESIGNATION
CEO/ Managing Director
Marketing Director
Marketing Manager
Other ________________________

90
Section 2: Company Demographic information
This section of the questionnaire should be completed in relationship to the company that the respondent is associated with.
1) How many years has the business been in existence? _____________
2) Please state the nature of industry the company operates in (e.g. manufacturing, farming)
___________________________________________________
3) What percentage of the business is owned or controlled by a family? ___________
4) Please state the (family) generational stage of the business: (1st, 2nd, 3rd etc.) ______
5) Please indicate the ethnic background of your family: (Black, Asian, white) ______
6) Please provide an indication of the company’s turnover
Amounts
≤ R10m
R11m – R50m
R51m – R150m
R151m – R350m
R351m – R500m
R501m – R1bn
> R1bn
7) What is the total number of full time employees, employed by the company: ____
SECTION B: Relationship marketing questions
This section assesses the characteristics of relationship marketing in the company.
Please indicate to what extent the does your business firm engage in the following practices, the rating 1 – low to 7 - high: (Please relate each statement to your company as it currently exists.)

91
1 2 3 4 5 6 7
I Customer retention questions
1. In our firm, we have a strong commitment to our customers
2. This customer commitment, is also reflected in the marketing budget allocated to segment relationship with existing customers
3. Our firm on average, has a long standing relationship with its high value customers
4. In our firm, a good percentage of our customer base is retained annually
5. Retaining customers is an important part of our business strategy
6. In our firm, managerial time is spent on discussing and making decisions about customers in meetings
7. Our firm would be a lot better off if the sales forces retained more clients
8. We are always looking at ways to create customer value in our product
II Customer satisfaction questions
9. We assess the compliants received from our customers on a regular basis
10. We define quality as an extent to which our customers are satisfied with our products
11. The current level of customer satisfaction for our products and service is
12. In our firm, new customers are continously referred to us by existing customers
13. The level of repeat purchases by existing customers in our firm is
14. Our firm assesses/measures the level satisfaction of our customers, at least once every three months
III Employee relationship questions
15. In our firm, we have long standing relationships with employees
16. In our firm, we encouraged to develop both social and professional levels of relationships with employees
17. Our employees are regarded as an extension of the family
18. In our firm, we interact with family members of our employees
19. In our firm, we actively seek to develop both social and professional employee relationship
20. In our firm, we regard employees as our best asset
1 2 3 4 5
1 2 3 4 5
1 2 3 4 5
1 2 3 4 5
1 2 3 4 5
1 2 3 4 5
1 2 3 4 5
1 2 3 4 5
6 7
7 6
7 6
6 7
6 7
6 7
6 7
6 7
1 2 3 4 5
1 2 3 4 5
6 7
6 7
1 2 3 4 5
1 2 3 4 5
7 6
6 7
1 2 3 4 5 7 6
1 2 3 4 5 7 6
1 2 3 4 5
1 2 3 4 5
1 2 3 4 5
1 2 3 4 5
1 2 3 4 5
6 7
6 7
6 7
6 7
6 7
1 2 3 4 5 6 7
92
III Market orientation, general questions
1. we encourage customers’ comments and compliants because they help us do a better job
2. Customer centricity is an important aspect in our organisational strategy
3. We take into consideration competitive factors, when developing our strategy
4. In our firm, we frequently monitor environmental factors influencing the industry, we operate in
5. Decisions taken within our firm, are informed by environmental factors
6. In our firm, the level of inter-departmental coordination is
SECTION C: Other customer retention questions
This section aims to clarify customer retention strategies that may have not been
covered by questions in section B, which the respondent may feel is important.
1) What is the company’s annual marketing budget and what percentage is spent on
attracting new customers? __________
If relevant factor is mentioned
o Prompt (the intention of the researcher will be to ascertain how retention is
being conducted and its contribution to the business)
2) What is the total number of customers in the company? ___________
3) What percentage of the above customer based is retained annually? _______
4) How much of managerial time is spent on discussing and making decisions about customer relationships in company meetings? (high, medium or low) _________
If relevant factor is mentioned
o Prompt (the intention of the researcher will be to ascertain how much
resources is dedicated to retaining customers)
SECTION D: Other customer satisfaction questions
This section aims to clarify customer satisfaction strategies that may have not been
covered by questions in section B, which the respondent may feel is important.
1 2 3 4 5
1 2 3 4 5
1 2 3 4 5
1 2 3 4 5
1 2 3 4 5
6 7
6 7
6 7
6 7
6 7
1 2 3 4 5 6 7

93
1) How satisfied are customers to the company’s products & services? __________
If relevant factor is mentioned
o Prompt (the intention of the researcher will be to ascertain how the respondent
derives the conclusion)
4) How many of the company’s employees are directly involved in servicing customers?
_______
5) Does the company have a customer compliant handling policy? _______, if answered yes, then how many complaints is received on annual basis? ________
If relevant factor is mentioned
o Prompt (the intention of the researcher will be to ascertain whether the
company measures satisfaction and to what extent that it is dedicated towards
resolving complaints)
SECTION E: Other employee satisfaction questions
This section aims to clarify employee satisfaction strategies that may have not been
covered by questions in section B, which the respondent may feel is important.
1) How long (on average) do full-time employees stay with the company? _______, are they generally satisfied? ____
If relevant factor is mentioned
o Prompt (the intention of the researcher will be to ascertain how the respondent
derives the conclusion)
3) Does the company have a formal internal marketing program that provides
communication to its employees? (Y/N) ____
4) How frequently is information regarding the business communicated to all employees?
____
If relevant factor is mentioned

94
o Prompt (the intention of the researcher will be to ascertain how internal
communication is conducted in firm)
SECTION F: General Questions
This section relates to other characteristics of relationship marketing that have not been
covered by questions in section B, which the respondent may feel is important.
1) What marketing strategies does your business adopt?
If relevant factor is mentioned
o Prompt (the intention of the researcher will be to ascertain how marketing is
being conducted and its contribution to the business)
2) Based on your perspective, how do you define relationship marketing?
If relevant factors are mentioned
o Prompt (the intention of the researcher is to fully understand how the
respondents perceives relationship marketing to be)
3) What characteristics of relationship marketing does your business adopt?
If relevant factor is mentioned
o Prompt (the intention of the researcher will be to ascertain how relationship
marketing is being conducted in the business)

95
APPENDIX 2: SAMPLE LIST OF CODES AND DEFINITIONS
Codes Type Codes Definitions
Master code TM Trade Marketing
Sub-code TM – E Exhibitions, Trade shows, Conferences, product
demonstrations
Sub-code TM – A Account management, client servicing, after sales-
service
Master code WM Word – of – mouth Marketing
Sub-code WM – C Client referrals, social networking
Master code DM Direct Marketing
Sub-code DM – D Client presentations, D2C promotions
Master code DigM Digital Marketing
Sub-code DigM – 1 Online, social media, internet
Sub-code DigM – 2 Mobile advertising, In store screens
Master code LT Long term Relationship
Sub-code LT - customer Cultivating long term relationship with customers
Preserving sustainable relationship with customers

96
Fostering long term relationships with clients
Long term customer partnership
Sub-code LT-
stakeholder
Building relationships with stakeholders
Mutual beneficial relationship with employees
Master code RM Relationship Marketing
Sub-code RM – need Understanding the needs of the customer
Know your customer (KYC)
Better understand the client
Sub-code RM - personal Personalised interactions
Face-to-Face engagements
Tailored client reporting and feedback
Sub-code RM -
satisfaction
Consistent satisfaction of customer needs
Ensuring high levels of client satisfaction
Keeping clients happy with service rendered
Meeting and exceeding expectations
Sub-code RM - retention Maintaining existing clients
Defending your client portfolio
Managing current relationships

97
APPENDIX 3: CONSISTENCY MATRIX
Propositions Source of Theory Source of Data Data Analysis Method
Proposition 1: South African
family businesses have a low
market orientation
Family businesses exhibit lower
market orientation than non-family
businesses, this is according to a
quantitative examination by
Zachary et al. (2011).
Questionnaire, section B Content analysis
Distribution fitting algorithm
Proposition 2: South African
family businesses have a high
customer retention rate
Proposition 3: South African
family businesses have a high
customer satisfaction levels
This argument is supported by
Tokarczyk et al. (2007) and
Cooper et al. (2005), who found
empirical evidence that further
supports customer orientation as
a major theme amongst family
businesses. Families, by virtue of
their DNA, cultivate deep
relationships with people, which
include customers, suppliers and
even competitors.
Questionnaire, section B, C & D Content analysis
Distribution fitting algorithm

98
Proposition 4: South African
family businesses have good
employee relations
With regards to employee
relationships, Dyer (2006)
suggests that family business
may have advantages in
developing social capital with
different stakeholders which
include employees, than
nonfamily businesses. Family
businesses typically cultivate and
nurture long-standing
relationships with employees
across generations (Zachary et al.
2011).
Questionnaire, section B &E Content analysis
Distribution fitting algorithm