Embed Size (px)
Citation preview

AN INVESTIGATION INTO GROWTH CHALLENGES ENCOUNTERED BY
REGISTERED SMALL AND MEDIUM ENTERPRISES IN KATUTURA CENTRAL
CONSTITUENCY
A THESIS SUBMITTED IN PARTIAL FULFILMENT
OF THE REQUIREMENTS FOR THE DEGREE OF
MASTER OF BUSINESS ADMINISTRATION
OF
THE UNIVERSITY OF NAMIBIA
BY
FOIBE NDAPEWA SHILINGE
STUDENT NUMBER: 200837486
MARCH 2016
Supervisor: Dr. Gwendoline Vusumuzi Nani, Ph.D

i
DECLARATION
I, the undersigned, Foibe Ndapewa Shilinge, student number 200837486, a Master of Business
Administration student, hereby declare that this thesis is my own original work and that all
sources have been accurately reported and acknowledged, and that this thesis had not previously
in its entirely or in part, been submitted at any academic institution in order to obtain an
academic qualification.
17 March 2016
___________________ ________________
Signature Date

ii
DEDICATION
This project is dedicated to my husband, Mr. Dominicus N. Uugwanga; my sons, Nestor and
Tobias; my daughters, Aloycia and Ferciana; my brothers, Natangwe, Gerson & Wilhem; my
sisters, Rachel, Aishe & Wilka, and to my parents.
To my husband, sons and daughters, brothers and sisters, you have made this study possible
because you have been caring, loving, humble, and supportive. To my parents, you have laid a
very strong foundation that made me who I am today.

iii
Table of Contents
DECLARATION ........................................................................................................................................... i
DEDICATION .............................................................................................................................................. ii
ACKNOWLEDGEMENTS ......................................................................................................................... ix
ABSTRACT .................................................................................................................................................. x
CHAPTER ONE INTRODUCTION ............................................................................................................ 1
1.1. Orientation of the proposed study ..................................................................................................... 1
1.2. Statement of the problem .................................................................................................................. 2
1.3 Research Questions ........................................................................................................................... 3
1.4 Significance of the study ................................................................................................................... 4
1.5 Limitations of the study .................................................................................................................... 4
1.6 Chapter’s summary ........................................................................................................................... 5
CHAPTER TWO LITERATURE REVIEW ................................................................................................ 6
2.1 The definition of an SME ....................................................................................................................... 6
2.2 The contribution of SMEs in any economy ............................................................................................ 8
2.2.1 The role played by SMEs in the United States of America ............................................................... 10
2.2.2 The role played by SMEs in the United Kingdom and the European Community ............................ 11
2.2.3 The role played by SMEs in the People’s Republic of China and the Asian .................................. 12
Community ................................................................................................................................................. 12
2.2.4 The role played by SMEs in Africa ................................................................................................ 13
2.3 The measures of growth of SMEs in Namibia ...................................................................................... 18
2.3.1 Hidden Champions Analysis .............................................................................................................. 20
2.3.1.1 Customer relations or service .......................................................................................................... 21
iv
2.3.1.2 Markets/Competition ...................................................................................................................... 22
2.3.1.3 Government Relations and Networks ............................................................................................. 22
2.3.1.4 Organizations, Leadership, and Human Resource Management .................................................... 23
2.3.1.5 Business Strategies .......................................................................................................................... 23
2.3.1.6 Products and Innovation.................................................................................................................. 24
2.4 Challenges faced by SMEs generally in the micro, market and macro environments .......................... 24
2.5 Namibian Government’s policies relating to SMEs.............................................................................. 36
2.5 Chapter Summary ................................................................................................................................. 42
CHAPTER THREE RESEARCH METHODOLOGY ............................................................................... 43
3.1 Research Design ............................................................................................................................. 43
3.2 Population ....................................................................................................................................... 43
3.3 Sample............................................................................................................................................. 44
3.4 Research Instruments ...................................................................................................................... 45
3.5 Research Procedure ......................................................................................................................... 45
3.6 Data Analysis ................................................................................................................................. 46
3.7 Research Ethics ..................................................................................................................................... 47
3.8 Chapter summary ............................................................................................................................ 47
CHAPTER FOUR DATA ANALYSES AND DISCUSSION ................................................................... 48
4.1 Response Rate ....................................................................................................................................... 48
4.2 Demographical data of the entrepreneurs ............................................................................................. 49
4.2.1 Gender of respondents ....................................................................................................................... 49
4.2.2 Age of respondents ............................................................................................................................ 49
4.2.3 Level of education .............................................................................................................................. 50
4.2.4 Types of enterprises ........................................................................................................................... 51

v
4.2.5 The length of operating the enterprise ............................................................................................... 53
4.2.6 Registration of enterprises ................................................................................................................. 54
4.2.6 Ownership of enterprises ................................................................................................................... 54
4.3 Micro environmental challenges ........................................................................................................... 55
4.3.1 Stock levels increased or not .............................................................................................................. 55
4.3.2 Sales levels increased or not .............................................................................................................. 56
4.3.3 Percentage of respondents that are producing goods ......................................................................... 57
4.3.3.1 Level of production attained ........................................................................................................... 58
4.3.4 Number of employees recruited ......................................................................................................... 59
4.3.5 Profit earned since the establishment of the enterprise ...................................................................... 60
4.3.6 Vehicle base that were increased and that were not increased ........................................................... 61
4.3.7 Level of equipment base that were increased .................................................................................... 62
4.4 Market environment challenges ............................................................................................................ 63
4.4.1 Number of customers attracted .......................................................................................................... 63
4.4.2 Threat posed by competitors .............................................................................................................. 64
4.4.4 Suppliers deliver orders on time ........................................................................................................ 65
4.4.6. Application for bank loans ................................................................................................................ 67
4.4.6.1 Reasons for not applying loans ....................................................................................................... 67
4.4.7 Receipt of bank loans ......................................................................................................................... 68
4.4.8 Other types of finance used to finance the enterprises ....................................................................... 70
4.4.10 Improvement on the growth of business by the loans ...................................................................... 71
4.5 Macro environmental challenges .......................................................................................................... 72
4.5.1 Government plays a big role in promoting establishment of SMEs .................................................. 73
4.5.3 Tax rates on enterprises...................................................................................................................... 74
vi
4.5.5 Foreign entrepreneurs in manufacturing ............................................................................................ 76
4.5.6 Foreign entrepreneurs in industrial development ............................................................................... 77
4.5.7 Entrepreneurs contribution to the formulation of SME policies ........................................................ 78
4.5.8 Government provides start-up capital ................................................................................................ 79
4.5.8 Government grants collateral to SMEs .............................................................................................. 79
4.6 Addressing growth challenges faced by registered SMEs in Katutura Central Constituency .............. 80
4.7 Chapter summary .................................................................................................................................. 81
CHAPTER FIVE SUMMARY, CONCLUSIONS AND RECOMMENDATIONS .................................. 82
5.1 Summary ............................................................................................................................................... 82
5.2 Conclusions ........................................................................................................................................... 83
5.2 Recommendations ........................................................................................................................... 85
5.2.1 Competition and expansion of enterprise operations ......................................................................... 85
5.2.2 Planning ............................................................................................................................................. 86
5.2.3 Policy making .................................................................................................................................... 86
5.2.4 Access to finance ............................................................................................................................... 87
5.2.5 Inadequate infrastructure.................................................................................................................... 87
5.2.7 Training .............................................................................................................................................. 88
5.3 Limitations of findings .......................................................................................................................... 88
5.4 Area for further research ....................................................................................................................... 88
REFERENCES ........................................................................................................................................... 89
APPENDIX 1 ............................................................................................................................................ 101
Questionnaire Cover Letter ....................................................................................................................... 101
APPENDIX 2 ............................................................................................................................................ 102
RESEARCH QUESTIONAIRE ............................................................................................................... 102

vii
LIST OF FIGURES
Figure 1. Respondents' level of education .................................................................................................. 51
Figure 2. Types of enterprises ..................................................................................................................... 52
Figure 3. Duration of operating the enterprise ............................................................................................ 53
Figure 4. Registration of enterprises ........................................................................................................... 54
Figure 5. Ownership of the enterprise ......................................................................................................... 55
Figure 6. The level of stocks increased ....................................................................................................... 56
Figure 7. Respondents that increased and those had not increase their sales .............................................. 57
Figure 8. Respondents that producing and that did not producing their goods ........................................... 58
Figure 9. Respondents that had increased their production and that had not .............................................. 58
Figure 10. Respondents that had increased their employees and those had not increased their employees 59
Figure 11. Respondents that increased their profit and those had not increase their profit ........................ 60
Figure 12. Percentages of vehicle base that were increased and that did not increased ............................. 61
Figure 13. Respondents that had increased their equipment base and those had not increased their
equipment .................................................................................................................................................... 62
Figure 14. Respondents that had increased their customers ....................................................................... 63
Figure 15. Respondents that experienced threats from their competitors ................................................... 64
Figure 16. Threat posed by similar products in the market place ............................................................... 65
Figure 17. Respondents that had suppliers .................................................................................................. 66
Figure 18. Advertisement of goods and services ........................................................................................ 66
Figure 19. Application for bank loans ........................................................................................................ 67
Figure 20. Reasons why respondents had not applied for loans ................................................................. 68
Figure 21. Outcome of the loans applications ............................................................................................. 69
Figure 22. Other types of finance used to finance the enterprises .............................................................. 70

viii
Figure 23. Respondents that faced difficulties in repaying the loans.......................................................... 71
Figure 24. Improvement to the growth of business by the loans ................................................................ 72
Figure 25. Government roles in promoting establishment of SMEs ........................................................... 73
Figure 26. Government’s commitment towards the growth of SMEs ........................................................ 74
Figure 27. Tax rates on enterprises ............................................................................................................. 75
Figure 28. Government provides business management training ............................................................... 75
Figure 29. Foreign entrepreneurs in manufacturing businesses .................................................................. 76
Figure 30. Foreign entrepreneurs in industrial development ...................................................................... 77
Figure 31. Formulation of SME policies .................................................................................................... 78
Figure 32. Government provision of start-up capital .................................................................................. 79
Figure 33. Government’s provision of collateral to SMEs ......................................................................... 80
LIST OF TABLES
Table 1. Number of respondents………………………………………………………………...48
Table 2. Respondents by gender....................................................................................................49
Table 3. Age of respondents (n = 71)............................................................................................50

ix
ACKNOWLEDGEMENTS
I give all my praises to the Almighty God, who blessed me with sufficient courage and capacity
to carry out and complete this study. Being aware of my limitations and shortcomings, it was not
possible to accomplish this work without his help.
I would like to thank all the respondents for providing me an opportunity to research in their
enterprises.
I extend my deepest gratitude to my thesis supervisor, Dr. Gwendoline Vusumuzi Nani,
National University of Science and Technology, Zimbabwe, without her strenuous effort and
valuable expert guidance, this thesis would not have been concluded. In spite of her busy
schedule, she was every time ready to take time and assist me a lot in the execution of my
present venture. Through her scholarly disclosure, critical analysis, work design, valuable
suggestions and, her excellent moral support and encouragement throughout my research, she
eased the burden. Thus, it was a pleasure to have worked under the supervision of such a
resourceful and learned person like her. I am really thankful to her for guidance and support.
I am indebted to my family who provided all the encouragement and support in pursuit of this
research study.

x
ABSTRACT
The study sought to investigate the factors that hamper the growth of registered small and
medium enterprises, specifically in Katutura Central Constituency, in order to develop an
understanding of the dynamics of SMEs. The study was motivated by the fact that despite the
establishment of the SME Incubation Centres in Katutura with the objective of assisting small
businesses to grow into formal small and medium enterprises, most of them are still in
incubation.
The research study employed a mixed method approach, comprising of the qualitative and
quantitative research designs. The quantitative research design enabled the researcher to collect
data using questionnaires and convert that data into numerical form so that statistical analyses
could be made and conclusions were drawn from the statistical analyses. The qualitative design
enabled the researcher to gather data through interviews and focus group discussions with the use
of open-ended questions. The population of the study was 500 entrepreneurs and the sample size
consisted of seventy five (75) entrepreneurs.
Data was collected after the data collection instrument was approved by the supervisor. A pilot
study using 10 respondents was conducted before full scale data collection. The purpose of the
pilot study was to refine the questionnaires so that respondents could not have problems in
recording the data. Furthermore, it enabled the researcher to obtain some assessment of the
questions’ validity and the likely reliability of the data that were collected. Data from then (10)
piloted respondents was analyzed and results interpreted for correctness of the research
instruments. Appropriate modifications were done on the instruments. The modification of the
xi
questionnaire was then followed by full scale data collection. The questionnaires were
administered to entrepreneurs around the Katutura Central Constituency.
Qualitative data was analyzed manually by first summarizing the information gathered and then
categorized and coded the responses into emerging themes. Quantitative data was then analyzed
using a statistical package of Microsoft Excel.
The study revealed that stringent government policies relating to SMEs and lack of subsidies,
and micro and market environmental challenges such as competition, inadequate finance, lack of
equipment, limited enterprise spaces, and lack of business management skills have contributed to
the stagnant process of SMEs growth.
In conclusion, SME sector in Namibia has not flourished and met most expectations. Hence, the
issue of lack of access to capital, inadequate entrepreneurial development, disabling regulatory
environment as well as lack of effective competitive strategies pose serious challenges that
require active government and private sector involvement if the huge potential in this sector is to
be harnessed. Therefore, resolutions by both the private and public sectors to address these
challenges should be sought. One such notable attempt is in the form of both private and public
institutional arrangements to support SMEs by providing business management training. The
central government must work hand in hand with the private sector financial services to curb the
problems facing SME sector in terms of access to finance.
Further studies are required to establish if the challenges faced in rural areas are similar to those
faced by their urban counterparts.

1
CHAPTER ONE
1. INTRODUCTION
Chapter one provides an overview of the study. It is arranged as follows. Section 1.1 provides an
orientation of the proposed study. Section 1.2 focuses on the statement of the problem. Research
questions are stated in Section 1.3. Significance of the study is provided in Section 1.4. Section
1.5 outlines limitations of the study.
1.1. Orientation of the proposed study
In the Industrial Age, it was assumed that economies of scale would enable vertically integrated
large enterprises to emerge as permanent winners in the competitive marketplace of a globalized
economy. As the 21st century progressed, with the emergence of the knowledge economy, it
became increasingly evident that small and medium enterprises were not going to disappear but,
worldwide, in most countries, the enterprise sector would be largely composed of small and
medium enterprises (SMEs) and even smaller enterprises (Longenecker, Justin, Carlos, Moore,
William, & Leslie, 2008).
SMEs are the main source of economic growth in developed and developing countries (Stella,
2011). In the US, the SME sector is said to provide 67% employment and 61% manufacturing
sector output respectively. In Korea, there are over 30 million SMEs constituting about 99.9% of
the enterprises and employing over 88.1% of the labour force. Similarly, in Kenya SMEs are
responsible for about 80% of employment and contributes about 40% to GDP (Stella, 2011).
These findings demonstrate that SMEs are an integral part of the economy, critical in spurring
socioeconomic development (Stella, 2011).

2
The Government of Namibia recognised that SMEs can play a vital role in the country's socio-
economic development as indicated in National Development Plan Number 2 and Vision 2030.
According to the survey conducted by the Namibian Economic Policy Research Unit (NEPRU,
2003), it is evident that this sector is a key sector in poverty alleviation and economic growth in
Namibia. Namibian SMEs contribute close to 12 per cent to GDP and employ 20 per cent of the
total workforce (Nepru, 2005).
Realising the role that SMEs could play in bridging this gap, government produced a policy
paper on SMEs in 1997 entitled "Namibia: Policy and Programme on Small Business
Development". This policy, amongst others stipulates that government programmes in place
should ensure that conditions are favourable for SMEs in Namibia and should flourish. As per
the policy’s recommendation, government did not guard against the creation of an environment
in which small enterprises are pushed out of business by transnational corporations who tend to
repatriate their profits to their countries of origin.
During the colonial regime, the growth and development of the SME sector was deliberately
hampered by the competition from South African companies which posed a major threat to the
Namibian SMEs. Today, Chinese, European and other imports have added pressure on SMEs.
Nurturing small entrepreneurs that are labour-intensive may create and sustain more jobs than
the larger business sector (Labour Resource and Research Institute, (LaRRI), 2008).
1.2. Statement of the problem
According to Nuyoma (2010), Namibia has witnessed a phenomenal growth in the number of
business start-ups during the past two decades. This is, especially true, when it comes to the
3
operations of small and medium enterprises. Nuyoma (2010) also asserts that concomitantly, it
has also been observed that the majority of these businesses cease during the first twenty four
months of their existence. Available data indicates that approximately 65% of the small and
medium scale businesses belong to this failure group (Nuyoma, 2010; Michael, 2006; Tonderai,
2005 & Tirivangani, 2013). Kikonyogo (2000) emphasises that lack of government policies
aimed at reducing transaction costs, security, and competition can hamper the growth of SMEs.
The City of Windhoek established the SME Incubation Centres in Katutura with the objective of
assisting small businesses to breed and evolve into formal small and medium enterprises in a
period of between two and three years after entering incubation. However, most of the businesses
that entered the N$11-million SME Incubation Centres during its opening in 2002 are still in
incubation (Heita, 2013).
It is against this background that the study investigated the factors that hamper the growth of
registered small and medium enterprises, specifically in Katutura Central Constituency in order
to develop the understanding of the dynamics of SMEs. The purpose of the investigation is not
only for the development of supporting programmes and growth strategies for SMEs, but also for
the growth of the economy as a whole.
1.3 Research Questions
The following research questions guided the study in investigating the growth challenges
encountered by registered small and medium enterprises in Katutura Central Constituency.
1. What are the growth challenges faced by SMEs generally, in the micro, market and macro
environment?

4
2. Do registered SMEs in Katutura Central Constituency in Namibia grow?
3. What are the growth challenges faced by registered SMEs in the micro, market and macro
environment in Katutura Central Constituency in Namibia?
4. What are the perceptions of registered SMEs owners regarding Namibian Government policies
to ensure the growth of SMEs?
5. How can challenges faced by registered SMEs in Katutura Central Constituency in Namibia
be handled?
1.4 Significance of the study
This study is vital in exploring factors that hamper the growth of registered small and medium
enterprises (SMEs) in Namibia, specifically in Katutura Central Constituency. It is hoped that
findings of this study will be used by the Government of the Republic of Namibia and
commercial banks in developing policies that encourage the growth and sustainability of small
and medium enterprises. Non-Governmental Organizations (NGOs) and other development
partners dealing with poverty eradication and funding of developmental projects may also find
the results useful.
1.5 Limitations of the study
The researcher faced time and financial constraints because of full time employment. However,
to mitigate against time constraints, the researcher applied for a month’s leave to collect data. To
counter the challenge of inadequate funds, additional financial assistance was sought from
friends and relatives.

5
1.6 Chapter’s summary
In this chapter the focus was on the overview and the importance of SMEs around the globe and
in Namibia as well. The chapter discusses the background of the research problem, which is the
growth challenge that is faced by SMEs in Katutura Central Constituency. The purpose of
investigating the growth challenges faced by SMEs is also outlined. It is discussed that the study
is vital because it will be used by the Government of the Republic of Namibia, commercial
banks, and the Namibia Development Bank in developing policies that encourage the growth and
sustainability of small and medium enterprises. Non-Governmental Organizations (NGOs) and
other development partners dealing with poverty eradication and funding of developmental
projects may also find the results of the study useful. The next chapter reviews the literature of
this study.

6
CHAPTER TWO
2. LITERATURE REVIEW
This chapter reviews past studies on growth challenges faced by small and medium enterprises in
general. Section 2.1 focuses on the definition of an SME and Section 2.2 on the contribution of
SMEs to any economy. Section 2.3 focuses on the measures of growth of SMEs in Namibia.
Challenges faced by SMEs generally in the micro, market and macro environments are discussed
in Section 2.4. Section 2.5 provides the Namibian Government’s policies relating to SMEs. The
chapter’s summary is provided in Section 2.6.
2.1 The definition of an SME
Kapoor (1997: 3-4) argues that at present there is no universally agreed definition of the small
scale sector. Consequently, the definition has many variants depending on who is defining the
term and the purpose for which the definition is being made.
Kapoor (1997: 3-4) is supported by (Hooi, 2006) who also indicates that there is no accepted
worldwide definition of SMEs. In Malaysia, the definitions are solely based on a fixed
quantitative measure; for instance the total number of workers, the total number of capital, total
assets and lately by determining sales turnover (Hashim & Abdullah, 2000).
The European Union (2012) defines small and medium-sized enterprises (SMEs) as non-
subsidiary, independent firms which employ less than a given number of employees. This
number varies across countries.

7
The most frequent upper limit designating an SME is 250 employees, as in some countries set
the limit at 200 employees, while the United States considers SMEs to include firms with fewer
than 500 employees (European Union 2012).
Financial assets are also used to define SMEs. In the European Union, a new definition came to
light on 01 January 2005 applying to all community acts and funding programmes as well as in
the field of State aid where SMEs can be granted higher intensity of national and regional aid
than large companies. The new definition provides for an increase in the financial ceilings: the
turnover of medium-sized enterprises (50-249 employees) should not exceed EUR 50 million;
that of small enterprises (10-49 employees) should not exceed EUR 10 million while that of
micro firms (less than 10 employees) should not exceed EUR 2 million. Alternatively, balance
sheets for medium, small and micro enterprises should not exceed EUR 43 million, EUR 10
million and EUR 2 million, respectively.
According to Abdel and Haan (2004: 7), a small and medium enterprise is understood to be an
independent business undertaking where operational and administrative management are in the
hands of one or two persons; usually the owner (manager) who is responsible for making
decisions of the enterprise.
In Namibia, the Ministry of Trade and Industry (2010) defines a small enterprise as a business
employing between 6-30 employees. Medium enterprises are defined as those employing within
the range of 31-100 employees, while micro-businesses are defined as employing between 1-5
employees.

8
2.2 The contribution of SMEs in any economy
Kushnir, Mirmulstein, & Ramalho (2010) indicate that small and medium enterprises (SMEs) are
to be considered the backbone of the economy. These companies represent an essential source of
economic growth, vibrant and flexibility in advanced industrialized countries, just like they do in
emergent and in developed economies (Kushnir et al., 2010). The same authors further argue that
SMEs are the dominant form of business organisations, representing roughly 95 – 99% of all
companies. The Organization for Economic Cooperation and Development (2011) points out that
SMEs represent more than 95% of enterprises and ensure 60-70% of the jobs.
McClelland (2007) and Harper (2001) (both cited in Boshoff, Theron, & Schutte, 2008) suggest
that entrepreneurship has a critical role to play in the economic development of especially poorer
nations of the world. This view is supported by Sweeney (2011: 32) who suggests that “the
ability of an economy to adapt to change and to continue economic progress would seem to be
weakened if there is not a continuing infusion into the total economic system, at a numerically
high level, of new products, new markets and new jobs generated by small firms. In addition, a
strong small firm sector provides for the widespread and rapid diffusion of technical change and
innovation on which economic growth is ultimately based. Hill and McGowan (2009) indicate
that small firms and entrepreneurship indeed play a major role in the world economy (Timmons,
2004) and that they constitute the bulk of enterprises in most economies around the globe
(Storey, 2004).
There has been a tremendous increase in the number of small firms operating in most of the
advanced countries around the globe since the late 1960’s (Burns, 2001), with North America,

9
Asia and Western Europe “undergoing an entrepreneurial renaissance” (Calvin, 2002). These
small firms are considered, by many governments, as critical for the creation of employment and
ultimately for the creation of wealth.
Ariyo (2008) stipulates that small businesses are vital to the success of the economy. Not only as
they provide the success stories of the future, but also because they meet local needs (for an
example hairdresser, financial consultant and emergency plumber). Ariyo (2008) adds that SMEs
serve the requirements of larger businesses for an example photography services, printed
stationery, catering and routine maintenance. Oteh (2010) concurs with Ariyo (2008) that SMEs
are the main source of economic growth in developed and developing countries.
Fida (2008) asserts that SMEs play a significant contribution in the transition of agriculture-led
economies to industrial ones, furnishing plain opportunities for processing activities which can
generate sustainable sources of revenue and enhance the development process. SMEs build up
the expansion of systemic productive capability. Fida (2008) goes further, and says that SMEs
help to absorb productive resources at all levels of the economy and add to the formation of
flexible economic systems in which small and large firms are interlinked. Edmiston (2007) is
also of the opinion that politicians, academicians and developmental economists are of the view
that enhancing small business development and promoting entrepreneurship would be a good
strategy to contribute and promote economic development.
Advani (2007) believes that from the socio-economic development viewpoint, SMEs provide a
variety of benefits. SMEs have advantages over large-scale enterprises because they can adapt
easily to market conditions and they can withstand adverse economic conditions given their
10
flexible nature. They are more labour intensive than larger firms and they have lower capital
costs associated with job creation. This notion is supported by Liedholm & Mead (2007) and
Schmitz (2005) who indicate that SMEs play critical roles to ensure market stability,
employment and economic growth. The contribution, which small enterprises can make to the
national economy and wealth creation need to be recognized by the government from the
beginning and be considered as part and parcel of the economic development process.
According to Hill (2011), while SMEs create many jobs, they also destroy a lot of jobs.
However, Edmiston (2007) claims that Small and Medium Enterprises which can be defined as
small firms with less than 500 employees are an integral part of any national economy. They
employ more than half the workforce in the private sector, generate about ¾ of net new jobs each
year and produce more than half of the private sector’s output. Fletcher (2011) avows that from
an economic development point of view, small businesses create almost half of the new jobs in
the economy. Hill (2011) further criticizes SMEs by saying that they provide low value added
goods and services and have a short life. Sanchez (2006) disagrees with these views and states
that one of the main characteristics of the SMEs sector of the economy is its flexibility in
production. Based on “small is smart”, successful small enterprises continuously introduce new
and improved varieties of products.
2.2.1 The role played by SMEs in the United States of America
Longenecker, Justin, Carlos, Moore, William, & Leslie (2008); Elmuti & Kathawala (1999) and
Alvarez (1998) provide statistics indicating that the USA’s 23 million small businesses continue
to be a strong driving force in their economy. The small businesses absorb 52% of the private

11
work force and contribute 51% to GDP in the USA (Longenecker et al., 2003; Calvin, 2002;
Burns, 2001). Elmuti and Kathawala (1999) also suggest that a study conducted by the Small
Business Administration in the USA reveal that small business accounted for half of all new
innovations in the USA. Oteh (2010) mentions that in the USA, the SME sector is said to provide
67% employment and 61% manufacturing sector output, respectively.
2.2.2 The role played by SMEs in the United Kingdom and the European Community
According to Burns (2001) and Day (2000), small firms in the United Kingdom employ 62% of
the labour force and contribute 25% to GDP. In the European Community as a whole, small
firms employ 66% of the work force. Burns emphasizes the major role small firms play in the
European Community, by citing the employment generated by small firms in various European
countries. He suggests that small businesses contribute 79%, 63% and 60% to employment
creation in Italy, France and Germany respectively. According to Knutsen (2003), over 99% of
the 3.2 million businesses in the UK are small medium sized enterprises (SMEs) and they
account for more than two thirds of the business turnover.
Ariyo (2008) indicates that the difference in the contribution to the economic growth lies in the
importance attached to the SME sectors by the governments of each country and the role they
play in national economic development. In the UK, these businesses not only form the bedrock
of the British economy, but they are widely accepted as the main hub of economic activity in the
country. They are seen not just as job creators, but as creators of wealth. Top it all, the UK
government firmly believes that small and medium sized businesses are crucial to a successful
enterprise economy and the government is fully committed to stimulating the creation,

12
competitiveness and growth of new and small businesses. Ariyo (2008) further avows that the
key principles underlying the UK Government’s approach include fostering an enterprise culture
that encourages innovators and risk takers; providing and maintaining a supportive economic
environment; identifying and removing barriers to growth and providing high quality business
support for firms at all stages of their development.
It was highlighted by Kauffmann (2005) that with very few exceptions, all of the largest
companies in the world started as small enterprises. Supportive economies, had access to the
right people and capital, and technology turned small enterprises into giants. Kauffmann (2005)
further points out that in practice, it is a very small percentage of small firms which experience
this kind of growth but the fact remains that small and medium enterprises remain critical to the
UK economy, providing over 67% of the UK’s private-sector jobs and contributing over 50% of
UK GDP. In the case of developed countries, for example Germany, the economy is
characterised as having strong SMEs and about two-thirds of the workers are employed by these
enterprises (Kauffmann, 2005).
2.2.3 The role played by SMEs in the People’s Republic of China and the Asian
Community
According to the US Embassy (2002), the growing significance of SMEs in China's economy is
worth noting. Chinese and foreign experts estimate that SMEs are now responsible for
approximately 60% of China's industrial output, and employ around 75% of the workforce in
China's cities and towns. It is believed that SMEs are responsible for creating most new urban
jobs, and have created opportunities for workers laid-off from state-owned enterprises that re-
enter the workforce. Saru (2007) expands on US Embassy’s viewpoint by stating that SMEs are

13
the major growing force behind the fastest growing economy of China, in terms of contribution
to the national GDP (accounting for 40%), scale of assets, diversification of products, and the
creation of employment. Saru (2007) adds that, similarly, the role of SMEs is well acknowledged
in other countries such as Japan, Korea, and all other industrialised economies in terms of
creating employment, reducing poverty and increasing the welfare.
It was reported by Snell and Lau (2006) that in Korea, there are over 30 million SMEs
constituting about 99.9% of the enterprises and employing over 88.1% of the labour force.
Furthermore, in newly industrialised Asian countries, SMEs have become the driving force in
their rapid growth. For example, SMEs account for 99% of all enterprises and 88% of all
employees in South Korea. Snell & Lau (2006) further allude that some of the world’s leading
Korean companies such as Samsung and LG were once small enterprises.
The brief overview of the contribution that small enterprises make towards the economies of the
above mentioned countries emphasizes the importance of the small enterprise sector.
Governments around the world have realized just how important this sector of the economy is for
the future growth of their respective countries.
2.2.4 The role played by SMEs in Africa
In a study conducted by Stevenson & St-Onge (2005), it is reported that SMEs in Africa have
played a significant role in the macro economy. In South Africa, Boshoff, Theron, & Schutte,
(2008) conducted a survey and found out that South Africa is the most economically developed
African country. SMEs generated more than 55% of all jobs and 22% of the country’s Gross
Domestic Product (GDP). Gray (2002) asserts that despite the importance of SMEs, SMEs in

14
other African countries have generally shown asymmetrical development. Unlike that of South
Africa and the other powerhouse, Mauritius, two notable examples of countries with vibrant
SMEs, most countries have relied on oil or other natural resources for their economic
development.
The Department of Trade and Industry (2008) of South Africa suggests that there are more than
800 000 SMEs, absorbing approximately a quarter of the labour force of 15 million people. This
is in addition to approximately 3.5 million people who are involved in some type of survivalist
ventures. The DTI (2008) believe that small businesses in South Africa account for 60% of all
employment and for 40% of GDP. Commonwealth Resources (2008) indicate that agriculture
contributes 5% towards South Africa’s GDP and employees 10% of total labour; manufacturing
contributes 25% towards GDP and employs 28% of total labour, and mining contributes 7.7%
towards GDP.
From a South African perspective, the importance of small-to-medium sized enterprises in
contributing to national wealth is critical. SMEs are regarded as the ones with the potential for
job creation and makes a substantial contribution (35%) to GDP of South Africa (Rwigema and
Venter, 2010; Small Business Project, 2013).
For the South African government, the growth and development of the small business sector is
also playing a major role in addressing the imbalances of the past (Department of Trade and
Industry, 2008) as it is seen as a vehicle to create much needed employment and wealth.
Similarly, (Saru, 2007) also points out that in Kenya SMEs are responsible for about 80% of

15
employment and contributes about 40% to GDP. These examples demonstrate that SMEs are an
integral part of the economy critical in spurring socioeconomic development.
The strong interest in entrepreneurship is largely due to findings that new business enterprises
are the primary source of new employment opportunities (Boshoff, Theron and Schutte, 2008),
and this is indicated by Ndwandwe (2008) who reported that SMEs account for 60% of all
employed people in South Africa.
It is reported by Namibia Economic Policy Research Unit (NEPRU, 2010) that SMEs are important to
almost all economies in the world, but especially to developing countries like Namibia with
major income discrepancies between the rich and the poor, and with a headache of
unemployment. On what we may call the “static” front, SMEs contribute to output by
participating in the mainstream economy and to the creation of some “decent” jobs especially to
the few that runs-the SMEs. This assumption is supported by the Institute for Public Policy Research
(IPPR, 2011) that SMEs are the biggest employer and can close the inequality between the rich
and the poor. On the other hand, SMEs are the nurseries for the larger firms of the future. Many
large firms started as SMEs before they grew large. IPPR (2011) maintains that it is therefore, in
this regard that SMEs are the next and important step up for expanding micro enterprises. SMEs
contribute directly and often significantly to aggregate savings and investment of any nation, and
they are involved in the development of appropriate technology also. With increasing
competition within the SMEs, new solutions will be brought forth across different sectors (MTI,
2008, quoted in LaRRI 2010: 14-15).
16
In Namibia, there is a general consensus that the development of the SME sector offers great
opportunities for the attainment of sustainable socio-economic development (LaRRi, 2008;
Tonin, 2008). This has been recognised in the Namibia Vision 2030 which clearly states that
SMEs should act as the locomotives promoting “human development, equitable and balanced
growth, with a growing industrial sector.”
In 2005 the Institute for Public Policy Research (IPPR) reported that SMEs account for 20% of
employment in Namibia, and contribute 12% of GDP (Arnold, 2005; Tjirera, 2011). LaRRi
(2008) reported a considerable contribution in employment creation from the SME sector in
Namibia. The report indicates that the small business sector was estimated to provide around
60,000 full-time jobs in Namibia, making it a significant employment creation sector. In this
regard Mwilima (2010) states that in Namibia, SMEs provide some employment and incomes to
160,000 people, representing approximately one-third of the nation’s workforce. In terms of full-
time employment, this sector currently employs about 60,000 people. In Namibia, the majority of
SMEs are mainly found in the retailing sector selling foodstuffs and household products.
It was reported by the United Nations Industrial Development Organization (UNIDO), 2010 that
for developing countries like Namibia, integration into the global economy through economic
liberalisation, deregulation, and democratisation is seen as the paramount way to eradicate
poverty and inequality. Significant to this process, is the development of a private sector, in
which SMEs can play a central role. The United Nations Industrial Development Organization
(UNIDO), 2010 report further reveals that SMEs have an inclination to employ more labour-
intensive production processes than large enterprises. Consequently, they contribute significantly

17
to the provision of productive employment opportunities, the generation of income and,
eventually, the reduction of poverty. SMEs can become a major contributor to private sector
employment.
Namibia Chamber of Commerce and industry (2011) mentions that SMEs play a significant
contribution in the transition of agriculture-led economies to industrial ones furnishing plain
opportunities for processing activities which can generate sustainable source of revenue and
enhance the development process. The Chamber also points out that SMEs shore up the
expansion of systemic productive capability. They help to absorb productive resources at all
levels of the economy and add to the formation of flexible economic systems in which small and
large firms are interlinked. However, the Chamber cautions that, such linkages are very crucial
for the attraction of foreign direct investment (FDI). Investing larger corporations look for sound
domestic suppliers for their supply chains. The Chamber concludes by saying there are a number
of factors responsible for the importance of SMEs in Namibia. First, SMEs bolster an
entrepreneurial spirit and put forward flexibility in the economy. Second, SMEs emanate the
fastest growing export sub-sectors, such as maize farming and construction. Third, they can
support the poverty alleviation endeavours through employment generation process. Above all,
SMEs are more efficient in resource allocation as compared to that of large scale companies
from a social point of view. They provide for and facilitate for a more number of people.
According to Gaomeb during a Bank of Namibia Symposium (2012), Namibia’s economy is an
economy that can easily be grown by SMEs. However, efforts have remained restricted focusing
on the large enterprises, and neglecting SMEs which are the back bone of the economy. For
18
instance, institutions established to facilitate business activities, have been focusing their efforts
on large companies leaving the SMEs. SMEs are a distinctive mainstay of the economy that
requires owing special treatment (Bank of Namibia Symposium, 2012).
2.3 The measures of growth of SMEs in Namibia
In order to grow, small firms must evolve their organization, incorporating changes to
management structure, operational planning, control, and communication processes (Hanks,
2000), without impairing the firm's competitive advantage. Failure to make these changes may
result in harm to the business through stagnation, negative growth, loss of customers, and failure
to introduce new products, potentially closing the business (Churchill and Lewis 2003; Hambrick
and Crozier 2005).
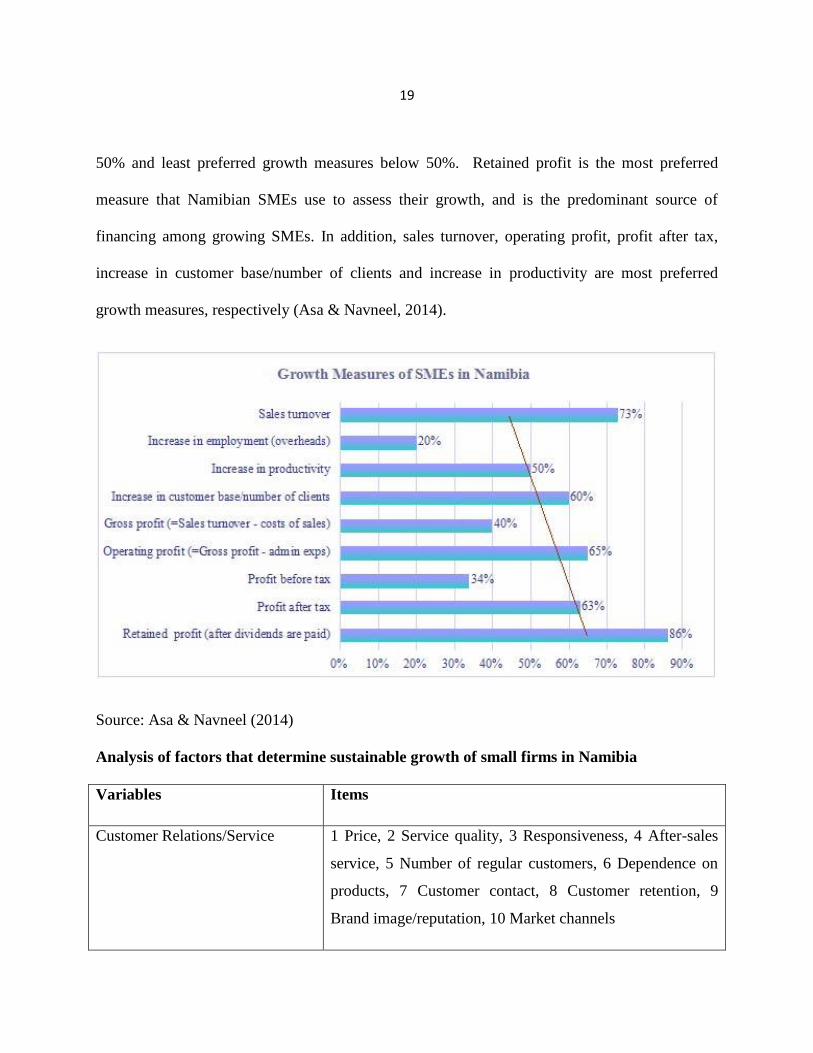
According to Asa & Navneel (2014), there is variation on preferred monetary and non- monetary
growth measures by different firms studied in Namibia. The graph below portrays the
preferences on measures of growth from the study conducted on Namibian SMEs from different
industries. While the Ministry of Trade in Namibia prefer to define and categorize growth of
SMEs on number of employees, however, the study shows that SMEs do not prefer to use
number of employees to measure their growth. In fact, they view the number of employees as an
overhead, which means the quantity of employees in SMEs in not much a strategic contributor to
their growth but the quality of employees carrying out day by day business operations is what
matters.
The linear trend line in the graph is referred to as “50/50 vector”. The 50/50 vector separates the
measures on the range of 50% apiece to exhibit the most preferred growth measures at above
19
50% and least preferred growth measures below 50%. Retained profit is the most preferred
measure that Namibian SMEs use to assess their growth, and is the predominant source of
financing among growing SMEs. In addition, sales turnover, operating profit, profit after tax,
increase in customer base/number of clients and increase in productivity are most preferred
growth measures, respectively (Asa & Navneel, 2014).
Source: Asa & Navneel (2014)
Analysis of factors that determine sustainable growth of small firms in Namibia
Variables Items
Customer Relations/Service 1 Price, 2 Service quality, 3 Responsiveness, 4 After-sales
service, 5 Number of regular customers, 6 Dependence on
products, 7 Customer contact, 8 Customer retention, 9
Brand image/reputation, 10 Market channels

20
Variables Items
Markets/Competition Market barriers, 2 Niche markets, 3 Diversification
Government Relations and
Networks
1 Governments, 2 External networks, 3 Sources of finance
Organizations, Leadership, and
Human Resource Management
1. Procurement, 2. New business planning, 3. Management
strategy, 4. Exploration of new markets, 5. Organizational
management, 6. Research and development
Business Strategies 1. Product differentiation, 2 Cost leadership, 3 Market
concentration, 4 Technology leadership, 5 Type of sales, 6
Pricing, 7 Outsourcing, 8 Customer relations, 9 Service, 10
Advertisement, 11 OEM use, 12 Product quality, 13
Flexibility, 14 Delivery
Products and Innovation 1 R&D investment, 2 Number of researchers, 3 Number of
employees with a master’s degree, 4 Cost of developing
new products, 5 Cost of improving products, 6 Intellectual
property rights
Internationalization 1. Time to internationalization, 2 Global alliances/joint
ventures, 3 Number of overseas branch offices
Source: Asa & Navneel (2014)
2.3.1 Hidden Champions Analysis
To identify the determinants of successful small firms growth, (Asa & Navneel, 2014) classifies
the variables into seven categories adapted based on those for Simon’s hidden champions of the
21st century: (1) customer relations/service, (2) markets/competition, (3) government relations
21
and networks, (4) organizations, leadership, and human resource management, (5) business
strategies, (6) products and innovation, and (7) internationalization. The critical success factors
to become high performing SMEs are determined based on distinctive behaviour which explain
their growth patterns.
Hence, rather than focusing on the firms’ demography such as firm size, age or gender of owner,
the behaviour of small firms was more concentrated in (Asa & Navneel, 2014)’s study. These
categories were employed to determine not only the performance of hidden champions but also
that of general and internationalized SMEs although in their study, the internalization of small
firms was found to be weak and insignificant.
Below are the critical factors that need consideration in maintaining the growth of small and
medium enterprises in Namibia.
2.3.1.1 Customer relations or service
Simon (2009) argues that closeness to customers helps the hidden champions’ innovation effort.
Closeness to customers means to have tight relations with the customers, and spatial proximity
through decentralization is a way of maintaining good relations (Simon, 2009). The main reason
for staying close with customers is to secure repeated purchases. This is an expected finding
since it points to the essence of customer relationship which in the end is profit earning through
continuous business from existing customers.

22
2.3.1.2 Markets/Competition
These internal competencies are linked with external opportunities that are in the market. The
hidden champions are focused on a niche market, where they make use of their strong
competitive advantage and market presence. This market presence also gives them closeness to
customers, which makes sure the company understands customers’ needs and can use this data in
their innovation process. Innovation ensures the competitive position and together with customer
relations it makes sure that technology and customer needs are coherent. This feature gives the
hidden champions a strong advantage that they can transfer to other regions all over the country
and thereby ensuring growth and economies of scale which lowers the cost, and strengthens the
competitive advantage further. Asa & Navneel (2014)’ study found SMEs that are strong at these
market features achieved growth. The regression model shows the significance of P-value 0.00
and has likeliness of 2.8 times in achieving growth than those that do not enjoy such market
features.
2.3.1.3 Government Relations and Networks
Acording to Asa & Navneel (2014), maintaining a good relationship with the government
guarantees business survival over period of time. The government is an important source of SME
financing and other business supports such as training and education. Networking has become
the art of success in today’s business environment. Networking connects the firm to government,
customers, and suppliers and even to other businesses to form strategic alliances for resources
and capabilities acquisitions towards sustainable competitive advantage and consequently the
growth of the firm. This variable is found to be significant and the firms that have high degree of
23
government relations and networks are 3.8 times likeliness to achieve growth than those with
low degree of relations (Asa & Navneel, 2014).
2.3.1.4 Organizations, Leadership, and Human Resource Management
This measure is important because it determines how the firm operates whereby goals and
objectives always come first (Asa & Navneel, 2014). For hidden champions, leadership means
inspiring employees to be best, to become a market leader. Simon’s hidden champions strongly
emphasize the personalities of the leaders, which he has divided into two groups: founding
entrepreneurs and entrepreneurs of perfection (Simon, 2009, p.300). Among the founding
entrepreneurs, Simon (2009, p.301) states that they “tend to have five traits in common: Unity of
person and purpose, single mindedness, fearless, stamina and perseverance, and the ability
inspire others. As for the entrepreneurs of perfection, they are the new generation of Chief
Executive Officers that take over after the founding entrepreneurs. They are well educated,
possess excellent English abilities, and they move with great self-confidence around the
international business stage (Simon, 2009, p.304). Asa & Navneel (2014)’s study found positive
results showing a significance of 0.00 and odds showing the likeliness of 3.0 times for firms with
high degree of this variable to achieve growth than those with the low degree scenario.
2.3.1.5 Business Strategies
Asa & Navneel (2014) state that business planning and objectives were related positively to firm
growth, indicating that faster growing firms often had business planning and objectives.
Marketing strategies, for instance advertisements and market concentration were related
positively to firm growth, with some factors being important and some not important in the
study. Technological sophistications, particularly in firms operating in IT industry were found to
24
be important in achieving firm growth. Training programmes for employees both internal and
external to embrace flexibility were also found to be a feature of successful firms. Odds show 2.3
times to achieve growth from firms with high degree of well implemented strategies that features
as a guiding tool of business operations (Asa & Navneel, 2014).
2.3.1.6 Products and Innovation
Growth is linked to a company’s ability to innovate (Nelson, 2008 and Winter, 2002). Moreover,
to sustain growth, firms need to constantly respond to their customers’ needs in novel and precise
ways. Asa & Navneel (2014)’s study revealed that there is no sufficient empirical evidence that
demonstrates a link between innovative activity and growth among small firms in Namibia.
However, the important evidence found is that small firms with high educated employees, to be
precise at master’s degree level and invest in market research were more likely (3.2 times) to
achieve some sort of growth by improving products to meet customers’ needs.
2.3.1.7 Internationalization
Internationalization of Namibian SMEs was found to be quite low. Asa & Navneel (2014)
emphasise that entrepreneurial spirit is the key to job creation, improving competitiveness and
economic growth in Namibia. After all, the growth of small firms in developing countries
depends on government role in creating an enabling environment with favourable market
conditions combined with some support to young dynamic entrepreneurs which in return
significantly contribute to employment creation and economic growth.
2.4 Challenges faced by SMEs generally in the micro, market and macro environments
The Small and Medium Enterprises has special features compared with the larger organizations.
SMEs must consider the motivations, constraints and uncertainties facing smaller firms and

25
recognize that these factors differ from those facing larger firms. According to Westhead and
Storey (2006), characteristics which distinguish small organizations form larger ones other than
size is that of uncertainty. For the small organization external uncertainty has affected the most
such as lack of power and influence in a market place, larger customer and vulnerability.
Therefore, the SMEs seem unpredictable and ruthless market. Hence, uncertainties have become
a major problem in the small organizations (Westhead & Storey 2006).
In many Western economies, such as the US and UK, banks also reduced their lending (loans
and overdrafts) to SMEs in a drive to reduce risk. This falling finance trend has continued as
SMEs have themselves reduced their demand for external funding as the recession has continued
(Williams, 2012).
Michael (2006) believes that starting a small enterprise is always risky, and the chance of success
is slim. According to the U.S.A Small Business Administration (2005), over 50% of small
businesses fail in the first year and 95% fail within the first five years. Michael (2006) gives the
following reasons for small enterprises’ failure: lack of experience, insufficient capital (money),
poor location, poor inventory management, over-investment in fixed assets, poor credit
arrangements, personal use of business funds, unexpected growth. Gustav (2010) adds two more
reasons: competition, and low sales.
It is generally recognized that SMEs face unique challenges, which affect their growth and
profitability and hence, diminish their ability to contribute effectively to sustainable
development. These include: lack of managerial training and experience, inadequate education

26
and skills, lack of credit, national policy and regulatory environment, technological change, poor
infrastructure and scanty markets information (Hill, 2011).
Sacerdoti (2005) highlights that surveys and studies conducted across the world over different
time periods provide compelling evidence that a vast number of small businesses fail in the first
few years. The majority of failures occur in the first two years while only a handful succeeds to
complete their first five years. Sacerdoti (2005) further argues that experts outline various
reasons why this happens, but overall most of them point out some common pitfalls into which
small enterprise start-ups easily tumble into.
World Bank Enterprise Survey (2006) reports that SMEs in low and middle income countries
perceive access to financing as a major obstacle to growth and development, indicating that most
of the financial instruments discussed above are not easily available in most of these countries.
The World Bank Enterprise Survey (2006) results indicate that SMEs in developing countries are
more likely to report that access to finance is a major obstacle to their development than SMEs in
developed countries.
According to Oteh (2010), one of the major difficulties SMEs come across, however, is the issue
of access to finance. SMEs, especially in developing countries, suffer from lack of access to
appropriate funds from both the money and capital markets. This is due in part to the perception
of higher risks resulting in high mortality rate of the business, information asymmetry, poorly
prepared project proposals, inadequate collateral, absence of, or unverifiable history of past
credit(s) obtained and lack of adequate historical records of the company’s transaction.
27
Ramsden (2011) outlines several challenges experienced by SMEs in developing countries,
including cumbersome business regulations, insufficient infrastructure, corruption, lack of access
to finance and management capacity for an example, the need for skills across a wide range of
disciplines, many of which are specialized or technical. He also pointed out that the smallest
firms are most severely affected by these constraints. Although SMEs often start with internal
sources of funding (such as savings), they tend to require external funding as they grow. Access
to such funding was mentioned as a major obstacle to SME growth and development.
Edmiston (2004) postulates that one of the most significant challenges is the negative
perceptions towards SMEs. Potential clients perceive small businesses as lacking the ability to
provide quality services and are unable to satisfy more than one critical project simultaneously.
Lack of planning, inadequate financing and poor management have been cited as the main causes
of failure of small enterprises (Longenecker, Justin, Carlos, Moore, William, & Leslie, 2006).
According to Beck, Demirgüç-Kunt, Laeven & Maksimovic, (2006), access to and cost of
finance is often ranked as one of most constraining feature of the business environment by
SMEs. In their research (Beck at el, 2006) indicate that the cost of finance is rated by over 35%
of small and medium enterprises as a major growth constraint especially in developing countries.
More other characteristics of the business environment, including tax rates and macroeconomic
instability, are also rated by many SMEs as major growth constraints.
OECD Development Centre ( 2005) reports that when it comes to the influx of Asian investors in
the case of Chinese businesses in general, many are likely to think that Chinese companies

28
operating in Africa are mostly related to oil or other natural resources sectors. However, 80% of
Chinese companies currently in Africa are SMEs. Chinese businesses are likely to enter where
most other foreign businesses do not consider it worthwhile to do business, because there are low
profit margins and weak supply chains. Chinese businesses see this as an opportunity and Africa
as a new market. The problem is that the increasing penetration of China in the African market
has also brought about several negative consequences. OECD Development Centre (2005)
furthermore revealed that most importantly, Chinese SMEs lack an understanding of African
business, as they do not try to integrate into the host countries. The most significant consequence
is that as a result, the strong presence of Chinese SMEs forces local firms out of business. Thus,
the penetration of Chinese companies threatens to undermine the development of local (African)
SMEs.
Thorniley (2010) states that despite the importance of SMEs, barriers exist for SMEs in Africa.
Most notably, many African countries lack the governmental capacity necessary to properly
support the development of local SMEs. What is worse is that, some African Governments
impose harsh regulations on local SMEs. As an example, in Ethiopia, many local SMEs
complain that regulation is too tight. They feel that it is too difficult to obtain a licence.
Thorniley (2010) adds that, proof of premises and requirements for large amounts of capital and
high qualifications stifle growth. SMEs are also heavily taxed. This makes it difficult for SMEs
to emerge from the local sector.
Okpara (2011) concurs with Thorniley (2010) who indicates that some governments actually
present quite an ironic attitude towards their own local SMEs. For example, in Ghana, after the
29
discovery of oil in the Sekondi-Takoradi region, many local businesses related to both the oil
sector and related industries such as gas refinery have emerged. Thus, many new SMEs have
tried to enter the market. However, it is said that the existing legal system provides a more
favorable environment for international companies. It is, therefore, impossible for local SMEs to
compete with international firms that have greater know-how and capital. Thus, the Ghanaian
government is supporting foreign investment rather than local growth. Okpara (2011) further
argues that there is another complaint from local Ghanaian SMEs that the bidding process seems
to favor foreign companies. Local SMEs complain that information about contracts is not made
available to local providers. This situation is closely related to corruption and the agreements
signed behind closed doors between businesses and governments. Locals perceive that there is no
transparency in this regard.
According to KPMG (2011), SMEs in Ghana and other countries try to finance their fixed assets
with long-term debt, and their current assets with short-term debt. Since SMEs with low asset
structure have greater difficulty accessing long-term debt, the only option is to fall on short-term
debt finance. In Ghana, long term finance providers typically require landed property as
collateral in granting credit (Joshua & Nicholas, 2009).
According to Gray (2002), in some countries such as the Democratic Republic of the Congo,
most local SMEs went bankrupt due to the civil war. Long-lasting civil war has undermined the
foundations for many SMEs. Gray (2002) continues that to further complicate matters, in many
countries, lack of infrastructure and environmental conditions such as unattractive tax regimes
and legal systems, small local markets, and corruption have hampered the development of SMEs.

30
All of these factors have resulted in an uncertain environment for local entrepreneurs. As a
result, local businesses tend to stay in the informal sector and do not contribute to national
economic growth.
According to Stella (2011), despite the important contribution to economic growth by SMEs, in
Kenya, SMEs continue to face numerous challenges including; inadequate infrastructural
facilities, challenges with attracting skilled manpower, high rate of enterprise mortality, lack of a
facilitative operating environment, restricted market access, and onerous regulatory
requirements. Stella (2011) adds that one of the main areas of concern is access to funding.
According to a survey of top 100 SMEs in Kenya, most SMEs rely heavily on savings or bank
loans for expansion capital (KPMG, 2011).
Despite SMEs’ significance, past statistics indicate that three out of five small businesses in
Kenya, particularly SMEs in Kisumu town, fail within the first few months of operation (Kenya
National Bureau of Statistics, 2007). However, it is generally recognised that SMEs face unique
problems, which affect their growth and profitability and, hence, diminish their ability to
contribute effectively to sustainable development. Many of the problems cited have implications
for technological choice. These problems include lack of access to credit, inadequate managerial
and technical skills, and low levels of education, poor market information, inhibitive regulatory
environments, and lack of access to technology (Harper 2008; ILO, 2009; House, Ikiara, &
McCormic, 2005).
According to Ariyo (2008), Nigeria’s SMEs experienced a lot of problems and hardships. This is
not just as an effect of the economic downturn. There are a number of bottlenecks, including

31
serious under capitalization with difficulty in gaining access to bank credits and other financial
markets; corruption and a lack of transparency; very high bureaucratic costs; but most
damagingly, a seemingly lack of government interest in and support for the roles that SMEs play
in national economic development and competitiveness. However, SMEs are criticized for their
high rate of bankruptcy (Ariyo, 2008).
According to Okpara (2011), financial experts say about 80 percent of small and medium
enterprises in Nigeria fail within the first five years of their existence due to lack of experience
and other wrong business practices. He attributed inability of SMEs to access finance from banks
and other financial institutions to lack of proper structures. In a study done in Uganda, access to
finance is the major constraint faced by SMEs followed by corruption, infrastructure and taxation
(Oteh, 2009).
Gaomeb (2012) outlines that lack of business and managerial skills can magnify financial
barriers for SMEs. Low levels of financial literacy can prevent SMEs from adequately assessing
and understanding different financing options and from navigating complex loan application
procedures. Similarly, the fact that SMEs’ accounting and financial statements are often not
transparent makes them (at least in the perception of many bankers), risky borrowers who thus
make for less attractive clients (Gaomeb, 2012).
Access to finance has been acknowledged by many as one of the major barriers to the
development and growth of small businesses in Namibia. The 2007 International Monetary Fund
(IMF) country report on Assessment of Financial System Stability, found that SME access to
finance remains limited in Namibia (IMF, 2007). The limited accessibility to financing options

32
for SMEs is a result of a lack of appropriate collateral, the underdevelopment of leasing and
factoring services, the comparably small supply of private equity and venture capital, and the
ineffective use of specialised financial institutions (Nakusera, 2008).
Tonderai (2005) highlights that in Namibia, according to statistics, nearly 70 per cent of loan
applications by SMEs do not qualify for financing and 80 per cent of all SMEs fail. Despite an
ever-improving environment in which SMEs operate, one glaring statistic that still haunts the
sector is the fact that according to Bank Windhoek Report (2013), 75% of new SMEs continue to
fail in their first year of operation. The main reason given for such frequent failures is a lack of
proper planning and the commercial bank has offered a list of helpful tips to assist upcoming
entrepreneurs in bettering their chances of success.
SMEs require adequate financing to meet the needs at each stage of their life cycle, from creation
through operation, development, expansion, and beyond. Financing is necessary to help them set
up and enhance their operations, develop new products, and invest in new staff or production
facilities (Stella, 2011).
The existence of a financing gap in the economy is confirmed through research by the
Parliamentary Standing Committee on Economics, Natural Resources and Public Administration
(2009); the World Bank (2006), Knutsen (2003), as well as the Namibia Chamber of Commerce
and Industry (2010).
More than 40 per cent of Micro, Small and Medium Enterprises (MSMEs) in the country identify
access to finance as the most serious obstacle to growth. Access to finance and the cost of credit,

33
both prominently feature as challenges faced by the sector. Stringent collateral requirements are
more of a challenge among small to medium enterprises, followed by cost of credit (Demirgüç-
Kunt, 2013). The twin challenges of the cost of borrowing and access to finance have to be
considered when devising SME financing strategies. Generally, in Africa, there are supply side,
demand side and institutional constraints to financing SMEs (Proparco, 2009).
According to Nuyoma (2010), there are three factors that hamper SME funding, namely demand-
side constraints, supply-side constraints and lending infrastructure, policy and institutional
constraints. If those constraints are adequately addressed, more SMEs in Namibia would be able
to get access to funding.
World Bank Enterprise Surveys (2006:09) recommends that capacity building of SMEs in terms
of preparing financial statements and business plans, as well as improving their financial literacy
and management training is shown to have positive impact on SMEs’ growth.
Ramsden (2010) alludes that various support strategies are needed to effect SME growth and
development. These include financial services that will meet SME needs, effective collateral
regimes that will contribute to banks lending to and supporting SMEs more willingly and a
supportive legal framework for SMEs. An interesting example cited is China which works on
the use of movable collateral registries to overcome the challenge of collateral experienced by
SMEs. Some of these suggestions are echoed in the Namibian studies.
Arnold, Grossmann, Mwatotele, Stork, and Tobias (2005: 15) suggest the introduction of special
financial services for small businesses and the systematic promotion of linkages between larger

34
private firms of the SMEs as such linkages hardly exist. The authors also allude to the need to
undertake regular SME development and impact assessments to continuously assess the
effectiveness of the support measures taken. This is certainly a key challenge in Namibia where
comprehensive and reliable data are hard to come by and often already outdated by the time the
reports are released.
Weidlich (2014) asserts that lack of access to finance, particularly bridging capital for SMEs in
Namibia remains a major obstacle. Many SMEs in Namibia are unable to obtain bank loans or
attract larger credit facilities from financial institutions due to lack of collateral.
Tonderai (2005) highlights that in Namibia, according to statistics, nearly 70 per cent of loan
applications from SMEs do not qualify. This has a negative impact on the growth of SMEs
because they cannot be able to expand and finance operation activities. Shiimi (2012) asserts that
lack of local SMEs protection from unfair foreign competition compromises the growth and
development of the sector. He further advocates that an example of such protection could be in
the form of appropriate regulation which will make it difficult for bigger businesses to enter the
market and crowd out SMEs. He gave an example of Angola, where businesses to a certain size
require a ministerial council’s approval.
Gaomeb (2012) is supported by Tirivangani (2011) who indicates in his report that Small to
Medium Scale Enterprises in Namibia are still defaulting on their repayment obligations despite
Government’s invigorated calls for banks to up funding. Tirivangani (2011) reported that this
comes despite the notion that SMEs have the potential to drive the country’s economy and boost

35
job creation in Namibia and at the back of the establishment of a Small to Medium Enterprise
bank.
A survey conducted by Timmons (2013), shows contrasting repayment rates by SMEs, with First
National Bank of Namibia recording a reasonable repayment rate of 67% while Bank Windhoek
acknowledges that SMEs are slightly on the wrong side of debt service recording an average 8%.
However, the Development Bank of Namibia says the most difficult thing when dealing with
SMEs is the lack of adequate financial information concerning unavailability of comprehensive
information on the intended project.
According to Sasman (2012), “SMEs face peculiar challenges mainly due to their size. SMEs
being small, they have some advantages of being more flexible to adapt to changes in the
business environment. SMEs being small also have disadvantages. “One of the disadvantages is
that because SMEs have small balance sheets, they have little financial resources to fall back on
in times of need. The result can be an inability to offer collateral when needed to raise finance, or
the inability to take on larger business opportunities.” Sasman (2012) also adds on that most
SMEs failed to provide convincing operations and business plans because of skills shortage and
sometimes inability to follow business principles.
Bank Windhoek Corporate Communications Manager, Van Rooyen whose organisation deals
with SMEs, in his address at the (SME Expo, 2012) in Windhoek, states that “Obviously, all
defaulters of the SME Branch are SMEs because the current default rate is 68%.”
36
A study conducted by (Nuyoma, 2010); reveals that Namibia shows that small firms are
discriminated against relatively large firms in most cases due to experience. Large scale firms
can cope and solve their hurdles due to possessing sound experience and financial position.
SMEs, due to their small size and the resulting peculiarities are far less capable of adjusting and
carrying on successful business which in most cases require push start from the procurement
company. Authors like (Michael, 2006; Tonderai, 2005 & Tirivangani, 2013) are of the opinion
that there are also some hidden and apparent obstacles in the path of growth of SMEs in
Namibia. The most important are; law and order situation; financial constraints; energy crisis;
taxation problems; labour issues; lack of coordination and regular information exchange
mechanism among institutions.
2.5 Namibian Government’s policies relating to SMEs
According to the Ministry of Trade and Industry (2012), SMEs in Namibia face constraints to
their development and their rate of failure is high, particularly among the new sectors. The policy
framework of 1997 was designed to unlock the potential of Namibia’s small businesses.
It was founded on the knowledge that there were shortages of enterprising endeavors in the
country; and that the present under-development of the sector is a legacy of the country’s
colonial past which left small entrepreneurs poorly placed to take advantage of opportunities for
growth and development. The policy framework assumes that the lead role in development will
be played by the sector’s progressive entrepreneurs. It is their ability to identify and exploit
opportunities that the sector‘s future rests upon (Ministry of Trade and Industry, 2012).

37
Ministry of Trade and Industry (2012) reveals that, since the Windhoek Chamber of Commerce
complained about an invasion of Chinese SMEs, regulations have been changed. All foreign
businesses in public transport and hair salons, which Chinese businesses have dominated, are
now regulated under a new permit system. The new permit system states that new entrepreneurs
have to comply with local registration requirements. These are examples of how the role of
African Governments is important when it comes to protection of local SMEs. These are all
passive responses, and instead, Governments need to be more pro-active in creating favourable
environments for their own SMEs (Ministry of Trade and Industry, 2012)..
The Ministry of Trade and Industry (MTI, 2012) recognises the development of the SME sector
as a means of reducing inequalities within the socio-economic environment of Namibia. The
SME sector is also empowering previously disadvantaged Namibians, as well as diversifying the
economy and promoting economic growth (MTI, 2012). To stimulate growth of the SME sector,
the MTI’s SME policies and programs are implemented through various departments and
agencies to address the deficiencies in the system. In essence, the SME policy framework
focuses on three key areas of intervention: deregulation and incentives; proactive programs; and
institutional support (MTI, 1997).
The then Trade and Industry Minister, Dr Hage Geingob, in his address at the Eenhana Trade and
Business Expo (2012), stated that government, through the Ministry of Trade and Industry,
would promote SMEs because it recognized the critical role that businesses played in the socio-
economic development and economic diversification of the country.

38
Dr Geingob said the government had put in place various policies and programmes for the
development of SMEs, such as sites and premises, equipment aid scheme, training and
mentorship. He further said that such initiatives were meant to help emerging small and medium-
sized businesses.
According to the Namibia Policy and Programme on Small Business Development (1997), the
Ministry of Trade and Industry will take action to reduce bottlenecks in local market by
reinforcing structures to implement single market measures on time and correctly. It will include
network regulation, effective enforcement and speedy conflict resolution. The ministry will also
improve the business environment in particular for SMEs, through pursuing market monitoring,
reducing administrative barriers, removing tax obstacles and supporting entrepreneurship, and
making it easier and less costly for Namibian business and consumers to profit from partnerships
by offering harmonised solutions for consumer contracts. Nevertheless, all the above have never
been addressed.
The overall objectives of the Programme on Small Business Development (1997) are to
contribute to the strengthening of industrial capacities of Namibian SMEs to face the double-
challenge of regional and world integration and, in particular, in the context of trade
liberalization and thereby to support efforts to reduce poverty. Specifically, in the context of the
liberalization of trade worldwide, the programme aims to support the dynamics of upgrading and
modernization of industries and related services. It is also aimed to improve the industries’
competitiveness, growth, job creation and access to national, regional and international markets.

39
The policy contributes to the strengthening of industrial capacities of Namibian SMEs to face the
double-challenge of regional and world integration and, in particular, in the context of trade
liberalization and thereby to support efforts to reduce poverty. Another objective is to support the
dynamics of upgrading and modernization of industries and related services, and to improve their
competitiveness, growth, job creation and access to national, regional and international markets
within the framework of globalization and economic diversification. The above objectives are in
line with the SADC Regional Indicative Strategies Development Plan (RISDP), the Namibian
National Development Plan 4 (NDP 4), Namibian National Industrial Policy Framework, as well
as the Manufacturing Strategy Framework.
Namibia Policy and Programme on Small Business Development (1997) further outlines that the
Ministry of Trade and Industry will strengthen institutional and programme management
capacities of the major stakeholders through reinforced capacities of the technical support
institutions, business advice and consultancy centres by providing business development services
to local producers. The Ministry will also strive for the establishment and strengthening of
financial mechanisms and products for SMEs’ competitiveness improvement and upgrading;
Currently, the MTI is developing an Industrial Upgrading and Modernization Programme
(IUMP) which aims at supporting the improvement and expansion of industrial activities in key
economic sectors. In October 2013 a review of the SME policy was commissioned to redefine
policy interventions and ensure that the programs are more responsive to the current needs of the
SME sector and culminate in the creation of a holistic SME support service (Timmons, 2013).
Notwithstanding these developments, there are still significant challenges perceived to be

40
limiting SME growth. This can be confirmed as some Namibians continue to blame the SMEs
regulatory frameworks (Timmons, 2013). Gaomeb (2012) highlights that there are other
challenges such as the regulatory environment which is not favorable to serve as an incentive to
SMEs growth.
According to Windhoek Chamber of Commerce and Industry Branch (2012), SMEs cannot
generate economies of scale because their transaction costs as share of total costs or revenues are
higher relative to large businesses. The Government policies aimed at reducing transaction
costs can stimulate growth of SMEs. The Government policies in support of SMEs should focus
on creating positive externalities for SMEs in the form of level credit markets, security,
competition and a low-cost equitable legal system. These policies can be implemented in the
long run and their impact would also be in the long run. However, most government policies
focus on different set of incentives (Windhoek Chamber of Commerce and Industry Branch,
2012).
The Chamber further criticises that Government policies’ focus on investment and tax incentives.
However, these policies are not effective in the long run and do not meet the expectations of the
businesses. Such efforts tend to support unprofitable activities and are inefficient. On the other
hand, governments can create an environment which will be effective in the long run such as
improving education, training and development of SME clusters.
Gaomeb (2012), claims that government policies must protect domestic SMEs from foreign
competition. Liberal access for imported goods and services to Namibian markets is likely to
undermine SME chances of success. A recent study into Chinese investments in Namibia, found
41
that the welcoming attitude towards Chinese investments that seemed prevalent amongst
Namibian politicians and government officials was not shared by Namibia’s small entrepreneurs
(Bank of Namibia Symposium, 2010).
A Labour Resource and Research Institute (LaRRI, 2008) study points out that in 2008, a group
of indigenous business people in Northern Namibia had publicly voiced their outrage over what
they termed unfair competition from Chinese traders. The group’s chairman Epafras
Mukwiilongo stated that, “some of Chinese get subsidies from their government. They can afford
to sell their products at a very low price and local entrepreneurs do not have any type of
protection. The group chairman further states that Chinese investors are taking all the business
opportunities from the local people. The government is telling the youth that they should go and
establish SMEs, but how does government expect these people to compete against skilled and
experienced business people if they are not given any type of protection (LaRRI, 2008)?”
The Foreign Investment Act of 1990 that makes provision for the promotion of foreign
investments in Namibia, reads as follows, “Subject to the provisions of this Section 3(1) and the
compliance with any formalities or requirements prescribed by any law in relation to the relevant
business activity; a foreign national may invest and engage in any business activity in Namibia
which any Namibian may undertake.” This statement is in contradiction with the SME policy
framework that focuses on key areas of intervention such as deregulation of the Namibia market
by protecting infant industry from foreign businesses. The Policy restricts Foreign Direct
Investment and Free Trade Area (FTA) (MTI, 1997). Namibia has still not signed the FTA as
required by the European Union because of domestic businesses protection. Edmiston (2007)

42
concurs that small enterprises are more flexible and better able to adapt to market conditions.
Therefore, it is important to create a conducive environment in which small enterprises can
operate, innovate and create needed jobs as a strategy to better economic development.
Sacerdoti’s (2013) proposal for the creation of an enabling environment for SMEs is based on
market-friendly, supply-side interventions. His paper does not provide an analysis of how
liberalised economies and fierce competition may undermine the development and growth of
SMEs. Nakusera (2008) points out that the “South-East Asian Tigers”, for example, advanced
their economic growth on the basis of state interventions in the economy, coupled with
systematic support and protection for local companies. This only changed gradually once local
companies had grown and were firmly established; and able to survive international competition.
Such an approach may hold relevant lessons for Namibia since our markets are dominated by
imports in virtually all sectors (Nakusera, 2008).
2.5 Chapter Summary
In this chapter the focus is on defining an SME, understanding the concepts of the importance of
small and medium enterprises. An exposition of the measures of growth of SMEs in Namibia,
challenges faced by SMEs generally in the micro, market and macro environment and the
Namibian Government’s policies relating to SMEs was given. The discussion is mainly done on
SMEs’ contribution in the US, UK, Asia and few countries in Africa including Namibia. It has
been confirmed by many authors that the small business sector is a viable vehicle, in the
economy supported by relevant statistics. While authors agree on the importance of the small
business sector, they also take note of the growth challenges faced by the SME sector.
43
CHAPTER THREE
3. RESEARCH METHODOLOGY
Chapter Three focuses on the methodology that was employed in this study. The chapter is
divided into the following sections. Research design is discussed in Section 3.1. Section 3.2 has
detailed the population from which the study obtained its findings. Sampling technique is
outlined in Section 3.3. Section 3.4 depicts research instruments and measures used to collect
data. Section 3.5 portrays the procedure undertaken to collect the data. Section 3.6 displays the
analytical technique the research used to produce the final results.
3.1 Research Design
This study employed a mixed method approach, which comprises of the qualitative and
quantitative research designs. The quantitative research design enabled the researcher to collect
data using questionnaires and convert the data into numerical form so that statistical analyses can
be made and conclusions drawn. The qualitative design enabled the researcher to gather data
through interviews and focus group discussions with the use of open-ended questions.
3.2 Population
The population of this study consists of registered SMEs operating from Soweto Markets and Dr.
Libertina Amadhila incubators within Katutura Central Constituency. Tirivangani (2013), reports
that the number of registered enterprises operating at the Libertina Amadhila and Soweto Market
Incubation Centres is 500. The selected incubators accommodate a number of tenants who
engage in many different enterprises.

44
3.3 Sample
According to Cresswell (1994), the sample size of a statistical sample is the number of
observations that constitutes it. It is typically denoted by n, a positive integer (natural number).
Sampling is the act, process, or technique of selecting a suitable sample, or a representative part
of a population for the purpose of determining parameters or characteristics of the whole
population (Zikmund, 2000). The latter further explaines that sampling methods are classified as
either probability or non-probability. In probability samples, each member of the population has
a known non-zero probability of being selected. Probability methods include random sampling,
systematic sampling, and stratified sampling. In non-probability sampling, members are selected
from the population in some non-random manner. These include convenience sampling,
judgment sampling, quota sampling, and snowball sampling (Zikmund, 2000).
The cluster sampling technique was used to choose the sample from the population of this study.
The reason for using this technique is to ensure a high degree of representation of the population
under study. The population was divided into clusters, depending on the similarity of the
businesses they operate; for example clothing, salon and manufacturing. Respondents were
randomly selected from clusters. The sample size consisted of seventy five (75) entrepreneurs.
The choice of the sample size was governed by among other things; 15% weighted of the total
population of the study (500 x 15% =75), the confidence one has in the validity and
generalisation of the data to be collected, a tolerable margin of error, and ultimately the size of
the total population from which the sample was drawn.
45
3.4 Research Instruments
Questionnaires were used for data collection and were self-administered and retrieved. Reasons
for using questionnaires for data collection were that; large amounts of data can be collected
from a large number of people in a short period of time and in a relatively cost effective way.
The questionnaire items such as wording, naming, and questions chosen for the questionnaire
used in this study were precise, clear, simple, unambiguous and easy to understand.
Questionnaires comprised mainly close-ended and a few open-ended questions on selected
variables.
3.5 Research Procedure
Relevant authorisation from The University of Namibia, Namibia Business School and Small
and Medium Enterprise owners was sought. A pilot study using 10 respondents was conducted
soon after the data collection instrument was approved by the supervisor. The purpose of the
pilot study, according to Saunders et al. (2000), and Cooper & Emory, (2001), is to refine the
questionnaire so that respondents will have no problems in recording the data. Furthermore, it
enables the researcher to obtain some assessment of the questions’ validity and the likely
reliability of the data that will be collected. Data from ten (10) respondents were analysed and
the results was interpreted for correctness of the research instruments. This was then given to the
supervisor who read and made corrections and improvements to ensure its validity.
Appropriate modification was then done on the instruments. This was then be followed by the
full scale data collection. This was done by administering the questionnaires to entrepreneurs
around the Katutura Central Constituency. This was done in a period of three weeks. Both
46
primary and secondary data was gathered. Primary data was collected from respondents and
secondary data was collected from books, journals, magazines, newspapers, pamphlets,
documents and the internet. The reason for gathering secondary data was to provide a baseline
with which collected primary data results could be compared to.
3.6 Data Analysis
The data entry process started as soon as questionnaires were collected from the field.
Qualitative data was analyzed manually by first summarizing the information gathered and
followed by categorization and coding into emerging themes. The quantitative data were then
analyzed using a statistical package of Microsoft Excel to increase the accuracy of the results.
Data generated from close-ended questions were analysed using descriptive statistics techniques.
The purpose of using descriptive statistics was to enable the researcher to describe what the data
showed on graphic analysis. For example, 80% of respondents agreed that lack of finance was
the primary challenge that hampered the growth of their enterprises. Graphs, charts and tables
were used to present quantitative data.
Qualitative data was categorised and sorted into themes or patterns, ideas, concepts or phrases in
order to attach meaning and significance to the findings. The narrative analysis technique was
used to analyse complex textual descriptions of data that had been gathered from secondary
sources, and from open-ended questions.
47
3.7 Research Ethics
The following research ethics were strictly adhered to during data collection. SME owners’
consent was sought and obtained before data was collected from the SMEs located within the
Katutura Central Constituency. Oral consent was obtained from each respondent before any
interview or discussion was conducted. Confidentiality was also assured to the respondents and
was observed by ensuring that unauthorized persons had no access to the data collected.
Respondents’ names or identity was not linked to any research materials, and that they were not
identified in any report or reports that resulted from the research. Data collected were solely used
for educational purposes on the growth of SMEs, with specific reference to Namibia. The
research was independent and impartial, and did not tarnish the image of the Namibian
Government nor anybody, nor any institution by publishing controversial information.
3.8 Chapter summary
Chapter Three focused on the research methodology that was employed in this study. The mixed
method approach comprising qualitative and quantitative research designs was discussed. The
population and sample of the study were clearly indicated. The chapter discussed instruments
that were used to collect primary and secondary data. Interviews and questionnaires were used to
collect primary data. Secondary data was extracted from books, journal articles, magazines,
research reports, and pamphlets. The research procedure that was followed in order to execute
the study was also outlined. Data analysis techniques that used were to analyse the data were also
highlighted.

48
CHAPTER 4
4. DATA ANALYSES AND DISCUSSION
This chapter presents the results of the analysis of the responses made to the interviews, focus
group discussions, and questionnaire schedules administered to the sampled entrepreneurs
operating small and medium enterprises within Katutura Central Constituency. The Chapter is
divided into the following sections. Section 4.1 provides the response rate. Section 4.2 shows
respondents’ demographical data. Section 4.3 presents an analysis of micro environmental
challenges on SMEs. Section 4.4 is about market environmental challenges on SMEs while
Setion 4.5 provides an analysis of macro environmental challenges. The Chapter summary is
given in Sections 4.6.
4.1 Response Rate
Table 1 below shows the response rate.
Sample of
the research
study
Number of
self-
administered
questionnaires
Number of
retrieved
questionnair
es
Number of group
discussion for 5
entrepreneurs
Number of
interviews
conducted
Response
rate
75 60 46 5 people x 3 group
discussions
10 95%
Total
Respondents
71
Table 1. Number of respondents
Table 1 above shows that, forty six (46) filled questionnaires were received from respondents;
ten (10) face-to-face interviews were contacted, and three focus group of five (5) entrepreneurs
were formed. The rate of response is 95% of the total sample of 75.

49
4.2 Demographical data of the entrepreneurs
The aim of this finding was to outline the demographic information of the respondents, type of
enterprises they operate, duration of operating their enterprises, and registration of the
enterprises. It aimed to validate the research topic in terms of registration of SMEs, and the
problem statement in terms of the duration of operating an enterprise.
4.2.1 Gender of respondents
The gender of the respondents was analysed and the results are shown in Table 2 below.
Gender Number
of respondents
%
Male 29 40
Female 42 60
Total 71 100
Table 2. Respondents by gender
It is indicated by the number of respondents that females that operate small and medium
enterprises are more than men entrepreneurs.
4.2.2 Age of respondents
Table 3 below shows the age of respondents.
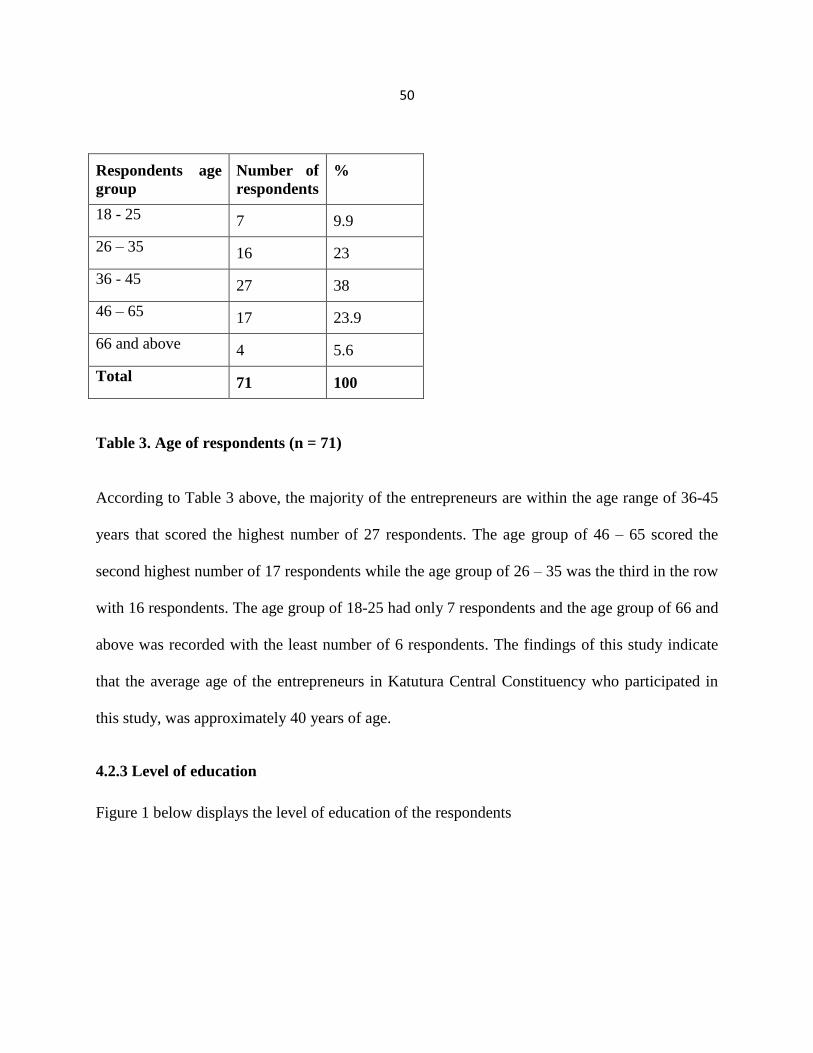
50
Respondents age
group
Number of
respondents
%
18 - 25 7 9.9
26 – 35 16 23
36 - 45 27 38
46 – 65 17 23.9
66 and above 4 5.6
Total 71 100
Table 3. Age of respondents (n = 71)
According to Table 3 above, the majority of the entrepreneurs are within the age range of 36-45
years that scored the highest number of 27 respondents. The age group of 46 – 65 scored the
second highest number of 17 respondents while the age group of 26 – 35 was the third in the row
with 16 respondents. The age group of 18-25 had only 7 respondents and the age group of 66 and
above was recorded with the least number of 6 respondents. The findings of this study indicate
that the average age of the entrepreneurs in Katutura Central Constituency who participated in
this study, was approximately 40 years of age.
4.2.3 Level of education
Figure 1 below displays the level of education of the respondents

51
Figure 1. Respondents' level of education
The level of education of the respondents was sought in order to establish the level of literacy of
entrepreneurs. Figure 1 above shows that 60% of the respondents had a primary level of
education; 27% had attained secondary level of education, and 3% had attained a university level
of education. Only 10% had no education level. Hall (2005) suggested that the level of education
and the attendance of management training courses is also an important aspect in terms of small
firm survival.
4.2.4 Types of enterprises
Figure 2 below shows the types of small and medium enterprises that are operated by the
respondents.

52
Figure 2. Types of enterprises
Thirty (30) percent of the respondents as shown in Figure 2 above indicated that they operate
shebeens; 25% of the respondents operate clothing enterprises; 10% operate salons and 5% each
are engaged in restaurant, auto panel, electrical and electronic repairs and manufacturing.
Entrepreneurs operating, key cutting and lock repair are 3%. Another 3% constitute
entrepreneurs in the shoe repair industry, 2% are operating bakeries, and only 1% percent is in
upholstery.
The shebeen industry scored the highest percentage, seconded by clothing. This indicates that
the two industries have many competitors compared to upholstery and bakery. These findings
can be supported by Gaomeb (2011) who narrated that Namibians must identify products and
services of SMEs where they are marginally competitive or marginally uncompetitive. Since
they are marginally competitive globally; they may still be competitive domestically and

53
regionally and hence can still become another peg for the economy. Such industries may be
construction, maintenance, carpentry, transport, ICT and body care. Gaomeb (2011) further
narrates that there are products and services where Namibian entrepreneurs are not competitive,
and where the prospects for becoming competitive are quite remote.
4.2.5 The length of operating the enterprise
Figure 3 below illustrates number of years that respondents operated their enterprises.
Figure 3. Duration of operating the enterprise
Figure 3 above reveales that 36 percent of the respondents indicated that they had operated their
enterprises for a period between one and three years, and 21 percent of the respondents had only
operated for less than a year. Those respondents who had been operating their businesses
between 3 and 10 years constituted 33 percent of the sample. Those who had been in operation
for more than 10 years were only 10 percent of the sample. The data shows that 57 percent t of
the enterprises have been in existence for less than three years.
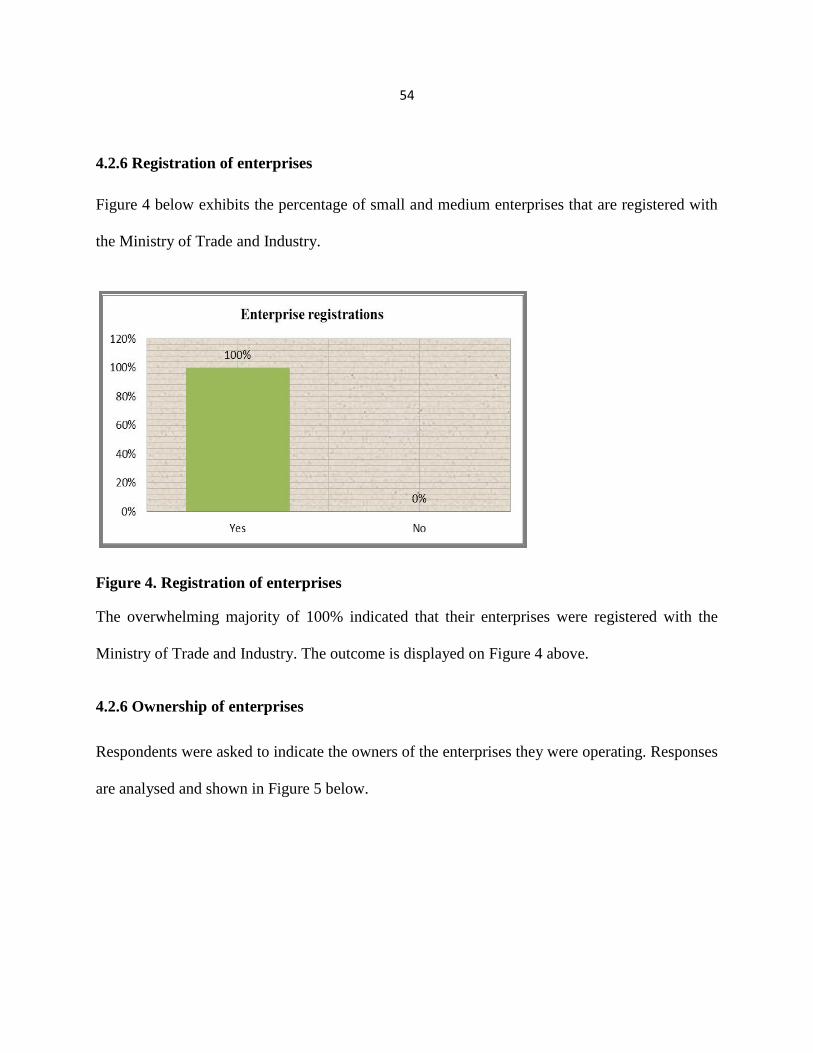
54
4.2.6 Registration of enterprises
Figure 4 below exhibits the percentage of small and medium enterprises that are registered with
the Ministry of Trade and Industry.
Figure 4. Registration of enterprises
The overwhelming majority of 100% indicated that their enterprises were registered with the
Ministry of Trade and Industry. The outcome is displayed on Figure 4 above.
4.2.6 Ownership of enterprises
Respondents were asked to indicate the owners of the enterprises they were operating. Responses
are analysed and shown in Figure 5 below.

55
Figure 5. Ownership of the enterprise
The study also sought to find out whether entrepreneurs had other investors, owned by the
family, owned by other firms or owned by business associates. An overwhelming 100% of the
respondents indicated that they were the owners of the enterprises they are operating.
4.3 Micro environmental challenges
The aim of this finding was to establish whether SMEs are growing or not. The growth is
measured by an increase in production of goods, stock level, sales, number of employees,
equipment base, vehicle base, and profit earned by SMEs. This finding addresses research
Question number two (2).
4.3.1 Stock levels increased or not
Figure 6 below displays whether respondents had increased the level of their stock since the
establishment of their enterprises.

56
Figure 6. The level of stocks increased
Respondents were asked to confirm whether their stock had increased or not since the
establishment of their enterprises. A follow up question was raised to establish why their stocks
had not increased. The results are presented on the pie chart on Figure 6 above.
Figure 6 above shows that 75% of the respondents confirmed that they had not increased their stock
since the inception of their enterprises; 25% of the respondents, indicated that they had increased
their stock. Megginson (2003) believes that the owner-managers’ ability to plan is imperative for
future growth and survival of the enterprise. The respondents (75%) that had not increased their
stocks indicated that they had not made enough profit to buy more stock, and the profit that they
earned was usually used to sustain them and not to increase the stock.
4.3.2 Sales levels increased or not
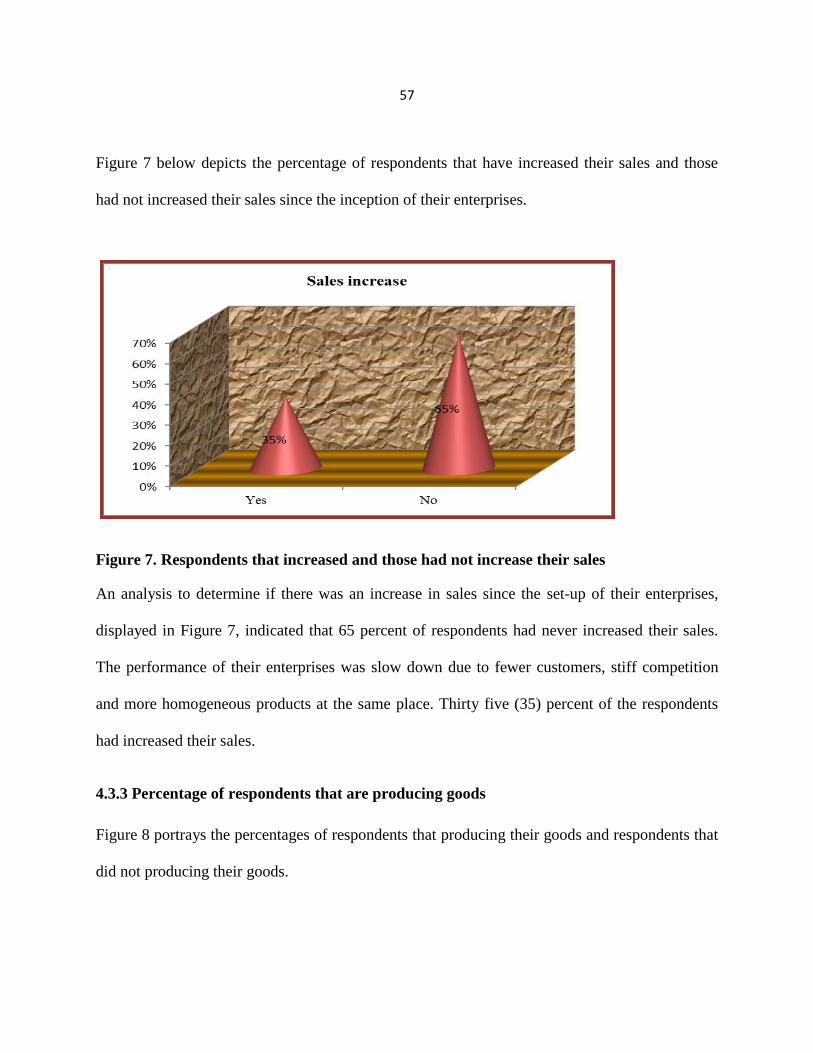
57
Figure 7 below depicts the percentage of respondents that have increased their sales and those
had not increased their sales since the inception of their enterprises.
Figure 7. Respondents that increased and those had not increase their sales
An analysis to determine if there was an increase in sales since the set-up of their enterprises,
displayed in Figure 7, indicated that 65 percent of respondents had never increased their sales.
The performance of their enterprises was slow down due to fewer customers, stiff competition
and more homogeneous products at the same place. Thirty five (35) percent of the respondents
had increased their sales.
4.3.3 Percentage of respondents that are producing goods
Figure 8 portrays the percentages of respondents that producing their goods and respondents that
did not producing their goods.

58
Figure 8. Respondents that producing and that did not producing their goods
The results in Figure 8 above show that only 69 percent of respondents are engaged in
production and 31 percent were not producing any goods.
4.3.3.1 Level of production attained
Figure 9 presents the outcome of the analysis of respondents that increased their production or
not.
Figure 9. Respondents that had increased their production and that had not
Figure 9 above shows that out of 69 percent of respondents that engaged in production, only 20
percent confirmed that they had increased their production, while 49 percent stated that they had
never increased their production.
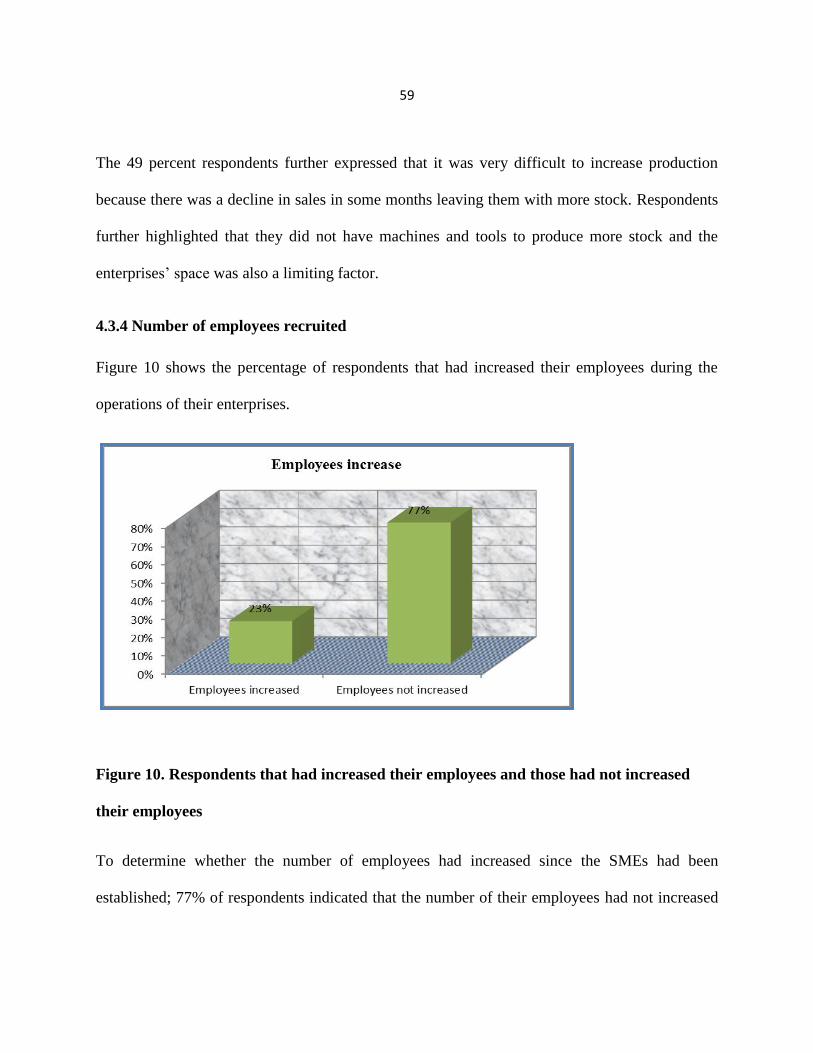
59
The 49 percent respondents further expressed that it was very difficult to increase production
because there was a decline in sales in some months leaving them with more stock. Respondents
further highlighted that they did not have machines and tools to produce more stock and the
enterprises’ space was also a limiting factor.
4.3.4 Number of employees recruited
Figure 10 shows the percentage of respondents that had increased their employees during the
operations of their enterprises.
Figure 10. Respondents that had increased their employees and those had not increased
their employees
To determine whether the number of employees had increased since the SMEs had been
established; 77% of respondents indicated that the number of their employees had not increased

60
since the setting up of their enterprises. Twenty three (23) percent confirmed that they had
increased the number of employees.
The reasons for not recruiting more employees were that: The size of the enterprises did not
require the owner to recruit more than two people; there was insufficient money to pay salaries;
the workload was not too much and employees’ turnover was too high and costly.
4.3.5 Profit earned since the establishment of the enterprise
Figure 11 displays the percentage of the respondents that earned profit and that did not earned
any profit since the establishment of their enterprises.
Figure 11. Respondents that increased their profit and those had not increase their profit
As shown in Figure 11 above, 87% of respondents confirmed that they had not earned profit
while 13% of respondents had earned profit. The 87 percent explained that it was very hard to
earn profit because of the following reasons. Firstly, the prices of raw materials were ever
increasing. Secondly, the sales were not good all the time. In some days the entrepreneur would

61
not even sell a single product. Stock sometimes got wasted especially in the catering industry due
to perishability of food especially vegetables.
Finally, rental fees for the incubations were also high, hence, the operation expenses were taking
a big portion of the money earned from the sales.
4.3.6 Vehicle base that were increased and that were not increased
Figure 12 below shows respondents that had increased the level of vehicle base and that were not
increased their vehicle base.
Figure 12. Percentages of vehicle base that were increased and that did not increased
As indicated in Figure 12 above, 98 percent of the respondents confirmed that they had not
increased the number of their vehicles since the inception of their businesses. They stated that
vehicles were very expensive and the money earned from the sales was not enough to buy a
vehicle. They further explained that they were not qualified to buy vehicles via financial

62
institutions or get loans from other sources. Two (2) percent of the respondents indicated that
they had managed to increase the number of their vehicles.
4.3.7 Level of equipment base that were increased
Figure 13 below illustrates the percentages of respondents that had increased their equipment
base and those had not increased their equipment during the operations of their enterprises.
Figure 13. Respondents that had increased their equipment base and those had not
increased their equipment
Respondents were asked whether they had increased the number of their equipment since the
establishment of their enterprises. The data in Figure 13 above indicates that 79 percent indicated
that they had not increased the number of their equipment because, equipment was very
expensive and they did not have enough money to buy additional equipment. They also
highlighted that the government was very reluctant in assisting them with equipment. Twenty
one (21) percent of the respondents confirmed that they had increased their equipment.

63
4.4 Market environment challenges
The purpose of this finding was to establish the challenges that were faced by the SMEs under
study. It aimed to find out whether competition, access to loans, repayment of loans, lack of
reliable suppliers, homogeneous goods in the market, and potential customers are some of the
challenges faced by SMEs in Katutura Central Constituency. It addresses research Question
number three (3).
4.4.1 Number of customers attracted
Figure 14 below shows whether the number of customers had increased since the establishment
of respondent’s enterprises.
Figure 14. Respondents that had increased their customers
As illustrated in Figure 14 above, seventy (70) percent of the respondents indicated that the
number of their customers had not been increased. They pointed out that it was difficult to attract
customers from their competitors.
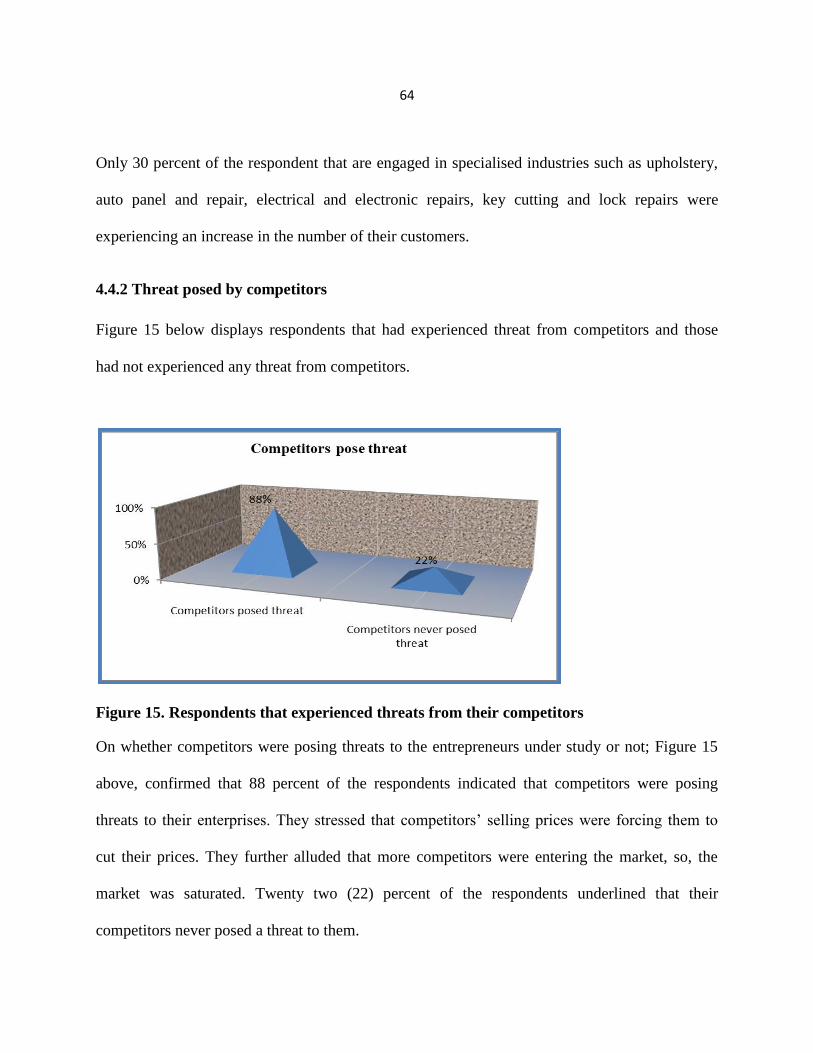
64
Only 30 percent of the respondent that are engaged in specialised industries such as upholstery,
auto panel and repair, electrical and electronic repairs, key cutting and lock repairs were
experiencing an increase in the number of their customers.
4.4.2 Threat posed by competitors
Figure 15 below displays respondents that had experienced threat from competitors and those
had not experienced any threat from competitors.
Figure 15. Respondents that experienced threats from their competitors
On whether competitors were posing threats to the entrepreneurs under study or not; Figure 15
above, confirmed that 88 percent of the respondents indicated that competitors were posing
threats to their enterprises. They stressed that competitors’ selling prices were forcing them to
cut their prices. They further alluded that more competitors were entering the market, so, the
market was saturated. Twenty two (22) percent of the respondents underlined that their
competitors never posed a threat to them.

65
4.4.3 Threat posed by similar products in the market place
Figure 16 below portrays whether homogeneous and substitute products had posed threats to the
respondents’ products or goods.
Figure 16. Threat posed by similar products in the market place
The analysis on Figure16 above, shows that 89 percent of the respondents confirmed that similar
products in the market were posing a threat to their products. Customers can buy anywhere as
similar products are all over the incubation centres. Many products sold by entrepreneurs were
targeting a small number of customers and some products were cheaper below the market prices.
Eleven (11) percent of respondents denied facing any threats posed by similar products in the
market place.
4.4.4 Suppliers deliver orders on time
Figure 17 below depicts respondents that had suppliers and those had no suppliers.

66
Figure 17. Respondents that had suppliers
Results presented in Figure 17 above shows that 100% of the respondents established that they
did not have suppliers but they buy directly from retailers. They confirmed that they were not
buying from one retailer but from many retailers depending on their prices.
4.4.5 Enterpreneurs advertising their products
Figure 18 below shows respondents that had advertised their goods and services and those had
not advertised their products.
Figure 18. Advertisement of goods and services
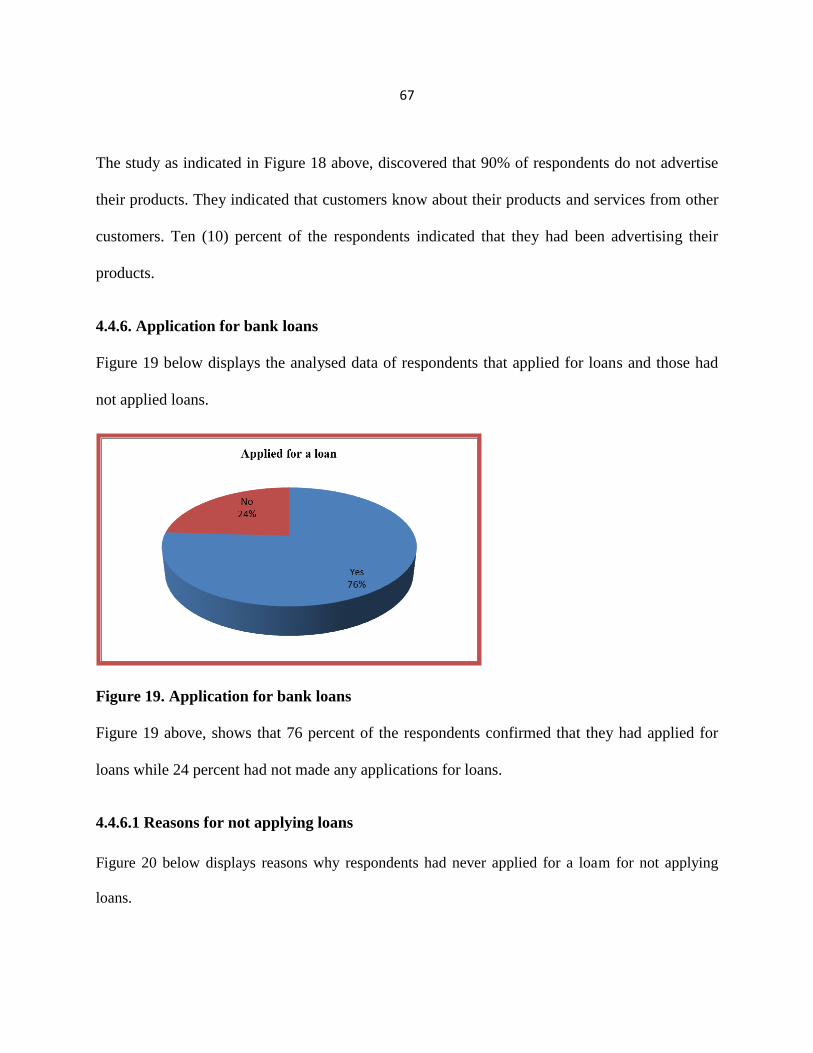
67
The study as indicated in Figure 18 above, discovered that 90% of respondents do not advertise
their products. They indicated that customers know about their products and services from other
customers. Ten (10) percent of the respondents indicated that they had been advertising their
products.
4.4.6. Application for bank loans
Figure 19 below displays the analysed data of respondents that applied for loans and those had
not applied loans.
Figure 19. Application for bank loans
Figure 19 above, shows that 76 percent of the respondents confirmed that they had applied for
loans while 24 percent had not made any applications for loans.
4.4.6.1 Reasons for not applying loans
Figure 20 below displays reasons why respondents had never applied for a loam for not applying
loans.

68
Figure 20. Reasons why respondents had not applied for loans
Figure 20 above indicates the respondents that did not apply for loans. Sixty (66) percent of the
respondents that did not apply for loans indicated that they had never applied for loans because they
did not want to take risk of re-paying the loans for a long period. They further stressed that loans are
very expensive because of high interest rates. Fifteen (15) percent of the respondents indicated that
they had never applied for bank loans because they were afraid that their applications would be
rejected, and 19 percent of the respondents indicated that they never applied because of lack of
information.
4.4.7 Receipt of bank loans
Figure 21 below indicates the outcome of the loans applications.
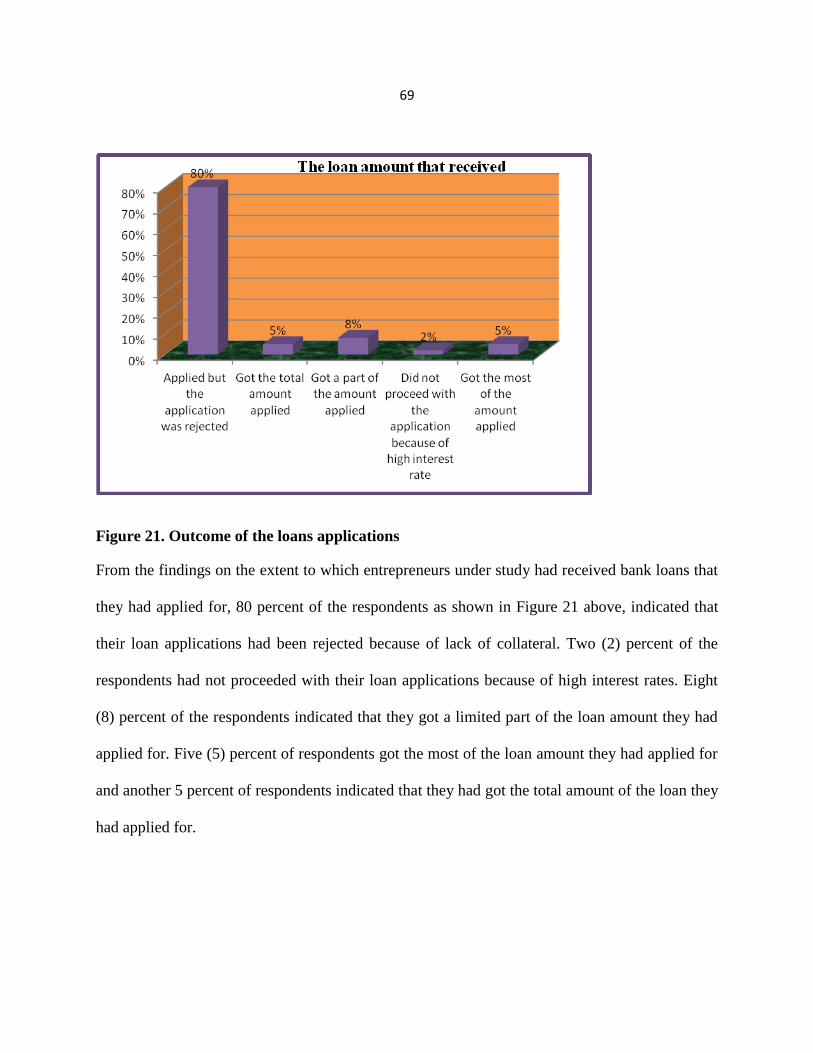
69
Figure 21. Outcome of the loans applications
From the findings on the extent to which entrepreneurs under study had received bank loans that
they had applied for, 80 percent of the respondents as shown in Figure 21 above, indicated that
their loan applications had been rejected because of lack of collateral. Two (2) percent of the
respondents had not proceeded with their loan applications because of high interest rates. Eight
(8) percent of the respondents indicated that they got a limited part of the loan amount they had
applied for. Five (5) percent of respondents got the most of the loan amount they had applied for
and another 5 percent of respondents indicated that they had got the total amount of the loan they
had applied for.
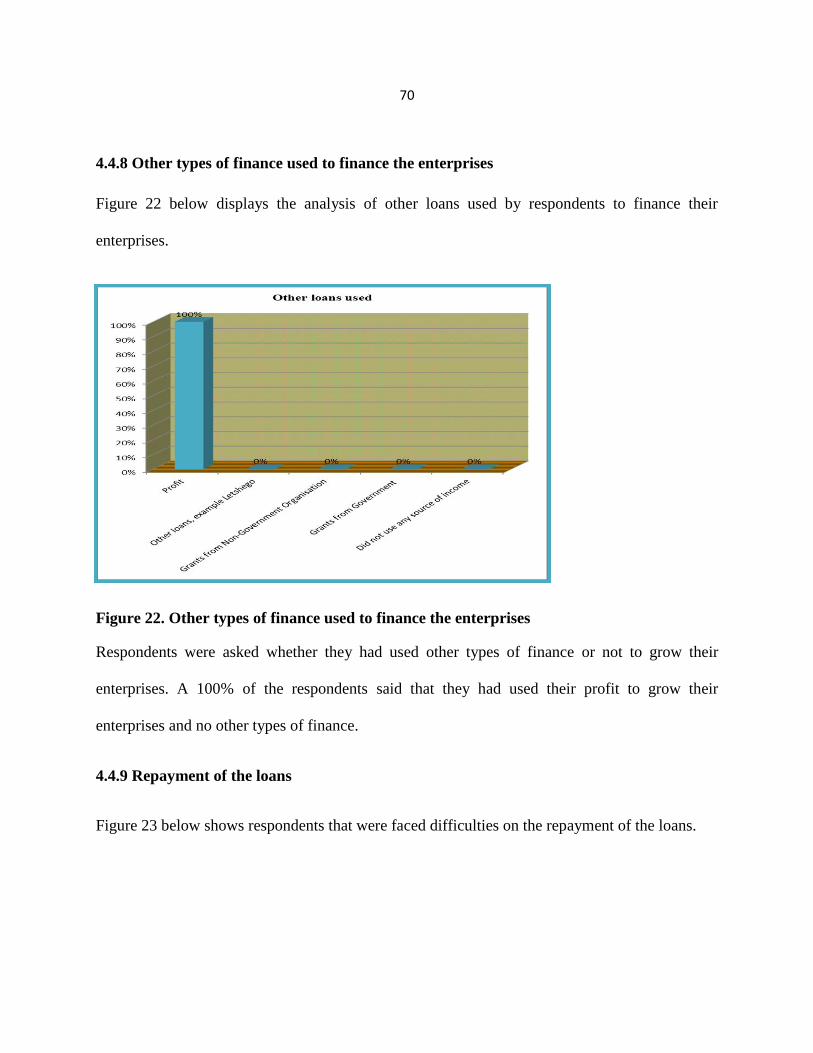
70
4.4.8 Other types of finance used to finance the enterprises
Figure 22 below displays the analysis of other loans used by respondents to finance their
enterprises.
Figure 22. Other types of finance used to finance the enterprises
Respondents were asked whether they had used other types of finance or not to grow their
enterprises. A 100% of the respondents said that they had used their profit to grow their
enterprises and no other types of finance.
4.4.9 Repayment of the loans
Figure 23 below shows respondents that were faced difficulties on the repayment of the loans.

71
Figure 23. Respondents that faced difficulties in repaying the loans
It was found out by this study as displayed in Figure 23 above, that 77% of the respondents that
had secured bank loans had been facing difficulties in repaying their loans. They outlined that
interest rates are very high and the repaying period is long. The money that is earned is not
enough to repay the loan and to maintain the enterprise. Twenty three (23) percent of the
respondents acknowledged that they did not face any difficulties to repay their loans.
4.4.10 Improvement on the growth of business by the loans
Figure 24 illustrate whether the loans had improved the growth of the small and medium
enterprises.

72
Figure 24. Improvement to the growth of business by the loans
As indicated in Figure 24 above, it was established that 24% of the respondents that were granted
bank loans had improved the growth of their enterprises. Seventy six (76) percent of the bank
loan recipients had indicated their dissatisfaction that the bank loans did not improve the growth
of their enterprises. The loans had been used to finance other expenses such as; maintenance,
rent, and production costs (labour, material, water and electricity and other overhead costs).
4.5 Macro environmental challenges
Respondents’ perceptions of government’s policies relating to SMEs
The purpose of this finding was to determine whether government policies are in favour of SMEs
development and promote SMEs’ growth. It aimed to determine whether the business
environment is conducive to SMEs to do business without unfair competitions. Moreover, it was
also meant to find out whether local SMEs were protected against foreign entrepreneurs by
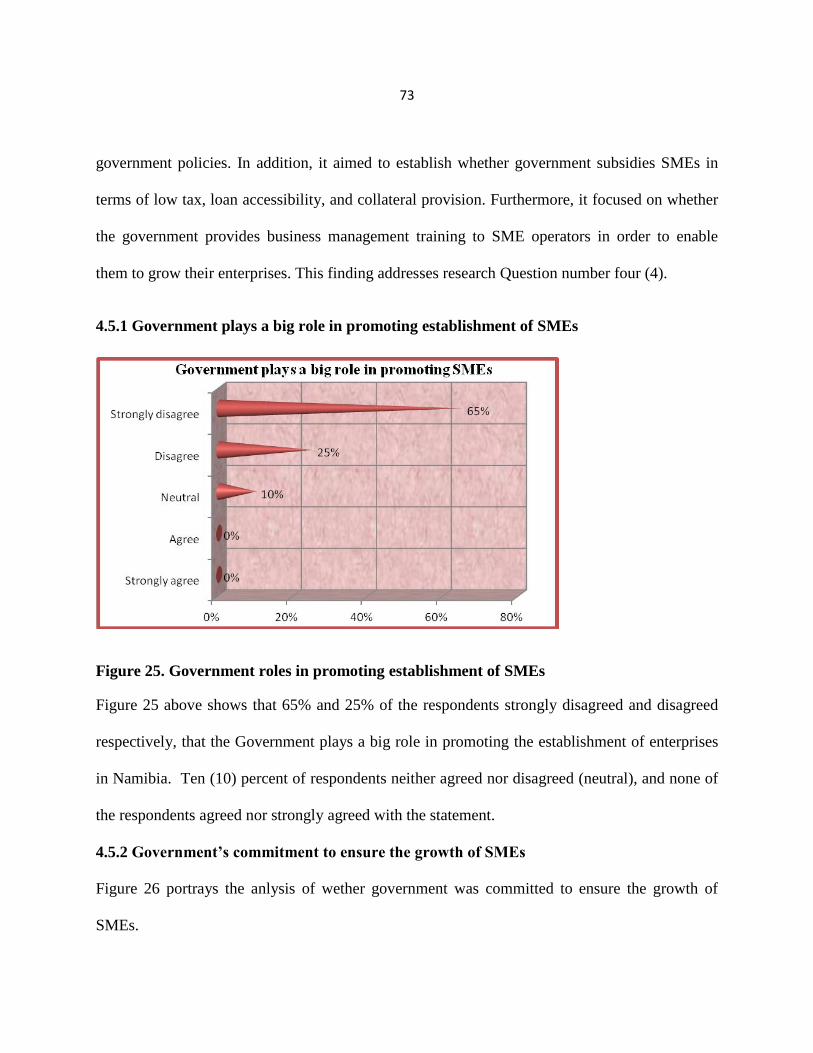
73
government policies. In addition, it aimed to establish whether government subsidies SMEs in
terms of low tax, loan accessibility, and collateral provision. Furthermore, it focused on whether
the government provides business management training to SME operators in order to enable
them to grow their enterprises. This finding addresses research Question number four (4).
4.5.1 Government plays a big role in promoting establishment of SMEs
Figure 25. Government roles in promoting establishment of SMEs
Figure 25 above shows that 65% and 25% of the respondents strongly disagreed and disagreed
respectively, that the Government plays a big role in promoting the establishment of enterprises
in Namibia. Ten (10) percent of respondents neither agreed nor disagreed (neutral), and none of
the respondents agreed nor strongly agreed with the statement.
4.5.2 Government’s commitment to ensure the growth of SMEs
Figure 26 portrays the anlysis of wether government was committed to ensure the growth of
SMEs.

74
Figure 26. Government’s commitment towards the growth of SMEs
It is illustrated on Figure 26 above that 50 percent of the respondents strongly disagreed that the
Government is committed to ensure the growth of small and medium enterprises in Namibia.
Forty three 43 percent of the respondents disagreed with the statements, seventeen (17) percent
of the respondents were neutral and none of the respondents strongly agreed or agreed with the
statement.
4.5.3 Tax rates on enterprises
Figure 27 below shows the analysis to determine whether tax rates were favourable to the
entrepreneurs or not.

75
Figure 27. Tax rates on enterprises
It is shown on figure 27 above that the the tax rate is not favourable to the enterprises. Only 8%
of respondents agreed and 5 % strongly agreed with the assumptions that the tax rate is
favourable to enterprises. Nineteen (19) percent of the respondents were neutral, and 70% of the
respondents strongly disagreed that the tax rate is favourable to their enterprises.
4.5.4 Business management training
Figure 28 below depicts analysis of the responses on whether government provides business
management trainings.
Figure 28. Government provides business management training
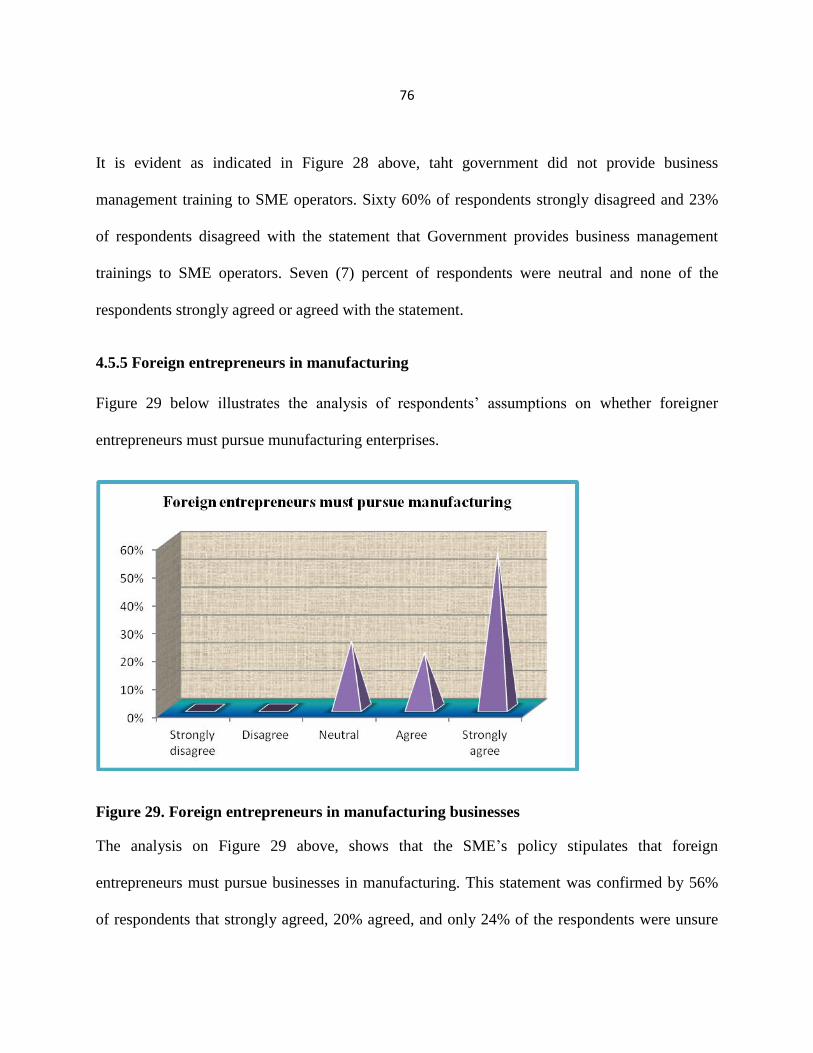
76
It is evident as indicated in Figure 28 above, taht government did not provide business
management training to SME operators. Sixty 60% of respondents strongly disagreed and 23%
of respondents disagreed with the statement that Government provides business management
trainings to SME operators. Seven (7) percent of respondents were neutral and none of the
respondents strongly agreed or agreed with the statement.
4.5.5 Foreign entrepreneurs in manufacturing
Figure 29 below illustrates the analysis of respondents’ assumptions on whether foreigner
entrepreneurs must pursue munufacturing enterprises.
Figure 29. Foreign entrepreneurs in manufacturing businesses
The analysis on Figure 29 above, shows that the SME’s policy stipulates that foreign
entrepreneurs must pursue businesses in manufacturing. This statement was confirmed by 56%
of respondents that strongly agreed, 20% agreed, and only 24% of the respondents were unsure
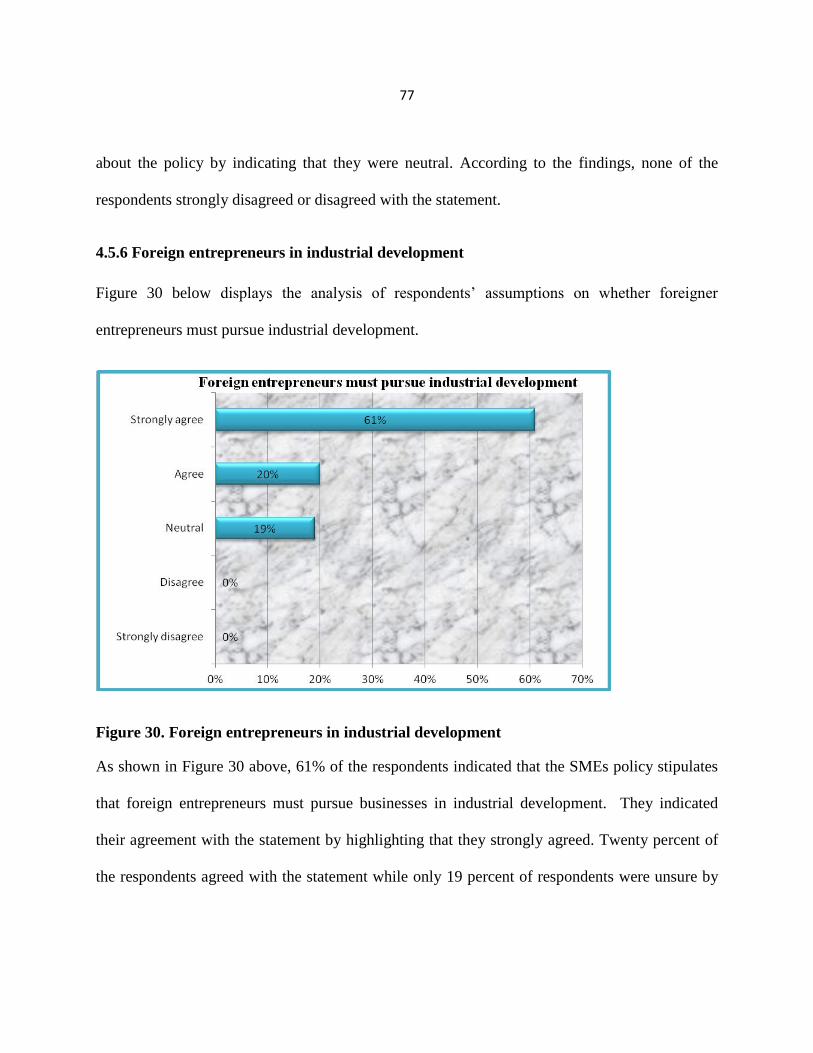
77
about the policy by indicating that they were neutral. According to the findings, none of the
respondents strongly disagreed or disagreed with the statement.
4.5.6 Foreign entrepreneurs in industrial development
Figure 30 below displays the analysis of respondents’ assumptions on whether foreigner
entrepreneurs must pursue industrial development.
Figure 30. Foreign entrepreneurs in industrial development
As shown in Figure 30 above, 61% of the respondents indicated that the SMEs policy stipulates
that foreign entrepreneurs must pursue businesses in industrial development. They indicated
their agreement with the statement by highlighting that they strongly agreed. Twenty percent of
the respondents agreed with the statement while only 19 percent of respondents were unsure by

78
indicating that they were neutral. None of the respondents strongly disagreed or disagreed with
the statement.
4.5.7 Entrepreneurs contribution to the formulation of SME policies
Figure 31 below illustrates responses on whether entrepreneurs had contributed to the
formulation of SME policies.
Figure 31. Formulation of SME policies
As it is shown in Figure 31 above, 77% of the respondents strongly disagreed that the
Government invited SMEs operators to contribute to the formulation of SME policies and ten
(10) percent of the respondents indicated that they disagreed with the statement. Thirteen (13)
percent of the respondents were neutral, and none of the respondents either strongly agreed or
agreed with the statements.

79
4.5.8 Government provides start-up capital
Figure 32 displays the analysis of responses on whether government provided start-up capital to
SME operators.
Figure 32. Government provision of start-up capital
Figure 32 above, indicated that 100% of the respondents strongly disagreed that Government had
provided start-up capital for their enterprises.
4.5.8 Government grants collateral to SMEs
Figure 33 below shows the analysis of data on whether government granted collateral security to
entrepreneurs in order to secure loans.

80
Figure 33. Government’s provision of collateral to SMEs
This study revealed as shown in Figure 33 that, 100% of respondents strongly disagreed that
Government granted collateral to entrepreneurs to get loans from financial institutions.
4.6 Addressing growth challenges faced by registered SMEs in Katutura Central
Constituency
Responses to the question on how growth challenges faced by registered small and medium
enterprises in Katutura Central Constituency can be tackled; respondents stressed that
Government must provide big business infrastructure that will enable the accommodation of big
business operations. Government must also render assistance in terms of equipment and other
necessary tools. Facilities must be strategically located so that many people can get access to their
enterprises. Government must subsidise SMEs, and it must disseminate information on SME
policies. The respondents further highlighted that Government must regulate the prices of input

81
and rental fees because these prices are ever increasing. Platform to advertise SMEs’ products
must also be created by the government. It is the government’s obligation to see to it that
entrepreneurs receive the requisite training. Respondents strictly highlighted that foreigners must
be restricted from operating SMEs as local entrepreneurs.
4.7 Chapter summary
The chapter presented, analysed, and interpreted data collected in the study. Charts, tables and
graphs were used to present the analyses of the data. The study revealed that stringent government
policies relating to SMEs and lack of subsidies, and other micro and market environmental
challenges such as competition, lack of finance, and equipment, limited enterprise spaces, and
lack of business management skills have contributed to the stagnant process of SMEs growth.
Chapter 5 focuses on summary, conclusions and recommendations of the study.

82
CHAPTER FIVE
SUMMARY, CONCLUSIONS AND RECOMMENDATIONS
Chapter Five presents the summary of the study, conclusions on the findings of the study and the
recommendations aimed to the entrepreneurs and the Government of the Republic of Namibia.
This chapter is divided into the following sections. Section 5.1 details the summary of the study.
Conclusions of the findings are indicated in Section5.2. Recommendations are given in Section
5.3. Section 5.4 presents the limitations of the findings, and the area for further research is
highlighted in Section 5.5. Section 5.6 highlights the chapter summary.
5.1 Summary
The study set out to investigate the growth challenges faced by small and medium enterprises
within the Katutura Central Constituency. The aim was to find out why there was mushrooming
of SMEs in Windhoek that were not growing to be formal businesses. Some of these SMEs were
established more than 10 years ago. The City of Windhoek established the SME Incubation
Centres in Katutura with the objective of assisting small businesses to breed and evolve into
formal small and medium enterprises in a period of between two and three years after entering
incubation. It is confirmed that, most of the businesses that entered the SME Incubation Centres
during its opening in 2002 are still in incubation. The investigation was done on government
policies related to SMEs, measures of growth of small and medium enterprises in Namibia,
growth challenges faced by registered small and medium enterprises in the micro, market and
macro environments in Katutura Central Constituency. The measures to tackle the growth
challenges faced by registered small and medium enterprises were also suggested.

83
The research study employed a mixed method approach, comprising of the qualitative and
quantitative research designs. Questionnaires and interviews were utilised to collect data.
Primary and secondary data were collected. The sample size of 75 respondents was drawn from
the population of 500 entrepreneurs.
The major findings of the study were; competition and lack of access to finance are the most
challenges that hamper the growth of SMEs. A number of challenging factors such as
insufficient capital (money), poor location, characteristics of the business environment (for
example, homogeneous products in the market, and prices of homogeneous were also pointed out
that they posed threats to the growth of the SMEs. It was also found that the limited accessibility
to finance options for SMEs is a result of lack of appropriate collateral and high interest rate on
the repayment of loans.
5.2 Conclusions
This study focused mainly on challenges that inhibit the growth of small and medium enterprises
(SMEs) in Namibia, specifically in Katutura Central Constituency. Based on the findings, the
following conclusions are drawn.
1. Research Question One: What are the growth challenges faced by SMEs generally, in
the micro, market and macro environment?
This question was answered by the literature review. It is generally highlighted that SMEs face
unique problems, which affect their growth and profitability and, hence, diminish their ability to
contribute effectively to sustainable development. These problems include lack of access to
84
credit, inadequate managerial and technical skills, low levels of education, poor market
information, inhibitive regulatory environments, lack of access to technology, and lack of
infrastructure. Environmental conditions such as unattractive tax regimes and legal systems,
small local markets, and corruption have also hampered the development of SMEs.
2. Research Question Two: Do registered SMEs in Katutura Central Constituency in
Namibia grow?
Based on findings, it can be concluded that many enterprises were not growing. Growth was
measured by identifying some variables such as level of sales, level of production, earned
profit, number of employees, customers, vehicles and the equipment base.
3. Research Question Three: What are the growth challenges faced by registered SMEs in
the micro, market and macro environment in Katutura Central Constituency in
Namibia?
Conclusions that can be drawn from this question are that, entrepreneurs that are operating in
Katutura Central Constituency faced numerous of growth challenges. Entrepreneurs stressed
that competition and lack of access to finance are the most challenges that hamper the growth
of their enterprises. They had listed a number of challenging factors such as insufficient
capital (money), poor location, characteristics of the business environment (for example,
homogeneous products in the market, prices of homogeneous products are very low that
forced them to lower their prices, customers’ behavior, and no barriers to new entrants. It was

85
also found that the limited accessibility to finance options for SMEs is a result of lack of
appropriate collateral and high interest rate on the repayment of loans.
4. Research Question Four: What are the perceptions of registered SMEs owners
regarding Namibian Government policies to ensure the growth of SMEs?
Based on this research question, it can thus be concluded that entrepreneurs perceived that
Government did not play a big role in promoting the growth of enterprises in Namibia.
Entrepreneurs indicated that company tax rate is very high. Government does not provide
business management trainings to SME operators. Many entrepreneurs confirmed that SME
policies stipulate that foreign entrepreneurs must pursue businesses in manufacturing and
industrial development. The government does not invite SMEs operators to contribute to the
formulation of SME policies. There was no indication from any of the respondents that
government granted collateral to entrepreneurs to get loans from financial institutions
5.2 Recommendations
The following recommendations are made, based on the findings and conclusions of the
research study.
5.2.1 Competition and expansion of enterprise operations
In view of the above conclusions, based on competition and expansion of enterprise
operations, it is recommended that SMEs must have a ‘global outlook’. Businesses of all sizes
across the globe can interact and share information, technology and products. SMEs must
consider micro, market, and macro environmental trends affecting availability of resources,
86
increasing or decreasing demand for products or services and where there is an unfilled need.
This may prove a challenge to SMEs but the government can step in here to provide
information on business trends.
5.2.2 Planning
SMEs must be proactive in their planning, including identifying the most attractive, fast-
growing markets in order to be competitive and win the market share. SMEs must build
relationships with banks and other key financiers of investment and trade, to facilitate
introductions between these funding sources and SME clients.
There is also a need for SMEs to get trained in an area that is relevant to the business they
operate. This study has clearly shown a few percentages of entrepreneurs with tertiary
qualifications. Furthermore, there is a need to improve ways of gathering customer
information for the purpose of personalized marketing and service. The more a business
owner knows about its customers, the better they can meet their needs.
5.2.3 Policy making
Government policymakers must identify any additional information and support mechanisms
that can be targeted towards SMEs to encourage their involvement in fast-growing economies.
The government must look for opportunities to reduce unnecessary regulations concerning
trade and investment. It must create clear signposting to help SMEs identify and access the
full range of financial support available for business activities. The government together with
the private sector must develop knowledge and information resources to guide SMEs handle
challenges associated with micro, market, and macro environmental activities. Government

87
must put effort on dissemination of information on SME policies and government initiatives
regarding SMEs. Foreigners must be restricted from operating SMEs as local entrepreneurs.
5.2.4 Access to finance
The central government must work hand in hand with the private sector financial services to
curb the problems facing SME sector in terms of access to finance. government together with
commercial banks should relax their requirements to borrowers of money. The government
and commercial banks should lower their interest rates on borrowed loans in order to boost
SMEs operations in the sector. Government must subsidise SMEs and guarantee security
provision in terms of collateral.
5.2.5 Inadequate infrastructure
In view of SMEs’ lack of adequate business infrastructure and access to other capital, the
Government should above all promote entrepreneurship, facilitate firm start-up and
expansion. The government must provide big business infrastructure that will enable
accommodation of a big volume of business operations. It must also render assistance in terms
of equipment and other necessary tools.
5.2.6 Regulations
The government must also foster the development of secondary SMEs markets to allow easy
entry and exit for investors, easy taxes on capital gains and other earnings.
It must also allow greater use of subsidies options as compensation in small firms.
Governments must also foster business networks which will bring together SMEs and
prospective investors. Reducing the regulatory burden on SMEs can be one of the greatest
spurs to entrepreneurship.

88
5.2.7 Training
Government should provide training for SMEs in business management. Entrepreneurs should
be trained on how to grow their enterprises. They must be trained on how to formulate
appropriate business plans in order to explore, grants, loans and other finances.
5.3 Limitations of findings
The study did not get information on whether business plans and cash flow statements had any
effect on the access to bank loans. The study did not also probe whether theft and armed
robbery were some of the factors that posed a threat to the growth of SMEs.
5.4 Area for further research
Despite numerous studies in the area of SMEs, there is still a lack of understanding regarding
the growth challenges faced by small enterprises in Namibia.
Past researches seem to suggest that access to credit has been a major challenge to SMEs. This
research study however, established that inadequate government subsidies, competition and
poor business management skills are the major growth challenges faced by SMEs in Namibia.
Further studies can also be conducted to establish if this is the case in rural areas or rural areas
are faced with unique challenges that are not shared by their urban counterparts.

89
REFERENCES
Abdel, K. and Haan, H. (2004). Financing Systems and Skills for Small Enterprises, Human
Resource Development Institutions, Netherlands: The Hague.
Advani A (2007). Industrial clusters: A support system for small and medium-sized enterprises,
the private sector development. World Bank Occasional Paper No. 32, Washington DC.
Alvarez, A. (2008). SMEs growth Challenges: A strategic plan, New York: MacMillan
Ariyo, D. (2008). Small firms are the backbone of the Nigerian economy. Africa Economic
analysis. Academy of Management Journal, 1(1), 109-124
Arnold, K., Grossmann, M., Mwatotele, J., Stork, C. & Tobias, P. (2005). SME Development and
Impact Assessment 2004. NEPRU Research report no. 18. Windhoek
Asa, K. and Navneel, M. (2014). Determinants of growth and profitability in small
entrepreneurial firms in Namibia. International Journal of Entrepreneurial Behaviour &
Research, 4 (1): 18 – 27.
Bank Windhoek Report, (2013), The role of Informal Sector: Background paper for the National
Plannining Commission’s Macro-economic Issues. Working paper no. 3. Windhoek
Beck, A., Demirguc-Kunt, A., Laeven, N. and Maksimovic, V. (2006) Small vs. Young Firms
across the World: Contribution to Employment, Job Creation and Growth.
90
Boshoff, A.B., Theron, S.W. and Schutte, J.L. (2008). Prediction of the success level of
entrepreneurial venture by means of biographical and business variables in a third world
setting, South African Journal of Economic and Management Sciences, 1(3): 348-361.
Burns, P. (2001). Entrepreneurship and Small Business. New York: Palgrave.
Calvin, R.J. (2002). Entrepreneurial Management. New York: McGraw Hill.
Churchill, N.C. and Lewis, V.L. (2003). The five stages of small business growth, Harvard
Business Review, 61(3): 30-50.
Commonwealth Resources (2008), Namibia: Development of small scale and informal
industries. Windhoek.
Cooper, D.R. and Emory, C.W. (2001). Business research methods, 4th ed. Massachusetts:
Irwin.
Creswell, J.W. (1994). Research design: Qualitative and quantitative approaches. London: Sage
Publications
Day, J. (2000). The value and importance of the small firm to the world economy, European
Journal of Marketing, 34(10): 1033-1037.
DTI, (2004), Small Business Development Guide. Department of Trade and Industry,
Government Printer, Pretoria South Africa.
DTI, (2007), Annual Review of SMEs in South Africa. Department of Trade and Industry,
Government Printer, Pretoria South Africa.
91
Edmiston, K.D. (2007). The role of small business in economic development. Community Affairs
Department, Federal Reserve Bank of Kansas City, USA.
Elmuti, D. and Kathawala, Y. (1999). SME Definition Academy of Management Journal, 31(4):
737-770
European Union (2012). A preliminary analysis of critical factors among small business firms.
Fida, B.A. (2008). The Role of Small and Medium Enterprises (SMEs) in Economic
Development. Enterprise Development.
Fletcher, R. (2011), Disquiet in the Oil City, African Business.
Gaomeb, M. (2012). Challenges facing SME's: Namibia Economic Society.
Geingob, H. (2012). Foreign direct investment in Namibia: benefits for small and medium
enterprises. Eenhana: Trade and Business Expo.
Government of the Republic of Namibia (1990), Foreign Investment Act. Act of Parliament,
Windhoek.
Gray, C. (2002). Entrepreneurship, resistance to change and growth in small firms, Journal of
Small Business and Enterprise Development, 9(1): 61-72.
Gustav, B. (2010), The Do It Yourself Business Book.
Hambrick, D. and L. Crozier. (2005). Stumblers and stars in the management of rapid growth.
Journal of Business Venturing, 1(2), 31-45.

92
Hanks, Z.J. (2000). Small business economics: A global perspective, 35(4): 38-44.
Hansohm, D. (2010), Policy, Poverty and Inequality in Namibia: The Case of Trade Policy and
Land Policy. NEPRU Research Report No. 18. Windhoek: NEPRU.
Harper, M. (2001). The development of a cost effective extension service for small business: A
Kenyan experiment. University of Nairobi, Nairobi, Kenya.
Hashim, M.K. and Abdullah, M.S. (2000). Developing SMEs taxonomies in Malaysia. Malaysian
Management Journal, 4(1), 43-50.
Heita, D. (2013). Private Sector to Manage SME Incubation Centre. Nedbank
Hill, J. and Mcgowan, P. (2009). Small business and enterprise development: questions about
research methodology, International Journal of Entrepreneurial Behaviour and Research,
5(1): 210-215
Hill, S. (2011), Economic Powerhouse, Germany, IP Global,
Hooi, L.W. (2006). Implementing e-HRM: The readiness of SME manufacturing company in
Malaysia. Asia Pacific Business Review, 12(4): 465-485.
House, M., Ikiara, P and McCormic, T. (2005). Strategic Entrepreneurial Growth, Ohio:
Thomson South-Western.
Institute for Public Policy Research (2011). SME Development and Impact Assessment.
Windhoek: IPPR.

93
International Labour Organisation (2009), Employment, incomes and equity. A strategy of
increasing productive employment in Kenya, Geneva: ILO.
International Monetary Fund (2007). Smarter Regulations for Small and Medium Size
Enterprises. Washington DC: World Bank Group.
Iraossi, G. (2007). The Power of Survey Design: A User's Guide for Managing Surveys,
Interpreting Results, and Influencing Respondents. Washington, D.C.: The World Bank.
Joshua, L. and Nicholas, K. (2009). Entrepreneurship and New Venture Management, 2nd
edition. Cape Town: Oxford University Press.
Kadhikwa, G., Erastus-Sacharia, A., & Hansohm, D. (2003). Small enterprise support
institutions in Namibia. NEPRU Research report no. 17. Windhoek.
Kapoor, H. (1997), Small and Medium Enterprise Dynamics in Indonesia, Bulletin of Indonesian
Economic Studies, 37 (3): 3-4.
Kauffmann, C. (2005). Policy Insights: Financing SMEs in Africa, OECD Development Centre.
Kenya National Bureau of Statistics, (2007). Development of SMEs for Wealth and
Employment creation and Poverty Reduction. Sessional Paper No. 2 of 2009. Nairobi:
Government Printers.
Kikonyogo, C.N. (2000). “Recent Development in Ugandan Financial Sector: Crisis or
Transition,” Bank of Uganda, Kampala.

94
Knutsen, S. (2003). The SME Financing Gap: Theory and Evidence. Washington: Organization
for Economic Cooperation & Development.
KPMG and Business Daily. (2011). Kenya Top 100 Mid- Sized Companies Survey.
Nairobi: Daly Nation.
Kushnir, K. Mirmulstein, M.L., Ramalho, R. (2010), Micro, Small, and Medium Enterprises
Around the World: How Many Are There, and What Affects the Count.
Labour Resource and Research Institute (2008). The Small and Micro Enterprise (SME) Sector
in Namibia: Conditions of Employment and Income. Windhoek: JCC.
Labour Resource and Research Institute (2010). The SME Sector in Namibia: Summary
Findings, Conclusions & Recommendations. Windhoek: JCC
Liedholm C, and Mead, D. (2007). Small scale industries in developing countries: Empirical
evidence and policy implications. International Development Paper No. 9. US
Department of Agriculture Economics, Michigan State University, East Lansing, MI,
USA.
Longenecker, P., Justin, G., Carlos, W., Moore, J., William, P., & Leslie, E., (2008). Small
business management: launching and growing entrepreneurial ventures. Casebound.
(14th ed.). Cengage Learning.
McCelland (2007). Understanding enterprise, entrepreneurship and small business. London:
Macmillan Press Ltd.

95
Megginson, L.C., Byrd, M.J. and Megginson, W.L. (2003). Small Business Management: An
Entrepreneur’s Guidebook, 4th edition. New York: McGraw-Hill.
Michael, A. (2006). Small Business Management. London, Pitman.
Ministry of Trade and Industry (1990). The Foreign Investment Act.
Windhoek: Government of the Republic of Namibia.
Ministry of Trade and Industry: (1997). Namibia: Policy and Progrmmme on Small Business
Development and Micro Enterprises; Your Key to Success: Namibia: Windhoek.
Ministry of Trade and Industry (2012). The small business baseline survey; Khomas Region:
volume III. Windhoek: Government of the Republic of Namibia.
Ministry of Trade and Industry (2008). The small business baseline survey;
Ohangwena,Omusati, Oshana and Oshikoto Regions: volume I. Windhoek: Government
of the Republic of Namibia.
Ministry of Trade and Industry (2010). The small business baseline survey; Erongo and
Otjozondjupa Regions: volume II. Windhoek: Government of the Republic of Namibia.
Mwilima, N. (2008). Namibia’s informal economy: possibilities for trade union intervention.
Windhoek: LaRRI.
Nakusela, R. (2008). Financing: Strategies for Namibia Paper presented at the Bank of Namibia
10th Annual Symposium, Windhoek, Namibia
96
Namibia Chamber of Mines and Industry (2010), The Informal Sector within Greater Windhoek:
A profile study and needs Assessment of the informal sector as an employment creator.
Windhoek. John Meinert printers.
Namibia Economic Policy Research Unit (2005). Small Business Background Directory.
Windhoek: NEPRU.
National Planning Commission (2011). National Development Programme 1 (NDP 4).
Windhoek.
National Planning Commission (1991). Vision 2030. Windhoek.
Natural Resources and Public Administration (2009). Growing with drought in Namibia:
Informal Social Security System in Caprivi and Erongo. Namibia: NISER.
Ndwandwe, M. (2008). Let down for SMMEs: A South African Perspective. Pretoria: Van Schaik
Publishers.
Nelson, .B (2008), Theorizing about Entrepreneurship, Entrepreneurship Theory and Practice,
16(2): 13-22.
Nuyoma, D. (2010). SME Financing: Strategies for Namibia. Proceedings of the Bank of
Namibia Symposium, 29 September, Windhoek, Namibia.
OECD, (2005) Organisation for Economic Cooperation and Development SME and
Entrepreneurship Outlook, Paris, OECD.
Okpara, J. (2011). Factors constraining the growth and survival of SMEs in Nigeria.
Management Research Review.
97
Oteh, A. (2010). Making Capital Market work for SMEs in Africa. Kikonyongo Capital Market
Awards, Kampala.
Proparco, S. (2009). Understanding the Causes of Business Failure Crises: Generic Failure
Types: Boiled Frogs, Drowned Frogs, Bullfrogs and Tadpoles, Management Decision,
32(4): 9-22.
Ramsden, N. (2010). The role of SMEs in employment creation and economic growth: lessons
from other countries. Paper presented at the Bank of Namibia 12th Annual Symposium,
Windhoek, Namibia
Ramsden, N. (2011), The role of SME’s in employment creation and economic growth: Lessons
from other countries. Washington: International Finance Corporation.
Rwigema, H. and Venter, R. (2010). Advanced Entrepreneurship. Cape Town: Oxford
University Press.
Sacerdoti, E., (2005) Access to Bank Credit in Sub-Saharan Africa: Key Issues and Reform
Strategies, International Monetary Fund Working Paper,
SADC Regional Indicative Strategies Development Plan (2010). Financing SMEs: Strategies for
SADC, Paper presented at the Bank of Namibia 12th Annual Symposium, Windhoek,
Namibia
Sanchez, J. (2006). Small business failure rates: Choice of definition and the size effect, Journal
of Entrepreneurial and Small Business Finance, 5(3): 271-286

98
Saru, E. (2007). Organizational learning and HRD: how appropriate are they are for small
firms? Journal of European Industrial Training, 31, (1): 36-51.
Sasman, T. (2012), SME Financing: Strategies for Namibia. Proceedings of the Bank of Namibia
Symposium, 29 September, Windhoek, Namibia.
Saunders, M.N.K. Lewis, P. & Thornhill, A. (2000). Research methods for business students,
London: Pitman.
Schmitz, H. (2005). Collective efficiency: Growth path for small scale industry. J. Dev. Stud.,
31(4): 529-566.
Sherbourne, R (2012), Assessing market demands for private equity and venture capital
initiatives for Emerging SMEs in Namibia. Windhoek.
Shiimi, N. (2012). The small business baseline survey; Khomas Region: volume III. Windhoek:
Government of the Republic of Namibia.
Simon, H. (2009). Hidden champions of the twenty-first century: Success strategies of unknown
world market leaders. New York: Springer
Small Business Project (2013). Is South Africa a good place to do business? SME Alert.
Snell, R. and Lau, A. (2006). Exploring Local Competencies salient for expanding small
businesses. Journal of Management Development, 13 (4), 4-15.
Stella, N. (2011). A strategy for development, World Bank.

99
Stevenson, L. and St-Onge, A. (2005). Support for growth-oriented women entrepreneurs in
Ethiopia, Kenya and Tanzania: An overview report, Programme on boosting employment
through small enterprise development, Job Creation and Enterprise Department,
International Labour Office, Geneva and Private Sector Department, Africa Development
Bank: Tunis.
Storey, D.J. (2004). Understanding the Small Business Sector. London: Thompson Learning.
Sweeney, G.P. (2011), New Entrepreneurship and the Smaller Firm. Dublin: WS McGowan Ltd.
Thorniley, T., (2010), The real Chinese entrepreneurs make their presence felt in Africa, Daily
Maverick,
Timmons, M. (19, August 2013), Role of the Government in SMEs financing. The Villager. pg.
18.
Tirivangani, M. (2013). Role of the Government in SMEs financing. Guidelines set to stem
SMEs’ failures. Windhoek
Tonderai, K. (2005). SME Financing: Strategies for Namibia. Proceedings of the Bank of
Namibia Symposium, 29 September, Windhoek, Namibia.
Tonin, A.(2008), The scope of procurement and the relevance of procurement financing in
namibia for SMEs, Nampro Fund, Multidisciplinary Centre, University of Namibia
UNIDO: (2010). United Nations Industrial Development Organisation’s Support to Namibia
Policy and Programme on Small Business Enterprises. NEPRU: Windhoek.
100
USA Embassy. (2002). China's Small and Medium Enterprises: Room To Grow With World
Trade Organisation.
Van Rooyen, M. (2012). Market study and development of a contact database of SMEs engaged in the
construction sector in Namibia. Windhoek: Consult Buro.
Weidlich, M. (10, Monday, April 2014), Small Enterprise Development. The Namibian. Pg 25
Westhead, P. and Storey, D. (2006). Management training and small firm performance: why is
the link so weak. International Small Business Journal, Vol. 14, No. 4, pp.13-24.
Williams, V. (2012), Small Business Lending in the United States 2010-2011 (US Small
Business Administration).
Wilson, K. (2007), Encouraging the internationalisation of SMEs. Promoting Entrepreneurship
in South East Europe: Policies and Tools. OECD Papers, 6 (12): 1–135.
Winter, L. (2002). Factors in the growth of micro-enterprises: developing a framework, Journal
of Small Business and Enterprise Development, 6(1): 41-58.
World Bank Enterprise Survey (2006), Small and Medium Enterprises across the Globe: A New
Database, World Bank Policy Research Working Paper.
Zikmund G. W., (2000) Business Research Methods, Oklahoma State University: The
Drydenpress, Harcourt College Publishers.

101
APPENDIX 1
Questionnaire Cover Letter
My name is Foibe Ndapewa Shilinge. I am a student at the Namibia Business School, University
of Namibia. I am conducting a research study in partial fulfillment of the requirements for the
Master in Business Administration Degree. The topic for my study is “An investigation of
growth challenges encountered by registered small and medium enterprises (SMEs) in
Katutura Central Constituency.” All information will be STRICTLY CONFIDENTIAL and
will only be used for academic purposes. Your cooperation is requested to make this study a
success.

102
APPENDIX 2
RESEARCH QUESTIONAIRE
Instructions for completing the questionnaire
1. Do not write your name on this questionnaire.
2. Answer questions as objectively and as honestly as possible.
3. Indicate your answer by a cross (x) in the relevant spaces that best reflect your answer.
4. Kindly answer only questions that are apply to you.
Demographic details
1. Please indicate your gender.
Male [ ] Female [ ]
2. Please indicate your age
18 - 25
26 – 35
36 - 45
46 – 65
66 and above
3. What is the highest level of education you have attained?
Grade 1 – Grade 10
Grade 12
National Certificate
National Diploma
Bachelor’s Degree
Masters Degree
PhD

103
Profile of the enterprise
4. Please indicate all the type(s) of enterprise you are in.
salon
bakery
upholstery
clothing
auto panel beat and spray
electrical and electronic repairs
shebeen
restaurant
manufacturing
Other (please specify)
5. Please indicate the length of time you have been operating your enterprise.
Less than a year
1 Year – 5 Years
6 Years – 10 Years
11 Years – 15 Years
16 Years – 20 Years
More than 20 Years
6. Is your enterprise registered? Yes [ ] No [ ]
7. Please indicate the owner of the enterprise by crossing the appropriate box.
Single owned
Have other investors
Family owned
Owned by other firms
Owned by business associates
Other, please specify

104
Business Growth
Micro environmental challenges
8. Has your stock increased since you set up your enterprise? Yes [ ] No [ ]
9. If the answer to Question 8 was, No, why are you not increasing your stock?
………………………………………………………………………………………………………
………………………………………………………………………………………………………
………………………………………………………………………………………………………
………………………………………………………………………………………………………
10. Is there an increase in your sales since you set up your enterprise? Yes [ ] No [ ]
11. If the answer to Question 10 was, No, what is hindering the growth of your sales?
………………………………………………………………………………………………………
………………………………………………………………………………………………………
………………………………………………………………………………………………………
………………………………………………………………………………………………………
12. Has your production increased since you set up your enterprise? Yes [ ] No [ ]
13. If the answer to Question 12 was, No, give reasons why your production is not increasing?
………………………………………………………………………………………………………
………………………………………………………………………………………………………
………………………………………………………………………………………………………
14. Has the number of your employees increased since you set up your enterprise?
Yes [ ] No [ ]
15. If the answer to Question 14 was, No, why are you not recruiting more employees?

105
………………………………………………………………………………………………………
……………………………………………………………………………………………………....
............................................................................................................................................................
............................................................................................................................................................
16. Have you earned any profits since you set up your enterprise? Yes [ ] No [ ]
17. If the answer to Question 16 was, No, why are you not making profit?
………………………………………………………………………………………………………
………………………………………………………………………………………………………
………………………………………………………………………………………………………
18. Has the number of your vehicles increased since the time you set up your enterprise?
Yes [ ] No [ ]
19. If the answer to Question 18 was, No, why are you not buying more vehicles?
………………………………………………………………………………………………………
………………………………………………………………………………………………………
………………………………………………………………………………………………………
20. Has your equipment increased since you started your enterprise? Yes [ ] No [ ]
21. If the answer to Question 20 was, No, why are you not buying more equipment?
………………………………………………………………………………………………………
………………………………………………………………………………………………………
………………………………………………………………………………………………………

106
Market environmental challenges
22. Has the number of your customers increased from the time you set up your enterprise?
Yes [ ] No [ ]
23. If the answer to Question 22 was, No, why are you not attracting more customers?
…………………………………………………………………………………………………………………………………………………………………
…………………………………………………………………………………………………………………………………………………………………
24. Are your competitors posing any threats to your enterprise? Yes [ ] No [ ]
25. If the answer to Question 24 was, Yes, please indicate the threats that your competitors are
posing to your enterprise.
………………………………………………………………………………………………………
………………………………………………………………………………………………………
……………………………………………………………………………………………………….
26. Do similar products in the market pose a threat to your products? Yes [ ] No [ ]
27. If the answer to Question 26 was, Yes, please indicate your plans to make your products
different.
………………………………………………………………………………………………………
………………………………………………………………………………………………………
………………………………………………………………………………………………………
28. Do your suppliers deliver sufficient quantities of goods as per your orders? Yes [ ] No [ ]
29. If the answer to Question 28 was, No, can you please state why your suppliers are not
delivering as required.

107
………………………………………………………………………………………………………
………………………………………………………………………………………………………
………………………………………………………………………………………………………
30. Do your suppliers deliver goods on time? Yes [ ] No [ ]
31. If the answer to Question 30 was, No, please indicate why your suppliers are not delivering on
time.
………………………………………………………………………………………………………
………………………………………………………………………………………………………
………………………………………………………………………………………………………
32. Are you able to negotiate prices with your suppliers? Yes [ ] No [ ]
33. Do you advertise your products? Yes [ ] No [ ]
34. If the answer to Question 33 was, Yes, where have you been advertising your products?
………………………………………………………………………………………………………
………………………………………………………………………………………………………
35. If the answer to Question 33 was, No, how do you let your customers know about your
products?
………………………………………………………………………………………………………
………………………………………………………………………………………………………
…………………………………………………………………………………………………….....
.............................................................................................................................................................
36. Have you ever applied for a bank loan? Yes [ ] No [ ]
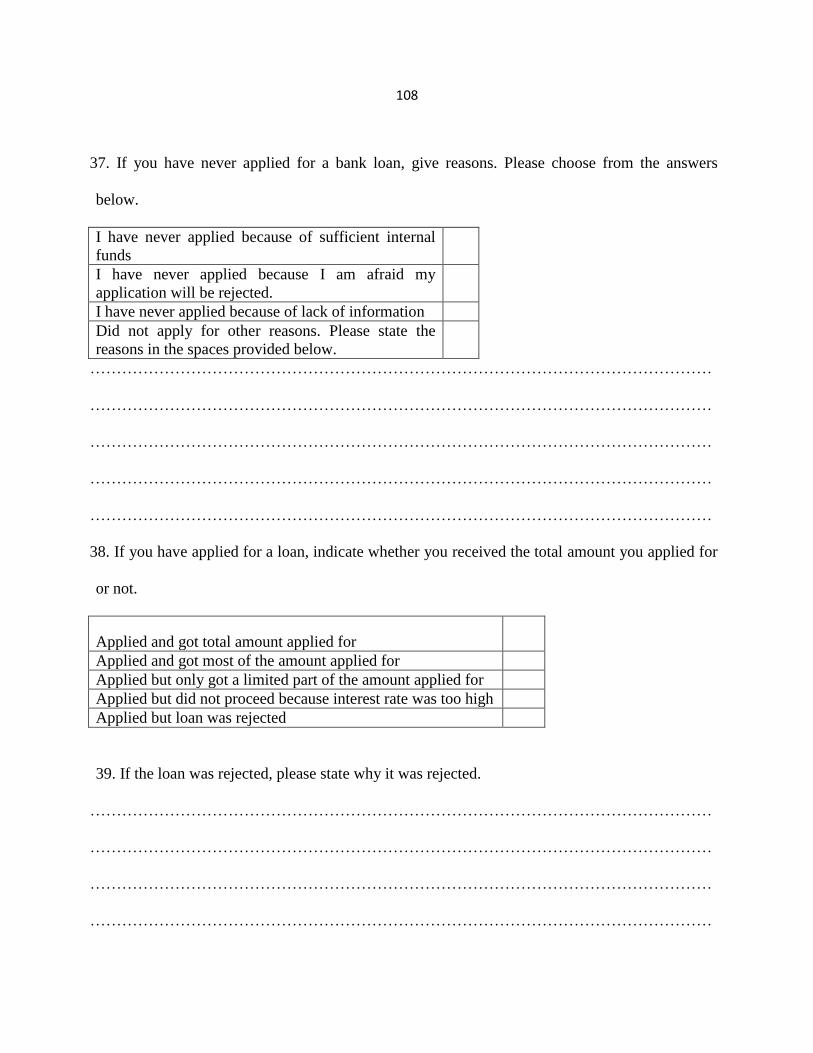
108
37. If you have never applied for a bank loan, give reasons. Please choose from the answers
below.
I have never applied because of sufficient internal
funds
I have never applied because I am afraid my
application will be rejected.
I have never applied because of lack of information
Did not apply for other reasons. Please state the
reasons in the spaces provided below.
………………………………………………………………………………………………………
………………………………………………………………………………………………………
………………………………………………………………………………………………………
………………………………………………………………………………………………………
………………………………………………………………………………………………………
38. If you have applied for a loan, indicate whether you received the total amount you applied for
or not.
Applied and got total amount applied for
Applied and got most of the amount applied for
Applied but only got a limited part of the amount applied for
Applied but did not proceed because interest rate was too high
Applied but loan was rejected
39. If the loan was rejected, please state why it was rejected.
………………………………………………………………………………………………………
………………………………………………………………………………………………………
………………………………………………………………………………………………………
………………………………………………………………………………………………………

109
………………………………………………………………………………………………………
………………………………………………………………………………………………………
40. What are the other types of finance you have used to grow your business?
41. If you took a loan for your business, do you face any difficulties in repaying your loan?
Yes [ ] No [ ] Not applicable [ ]
42. If the answer to Question 41was, Yes, why are you facing difficulties in repaying your loan?
……………………………………………………………………………………………………….
……………………………………………………………………………………………………….
.............................................................................................................................................................
43. Did the loan improve the growth of your business?
Yes [ ] No [ ] Not applicable [ ]
Macro environmental challenges
Respondents’ perceptions on Government’s policies towards SMEs
Please respond by putting a cross (x) in the relevant spaces that best reflect your answer.
Use the following key: 1 = Strongly disagree (SD); 2 = Disagree (D); 3 = Neutral (N); 4 = Agree
(A); 5 = Strongly agree (SA).
Namibian Government’s policies relating to SMEs SD
1
D
2
N
3
A
4
SA
5
44. Government plays a big role in promoting
establishment of enterprises in Namibia.
Profit
Other loans example, Letshego
Grants (Non- Government Organisation)
Grants (Government)
Did not use any source of finance

110
Namibian Government’s policies relating to SMEs SD
1
D
2
N
3
A
4
SA
5
45. Government is committed to ensure the growth of
small and medium enterprises.
1 2 3 4 5
46. The tax rate is favourable to my enterprise. 1 2 3 4 5
47.Government provides business management training
for SMEs.
1 2 3 4 5
48. The SMEs policy stipulates that foreign
entrepreneurs must pursue businesses in manufacturing.
1 2 3 4 5
49.The SMEs policy stipulates that foreign
entrepreneurs must pursue business in industrial
development.
1 2 3 4 5
50. Government invites SMEs operators to
contribute to the formulation of SME policies.
1 2 3 4 5
51. Government has provided start-up capital
for my business.
1 2 3 4 5
52. Government grants collateral to get a loan from
financial institutions.
1 2 3 4 5
53. How can growth challenges faced by registered small and medium enterprises in Katutura
Central Constituency be tackled? …………………………………………………………………..
............................................................................................................................................................
............................................................................................................................................................
............................................................................................................................................................