Embed Size (px)
Citation preview

AN INTRODUCTION TO THE
ROLE AND USE OF
PATHOLOGY LABORATORY
TESTING IN CLINICAL
PRACTICE
Dr Tom Hartley,
RHH Pathology Services & UTas HLS
March 2013 CAM 201

SETTING THE SCENE : DIAGNOSTIC SERVICES
Diagnostic Services – where does the Pathology Laboratory fit in ?
Group One : Medical “Imaging” … X-Ray, CAT scan, Ultrasound, Angiography, Endoscopy, NMR, PET, Nuclear Medicine ….
Group Two : Pathology “Testing” : 5 Main Disciplines across 13 Laboratories
Anatomical Pathology
Clinical Biochemistry
Coagulation
Cytogenetics
Cytology
Endocrinology
Haematology
Infection Control
Microbiology
Molecular Medicine
Phlebotomy Service
Post Mortem
Transfusion Medicine

http://www.labtestbook.com/index.html
TEXTBOOKS
You can’t get by without one ..

“e – TEXTBOOKS - RCPA”
www.rcpamanual.edu.au


? Pituitary Disease or Tumour

“e – TEXTBOOKS www.labcorp.com”


Australian & UK Labs Use
SI Units
To Convert to SI units :
(mg/dl X 10)
Molecular Weight
= mmol/L
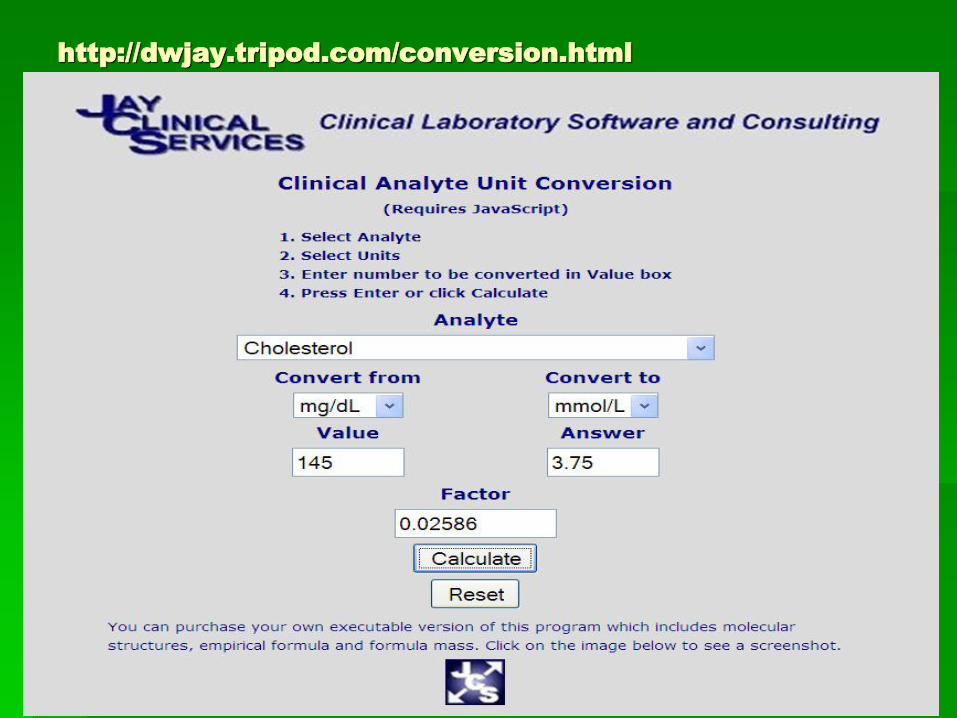
http://dwjay.tripod.com/conversion.html

First question – what is the
probability that this Test
Result I have just got back
from the Lab …eg a serum
albumin concentration …… is
abnormal ?
To make this decision you need to know some basic probability and statistical theory …. And this puts a lot of people off thinking about their laboratory data critically

The Normal Range for a
Laboratory Test Result
Conventionally laboratories report normal ranges that encompass the values for that test observed in 95% of healthy individuals.
So if we have a normal range for Serum Albumin 35 – 50 g/L then there is a 0.025 probability that a healthy person could have a serum albumin of less than 35. Equally there is a 0.025 probability that a healthy person could have a serum albumin of greater than 50.

The Statistician’s Normal Distribution
Curve

The Clinician’s Normal Distribution Curve
Serum Albumin : Reference Interval = 35 – 50 g/L
Therefore : Mean = 42.5 and SD = 3.75 and 2.5% of normal patients have
a serum albumin less than 35 g/L and 100% of normal patients have serum
albumins between 31.25 g/L and 53.75 g/L

But not all Laboratory data
are normally distributed eg
Platelets
So Laboratories should use
Parametric and Non-
Parametric Reference
Intervals as appropriate to the
distribution of results from
normal individuals

Steps in getting a reliable
Pathology Result
Correct patient
Correct patient preparation
Correct Sample Container
Correct Sampling Site
Correct Sample Labelling
Complete Pathology Request Form with Clinical Notes
Correct Sample Storage and Transport
Sent to the Correct Laboratory on the correct day

Second Question :
How can you diagnose a
disease from a laboratory
result ?
“How can I diagnose
Gestational Diabetes from my
patient’s fasting blood
glucose?”

Your
direction of
view when
with a new
patient

To answer this properly we
need to talk about
Test Specificity
and
Test Sensitivity ……

IDEAL SEPARATION OF
NORMALS FROM PATIENTS

TYPICAL OVERLAP OF RESULTS FROM NORMALS AND
RESULTS FROM PATIENTS

What does this result from a
new patient mean ?

Specificity Sensitivity

Specificity and Sensitivity of
a Test
Specificity : the probability that a
laboratory test will be negative in
the absence of a disease
= # of true negatives divided by
(# of true negative + # of false
positives)

True Neg
FP
Diagnostic
Criterion
NORMALS
SP=TN/(TN+FP)

Sensitivity : the probability that a
laboratory test is positive in the
presence of disease
= # of true positives divided by ( #
of true positives and # of false
negatives)

Diagnostic
Criterion
DIABETICS
FN
True Pos
SEN=TP/(TP+FN)

We can use a ‘Receiver Operator Curve’, which is a plot of (1-
Specificity) on the x axis vs Sensitivity on the y axis, to visualise
what happens when we move the ‘diagnostic threshold’

ROC Simulation


Third Question : How do I know that there
has been a Significant change in my
patient’s Laboratory Result ?
When the difference between the previous result and today’s result is greater than 2.77 times the Standard Deviation of the Laboratory’s Analytical Method eg.
01/12/07 Cholesterol = 5.65
12/02/08 Cholesterol = 5.75
Laboratory’s SD of their analysis = 0.17 mmol/L
Difference = 0.10 ….
Diff/SD = 0.10/0.17 = 0.59 NOT SIGNIFICANT !
A significant difference would be +/- 0.47 mmol/L !

Fourth Question : Why do you need
Pathology Tests ??
To gather evidence to prove and/or disprove
hypothetical diagnoses.
o This means you need hypotheses
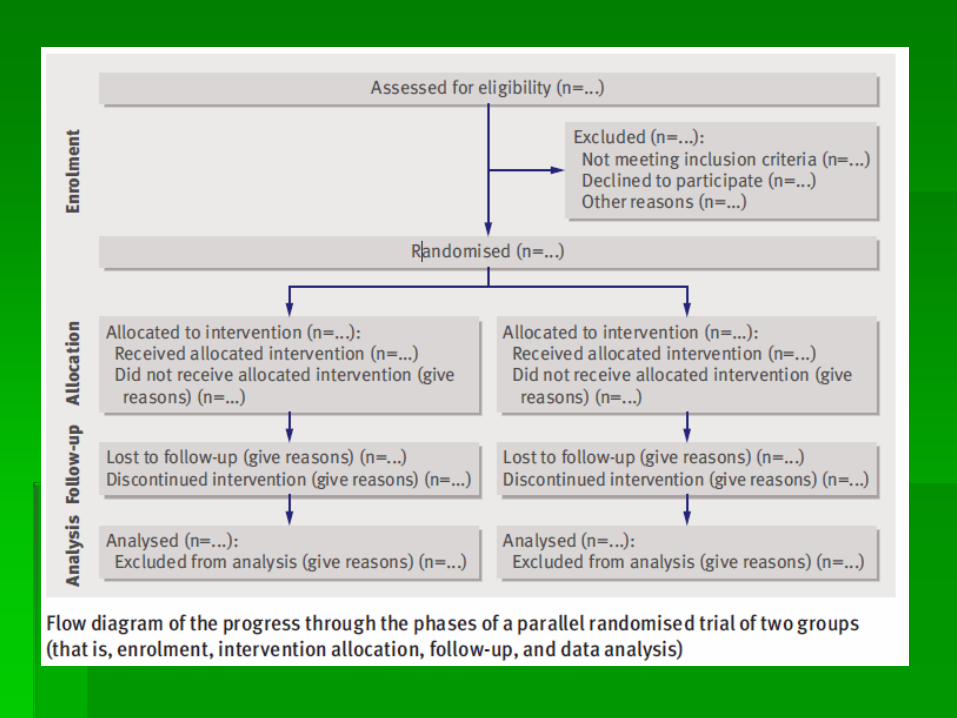
o To make hypotheses you need to have a knowledge of the underlying physiology of your hypotheses
o The best way is to have a flow diagram of the pathophysiology which shows where you will START ‘pathology testing’ with decision points that show when you will STOP ‘pathology testing’ ..


More results than you need …. ?

Clinical Trials : The majority are heavily
reliant upon carefully controlled
pathology testing performed by carefully
chosen pathology laboratories.


Pathology Testing comes to the
aid of the 21 most
underdiagnosed diseases
http://www.wrongdiagnosis.com/
1. Type 2 diabetes and Impaired glucose tolerance
2. High cholesterol
3. Hypertension
4. Osteoporosis
5. Sexually transmitted diseases
6. Hemochromatosis
7. Chronic kidney disease
8. Hypothyroidism including Hashimoto's thyroiditis
9. Glaucoma
10. Depression
Indicates conditions that are best diagnosed via pathology testing

Pathology Testing comes to
the aid of the 21 most
underdiagnosed diseases
11. Infectious diarrhea
12. Fecal incontinence
13. Lactose intolerance
14. Polycystic ovary syndrome (PCOS)
15. Flat feet
16. Attention deficit hyperactivity disorder and hyperactivity
17. Sleep disorders such as sleep apnoea
18. Asthma
19. Bipolar disorder
20. Celiac disease
21. Whooping cough (or pertussis)

SUMMARY
Pathology testing is usually the most convenient ‘diagnostic’ for both patient and clinician
Results need to be interpreted ‘statistically’ viz how abnormal, how ‘big’ is the change, what is the specificity and sensitivity of the test in the patient’s ‘suspected’ condition.
Testing protocol needs to be designed to match the ‘suspected’ pathophysiology and/or rule out other ‘pathologies’. Negative results are often just as valuable as positives.
There are good online resources as well as good ‘pocket’ guides…. You will not be able to get by without one.
Pathology results are only as good as the specimen
Pathology results are only “useful” if they have been requested because you have a diagnostic ‘hypothesis’ to prove or disprove.
View this presentation and more on
www.medlabstats.com/students

www.medlabstats.com/students