Embed Size (px)
Citation preview

An introduction to pathway modelling with Excel
Dr Sean ManziPenCLARHC/PenCHORD
University of Exeter

What is pathway modelling and why is it useful?
● What happens when you arrive as a patient to an Emergency Department?
What is pathway modelling and why is it useful?
● What you have just described is a care pathway

What is pathway modelling and why is it useful?
● What if we want to change something in that pathway?
● How can we know what the impact of that change might be?

What is pathway modelling and why is it useful?
We can model it!

What is pathway modelling and why is it useful?
A model is a simplification of reality
Warning!!!!All models are wrong but some are useful

What is pathway modelling and why is it useful?
Benefits of modelling
● Emulation : A model is a version of reality that can be altered without risk or consequence
● Speed : Typically, models can be designed and built much more quickly than real world changes can be efected.
● Communication : A model can help people to communicate about a problem using a shared language and point of reference
● Systems Thinking : The process of designing the model can help people to think about their systems

What is pathway modelling and why is it useful?
Benefits of pathway modelling
● Identify queues/blockages in the system
● Determine resource requirements
● Test new pathway confgurations

What is pathway modelling and why is it useful?
Pathway modelling and economic modelling
● Understanding the scale of change to service provision
● Estimation of efciency savings
● Supporting a fnancial case for capital investment

What is pathway modelling and why is it useful?
Lets have a look at some real examples of pathway modelling!

High-sensitivity troponin for the diagnosis of acute myocardial infarction in A&E

Cornwall mental health inpatient pathway modelling

Reducing delays in the bladder cancer pathway at Royal Cornwall Hospital

Radiographer-led discharge at Yeovil District Hospital

Modelling healthcare pathways in Excel
Today we are going to:● Understand some important concepts for
pathway modelling in Excel● Understand and process map our problem● Build a base case model● Test a change● If there is time: think about even more important
concepts for pathway modelling

Modelling healthcare pathways in Excel
● Important concepts for today– Functions in Excel– Conditional logic– Variability and distributions

Important concepts - functions● Functions take zero to many inputs
(“arguments”), do something with them, and generate an output.
● In Excel, functions are denoted as follows :
● =FUNCTIONNAME(argument1, argument2, [argument3])

Important concepts - functions● The arguments in a function can be either :
– Absolute values (such as 2, “hello”, 37)
– Cell references (such as A2, B7:B28, C:C)
– Functions – these are called nested functions

Important concepts - functions● When a function is used as an argument to another function, the
internal function is performed to generate an output. This output is then used as the argument.
● For example :
=SUM(MIN(A:A),AVERAGE(B:B))
● This SUM function has two nested functions – MIN() and AVERAGE(). Here, the minimum of column A is found, then the average of column B, then these two numbers are used as arguments for the SUM function, and so are added together.

Important concepts - functions● =RAND() - generates a pseudo-random number● =ROUND(Number to round, number of decimal
places) – rounds up a number to a specified number of decimal places
● =COUNT() - which counts the number of non-empty cells in a range
● =SUM() - which adds up a series of values● =AVERAGE() - which takes the mean of a series of
values

Important concepts – conditional logic● Modelling often requires diferent things to happen
depending on whether or not something is true / has happened.
● For example, a model may check a patient’s condition, and allocate them to a doctor accordingly. Or a model might check the time of day to determine how frequently patients arrive into the model.
● This kind of logic is called “Conditional Logic”

Important concepts – conditional logic● If we were writing a computer program, we would specify
conditional logic using IF-THEN-ELSE statements :IF this is true THENDo thisELSEDo this
● In Excel, we can use the IF Function to write such statements :=IF(logical test, value if true, value if false)
● Which is another way of saying :=IF(check if this is true, put this value in the cell if it is, put this value in the cell if it isn’t)

Important concepts – conditional logic● Let’s consider an example.
=IF(B7>=65, “Over 65”, “Under 65”)
● This function checks the value in cell B7 to see if it contains a number that is equal to or greater than 65. If it does, the value in the cell in which you wrote the function will be “Over 65”. If it doesn’t, it will display “Under 65” instead.

Important concepts – conditional logic● COUNTIFS() counts the number of values that
meet a certain criteria. It has the following format :
=COUNTIFS(criteria range 1, criteria 1, [criteria range 2], [criteria 2]…)
● E.g. =COUNTIFS(A:A, “Female”)

Important concepts – conditional logic● SUMIFS() only adds up numbers that meet
specified criteria. It has the following format :
=SUMIFS(sum range, criteria range 1, criteria 1, [criteria range 2], [criteria 2]…)
● E.g. =SUMIFS(B:B, A:A, “Male”)

Important concepts – conditional logic● AVERAGEIFS() takes an average but only includes
values where a corresponding field meets a certain criteria. It has the following format :
=SUMIFS(average range, criteria range 1, criteria 1, [criteria range 2], [criteria 2]…)
● E.g. =AVERAGEIFS(B:B, C:C, “Elderly male”)

Important concepts – conditional logic● If we want to look for values greater than (>) or less than
(<) a given value in these conditional functions we have to use a certain notation
● For example :=COUNTIFS(A:A, “>=“&5)=SUMIFS(B:B, A:A, “<“&B6)
● The operand is in inverted commas : “>=“● The ampersand (&) denotes the concatenation (attaching
the operand to the value)● An IF() function doesn’t need this, as it only checks a
single value.

Important concepts – variability
55 5
5
5 5
5 5 5
5
5
Average
45 6
5
5 5
6 4 5
5
5
Average
Scenario A
Scenario B
Treatment durationInter-arrival time
Treatment durationInter-arrival time

Important concepts – variability
55 5
P1, 5min
P2, 5min
P3, 5min
P4, 5min
P5, 5min
5
5
5
5
5
8:00 8:05 8:10 8:15 8:20 8:25
5 5
5 5 5
5
5
AverageScenario A
Finish at 8:25
Treatment durationInter-arrival time
Important concepts – variability
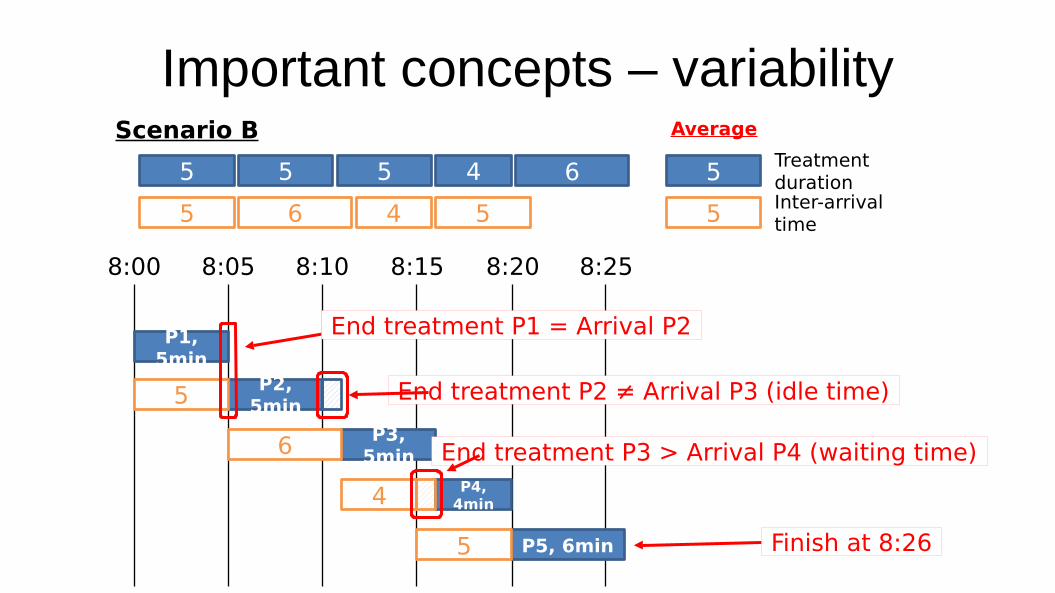
45 6
P1, 5min
P2, 5min
P3, 5min
P4, 4min
P5, 6min
5
5
6
4
5
8:00 8:05 8:10
End treatment P1 = Arrival P2
End treatment P2 ≠ Arrival P3 (idle time)
End treatment P3 > Arrival P4 (waiting time)
8:15 8:20 8:25
5 5
6 4 5
5
5
AverageScenario B
Finish at 8:26
Treatment durationInter-arrival time

Important concepts – variability
Real life is full of variability. And if our models are to be as accurate as possible, they should account for this variability as much as they can.
To do this, we can use distributions

Important concepts – distributions● A distribution is a way of representing the variability within
data. It tells us the probability of a value occurring in the future
● The RAND function in Excel draws random numbers from a uniform distribution. This means that all values have an equal probability of occurring.
● When building a model you would plot your data to understand its shape then use distribution ftting techniques to determine the most appropriate distribution and values (not covered here see pythonhealthcare.org for distribution ftting code)

Important concepts – distributions● There are many diferent types of distributions

Important concepts – distributions
54 7 Time (minutes)
Mean
Symmetric about mean
About 68% within 1 s.d.
of mean
About 95% within 2 s.d.
of mean
3 6
% o
ccurr
ence

Important concepts – distributions
In Excel we need an add called the Analysis ToolPak to generate random numbers from diferent distributions
● Go to File then Options● Select Add-Ins on the left-hand menu bar● Ensure “Excel Add-ins” is selected next to “Manage” at the
bottom of the window, and click “Go”● Tick the check box next to “Analysis ToolPak”● Click “OK”
● The ToolPak should now be installed

Important concepts – distributions
To access the random number generator:1. Click “Data Analysis” in the Analysis section of the
Data tab on the ribbon2. Select “Random Number Generation” and click OK

Important concepts – distributionsThe number of sets of random numbers you want
The number of random numbers you want to generate
The distribution from which you want to draw random numbers
The parameters needed to defne your chosen distribution
The Random Seed
Where do you want your random numbers to be output?
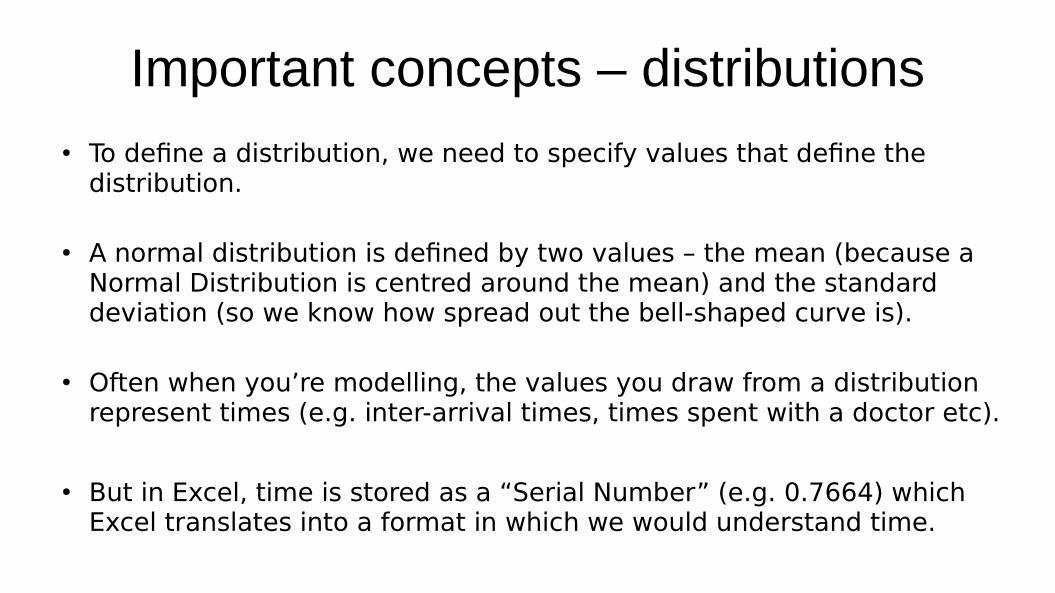
Important concepts – distributions● To defne a distribution, we need to specify values that defne the
distribution.
● A normal distribution is defned by two values – the mean (because a Normal Distribution is centred around the mean) and the standard deviation (so we know how spread out the bell-shaped curve is).
● Often when you’re modelling, the values you draw from a distribution represent times (e.g. inter-arrival times, times spent with a doctor etc).
● But in Excel, time is stored as a “Serial Number” (e.g. 0.7664) which Excel translates into a format in which we would understand time.

Important concepts – distributions● Why is this important? Because when you defne the distribution, if your
distribution represents time, you need to provide your values (e.g. mean and standard deviation) as serial numbers.
● Fortunately, the serial numbers aren’t as obscure as they may frst seem. In fact, they just represent the number of days that a time represents. So a serial number of 0.5 would represent 12 hours (half a day).
● Usually you’ll be working in minutes when building models. So to convert your minutes to a serial number, simply use the following formula :
● Serial Number = (time in minutes / 60) / 24

Modelling healthcare pathways in Excel
That is all the background information
Let’s build a model!!

The model – Our problem● A local GP surgery has contacted you to undertake some modelling. The surgery is
very small, and consists simply of a waiting room and a single GP who sees patients in the order in which they arrive. The GP starts seeing patients at 8am, and fnishes at 5pm.
– The surgery is looking to implement a new system that they believe will reduce consultation time with the doctor for minor injuries by an average of 20%.
● The surgery would like you to build a model of a day in the life of their surgery to help them answer the following questions :
– How long, on average are patients waiting to be seen now? What’s the longest waiting time?
– What is the predicted impact on waiting times if the average consultation time for minor injuries was reduced by 20%?
– What would be the impact on waiting times if a receptionist was hired to signpost patients arriving with minor injuries elsewhere, so they are not seen by the doctor?

The model – Conceptual model● Your frst task is to develop a conceptual model. This is a design for
your model that makes clear what you are going to include from the real world, as well as the assumptions and simplifcations that you’re making, and the data you’re going to need. There is no set standard for developing this, but we’d recommend the following :
– An annotated diagram or fowchart for each of the three systems (Base Case, What if 1, What if 2) and their processes
– A list of assumptions and simplifcations that you will need to make
– A list of the specifc data you will require to build the model
● Keep things as simple as possible. You will have 20 minutes to complete this exercise.

The model – Conceptual model
Let’s see what you have come up with

The model – Conceptual model● Base case
Patient arrives at surgery
Patient waits until doctor is available
Patient leaves the surgery
Patient is seen by doctor

The model – Conceptual model● Test of change 1
Patient arrives at surgery
Patient waits until doctor is available
Does patient have minor injury?
Patient is seen by doctor with new
system
Patient is seen by doctor
Patient leaves the surgery

The model – Conceptual model● Test of change 2
Patient arrives at surgery
Patient waits until doctor is available
Does patient have minor injury?
Patient is seen by doctor
Patient leaves the surgery
Patient is signposted elsewhere

The model – Conceptual model
Assumptions● There is no prioritisation of patients● The day we are modelling is representative● Travel times are trivial● The surgery starts on time
Simplifications● The doctor doesn’t get any breaks● There is no check in time or queuing for check in● The doctor continues working until the last patient has been seen● The doors close at 5pm and patients aren’t stopped from entering
before

The model – Conceptual model
You have been supplied with the following data :Inter-Arrival Times
● The times between patients arriving at the clinic follow a normal distribution. The mean is 5 minutes and the standard deviation is 1 minute.Consultation Times with Doctor
● The times patients spend with the doctor follow a normal distribution.● For patients with minor injuries, the mean is 5 minutes and the
standard deviation is 1 minute.● For all other patients, the mean is 8 minutes and the standard deviation
is 2 minutes.Presentations to the Surgery
● 57% of patients attending present with minor injuries.

The model – Building the modelWe’re now going to build the model together. Let’s build the model for the base case frst, and let’s start by modelling only Minor Injuries patients.
Patient arrives at surgery
Patient waits until doctor is available
Patient leaves the surgery
Patient is seen by doctor
You have been supplied with the following data :Inter-Arrival TimesThe times between patients arriving at the clinic follow a normal distribution. The mean is 5 minutes and the standard deviation is 1 minute.Consultation Times with DoctorThe times patients spend with the doctor follow a normal distribution.For patients with minor injuries, the mean is 5 minutes and the standard deviation is 1 minute.For all other patients, the mean is 8 minutes and the standard deviation is 2 minutes.Presentations to the Surgery57% of patients attending present with minor injuries.

The model – The base caseWe now have the answer to Question 1 :1. How long, on average are patients waiting to be seen now? What’s the longest waiting time?

The model – Tests of changeYou now need to use your models to answer questions 2 and 3 :
2. What is the predicted impact on waiting times if the average consultation time for minor injuries was reduced by 20%?3. What would be the impact on waiting times if a receptionist was hired to signpost patients arriving with minor injuries elsewhere, so they are not seen by the doctor?
Use your conceptual models to guide how you will do this. Take a copy of your base case model.

The model – Test of change 1

The model – Test of change 2

The model – Completed
Congratulations!You have built a model of a healthcare pathway
and tested the impact of two changesThe story continues...

Model validation and verification
Real world
Validation Verifcation Validation
Conceptual model
Mathematical model
Credibility
Use of results
• Validation: the process of determining whether a model is sufficiently a啣�ccura �te啣fora 啣the啣p�ra ticuly �ra 啣objectives啣of啣the啣studa啣
• Verification: the process of determining if the conceptual model has been correctly translated into a mathematical or computer model (testing).
• Credibility: the model and its results are believed and trusted by users
Results
Credibility

Conceptual model validation
The啣CM啣cont�ins啣det�ily s啣�bout啣the啣studa啣objectives,啣how啣the啣ra e�ly 啣wora ly d啣wora ks,啣�ssumptions,啣modely 啣simply ifc�tions,啣d�t�啣soura ces啣�nd啣wh�t-if啣scen�ra ios.啣啣
E.g:啣the啣cly inic啣modely
Model simplifications ● No breaks for the doctor● Same doctor each day working at same rate● No check-in time with receptionist, no queue for receptionist● The doctor continues working until the last patient has been seen● The doors close at 5pm, patients aren’t stopped from entering before
Assumptions● Clinic starts on time!● Travel times are trivial● No priority of patients

Simple ‘black box’ validationA simple approach to validating models is to compare the model’s predicted outputs with data from the real systemE.g.啣�啣comp�ra ison啣of啣modely ly ed啣�nd啣histora ic�ly 啣�vera �ge啣queuing啣times
Issues?
– Ignores the internal workings of the model
– How do you validate a what-if scenario (no real world to compare against)?
– Often real world data are unavailable or inaccurate
Black box validation is a good start, but not enough! We need to:
– Validate smaller parts of the model
– Validate input data
– Work closely with subject matter experts
– Compare results to similar (sometimes simpler) models
– Assess uncertainty (to be discussed later)

Confidence not validity● It is not possible to prove that a model is valid● But you can disprove that it is valid
● View validation as a process of building confdence that the model and its results are sufciently accurate for the purpose it was built to address
● Confdence thresholds vary by user and modeller.● This means that a valid model may not be viewed as credible by users● This means that an invalid model may be viewed as credible by users!
● Do not fall into the trap of thinking that a valid model is the most ‘realistic one’

Final points● A more complex model is not always a better model. In fact it rarely is!● All models are wrong but some are useful● An objectively built and well validated model can support decision making● The real world is far more complex than a model so it should inform and
not determine a decision
● Pathway models should be designed and built to answer a particular question
● Whole system models are rarely useful – better to focus on a known problem area
● Modelling is an iterative process – you will go back and forth between conceptual modelling, the formal model and output analysis
● A good model requires good data● Enjoy building models, the process should be fun and interesting

Well done!
We have made it to the end of the sessionCheck out our websites for more information and advanced training
materials
http://clahrc-peninsula.nihr.ac.uk/
http://penchord.org
https://pythonhealthcare.org/
More to come soon!!