Embed Size (px)
Citation preview

An introduction to load testing for Web applicationsBusiness white paper

2
Table of contents
Introduction ............................................................3Grow your business through online exposure ..............3Application performance testing prior to going live .......4Key characteristics of an automated load testing tool ....5The process of automated load testing ........................5 Step 1: Perform system analysis .............................5 Step 2: Create virtual user scripts ...........................6 Step 3: Define user behavior .................................6 Step 4: Create a load test scenario ........................6 Step 5: Create network impact tests .......................6 Step 6: Run the load test scenario and monitor the
performance ............................................7 Step 7: Analyze results .........................................7HP LoadRunner software ...........................................7 Step 1: Perform system analysis .............................8 Step 2: Create virtual user scripts ...........................8 Step 3: Define user behavior .................................9 Step 4: Create a load test scenario ........................9 Step 5: Create network impact tests .....................10 Step 6: Run the load test scenario and monitor
the performance .....................................10 Step 7: Analyze results ....................................... 11Summary .............................................................. 12

3
IntroductionIt’s hard to imagine today’s world without the Internet. Websites bring us news stories and entertainment, help us connect with people, boost productivity, and provide a convenient storefront for online purchases—anytime, from anywhere in the world, from any computer or mobile device. Companies increasingly rely on Web applications to automate their core business functions as well as enable them to offer more products and services through their websites.
But for an online business to be successful it has to be available at a click of a button—without long wait times, delays, errors, or service interruptions. Websites must be able to handle sudden increases in traffic or operation volume without compromising the user experience or a company’s ability to quickly and accurately process business transactions.
In this paper, we will discuss the importance of measuring application performance, and explore best practices for load and performance testing. We will also examine various components of a successful load testing process as well as look at the attributes of a reliable load testing software solution. Finally, we’ll provide an overview of HP LoadRunner software, the industry-leading performance validation tool.
Grow your business through online exposure The advancement of Web applications has changed the way companies promote, market, and sell their products. It also helped automate key business
processes, making it faster and easier to enter orders, process payments, or track data. The large volumes of information gathered by Web applications can help companies define more precise marketing strategies, target specific customers, as well as offer better, more personalized service to their clients.
But the more companies rely on Web applications for running their business and generating revenue, the greater the risk of failure. At the early age of online commerce, most companies didn’t invest any time in pre-production performance testing, or at the very best performed manual testing—hoping that their infrastructure would support the user load after the application went live. Not surprisingly, it was common to see a website go down right after go live, a big upgrade or following a promotional campaign and a subsequent increase in traffic. But today’s businesses can’t afford even short-term interruptions, and the new generation of online-savvy consumers expects reliable service and timely response at all times. If a site cannot accept an order or is taking too long to display product selection, customers won’t hesitate to take their business elsewhere. Tough competition and uncertain economic climate demand that companies pay closer attention to quality, reliability, availability, and performance of their online applications.
Today’s Web applications are also more complex than ever before. Scaling a multifaceted, integrated infrastructure from end-to-end means managing the performance and capacities of individual components within each tier—as well as measuring the overall transaction response times of the entire system.
Figure 1 An example of a complex Web infrastructure
Clients Routers Switches Webservers
Internetfirewall
Loadbalancers
Applicationservers
Database servers and other
database sources
Internet
For an online business to be successful, it has to be available at a click of a button—without long wait times, delays, errors, or service interruptions.

4
This complexity triggers many uncertainties about the integrity and performance capabilities of a Web application. Will it provide consistently fast response times for all users—regardless of where they are coming from or what type of connection they are using? Can an application sustain a large user volume? Will it remain fast and reliable after a sudden increase in the number of users? Is there sufficient hardware on each tier to handle high traffic volumes? Can all the interoperable pieces of the system work reliably together? To answer these questions, you must be able to predict how your Web applications will behave in a production environment before going live, and continue to measure and monitor your systems throughout its lifecycle.
Application performance testing prior to going liveA typical response to growing traffic on your website is to add more hardware to each component of the system. However, such random attempts to improve performance often lead to overbuying hardware—and not necessarily to better performance and scalability. The only way to accurately predict system behavior is to load test your applications end-to-end, measure response times from the end-user perspective and diagnose and remedy any performance issues prior to going live.
Application performance testing is the way to measure your Web application’s ability to conduct multiple transactions simultaneously while maintaining adequate response times. It also helps you isolate bottlenecks in any component of the network infrastructure to accurately pinpoint potential problems. Two common approaches to performance testing methods are manual and automated testing. Unfortunately, manual testing has several inherent challenges, such as:•Difficulty emulating the behavior of thousands of
concurrent users •Coordinating user operations
•Accurately measuring response times•Comparing results between test runs, scenarios,
and iterations.
Manual testing is also not the most practical option because in order to accurately diagnose problems, you must repeat tests multiple times: first to identify performance problems, tune the system and then retest to verify that tuning has had a positive impact.
With automated performance testing tools, you can automatically run tests and measure results. You can also easily and cost-effectively create and maintain scripts and scenarios to maximize reuse between test runs and accurately compare results. Automated testing tools help reduce the risk of human error during testing. As a result, automated load testing has become the preferred choice for companies of all types and sizes for load testing of their business critical applications. Automated testing tools typically use three major components to execute a test:•A control console that organizes, drives, and
manages the load•Virtual users (Vusers)—processes used to imitate
a real user performing a business process on a client application
•Load servers (used to run the Vusers)
Using these components, automated load testing tools can:•Replace manual testers with automated Vusers•Simultaneously run many Vusers on a single load
generating machine•Automatically measure transaction response times•Easily repeat load scenarios to validate any changes
you make to optimize performance
This advanced functionality allows you to save time and resources.
Figure 2Automated load testing emulates production workloads on an entire system
Simulated usersController Internet/WAN Web server Applicationservers
Database
5
Key characteristics of an automated load testing toolThe primary goal of load testing tools is to accurately predict system performance and isolate performance issues. To identify performance problems, load testing tools monitor key system-level components and find bottlenecks during the test run. Accuracy is defined by how closely an automated tool can emulate real-user behavior. A scalable tool is able to simulate a greater load using fewer resources.
The process of automated load testingWith disciplined approach to load testing, you can optimize resources, better predict hardware, software, and network requirements and set performance expectations to meet customer service level agreements (SLAs). You also must be able to repeat the testing process regularly in order to verify that application or infrastructure changes did not negatively impact system performance. Outlined below is a step-by-step overview of the automated load testing process:
Step 1: Perform system analysisThis step is critical to interpreting your testing needs and is used to determine whether the system can scale and perform to your specifications. At this stage,
you need to translate your user requirements into load testing objectives. A thorough evaluation of the requirements before beginning load testing can help provide realistic test goals and conditions.
First, you must identify your key performance objectives. These may include determining which processes and transactions to test, which system components to use in the test, and the number of concurrent connections and hits per second to expect against the application. You also want to look at the overall end-to-end business processes to clarify which ones need to be tested.
For example, an online book retailer may flag the “buy book” transaction for the purposes of a test. The overall transaction can include browsing the book selection, choosing a book to purchase, entering payment and shipping information, and completing the purchase. By clearly defining the load testing objectives, you can provide a concise outline of the SLAs and mark the goals to be achieved with testing.
Second, you need to define what input data is going to be used for testing. This data can be created dynamically or sourced from existing lists—such as a customer database. By using realistic data, you can create more accurate load tests and better predict system performance in production.
Table 1Accuracy and scalability are key attributes of an automated load testing solution
Accuracy Scalability
•Record load testing scripts against a real client application.
•Capture protocol-level communication between the client application and the rest of the system.
•Provide flexibility and the ability to define configurations for user behavior (for example, think times, connection speeds, cache settings, iterations).
•Verify that the requested content returns to the browser to facilitate a successful transaction.
•Show detailed performance results that can be easily understood and analyzed to identify the source of the problem.
•Measure end-to-end response times.
•Use real-life data.
•Synchronize Vusers to generate peak loads.
•Monitor different tiers of the system with less intrusion.
•Generate more Vusers that can be run on a single machine before exceeding its capacity.
•Generate more hits per second against a Web server.
•Manage thousands of Vusers.
•Increase the number of Vusers in a controlled manner.
•Simulate the effect of scaling out to remote locations over wireless area networks (WANs).

6
Third, you must determine the appropriate strategy for testing applications. You can choose one or more types of performance testing: load testing, stress testing, and capacity testing. Load testing is typically used to gauge how an application will perform under a specific user load. Your goal is to determine whether your Web application can sustain this requested number of users with acceptable response times. Stress testing is the way to validate an application’s stability and reliability by applying a load for an extended period of time. Capacity testing helps you determine the maximum number of users who can access your application simultaneously before experiencing system failure.
Fourth, you need to cultivate a solid understanding of your system’s architecture, including:•Defining the types of routers and network
connectivity you’re using in the network setup•Determining whether you’re using multiple servers•Establishing whether you’re using load balancers as
part of your IP network•Determining which servers are configured into the
system (Web, application, and database)
Finally, you must know which resources are available to run the Vusers by deciding whether you have sufficient numbers of load generators or test machines to run the appropriate number of Vusers. You must also determine whether the testing tool has multi-threading capabilities and can increase the number of Vusers being run. Ultimately, your goal is to reduce your consumption of system resources while increasing the number of Vusers.
Step 2: Create virtual user scriptsUse a script recorder to capture all the business processes into test scripts, which are often referred to as Vuser scripts or Vusers. A Vuser emulates the real user by interacting with the application as a client. You must identify and record all the various business processes from start to finish. This can help you determine the amount of time you need to measure the performance of a business process.
Step 3: Define user behaviorRun-time settings define the way the script runs in order to accurately emulate real users. Settings can configure think times, connection speeds, and error handling rules. Think times can vary depending on your customer’s actions and complexity of a transaction. For example, a customer can move quickly through the account information update page, while taking longer comparing product options or entering payment information.
Your system’s response times will also vary depending on the users’ connection speed. WAN emulation accurately imitates a variety of connection options at varying network bandwidth and latencies. This can help you determine how the underlying network affects application response times. Because errors can arise throughout a scenario and impede testing, you also need to configure error handling. You can configure Vusers to handle these errors so you can run the tests uninterrupted. Network communications errors can also profoundly influence application response times. You can also configure WAN emulation to introduce underlying network errors to understand their impact and measure the application’s tolerance for them.
Step 4: Create a load test scenarioThe load test scenario contains information about the groups of Vusers that can run the scripts and the load machines on which the groups are running. To run a successful scenario, you must first categorize your customers into groups based on their transactions. Then, you need to define and distribute the total number of Vusers. You can assign a varying number of Vusers to individual business processes to emulate user groups performing multiple transactions. One group may be searching for a book, while the second and third groups are entering payment information or shipping addresses.
After Vuser groups have been assigned, you must determine which load-generating machines the Vusers can run on. You can add load generator machines to the client side of the system architecture to run additional Vusers. Finally, you need to specify how the scenario will run. You can run the Vuser groups either in staggered or parallel formation. Staggering the Vusers allows you to examine a gradual increase of the user load to a peak.
Step 5: Create network impact testsThe network test uses information about where the groups of Vusers can be located relative to the server. During the test, only the network characteristics—such as bandwidth availability, contention, latency, errors, and jitter—can change; the number of Vusers in this test remains constant. By staggering the decreases in network bandwidth or increases in latency, errors and jitter, you can understand their relative influence on application behavior. This data can be used to set network requirements for the application when it is deployed. You can conduct this kind of testing directly over the network to remote locations, but for testing purposes it is generally more practical to emulate the network where you can easily establish a variety of conditions using WAN emulation. This can allow you to predict the performance for remote users.
7
Step 6: Run the load test scenario and monitor the performanceYou can view the application’s performance at any time during the test using real-time monitoring. Every component of the system requires monitoring: the clients, the network, the Web server, the application server, the database, and all server hardware. You can detect performance bottlenecks early during testing using real-time monitoring. You then have the ability to view the performance of every single tier, server, and component of the system during testing. As a result, you can instantly identify performance bottlenecks during load testing. This can allow you to accelerate the test process and achieve a more stable application.
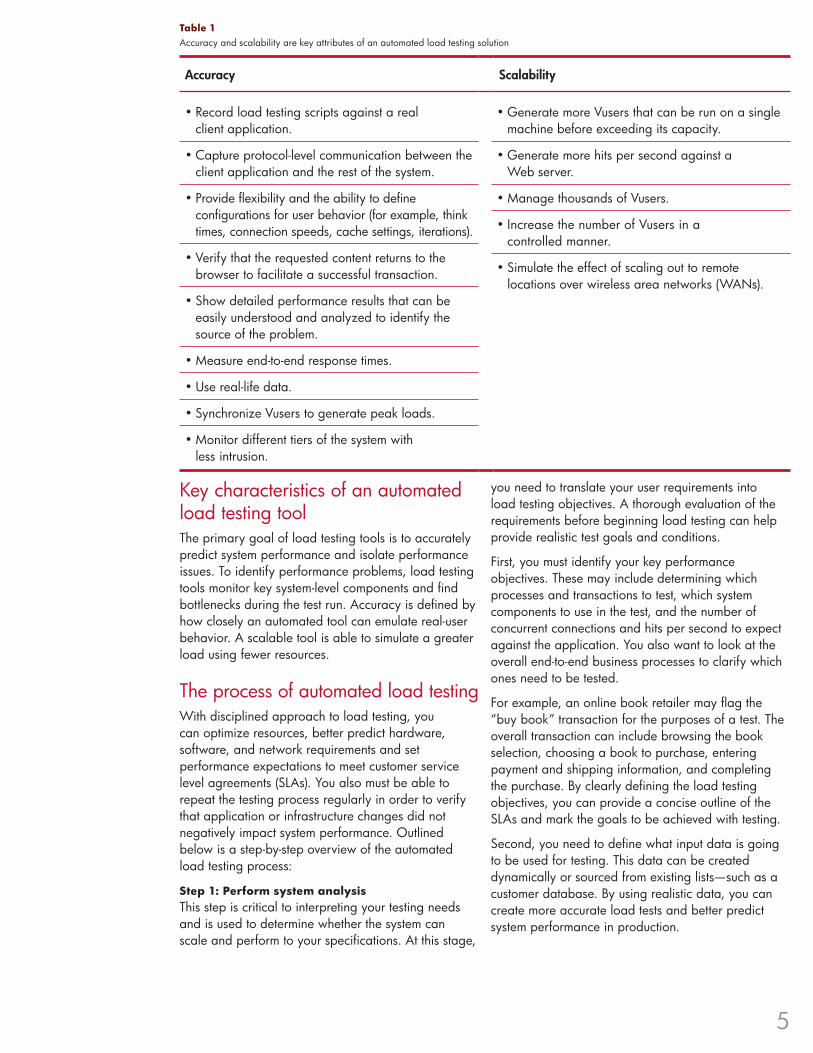
Step 7: Analyze resultsCollecting and processing test data is an essential step in isolating and resolving performance bottlenecks. The analysis can produce a series of graphs and reports that help summarize and present the end-to-end test results. For example, Figure 3 uses generic data to display a standard performance under load graph that shows the total number of Vusers against the response times. You can use this data to determine the number of customers who can use your application simultaneously until response times become unacceptable. Figure 4 shows the total number of transactions that passed or failed in a particular scenario. Using the analysis of these types of graphs, you can isolate bottlenecks and determine which changes you need to make to improve system performance. After these changes are made, you must rerun the load test scenarios to verify the adjustments.
HP LoadRunner softwareHP LoadRunner software is the industry-standard solution for application performance testing. HP LoadRunner helps you obtain an accurate picture of end-to-end system performance before going live. It helps:•Pinpoint end-user, system-level, and code-level
bottlenecks rapidly and with ease;•Identify and reduce performance bottlenecks during
the development lifecycle;•Verify that new or upgraded applications meet
specified performance requirements.
Using minimal hardware resources, HP LoadRunner emulates hundreds or thousands of concurrent users to apply production workloads to almost any application platform or environment. HP LoadRunner stresses an application from end-to-end—applying consistent, measurable, and repeatable loads—then uses the data to identify scalability issues that can affect real users in production.
As it drives load against the system, HP LoadRunner captures end-user response times for business processes and transactions. Non-intrusive, real-time performance monitors obtain and display performance data from every tier, server, and system component. Strong analysis capabilities help isolate performance bottlenecks quickly and efficiently.
Figure 3This generic graph shows application performance under load. In this example, the application response times increase sharply once the number of concurrent users reaches 7,500.
Figure 4This generic graph shows transactions that passed or failed. In this example, transaction number two failed approximately one-third of the time. Depending on how critical this transaction is, such high failure rate is likely not acceptable for the business.

8
HP LoadRunner supports performance testing for a wide range of application environments and protocols, including Web, SOA and Web Services, Ajax, RDP, Database, Terminal, Citrix, Java™, .NET, and all major ERP and CRM applications. HP LoadRunner has more than 60 non-intrusive monitors tailored for these systems and provides diagnostics for any applications running on J2EE or .NET platforms.
To enable load testing earlier in the application lifecycle, HP LoadRunner integrates with the leading J2EE, Microsoft® Visual Studio, and Microsoft .NET environments. This integration lets you create HP LoadRunner scripts directly within the IDE, so developers can participate in the performance testing efforts earlier.
As part of the lifecycle approach to application testing, HP LoadRunner is also integrated with HP QuickTest Professional, HP Quality Center, and HP Business Availability Center software. Leveraging these complementary solutions together with HP LoadRunner provides a comprehensive approach for managing the overall testing process, measuring release risk, and increasing the reuse of testing assets from pre-release to production.
Step 1: Perform system analysisHP LoadRunner follows a similar system analysis method as we described previously in this paper. It is essential to identify all testing conditions when you emulate a test environment, including system architecture components, all processes that are being tested and the total number of Vusers you intend to test. A good system analysis can enable you to convert your goals and requirements into a successful, automated test script.
Step 2: Create virtual user scriptsTo create a Vuser script, you can record a business processes with HP LoadRunner Virtual User Generator (VuGen). VuGen is a component that runs on a client desktop to capture the communication between the client application and the server. VuGen can emulate the exact behavior of a real browser by sending various protocol requests to the server.
HP LoadRunner’s Click and Script technology helps you easily record scripts at the user-interface level. HP LoadRunner automatically captures the most valuable scripting information to create succinct, visually intuitive, easy to understand scripts, reducing scripting time and maintenance by up to 80 percent. These scripts are also easier to maintain, allowing you to easily visualize what is happening in each statement, and focus on the elements that need to be modified for another test.
Once the script has been generated, you can add logic and intelligence to make it more realistic imitating a real user interacting with an application. Logic can be added at the transaction level, as well as using verification and parameterization techniques.•Transactions: Transactions represent a series of
operations that must be measured under load conditions. A transaction can be a single operation by a customer or a complete business process leading through several screens, such as the end-to-end process of selecting, comparing, and purchasing a product online.
Figure 5How HP LoadRunner works.
Thousands of virtual usersperform real-lifetransactions to simulateproduction traffic
Real-time monitors captureperformance data across alltiers, servers and networkresources and displayinformation on the Controller
Results are stored in adatabase repositoryallowing users to generate reports andperform analysisThe Controller is a
central console fromwhich the load tests aremanaged and monitored
2 3
4
1

9
•Verification: VuGen allows you to insert verification checkpoints using ContentCheck, which verifies that the application functions as expected by analyzing the returned page. If the verification fails, HP LoadRunner can log the error and highlight the reasons for the failure (for example, broken link, missing images, erroneous text, and so on).
•Parameterization: To accurately simulate real-user behavior, HP LoadRunner Vusers use varying sets of data during load testing that replace constant values in the script with variables or parameters. The Vuser can substitute the parameters with values from a data source, such as flat files, random numbers, date/time, and so on. This allows you to test a business process with varied sets of data.
Step 3: Define user behaviorHP LoadRunner provides comprehensive run-time settings to configure scripts that emulate the behavior of real users. Below are some examples of run-time settings:•Think time: Controls the speed at which the Vuser
interacts with the system by including pauses of think times during test execution.
•Connection speed: Simulates a user connected to the system from different network speeds.
•Emulate cache: Emulates a user browsing with a specific cache size. Caching can be turned off based on server requirements.
•Browser emulation: Enables you to specify which browser the Vuser simulates.
•Number of connections: Allows the Vuser to control the number of connections to a server.
•IP spoofing: Tests the performance impact of IP-dependent components by assigning Vusers their own IP addresses from the same physical machine.
•Iterations: Commands repetition of Vuser scripts and paces Vusers, instructing how long to wait between intervals. Iterative testing defines the amount of work a user does based on the number of times a process is performed using varying data.
•Error handling: Regulates how a Vuser handles errors during script execution. HP LoadRunner can enable the continue on error feature when the Vuser encounters an error during replay.
•Log files: Stores information about a Vuser’s server communication. Standard logging maps all transactions, rendezvous, and output messages. Extended logging also tracks warnings and other messages.
Step 4: Create a load test scenarioHP LoadRunner Controller is used to create scenarios, providing you with complete visibility of the tests and the Vusers from a single point of control. The Controller facilitates the process of creating a load test scenario by allowing you to:•Assign scripts to individual groups•Define the total number of Vusers needed to run
the tests•Define the host machines on which Vusers
are running
In addition, HP LoadRunner offers a scenario wizard, a scheduler and TurboLoad to enhance your experience during testing. The HP LoadRunner scenario wizard allows you to quickly compose multi-user load test scenarios. Using five easy-to-follow screens, the scenario wizard leads you through a process of selecting the workstations that can host the Vusers, as well as the test scripts to run.
Figure 6The VuGen allows you to capture business processes to create Vusers.
Business Process
Application
Scripts
VuGen Recorder
Browser

10
During this step-by-step process, you also create simulation groups of Vusers. The HP LoadRunner scheduler is used to ramp Vuser numbers up or down in order to position Vusers in both the ready state and the running state. For example, you may want to gradually increase the number of customers logging onto your site with a fixed batch size. This is referred to as the ready state. This method helps avoid unnecessary strain on the system.
The scheduler also manages scheduling and features an automated process that allows the user to run the script without being present. In real time, this would be similar to running a script during off-peak hours—such as 6 p.m. to 6 a.m. To schedule a test, you simply click the Run Scenario button and enter the desired starting time.
Step 5: Create network impact testsHP LoadRunner has the ability to handle WAN emulation, so you can use the same virtual-user scripts used in the previous steps for network impact tests. Network characteristics such as connection speed, latency, and error rates are modified for groups of Vusers that are simultaneously emulated during a single test run. You can then accurately determine the impact of the network on response time on the different groups, as well as the sensitivities of the application to the network. You can record expected response time data and network requirement set for use later when the application goes live.
Step 6: Run the load test scenario and monitor the performanceOnce the scenario is built, you are ready to run the test. The HP LoadRunner controller provides a suite
of performance monitors that can monitor each component of a multi-tier system during the load test. By capturing performance data over the entire system, you can correlate this information with the end-user loads and response times to identify bottlenecks. HP LoadRunner provides performance monitors for all parts of the system under test—including Web servers, application servers, databases, ERP and CRM systems, firewalls, and load balancers. HP LoadRunner can identify hardware limitations and software configuration issues that might otherwise go undetected. All performance monitors are non-intrusive and hardware and OS independent, so they do not require that agents be installed on the remotely monitored servers.
To look deeper into each transaction—from end-user response time all the way down to the application method level—you can use HP Diagnostics software. During a performance test, HP Diagnostics traces business processes from the client side across all tiers of the infrastructure, and then breaks down each transaction response time into time spent in the various tiers and within individual components. HP Diagnostics provides:•An intuitive, easy-to-use view of how individual tiers,
components, memory, and SQL statements impact overall performance of a business process under load conditions.
•The ability to more easily find components relevant to a specific business process under test.
•The ability to triage and find problems effectively with business context, enabling teams to focus on problems impacting business processes.
Figure 7HP LoadRunner and HP Diagnosis allow you to monitor system performance during tests and diagnose performance bottlenecks as they occur.

11
Step 7: Analyze resultsAnalyzing results is possibly the most important step in the load testing process. Until this point, you have been able to precisely record and play back the actions of a real user and look into potential bottlenecks using performance-monitoring features. Now, you can take steps to fix any problems that have been identified during testing.
First, a network specialist (such as a database administrator or consultant) can make the necessary adjustments to the system. Then you need to rerun the scripts to verify that the changes have taken place. Finally, you can measure the amount of improvement the system has undergone by comparing results from before and after testing.
The HP LoadRunner analysis component provides a single integration environment that collectively gathers all the data generated throughout the testing cycle. HP LoadRunner analysis provides advanced capabilities that let you compare results across scenarios and drill down into network layers to identify bottlenecks. In addition, HP LoadRunner analysis uses a series of sophisticated graphs and reports that help you answer such questions as: What was the Web server’s CPU memory when the system was under a load of 5,000 simultaneous users? How many total transactions passed or failed after the completion of the load test? How many hits per second can the Web server uphold? What were the average transactions times for each Vuser? Figures 8 and 9 show examples of HP LoadRunner analysis graphs.
HP LoadRunner provides a variety of performance graphs, such as the ones listed below:•Percentile: analyzes percentage of transactions that
were performed within a given time range•Performance under load: indicates transaction
times relative to the number of Vusers running at any given point during the scenario
•Transaction performance: displays the average time taken to perform transactions during each second of the scenario run
•Transaction performance summary: displays the minimum, maximum and average performance times for all the transactions in the scenario
•Transaction performance by Vuser: displays the time taken by an individual Vuser to perform transactions during the scenario
•Transaction distribution: displays the distribution of the time taken to perform a transaction
HP LoadRunner also offers two types of Web graphs:•Connections per second: shows the number of
connections made to the Web server by Vusers during each second of the scenario run
•Throughput: shows the amount of throughput on the server during each second of the scenario run
HP LoadRunner analysis includes a correlation of results feature to enhance the user analysis process for the data. This allows you to custom design a graph beyond the basics using any two metrics. As a result, you can identify and troubleshoot performance problems more quickly.
Figure 8This sample activity graph displays the number of completed transactions (successful and unsuccessful) performed during each second of a load test. This graph helps you determine the actual transaction load on your system at any given moment. The results show that after six minutes an application is under a load of 200 transactions per second.
Figure 9This graph displays the number of transactions that passed, failed, aborted, or ended with errors. For example, these results show the “Submit Search” business process passed all its transactions at a rate of approximately 96 percent.
SummaryYou can’t afford to take chances with your Web application performance and reliability. Your company’s success, revenue, and reputation often depend on the IT applications’ ability to accurately support business processes and deliver positive experience for all users at all times.
The intricacy of today’s Web technologies, high traffic volumes, complexity of transactions, and frequent changes demand that you take a lifecycle approach
to performance testing. Make it a part of the delivery process for all applications. By following the best practices and using the right tools for planning, building, maintaining, and reusing your performance testing assets, you will greatly reduce the risk of failure and enable that your applications remain scalable and reliable throughout the lifecycle.
Get connectedwww.hp.com/go/getconnected
Get the insider view on tech trends, alerts, and HP solutions for better business outcomes
© Copyright 2007, 2010 Hewlett-Packard Development Company, L.P. The information contained herein is subject to change without notice. The only warranties for HP products and services are set forth in the express warranty statements accompanying such products and services. Nothing herein should be construed as constituting an additional warranty. HP shall not be liable for technical or editorial errors or omissions contained herein.
Microsoft is a U.S. registered trademarks of Microsoft Corporation. Java is a US trademark of Sun Microsystems, Inc.
4AA1-3944ENW, Created August 2007, Updated July 2010, Rev 1.
Share with colleagues
To discover how you can measure application performance using load testing software from HP, please visit: www.hp.com/go/loadrunner