Embed Size (px)
Citation preview

An Intraday Analysis of Exchange Traded Fund Markets
Van T. Nguyen University of Mississippi
Current version: March 2, 2005
Contact information Van T. Nguyen P O Box 8255 University, MS 38677 Phone: (662) 2348640

2
An Intraday Analysis of Exchange Traded Fund Markets
Abstract
This study provides an intraday analysis of Exchange Traded Fund markets. We
investigate trading implications surrounding the open and close, and compare price
discovery and liquidity in a multi-market trading framework. In addition, we test
whether the difference of ETFs with regard to market maker inventory management
causes intraday spread patterns to differ from those of the underlying securities. We find
that despite the small market share of trading volume, the AMEX contributes most to
price discovery in all trading periods, especially at the open and close. However, the
AMEX also charges the highest transaction costs for investors. This result is consistent
with the market power hypothesis. We also find that the intraday spread patterns of ETFs
are different from those of the underlying securities. This discrepancy is attributable to
the fact that market makers use a different device than spread to control their inventory.
JEL Classification: G14; G18
Key Words: Exchange Traded Funds, Opening, Closing, Intraday Patterns, Price
Discovery, Price Efficiency, Market Transparency, Fragmentation, Consolidation

3
1. Introduction
The opening and closing mechanism of an exchange are of considerable
importance because there is concentrated trading volume at the open and close [Brock
and Kleidon (1992)]. Furthermore, the opening and closing prices serve as benchmarks
for various interests.1 Although, all trading sessions facilitate the process through which
new information is incorporated in security prices (price discovery) and provide liquidity
for traders, the open and close may differ from the regular trading session with regards to
the proportion of informed and liquidity-motivated trading.2
Previous studies document that information asymmetry is greatest at the open due
to the overnight (or weekend) non-trading period. Information asymmetry declines over
the trading day as trading reveals information, and this information is incorporated into
stock prices [Barclay and Hendershott (2003)]. Since information asymmetry is higher at
the open, it is likely that the proportion of informed trading is higher at the open than at
other trading periods. Hence, the opening mechanism plays a crucial role in information
aggregation and price discovery during a period of high information asymmetry. In
contrast, the fraction of liquidity-motivated trading is higher at the close due to inventory
motives [Barclay and Hendershott (2003)]. Liquidity is important at the close because
the cost of holding a suboptimal inventory may be large.
Differences in opening and closing procedures across markets may lead to
different levels of price discovery, “price efficiency,” and liquidity. Numerous studies
investigate the opening and closing of trading of New York Stock Exchange- (NYSE)
1 The opening prices are used as settlement prices for derivative products. For example, the quarterly settlement of stock index futures contracts are based on the opening stock prices on the contracts’ expiration date. Investors use closing prices to monitor their holdings. Closing prices are also used as benchmark prices for NAVs and index valuations. 2 Price discovery and liquidity are among the most important functions of a security market.

4
and NASDAQ-listed securities [Brock and Kleidon (1992), Greene and Watts (1996),
Cao, Ghysels, and Hatheway (2000), Madhavan and Panchapagesan (2000), Masulis and
Shivakumar (2002), and Bacidore and Lipson (2001)]. However, these studies often only
consider the primary exchange and neglect the fact that a substantial proportion of
NYSE- and NASDAQ-listed securities are traded on regional exchanges and Electronic
Communication Networks (ECNs). This dispersal of trading of a security into multiple
trading venues is known as fragmentation. As a market for a security fragments, it is
difficult to identify the location of price information, price discovery, and liquidity. A
cross-market comparison will help determine which market contributes more to price
discovery and liquidity. The opening and closing of a security in a multimarket trading
setting has not yet been investigated in the literature. This study aims to fill this gap.
While the opening and closing of NYSE- and NASDAQ-listed securities are
widely investigated, there is little research regarding that of securities listed on the
American Stock Exchange (AMEX). AMEX-listed securities are comprised largely of
Exchange Traded Funds (ETFs). ETFs are traded on up to nine market centers: the
AMEX, Boston Stock Exchange (BSE), Chicago Stock Exchange (CHX), National Stock
Exchange (NSE, formerly Cincinnati Stock Exchange), NASDAQ, NYSE, Pacific Stock
Exchange (PAC), Philadelphia Stock Exchange (PHX), and Chicago Board of Options
Exchange (CBOE). ETFs are actively traded and had a turnover ratio of 7.8 compared to
1.8 for the S&P 500 stocks in 2002.3 Since the ETF market is active, it attracts
competition from off-exchange trading venues. The intense competition among
exchanges causes the ETF market to be highly fragmented. The AMEX is an order-
3 The statistic is calculated using CRSP data. We calculate the average monthly turnover ratio for year 2002 for 115 ETFs listed on the AMEX and the S&P 500 stocks.

5
driven continuous auction market with a single-price opening auction, similar to the
NYSE. However, the market for AMEX-listed securities is more fragmented than that of
NYSE-listed securities.4 The fragmented feature of the market for AMEX-listed
securities provides a natural experiment for studying price discovery at the open and
close on a multimarket trading environment.
In addition, the study of opening and closing of ETFs and price discovery are also
of considerable academic and practical importance for another reason. The mix of
informed trading and liquidity-motivated (uninformed) trading differs in the market for
ETFs and the market for underlying securities (Subrahmanyam (1991), Gorton and
Pennacchi (1993)). Subrahmanyam (1991) develops a model where discretionary
liquidity traders can strategically choose to execute their portfolio trades either in the
market for the basket or in the underlying securities markets. The model predicts that
basket securities are more appealing to liquidity traders who trade portfolios due to lower
adverse selection costs. Adverse selection has two components which are security-
specific and systematic components. The security-specific component tends to get
diversified away in baskets. Gorton and Pennacchi (1993) also suggest that basket
securities serve as the lowest transaction cost market for liquidity traders trading in
portfolios. In their model, uninformed traders are motivated to reduce their trading losses
to informed traders by trading in basket securities rather than individual securities.
Basket securities provide low cost diversification opportunities for liquidity traders.
Since ETFs are basket securities, they may be relatively more appealing to liquidity
4 AMEX-listed securities are traded on up to nine different markets while NYSE-listed securities are traded on seven markets. Bessembinder (2003) shows that, for the 100 largest NYSE stocks, the NYSE maintained around 82 percent of the market share in terms of trading volume in year 2000. The picture is different for the ETFs as in 2001 the AMEX had about 34, 58 and 56 percent of trading volume in the QQQ, SPY and DIA, respectively [Boehmer and Boehmer (2003)].

6
traders than the underlying securities. The differing mix of informed and liquidity-
motivated trading of ETFs may cause the opening and closing of ETFs to differ from that
of the underlying securities. Particularly, the mix of informed trading and liquidity-
motivated trading may affect the price discovery process because informed trading
affects the amount of information revealed and the timing of that revelation.
The primary contributions of this study are twofold. First, by examining the
highly fragmented ETF market, we are able to study price discovery and liquidity in
multimarket trading at the open and close. Second, this study provides a comprehensive
analysis of the opening and closing procedures of ETF markets.
The paper proceeds as follows. In section 2 we describe the institutional
framework of ETF markets. In Section 3 we develop hypotheses. Section 4 provides a
description of the data and the methods used in this paper. Section 5 contains empirical
analyses and results. Section 6 concludes.
2. Institutional Background
At their inception, most ETFs were listed on the AMEX and began trading
primarily on the AMEX and NASDAQ. Currently, the NYSE, regional exchanges and
various Electronic Communication Networks (ECNs) are making inroads into ETF
trading. ETFs now trade on nine different markets. The AMEX has lost its dominant
position and the market for ETFs is highly fragmented.5 Proponents of market
5 When first introduced, the QQQ, SPY and DIA traded primarily on the AMEX, with AMEX having 86, 99 and 93 percent of the share volume, respectively. In 2000, after the NYSE entrance, the AMEX had about 34, 58 and 56 percent of the trading volume in the QQQ, SPY and DIA, respectively [Boehmer and Boehmer (2003)]

7
fragmentation argue that it is associated with competition and innovation. In addition,
fragmented markets can better meet the diverse needs of investors because different
markets provide different services to investors. While, fragmentation has a positive side,
it also has a negative side. Price discovery is difficult in a fragmented market [Stoll
(1994), Amihud and Mendelson (1996), Macey and O'Hara (1999)]. In particular, price
discovery can be increasingly difficult at the open and close, since the various markets
have different opening and closing procedures.
The market centers that trade ETFs can be classified into four general groups.
The AMEX and NYSE are specialist markets. The NASDAQ is dealer market. The Inet
(reports trades to the NSX) and the Archipelago Stock Exchange (reports trades to the
PAC) are electronic markets. In addition, the Boston Stock Exchange (BSE), Chicago
Stock Exchange (CHX), Philadelphia Stock Exchange (PHX), and Chicago Board of
Options Exchange (CBOE) are classified as regional exchanges.
At the open, both the NYSE and AMEX use a batch method to open trading for
actively traded stocks .6 In a batch (call auction) market, multiple traders transact at a
pre-specified time at a single price that maximizes trading volume. Order flow is
consolidated on the AMEX and NYSE at the open because those two markets have a
central limit order book to aggregate orders. The specialists observe the limit order book
and determine the opening price. Any order imbalances can be offset by the specialists
trading from their inventories. The specialists may profit, given the information
advantage at the opening. However, inventory control and exchange obligations, such as
price continuity, may limit the specialists from trading strategically on their information
6 For thinly traded stocks, the specialists open trading by posting bids and offers based on the information from the limit order book and their willingness to trade.

8
advantage. At the open, AMEX specialists can observe their limit order books, but no
other traders can. Although, opening procedures are similar on the AMEX and NYSE,
pre-trade transparency is not. The level of pre-trade transparency at the NYSE has
changed after the introduction of the OpenBook in January 2002. The OpenBook allows
traders off the NYSE floor to observe the limit order book in real time.
Like the opening procedures, the closing auction on the AMEX and NYSE also
yields a single trade price. Traders can enter market-on-close (MOC) and limit-on-close
(LOC) orders to be executed at the closing prices. Before the close, specialists determine
if there is an imbalance of buy or sell MOC and LOC orders. If the specialist publishes
an order imbalance, MOC and LOC orders can only be entered on the other side of the
imbalance. At the close, on-close orders are paired off at the same trade price, and
specialists supply additional liquidity needed to execute the remaining on-close orders.
On the NASDAQ, trading opens with competing dealers posting firm quotes.
However, in the pre-trade period, market makers can signal their information by posting
nonbinding quotes [Cao, Ghysels, and Hatheway (2000)].7 This process conveys
information to other dealers and aids substantially to price discovery. In contrast to the
AMEX and NYSE, the NASDAQ does not have a central limit order book that
aggregates orders. The opening process on NASDAQ can be highly decentralized as
actively traded stocks have many market makers.
The closing session of the NASDAQ is similar to that of the opening session. On
March 29, 2004, the NASDAQ launched a closing cross that crosses orders at a single
7 In the last few years, the pre-market has become more active [Barclay and Hendershott (2004)]. Market makers can also use trading as price signal in addition to the use of nonbinding quotes.

9
price. However, this closing cross only applies to NASDAQ stocks, not exchange-listed
securities.
The Archipelago Stock Exchange (ArcaEx) currently runs an opening call auction
for NYSE- and AMEX-listed securities. The ArcaEx initiated a closing auction for OTC
stocks in March 2004 and is planning to commence a closing auction for listed securities.
Contrary to the specialists who set a single opening price and offset the order imbalance
by trading from their inventories, the ArcaEx is an automated system that constructs a
system clearing price that maximizes executed volume without any intervention of
market makers. Any order imbalance is disseminated to a continuous trading system.
The INET, on the other hand, does not open and close with a call. INET starts with an
empty book in the morning because unexecuted orders from previous days expire. Both
the ArcaEx and INET are Electronic Communication Networks (ECNs). Despite
dissimilarities, they both have a preopening trading session that contributes significantly
to price discovery [Barclay and Hendershott (2003)].
The OpenBook on the NYSE, the pretrade period on the NASDAQ and the
preopening trading sessions on the ECNs, make the level of pretrade transparency on
those trading venues higher than on the AMEX. The differences in opening and closing
procedures of ETF market centers lead to the conjecture that the levels of contribution to
price discovery and liquidity may vary across markets at the open and close. In the next
section, we relate this issue to previous research and develop hypotheses to be tested.
3. Hypotheses
3.1 Price Discovery

10
“Price discovery” refers to the process where new information is impounded in
securities prices. “Price efficiency” refers to the degree to which prices reflect the true
value of securities. Price discovery and price efficiency are directly related. When
securities are traded simultaneously in different market structures, price discovery will
occur in the more informationally efficient markets. As mentioned in section 2, opening
procedures and levels of pre-trade transparency differ across market centers. Those two
factors affect price discovery and price efficiency.
Madhavan and Panchapagesan (2000) compare the single-price opening auction
of the NYSE with a fully automatic call auction system that does not involve any
specialist intervention. They find that the presence of specialists facilitates price
discovery relative to a fully automated call auction market. Greene and Watts (1996)
compare the ability of the NYSE and NASDAQ to impound information into the opening
trade and find no significant differences. On the other hand, Masulis and Shivakumar
(2002) find that price adjustments to overnight information releases are quicker on the
NASDAQ than on the NYSE. Our study differs from those studies because we compare
various market centers trading the same security. By doing so, we can control for
security specific characteristics.
Several studies offer results about the role of specialists in the price discovery
process of a single-price opening auction. Stoll and Whaley (1990) and Brock and
Kleidon (1992) argue that specialists have privileged knowledge about order imbalances
at the open, and use that knowledge to profit by setting wider spreads. As a result, the
reduced competition at the open induces greater price volatility.8 If specialists trade on
their information, price discovery is facilitated and opening prices are more efficient. 8 Price volatility is not necessary bad if it reflects private information revealed in trading.

11
However, Madhavan and Panchapagesan (2000) find that specialists’ opening trades, not
only reflect information from the limit order book, but also non-informational factors
such as price stabilization. Their results indicate that price stabilization requirements
limit the ability of specialists to extract rents from their superior information.
Under the assumption that only the specialists can observe their limit order books,
they play important roles in the price discovery process. However, if the limit order book
is displayed to the public, will price discovery and price efficiency be affected?
Regarding pre-trade transparency, Stoll and Whaley (1990) argue that the disparate
opinions formed by limit order investors who cannot observe the limit order book make
price discovery more difficult. Boehmer, Saar, and Yu (2003) provide empirical support
to the view that pre-trade transparency enhances informational efficiency and benefits the
price discovery process. The limit order book reveals buying and selling interest, and can
be used by investors to infer the value of the security. Domowitz and Madhavan (2001)
suggest that some transparency is desirable. When liquidity is displayed, it attracts
further liquidity. However, too much transparency can be detrimental to liquidity and
price discovery because a transparent market may discourage traders from submitting
orders because of information revelation. On the other hand, little transparency may
attract informed traders, and consequently discourage liquidity traders. Hence, liquidity
may decrease and price volatility may increase.
The above studies consider only the primary exchange. In the case of
multimarket trading, traders can migrate from one trading venue to another. Informed
traders prefer markets where their orders are not displayed. Thus, the less transparent
opening call auction of the AMEX should attract more informed order flow. Informed
12
traders possess private information about the true value of a security. Given the ability to
trade anonymously, informed traders are enticed to reveal their true reservation prices,
thus contributing to price discovery. We face a dilemma in conjecturing whether an
opaque market enhances or impairs price discovery. On one hand, AMEX’s share of
price discovery may be enhanced by informed traders who are enticed by the ability to
trade anonymously. On the other hand, informed trading may discourage liquidity traders
and consequently impair liquidity and price discovery. Hence, the net effect of market
transparency is an empirical issue we address.
We argue that the negative effect of market transparency may not be as important
a consideration because the consolidation of trading on the AMEX at the open may
attract a greater proportion of liquidity traders. The consolidation of trading leads to
positive network externalities where order flow attracts order flow [Economides and
Schwartz (2001)]. Accordingly, we hypothesize that the opening call auction on the
AMEX is expected to contribute most significantly to price discovery and liquidity.
Hypothesis 1: Price discovery varies across ETF markets at the open, with the AMEX
contributing more to price discovery than the other trading venues.
At the opening, trading consolidates on the AMEX and NYSE. On the other
hand, after the opening, trading becomes more fragmented (see Table 2). Trading
activity on the ECNs increases rapidly. We will examine which market centers
contribute most to price discovery on an intraday basis.

13
Barclay, Hendershott, and McCormick (2003) find that ECNs attract informed
traders due to their advantages of anonymity and speed of execution when looking at
NASDAQ stocks. NASDAQ market makers are able to retain the most profitable orders
by preferencing or internalizing the less informed trades and offering those trades better
executions while the more informed and consequently less profitable orders, are executed
on ECNs. For NYSE-listed securities, there is evidence that the regional exchanges skim
less-informed order flow from the NYSE [Easley, Kiefer, and O'Hara (1996);
Bessembinder and Kaufman (1997)]. In addition, Huang (2002) examines quote quality
of Nasdaq market makers and ECNs. The results indicate that the ECNs not only submit
informative quotes, but also contribute most to price discovery, and are price leaders. He
suggests that those qualities are attributable to the anonymous trading feature of the
ECNs. As informed trading and price discovery are related, we expect price discovery to
differ across trading venues as informed trading does.
Hypothesis 2: Intraday price discovery differs across trading venues, with the AMEX,
NYSE and ECNs contributing more to price discovery than the NASDAQ
and regional exchanges.
3.2 Price Efficiency
As price discovery and price efficiency are directly related, one might conjecture
that the AMEX’s opening price is relatively more efficient than that of other trading
venues. However, a market that facilitates more price discovery at the open will not
necessarily have a more efficient opening price as markets can free ride on price
14
discovery occurring on other markets. If markets free ride on price discovery occurring
on other markets we would expect that the markets that open later will have more
efficient opening prices.
Hypothesis 3: The market that opens after other markets will have the most efficient
opening prices.
3.3 Trading Costs
The opening call auction of the AMEX and NYSE attracts substantial volume.
There are several studies providing empirical supports for the view that consolidation of
order flow helps reduce trading costs. Bacidore and Lipson (2001) find that the opening
trades on the NYSE are less costly than later trades whereas opening trades on the
NASDAQ are more costly than later trades. They attribute the lower trading costs on the
NYSE to the consolidation of orders at the opening auction. Arnold, Hersch, Mulherin,
and Netter (1999), and Amihud, Lauterbach, and Mendelson (2003) find that
consolidation of orders leads to lower spreads. Bennett and Wei (2003) find that trading
costs decline when firms move from the NASDAQ to the NYSE, and argue that the
overall improvement in market quality is caused by the more consolidated system of the
NYSE. On the other hand, Stoll and Whaley (1990) and Brock and Kleidon (1992) argue
that specialists have privileged knowledge about order imbalances at the open, and use
that knowledge to profit by setting wider spreads. Thus, we need empirical evidence to
determine which one of consolidation hypothesis and market power hypothesis is valid.
In this paper we argue that the high opening trading volume on the AMEX provides

15
better opportunities for trading interests to cross, thereby reducing trading costs for
investors
Hypothesis 4: The opening trades on the AMEX and NYSE are less costly for ETF
investors than the opening trades on other ETF markets
Numerous studies find that the probability of informed trading differs across
trading venues. [Easley, Kiefer, and O'Hara (1996); Bessembinder and Kaufman (1997);
Barclay, Hendershott, and McCormick (2003)] As the NASDAQ and regional exchanges
can skim less-informed order flow, we expect trading costs to be lower on NASDAQ and
regional exchanges during the trading day.
Hypothesis 5: Trading costs are lower on regional exchanges and NASDAQ during the
trading day.
Previous intraday literature documents that the pattern of spreads is different on
the NYSE and the NASDAQ. McInish and Wood (1992) find that intraday spread for
stocks listed on the NYSE or AMEX has a reverse J-shaped pattern. Chan, Christie, and
Schultz (1995) find the intraday spread for the NASDAQ securities is widest at the open
and remain high in the first hour of trading, thereafter declines and narrows abruptly
during the last hour of trading. The differing spread patterns for NYSE- and NASDAQ-
listed securities at the close may be attributable to differences in the dealers’ method for
inventory management [Chan, Christie, and Schultz (1995)]. Amihud and Mendelson

16
(1982) construct an inventory model, where the specialist reacts to inventory imbalances
by widening the spread. Chan, Christie, and Schultz (1995) argue that NASDAQ market
makers narrow spreads in order to unload unwanted inventory. Barclay, Christie, Harris,
Kandel, and Schultz (1999) show that new SEC order handling rules affect the intraday
pattern of inside spreads. Inside spreads are highest immediately after the open, drop
sharply in the first half-hour of trading, remain stable during the day, and drop abruptly at
the close. The results indicate that intraday pattern of spreads for NASDAQ stocks
converge to that of the NYSE- and AMEX-listed stocks at the open. However, the
differences at the close remain after the SEC rules change.
One feature of ETFs that differs from that of the individual stocks is the
possibility of in-kind creation and redemption. In-kind creation and redemption are
processes whereby ETF shares and underlying stock shares are traded interchangeably
without resorting to traditional cash sales of the underlying equities.9 Only Authorized
Participants (APs), which are ETF specialists and designated institutional investors, can
post orders to create or redeem ETF shares. The APs have until a few seconds before
4:00 pm to notify the Trust of any intention of creation or redemption. Creations and
redemptions are mainly motivated by inventory management by the APs. The APs may
need to create additional ETF shares because of strong demand or may need to redeem
existing ETF shares because of an excessive inventory. If an ETF is traded at a discount
(ETF’s price is lower than the fund’s net asset value (NAV)), ETF specialists who have a
long inventory will be better off unwinding their inventory by redemption. However, if
an ETF is trading at a premium (ETF’s price is higher than the fund’s NAV), the ETF
specialists will benefit from a long inventory. The opposite applies to specialists who 9 In-kind creation/redemption does not create a tax event for the fund, whereas a cash sale does.

17
have short inventory. As possibilities of creation and redemption serve as inventory
management devices, ETF specialists do not face the same level of inventory risk as do
individual stock specialists. Furthermore, besides the possibility of making offsetting
transactions in the market of underlying securities, market makers and specialists can do
so in the futures market or market of related ETFs. As inventory risk is less of an
important consideration in the case of ETFs, quoting behavior of ETF specialists may
differ from that of market makers of individual NYSE- and NASDAQ-listed securities.
Unlike previous intraday studies that suggest that spreads are used by specialists
as device for inventory management, we argue in this study that the possibility of
creation and redemption is a means of inventory management. The difference in
inventory management of ETF market makers will lead, hypothetically, to different
intraday spread patterns for ETFs as compared to NYSE- and NASDAQ-listed securities.
As market makers rely less on spreads as devices for inventory management, we do not
expect an abrupt increase or decrease in spreads at the close.
Hypothesis 6: Intraday spread pattern of ETFs differs from that of NASDAQ and NYSE
securities.
4. Data and Descriptive Statistics
4.1 Data
Our data consist of all trades and quotes during normal trading hours for all ETFs listed
on the AMEX. Our initial sample consists of 128 ETFs. We exclude any ETFs that have
a price less than $3.00. Additionally, we add the criteria that the ETF must trade every

18
day in the sample, with an average of at least 50 trades a day. The study period is June
2004 (21 trading days). Trade and Quote database (TAQ) provides quotes and trades data
for AMEX-listed securities. TAQ classifies trades and quotes for various markets such as
the AMEX, NYSE, NASDAQ, Archipelago Stock Exchange (which is a fully electronic
exchange), Boston Stock Exchange (BSE), Chicago Stock Exchange (CHX), National
Stock Exchange (NSE, formerly Cincinnati Stock Exchange), Philadelphia Stock
Exchange (PHX), and Chicago Board of Options Exchange (CBOE). We group the last
five markets into one group called “Regionals” as they only have a small market share of
ETF trading. The analysis in this paper emphasizes more on specialist markets, dealer
markets, and ECNs.
Besides TAQ, we use another dataset, INET’s historical ITCH data, to identify
trades and quotes from one of the largest ECN, INET. INET reports trades in ETFs both
to NASDAQ’s Computer Assisted Execution System (CAES) and National Stock
Exchange (NSX). INET trades are printed with symbol “T” on CAES and “C” on the
NSX in TAQ. INET’s historical ITCH data allows the possibility to segregate INET
trades from NASDAQ and NSX trades on TAQ. ITCH is a vendor level data feed that
provides data about orders entered into and executed on the INET. These data are time-
stamped to the nearest milliseconds. ITCH data feed is made up of a series of sequenced
messages that disseminates information about orders and execution that would change
INET limit order book. We match ITCH trades with TAQ trades based on price, size,
and time. Due to reporting delays, INET trades are usually printed a couple of seconds
later on the TAQ. We match ITCH trades to TAQ trades using different time lags (0-5
seconds time lag). This procedure identifies most of INET trades on the TAQ.

19
Another benefit that ITCH provides is order type identification. Unlike TAQ,
ITCH indicates whether an order is buyer- or seller-initiated. For non-INET trades we
use the Lee and Ready (1991) algorithm to classify trade direction. A trade is classified
at buyer-initiated if the trade price is greater than the prevailing quote midpoint, and
seller-initiated if lesser than the prevailing quote midpoint. Trades executed at the
midpoint on an up-tick are classified as buyer-initiated and on a downtick as seller-
initiated. Quote midpoints are calculated using the National Best Bid and Offer (NBBO)
inferred from TAQ.
4.2 Trading Activity
Table 1 describes trading activity in ETFs for various markets. Trading activity
variables include the average daily number of trades, average daily volume and mean
trade size. In terms of number of trades, the ArcaEx is the most active followed by the
INET. These two markets are both Electronic Communication Networks (ECNs). In
terms of trading volume the INET leads followed by the ArcaEx. The primary market,
AMEX, seems to loose market share to these ECNs. Although the number of trades is
larger on the ArcaEx than on the INET, its market share in trading volume is smaller. It
can be explained by the smaller trade size on the ArcaEx. Overall, mean trade size for
ETFs is larger than 1000 shares with only Regional with a mean trade size of 687.93.
The analysis of trading activity leads to the conclusion that ETF markets are fairly
fragmented. There are four big players, the ArcaEx, INET, NASDAQ, and AMEX, but
none of these dominates the whole market.

20
While Table 1 analyses trading activity on an average daily basis, Table 2 reports
market share in term of trading volume for various markets at different time periods.
Table 2 gives us an overall picture of the importance of the opening and closing, and the
changing nature of ETF trading from a more consolidated market system at the opening
to a more fragmented market system during intraday period. Trading volume exceeds
seven percent at the first 15 and last 15 minutes of the trading day. The opening auction
of the AMEX accounts for approximately 0.36 percent of daily volume. While the
ArcaEx and INET take a large market share during intraday periods, their market shares
at the opening and closing are relatively small. The relatively high trading activity at the
open and close can be explained by the theory that limit order traders trade early in the
day to meet liquidity demands arising overnight or to take advantage of information
asymmetry existing at the opening of the market. This theory is advanced by Admati and
Pfleiderer (1988) who argue that the concentrated trading patterns arise endogenously as
the result of the strategic behavior of informed traders and discretionary liquidity traders.
Brock and Kleiden (1992) analyze the effect of periodic stock market closure on
transactions demand and volume of trade, and consequently, bid and ask prices. Their
study demonstrates that transactions demand at the open and close is greater and less
elastic than at other times of the trading day and that the market maker takes advantage of
the inelastic demand by imposing a higher spread to transact at these periods of peak
demand. This hypothesis will be tested in section 5.
Figure 1 graphs the average trading volume and volatility by half-hour period
during the trading day. Dating back to the earliest intraday patterns literature, Wood,
McInish and Ord (1985), Harris (1986) and McInish and Wood (1990a) show that

21
volatility exhibits a U-shaped pattern over the trading day. Jain and Joh (1988) and
McInish and Wood (1990b) also show an intraday U-shaped pattern in volume. Tse and
Hackard (2003) are the first to examine the intraday behavior of ETFs. However, they
only examine one ETF, the QQQ. They find that QQQ exhibits a distinct U-shaped
pattern for volume and the number of trades. We will add to their study by investigating
the intraday behavior of all ETFs. In addition, we also examine the intraday pattern of
volatility. In order to estimate the intraday patterns in volatility, we compute standard
deviation of the midquote at the end of each 30 minute interval (overnight returns are not
included). Chan, Christie, and Schultz (1995) suggest that using the average of inside bid
and inside ask quotes instead of trade prices helps alleviate the volatility induced by bid-
ask bounce.
We conduct F-tests to test for differences in trading volume and return volatility
across the 13 time intervals. The results suggest a U-shaped pattern in volume, consistent
with previous studies concerning intraday patterns in trading activity. However,
volatility seems to exhibit a different pattern at the end of the trading day. This might be
attributable to the different feature of ETFs. ETFs do not typically trade at a discount to
their net asset value (NAV). Since large institutions can create or sell the underlying
shares directly, arbitrage keeps ETF prices very close to their NAV. Return volatility
may be higher in the early morning. However, as the trading proceeds, ETF prices are
closer to their NAV. Consequently, ETF return volatility does not level up at the close of
the trading day as does return volatility of the underlying securities.

22
5. Empirical Analyses and Results
This section contains empirical analyses and results. We will examine price
discovery and liquidity (trading costs) at different periods of the trading day. In addition,
we also investigate which market structure provides the most efficient opening price.
5.1 Price Discovery
There are two alternative measures of price leadership in previous literature. The
first one is the Vector Error Correction Model (VECM) of Hasbrouck (1995). This
model decomposes a security price into two components. The first component is the
random-walk component which is common for all prices across markets. The second
component is a transient effect which is microstructure-related. The VECM estimates
market participant’s share of the variance innovations in the common permanent price.
Another alternative approach to measure information flow associated with various time
periods and to identify trading venues with the dominant price leadership is the weighted
price contribution (WPC). Barclay and Warner (1993) use the WPC measures to
examine price changes associated with trades of different sizes and thereby identify
which trades move prices. Cao, Ghysels, and Hatheway (1999) use WPC measures to
examine the contribution of locks and crosses in the pre-opening trading period to the
price discovery process. Huang (2002) uses WPC measures to identify price leadership
among NASDAQ market makers and ECN. Barclay and Hendershott (2003) use WPC to
measure price discovery in the after hours markets. In this paper we adopt the WPC to
examine price leadership. The advantage of the WPC measure is that it provides a single
measure for price leadership while VECM provides bounds on the information shares of

23
each participant (Huang, 2002). Another advantage of the WPC is that it reduces the
heteroskedasticity in the observations and avoids the difficulties of zero price changes
Barclay and Hendershott (2003).
In this paper we use WPC to measure the price contribution of different trading
venues at various trading period. We divide the open-to-close into five periods, opening
(9:30-9:45am), post opening (9:45-10:00am), intraday (10:00am-3:30pm), pre-closing
(3:30-3:45pm), closing (3:45-4:00pm). In addition, we add the opening and closing
trades.
The WPC for each participant “j” and each time period “i” is computed as
⎟⎟⎠
⎞⎜⎜⎝
⎛
⎟⎟⎟⎟
⎠
⎞
⎜⎜⎜⎜
⎝
⎛
=∑∑=
=
is
jis
S
sS
s
is
is
ij retretx
ret
retWPC
,
1
1
,
Where jisret , is the logarithmic return for participant “j” during period “i” for
stock “s” and i
sret is return for period “i” for stock “s”. The return used in the approach
is from trade prices. While most of these studies examine quote changes, we examine
trade price changes. The advantage of using trade prices is that we can be able to identify
where information enters the market or where informed traders might choose to trade.
Quote data only identifies which venue providing the most timely and informative
quotes. When an informed trader trades in market A, he might reveal information not
only to market A but also market B. In this case both markets revise their quotes to
adjust for change in information. Only trade data can answer the question of where
information enters the markets.

24
The weakness of using changes in trade prices is the problem of bid-ask bounce.
Trade prices may change when a buy order is followed by a sell order and vice versa,
while the prices that market makers are willing to buy and sell stay the same. We correct
for this problem by classifying trades according to whether they are buyer- or seller-
initiated. We exclude the price changes from buy to sell order and from sell to buy
orders. (Graham, Michaely, and Roberts (2003): Bid-ask bounce).
Table 3 shows the weighted price contribution of various markets at the opening,
closing and other time periods. WPC measures the fraction of open-to-close return that
occurs in each period. WPC of the opening reflects the ability of the opening procedures
of various markets to incorporate overnight information into the opening prices. WPC
measure help identifying price leadership among markets as it estimates the contribution
of various markets to the open-to-close price changes of the observed periods.
Consistent with Hypothesis 1, the opening auction of the AMEX contributes most
to price discovery process, as its WPC exceeds three percent. Although the NYSE also
has an opening auction, its WPC is only 0.9 percent. As argued earlier, the opaque
auction system of the AMEX may attract more informed trading and discourage liquidity
traders, consequently impairing price discovery process. It may be true that in a market
system where only one market dominates, pre-trade transparency may enhance price
discovery. However, in a multiple market trading system traders can migrate from
trading venue to trading venue. If a market is transparent, it will discourage informed
traders to trade. Consequently, they will migrate to a less transparent market. This can
explains why the transparent opening auction of the NYSE does not attract a large pool of
liquidity. Our study is consistent with (Economides and Schwartz, 2001) who suggest

25
that consolidation of trading leads to positive network externalities. The results support
the hypothesis that the consolidation effect is stronger than the negative effect of market
transparency.
A closer look at the total WPC of all markets for each time period indicates that
the AMEX contributes most to price discovery with a WPC measure of 48.38%. The
dealer market, NASDAQ, contributes with 18.92% to the total daily price changes.
Despite the higher market share of ECNs, they contribute very little to price discovery.
This result is inconsistent with Barclay, Hendershott and McCormick (2003) who suggest
that ECNs attract informed trading due to the anonymity their trading system provides.
Previous studies also suggest that NASDAQ market makers use order internalization or
preferencing agreement to get less informed trades. In the case of ETFs, where informed
trading is not prevalent, market makers do not cream skim like they do for trading in the
underlying securities.
Figure 2 graphs intraday WPC based on 13 half-hour minute intervals. We
conduct F-tests to test for differences in WPC measures across 13 trading intervals. The
result shows a nicely V-shaped intraday WPC pattern. The sharply rise of WPC measure
at the close of the trading day seems puzzling given the fact information asymmetry
declines over the trading day (Barclay and Hendershott, 2003).
5.2 Information Efficiency of Prices
We follow Madhavan and Panchapagesan (2000) and use the variance ratio test to
determine which opening procedure provides most efficient opening prices. We use the
3:00 pm midquote as a common benchmark, a proxy for the security’s value, and

26
calculate how much the opening price of the different markets deviate from this common
benchmark. The variance ratio is computed as
)]ln(P-)Var[ln(P)]ln(P-)Var[ln(P
b*
a*
=VR
where P* is the 3:00 pm midquote and Pa is the opening price of market A and Pb is the
opening price of market B. A ratio close to one indicates that there is little difference in
the information content of the opening prices of two markets. A ratio larger than one
indicates that the opening price of market B is closer to the 3:00pm midquote, which
means that market B has more efficient opening prices. We compare each of other
markets to the primary market, the AMEX, to determine whether the specialists use their
information advantage via an auction system to set the most efficient prices.
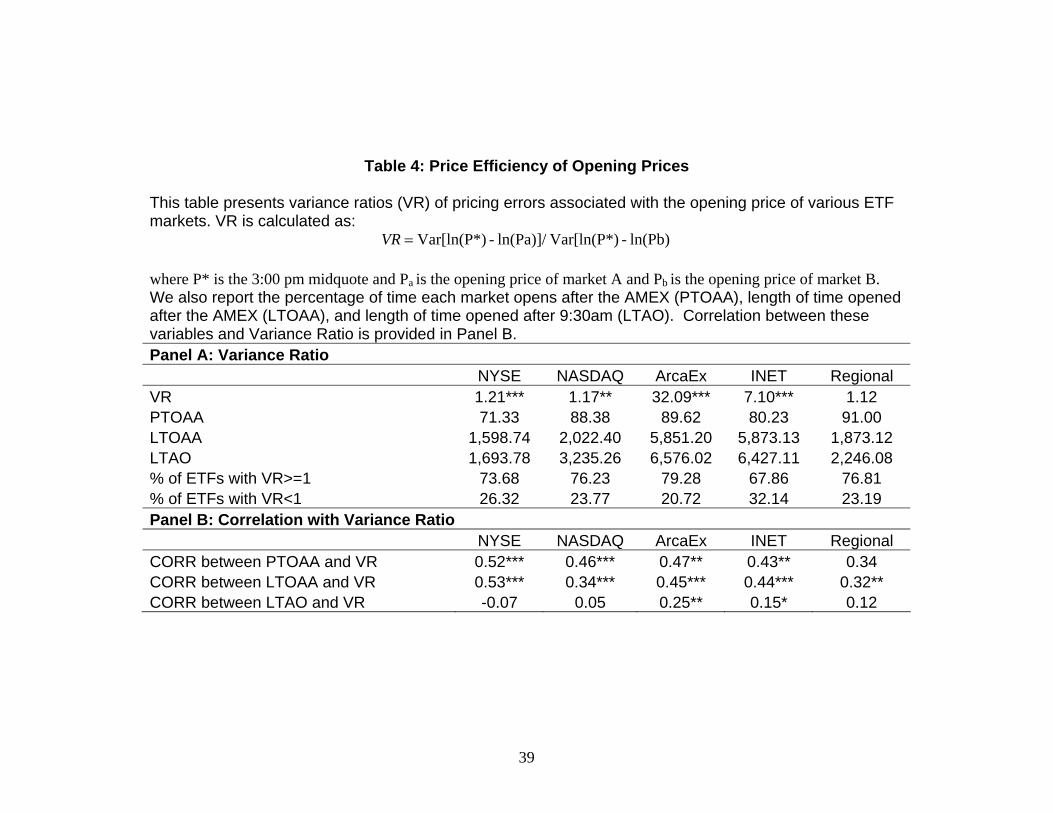
Table 4 reports Variance Ratio (VR) for various markets. The result shows that
VR is larger than one for all markets. A VR larger than one indicates that opening price
of that particular market is closer to the 3:00 pm midquote than the opening price of the
AMEX is. The percentage of time VR is larger than one exceeds 70 percent for almost
all markets. In order to investigate whether other markets free ride on information
revealed by the opening auction of the AMEX and thereby set a more efficient opening
price, we compute the percentage of time in which other markets open after the AMEX
(PTOAA). Table 4 shows that most of the time other markets open after the AMEX.
The correlation between POTOAA and VR is positive for all exchanges. A positive
correlation confirms our Hypothesis 3, which states that markets free ride on information

27
revealed through trades in other market, in which case is the AMEX. We also compute
the average length of time other markets open after the AMEX (LTOAA). The ECNs
have the highest LTOAA.
Table 5 reports a robust check for the determinants of opening price efficiency.
We regress VR on the length of time and percentage of time opened after the AMEX and
the size of the opening trades. The regression results illustrate that the longer the length
of time other markets open after the AMEX, the more efficient is their opening price.
5.3 Trading Costs and Intraday Spread Patterns
Table 6 explores the impact of opening and closing procedures on liquidity which
is measured by trading costs. Effective spreads for five time periods (opening, post-
opening, intraday, pre-closing, and closing) and opening and closing trades are reported.
If it is true that the consolidation of trading at the opening and closing auction on the
AMEX and NYSE provides better opportunities for trading interests to cross and helps
reducing trading costs, we would observe lower spreads for AMEX and NYSE opening
and closing trades than trades in other markets in the same time periods. In addition,
trading costs for opening and closing trades on the AMEX and NYSE should also be
lower than AMEX and NYSE trades in other time periods. However, if the specialists
take advantage of the inelastic demand at the open and close by imposing a higher spread
to transact at these periods of peak demand as argued in Brock and Kleidon (1992), we
would observe higher spreads for AMEX and NYSE trades than for trades in other
markets in the same time periods and for AMEX and NYSE trades in other time periods.
28
Table 6 reports effective spread for all markets at the opening, closing and five
other intraday periods. Our results lend support to the result in Brock and Kleidon
(1992). Trading costs of AMEX specialist trades are significantly higher than those of
other markets at the opening. Even though AMEX trading costs decrease during intraday
period, they are still higher than those of other markets. It is possible that AMEX
specialist has the obligation to maintain an orderly market and consequently has to trade
very infrequently traded ETFs. The spread for infrequently traded securities is known to
be wider than that of frequently traded securities. The fact that AMEX trades more
infrequently traded stocks may cause their trading costs to be wider. We need to control
for ETF characteristics before making the statement that AMEX trading costs are wider.
Figure 3 plots intraday patterns of effective spreads and quoted spreads.
According to Chan, Christie, and Schultz (1995), inventory management by market
makers may affect the width of bid-ask spreads near the close. However, as argued
earlier, ETF markets offer market makers a variety of devices to manage their inventory
such as in-kind creation and redemption, and the possibility of making offsetting
transactions in the futures market and market of related ETFs. Thus, we do not anticipate
an abrupt increase or decrease in spreads at the close. We plot effective spreads and
quoted spreads against thirteen trading intervals. Figure 3 indicates that effective spreads
and quoted spreads are widest at the open. The effective spreads and quoted spreads
decline sharply in the first 30 minutes of trading and remain stable throughout the trading
day. This pattern is very different from intraday spread patterns of NYSE and NASDAQ
securities. We do not observe an abrupt drop as of NASDAQ securities and sharp rise as
of NYSE securities. The result supports Hypothesis 6. Given, the flexibility of ETFs

29
with respect to the possibility for market makers to make offsetting transactions via in-
kind creation and redemption and trading in futures market and market of related ETFs,
they do not rely solely on spread as a device for controlling their inventory.
6. Conclusion
This paper provides an intraday analysis of Exchange Traded Fund markets with
emphasis on the opening and closing mechanisms. We investigate trading implications
surrounding the opening and closing, and compare price discovery and liquidity in a
multi-market trading framework. In addition, we test whether the difference of ETFs
with regard to market maker inventory management at the close causes intraday spread
patterns to differ from those of the underlying securities.
The descriptive analysis of market share in terms of volume suggests that the
market for ETFs is fragmented with the ECNs accounting for approximately 50 percent
of trading volume. The primary market, AMEX, only has around 14 percent of trading
volume of its listed securities. The opening and closing exhibit a different nature as
trades are consolidated on the primary market. We find that the opening auction of the
AMEX serves an important role in the price discovery process. Our finding that
consolidation of trades at the opening on the AMEX contributes most to price discovery
is consistent with the positive network externalities hypothesis of Economides and
Schwartz (2001). Despite the small market share of ETF trading, the AMEX contributes
around 48.38 percent of the intraday price changes. This result accentuates the important
role of the specialist in the ETF markets.

30
This article also documents a V-shaped intraday weighted price contribution.
Weighted price contribution proxies for price discovery and information entered the
market. In contrast, Barclay and Hendershott (2003) suggest that information asymmetry
should decline throughout the trading day as information is revealed through trading. A
sharp increase in the weighted price contribution at the end of the day seems puzzling.
Future research needs to be done in order to shed light on this puzzling issue.
Regarding price efficiency, our study suggests that the opening auction of the
AMEX helps incorporate overnight information into securities prices. Most of the time
other markets open after the AMEX and are able to free-ride on information revealed
through AMEX opening trades. This fact is reflected in the length of time other markets
open after the AMEX, as well as the higher variance ratio.
While the AMEX contributes most to price discovery, it also has the highest
spreads for investors at the opening and closing. This results support the market power
hypothesis of Stoll and Whaley (1990) who state that specialists use their information
advantage to set wider spreads at the open, and Brock and Kleidon (1992) who argue that
market makers take advantage of the inelastic demand at the open and close by imposing
wider spreads to transact at these periods of peak demand.
One eye-catching result from our analysis is the spread pattern of ETFs. Our
finding suggests that the intraday patterns of spreads are materially affected by the class
of securities traded. ETFs provide market makers the opportunity to control their
inventory at the end of the trading day by allowing them the possibility to make in-kind
creation/redemption. In addition, ETF market makers can also make offsetting
transaction in the futures market and market of related ETFs. As ETF market makers do

31
not solely rely on spread to control their inventory, there is no abrupt change in spread at
the end of the trading day.

32
References:
Ackert, L. F. and Y. S. S. Tian, 2001, Efficiency in index options markets and trading in stock baskets, Journal of Banking & Finance 25(9), 1607-1634. Amihud, Y., B. Lauterbach and H. Mendelson, 2003, The value of trading consolidation: Evidence from the exercise of warrants, Journal of Financial and Quantitative Analysis 38(4), 829. Amihud, Y. and H. Mendelson, 1982, Asset pricing behavior in a dealership market, Financial Analysts Journal 38(May/June), 50-59. Amihud, Y. and H. Mendelson, 1996, A new approach to the regulation of trading across securities markets, New York University Law Review 71(1441). Arnold, T., P. Hersch, J. H. Mulherin and J. Netter, 1999, Merging markets, Journal of Finance 54(3), 1083-1107. Bacidore, J. and M. L. Lipson, 2001, The effects of opening and closing procedures on the NYSE and Nasdaq, Working paper. Barclay, M. J., W. G. Christie, J. H. Harris, E. Kandel and P. H. Schultz, 1999, Effects of market reform on the trading costs and depths of Nasdaq stocks, Journal of Finance 54(1), 1-34. Barclay, M. J. and T. Hendershott, 2003, Price discovery and trading after hours, Review of Financial Studies 16(4), 1041-1073. Barclay, M. J. and T. Hendershott, 2004, A comparison of trading and non-trading mechanisms for price discovery, Working paper. Barclay, M. J. and T. Hendershott, 2004, Liquidity externalities and adverse selection: evidence from trading after hours, Journal of Finance forthcoming. Barclay, M. J., T. Hendershott and C. M. Jones, 2004, Which witches better? A cross-market comparison of extreme liquidity shocks, Working Paper. Barclay, M. J., T. Hendershott and D. T. McCormick, 2003, Competition among trading venues: Information and trading on Electronic Communications Networks, Journal of Finance 58(6), p2637-2365. Barclay, M. J. and J. B. Warner, 1993, Stealth trading and volatility : Which trades move prices?, Journal of Financial Economics 34(3), 281-305. Bennett, P. and L. Wei, 2003, Market structure, fragmentation and market quality - Evidence from recent listing switches, Working paper, New York Stock Exchange.

33
Bessembinder, H., 2003, Quote-based competition and trade execution costs in NYSE-listed stocks, Journal of Financial Economics 70(3), 385-422. Bessembinder, H. and H. M. Kaufman, 1997, Cross-exchange comparison of execution costs and information flow for NYSE-listed stocks, Journal of Financial Economics 46(3), 293-319. Biais, B., P. Hillion and C. Spatt, 1999, Price discovery and learning during the preopening period in the Paris bourse, Journal of Political Economy 107(6), 1218-1248. Boehmer, B. and E. Boehmer, 2003, Trading your neighbor's ETFs: Competition or fragmentation?, Journal of Banking & Finance 27(9), 1667-1703. Boehmer, E., G. Saar and L. Yu, 2003, Lifting the veil: An analysis of pre-trade transparency at the NYSE, Journal of Finance forthcoming. Brock, W. and A. Kleidon, 1992, Periodic market closure and trading volume: a model of intraday bids and asks, Journal of Economic Dynamics and Control 16, 451-489. Cao, C., E. Ghysels and F. Hatheway, 2000, Price discovery without trading: Evidence from the Nasdaq preopening, Journal of Finance 55(3), 1339-1365. Chan, K. C., W. G. Christie and P. H. Schultz, 1995, Market structure and the Intraday pattern of bid-ask spreads for NASDAQ securities, Journal of Business 68(1). Coppejans, M. and Domowitz, 2001, Noise in the price discovery process: a comparison of periodic and continuous auctions. In R. A. Schwartz, eds, The Electronic Call Auction: Market Mechanism and Trading (building a better stock market), Kluwer Academic Publishers. Domowitz, I. and A. Madhavan, 2001, Open sesame: alternative opening algorithms in securities markets. In R. A. Schwartz, eds, The electronic call auction: market mechanism and trading, building a better stock market, Kluwer academic Publishers. Domowitz, I. and A. Madhavan, 2001, Open sesame: Alternative opening algorithms in securities markets. In R. A. Schwartz, eds, The electronic call auction: Market mechanism and trading (building a better stock market), Kluwer Academic Publishers. Easley, D., N. M. Kiefer and M. O'Hara, 1996, Cream-skimming or profit-sharing? The curious role of purchased order flow, Journal of Finance 51(3), 811-833. Economides, N. and R. A. Schwartz, 2001, Electronic call market trading. In R. A. Schwartz, eds, The Electronic Call Auction: Market Mechanism and Trading (building a better stock market), Kluwer Academic Publishers.

34
Goldstein, M. A., A. V. Shkilko, B. F. Van Ness and R. A. Van Ness, 2004, Electronic limit order books, dealer/specialists,and inter-market competition on NASDAQ, Working Paper. Gorton, G. B. and G. G. Pennacchi, 1993, Security baskets and index-linked securities, Journal of Business 66(1), 1-27. Graham, J. R., R. Michaely and M. R. Roberts, 2003, Do Price Discreteness andTransactions Costs A¡ect Stock Returns? Comparing Ex-Dividend Pricing Before and After Decimalization, Journal of Finance LVIII(6). Greene, J. T. and S. G. Watts, 1996, Price discovery on the NYSE and the NASDAQ: The case of overnight and daytime news releases, Financial Management 25(1), 19-&. Hasbrouck, J., 1995, One security, many markets: determining the contributions to price discovery, Journal of Finance 50(4), 1175-1199. Hasbrouck, J., 2001, Intraday price formation in US equity index markets, Working paper. Huang, R. D., 2002, The quality of ECN and Nasdaq market maker quotes, Journal of Finance 57(3), 1285 - 1319. Lee, C. and M. Ready, 1991, Inferring trade direction from intraday data, Journal of Finance 46, 733-747. Macey, J. R. and M. O'Hara, 1999, Regulating exchanges and alternative trading systems: a law and economic perspective, Journal of Legal Studies 28 (17). Madhavan, A., 1992, Trading mechanisms in securities markets, 1992 47(2), 607-641. Madhavan, A. and V. Panchapagesan, 2000, Price discovery in auction markets: A look inside the black box, Review of Financial Studies 13(3), 627-658. Madhavan, A. and V. Panchapagesan, 2002, The first price of the day - Auctions are not practical for trading all securities, Journal of Portfolio Management 28(2). Masulis, R. W. and L. Shivakumar, 2001, Does market structure affect the immediacy of stock price responses to news?, Working paper. Masulis, R. W. and L. Shivakumar, 2002, Does market structure affect the immediacy of stock price responses to news?, Journal of Financial and Quantitative Analysis 37(4), 617-648. McInish, T. H. and R. A. Wood, 1992, An analysis of intraday patterns in bid/ask spreads for NYSE stocks, Journal of Finance 47(2).

35
Richards Jr., A., 2003, All about ExchangeTraded Funds, McGraw-Hill. Stoll, H. and R. Whaley, 1990, Stock market structure and volatility, Review of Financial Studies 3(1), 37-71. Stoll, H. R., 1994, The causes and consequences of the rise in third market and regional trading, The Journal of Corporation Law 19 (509). Subrahmanyam, A., 1991, A theory of trading in stock index futures, Review of Financial Studies 4(1), 17-51. Yu, L., 2003, Basket securities, price formation, and informational efficiency, Working paper.

36
Table 1: Descriptive Statistics This table reports descriptive statistics for average daily trading activity across various markets. Regional include Boston Stock Exchange (BSE), Chicago Stock Exchange (CHX), National Stock Exchange (NSE), Philadelphia Stock Exchange (PHX), and Chicago Board of Options Exchange (CBOE). Average daily # of trades and average daily volume are calculated for each day and average across 21 trading days of June 2004. Mean trade size is computed for each stock, each day and then average across stocks, then across days.
AMEX NYSE NASDAQ ArcaEx INET Regional Average Daily # of Trades (in thousands) 10.77 3.21 7.10 99.46 35.52 12.93
Average Daily Volume (in millions) 20.58 6.53 29.53 36.88 35.41 17.84
Mean Trade Size 1305.16 2455.97 2786.19 1344.45 1060.47 687.93
Market Share (volume) 0.14 0.04 0.20 0.25 0.24 0.12

37
Table 2: Proportion of Trading Day Volume
This table shows market share of various markets during five different time periods and the opening and closing. The opening and closing are the first and last trades of each market. All numbers are expressed as percentage of total daily share volume.
All AMEX NYSE NASDAQ ArcaEx INET Regional
Opening Trade 0.0036 0.00226 0.00107 0.00041 0.00023 0.00018
9:30-9:45 0.0882 0.00993 0.01206 0.01219 0.01569 0.0271 0.01126
9:45-10:00 0.0716 0.00636 0.01007 0.01106 0.01334 0.02203 0.00876
10:00-3:30 0.6993 0.07742 0.0984 0.11714 0.14494 0.17237 0.08903
3:30-3:45 0.0615 0.00712 0.00823 0.00763 0.01311 0.01913 0.00623
3:45-4:00 0.0794 0.0099 0.00993 0.00888 0.01753 0.02471 0.00845
Closing Trade 0.00075 0.00107 0.00144 0.00056 0.00026 0.00022

38
Table 3: Weighted Price Contribution (WPC) This table provides the weighted price contribution for various time periods to the open-to-close return for various ETF markets. The WPC for each participant “j” and each time period “i” is computed as
⎟⎟⎠
⎞⎜⎜⎝
⎛
⎟⎟⎟⎟
⎠
⎞
⎜⎜⎜⎜
⎝
⎛
=∑∑=
=
is
jis
S
sS
s
is
is
ij retretx
ret
retWPC
,
1
1
,
Where jisret , is the logarithmic return for participant “j” during period “i” for stock “s” and
i
sret is return for period “i” for stock “s”
AMEX NYSE NASDAQ ArcaEx INET Regionals First Trade 0.0198 0.00894*** 0.00678*** 0.00917*** 0.00478*** 0.00539*** 9:30-9:45 0.0336 0.00888*** 0.00932*** 0.00866*** 0.00384*** 0.00439*** 9:45-10:00 0.0056 0.00034*** 0.00273*** 0.00052*** 0.00055*** 0.00091*** 10:00-3:30 0.4034 0.07183*** 0.16091*** 0.08894*** 0.03489*** 0.07665*** 3:30-3:45 0.0336 0.00469*** 0.0129*** 0.00741*** 0.00485*** 0.00688*** 3:45-4:00 0.0077 0.00076*** 0.0033*** 0.00092*** 0.00011*** 0.001*** Last Trade 0.0035 0.0023 0.0045 0.0039 0.0022 0.0044 Whole day 0.4838 0.0865*** 0.18916*** 0.10645*** 0.04424*** 0.08983***
39
Table 4: Price Efficiency of Opening Prices This table presents variance ratios (VR) of pricing errors associated with the opening price of various ETF markets. VR is calculated as:
ln(Pb)-Var[ln(P*)ln(Pa)]/ -Var[ln(P*)=VR
where P* is the 3:00 pm midquote and Pa is the opening price of market A and Pb is the opening price of market B. We also report the percentage of time each market opens after the AMEX (PTOAA), length of time opened after the AMEX (LTOAA), and length of time opened after 9:30am (LTAO). Correlation between these variables and Variance Ratio is provided in Panel B. Panel A: Variance Ratio NYSE NASDAQ ArcaEx INET Regional VR 1.21*** 1.17** 32.09*** 7.10*** 1.12 PTOAA 71.33 88.38 89.62 80.23 91.00 LTOAA 1,598.74 2,022.40 5,851.20 5,873.13 1,873.12 LTAO 1,693.78 3,235.26 6,576.02 6,427.11 2,246.08 % of ETFs with VR>=1 73.68 76.23 79.28 67.86 76.81 % of ETFs with VR<1 26.32 23.77 20.72 32.14 23.19 Panel B: Correlation with Variance Ratio NYSE NASDAQ ArcaEx INET Regional CORR between PTOAA and VR 0.52*** 0.46*** 0.47** 0.43** 0.34 CORR between LTOAA and VR 0.53*** 0.34*** 0.45*** 0.44*** 0.32** CORR between LTAO and VR -0.07 0.05 0.25** 0.15* 0.12

40
Table 5: Regression Analysis of Price Efficiency of Opening Prices
This table presents the determinants of price efficiency of opening prices. We regress Variance Ratio on various determinants anticipated to explain the variation in the Variance Ratio. VR = a+b1PTOAA+b2LTOAA+b3SIZE where VR is variance ratio, PTOAA is the percentage of time each market opens after the AMEX, LTOAA is the length of time opened after the AMEX, and Size is the mean trade size of the opening trades. Variable Coefficients p-value Intercept -16.07037 0.1643 PTOAA 0.02073 0.8915 LTOAA 0.00754 <.0001 SIZE -0.00083567 0.4867 R-Square 0.0544 Pr > F <.0001

41
Table 6: Trading Costs
This table reports execution quality, measured by Effective Spread, for various markets at the opening, closing, and other intraday trading periods. Effective Spread is the trade price minus quote midpoint for buy orders and quote midpoint minus trade price for sell order. Quote midpoint is the prevailing NBBO quote. For non-INET trades, trades are designated as buyer-initiated and seller-initiated according to Lee and Ready (1991) algorithm. For INET trades, the historical ITCH data provides identification of buy/sell indicator. A comparison of effective spreads between AMEX trades and trades from other markets is conducted by using t-tests. AMEX NYSE NASDAQ ArcaEx INET Regional Opening Trade 0.3039 0.07937*** 0.22408*** 0.09133*** 0.09713*** 0.22613*** 9:30-9:45 0.2503 0.06438*** 0.2269 0.12685*** 0.0993*** 0.2653 9:45-10:00 0.1020 0.03922*** 0.1031 0.06587*** 0.07195** 0.0847 10:00-3:30 0.0899 0.03026*** 0.0990 0.07094* 0.0845 0.0747 3:30-3:45 0.0950 0.03215*** 0.0967 0.06518** 0.0893 0.0827 3:45-4:00 0.0981 0.03451*** 0.0983 0.0778 0.06725* 0.07463** Closing Trade 0.1010 0.0352*** 0.0959 0.07674** 0.0913 0.07801** *** indicates significance at 0.01 level. **indicates significance at 0.05 level. *indicates significance at 0.1 level

42
Figure 1: Trading Volume and Volatility
0.00
50.00
100.00
150.00
200.00
250.00
300.00
350.00
400.00
450.00
1 2 3 4 5 6 7 8 9 10 11 12 13
Time Interval
Aver
age
Daily
Vol
ume
(in
mill
ion
shar
es)
0.0000
0.0500
0.1000
0.1500
0.2000
0.2500
0.3000
Retu
rn V
olat
ility
(in
$)
VolumeVolatility
Figure 1: Trading Volume and Volatility
This figure plots the average daily trading volume and volatility for thirteen half-hour periods during normal trading hours. Volatility is defined as the standard deviation of the half-hour stock return.

43
Figure 2: Intraday Weighted Price Contribution
0.05
0.055
0.06
0.065
0.07
0.075
0.08
0.085
0.09
1 2 3 4 5 6 7 8 9 10 11 12 13
Time Interval
WPC
Figure 2: Intraday Weighted Price Contribution This table examines the intraday pattern of the Weighted Price Contribution.
The trading day is divided into 13 half-hours intervals. F-tests are conducted to test whether the means differ across the 13 time intervals.

44
Figure 3: Intraday Spread Patterns
00.05
0.10.15
0.20.25
0.30.35
0.40.45
0.5
1 2 3 4 5 6 7 8 9 10 11 12 13Time Interval
Spre
ads
in $
Effective SpreadQuoted Spread
Figure 3: Intraday Spread Patterns
This table examines the intraday pattern of effective spreads and quoted spreads. The trading day is divided into 13 half-hours intervals (9:30am-4:00pm).


![Overview of European Electricity Markets · PDF fileOverview of European Electricity Markets . ... Price range: [-500€/MWh; 3000€/MWh]. Intraday market: ... intraday market of](https://img.dokumen.tips/doc/110x75/5ab5c6897f8b9a2f438cfbf4/overview-of-european-electricity-markets-of-european-electricity-markets-price.jpg)


![TRADING VOLUMES IN INTRADAY MARKETS … for Management Science and Energy Economics University of Duisburg-Essen EWL Working Paper No. [03/15] TRADING VOLUMES IN INTRADAY MARKETS -](https://img.dokumen.tips/doc/110x75/5b059f077f8b9a79538b48cc/trading-volumes-in-intraday-markets-for-management-science-and-energy-economics.jpg)


![Generating Intraday Trading Rules on Index Future Markets ... · technical analysis in financial markets and the profitability of technical pattern [1]-[3]. Technical trading rules](https://img.dokumen.tips/doc/110x75/5abfd1587f8b9a7e418ea0f4/generating-intraday-trading-rules-on-index-future-markets-analysis-in-financial.jpg)