Embed Size (px)
Citation preview

AN INTERNATIONAL PERSPECTIVE
ON HIGHER EDUCATION
Dirk Van Damme
OECD/EDU

PARTICIPATION
ATTAINMENT
MASSIFICATION…
AND THE VALUE OF A HIGHER
EDUCATION DEGREE
1
2

Educational attainment 25-34y oldsRelative share of attainment levels, OECD – 2000-2016
0
20
40
60
2000 2005 2010 2015 2016
Source: Education at a Glance 2017, Table A1.2 (OECD, 2017)
Upper secondary or post-secondary non-tertiary
Tertiary
Below upper secondary
3
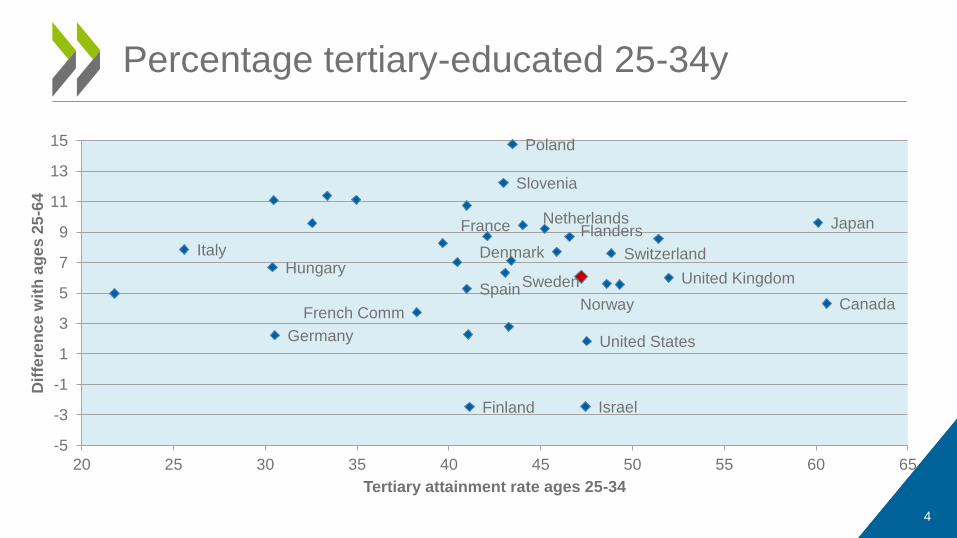
Percentage tertiary-educated 25-34y
Poland
Slovenia
JapanFranceNetherlands
Flanders
Italy Denmark SwitzerlandHungary
Sweden United Kingdom
NorwaySpain
CanadaFrench Comm
Germany United States
IsraelFinland
-5
-3
-1
1
3
5
7
9
11
13
15
20 25 30 35 40 45 50 55 60 65
Dif
fere
nc
e w
ith
ag
es
25
-64
Tertiary attainment rate ages 25-34
4

And more young people are pushing for
higher education
0
10
20
30
40
50
60
70
80
90
100
First-time tertiary entry rates (2015)
5

The wage premium remains high internationally,
but is low in Sweden
50
75
100
125
150
175
200
225
250
Sw
ede
n
Esto
nia
No
rway
De
nm
ark
Fin
land
Gre
ece
Be
lgiu
m
Ne
w Z
ea
land
Au
str
alia
Kore
a
Ita
ly
Ca
na
da
La
tvia
Ne
the
rla
nd
s
Sw
itze
rlan
d
Ja
pa
n
Sp
ain
Un
ite
d…
Au
str
ia
Fra
nce
OE
CD
…
Luxe
mb
ou
rg
Isra
el
Po
land
Ire
land
Ge
rma
ny
Turk
ey
Po
rtu
ga
l
Cze
ch…
Slo
va
k…
Slo
ve
nia
Un
ite
d…
Lith
ua
nia
Hu
ng
ary
Me
xic
o
Costa
Ric
a
Co
lom
bia
Ch
ile
Bra
zil
Earning disadvantage of adults with below upper secondary education Earning advantage of adults with tertiary educationIndex
6

Yet, the level of over-qualification is relatively
low
0 5 10 15 20 25 30 35
JapanEngland/N. Ireland (UK)
AustraliaIreland
CanadaEstonia
GermanySpain
AverageKorea
AustriaCzech Republic
NorwayUnited States
SwedenDenmark
Slovak RepublicFinlandPoland
Cyprus¹ ²Flanders (Belgium)
NetherlandsItaly
7
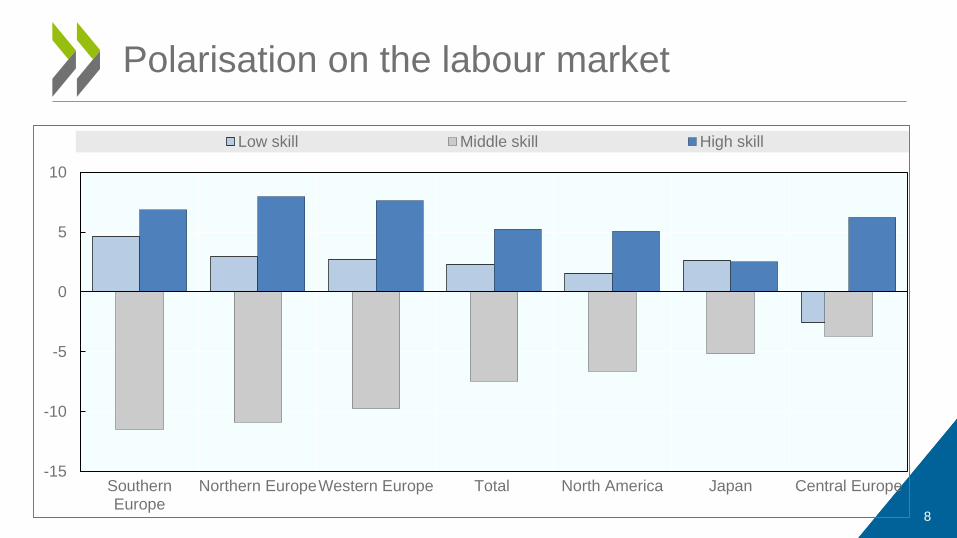
Polarisation on the labour market
-15
-10
-5
0
5
10
SouthernEurope
Northern EuropeWestern Europe Total North America Japan Central Europe
Low skill Middle skill High skill
8

End of credentialism?
9

EMPLOYABILITY
AND THE SOCIAL OUTCOMES OF
HIGHER EDUCATION2
10

Employment rates of graduates are still good, but added
value over a vocational secondary education is negative
0
10
20
30
40
50
60
70
80
90
100
Below upper secondary Vocational General or no distinction Tertiary%
Employment rates of 25-34 year-olds, by educational attainment and programme orientation (2016)
11

Social outcomes – healthProportion of adults reporting that they are in good health, by educational attainment
20
30
40
50
60
70
80
90
100
Kore
a
Esto
nia
Ja
pa
n
Spa
in
Avera
ge
Ne
the
rla
nds
Fra
nce
Fin
land
Norw
ay
Denm
ark
Eng
land
/N.…
Austr
alia
Austr
ia
Italy
Sw
ede
n
Fla
nde
rs…
Slo
vak R
epu
blic
Germ
any
Pola
nd
Cana
da
Un
ited
Sta
tes
Ire
land
Cze
ch R
ep
ub
lic
%
Below upper secondary education Upper secondary or post-secondary non-tertiary education Tertiary Education
12

Social outcomes – Interpersonal trustProportion of adults expressing interpersonal trust, by level of educational attainment
0
10
20
30
40
50
60
70
80
90
100
Denm
ark
Norw
ay
Fin
land
Ne
the
rla
nds
Sw
ede
n
Sw
itze
rla
nd
Austr
ia1
Isra
el
Un
ited
Kin
gd
om
Ire
land
1
Esto
nia
OE
CD
ave
rag
e
Belg
ium
Spa
in
Cze
ch R
ep
ub
lic
Italy
2
Slo
ven
ia
Slo
vak R
epu
blic
Fra
nce
Gre
ece
Pola
nd
Hung
ary
Port
ug
al
Tu
rkey
Below upper secondary education Upper secondary education Tertiary educationPercentage
13

Cognitive foundation skills are moderately
associated with interpersonal trust
Denmark
Norway
Finland
SwedenSwitzerland
Ireland
Netherlands
Great Britain
AustriaLuxembourg
GermanyBelgium
SpainCzech Rep
Italy
HungaryPortugal
Slovak Rep
Greece
460
470
480
490
500
510
520
530
540
-1 -0,8 -0,6 -0,4 -0,2 0 0,2 0,4 0,6 0,8 1
PIS
A r
ea
din
g s
co
re 2
00
9
Interpersonal trust
14

15
Social outcomes probably are driven by social
and emotional skills - An example: conscientiousness
Conscientiousness
Achievement orientation
Setting high standards for oneself and
working hard to meet them
Self-control
Ability to control impulses, delay gratification and
maintain concentration
Responsibility
Following through with promises to
others
Persistence
Persevere in tasks and activities, hard
to distract

HIGHER EDUCATION
PREPARING FOR A CHANGING
SKILLS DEMAND3
16

Is higher education preparing for a changing
skills demand?
Routine manualNonroutine manual
Routine cognitive
Nonroutine analytic
Nonroutine interpersonal
35
40
45
50
55
60
65
70
1960 1970 1980 1990 2000 2006 2009
Mean task input in percentiles of 1960 task distribution (US)
17

In terms of level and well-roundedness of
adult skills Sweden is well-prepared
FinlandNetherlands
SwedenNorwayJapan
New ZealandAustraliaDenmark
Flanders (Belgium)SingaporeGermanyCanadaAustria
Czech RepublicEngland/N. Ireland (UK)
EstoniaUnited States
KoreaSlovak Republic
IsraelIreland
Russian FederationSloveniaPoland
LithuaniaGreeceChile
Turkey
50 25 0 0 25 50
% of
individuals
lacking
basic skills
% of well-
rounded
individuals
18

Highly specialised jobs are more at risk
Specialisation negatively related to skills
Chile
Turkey
Italy
Greece
Spain
Israel
Slovenia
Singapore
France
Lithuania
Poland
Ireland
Austria
United States
Germany
England/N. Ireland (UK)
Korea
Denmark
Czech Republic
Canada
Slovak Republic
Russian Federation
Estonia
Flanders (Belgium)
Norway
New Zealand
Australia
Sweden
Netherlands
Finland
Japan
0,45
0,455
0,46
0,465
0,47
200 230 260 290 320
Source: Survey of Adult Skills (2012, 2015)
Increased
median worker
specialisation
Median literacy score19

Specialisation by educational attainment
Sweden’s tertiary graduates too specialised?
0,45 0,455 0,46 0,465 0,47
FinlandCzech Republic
AustriaGermany
NorwayEstonia
DenmarkJapan
Flanders (Belgium)Australia
SingaporeUnited States
SloveniaNew ZealandNetherlands
SwedenPoland
England/N. Ireland (UK)Korea
Slovak RepublicFrance
CanadaChile
TurkeyIsrael
ItalyIreland
LithuaniaSpain
GreeceRussian Federation
Tertiary
Upper secondary or
post-secondary non-
tertiary
Below upper secondary
more specialised
20

AND WHAT ABOUT THE
QUALITY OF HIGHER
EDUCATION?4
21

200 220 240 260 280 300 320 340
Spain
England (UK)
England/N. Ireland (UK)
Ireland
Italy
Korea
Canada
Poland
United States
Northern Ireland (UK)
Australia
Estonia
Average
France
Denmark
Norway
Slovak Republic
Germany
Japan
Sweden
Austria
Netherlands
Flanders (Belgium)
Czech Republic
Finland
Numeracy scores of tertiary educated adults of 25-34y old 22

Proportion of 25-64 year-olds scoring at PIAAC numeracy level
4 and 5, by educational attainment of the population (2012)
0
5
10
15
20
25
30
35
40
Ja
pa
n
Fin
land
Neth
erla
nds
Sw
ede
n
Austr
alia
No
rwa
y
Fla
nde
rs…
Eng
land
(U
K)
Eng
land
/N.…
Un
ited
Sta
tes
Cze
ch R
ep
ub
lic
OE
CD
ave
rag
e
Pola
nd
Ca
na
da
No
rth
ern
…
Austr
ia
Germ
any
Ire
land
Fra
nce
De
nm
ark
Esto
nia
Slo
vak R
epu
blic
Kore
a
Ru
ssia
n…
Spa
in
Italy
Below upper secondary education Upper secondary or post-secondary non-tertiary education Tertiary education
23

Internationally, between ’90s and 2010s foundation
skills have slightly decreased, despite massification
0 0,05 0,1 0,15 0,2 0,25 0,3 0,35 0,4 0,45 0,5
Level 1and Below
Level 2
Level 3
Level 4-5
PIAAC
IALS
24

In Sweden literacy proficiency has decreased
significantly, also among higher educated
25