Embed Size (px)
Citation preview
Full Terms & Conditions of access and use can be found athttp://www.tandfonline.com/action/journalInformation?journalCode=rpag20
Download by: [Kartik Ariyur] Date: 09 May 2016, At: 16:22
Papers in Applied Geography
ISSN: 2375-4931 (Print) 2375-494X (Online) Journal homepage: http://www.tandfonline.com/loi/rpag20
An Interdisciplinary Approach for a WaterSustainability Study
Ningning Kong, Qinghua Li, Nikhil Sangwan, Robert Kulzick, Sorin Matei &Kartik Ariyur
To cite this article: Ningning Kong, Qinghua Li, Nikhil Sangwan, Robert Kulzick, Sorin Matei &Kartik Ariyur (2016): An Interdisciplinary Approach for a Water Sustainability Study, Papers inApplied Geography, DOI: 10.1080/23754931.2015.1116106
To link to this article: http://dx.doi.org/10.1080/23754931.2015.1116106
Published online: 09 May 2016.
Submit your article to this journal
View related articles
View Crossmark data
RESEARCH ARTICLE
An Interdisciplinary Approach for a Water Sustainability Study
Ningning Konga, Qinghua Lib, Nikhil Sangwanb, Robert Kulzickc, Sorin Mateid, andKartik Ariyure
aPurdue University Libraries, Purdue University, West Lafayette, Indiana; bSchool of Civil Engineering, Purdue University,Delon and Elizabeth Hampton Hall of Civil Engineering, West Lafayette, Indiana; cDepartment of Political Science,Purdue University, West Lafayette, Indiana; dSchool of Communication at Purdue University, West Lafayette, Indiana;eSchool of Mechanical Engineering, Purdue University, West Lafayette, Indiana
ABSTRACTInterdisciplinary research is often challenging as a result of the differentbackgrounds of researchers from different disciplines. Such difficultyfrequently hinders the understanding, communication, and collaborationamong researchers from different disciplines. Meanwhile, research methodsin geography can effectively link and synthesize different discipline-specificinformation. In this study, we show the application of geographic informationsystems (GIS) for the spatial analysis in a water sustainability project. We alsoshow that GIS, as a spatial decision support system, could be effectively usedfor managing both hydrologic and social factors. With GIS, the project wasable to integrate multidisciplinary data sets and visualize spatial informationvia a Web platform for sharing and communication. Our study demonstratedthat geographic research methods could be effective when facilitatingcollaborations among the humanities, social science, and engineering toquantify social objectives and constraints, and providing insight in solvinggrand challenge problems.
KEYWORDSInter-discipline; watersustainability; geospatial dataintegration; collaboration
Water resource management is a difficult challenge to the sustainability of aquatic ecosystems due toincreasing demands, climate change, and their degradation (Raskin, Hansen, and Margolis 1996; God-fray et al. 2010; Duan, Fedler, and Hochmuth 2012). Effective management of water resources not onlyrequires extensive knowledge in hydrological modeling, water conservation, and treatment, but alsoneeds to take into account socioeconomic factors, public policy, and social behavioral feedback in deci-sion-making processes (Sedlak and Schnoor 2013; White 2013; Singh, Khedun, and Mishra 2014).Researchers have suggested an interdisciplinary approach to addressing challenges to water-relatedissues that theoretically integrate human factors into the hydrological models with social feedbacks(Wiek and Larson 2012; Sivapalan et al. 2014). Given the complexity of such issues, an interdisciplinaryapproach was often needed to effectively confront these challenges. Interdisciplinary research oftenrequires researchers with very different backgrounds to understand and communicate with each other,however. Such collaborations frequently press researchers beyond their own expertise, which greatlychallenges the success of such collaborations.
We argue that research methods in geography can be a useful tool to facilitate interdisciplinarywater resource research by synthesizing and visualizing various discipline-specific information, identi-fying geospatial relationships among information coming from different sources in different formats,and facilitating decision-making processes through map analyses. In this study, we explored the
CONTACT Ningning Kong [email protected] Purdue University Libraries, Purdue University, 504 W. State Street, WestLafayette, IN 47907-2058.
Color versions of one or more of the figures in this article can be found online at www.tandfonline.com/rpag.© 2016 Applied Geography Conferences
PAPERS IN APPLIED GEOGRAPHY2016, VOL. 0, NO. 0, 1–12http://dx.doi.org/10.1080/23754931.2015.1116106
Dow
nloa
ded
by [
Kar
tik A
riyu
r] a
t 16:
22 0
9 M
ay 2
016
application of geographic research methods in interdisciplinary research by using a recently fundedMellon Grand Challenge Exploratory project, “Equitable Water Policy Decision Making,” as an exam-ple. Although the project is still in the stage of building its final model, we showcase here three majorcontributions made possible by this project: (1) synthesizing multidiscipline information by an inte-grated geodatabase that took into account both physical and social factors related to water resources,and could be easily utilized by all the researchers in the project; (2) visualizing spatial information byusing a Web-based platform to display and communicate information between research teams, whichhelped to remove the barrier of domain expertise; and (3) analyzing spatial and temporal patternsacross disciplines. The first two contributions allowed researchers from different disciplines to under-stand, visualize, and use information from each other; and the third one allowed the team to discoverspatial and temporal relationships beyond disciplinary boundaries.
Previous studies
Geography research methods have been proven an effective tool in multidisciplinary data integration,but they now face various new challenges (Li 2007; Kawabataa et al. 2010; Kong 2015). Geographicinformation system (GIS)-based modeling, analysis, and data integration have been applied in manydifferent research fields, such as health, environment, and transportation (Corwin and Wagenet 1995;Goodchild 2000; Murray et al. 2009). In addition, by integrating data from various disciplines, GIS pro-motes the crosswalk between disciplines (Alibrandi 1998; Koedam et al. 2004; Wang 2013). Geographyresearch methods have also been integrated in multicriterion decision-making processes for more thantwo decades (Carver 1991; Church, Loban, and Lombard 1992; Pereiraa and Duckstein 1993; Malczew-ski 1996).
Studies have found that GIS techniques and procedures have an important role to play in analyzingdecision problems by integrating spatially referenced data in a problem-solving environment, includingthe application of GIS in hydrology and water resource (Cowen 1988; Malczewski 1996; Chakhar andMartel 2003). In recent years as we stepped into the era of big data, multidisciplinary information isavailable in a variety of formats from many different data sources. This information includes spatiallyreferenced data, as well as nonspatial data. How to integrate these data sets into a well-organized spatialdatabase to truly promote interdisciplinary research is a challenge that GIScience faces (Yi, Li, andCheng 1999; Kong 2015).
Moreover, the recent development of Web GIS provides even more possibilities to promote interdis-ciplinary research (Kim and Kim 2002; Batty et al. 2010; Golhani, Rao, and Dagar 2015). Web GIS ena-bles the non-GIS users to visualize spatial information on their Web browser or even mobile devices,which erases the technology barrier of using GIS and integrates spatial thinking across teams in a mul-tidisciplinary project development (Kong, Zhang, and Stonebraker 2015). By placing the spatial infor-mation and some simple mapping capability on the Web, researchers can easily visualize and overlayinformation from other disciplines.
Different from previous water resource spatial decision-making tools, the project discussed in thisstudy was designed to develop a system dynamic model that emphasized the progress and interactionsbetween hydrological modeling and public policy research, allowing the simulation of water resourcedynamics in different natural and policy scenarios. In this study, we used a new approach that inte-grated the relational geodatabase and the Web GIS platform to facilitate the research and communica-tion among researchers, decision makers, and the general public. We demonstrated that our approachcould be an effective way to link multidisciplinary data sets, visualize spatial information across teams,conduct geospatial analyses between disciplines, and inform decision makers as well as the generalpublic about our research outcomes.
The equitable water policy decision making project
The overarching goal of the Equitable Water Policy Decision Making project was to explore decision-making tools for water sustainability that utilized both hydrological and social data sets, and accounted
2 N. KONG ET AL.
Dow
nloa
ded
by [
Kar
tik A
riyu
r] a
t 16:
22 0
9 M
ay 2
016
for the feedback loops between the policymaking process and human behavior. Aided by the available“big data” in land cover, hydrology, soil, population, newspapers, and social media, the objective of theproject was to construct a water sustainability model designed to take into account the human politicsand the feedback effects of policy on social information and water resource use.
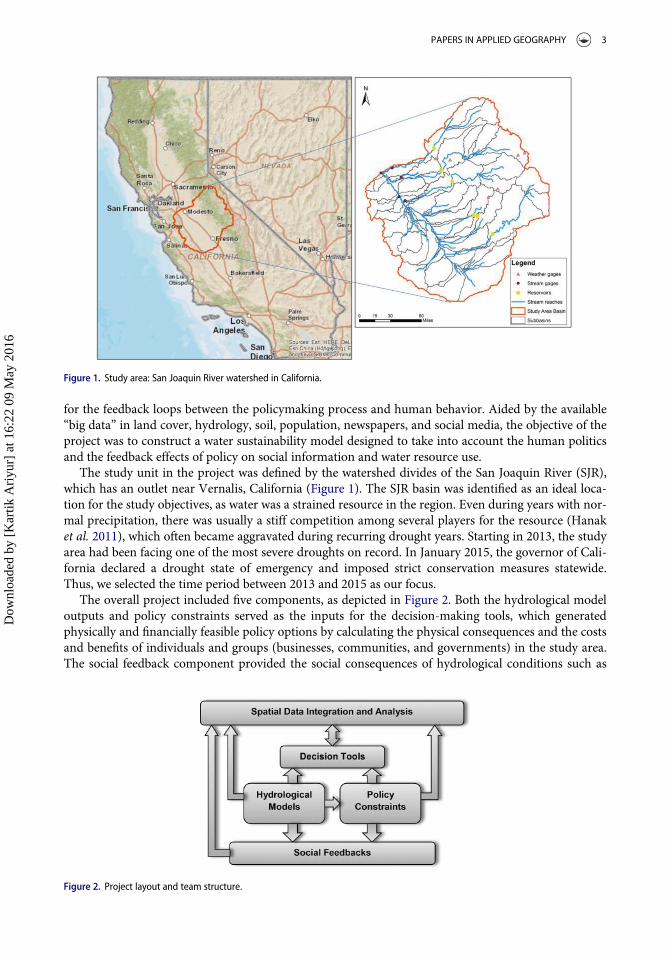
The study unit in the project was defined by the watershed divides of the San Joaquin River (SJR),which has an outlet near Vernalis, California (Figure 1). The SJR basin was identified as an ideal loca-tion for the study objectives, as water was a strained resource in the region. Even during years with nor-mal precipitation, there was usually a stiff competition among several players for the resource (Hanaket al. 2011), which often became aggravated during recurring drought years. Starting in 2013, the studyarea had been facing one of the most severe droughts on record. In January 2015, the governor of Cali-fornia declared a drought state of emergency and imposed strict conservation measures statewide.Thus, we selected the time period between 2013 and 2015 as our focus.
The overall project included five components, as depicted in Figure 2. Both the hydrological modeloutputs and policy constraints served as the inputs for the decision-making tools, which generatedphysically and financially feasible policy options by calculating the physical consequences and the costsand benefits of individuals and groups (businesses, communities, and governments) in the study area.The social feedback component provided the social consequences of hydrological conditions such as
Figure 1. Study area: San Joaquin River watershed in California.
Figure 2. Project layout and team structure.
PAPERS IN APPLIED GEOGRAPHY 3
Dow
nloa
ded
by [
Kar
tik A
riyu
r] a
t 16:
22 0
9 M
ay 2
016
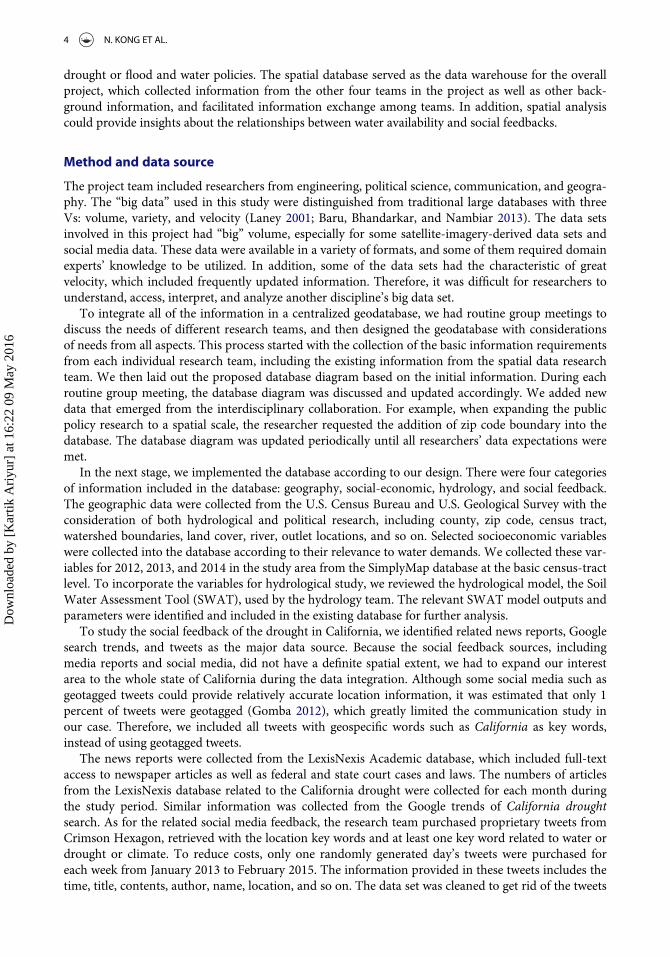
drought or flood and water policies. The spatial database served as the data warehouse for the overallproject, which collected information from the other four teams in the project as well as other back-ground information, and facilitated information exchange among teams. In addition, spatial analysiscould provide insights about the relationships between water availability and social feedbacks.
Method and data source
The project team included researchers from engineering, political science, communication, and geogra-phy. The “big data” used in this study were distinguished from traditional large databases with threeVs: volume, variety, and velocity (Laney 2001; Baru, Bhandarkar, and Nambiar 2013). The data setsinvolved in this project had “big” volume, especially for some satellite-imagery-derived data sets andsocial media data. These data were available in a variety of formats, and some of them required domainexperts’ knowledge to be utilized. In addition, some of the data sets had the characteristic of greatvelocity, which included frequently updated information. Therefore, it was difficult for researchers tounderstand, access, interpret, and analyze another discipline’s big data set.
To integrate all of the information in a centralized geodatabase, we had routine group meetings todiscuss the needs of different research teams, and then designed the geodatabase with considerationsof needs from all aspects. This process started with the collection of the basic information requirementsfrom each individual research team, including the existing information from the spatial data researchteam. We then laid out the proposed database diagram based on the initial information. During eachroutine group meeting, the database diagram was discussed and updated accordingly. We added newdata that emerged from the interdisciplinary collaboration. For example, when expanding the publicpolicy research to a spatial scale, the researcher requested the addition of zip code boundary into thedatabase. The database diagram was updated periodically until all researchers’ data expectations weremet.
In the next stage, we implemented the database according to our design. There were four categoriesof information included in the database: geography, social-economic, hydrology, and social feedback.The geographic data were collected from the U.S. Census Bureau and U.S. Geological Survey with theconsideration of both hydrological and political research, including county, zip code, census tract,watershed boundaries, land cover, river, outlet locations, and so on. Selected socioeconomic variableswere collected into the database according to their relevance to water demands. We collected these var-iables for 2012, 2013, and 2014 in the study area from the SimplyMap database at the basic census-tractlevel. To incorporate the variables for hydrological study, we reviewed the hydrological model, the SoilWater Assessment Tool (SWAT), used by the hydrology team. The relevant SWAT model outputs andparameters were identified and included in the existing database for further analysis.
To study the social feedback of the drought in California, we identified related news reports, Googlesearch trends, and tweets as the major data source. Because the social feedback sources, includingmedia reports and social media, did not have a definite spatial extent, we had to expand our interestarea to the whole state of California during the data integration. Although some social media such asgeotagged tweets could provide relatively accurate location information, it was estimated that only 1percent of tweets were geotagged (Gomba 2012), which greatly limited the communication study inour case. Therefore, we included all tweets with geospecific words such as California as key words,instead of using geotagged tweets.
The news reports were collected from the LexisNexis Academic database, which included full-textaccess to newspaper articles as well as federal and state court cases and laws. The numbers of articlesfrom the LexisNexis database related to the California drought were collected for each month duringthe study period. Similar information was collected from the Google trends of California droughtsearch. As for the related social media feedback, the research team purchased proprietary tweets fromCrimson Hexagon, retrieved with the location key words and at least one key word related to water ordrought or climate. To reduce costs, only one randomly generated day’s tweets were purchased foreach week from January 2013 to February 2015. The information provided in these tweets includes thetime, title, contents, author, name, location, and so on. The data set was cleaned to get rid of the tweets
4 N. KONG ET AL.
Dow
nloa
ded
by [
Kar
tik A
riyu
r] a
t 16:
22 0
9 M
ay 2
016

with other water-related topics, such as the key words of heater, plumber, plumbing, and so on. Afterthis initial cleaning process, we were left with 99,367 relevant tweets.
To promote spatial thinking across the project development, we provided a Web-based map appli-cation that connected the geodatabase to the Web. Researchers from multiple disciplines could easilyselect the variables they were interested to make a map, or overlay multiple information. At the finalstage of the project, this Web application could serve as a communication point for the decision makersonce the decision simulation tools were fully developed and integrated into the Web page.
Capacities enabled by geography methods
Database integration
An ArcSDE geodatabase was designed and developed to serve as the central data warehouse with infor-mation from different data sources. The enterprise database not only provided the project team with anonline platform to share information, but also built the relationships between different tables acrossdisciplines so that team members could easily integrate information from other research areas. Data-base connection information was provided to all the team members to fit their analysis environment.For researchers who used ArcGIS software (ArcGIS Desktop, Release 10.2.2, 2015, Environmental Sys-tems Research Institute, Redlands, CA), the ArcGIS connection information was provided. Forresearchers who use statistical software or modeling tools, we provided the database connectionmethod and instruction so that their software such as R and MATLAB could read the data tables. Data-base components are described in the following paragraphs.
Spatial and social dataA simplified version of the database diagram for spatial and social data is shown in Figure 3. Accordingto different needs in the socioeconomic aspects of the research, we included spatial boundary files atdifferent scales, from country boundary, to states in the United States, counties, zip codes, and censustracts. For socioeconomic factors, the database included data from basic census-tract level during thestudy period, with linkages to the census tract ID in the spatial file. Thus, these data could be spatiallyaggregated if needed. The Twitter data were related to countries and states. Furthermore, if the tweetsincluded city information, we added the x, y coordinates of the city point to the Twitter data table.
Hydrological dataThe database diagram of hydrologic data is shown in Figure 4. Serving for the SWAT model used inthis research, we included all the parameters and variables relevant to the project. The SWAT modelwas developed in a GIS environment. Most of the inputs were spatial data, including 10-m resolutionraster data, as well as vector data for watershed, river, outlet, weather station, and reservoir locations.The weather and reservoir measurement data were saved as tabular data with time and observationinformation linked to their location files.
Model for data resampleIn addition to the originally collected data tables, we also developed a geoprocessing model to resamplethe data by geospatial unit. The resampling was particularly needed for socioeconomic data, whichwere originally collected at the census tract level, but the research team was working with different geo-graphical units, such as watershed, county, or zip code. Appropriate assumptions were made during theresampling process. For example, domestic water use for each subbasin was resampled in proportion toits population share, whereas the irrigation needs were assumed to be proportional to the agriculturalarea in that subbasin.
Data documentationTo remove the interdisciplinary barriers and improve the quality of communication, we documented thegeodatabase in two means. First, the detailed database diagram was updated and shared in a timely
PAPERS IN APPLIED GEOGRAPHY 5
Dow
nloa
ded
by [
Kar
tik A
riyu
r] a
t 16:
22 0
9 M
ay 2
016
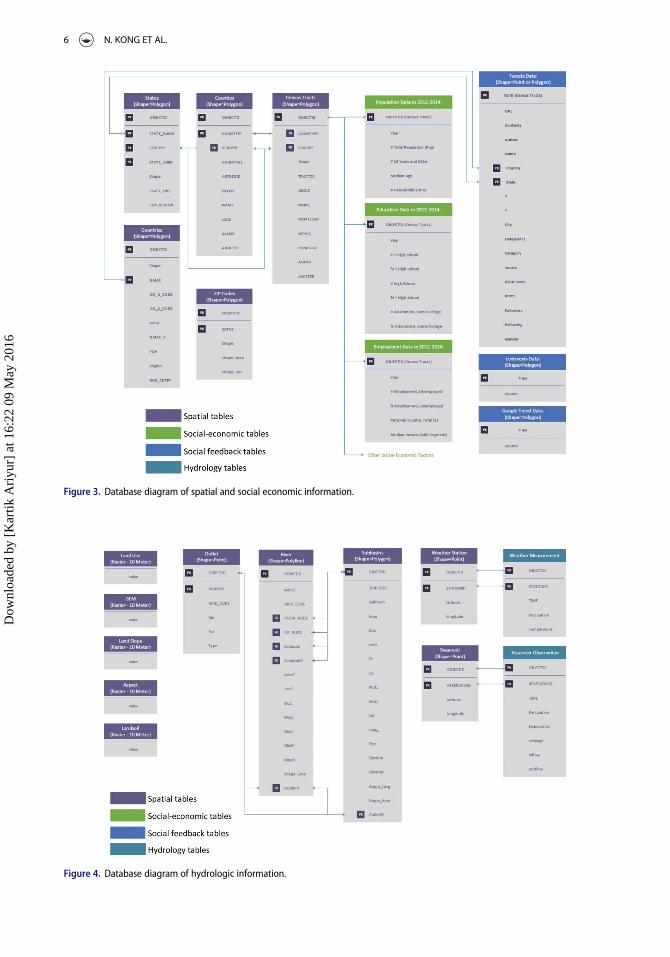
Figure 3. Database diagram of spatial and social economic information.
Figure 4. Database diagram of hydrologic information.
6 N. KONG ET AL.
Dow
nloa
ded
by [
Kar
tik A
riyu
r] a
t 16:
22 0
9 M
ay 2
016
manner between teams. The diagram helped team members to have an overall understanding of theavailable information and project progress, and encouraged them to use information across their disci-pline boundaries. Second, data documentation allowed the teams to better understand and use the data.Data documentation in this project included a data source listing and a data dictionary. The data sourcelisting documented where and when the data had been collected. A data dictionary is a collection of thedata objects’ descriptions, including themeaning of each column in the table, measuring units, and so on.
Web-based spatial data visualization
GIS provided the opportunity to visualize spatial information and associated tabular data, whichencouraged spatial thinking and facilitated discussion across disciplines. The mapping capability wasusually limited by software availability and GIS training, though. In a multidisciplinary project, it mightnot be possible for every researcher to learn GIS and visualize spatial data on his or her own. To facili-tate collaboration from the spatial perspective, we took advantage of Web GIS and visualized the infor-mation from our geodatabase using a Web browser.
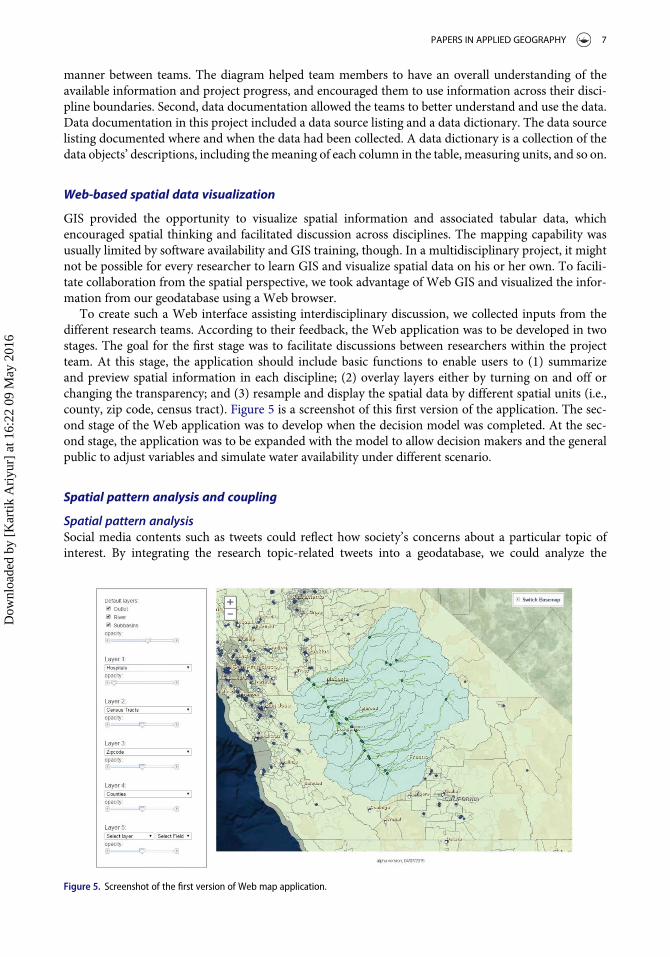
To create such a Web interface assisting interdisciplinary discussion, we collected inputs from thedifferent research teams. According to their feedback, the Web application was to be developed in twostages. The goal for the first stage was to facilitate discussions between researchers within the projectteam. At this stage, the application should include basic functions to enable users to (1) summarizeand preview spatial information in each discipline; (2) overlay layers either by turning on and off orchanging the transparency; and (3) resample and display the spatial data by different spatial units (i.e.,county, zip code, census tract). Figure 5 is a screenshot of this first version of the application. The sec-ond stage of the Web application was to develop when the decision model was completed. At the sec-ond stage, the application was to be expanded with the model to allow decision makers and the generalpublic to adjust variables and simulate water availability under different scenario.
Spatial pattern analysis and coupling
Spatial pattern analysisSocial media contents such as tweets could reflect how society’s concerns about a particular topic ofinterest. By integrating the research topic-related tweets into a geodatabase, we could analyze the
Figure 5. Screenshot of the first version of Web map application.
PAPERS IN APPLIED GEOGRAPHY 7
Dow
nloa
ded
by [
Kar
tik A
riyu
r] a
t 16:
22 0
9 M
ay 2
016
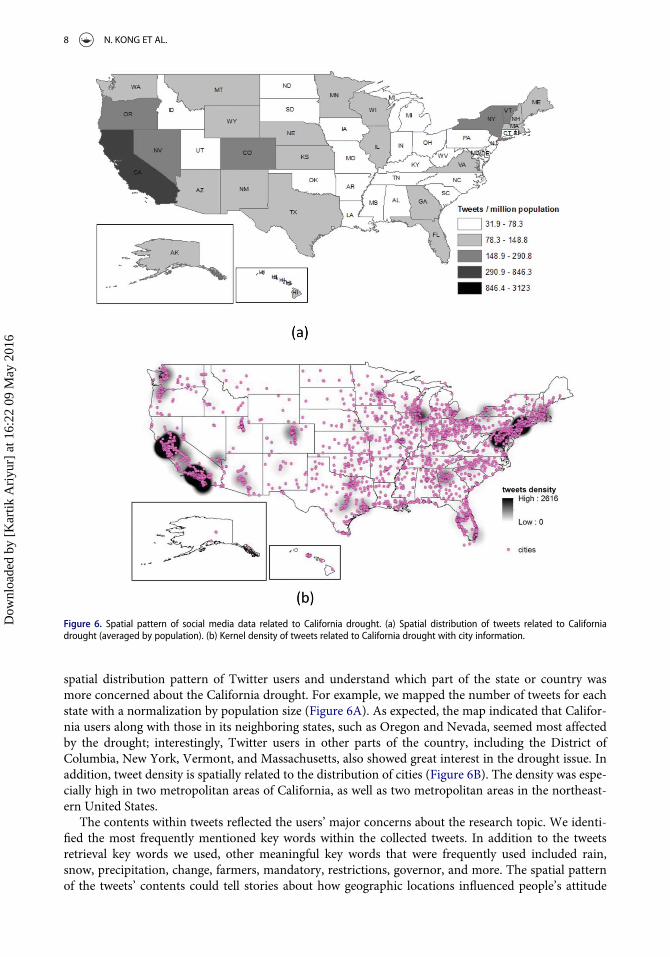
spatial distribution pattern of Twitter users and understand which part of the state or country wasmore concerned about the California drought. For example, we mapped the number of tweets for eachstate with a normalization by population size (Figure 6A). As expected, the map indicated that Califor-nia users along with those in its neighboring states, such as Oregon and Nevada, seemed most affectedby the drought; interestingly, Twitter users in other parts of the country, including the District ofColumbia, New York, Vermont, and Massachusetts, also showed great interest in the drought issue. Inaddition, tweet density is spatially related to the distribution of cities (Figure 6B). The density was espe-cially high in two metropolitan areas of California, as well as two metropolitan areas in the northeast-ern United States.
The contents within tweets reflected the users’ major concerns about the research topic. We identi-fied the most frequently mentioned key words within the collected tweets. In addition to the tweetsretrieval key words we used, other meaningful key words that were frequently used included rain,snow, precipitation, change, farmers, mandatory, restrictions, governor, and more. The spatial patternof the tweets’ contents could tell stories about how geographic locations influenced people’s attitude
Figure 6. Spatial pattern of social media data related to California drought. (a) Spatial distribution of tweets related to Californiadrought (averaged by population). (b) Kernel density of tweets related to California drought with city information.
8 N. KONG ET AL.
Dow
nloa
ded
by [
Kar
tik A
riyu
r] a
t 16:
22 0
9 M
ay 2
016
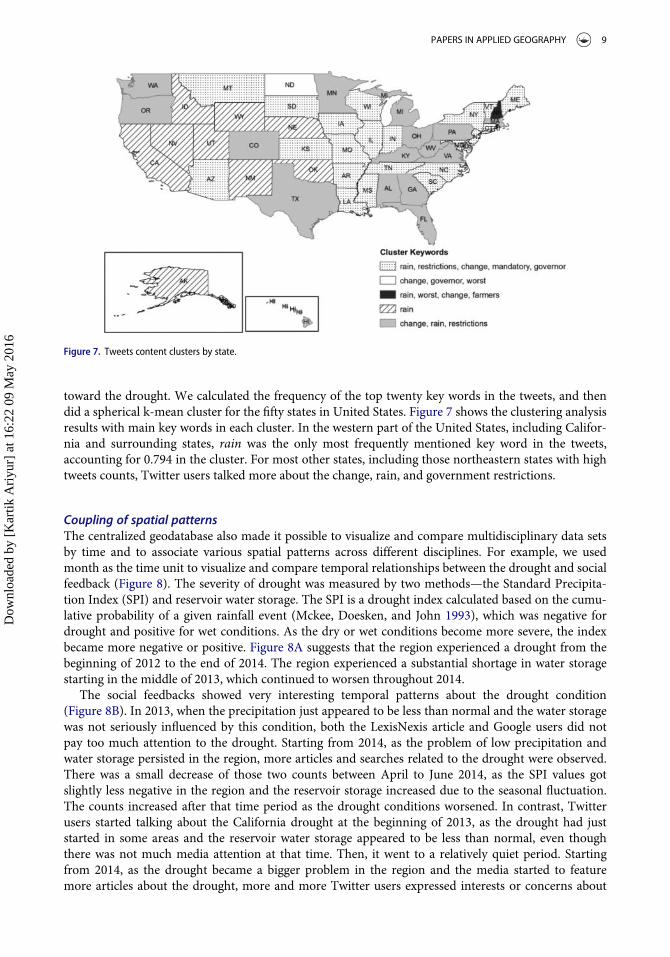
toward the drought. We calculated the frequency of the top twenty key words in the tweets, and thendid a spherical k-mean cluster for the fifty states in United States. Figure 7 shows the clustering analysisresults with main key words in each cluster. In the western part of the United States, including Califor-nia and surrounding states, rain was the only most frequently mentioned key word in the tweets,accounting for 0.794 in the cluster. For most other states, including those northeastern states with hightweets counts, Twitter users talked more about the change, rain, and government restrictions.
Coupling of spatial patternsThe centralized geodatabase also made it possible to visualize and compare multidisciplinary data setsby time and to associate various spatial patterns across different disciplines. For example, we usedmonth as the time unit to visualize and compare temporal relationships between the drought and socialfeedback (Figure 8). The severity of drought was measured by two methods—the Standard Precipita-tion Index (SPI) and reservoir water storage. The SPI is a drought index calculated based on the cumu-lative probability of a given rainfall event (Mckee, Doesken, and John 1993), which was negative fordrought and positive for wet conditions. As the dry or wet conditions become more severe, the indexbecame more negative or positive. Figure 8A suggests that the region experienced a drought from thebeginning of 2012 to the end of 2014. The region experienced a substantial shortage in water storagestarting in the middle of 2013, which continued to worsen throughout 2014.
The social feedbacks showed very interesting temporal patterns about the drought condition(Figure 8B). In 2013, when the precipitation just appeared to be less than normal and the water storagewas not seriously influenced by this condition, both the LexisNexis article and Google users did notpay too much attention to the drought. Starting from 2014, as the problem of low precipitation andwater storage persisted in the region, more articles and searches related to the drought were observed.There was a small decrease of those two counts between April to June 2014, as the SPI values gotslightly less negative in the region and the reservoir storage increased due to the seasonal fluctuation.The counts increased after that time period as the drought conditions worsened. In contrast, Twitterusers started talking about the California drought at the beginning of 2013, as the drought had juststarted in some areas and the reservoir water storage appeared to be less than normal, even thoughthere was not much media attention at that time. Then, it went to a relatively quiet period. Startingfrom 2014, as the drought became a bigger problem in the region and the media started to featuremore articles about the drought, more and more Twitter users expressed interests or concerns about
Figure 7. Tweets content clusters by state.
PAPERS IN APPLIED GEOGRAPHY 9
Dow
nloa
ded
by [
Kar
tik A
riyu
r] a
t 16:
22 0
9 M
ay 2
016
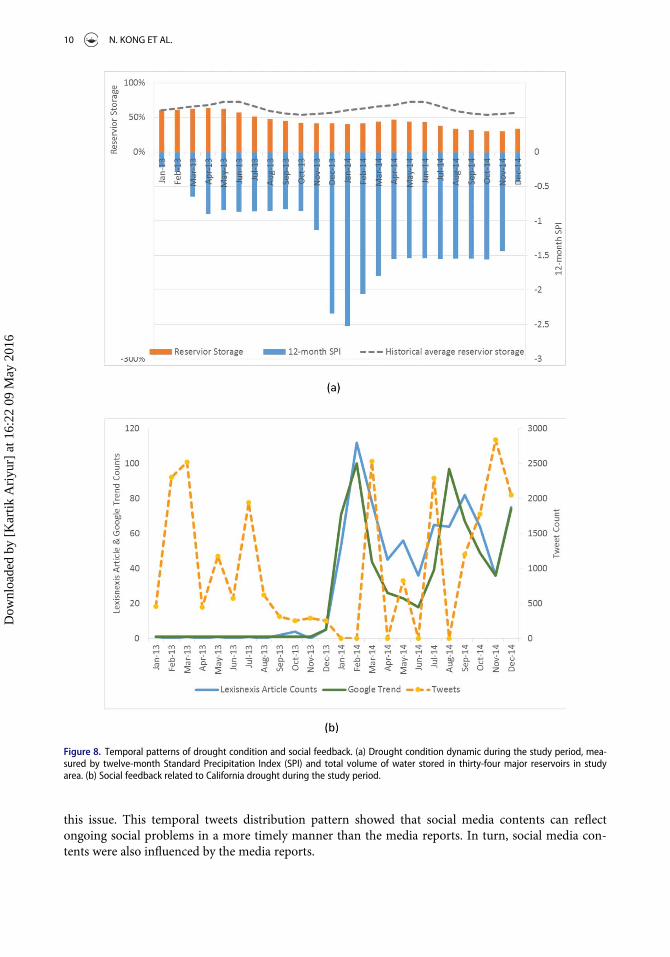
this issue. This temporal tweets distribution pattern showed that social media contents can reflectongoing social problems in a more timely manner than the media reports. In turn, social media con-tents were also influenced by the media reports.
Figure 8. Temporal patterns of drought condition and social feedback. (a) Drought condition dynamic during the study period, mea-sured by twelve-month Standard Precipitation Index (SPI) and total volume of water stored in thirty-four major reservoirs in studyarea. (b) Social feedback related to California drought during the study period.
10 N. KONG ET AL.
Dow
nloa
ded
by [
Kar
tik A
riyu
r] a
t 16:
22 0
9 M
ay 2
016
Discussion and conclusion
Our study demonstrated that geographic data integration, visualization, and analysis were effectiveways to facilitate interdisciplinary research. By integrating multiple discipline information into a geo-database with spatial visualizations, researchers in different disciplines can better understand eachother’s domains. Throughout the first year of the project’s weekly meetings, the geodatabase structureand Web map were the two major topics used frequently in project discussion. In addition, data inte-gration has enabled spatial and temporal analysis across disciplines. In our initial analysis, social mediaand newspaper articles have shown different patterns around a drought event. Social media usersresponded much sooner than the media reports in our study case. Spatially, related social media con-tents were not just limited to the region that is experiencing the drought. People in different geographiclocations also care about the event albeit from different perspectives.
Our next goal is to make use of the current research results to develop a model for making waterpolicy decisions. A system of differential equations will be built and solved to estimate future wateravailability. The model will be integrated into the Web GIS interface, which allows the decision makersto simulate different physical and social scenarios in predicting water availability and social feedbacks.
From this study, we also learned some limitations and challenges. The biggest limitation of geospa-tial data integration in this study is that the system only works well with quantitative data. There aremany qualitative social variables, or variables that do not tie up with geographic locations existing inthe model building process. At this stage of the project, this information can only be kept with eachindividual research team. Furthermore, a geodatabase connection requires technical skills and learningcurves. It might be a minor issue for teams with GIS or technology background, but might be a largerissue for those researchers who are not familiar with relational databases. The challenges that we willbe facing soon is the data management issue. The current database only includes information from ourdata collection period. As the project develops, there will be many intermediate file generated, whichmight increase the database size rapidly. How to document, manage, and preserve related informationin the long term will be a topic to pursue in the future.
References
Alibrandi, M. 1998. GIS as a tool in interdisciplinary environmental studies: Student, teacher, and community perspec-tives.Meridian, 1(2): 1–10.
Baru, C., M. Bhandarkar, and R. Nambiar. 2013. Setting the direction for big data benchmark standards. In Selected topicsin performance evaluation and benchmarking, ed. R. Nambiar and M. Poess, 197–208. Berlin: Springer.
Batty, M., A. Hudson-Smith, R. Milton, and A. Crooks. 2010. Map Mashups, Web 2.0 and the GIS Revolution. Annals ofGIS, 16(1): 1–13.
Carver, S. J. 1991. Integrating multi-criteria evaluation with geographical information systems. International Journal ofGeographical Information Systems, 5: 321–39.
Chakhar, S., and J.-M. Martel. 2003. Enhancing geographical information systems capabilities with multi-criteria evalua-tion functions. Journal of Geographic Information and Decision Analysis, 7: 47–71.
Church, R. L., S. R. Loban, and K. Lombard. 1992. An interface for exploring spatial alternatives for a corridor locationproblem. Computers and Geosciences, 8: 1095–1105.
Corwin, D. L., and R. J. Wagenet. 1995. Applications of GIS to the modeling of nonpoint source pollutants in the VadoseZone: A conference overview. Journal of Environmental Quality, 25(3): 403–11.
Cowen, D. 1988. IS versus CAD versus DBMS: What are the differences. Photogrammetric Engineering and Remote Sens-ing, 54: 1551–55.
Duan, R., C. B. Fedler, and G. J. Hochmuth. 2012. Tuning to water sustainability: Future opportunity for China. Environ-mental Science & Technology, 46: 5662–63.
Godfray, H. C. J., J. R. Beddington, I. R. Crute, L. Haddad, D. Lawrence, J. F. Muir, J. Pretty, S. Robinson, S. M. Thomas,and C. Toulmin. 2010. Food security: The challenge of feeding 9 billion people. Science, 327(5967): 812–18.
Golhani, K., A. S. Rao, and J. C. Dagar. 2015. Utilization of open-source Web GIS to strengthen climate change informat-ics for agriculture. In Climate change modelling, planning and policy for agriculture, ed. A. K. Singh, J. C. Dagar, A.Arunachalam, R. Gopichandran, and K. N. Shelat, 87–91. New Delhi: Springer.
Gomba, R. 2012. What percentage of tweets are geotagged? http://www.quora.com/What-percentage-of-tweets-are-geotagged-What-percentage-of-geotagged-tweets-are-ascribed-to-a-venue. Accessed September 8, 2015.
Goodchild, M. F. 2000. GIS and transportation: Status and challenges. GeoInformatica, 4(2): 127–39.
PAPERS IN APPLIED GEOGRAPHY 11
Dow
nloa
ded
by [
Kar
tik A
riyu
r] a
t 16:
22 0
9 M
ay 2
016
Hanak, E., J. Lund, A. Dinar, B. Gray, R. Howitt, J, Mount, P. Moyle, and B. Thompson. 2011. Managing California’swater: From conflict to reconciliation. San Francisco: Public Policy Institue of California.
Kawabataa, M., R. B. Thapab, T. Oguchia, and M.-H. Tsou. 2010. Multidisciplinary cooperation in GIS education: A casestudy of US colleges and universities. Journal of Geography in Higher Education, 34(4): 493–509.
Kim, D.-H., and M.-S. Kim. 2002. Web GIS service component based on open environment. IEEE International Geosci-ence and Remote Sensing Symposium, 6:3346–48.
Koedam, N., F. Dahdouh-Guebas, R. De Wulf, J. Tack, and P.T. Obade. 2004. GIS-based integration of interdisciplinaryecological data to detect land-cover changes in creek mangroves at Gazi Bay, Kenya. Western Indian Ocean Journal ofMarine Science, 3(1): 11–27.
Kong, N. 2015. Exploring best management practices for geospatial data in academic libraries. Journal of Map & Geogra-phy Libraries, 11(September): 207–25.
Kong, N., T. Zhang, and I. Stonebraker. 2015. Evaluation of Web GIS functionality in academic libraries. Applied Geogra-phy, 60: 288–93.
Laney, D. 2001. 3D data management: Controlling data volume, velocity, and variety. In META Delta research report, p.949. Available at http://blogs.gartner.com/doug-laney/files/2012/01/ad949-3D-Data-Management-Controlling-Data-Volume-Velocity-and-Variety.pdf.
Li, D. 2007. On geomatics in multi-discipline integration. Acta Geodaetica et Cartographica Sinica, 4: 20.Malczewski, J. 1996. A GIS-based approach to multiple criteria group decision-making. International Journal of Geo-
graphical Information Systems, 10(8): 955–971.Mckee, T. B., N. J. Doesken, and K. John. 1993. The relationship of drought frequency and duration to time scales. Pro-
ceedings of the 8th Conference on Applied Climatology, 17:179–83.Murray, E. J., B. J. Marais, G. Mans, N. Beyers, H. Ayles, P. Godfrey-Faussett, S. Wallman, and V. Bond. 2009. A multidis-
ciplinary method to map potential tuberculosis transmission “hot spots” in high-burden communities. The Interna-tional Journal of Tuberculosis and Lung Disease, 13(6): 767–74.
Pereiraa, J. M. C., and L. Duckstein. 1993. A multiple criteria decision-making approach to GIS-based land suitabilityevaluation. International Journal of Geographical Information Systems, 7(5): 407–24.
Raskin, P. D., E. Hansen, and R. M. Margolis. 1996. Water and sustainability: Global patterns and long-range problems.Natural Resources Forum, 20(1): 1–15.
Sedlak, D. L., and J. L. Schnoor. 2013. The challenge of water sustainability. Environmental Science & Technology, 47:5517.
Singh, B. P., C. P. Khedun, and A. K. Mishra. 2014. Water, environment, energy, and population growth: Implications forwater sustainability under climate change. Journal of Hydrologic Engineering, 19: 667–73.
Sivapalan, M., M. Konar, V. Srinivasan, A. Chhatre, A. Wutich, C. A. Scott, J. L. Wescoat, and I. Rodr�ıguez-Iturbe. 2014.Socio-hydrology: Use-inspired water sustainability science for the Anthropocene. Earth’s Future, 2(4): 225–30.
Wang, T. 2013. Interdisciplinary urban GIS for smart cities: Advancements and opportunities. Geo-Spatial InformationScience, 16(1): 25–34.
White, D. D. 2013. Framing water sustainability in an environmental decision support system. Society & Natural Resour-ces, 26(11): 1365–73.
Wiek, A., and K. L. Larson. 2012. Water, people, and sustainability—A systems framework for analyzing and assessingwater governance regimes.Water Resources Management, 26(11): 3153–71.
Yi, S., Q. Li, and J. Cheng. 1999. An interoperability GIS model based on the spatial information infrastructure. In Pro-ceedings of Geoinformatics’99 Conference, Ann Arbor, 19–21 June, 1999, pp. 1–5.
12 N. KONG ET AL.
Dow
nloa
ded
by [
Kar
tik A
riyu
r] a
t 16:
22 0
9 M
ay 2
016