Embed Size (px)
Citation preview

An intelligent algorithm for optimization of resource allocation problem by considering human error in an emergency
department
R. Yazdanparast1*, M. Hamid1, A. Azadeh1, A. Keramati1
1School of Industrial Engineering, College of Engineering, University of Tehran, Iran [email protected], [email protected], [email protected], [email protected]
Abstract Human error is a significant and ever-growing problem in the healthcare sector. In this study, resource allocation problem is considered along with human errors to optimize utilization of resources in an emergency department. The algorithm is composed of simulation, artificial neural network (ANN), design of experiment (DOE) and fuzzy data envelopment analysis (FDEA). It is a multi-response optimization approach to optimize human error, cost, wait time, and patient safety, and productivity. Skill, rule, and knowledge (SRK) based approach is used to model human error. Simulation is applied to determine the relationship between human resource utilization and human error and also to model SRK behavior. ANN is utilized to predict response variables. FDEA is used to identify the optimum scenario. This is the first study that considers human errors along with resource allocation in the emergency department (ED). Second, it is equipped with verification and validation at each phase. Third, it is a practical approach for emergency departments (EDs). Keywords: Human error, resource allocation, skill, rule, knowledge-based approach, multi-response optimization, discrete-event simulation
1- Introduction The healthcare sector has become a very complex system in the last decade due to the growth in patient referral(Plsek and Greenhalgh, 2001).The other main reasons for this complexity are the emergence of various departments and a variety of services to patients (Carayon, 2016).It is important to note that healthcare sector couldn’t deal with this complexity and it led to the human errors’ growth(Berwick, 2003).Some researchers have evaluated and compared different industries due to safety and error, and finally determined healthcare sector as an unsafe industry (Amalberti et al., 2005).Carthey et al. (2001)studiedthe human error rate and finally stated that about ten percent of patients who visit healthcare sector face human errors in their treatment process. Increasing the number of patient referral to healthcare sector puts more pressure on the system and its resources. Workload growth leads to exhaustion of resources (fatigue), reduction of human resources’ concentration, and finally more human errors (Montgomery, 2007).Error classification frameworks and approaches are widely used in the last decade and many sources of human errors are determined in the healthcare sector. Although various frameworks and approaches are presented to this day, Skill, Rule, and Knowledge
*Corresponding author ISSN: 1735-8272, Copyright c 2018 JISE. All rights reserved
Journal of Industrial and Systems Engineering Vol. 11, No. 1, pp. 287-309 Winter (January) 2018
287

(SRK) based behavior which is presented by (Rasmussen, 1982) is one of the most applicable concepts. SRK based behavior classifies human errors in an organization into three main groups as follows:
• Skill-based errors: This type of error occurs when the operator is not at an acceptable level of conscious. The skill-based error is classified into two groups of error including lapses and slips. Lapse occurs when the operator forgets some part of an activity while slip occurs when the operator performs a part of an activity in a wrong way. Both types of skill-based errors are done unintentionally. The sources of this type of error can be fatigue and lack of concentration.
• Rule-based error: This type of error occurs when the operator employs a wrong rule or instruction in performing a right activity or right rule or instruction in a wrong activity.
• Knowledge-based error: This type of error occurs when the operator faces an activity which is not meant to happen and the operator has not been trained for it. In this situation, he has to apply his knowledge for performing the activity. If any error happens in this situation, it should be classified as a knowledge-based error.
Later, many researchers have studied SRK based behavior and improved its application and algorithm. Reason (1997) presented a new algorithm based on SRK behavior for error classification. Since researchers faced some problems in employing the presented algorithm, Saurin et al. (2008) presented an improved algorithm for error classification based on SRK based behavior. Various sources of human errors are determined in healthcare sector. One of the most important and mentioned sources of human errors in the healthcare sector is workload which leads to concentration and ability reduction. When the workload increases in a system, the resources have to work harder and without any rest. In ED this problem is much more important and complicated. The patient arrival rate into EDs is stochastic and most of the time their health status is critical (or after a while, their health status may become critical) and they need a fast examination (Lynn and Kellermann, 1991). It is possible to evaluate and measure workload in an ED using utilization. Utilization is an index which takes values between 0 and 1. Utilization equal to 1 means that the resource has been busy all the time and didn’t have any time for rest and in other words show the high workload in a system. Utilization is significant in resource allocation and is considered as one of the objectives that should be maximized in most of the studies. It is important to consider human factors when optimizing a system that is composed of human resources. It is possible to consider utilization as a key to connect conventional resource allocation problem with optimizing human errors in a system.
1-1- Human error in healthcare Many researchers have studied human error identification and classification in the last decade. van der Sijs et al. (2010) used SRK based behavior and simulation environment to study the correctness of drug safety alert handling and errors. Moody (2012) employed lean principles and human factors in an ED. They used SRK based behavior for error classification. Vaughn-Cooke et al. (2015) studied error classification among diabetes patients and identified two main categories including skill-based errors and intentional violations. At the end, they presented risk mitigation strategies for safety improvement. Fernandez and Gillis-Ring (2003) reviewed the literature and presented strategies for preventing human errors in the healthcare sector. Azadeh et al. (2016) used improved SRK based behavior and discrete-event simulation for human error classification and optimization in an emergency department (ED).
1-2- Simulation in healthcare Many researchers have studied resource allocation in ED in the last decade. Amaral and Costa (2014) presented an approach based on multi-criteria decision analysis for resource allocation in an ED in Brazil. They used PROMETHE II method for analyzing the collected data. The results showed 70% reduction in waiting time of patients. Azadeh et al. (2013) used discrete-event simulation and data envelopment analysis to improve the quality of care in medical centers. Al-Refaie et al. (2014) presented a simulation-based approach to optimizing the performance of an ED in a Jordanian hospital. The presented approach evaluated possible scenarios and finally, the best scenario determined using data envelopment analysis (DEA). Abo-Hamad and Arisha (2013) presented a simulation-based framework to determine the most efficient level of resources in order to optimize the objectives such as cost, patients’ waiting time and costs of human resources. Rau et al. (2013) used discrete event simulation as
288

an effective tool for strategic capacity planning for an outpatient therapy clinic. They showed that average waiting time for new patients decreased if they were given priority over returning patients. There are several tools to evaluate, improve, and optimize processes in industrial and service units. Discrete event simulation (DES) is known as an applicable tool for evaluation and optimization of complex systems in which mathematical modeling is not applicable(Nasiri et al., 2017). Using simulation in the healthcare sector is not new. It is been about four decades that researchers especially non-academic healthcare practitioners use simulation as a decision support technique (Gaba, 2007). In this study, an integrated algorithm for optimizing resource allocation and human errors is presented. The purpose of this study is to present an integrated algorithm for optimizing resource allocation with respect to a human error in an ED. This is the first study that considers human error and safety along with resource allocation, simultaneously. The presented algorithm is composed of multi-response optimization, SRK based behavior. The contributions of the current study comparing previous studies are as follow:
• This is the first study that considers skill, rule, and knowledge based errors in resource
allocation problem in healthcare sector. • The relation between utilization and human errors’ rate of occurrence is quantified using least
square error regression models. • The proposed multi-objective problem considers traditional objectives such as cost and time
along with patient safety. • The proposed algorithm is capable of dealing with hybrid uncertainty. Simulation modeling
deals with stochastic parameters, while fuzzy based methods are used to deal with uncertainty in decision making.
2- Methodology This study presents an integrated algorithm for optimizing resource allocation and human errors. First, the historical data regarding human errors are collected per day for 6 months from the case under study. Then, using improved error classification algorithm presented by (Saurin et al., 2008) each error type is classified. In the next step, the relation between resource responsible for the error and its utilization is determined. This relation is the key to connect this phase to the next phase which is simulation-based optimization. The flowchart of the presented algorithm in this study is presented in figure 1.
289

Fig 1. Flowchart of the presented algorithm The steps of the presented algorithm are explained as follows:
290

2-1- Modeling phase Step 1.Clinical pathway: In order to model a system, first, all the interactions, entities and processes in the system should be determined. Since the purpose of this study is to optimize an emergency department, the details of such a system should be determined. In the healthcare sector, patients are the most important entity which circulates through the system to get health services. The clinical pathway of each healthcare sector is defined based on many reasons and is specific. In order to determine the clinical pathway of the considered system, interviews with experts of the system should be performed. Step 2. Identification of common human errors: In order to identify common human errors, interviews with experts and directors of the considered emergency department should be performed. Most of the emergency departments have the records of human errors in their information system. Step 3. Collecting required data: Since the presented algorithm is simulation based, collecting required and validate data is a significant step. The required data are collected using the data records from ED information system such as time between the arrival of patients and the rest of data are estimated using experts’ judgment such as required time for visiting fast patients. Step 4. Modeling: ED is a complex system and in order to consider the problem as close as possible to real-world condition, discrete-event simulation (DES) is used instead of mathematical modeling. After determining the clinical pathway of considered ED and collecting required data for modeling, it is possible to simulate the department using a DES package. Step 5.Verification and validation of simulation model: After simulating the considered ED, it is important to make sure that simulated model is representing the considered case with an acceptable level of error. In order to verify the simulated model experts’ judgment is used. For validating the model, three performance variables for the model such as “mean wait time of patients in triage” are considered. The obtained results of the simulation model for performance variables are compared to real data collected from the case using 2 sample t-test. 2-2- Human error phase Now in order to connect resource allocation problem with human errors reduction, the relation function between human resource utilization and rate of human errors should be determined. In this way, it is possible to consider the rate of human errors occurring as one of the response variables. The next phase is dedicated to this matter. Step 6. Historical data collection: In order to determine the relation function between human resource utilization and rate of human errors’ occurrence, historical data regarding a number of patients’ referral to considered ED and human errors’ reports are collected per day for six months. Step 7. Human error classification: Many researchers have presented human error classification frameworks so far. SRK based behavior presented by Rasmussen (1990) is one the most known and accepted frameworks in this regard. In the presented algorithm, improved SRK behavior presented by (Saurin et al., 2008) is considered for classifying human errors. Considering the human error classification algorithm, it is possible to determine each historical data regarding human errors in considered ED. Since each type of human error has a different source of occurrence, in order to act effectively, the type of each error should be identified and then it is possible to make preventive and improvements plans. That’s the reason for classifying human errors before estimating the relation function with human resource utilization. Steps 8 and 9.Historical scenarios’ simulation: After determining the number of human errors’ occurrence for each day, it is possible to use simulation base model to evaluate each day by considering the number of patients referred to ED and number of human errors per each day as deterministic variables. After simulating all historical periods (100 days), the utilization of human errors responsible for errors are determined and extracted from simulation results. Step 10.Relation function estimation: In order to evaluate the relation function between utilization of human resources responsible for errors with rate of human errors’ occurrence, least squares estimation approach is employed for linear, quadratic and cubic regression. The variables considered for estimation are the utilization of human resource responsible for errors and rate of occurrence for each error type.
291

2-3- Optimization phase Now the relation function between each type of human errors and resource utilization is determined and it is possible to evaluate the ED at different resource levels by considering human errors. The optimization phase is dedicated to resource allocation optimization by considering human factors. Step 11.Controllable and response variables: In a simulation optimization approach, the meaningful changes are made to controllable variables in order to find the optimal values of response variables which are the objectives of the model. Controllable variables are representing the human resources and equipment for allocation. Controllable and response variables are determined based on the objectives of the study, budget and resource limitations and experts’ judgment. Step 12.Design of experiment (DOE): After determining controllable variables and their upper bounds and lower bounds, it is possible to use DOE to develop experimental scenarios. DOE is used when the number of all possible scenarios is high and it is time and cost consuming, and also when the optimization process may need to be repeated due to the erratic nature of the case. To do this, Taguchi is used in the presented algorithm as a known and acceptable method to design experimental scenarios. Step 13.Simulation of experimental scenarios: In order to evaluate the experimental scenarios, the simulation-based model with stochastic variables is considered. Since the simulation base model is validated and verified, it is possible to change the inputs of the model and evaluate other situations for the case. Therefore, experimental scenarios are simulated and response variables of the model are extracted. Since it is possible that optimal solution is not among experimental ones and only the experimental possible solutions are evaluated, experimental results should be expanded to the whole possible solutions. In the presented algorithm, ANN is used to expand the experimental results. Step 14.Experimental scenarios’ expansion: Now in order to expand the results of experimental scenarios into whole possible combinations of controllable factors, an estimation tool is needed. There are many estimation tools such as regression models and ANN that try to find some patterns in data at hand and then by using founded patterns, it is possible to estimate new scenarios’ response variables. In presented algorithm multi-layer perceptron (MLP) is considered for prediction. In the presented algorithm, ANN is used for estimation of all possible scenarios while experimental scenarios' data will be used for training and testing. The different structures should be examined to find the best estimation network for the problem at hand. Various structures are run and when the structure with a final error less than 0.1 is found the search is complete. After finding the best estimation network, it is possible to estimate response variables for all possible scenarios. Since estimation networks are prone to errors (e.g., over fitting), each structure is run for ten times with random data sets (70% training data, 30% for test and validation and random DMUs for each data set in each run). After running each structure each time, two errors’ components including training error and test error is extracted. The mean absolute percentage error (MAPE) for each structure is calculated by the following equations, Equations 1 to 3. MAPE = 1
N∑ �Actual Valuei−Set Point Valuei
Actual Valuei�N
i=1 (N: the number of rows) (1)
Errorn = �(Train. MAPE)n ∗ (Test. MAPE)n (2)
MAPE�������� =∑ Errorn10n=1
10 (3)
Equation 1 is used for calculating errors regarding training and test data. Since in estimation functions, overfitting is possible, and it cannot be diagnosed using a training errors indicator, errors related to testing data for calculating the final error of each run is considered. A geometric mean is used for calculating the related error of each run of each structure using equation 2. Besides considering test error in the final error indicator, random data sets in each run for each structure is used. Since each structure is run for ten times, equation 3is used for calculating the final mean error of each neural network structure. Finally, ANN-MLP and RBF different structures are evaluated, the search is done when a structure presents the MAPE�������� less than 0.1 which is considered as the best estimation network
292

for the problem. After determining the best structure, it is used to estimate the non-experimented scenarios results. The input variables of ANN, are controllable variables, which are a number of considered resources for allocation. The output variables of the model are response variables including mean weighted wait time of patients in the ED, mean wait time of patients in triage, mean utilization of nurses, a mean wait time of patients for bed, redundancy score, and cost. It is notable that outputs estimation is done by an ANN structure separately for each output. Step 15.Determining the efficient scenario: The efficiency scores of all possible scenarios are calculated using fuzzy data envelopment analysis (FDEA). The scenario with the highest efficiency score is identified as the optimal scenario. Since it is possible to have more than one efficient DMU, DEA models considered in this study are full ranking models and are able to present values more than 1 which helps us to rank the scenarios easily. 3- Experiment This study is employed in an actual ED in Tehran, Iran. The considered ED is located in the middle of Tehran, and one of the most crowded regions of capital and serves more than 30000 patients a year. The department is consisting of two main parts including “General” and “Critical” section. “Critical” section is composed of CPR and ICU units, which serves critical stage patients. About 95% of patients are served in “General” section while others are a critical stage and are referred to “Critical” section. The key resources considered in the department are Triage Nurse, Nurse, Physician, Beds, CPR units, and Oxygen capsule. The department has two triage nurses, three physicians, four nurses, twenty beds, a CPR unit and three sets of oxygen capsules currently. The clinical pathway of considered ED is presented in Figure ۲. The patients’ referral to the ED is classified into two clusters including “self-referral” and “ambulance delivery”. After entering the ED, patients are monitored by triage nurses and the stage of patients is determined. There are four stages of the patients’ illness severity including “fast”, “sub-acute”, “acute”, and “critical (or CPR)” patients. Then each patient is sent to other divisions based on the patient’s stage.
3-1- Human error Human errors are rising in healthcare sector due to the congestion of patients and lack of experienced and well-trained staff. Common human errors of the considered department are also identified and presented in table 2. The information system of considered ED has archived the reports regarding stated human errors in the system.
Table 2. Common human errors in the considered ED
Human Error Error Explanation Source of Error
Unsafe Transportation
This error occurs in patients transportation among sections of ED
such as Radiography and usually cause physical injuries
The fatigue of nurse responsible for transportation and crowded ED are possible
reasons. The old and wrong structure of building and routes is also a reason.
Venipuncture Error
This error causes the patients dissatisfaction and physical damage.
The lack of concentration due to fatigue and work pressure along with lack of experience
and training are possible reasons.
Wrong Sampling
The treatment process lasts longer and leads to patient’s dissatisfaction.
The lack of concentration due to fatigue and work pressure along with lack of experience
and training are possible reasons.
293

Ambulance Delivery
Self-referring patients
Triage
CPR
Acute Patients
Sub-Acute Patients
Fast Patients Fast Room
Visiting by Physician and
Nurse
Lab Test Radiology
Exit
Hospitalization Final Diagnosis
Acute and Sub-Acute Room
Dead
Visiting by Physician and
Nurse
Lab Test and Radiology ICU
Yes Yes
Yes
Yes
Yes
No No
No
No
No
Lab Test Radiology Does patient need to stay?
CPR successful? Status Critical?
Fig 2. Clinical pathway of considered ED
294

3-2- Modeling For modeling the problem based on the determined clinical pathway, discrete-event simulation package, Arena v.14 is used. Figure ۳ presents the designed model for the considered ED. The simulation package Arena is a modular discrete event simulation based package which has been used by many researchers in past decade(Nasiri et al., 2017). The simulation model is designed based on the clinical pathway of considered department presented in figure ۳ and is explained as follows. In this model, patients are known as entities. They enter the network via a Create module. Then, the severity of their illness is assigned to them through a Decide module and four Assign modules as attributes. Patients have to wait for nurses and doctors in the triage station, in which their severity stage is determined. After evaluation of patients’ condition, they are transmitted to a fast, acute, sub-acute, and CPR rooms depending on the severity of their illness. During the transfer of patients to these rooms, there may be a transportation error. In this case, the patient's transportation time will be increased with a certain probability. Also, during this unsafe transportation, the illness severity of the patients may be increased with a certain probability. After transferring patients to rooms, the necessary services (e.g., Venipuncture, examination, etc.) are provided to patients via a Process module in which the action of seize-delay-release shows reserving and assigning required staff for a specific duration and release them after receiving services. Then, if necessary, patients will undergo radiographic imaging and blood sampling. There can be possible errors during the process of venipuncture and sampling. The venipuncture errors can increase the time needed to conduct venipuncture and sampling errors which result in re-sampling. In the end, after taking due actions to stabilize patients’ situation, if there is any need for further care, s/he will be transferred to hospitalization units, otherwise, s/he will be dismissed. As mentioned earlier, three types of human errors are considered in the simulation model, including transportation, venipuncture and sampling errors. In order to show the occurrence of these errors, seven sub-models are designed (sub-models A-G), where sub-model A is used for transportation errors. Sub-models B-D are related to the venipuncture error and sub-models E-G are related to the sampling error. In order to better understand how errors occur in the network, transportation error is explained in details as follows. In sub-model A, only one entity is generated and enters the network at a specified time (shown in the table in the form of Bold). When this entity reaches “Assign13” module, an arbitrary variable (i.e., TP) will get a value of 2, which represents the occurrence of a transportation error in the network. Then, the entity waits in “Delay1” module as many as TBOTE until the next transportation error occurs. By defining a condition (i.e. TP≤1) in a Decide module, the patient is directed to the “Assign1” module. Thereby, his/her transport time will be changed to a certain value (shown in the table in the form of Bold). Also, when an entity reaches “Assign1” module, the TP value is subtracted one unit. In this case, due to the defined condition (i.e. TP≤1) in the Decide module, the entities will be directed to the “Assign2” module and the transportation time will be restored. It should be noted that the initial value of variable TP is considered one.
295

Fig 3.The simulation model of considered ED in Arena v.14
296

3-3- Artificial Neural Networks (ANNs) ANN is a processing algorithm inspired by biological nervous systems, such as the brain. ANNs are applied when there are no functional forms and there is a need for data-based algorithms. ANNs are great substitutes for regression models and other statistical analysis and techniques (Singh et al., 2003). Among various artificial neural networks, ANN-MLP is a well-known method for estimation in engineering problems. MLP networks consist of an input layer, one or more hidden layers and an output layer. Each layer is composed of a number of particles called neurons working with each other for solving specific problems. In ANN-MLP, outputs are calculated using a linear combination of neurons in hidden layers, while each one is a function based on the weighted sum of inputs as follows (Equation 4):
𝑦𝑦 = 𝑓𝑓(𝑥𝑥,𝜃𝜃) + 𝑒𝑒 (4)
Where e is the error component, x is the vector of explanatory variables, and 𝑦𝑦� = 𝑓𝑓(𝑥𝑥,ℎ) is the unknown function for prediction based on available data. The ANN-MLP network is as follows (Equation 5):
𝑦𝑦� = 𝐹𝐹(𝑣𝑣0 + �𝐻𝐻𝑚𝑚
𝑗𝑗=1
�𝜆𝜆𝑗𝑗 + �𝑥𝑥𝑖𝑖𝑤𝑤𝑖𝑖𝑗𝑗
𝑛𝑛
𝑖𝑖=1
� 𝑣𝑣𝑗𝑗) (5)
Where 𝑦𝑦�the estimation value (i.e., output), F is the output layer function, H is hidden layer function, n is the number of inputs, m is number of hidden units, x is the input vector (𝑖𝑖 = 1, … ,𝑛𝑛), 𝜃𝜃 is the weights vector, 𝑣𝑣0 is the output bias, 𝜆𝜆𝑗𝑗 is the hidden units biases (𝑗𝑗 = 1, … ,𝑚𝑚), 𝑤𝑤𝑖𝑖𝑗𝑗 is the weight from input unit 𝑖𝑖 to hidden unit𝑗𝑗, and 𝑣𝑣𝑗𝑗 is the weight from hidden unit 𝑗𝑗 to output. Some features (e.g., the number of hidden layers, training function, transfer function of hidden layers and number of neurons in hidden layers) can affect the performance of the created network. Thus, in order to find the best structure, trial and error method are used(Azadeh et al., 2017).
3-4- Data Envelopment Analysis (DEA) DEA is used to evaluate the relative effectiveness of a group of decision-making units (DMUs), while there are several inputs and outputs for each DMU. The efficiency computed in this problem is the ratio of the weighted sum of outputs to the weighted sum of inputs. So for maximizing the DMUs’ efficiency, inputs should be minimized while the outputs are fixed (input-oriented model) or outputs should be maximized while the inputs are fixed (output-oriented model). In this study four conventional DEA models including BCC input-oriented, BCC output-oriented, CCR input-oriented, and CCR output-oriented are considered. The input and output variables of each DEA model are presented in table 3.
Table 3. Input and output variables of DEA models Input Variables Output Variables
Number of Triage Nurses Mean weighted wait time of patients Number of Physicians Mean wait time for patients in Triage
Number of Nurses Frequency of skill-based Error Number of Beds Mean wait time for bed
Number of CPR units Redundancy Score Number of oxygen capsules Cost
It is notable that the “frequency of skill-based error” is calculated based on the nurse utilizations which are estimated using ANN. Redundancy score is determined for each scenario based on the experts’ judgment. Since the department refused to share the information regarding human resources expenses and costs, a relative set of values based on experts’ judgment is considered. There are n (n=810) DMUs and each of them has m (m=6) inputs and s (s=6) outputs, the efficiency of the jth DMU will be computed by mathematical programming model as follows:
297

(8)
( ) ( )( )1
1 , 1s
m l m ui jq jq jq jq
iMax u y y y yθ α α α α
=
= + − + −∑
. . s t
( ) ( )( )1
1 , 1 1m
m l m uj jq jq jq jq
jv x x x xα α α α
=
+ − + − =∑
( ) ( )( )
( ) ( )( )1
1
1 , 1
1 , 1 0, 1,...,
sm l m u
i jk jk jk jki
mm l m u
j jk jk jk jkj
u y y y y
v x x x x k n
α α α α
α α α α
=
=
+ − + −
− + − + − ≤ =
∑
∑
, 0, 1, , , 1, , .i ju v j m i s≥ = … = …
The proposed model is developed based on 𝛼𝛼-cuts method. It considers input and output variables as triangular fuzzy numbers. Since simulation results are stochastic, the minimum values obtained for each variable are considered as minimum values of fuzzy numbers. The mean values are considered as the center of the fuzzy numbers, finally maximum value of the variable is considered as the maximum value of fuzzy numbers. For controllable variables, fuzzy numbers are considered equal due to deterministic nature.
4- Computational results The obtained numerical results are presented as follows:
4-1- Collecting required data for simulation Required data for simulation are collected from the considered ED and are presented in table 4.
Table 4. Distribution function of processes
Process Explanation Distribution Function (minutes)
Patients Arrival Time between arrivals of patients Exponential(10) Initial Examination (Triage) The time of initial examination Tria(1, 2, 3.5)
Transportation Time The required time for transporting patients to the rooms based on the patients’ stage Tria(1.5, 2, 3)
CPR The required time for performing CPR Tria(40, 60, 110)
Acute and Sub-Acute Room The required time for nurse Tria(3, 4, 5)
The required time for both physician and nurse Tria(5, 6.5, 8)
Fast Room The required time for nurse Tria(2, 4, 5)
The required time for both physician and nurse Tria(2, 4, 5)
Blood Test (Laboratory) Preparing the results of blood test Tria(140, 220, 310)
Final Diagnosis The process time for critical patients Tria(4, 6, 8) The process time for acute patients Tria(3, 4, 5)
The process time for sub-acute patients Tria(2, 3, 4)
Repeated Venipuncture (Error)
The time between occurring repeated venipuncture error in acute Exponential(450)
The time between occurring repeated venipuncture error in sub-acute room Exponential(1280)
The time between occurring repeated venipuncture error in fast room Exponential(2250)
Consequence of Repeated Venipuncture Error
The process in acute and sub-acute room for acute patients Tria(3.5, 5, 6.5)
298

Table 4. Distribution function of processes
Process Explanation Distribution Function (minutes)
The process in acute and sub-acute room for sub-acute patients Tria(3, 3.5, 5.5)
The process in fast room for fast patients Tria(3, 4, 5.5)
Sampling Error
The time between occurring sampling error in acute room
(7200*Beta) a = 0.46, b = 1.5
The time between occurring sampling error in sub-acute room
(7200*Beta) a = 0.296, b = 1.11
The time between occurring sampling error in fast room
(17300*Beta) a = 0.348, b = 1.99
Repeated Sampling The required time of process Tria(230, 310, 350)
Transportation Events(Error) The time between occurring unsafe transportation error Exponential(1750)
Consequence of Transportation Error
The required time for transferring patients is increased Triangular(3, 4, 5)
4-2- Verification and validation of simulation model The simulation verification and validation results are presented in table 5.
Table 5. Verification and validation results for simulation model
t-test Results Simulation
Results Real Data
Performance Variable
p-value = 0.097 Confidence Level = 0.95
۴٫۵۴۰۵ Sample Size = 30
Sample Mean = 5.04 Standard Deviation = 0.6282
Mean wait time in Triage
P-value = 0.112 Confidence Level = 0.95
28.5673 Sample Size = 30
Sample Mean = 31.5 Sample Standard Deviation = 6.0034
Mean wait time for bed
P-value = 0.172 Confidence Level = 0.95
17.4832 Sample Size = 30
Sample Mean = 16.3 Sample Standard Deviation = 3.582
Mean wait time of fast patients for
examination in fast room
4-3-Historical data collection The historical data regarding human errors’ occurrence in considered ED including wrong sampling, repeated venipuncture, and unsafe transportation are collected from the case under study.
4-4- Human error classification After collecting historic data regarding human errors, SRK based behavior is employed for error classification. The results of human error classification are presented in table 6.
299

Table 6. The results of human error classification
Human Error Error Type Source of Error Error Frequency
Percentage
Unsafe Transportation
Skill-Based Crowd and work pressure which cause
resource fatigue and loss of focus ۵۵%
Rule-Based Lack of attention to patients’
transportation procedures ۲۱%
Knowledge-Based Insufficiency and inability of the human
resource + lack of experience ۲۴%
Repeated Venipuncture
Skill-Based Crowd and work pressure which cause resource fatigue and loss of focus along
with lack of training ۴۴%
Rule-Based Lack of attention to venipuncture
procedures ۱۰%
Knowledge-Based Insufficiency and inability of the human
resource + lack of experience ۳۲%
No Error The human resource is not responsible
for the error ۱۴%
Wrong Sampling
Skill-Based Crowd and work pressure which cause
resource fatigue and loss of focus ۵۹%
Rule-Based Lack of attention to sampling procedures ۱۷%
Knowledge-Based Insufficiency and inability of the human
resource + lack of experience ۲۴%
4-5- Historical scenarios’ simulation After collecting the number of patients’ referral to the considered ED for historic data and classifying related human errors, it is possible to simulate each day using simulation model and extract the utilization of human resources responsible for errors. The related results for historic data are presented in appendix 1.
4-6- Relation function estimation Now it is possible to determine a relation function between resource utilization and rate of each human error type using least square estimation. The results of the correlation coefficient between each type of error and resource utilization are presented in table ۷.
Table 7. Correlation between each type of human error and resource utilization Human Error Correlation Coefficient Confidence Level
Skill-Based 0.888 ۹۵% Rule-Based -0.220 ۹۵%
Knowledge-Based 0.133 ۹۵%
As shown in table 7, only skill-based error has a direct relation with the utilization of human resource responsible for error (Nurse). After evaluating linear, quadratic and cubic regression estimation, it determined that cubic regression has the best performance in estimation as it is shown in figure 4. The result for cubic regression estimation is presented in figure 5.
300

Fig 4.The performance of cubic regression for relation function estimation of skill-based error
Fig 5. Result of cubic regression for relation function estimation of skill-based error
Finally, the relation function between nurse utilization and skill-based error is presented in equation 12.
)12( 𝑆𝑆 = −18.68 + (0.8540 ∗ 𝑈𝑈) − (0.01351 ∗ 𝑈𝑈2) + (0.000076 ∗ 𝑈𝑈3)
301
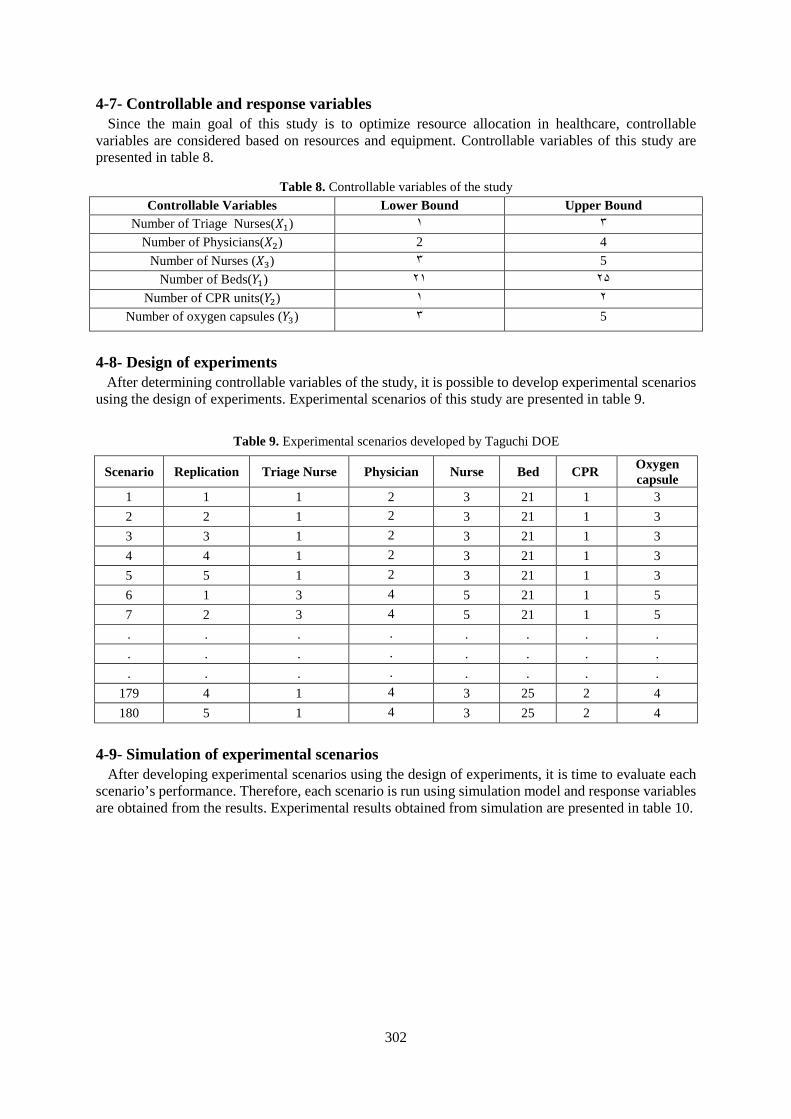
4-7- Controllable and response variables Since the main goal of this study is to optimize resource allocation in healthcare, controllable variables are considered based on resources and equipment. Controllable variables of this study are presented in table 8.
Table 8. Controllable variables of the study Controllable Variables Lower Bound Upper Bound
Number of Triage Nurses(𝑋𝑋1) ۱ ۳ Number of Physicians(𝑋𝑋2) 2 4
Number of Nurses (𝑋𝑋3) ۳ 5 Number of Beds(𝑌𝑌1) ۲۱ ۲۵
Number of CPR units(𝑌𝑌2) ۱ ۲ Number of oxygen capsules (𝑌𝑌3) ۳ 5
4-8- Design of experiments After determining controllable variables of the study, it is possible to develop experimental scenarios using the design of experiments. Experimental scenarios of this study are presented in table 9.
Table 9. Experimental scenarios developed by Taguchi DOE
Scenario Replication Triage Nurse Physician Nurse Bed CPR Oxygen capsule
1 1 1 2 3 21 1 3 2 2 1 2 3 21 1 3 3 3 1 2 3 21 1 3 4 4 1 2 3 21 1 3 5 5 1 2 3 21 1 3 6 1 3 4 5 21 1 5 7 2 3 4 5 21 1 5 . . . . . . . . . . . . . . . . . . . . . . . .
179 4 1 4 3 25 2 4 180 5 1 4 3 25 2 4
4-9- Simulation of experimental scenarios After developing experimental scenarios using the design of experiments, it is time to evaluate each scenario’s performance. Therefore, each scenario is run using simulation model and response variables are obtained from the results. Experimental results obtained from simulation are presented in table 10.
302

Table 10. Response variables of experimental scenarios
Scen
ario
Mea
n w
eigh
ted
wai
t tim
e of
pat
ient
s Mea
n w
ait t
ime
for
patie
nts i
n T
riag
e N
urse
Util
izat
ion
Mea
n w
ait t
ime
for
Bed
Red
unda
ncy
Scor
e
Cos
t
1 0.48878 0.12233 0.92511 0.48734 0.52632 178.5
2 0.41116 0.10238 0.95455 0.54363 0.52632 178.5 3 0.49512 0.11938 0.96041 0.57893 0.52632 178.5 4 0.42356 0.09473 0.90473 0.50478 0.52632 178.5 5 0.55929 0.14724 0.92526 0.49865 0.52632 178.5 6 0.03433 0.00635 0.75484 0.56282 0.94737 193.5 7 0.03052 0.00427 0.78436 0.60238 0.94737 193.5 . . . . . . . . . . . . . . . . . . . . .
179 0.06453 0.17655 0.91480 0.01684 0.73684 301 180 0.07143 0.14679 0.93974 0.01858 0.73684 301
4-10- Experimental scenarios’ expansion In order to expand experimental results to the whole possible scenarios, ANN-MLP is been considered. First, the best structure of ANN should be determined. Parameter tuning results for each output using ANN-MLP is presented in tables 11.
Table 11. Optimal artificial neural network structures for output estimation Estimation Network
Output 1 Output 2 Output 3 Output 4 Output 5 Output 6
Mean Absolute
Error 0.0912 0.0896 0.0831 0.0769 0.0994 0.0901
Structure th12–MLP
structure th8 –MLP
structure th3 –MLP
structure th7 -MLP
structure th8 –MLP
structure th12 –MLP
structure Finally, response variables of all possible scenarios are estimated using optimal ANN structures determined in table 11and are presented in table 12.
303

Table 12. Response variables of all possible scenarios
Scen
ario
Mea
n w
eigh
ted
wai
t tim
e of
pat
ient
s
Mea
n w
ait t
ime
for
patie
nts i
n T
riag
e
Freq
uenc
y of
skill
-ba
sed
Err
or
Mea
n w
ait t
ime
for
bed
Red
unda
ncy
Scor
e
Cos
t
1 0.083204039 0.06241201 3.734654584 0.482562800 0.789473684 286 2 0.085995326 0.098590681 3.947802804 0.361487992 0.684210526 287.5 3 0.096704514 0.043142716 4.383490096 0.052352458 0.736842105 294 4 0.043886979 0.003107543 1.056535765 0.448396541 0.947368421 296 5 0.041315589 0.006029096 1.613332521 0.522501551 0.947368421 293 6 0.055730016 0.04996295 2.199508690 0.351751293 0.736842105 193.5 7 0.561875696 0.007679562 0.699579469 0.448987034 0.736842105 182.5 . . . . . . . . . . . . . . . . . . . . .
806 0.566786899 0.122053497 1.316094807 0.136963216 0.736842105 287 807 0.065593522 0.006766870 2.366414305 0.060382783 0.894736842 201.5 808 0.472130612 0.006815953 3.343298863 0.560742363 0.736842105 281.5 809 0.080160969 0.007021427 0.749469553 0.156705080 0.947368421 294.5 810 0.093708727 0.054557812 4.380229296 0.016415600 0.789473684 297.5
4-11- Determining the efficient scenario In order to determine the optimal scenario among all possible scenarios, FDEA is used. FDEA calculates an efficiency score for each scenario considering the controllable and response variables. The obtained results for optimal scenarios are presented in table 13.
Table 13. Most efficient scenarios among all possible scenarios
Ran
k
Scen
ario
Num
ber
Tri
age
Nur
se
Phys
icia
n
Nur
se
Bed
CPR
Oxy
gen
Cap
sule
Mea
n w
eigh
ted
wai
t tim
e of
pat
ient
s
Mea
n w
ait t
ime
for
patie
nts i
n T
riag
e
Freq
uenc
y of
skill
-ba
sed
Err
or
Mea
n w
ait t
ime
for
bed
Red
unda
ncy
Scor
e
Cos
t
1 507 3 4 5 22 1 3 0.035038 0.003058 0.720896 0.283646 0.842105 195.5
2 327 3 4 5 24 1 3 0.037098 0.004265 0.85305۰ 0.044381 0.842105 201.5
3 314 3 4 5 25 1 3 0.035409 0.003709 1.190421 0.016233 0.842105 204.5
4 93 3 4 5 21 1 3 0.036636 0.003484 0.911279 0.514104 0.842105 192.5
5 303 2 4 5 25 1 4 0.040248 0.031538 0.784326 0.010913 0.842105 204
6 81 3 4 5 25 1 4 0.038710 0.005067 1.501912 0.009207 0.894736 205
7 32 3 4 5 24 1 4 0.042610 0.004782 1.133768 0.055915 0.894736 202
8 501 3 4 5 23 1 4 0.038517 0.007032 0.600736 0.141904 0.894736 199
9 701 3 4 5 22 1 4 0.047888 0.003337 1.2576۰۰ 0.317495 0.894736 196
10 742 3 4 5 25 1 5 0.046212 0.003411 1.612639 0.011512 0.947368 205.5
304

After confirming results by the experts of considered ED, based on the estimated values for response variables and controllable values of these efficient scenarios, scenario number 2 is determined as the best scenario. In order to evaluate the improvements, the determined optimal scenario is compared with the current situation of the considered ED and related results are presented in table 14.
Table 14. Comparison between optimal scenario and current situation of the ED
Scen
ario
Tri
age
Nur
se
Phys
icia
n
Nur
se
Bed
CPR
Oxy
gen
Cap
sule
Mea
n w
eigh
ted
wai
t tim
e of
pat
ient
s
Mea
n w
ait t
ime
for
patie
nts i
n T
riag
e
Freq
uenc
y of
skill
-bas
ed
Err
or
Mea
n w
ait t
ime
for
bed
Red
unda
ncy
Scor
e
Cos
t
Opt
imal
Sce
nari
o
327 3 4 5 24 1 3 0.0370 0.0042 0.853 0.0443 0.842 201.5
Cur
rent
Situ
atio
n
٤۷٤ 2 3 4 21 1 3 0.0752 0.0613 3.486 0.5173 0.684 185.5
Improvements and Performance Changes
-50.7% -93.1% -75.5% -85.2% 23% 8.6 %
5- Conclusion The purpose of this study was to present an integrated algorithm toward optimizing resource allocation by considering human errors in an emergency department. An actual ED in Tehran, Iran was considered as the case under study. Since work pressure is known as a significant source of human error, it is important to present an integrated algorithm toward balancing the utilization of resources in order to reduce human errors. In this regard first, required data for modeling the case under study was collected from the case. Then, the simulation model was validated and verified by collecting real data regarding three performance variables and comparing them to simulation results using t-test. Then historic data regarding human errors in the considered ED along with a number of patient referral per day were collected from the ED’s database. In the next step, human errors’ historic data evaluated using improved error classification SRK based behavior presented by (Saurin et al., 2008). After obtaining each type of error frequency per day, each day was simulated using simulation base model and with considering a number of patients’ referral to the case. Then the utilization of nurses (human resource responsible for the identified errors) extracted from the results. After that by employing Spearman
305

correlation coefficient between nurses’ utilization and frequency of each type of error was calculated. The results indicated that utilization of human resources responsible for errors and skill-based error’s frequency are correlated (p-value = 0.888). In order to determine the relation function between nurses’ utilization and skill-based error’s frequency, least squares method was employed. Since utilization is the main index in optimizing resource allocation, after obtaining the relation function between utilization of nurses and human errors, it is possible to integrate both concepts and optimize them both. In this regard, controllable variables were determined based on the human resources and key equipment of considered ED. Then thedesign of experiments was used to develop experimental scenarios. After that, each experimental scenario was simulated and response variables of the study, which represents the objectives of the study, were obtained. In order to expand the experimental results to the whole possible scenarios, ANN-MLP is employed. First, best structures of ANN are determined for each response estimation. Then all possible scenarios’ response variables were estimated. In order to find the optimal scenario, FDEA was used in this study. The efficiency scores of all possible scenarios calculated and efficient scenarios determined. Final results indicated that by adding one more triage nurse, one more physician, one more nurse and four more beds to the department, mean weighted wait time of patients will be reduced by 50.7%, mean wait time for patients in triage will be reduced by 93.1%, frequency of skill-based error will be reduced by 75.5%, mean wait time for bed will be reduced by 85.2%, and redundancy score will be increased by 23%. Although this improvement increases the resource costs of the considered ED by 8.6%.
References Abo-Hamad, Waleed, & Arisha, Amr. (2013). Simulation-based framework to improve patient experience in an emergency department. European Journal of Operational Research, 224(1), 154-166. Al-Refaie, Abbas, Fouad, Rami H, Li, Ming-Hsien, & Shurrab, Mohammad. (2014). Applying simulation and DEA to improve performance of emergency department in a Jordanian hospital. Simulation Modelling Practice and Theory, 41, 59-72. Amalberti, René, Auroy, Yves, Berwick, Don, & Barach, Paul. (2005). Five system barriers to achieving ultrasafe health care. Annals of internal medicine, 142(9), 756-764. Amaral, Thiago M, & Costa, Ana PC. (2014). Improving decision-making and management of hospital resources: An application of the PROMETHEE II method in an Emergency Department. Operations Research for Health Care, 3(1), 1-6. Azadeh, A, Ahvazi, M Pourebrahim, Haghighii, S Motevali, & Keramati, A. (2016). Simulation optimization of an emergency department by modeling human errors. Simulation Modelling Practice and Theory, 67, 117-136. Azadeh, A, Mianaei, H Shams, Asadzadeh, SM, Saberi, M, & Sheikhalishahi, M. (2015). A flexible ANN-GA-multivariate algorithm for assessment and optimization of machinery productivity in complex production units. Journal of Manufacturing Systems, 35, 46-75. Azadeh, Ali, Sepahi, Masoome, & Haghighi, Sara Motevali. (2013). An integrated simulation-DEA approach to improve quality care of medical centres. International Journal of Process Management and Benchmarking, 3(3), 352-370. Azadeh, Ali, Yazdanparast, Reza, Zadeh, Saeed Abdolhossein, & Zadeh, Afshin Esmail. (2017). Performance optimization of integrated resilience engineering and lean production principles. Expert Systems with Applications, 84, 155-170. Berwick, Don M. (2003). Improvement, trust, and the healthcare workforce. Quality and Safety in Health Care, 12(6), 448-452.
306

Carayon, Pascale. (2016). Handbook of human factors and ergonomics in health care and patient safety: CRC Press. Carthey, J, De Leval, MR, & Reason, JT. (2001). Institutional resilience in healthcare systems. Quality in health care, 10(1), 29-32. Feng, Yen-Yi, Wu, I-Chin, & Chen, Tzu-Li. (2015). Stochastic resource allocation in emergency departments with a multi-objective simulation optimization algorithm. Health care management science, 1-21. Fernandez, Conrad V, & Gillis-Ring, Jane. (2003). Strategies for the prevention of medical error in pediatrics. The Journal of pediatrics, 143(2), 155-162. Gaba, David M. (2007). The future vision of simulation in healthcare. Simulation in Healthcare, 2(2), 126-135. Konrad, Renata, DeSotto, Kristine, Grocela, Allison, McAuley, Patrick, Wang, Justin, Lyons, Jill, & Bruin, Michael. (2013). Modeling the impact of changing patient flow processes in an emergency department: Insights from a computer simulation study. Operations Research for Health Care, 2(4), 66-74. Lynn, Stephan G, & Kellermann, Arthur L. (1991). Critical decision making: managing the emergency department in an overcrowded hospital. Annals of emergency medicine, 20(3), 287-292. Montgomery, Vicki L. (2007). Effect of fatigue, workload, and environment on patient safety in the pediatric intensive care unit. Pediatric Critical Care Medicine, 8(2), S11-S16. Moody, Laura. (2012). Human Factors and Lean in the ER: A Review of the Literature. Paper presented at the Symposium on Human Factors in Healthcare. Nasiri, Mohammad Mahdi, Yazdanparast, Reza, & Jolai, Fariborz. (2017). A simulation optimisation approach for real-time scheduling in an open shop environment using a composite dispatching rule. International Journal of Computer Integrated Manufacturing, 1-14. Plsek, Paul E, & Greenhalgh, Trisha. (2001). The challenge of complexity in health care. British Medical Journal, 323(7313), 625. Rasmussen, Jens. (1982). Human errors. A taxonomy for describing human malfunction in industrial installations. Journal of occupational accidents, 4(2-4), 311-333. Rau, Chi-Lun, Tsai, Pei-Fang Jennifer, Liang, Sheau-Farn Max, Tan, Jhih-Cian, Syu, Hong-Cheng, Jheng, Yue-Ling, . . . Jaw, Fu-Shan. (2013). Using discrete-event simulation in strategic capacity planning for an outpatient physical therapy service. Health Care Management Science, 16(4), 352-365. Reason, J. (1997). Reconciling the different approaches to safety management In: Reason J, editor. Ma na ging the risks of organizational accidents: Aldershot: Ashgate Publishing. Saurin, Tarcisio Abreu, de Macedo Guimarães, Lia Buarque, Costella, Marcelo Fabiano, & Ballardin, Lucimara. (2008). An algorithm for classifying error types of front-line workers based on the SRK framework. International Journal of Industrial Ergonomics, 38(11), 1067-1077. Singh, TN, Kanchan, R, Verma, AK, & Singh, S. (2003). An intelligent approach for prediction of triaxial properties using unconfined uniaxial strength. Min Eng J, 5(4), 12-16.
307

van der Sijs, Heleen, van Gelder, Teun, Vulto, Arnold, Berg, Marc, & Aarts, Jos. (2010). Understanding handling of drug safety alerts: a simulation study. International journal of medical informatics, 79(5), 361-369. Vaughn-Cooke, Monifa, Nembhard, Harriet Black, Ulbrecht, Jan, & Gabbay, Robert. (2015). Informing Patient Self-Management Technology Design Using a Patient Adherence Error Classification. Engineering Management Journal, 27(3), 124-130. Zeinali, Farzad, Mahootchi, Masoud, & Sepehri, Mohammad Mehdi. (2015). Resource planning in the emergency departments: A simulation-based metamodeling approach. Simulation Modelling Practice and Theory.
308
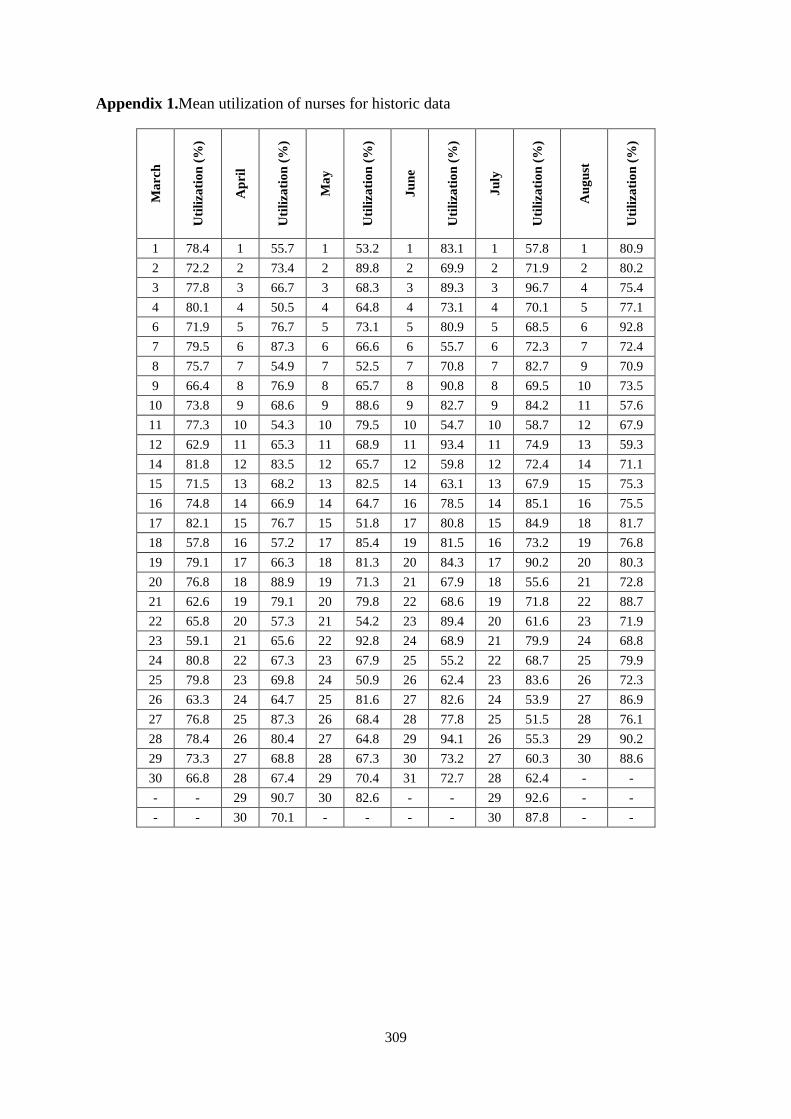
Appendix 1.Mean utilization of nurses for historic data
Mar
ch
Util
izat
ion
(%)
Apr
il
Util
izat
ion
(%)
May
Util
izat
ion
(%)
June
Util
izat
ion
(%)
July
Util
izat
ion
(%)
Aug
ust
Util
izat
ion
(%)
1 78.4 1 55.7 1 53.2 1 83.1 1 57.8 1 80.9 2 72.2 2 73.4 2 89.8 2 69.9 2 71.9 2 80.2 3 77.8 3 66.7 3 68.3 3 89.3 3 96.7 4 75.4 4 80.1 4 50.5 4 64.8 4 73.1 4 70.1 5 77.1 6 71.9 5 76.7 5 73.1 5 80.9 5 68.5 6 92.8 7 79.5 6 87.3 6 66.6 6 55.7 6 72.3 7 72.4 8 75.7 7 54.9 7 52.5 7 70.8 7 82.7 9 70.9 9 66.4 8 76.9 8 65.7 8 90.8 8 69.5 10 73.5
10 73.8 9 68.6 9 88.6 9 82.7 9 84.2 11 57.6 11 77.3 10 54.3 10 79.5 10 54.7 10 58.7 12 67.9 12 62.9 11 65.3 11 68.9 11 93.4 11 74.9 13 59.3 14 81.8 12 83.5 12 65.7 12 59.8 12 72.4 14 71.1 15 71.5 13 68.2 13 82.5 14 63.1 13 67.9 15 75.3 16 74.8 14 66.9 14 64.7 16 78.5 14 85.1 16 75.5 17 82.1 15 76.7 15 51.8 17 80.8 15 84.9 18 81.7 18 57.8 16 57.2 17 85.4 19 81.5 16 73.2 19 76.8 19 79.1 17 66.3 18 81.3 20 84.3 17 90.2 20 80.3 20 76.8 18 88.9 19 71.3 21 67.9 18 55.6 21 72.8 21 62.6 19 79.1 20 79.8 22 68.6 19 71.8 22 88.7 22 65.8 20 57.3 21 54.2 23 89.4 20 61.6 23 71.9 23 59.1 21 65.6 22 92.8 24 68.9 21 79.9 24 68.8 24 80.8 22 67.3 23 67.9 25 55.2 22 68.7 25 79.9 25 79.8 23 69.8 24 50.9 26 62.4 23 83.6 26 72.3 26 63.3 24 64.7 25 81.6 27 82.6 24 53.9 27 86.9 27 76.8 25 87.3 26 68.4 28 77.8 25 51.5 28 76.1 28 78.4 26 80.4 27 64.8 29 94.1 26 55.3 29 90.2 29 73.3 27 68.8 28 67.3 30 73.2 27 60.3 30 88.6 30 66.8 28 67.4 29 70.4 31 72.7 28 62.4 - - - - 29 90.7 30 82.6 - - 29 92.6 - - - - 30 70.1 - - - - 30 87.8 - -
309