Embed Size (px)
Citation preview

The Annals of Applied Statistics2009, Vol. 3, No. 4, 1675–1694DOI: 10.1214/09-AOAS261© Institute of Mathematical Statistics, 2009
AN INTEGRATIVE ANALYSIS OF CANCER GENE EXPRESSIONSTUDIES USING BAYESIAN LATENT FACTOR MODELING1
BY DANIEL MERL, JULIA LING-YU CHEN, JEN-TSAN CHI AND MIKE WEST
Duke University
We present an applied study in cancer genomics for integrating data andinferences from laboratory experiments on cancer cell lines with observa-tional data obtained from human breast cancer studies. The biological fo-cus is on improving understanding of transcriptional responses of tumors tochanges in the pH level of the cellular microenvironment. The statistical fo-cus is on connecting experimentally defined biomarkers of such responses toclinical outcome in observational studies of breast cancer patients. Our analy-sis exemplifies a general strategy for accomplishing this kind of integrationacross contexts. The statistical methodologies employed here draw heavilyon Bayesian sparse factor models for identifying, modularizing and corre-lating with clinical outcome these signatures of aggregate changes in geneexpression. By projecting patterns of biological response linked to specificexperimental interventions into observational studies where such responsesmay be evidenced via variation in gene expression across samples, we areable to define biomarkers of clinically relevant physiological states and out-comes that are rooted in the biology of the original experiment. Through thisapproach we identify microenvironment-related prognostic factors capableof predicting long term survival in two independent breast cancer datasets.These results suggest possible directions for future laboratory studies, as wellas indicate the potential for therapeutic advances though targeted disruptionof specific pathway components.
1. Introduction. Cancer progression involves a complex interaction of ge-netic and genomic factors that jointly subvert normal cell development. The ge-nomic component, which encompasses gene expression and regulation, is substan-tially impacted by the biochemical composition of the local environment in whicha cell grows. So-called micro-environmental parameters, including levels of oxida-tion, lactate, acidity, nutrients of various kinds and other factors affecting physicalinteractions between cells, are increasingly studied for their potential to improveour understanding of cancer biology, and for their promise to lead to new therapeu-tic strategies. Changes in such parameters can impact gene transcription, which in
Received November 2008; revised May 2009.1Supported in part by NSF Grant DMS-03-42172 and National Institutes of Health Grant NCI U54-
CA-112952. Any opinions, findings and conclusions or recommendations expressed in this work arethose of the authors and do not necessarily reflect the views of the NSF or NIH.
Key words and phrases. Acidosis and neutralization pathways in cancer, Bayesian latent factormodels, breast cancer genomics, gene expression signatures, integrative cancer genomics, micro-environmental parameters in cancer, Weibull survival models.
1675

1676 MERL, CHEN, CHI AND WEST
turn impacts protein production. Variation in these fundamental parameters cantherefore induce a cascade of effects, producing disruptions of normal cellularprocesses in downstream biological pathways [Hanahan and Weinberg (2000)].For example, changes to the pH level in the cellular environment may effect gly-colysis, thus impacting on numerous genes involved in the glycolysis pathway.Some of these genes may also play roles in the regulation of cell growth, and theirsuppression may engender tumorigenesis and promote the aggressive advance ofexisting cancerous states. Microarray gene expression assays can be used to gener-ate data on the transcriptional response of cancer cells to controlled manipulationsof environmental factors such as pH. This data is useful for characterizing thesemicro-environmental response pathways.
Our study concerns changes to cellular pH levels, and the resulting neutraliza-tion and lactic acidosis response pathways. Section 2 describes the applicationof sparse Bayesian regression models [Lucas et al. (2006); Seo, Goldschmidt-Clermont and West (2007)] to microarray data generated through a series of lab-oratory experiments on cultured breast tumor cells in which cellular pH levelswere manipulated in a controlled manner. These analyses yield statistical expres-sion signatures of the cellular responses to various interventions on the pH level.The main challenge lies in relating these signatures, and the biological pathwaysthey characterize, to variation in gene expression across large samples of humanbreast tumors. This integration of in vitro and in vivo data sets is the driving fo-cus of this and related studies. In addition to comprising a detailed study of newdata and experimental results, through which are generated several directions forbiomedical research, this work exemplifies an overall strategy for cross-study, inte-grative analysis of gene expression data for exploring and relating pathway-relatedexperimental findings to clinical contexts and patient outcomes.
When considering variability in expression patterns of genes in observationaltumor data, we face questions of differences due to the differing contexts. It is tobe expected that a tumor in vivo evidences far more complex and heterogeneousbiological variation than in the controlled in vitro setting, and this will be manifestin measures of gene expression. Normal cell processes held in quiescence in cellcultures may when active co-regulate the expression of relevant signature genesin in vivo, confounding the pattern of expression that was evident in vitro. Hence,when aiming to translate experimental findings to tumor populations, thereby pro-viding a mapping of an in vitro signature to its in vivo counterpart, we requirestatistical models capable of discovering and representing the additional complex-ity surrounding and interacting with the original response signature. Section 3describes our analysis of a large and heterogeneous breast cancer data set usingsparse latent factor models [West (2003); Carvalho et al. (2008)] that satisfy thesedesiderata. This analysis includes a targeted factor search that facilitates estimationof statistical factors associated with an initial set of genes underlying the in vitroexperimental signatures. The factors discovered in this way represent a modular
BAYESIAN FACTOR ANALYSES IN INTEGRATIVE CANCER BIOLOGY 1677
decomposition of the biological patterns evident in the in vivo breast cancer data,while retaining connections to the experimental signatures.
Section 4 discusses aspects of the biological and clinical interpretations of theseestimated factors, which can be viewed as a refined in vivo set of summary bio-markers of variation in the neutralization and lactic acidosis response pathways ofthese breast cancers. In survival analyses, we find that these factor model derivedbiomarkers have substantial prognostic value in connection with long-term sur-vival and, hence, the sets of genes comprising these factors warrant further study.We present predictive validation of this key finding in analyses of two separatebreast cancer data sets. We then provide biological interpretation of one key fac-tor that emerged from the evolutionary factor search, which plays a key role as apredictive variable in the survival analyses. It turns out that this factor is a singlecomponent of a specific biological pathway that has previously been noted as arisk biomarker in cancer, but not, to date, connected at all into response pathwayslinked with variation in cellular pH. This finding has generated follow-on biologi-cal research and initiated a new line of experimentation on the role of this pathwayin connection with cancer cell micro-environmental influences.
2. Neutralization experiments and analysis.
2.1. Biological and experimental context. Investigating the effects of changesin the micro-environment in which cells grow is of increasing interest in cancerresearch. The tumor micro-environment is typically characterized by oxygen de-pletion, high lactate and extracellular acidosis coupled with vascular leakage, glu-cose and energy deprivation. These and other micro-environmental features varywidely across tumors and generally exhibit substantial temporal and spatial dif-ferences in a tumor. Micro-environmental stresses trigger biochemical changes incancer cells that directly modulate physiological, metabolic and ultimately clinicalphenotypes. Improved understanding of the molecular mechanisms of such tumorresponses holds promise for immediate translational impact and clinical care, asrelevant therapies can be brought to bear to modify the micro-environment.
Currently, with the exception of hypoxia, very little is understood about howeach individual stress affects cellular phenotypes and tumor progression. To ex-amine how cancer cells respond to increased acidity or pH neutralization at dif-ferent time points, MCF7 cell cultures (a commonly-used breast tumor cell line)were grown in neutral media and then exposed to varying interventions in severalassays in parallel. For some cells, lactic acid was added to the medium (25 mMlactic acid at pH 6.7) for 1 and 4 hours; others cells experienced strong lactic aci-dosis conditions (25 nM lactic acid at pH 5.5) for 4 hours. Similarly, the effects ofneutralization were assayed by shifting the MCF7 cultures from overnight lacticacidosis conditions at pH 6.7 to neutral regular media at pH 7.4 for 1 and 4 hours.Control cells were grown in each starting condition (neutral conditions and lacticacidosis conditions). The complete set of experiments is summarized in Table 1.The mRNA extracted from each of the resulting n = 27 batches of MCF7 cultures

1678 MERL, CHEN, CHI AND WEST
TABLE 1Summary of neutralization/acidosis experiments. Cell entries indicate the number of replicates per
experimental group
Exposure condition
pH 7.4 pH 6.7 pH 5.5
Growth condition 1hr 4hr 1hr 4hr 4hr
pH 7.4 3× 3× 3× 3× 3×pH 6.7 3× 3× 3× 3×
was purified using Ambion miRVana RNA purification kits and standard microar-ray assays were performed using Affymetrix U133 Plus 2 Genechip platforms. Allraw microarray data were preprocessed using RMA [Irizarry et al. (2003)], the log(base 2) scale output of which were used in all ensuing statistical analyses.
2.2. Cellular response signatures. Quantitative summaries of the cellular re-sponses to lactic acidosis and neutralization treatments were obtained using a stan-dard sparse multivariate regression model [Lucas et al. (2006); Seo, Goldschmidt-Clermont and West (2007)]. We analyzed 19,375 genes (technically, probe-setsfrom the Affymetrix array; we will use “gene” and “probe” interchangeably)whose median expression level is at least 5.5 and whose expression ranges morethan 0.5-fold across the n = 27 experimental samples. Let Xexp denote the19,375 × 27 matrix of expression values. Rows represent genes and columns cor-respond to three replicate samples for each of the following experimental groups:(i) control (pH 7.4 → 7.4) at 1 hour; (ii) control at 4 hours; (iii) lactic acido-sis (pH 7.4 → 6.7) at 1 hour; (iv) lactic acidosis at 4 hours; (v) neutralization(pH 6.7 → 7.4) at 1 hour; (vi) neutralization at 4 hours; (vii) acidic growth (con-stant pH of 6.7) at 1 hour; (viii) acidic growth at 4 hours; (ix) strong lactic acidosis(pH 7.4 → 5.5) at 4 hours. Let H exp denote the 11 × 27 design matrix where thefirst 8 rows contain binary indicators for effects associated with differential expres-sion relative to the 1hr control group: 1hr lactic acidosis effect, 1hr neutralizationeffect, 1hr acidic growth effect, 4hr control effect, 4hr lactic acidosis effect (rela-tive to 4hr control), 4hr neutralization (relative to 4hr control), 4hr acidic growtheffect (relative to 4hr control) and 4hr strong lactic acidosis effect (relative to 4hrcontrol). The last three rows contain artefact control factors derived from the firstthree principle components of the expression levels associated with the AFFX se-ries control genes included on the Affymetrix microarrays. These control genesare not variably expressed in humans, and so patterns of variation across sam-ples manifest in control genes represents systematic errors arising from differentexperimental conditions. Use of these artefact control factors provides opportu-nity for sample-specific correction of artefactual effects on genes that may oth-erwise result in false-discovery or obscure meaningful biological variation [fol-

BAYESIAN FACTOR ANALYSES IN INTEGRATIVE CANCER BIOLOGY 1679
lowing Lucas et al. (2006) and Carvalho et al. (2008)]. After deriving the artefactcontrol factors, rows corresponding to Affymetrix control genes are removed fromsubsequent analyses.
The model for the expression of gene g in sample i is
xexpg,i = μg +
11∑
k=1
βg,khexpk,i + νg,i
or in matrix from
Xexp = μ1 + BH + N,
where μg denotes the mean expression of gene g in the 1hr control samples, eachβg,k is the change in expression of gene g due to design factor k, and the νg,i areindependent, normally distributed idiosyncratic noise terms representing residualbiological variation, experimental and measurement errors with individual vari-ances ψg. Sparsity is induced via prior distributions that place positive probabilityon βg,k = 0 for each g, k pair, and resulting posterior analysis allows investigationof posterior sparsity patterns via probabilities π∗
g,k = Pr(βg,k �= 0|Xexp). Full de-tails follow Lucas et al. (2006) and prior specifications, including priors for the μk,
variance parameters and all hyper-parameters, are given in Supplement B. Pos-terior inference via MCMC is achieved using the BFRM software [Wang et al.(2007)].
Figure 1 broadly illustrates genes uniquely associated with individual treatmenteffects as well as those involved in multiple responses. This gives some indicationof the degree of intersection of the cellular pathways being queried by the differenttreatments. Across the 8 treatments, the sparsity, as measured by the percent ofgenes for which π∗
g,k > 0.99, ranges from 29% (4 hour neutralization) to 46%
(4 hour lactic acidosis). The fold-change associated with the involved genes (2|βg,k |for g such that π∗
g,k > 0.99) ranges from 1.06× to 13×, with a mean of 1.4×.The cellular response to each treatment, also called the signature of the treat-
ment, is characterized by estimated effects β∗g,k = E(βg,k|βg,k �= 0,Xexp) together
with the π∗g,k. The ability of each signature to uniquely identify the treatment it re-
flects can be further explored using summary signature scores as defined in Lucas,Carvalho and West (2009). Based on posterior means β∗
g,k and ψ∗g , let
sk,i =19,375∑
g=1
β∗g,kx
expg,i /ψ∗
g
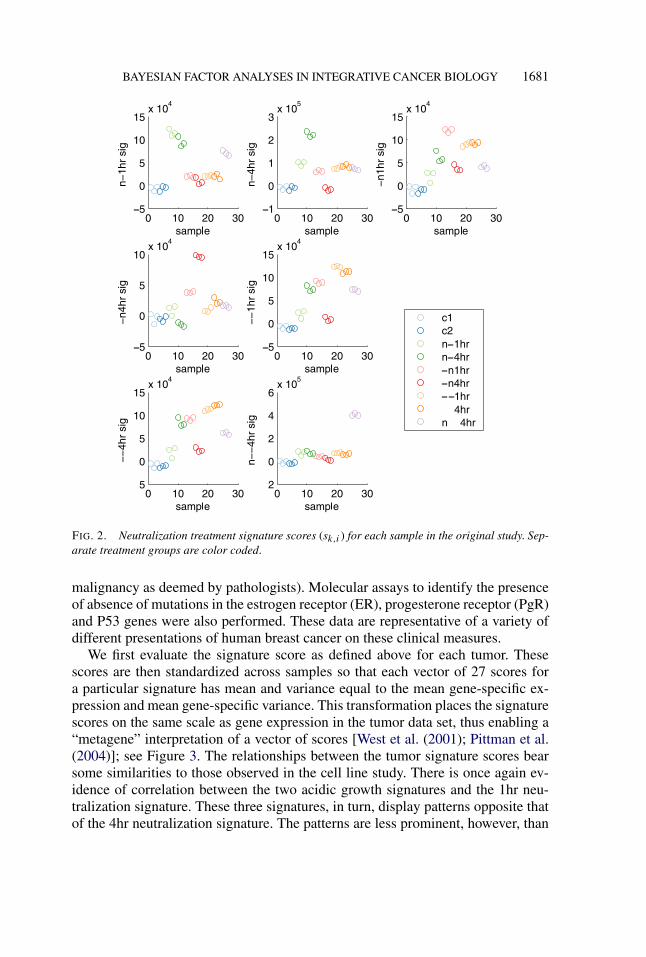
define the score for treatment signature k on sample i. This expression is derivedfrom the data-driven component of the Bayes factor that weighs the evidencein favor of the given signature describing the variation in a sample (p(xi |hk,i =1)/p(xi |hk,i = 0)). Figure 2 shows the values of the scores associated with 7 treat-ment signatures plotted across samples. As expected, the highest scoring samplesfor each signature are those upon which that signature is based, but importantconnections between signatures can be identified on the basis of other high- or

1680 MERL, CHEN, CHI AND WEST
FIG. 1. Neutralization signature skeleton: black indicates genes g (rows) with posterior probabilityπ∗
g,k > 0.99 for each experimental group k (columns). Genes are ordered to emphasize which genesare unique to each successive experiment relative to the previous.
low-scoring treatment groups. For example, there is a inverse relationship betweenthe 4hr acidosis score and the 4hr neutralization score. Also evident is the similar-ity between the 1hr and 4hr acidic growth signatures, which can also be inferredthrough the large intersection of the genes defining the two signatures (Figure 1).
3. Latent factor analysis of breast tumor gene expression.
3.1. In vivo breast cancer data. The primary goals of this study are to uncovershared structures in the cell response signatures defined above, and to quantifythe extent to which these structures can be used to predict clinical phenotypes inreal human cancers. Here we make use of the gene expression data for a collec-tion of 251 surgically removed breast tumors as reported in Miller et al. (2005).Affymetrix 133A and 133B GeneChip microarrays were generated for each tu-mor sample, and relevant clinico-pathological variables were collected for eachpatient. This included age at diagnosis, tumor size, lymph node status (an indi-cator of metastatic cancer) and Elston histological grade (a categorical rating of
BAYESIAN FACTOR ANALYSES IN INTEGRATIVE CANCER BIOLOGY 1681
FIG. 2. Neutralization treatment signature scores (sk,i ) for each sample in the original study. Sep-arate treatment groups are color coded.
malignancy as deemed by pathologists). Molecular assays to identify the presenceof absence of mutations in the estrogen receptor (ER), progesterone receptor (PgR)and P53 genes were also performed. These data are representative of a variety ofdifferent presentations of human breast cancer on these clinical measures.
We first evaluate the signature score as defined above for each tumor. Thesescores are then standardized across samples so that each vector of 27 scores fora particular signature has mean and variance equal to the mean gene-specific ex-pression and mean gene-specific variance. This transformation places the signaturescores on the same scale as gene expression in the tumor data set, thus enabling a“metagene” interpretation of a vector of scores [West et al. (2001); Pittman et al.(2004)]; see Figure 3. The relationships between the tumor signature scores bearsome similarities to those observed in the cell line study. There is once again ev-idence of correlation between the two acidic growth signatures and the 1hr neu-tralization signature. These three signatures, in turn, display patterns opposite thatof the 4hr neutralization signature. The patterns are less prominent, however, than

1682 MERL, CHEN, CHI AND WEST
FIG. 3. Initial evaluation of neutralization signature levels across tumor samples. Samples areordered by first principle component to emphasize dominant signature gradients.
was evident in the cell culture data. Although the variation in these scores presum-ably relates, in part, to underlying biological variation in the activity of the lacticacidosis and neutralization response pathways within these tumors, as mentionedabove, the set of genes characterizing the in vivo effects of lactic acidosis and neu-tralization may differ substantially from those characterizing the in vitro responsesas a result of the more complex interactions with other cellular processes.
We thus aim to refine our evaluation of the response pathway activity levels inthe tumor data by using the signature scores as initial “anchors” in an analysisusing sparse latent factor models. The main idea is to define statistical factors onsets of genes related to these initial scores, and to link in other genes that mayconnect with the different response pathways active in vivo. This is accomplishedas follows.
3.2. Sparse factor model specification. Sparse latent factor models representcommon patterns in gene expression via latent factors in which the factor-generelationships are sparse; this notion of statistical sparsity is key for representingthe intersecting subsets of genes potentially related to underlying networks of bi-ological pathways [West (2003); Seo, Goldschmidt-Clermont and West (2007);Lucas et al. (2009); Carvalho et al. (2008)]. The form of the statistical modelis an extension of the sparse regression model. A key part of our analysis strat-egy stems from augmenting the 44,592 × 251 matrix of gene expression data forthe tumor data with the 7 values of the projected treatment signature scores. Letp = 44,592 + 7 = 44,599 and n = 251, and let Xobs denote the p × n matrixin which the first 7 rows are the projected scores across tumor samples, and rows8−p are the gene expression values. Here we will make use of K = 4 artefact con-trol factors derived from the first four principal components of the control genes of

BAYESIAN FACTOR ANALYSES IN INTEGRATIVE CANCER BIOLOGY 1683
the breast tumor microarrays. A latent factor model consisting of L latent factorsis therefore
xobsg,i = μg +
K∑
k=1
αg,kλk,i +K+L∑
l=K+1
αg,lλl,i + νg,i
or, in matrix form,
Xobs = μ1 + A� + N,
where: (i) the first K rows of the (K + L) × n matrix � are the known arte-fact controls; (ii) the remaining L rows contain latent factor scores; (iii) the first K
columns of the p×(K +L) matrix A are regression parameters on the artefact con-trols (changing notation from the earlier β to α for notational convenience here);(iv) the remaining L columns of A are factor loadings parameters relating factorsto genes and to the projected scores; and (v) A is sparse, with sparsity pattern tobe inferred along with estimation of nonzero values. The model is completed byassigning sparsity priors over columns of A, precisely as was done for B in thesparse regression model; prior specification for A, variance components and otherhyper-parameters follows default recommendations for the BFRM framework (seeSupplement B).
Flexibility in representing potentially complicated patterns underlying expres-sion is achieved using nonparametric Bayesian Dirichlet process models for thefactor scores. The L-vectors (λK+1,i , . . . , λK+L,i)
′, representing the latent factorvalues on tumor sample i, are modeled as draws from an unknown latent factordistribution subject to a Dirichlet process prior with a multivariate normal basemeasure. This standard nonparametric mixture model allows great flexibility inadapting to nonnormal structures commonly manifest in factor scores [Carvalhoet al. (2008); Wang et al. (2007)].
Ensuring the identifiability of latent factors requires the use of a modified prioron A such that the leading L rows have an upper triangle of zeros and positiveupper diagonal elements; that is, for g = 1 :L, we have αg,g+K > 0 and αg,l = 0for l > g + K . The first L variables in Xobs then represent “founders” of the L
latent factors, with variable g associated with a αg,g-fold change in expressiondue to factor g, (g = 1, . . . ,L). It also defines an hierarchical dependence on thefactors, namely,
xobs1,i = · · · + α1,K+1λK+1,i + ν1,i ,
xobs2,i = · · · + α2,K+1λK+1,i + α2,K+2λK+2,i + ν2,i ,
xobs3,i = · · · + α3,K+1λK+1,i + α3,K+2λK+2,i + α3,K+3λK+3,i + ν3,i
and so on. This structure aids the interpretation of the latent factor loadings as rep-resenting interconnected components of a complex biological process. The latentfactor scores λi,l quantify variation across tumors for these expanding levels ofcomplexity, with each additional factor accounting for variation in observed geneexpression unaccounted for by the previous set of factors. With our use of pro-

1684 MERL, CHEN, CHI AND WEST
jected in vitro signature scores here as the first 7 variables, the first 7 factors willnow represent patterns underlying co-variation in expression of sets of genes thatlink indirectly to these treatment signatures. Additional factors then reflect otherdimensions of common variation in the set of genes analyzed.
3.3. Targeted factor search. Decomposition of the patterns of variation evi-dent in the tumor gene expression data into latent factors proceeds through evo-lutionary model search, full details of which appear in Carvalho et al. (2008) andWang et al. (2007). The evolutionary model search provides a computationally ef-ficient approximation to the computationally prohibitive full factor analysis on theentire set of genes, and produces full posterior results for the final set of factors andgenes. A key novelty of this approach is that we exploit the sensitivity of the modelsearch procedure to its initial configuration in order to explore the space of factormodels surrounding an initial model containing 7 latent factors and representingonly the 7 response metagenes. By construction, these initial factors are each de-fined, or “founded,” by the neutralization/lactic acidosis treatment scores, therebyensuring that the model search is primarily concerned with patterns of variationrelated to these particular response pathways.
Evolution of this initial model proceeds as follows. Samples from the joint pos-terior distribution of model parameters are obtained through MCMC. Based onthese fitted values, we impute inferences for all genes g > 7 that are not currentlyincluded in the model, as described in Carvalho et al. (2008). Thus, after fittingthe initial factor model which considers only the signature scores, we examine ex-pression levels of the full set of 44,000+ genes for evidence of association withthe current factors. The imputation process generates approximate probabilitiesπ∗
g,l = Pr(αg,l �= 0|Xobs) for all such genes g. Genes are ranked on the basis ofthese probabilities, and the model is then expanded to include a small number ofthe genes with largest values of the projected π∗
g,l . The model is then refitted tothis expanded sample, and if appropriate, the number of factors is increased in or-der to adapt to additional common patterns of expression variation now evident inthe increased set of variables being modeled. This process is repeated until no newgenes or factors can be added, or until the model reaches a designated maximumsize. More details on the search strategy, including control parameters governingmodel expansion, are given in Supplement B.
The initial 7-gene, 7-factor model evolved under this process to reach a termi-nal size of 500 variables (the designated maximum) incorporating 30 latent factors.Figure 4 shows the skeleton of the factor structure, in terms of major patterns ofgene-factor relationships. The ordering of the factors is determined by the modelsearch procedure, and represents the incremental improvement to model fit pro-vided by each subsequent factor. In this sense, each subsequent factor builds uponthe complexity modeled by the previous factors. The leading 7 factors correspondto the following signatures, respectively: 4hr lactic acidosis, 1hr lactic acidosis,1hr neutralization, 4hr strong lactic acidosis, 4hr acidic growth, 1hr acidic growth,and 4hr neutralization. Like their in vitro signature counterparts, the in vivo fac-

BAYESIAN FACTOR ANALYSES IN INTEGRATIVE CANCER BIOLOGY 1685
FIG. 4. Skeleton of fitted factor loadings for tumor data. Black indicates variable-factor loadingswith π∗
g,l > 0.99. The first 7 variables are the projected neutralization scores, followed by 493 genesreordered for a clear visual presentation of the sparsity structure of, and cross-talk in, gene-factorloadings.
tors loadings contain a great deal of sparsity. Of the 493 genes included in thefinal model, only 333 are among those identified in the in vitro signature analy-sis. Factor 1, founded by the the 4hr lactic acidosis signature score, has 173 geneswith nonzero loadings at the 0.99 probability threshold, compared to 8909 in thein vitro signature.
Posterior estimates of the factor loadings (α∗g,l = E(αg,l|αg,l �= 0,Xobs)) aid in
generating further insights. In particular, the upper portion of the estimated load-ings matrix sheds light on the structure of connections between latent factors; seeFigure 5. As described in Section 3.2, one interpretation of a row A is as a set ofcoefficients determining a linear combination of factor scores that predict the geneexpression vector for the corresponding variable. The inset of Figure 5 shows thatthe fitted values of all 7 of signature scores involve positive contributions fromfactor 1, the factor version of the 4hr lactic acidosis signature. Thus, the patternof 4hr lactic acidosis signature activity across samples describes a fundamentalpattern of pathway activation that underlies the activity patterns of the other 6 sig-

1686 MERL, CHEN, CHI AND WEST
FIG. 5. Heat map showing the magnitudes of the fitted factor loadings α∗g,l for the first L = 30
rows of A. The founder gene for each factor is designated by its U133+ probe ID. The terms in eachrow determine a linear combination of latent factors that predict the observed expression levels ofthe founder gene.
natures. The seventh factor (i.e., the factor representation of the 4hr neutralizationsignature) sits atop this hierarchy of pathway complexity, represented as a linearcombination of factors 1 (4hr neutralization), 3 (1hr neutralization), 4 (4hr stronglactic acidosis) and 5 (4hr acidic growth), plus the additional pattern of expressionunique to this pathway.
4. Biomedical connections of factor profiles.
4.1. Factor-based prediction of long term survival. The in vivo latent factorslinked to neutralization pathways represent complexity in the patterns of expres-
BAYESIAN FACTOR ANALYSES IN INTEGRATIVE CANCER BIOLOGY 1687
sion, and therefore in the levels of underlying biological pathway activation evidentacross the tumor samples. For this reason, latent factors can be regarded as can-didate biomarkers of physiological states that link to these pathways. Our studyexplores this using the posterior mean factor scores λ∗
l,i as candidate predictors ina survival analysis of the breast cancer patient data.
We use Weibull regression models of patient survival that draw on the 30 esti-mated neutralization/lactic acidosis pathway factors, the 7 original projected sig-nature scores and the clinical covariates available for this data set [Miller et al.(2005)]. The latter include histologic grade, ER mutation status, node status,P53 mutation status, PgR mutation status, tumor size and age at diagnosis. Thisanalysis allows both integration and comparison of the prognostic value of thesetraditional markers with specific pathway-related signature scores, and their la-tent factor representations—an integrative clinico-genomic analysis. Let ti de-note the survival time of patient i. The Weibull density function is p(ti |a, γ ) =ata−1
i exp(ηi − tai eηi ), where a > 0 is the index parameter and ηi = γ ′yi the linearpredictor based on a covariate vector yi. We explore subsets of covariates and re-gression model uncertainty using Bayesian shotgun stochastic search [Hans, Dobraand West (2007); Hans et al. (2007b)]. This generates a list of regression covari-ate subsets and the corresponding posterior regression model probabilities for usein Bayesian model averaging for survival prediction and in exploring relevanceof variables. Details of model and prior specification follow defaults in the SSSsoftware [Hans et al. (2007b)] as noted in Supplement B.
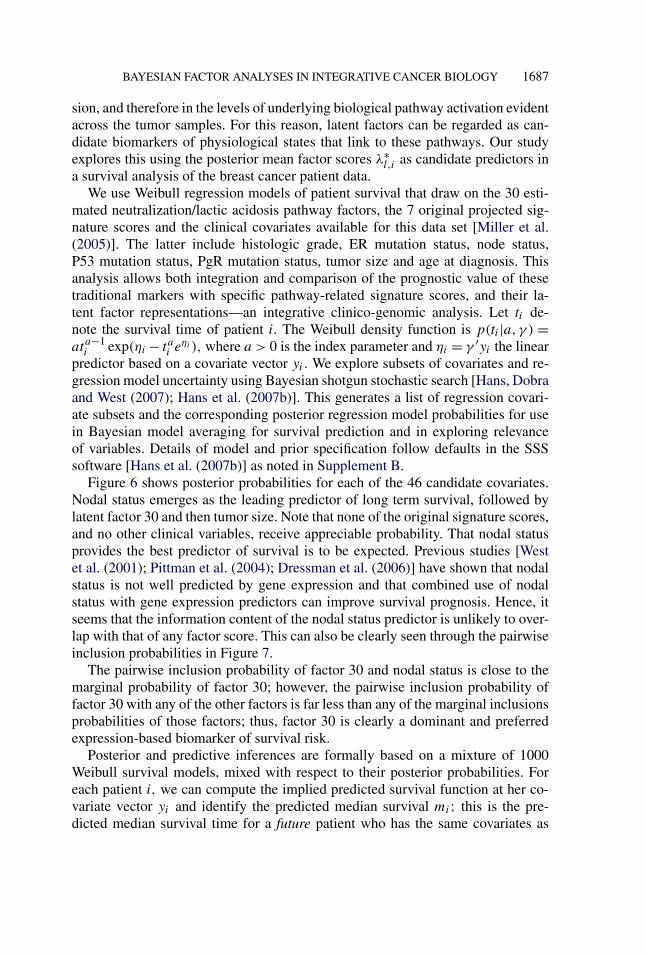
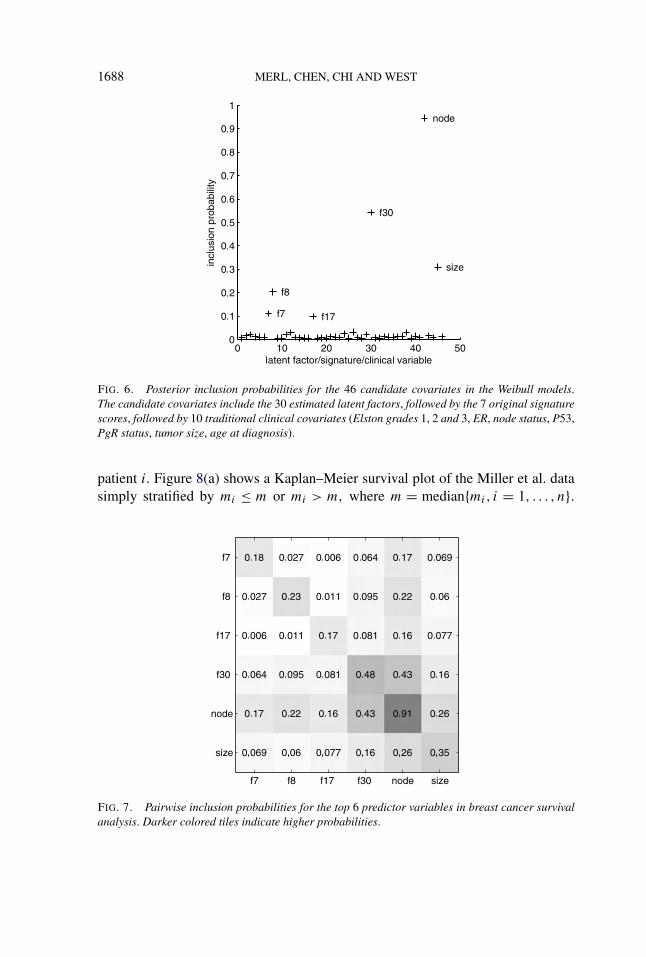
Figure 6 shows posterior probabilities for each of the 46 candidate covariates.Nodal status emerges as the leading predictor of long term survival, followed bylatent factor 30 and then tumor size. Note that none of the original signature scores,and no other clinical variables, receive appreciable probability. That nodal statusprovides the best predictor of survival is to be expected. Previous studies [Westet al. (2001); Pittman et al. (2004); Dressman et al. (2006)] have shown that nodalstatus is not well predicted by gene expression and that combined use of nodalstatus with gene expression predictors can improve survival prognosis. Hence, itseems that the information content of the nodal status predictor is unlikely to over-lap with that of any factor score. This can also be clearly seen through the pairwiseinclusion probabilities in Figure 7.
The pairwise inclusion probability of factor 30 and nodal status is close to themarginal probability of factor 30; however, the pairwise inclusion probability offactor 30 with any of the other factors is far less than any of the marginal inclusionsprobabilities of those factors; thus, factor 30 is clearly a dominant and preferredexpression-based biomarker of survival risk.
Posterior and predictive inferences are formally based on a mixture of 1000Weibull survival models, mixed with respect to their posterior probabilities. Foreach patient i, we can compute the implied predicted survival function at her co-variate vector yi and identify the predicted median survival mi; this is the pre-dicted median survival time for a future patient who has the same covariates as
1688 MERL, CHEN, CHI AND WEST
FIG. 6. Posterior inclusion probabilities for the 46 candidate covariates in the Weibull models.The candidate covariates include the 30 estimated latent factors, followed by the 7 original signaturescores, followed by 10 traditional clinical covariates (Elston grades 1, 2 and 3, ER, node status, P53,PgR status, tumor size, age at diagnosis).
patient i. Figure 8(a) shows a Kaplan–Meier survival plot of the Miller et al. datasimply stratified by mi ≤ m or mi > m, where m = median{mi, i = 1, . . . , n}.
FIG. 7. Pairwise inclusion probabilities for the top 6 predictor variables in breast cancer survivalanalysis. Darker colored tiles indicate higher probabilities.

BAYESIAN FACTOR ANALYSES IN INTEGRATIVE CANCER BIOLOGY 1689
FIG. 8. (a) Kaplan–Meier curves demonstrating stratification of Miller data into high- and low-risk groups, based on the fitted Weibull mixture. (b) Estimated survival curve associated with varyinglevels of factor 30, holding all other predictors at their median values. (c) Kaplan–Meier curvesdemonstrating stratification of Miller data into high- and low- risk groups, based solely on the valueof factor 30.
There is approximately a 30% difference in the empirical 10-year survival proba-bility between patients cohorts stratified crudely on this basis, as a simple visualof the relevance of the included covariates. By way of focusing on factor 30, weplot the model-averaged survival curve for a hypothetical patient whose covariatesare held constant at their median values in the data set, save for variation in thefactor 30 score; see Figure 8(b), where factor 30 is set at its 5th, 50th and 95th per-

1690 MERL, CHEN, CHI AND WEST
centiles in the data set, all other covariates remaining fixed. The estimated effectof variation in factor 30 alone accounts for approximately 20% of the difference in10-year patient survival between the high-risk and low-risk subgroups. This pre-diction is confirmed by considering the Kaplan–Meier curves formed by stratifyingthe patients on the basis of the patient-specific factor 30 value compared to the me-dian across samples; see Figure 8(c). The pattern of gene expression comprisingthe loading associated with factor 30 warrants further investigation, to which wewill return in Section 4.3.
4.2. Out-of-sample factor projection. It is critical to evaluate whether or notthe above results can be confirmed through out-of-sample prediction. We do thiswith two additional breast cancer data sets: that of Pawitan et al. (2005), consistingof 159 primary breast tumors assayed on Affymetrix U133A and U133B chips, andthat of Sotiriou et al. (2006), consisting of 189 primary breast tumors assayed onU133A chips.
Fixing all factor model parameters at their posterior means, we can directly pre-dict values of the latent factors for each new patient; see Supplement B and [Lucaset al. (2009)]. Note that this calculation is purely predictive; no model fitting noradditional analysis of the two validation data sets was performed. Using the pre-dicted latent factor vectors, we can produce the same survival plots for these data,stratifying each of the two new patient cohorts on the basis of their factor 30 scoresas above; see Figure 9, as compared to Figure 8(c). The association between low
FIG. 9. Kaplan–Meier curves demonstrating stratification of (a) the Pawitan et al. (2005) patientsamples, and (b) the Sotiriou et al. (2006) patient samples (right) into high- and low- risk groupsbased on imputed values of factor 30, as identified in the latent factor analysis of the Miller data.
BAYESIAN FACTOR ANALYSES IN INTEGRATIVE CANCER BIOLOGY 1691
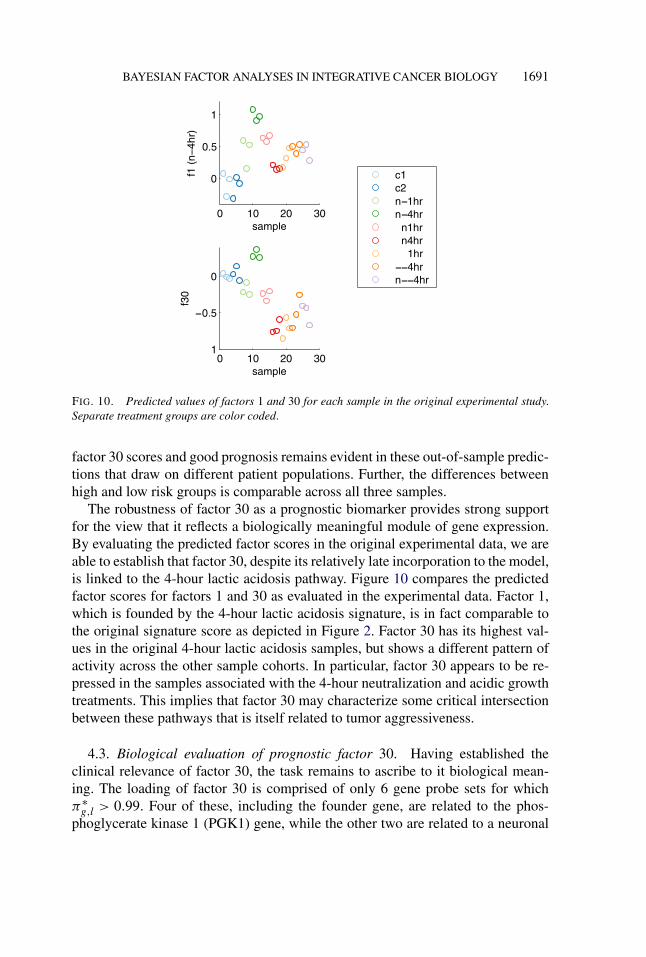
FIG. 10. Predicted values of factors 1 and 30 for each sample in the original experimental study.Separate treatment groups are color coded.
factor 30 scores and good prognosis remains evident in these out-of-sample predic-tions that draw on different patient populations. Further, the differences betweenhigh and low risk groups is comparable across all three samples.
The robustness of factor 30 as a prognostic biomarker provides strong supportfor the view that it reflects a biologically meaningful module of gene expression.By evaluating the predicted factor scores in the original experimental data, we areable to establish that factor 30, despite its relatively late incorporation to the model,is linked to the 4-hour lactic acidosis pathway. Figure 10 compares the predictedfactor scores for factors 1 and 30 as evaluated in the experimental data. Factor 1,which is founded by the 4-hour lactic acidosis signature, is in fact comparable tothe original signature score as depicted in Figure 2. Factor 30 has its highest val-ues in the original 4-hour lactic acidosis samples, but shows a different pattern ofactivity across the other sample cohorts. In particular, factor 30 appears to be re-pressed in the samples associated with the 4-hour neutralization and acidic growthtreatments. This implies that factor 30 may characterize some critical intersectionbetween these pathways that is itself related to tumor aggressiveness.
4.3. Biological evaluation of prognostic factor 30. Having established theclinical relevance of factor 30, the task remains to ascribe to it biological mean-ing. The loading of factor 30 is comprised of only 6 gene probe sets for whichπ∗
g,l > 0.99. Four of these, including the founder gene, are related to the phos-phoglycerate kinase 1 (PGK1) gene, while the other two are related to a neuronal
1692 MERL, CHEN, CHI AND WEST
cell death-related protein and the CEGP1 protein. The factor is characterized byoverexpression (βg,k > 0) of the PGK1 and neuronal cell death proteins and sup-pression (βg,k < 0) of CEGP1.
A literature search generates detailed biological information on PGK1, andits role in the glycolysis pathway where it is fundamental to cell growth andmetabolism. PGK1 catalyzes the reversible conversion of 1,3-diphosphoglycerateto 3-phosphoglycerate with the generation of one molecule of ATP and this rep-resents an important step in glycolysis pathways. In addition, PGK1 has been re-ported to induce other processes related to cancer progression, such as conferringa multi-drug resistant (MDR) phenotype [Duan et al. (2002)] and affecting tumorangiogenesis through affecting secreted plasmin [Lay et al. (2000)]. Previous stud-ies have also shown that elevated levels of PGK1 predict poor survival outcomesin lung cancers [Chen et al. (2003)], and that PGK1 can often be expressed at highlevels in pancreatic [Hwang et al. (2006)] and renal [Unwin et al. (2003)] can-cers. The association between high factor 30 levels and poor prognosis indicates asimilar relationship between PGK1 and survival may exist for breast cancers.
Since PGK1 is an important component of glycolysis pathways, our findingshere may implicate glycolysis activities in poor patient survival. This is supportedby previous findings that expression of glycolysis pathways and PGK1 are re-pressed by lactic acidosis [Chen et al. (2008)]. Factor 30 links the neutralizationpathway response signatures to a clear PGK1 factor that may now serve as a bio-marker of one key aspect of tumor responses to changes in pH with the potential toaid in predicting follow-on changes in tumor metabolism via glycolysis pathwayactivation. Further evaluation of this chain of relationships is now initiated and willbe explored using independent methods such as tumor tissue microarrays [Chenet al. (2003)]. Since PGK1 and glycolysis pathways are also controlled by hypoxia[Chi et al. (2006)], these results also highlight their potential roles as integral me-diators of multiple micro-environmental factors affecting tumor progression andclinical outcomes.
Acknowledgments. The authors are grateful to an editor of AOAS and ananonymous reviewer for constructive comments on this manuscript.
SUPPLEMENTARY MATERIAL
Supplement A: Software and Data (DOI: 10.1214/09-AOAS261SUPPA; url).This site contains all materials needed to reproduce the reported analyses. Thisincludes all data files, control files for the BFRM and SSS software, and MATLABfunctions for producing graphical summaries.
Supplement B: Appendix (DOI: 10.1214/09-AOAS261SUPPB; .pdf). The ap-pendix Merl et al. (2009) provides further details on prior specifications in thesparse regression and sparse latent factor models. The appendix also containsdetails on the control parameters for the evolutionary factor search and shotgun

BAYESIAN FACTOR ANALYSES IN INTEGRATIVE CANCER BIOLOGY 1693
stochastic search, and describes the procedure for imputing factor scores in newsamples.
REFERENCES
CARVALHO, C., CHANG, J., LUCAS, J., NEVINS, J., WANG, Q. and WEST, M. (2008). High-dimensional sparse factor modelling: Applications in gene expression genomics. J. Amer. Statist.Assoc. 103 1438–1456.
CHEN, G., GHARIB, T., WANG, H., HUANG, C., KUICK, R., THOMAS, D., SHEDDEN, K., MISEK,D., TAYLOR, J., GIORDANO, T., KARDIA, S., IANNETTONI, M., YEE, J., HOGG, P., OR-RINGER, M., HANASH, S. and BEER, D. (2003). Protein profiles associated with survival inlung adenocarcinoma. Proc. Natl. Acad. Sci. 100 13537–13542.
CHEN, J.L-Y., LUCAS, J., SCHROEDER, T., MORI, S., NEVINS, J., DEWHIRST, M., WEST, M. andCHI, J. (2008). Genomic analysis of response to lactic acidosis and acidosis in human cancers.PLoS Genetics 4 e1000293.
CHI, J., WANG, Z., NUYTEN, D., RODRIGUEZ, E., SCHANER, M., SALIM, A., WANG, Y., KRIS-TENSEN, G., HELLAND, A., BORRESEN-DALE, A., GIACCIA, A., LONGAKER, M., HASTIE,T., YANG, G., VAN DE VIJER, M. and BROWN, P. (2006). Gene expression programs in responseto hypoxia: Cell type specificity and prognostic significance in human cancers. PLoS Medicine 3e47.
DRESSMAN, H., HANS, C., BILD, A., OLSON, J., ROSEN, E., MARCOM, P., LIOCHEVA, V.,JONES, E., VUJASKOVIC, Z., MARKS, J., DEWHIRST, M., WEST, M., NEVINS, J. and BLACK-WELL, K. (2006). Gene expression profiles of multiple breast cancer phenotypes and response toneoadjuvant chemotherapy. Clinical Cancer Research 12 819–826.
DUAN, Z., LAMENDOLA, D., YUSUF, R., PENSON, R., PREFFER, F. and SEIDEN, M. (2002).Overexpression of human phosphoglycerate kinase 1 (pgk1) induces a multidrug resistance phe-notype. Anticancer Research 22 1933–1941.
HANAHAN, D. and WEINBERG, R. (2000). The hallmarks of cancer. Cell 100 57–70.HANS, C., DOBRA, A. and WEST, M. (2007). Shotgun stochastic search in regression with many
predictors. J. Amer. Statist. Assoc. 102 507–516. MR2370849HANS, C., WANG, Q., DOBRA, A. and WEST, M. (2007b). SSS: High-dimensional Bayesian re-
gression model search. Bulletin of the International Society for Bayesian Analysis 14 8–9.HWANG, T., LIANG, Y., CHIEN, K. and YU, J. (2006). Overexpression and elevated serum levels
of phosphoglycerate kinase 1 in pancreatic ductal adenocarcinoma. Proteomics 6 2259–2272.IRIZARRY, R., BOLSTAD, B., COLLIN, F., COPE, L., HOBBS, B. and SPEED, T. (2003). Summaries
of affymetrix genechip probe level data. Nucleic Acids Research 31 e15.LAY, A., JIANG, X., KISKER, O., FLYNN, E., UNDERWOOD, A., CONDRON, R. and HOGG, P.
(2000). Phosphoglycerate kinase acts in tumour angiogenesis as a disulphide reductase. Nature408 869–873.
LUCAS, J., CARVALHO, C., WANG, Q., BILD, A., NEVINS, J. and WEST, M. (2006). Sparse statis-tical modelling in gene expression genomics. In Bayesian Inference for Gene Expression and Pro-teomics (P. Müller, K. Do and M. Vannucci, eds.) 155–176. Cambridge Univ. Press. MR2269095
LUCAS, J., CARVALHO, C. and WEST, M. (2009). A Bayesian analysis strategy for cross-studytranslation of gene expression biomarkers. Statist. Appl. Genet. Mol. Biol. 8 art11.
LUCAS, J., CARVALHO, C., MERL, D. and WEST, M. (2009). In-vitro to in-vivo factor profiling inexpression genomics. In Bayesian Modeling in Bioinformatics (D. Dey, S. Ghosh and B. Mallick,eds.). Chapman & Hall/CRC. To appear.
MERL, D., CHEN, J.L-Y., CHI, J. and WEST, M. (2009). Supplement to “An integrative analy-sis of cancer gene expression studies using Bayesian latent factor modeling.” DOI: 10.1214/09-AOAS261SUPPA, 10.1214/09-AOAS261SUPPB.

1694 MERL, CHEN, CHI AND WEST
MILLER, L., SMEDS, J., GEORGE, J., VEGA, V., VERGARA, L., PLONER, A., PAWITAN, Y.,HALL, P., KLAAR, S., LIU, E. and BERGH, J. (2005). An expression signature for p53 sta-tus in human breast cancer predicts mutation status, transcriptional effects, and patient survival.Proc. Natl. Acad. Sci. 102 13550–13555.
PAWITAN, Y., BJOHLE, J., AMLER, L., BORG, A., EGYHAZI, S., HALL, P., HAN, X., HOLMBERG,L., HUANG, F., SLAAR, S., LIU, E., MILLER, M., NORDGREN, H., PLONER, A., SANDELIN,K., SHAW, P., SMEDS, J., SKOOG, L., WEDREN, S. and BERGH, J. (2005). Gene expressionprofiling spares early breast cancer patients from adjuvant therapy: Derived and validated in twopopulation-based cohorts. Breast Cancer Research 7 R953–R964.
PITTMAN, J., HUANG, E., DRESSMAN, H., HORNG, C., CHENG, S., TSOU, M., CHEN, C., BILD,A., IVERSEN, E., HUANG, A., NEVINS, J. and WEST, M. (2004). Integrated modeling of clinicaland gene expression information for personalized prediction of disease outcomes. Proc. Natl.Acad. Sci. 101 8431–8436.
SEO, D., GOLDSCHMIDT-CLERMONT, P. and WEST, M. (2007). Of mice and men: Sparse statisticalmodelling in cardiovascular genomics. Ann. Appl. Statist. 1 152–178. MR2393845
SOTIRIOU, C., WIRAPATI, P., LOI, S., HARRIS, A., FOX, S., SMEDS, J., NORDGREN, H.,FARMER, P., PRAZ, V., HAIBE-KAINS, B., DESMEDT, C., LARSIMONT, D., CARDOSO, F.,PETERSE, H., NUYTEN, D., BUYSE, M., VAN DE VIJVER, M., BERGH, J., PICCART, M. andDELORENZI, M. (2006). Gene expression profiling in breast cancer: Understanding the molec-ular basis of histologic grade to improve prognosis. Journal of the National Cancer Institute 98262–272.
UNWIN, R., CRAVEN, R., HARNDEN, P., HANRAHAN, S., TOTTY, N., KNOWLES, M., EARD-LEY, I., SELBY, P. and BANKS, R. (2003). Proteomic changes in renal cancer and co-ordinatedemonstration of both the glycolytic and mitochondrial aspects of the warburg effect. Proteomics3 1620–1632.
WANG, Q., CARVALHO, C., LUCAS, J. and WEST, M. (2007). BFRM: Bayesian factor regressionmodelling. Bulletin of the International Society for Bayesian Analysis 14 4–5.
WEST, M. (2003). Bayesian factor regression models in the “large p, small n” paradigm. In BayesianStatistics 7 (J. Bernardo, M. Bayarri, J. Berger, A. Dawid, D. Heckerman, A. Smith and M. West,eds.) 723–732. Oxford Univ. Press. MR2003537
WEST, M., BLANCHETTE, C., DRESSMAN, H., HUANG, E., ISHIDA, S., SPANG, R., ZUZAN, H.,MARKS, J. and NEVINS, J. (2001). Predicting the clinical status of human breast cancer utilizinggene expression profiles. Proc. Natl. Acad. Sci. 98 11462–11467.
D. MERL
DEPARTMENT OF STATISTICAL SCIENCE
DUKE UNIVERSITY
DURHAM, NORTH CAROLINA 27708-0251USAE-MAIL: [email protected]
J. L.-Y. CHEN
J.-T. CHI
DEPARTMENT OF MOLECULAR GENETICS
& MICROBIOLOGY
INSTITUTE FOR GENOME SCIENCES AND POLICY
DUKE UNIVERSITY MEDICAL CENTER
BOX 3382DURHAM, NORTH CAROLINA 27710-3382USAE-MAIL: [email protected]
M. WEST
DEPARTMENT OF STATISTICAL SCIENCE
INSTITUTE FOR GENOME SCIENCES AND POLICY
DUKE UNIVERSITY
DURHAM, NORTH CAROLINA 27708-0251USAE-MAIL: [email protected]