Embed Size (px)
Citation preview

An integrated techno-economic, environmental and social assessment of the solar thermochemical fuel pathway
Christoph Falter*a, Antonio Valenteb,c,§ , Antoine Habersetzera, Diego Iribarrenb, Javier Dufourb,c
a. Bauhaus Luftfahrt, Willy -Messerschmitt-Str. 1, 82024 Taufkirchen, Germany. b. IMDEA Energy - Systems Analysis Unit, 28935 Móstoles, Spain. c. Chemical and Environmental Engineering Group, Rey Juan Carlos University, 28933 Móstoles, Spain §Current address: Department of Chemistry and Applied Biosciences, Institute for Chemical and Bioengineering, ETH Zurich, Vlad imir-Prelog-Weg 1, 8093 Zurich,
Switzerland
Supplementary Information
Computational model of the thermochemical redox cycle
The computational model used for the calculation of the energy balance of the thermochemical redox reaction is based on the
work performed in Falter et al. 1. The following values2 are assigned to the parameters to achieve the proposed efficiency of 19%
(excluding the energy for vacuum pumping and gas separation).
Table S.1 Parameter values for thermochemical redox cycle.
Parameter Value Unit
Concentration ratio 5000 -
Oxidation temperature 1000 K
Reduction temperature 1900 K
Efficiency gas heat recuperation 0.7 -
Efficiency solid heat recuperation 0.7 -
Reduction pressure 1100 Pa
Oxidation pressure 1.013×10⁵ Pa
Efficiency CO2 conversion 0.5 -
Optimisation of reactor efficiency with respect to reduction pressure
The reduction pressure of the reactor is varied to maximise energy conversion efficiency (Figure S.1).
Figure S.1 Optimization of reactor efficiency with respect to reduction pressure.
1,96
1,98
2,00
2,02
2,04
2,06
250 750 1250 1750 2250
Jet
fuel
pro
du
ctio
n c
ost
s [€
/L]
Reduction pressure [Pa]
Electronic Supplementary Material (ESI) for Sustainable Energy & Fuels.This journal is © The Royal Society of Chemistry 2020
2 |
Additional economic information
Table S.2 Financial assumptions for different countries.
Country Inflation [%]a Debt interest rate [%]b Equity interest rate [%]c Nominal weighted av.
cost of capital [%]d
Morocco 1.24 5.70 11.78 8.13
USA 1.32 4.05 8.20 5.71
Spain 0.52 2.20 8.88 4.87
Australia 1.96 5.27 7.70 6.24
Chile 3.32 4.58 10.78 7.06
South Africa 5.62 10.39 17.12 13.08
a The interest rates are the average of the years 2013-2017 and are taken from the World Bank3.
b The debt interest rates are bank prime lending rates from the IMF4.
c The equity interest rates are the sum of government bond yields and equity risk premiums, taken from 5,6 and Damodoran7.
d The nominal weighted average cost of capital is derived from the debt (d) and equity (e) interest rates as follows: WACC(nom)=0.6×d+0.4×e.
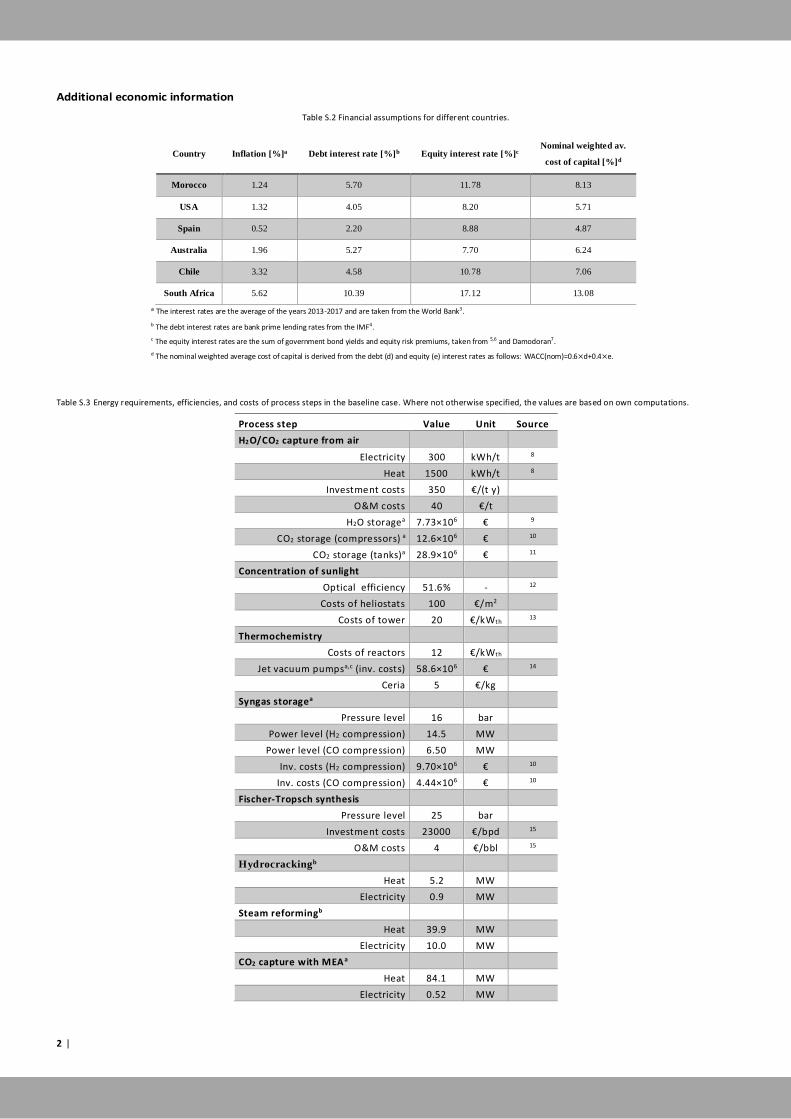
Table S.3 Energy requirements, efficiencies, and costs of process steps in the baseline case. Where not otherwise specified, the values are based on own computations.
Process step Value Unit Source
H2O/CO2 capture from air
Electricity 300 kWh/t 8
Heat 1500 kWh/t 8
Investment costs 350 €/(t y)
O&M costs 40 €/t
H2O storagea 7.73×10⁶ € 9
CO2 storage (compressors) a 12.6×10⁶ € 10
CO2 storage (tanks)a 28.9×10⁶ € 11
Concentration of sunlight
Optical efficiency 51.6% - 12
Costs of heliostats 100 €/m2
Costs of tower 20 €/kWth 13
Thermochemistry
Costs of reactors 12 €/kWth
Jet vacuum pumpsa,c (inv. costs) 58.6×10⁶ € 14
Ceria 5 €/kg
Syngas storagea
Pressure level 16 bar
Power level (H2 compression) 14.5 MW
Power level (CO compression) 6.50 MW
Inv. costs (H2 compression) 9.70×10⁶ € 10
Inv. costs (CO compression) 4.44×10⁶ € 10
Fischer-Tropsch synthesis
Pressure level 25 bar
Investment costs 23000 €/bpd 15
O&M costs 4 €/bbl 15
Hydrocrackingb
Heat 5.2 MW
Electricity 0.9 MW
Steam reformingb
Heat 39.9 MW
Electricity 10.0 MW
CO2 capture with MEA a
Heat 84.1 MW
Electricity 0.52 MW

| 3
Water input 1.34 L/FU
Investment costs 12.9×10⁶ € 16
Product pipelinea
Investment costs 90 €/m 17
Ship transport
Unit cost 8×10⁻³ €/L 18
Labour costs
Number of managers 5
Number of engineers 30
Number of clerks 15
Number of technicians 100
Number of workers 246
Salary of managers 13890 $/y 19
Salary of engineers 7746 $/y 19
Salary of clerks 3869 $/y 19
Salary of technicians 5646 $/y 19
Salary of workers 3839 $/y 19 a The associated O&M costs are 5% of the investment costs .
b The associated costs are assumed to be included in the cost of FT.
c The O&M costs are included in the labour costs.
Table S.4 Cost estimate of solar thermochemical reactors.
Single reactor unit at 50 kW capacity Cost [$]
Shell / pressure vessel 6,500 Piping 1,000 Insulation 15,000 Flange and front 6,500 Window 500
Window Mount 1,000 Active radiation shield 2,500 Mounting/structure 3,000 Misc. hardware 1,000 Equipment: vacs 10,000 Equipment: valves 1,000 Equipment: sensing 2,000 Equipment: control 5,000
Total cost 55,000 Unit cost per kW (single reactor) 1100 $ Unit cost per kW (at GW-scale with scaling factor 0.6) 12 €

4 |
Additional information regarding the social assessment
Table S.5 Specific social risk levels for the country-specific sectors involved in the baseline case.
Country PSILCA sector Child
labour Forced labour
Health expenditure
Used for
Morocco (MA) Electricity, gas and water supply Low Low High Working hours at the fuel plant
Morocco (MA) Maintenance and repair Low Low High O&M (solar field, CO2 and H2O) Morocco (MA) Construction Low Low High Buildings
Spain (ES) Electrical machineries and apparatus No Very low Low Heliostats
Spain (ES) Electric machinery and material No Very low Low Cables
Spain (ES) Construction No Very low Low Pedestal
Spain (ES) Other services and activities No Very low Low Overhead
Spain (ES) Manufacture of fabricated metal products No Very low Low Gear drive Spain (ES) Manufacture of glass and glass products No Very low Low Mirrors
China (CN) Metal products High Very low Medium Pipelines
China (CN) Chemicals for special usages High Very low Medium Ceria
Czech Republic (CZ) Machinery and equipment No Low Medium Compressors
India (IN) Manufacture of fabricated metal products Very low High High Gas separator USA Power boilers and heat exchangers No Very low Medium Reactors
France (FR) Machinery and equipment No Very low Low O&M (syngas storage, valves,
pump); vacuum pumps
Portugal (PT) Manufacture of basic metals Low Very low Medium Steel (mix)
Turkey (TR) Manufacture of basic metals Low Low Medium Steel (mix)
USA Other industrial machinery manufacturing No Very low Very low CO2 capture
China (CN) Other general industrial machinery High Very low Medium Valves, checks
Germany (DE) Basic ferrous metals No Very low Low Steel (mix) France (FR) Manufacture of basic metals No Very low Low Steel (mix)
Italy (IT) Manufacture of basic metals No Very low Medium Steel (mix)
Germany (DE) Communication and electronic equipment No Very low Low Motor
China (CN) Non-metal minerals and other mining High Very low Medium Cerium mining
Table S.6 Social life-cycle profile of the jet fuel when considering alternative locations of the solar jet fuel plant (values in mrh per litre of jet fuel).
Country Child labour Forced labour Health expenditure
Morocco
(baseline) 1.08×10⁻¹ 1.30×10⁻² 3.03×10⁹
Spain 1.27×10⁻¹ 5.49×10⁻⁴ 8.92×10⁻²
USA 1.39×10⁻¹ 5.48×10⁻⁴ 1.10×10⁻¹
Australia 2.52×10⁻¹ 4.59×10⁻⁴ 9.95×10⁻²
Chile 3.22×10⁻¹ 8.58×10⁻⁴ 2.43×10⁻¹
South Africa 6.17 6.42×10⁻³ 2.42×10⁻¹
| 5
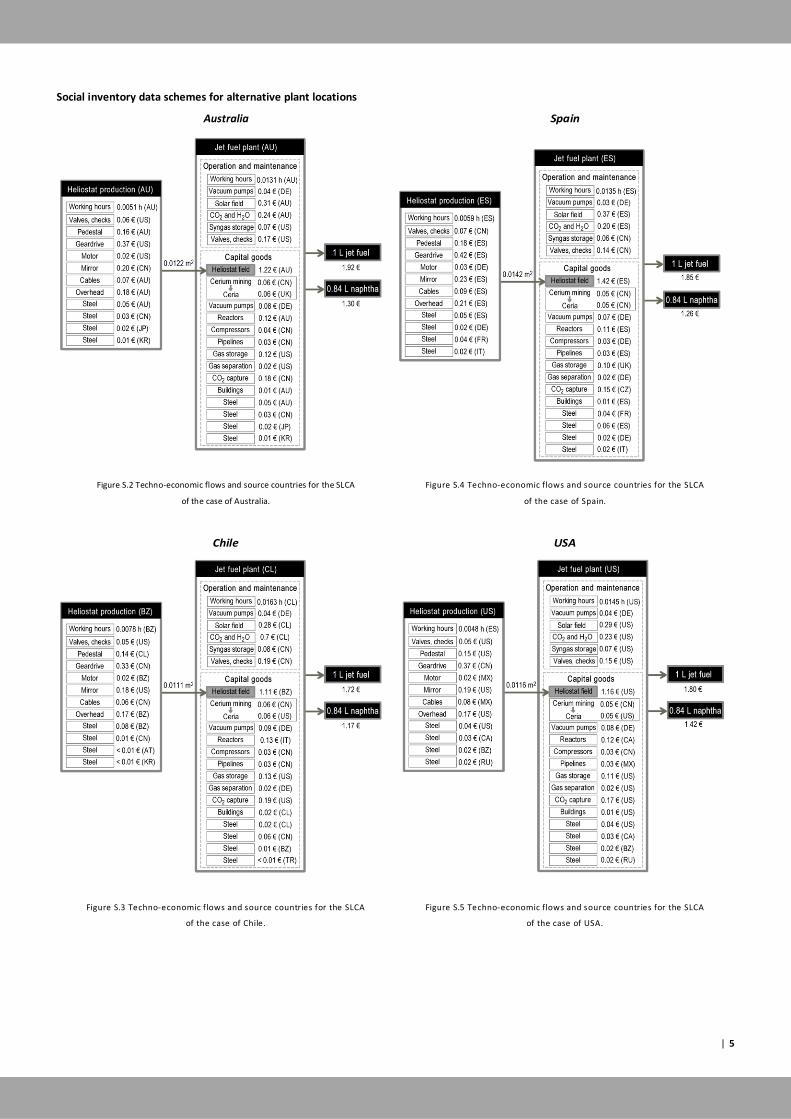
Social inventory data schemes for alternative plant locations
Australia
Spain
Figure S.2 Techno-economic flows and source countries for the SLCA
of the case of Australia.
Figure S.4 Techno-economic flows and source countries for the SLCA
of the case of Spain.
Chile
USA
Figure S.3 Techno-economic flows and source countries for the SLCA
of the case of Chile.
Figure S.5 Techno-economic flows and source countries for the SLCA
of the case of USA.
6 |
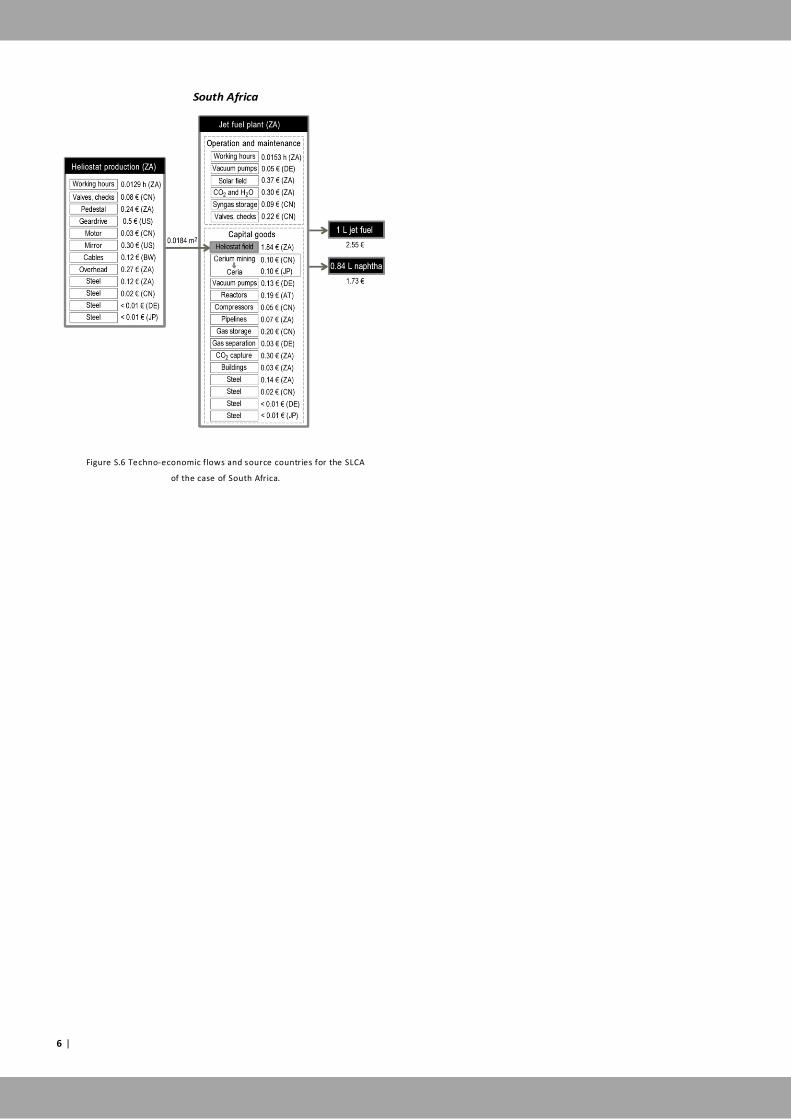
South Africa
Figure S.6 Techno-economic flows and source countries for the SLCA
of the case of South Africa.

| 7
Aspen model for the simulation of syngas conversion
In the following, the computational Aspen Plus model for the derivation of mass and energy balances of the syngas-to-fuel
conversion is shown.
Process diagram for whole plant
CO2 separation with monoethanolamine (MEA)
As only half of the CO2 entering the solar thermochemical reactor is converted into CO, CO2 has to be separated from the syngas
to reduce its partial pressure in the FT reactor. This is done via chemical absorption with monoethanolamine.
Fischer-Tropsch conversion
The syngas, having been cleaned from CO2, is sent to the Fischer-Tropsch reactor (25 bar; H2/CO feed ratio of 1.7), where
hydrocarbon chains of different length are assembled. The light fractions are subsequently separated via flash distillation.
The model behind this step is based on the kinetic model in Visconti and Mascellaro 2013 20.
Figure S.7 Process model of syngas-to-fuels conversion. CO2 capture reduces the share of CO2 in the gas mixture (H2+CO+CO2). The Fischer-Tropsch synthesis produces hydrocarbons
of different chain lengths in the gaseous, liquid, and waxy regime, where the gaseous fraction is steam reformed back into syngas.
Figure S.8 Process model for CO2 capture with MEA.
CO2 capture
Fischer-Tropsch Refining
Reforming
Syngas
Tailgas
(C1-C4)
Syngas
Syngas
Kerosene
Naphtha
MEA+CO2
MEA
MEA+CO2
MEA
S1(OUT)
CO2OUT(OUT)
(fresh amine)
CO2 absorber
CO2 stripper and amine recovery
(CO2 recycle)
(CO2 - depleted SYNGAS)
Syngas from
reactor
MEA
Figure S.9 Process model for Fischer-Tropsch conversion. The syngas entering the compression has been subject to CO2 removal. The FT synthesis operates at a pressure of 25
bar and a temperature of about 220°C. The tailgas is composed of the gaseous fraction of hydrocarbons produced.
FT synthesis Tailgas to reformer
Liquids
TAILGAS(OUT)
FTPROD(OUT)
Syngas

8 |
Refining
The FT synthesis is carried out at low temperature using a Co-based catalyst to create long-chained hydrocarbons. To receive the
desired regime of C8-C16, the hydrocarbons need to be cut to shorter lengths via hydrocracking. At first, water is separated from
the FT liquids, which are then sent to a first flash separator to remove light fractions. In the hydrocracker, the long-chained
hydrocarbons are cut to shorter lengths with hydrogen at elevated pressure and temperature. Further separation steps separate
the jet fuel from naphtha and tail gas.
Reforming
The gaseous fraction from the hydrocracker is reformed with steam to syngas, which is then fed back into the process to increase
the conversion of syngas to fuels. In the steam reformer, syngas is produced from the tail gas of the hydrocracker and water. The
syngas is then cleaned and compressed to be fed back into the system before the FT synthesis.
Figure S.10 Process model for the refining of FT liquids. The liquids are composed of hydrocarbons with a chain length of >C5 and water, which is removed. A flash distillation
separates hydrocarbons into different chain lengths, where the longer fractions are cracked into shorter lengths with H2. The resulting liquid mixture is then separated into its
kerosene and naphtha fractions, and a gaseous fraction that returns to the steam reformer.
Kerosene Water
FT liquids
H2
Separation
Separation
Tailgas to
reformer
Hydrocracking
Naphtha
Figure S.11 Process model for steam reforming of light hydrocarbons.
H2O
Reformer
Tailgas from hydrocracker
Separation
Compression
Separation
Syngas

| 9
Additional environmental life-cycle indicators
Table S.7 presents an additional set of environmental life-cycle indicators that complement the assessment of the environmental
performance of the fuel pathway. The chosen method is ReCiPe 2016.
Table S.7 Additional environmental life-cycle indicators.
Indicator Solar fuel Conv. Fuel Unit
Stratospheric ozone
depletion 7.23x10⁻⁷ 1.28 x10⁻⁶
kg CFC-
11 eq.
Fine particulate matter
formation 4.47x10⁻³ 2.25x10⁻³
kg PM
2.5 eq.
Terrestrial acidification 1.15x10⁻² 6.43x10⁻³
kg SO2
eq.
Fossil depletion 0.399 1.74 kg oil eq.
Fresh water
consumption 2.31x10⁻² 8.50x10⁻³ m3
Human toxicity, cancer
1.31x10⁻⁶ 5.40x10⁻⁸ DALY
Human toxicity, non-
cancer
1.66x10⁻⁶ 1.16x10⁻⁷ DALY
Climate change human
Health, default, excl.
biogenic carbon
-3.04x10⁻⁶ 6.89x10⁻⁷ DALY
References
1 C. P. Falter and R. Pitz-Paal, Sol. Energy, 2017, 144, 569–579.
2 C. Falter, A. Sizmann and R. Pitz-Paal, in AIP Conference Proceedings, 2017, vol. 1850.
3 Worldbank, Inflation, consumer prices (annual %).
4 IMF, Lending rates, Percent per annum.
5 Trading Economics, Government Bond yields.
6 World Government Bonds, 10 Year Bond Yields, http://www.worldgovernmentbonds.com/, (accessed 8 October 2019).
7 A. Damodoran, Estimated Country Risk Premiums.
8 Climeworks LLC., CO2 air capture demonstration plant, http://www.climeworks.com/co2-capture-plants.html, (accessed 1 June
2014).
9 G. Wernet, C. Bauer, B. Steubing, J. Reinhard and B. Moreno-Ruiz, E., Weidema, Int. J. Life Cycle Assess., 2016, [online] 2, 1218–
1230.
10 S. T. McCoy, Diss. Carnegie Mellon Univ.
11 B. D. James, C. Houchins, J. M. Huya-Kouadio and D. A. Desantis, 2016, 1–54.
12 Sargent&Lundy, Assessment of Parabolic Trough and Power Tower Solar Technology; SL-5641, Chicago, IL, USA, 2003.
13 T. R. Mancini, J. A. Gary, G. J. Kolb and C. K. Ho, Power Tower Technology Roadmap and Cost Reduction Plan., Albuquerque, NM,
and Livermore, CA (United States), 2011.
14 S. Brendelberger, H. von Storch, B. Bulfin and C. Sattler, Sol. Energy, 2017, 141, 91–102.
15 Velocys, 2013.
16 J. Kim, T. a. Johnson, J. E. Miller, E. B. Stechel and C. T. Maravelias, Energy Environ. Sci., 2012, 5, 8417.
17 M. S. Peters, K. D. Timmerhaus and R. E. West, Plant Design and Economics for Chemical Engineers, 2003.
18 US Department of Transportation, Average Freight Revenue,
https://www.bts.gov/archive/publications/national_transportation_statistics/2000/3-17, (accessed 18 January 2019).
19 ILO, Mean nominal monthly earnings of employees by sex and occupation-- Harmonized series.
20 C. G. Visconti and M. Mascellaro, Catal. Today, 2013, 214, 61–73.