Embed Size (px)
Citation preview

`
An Overview
An Integrated Supply Chain Solutions Provider
March 2016

Business & Management
Financial Summary
Risk Management
2

Corporate Overview
Commenced distribution operations in India in 1993
Evolved into Supply chain Solutions Provider (traditional cash and carry model to management of inventory)
~ Distribution Channel spans across India, South Asia, Middle East, Africa & Turkey ~ Distributes over 200 brands of Global repute ~ Post sales support services – 360+ service centres in India, MEA & Singapore.
~ 2nd largest distributor of IT & Non -IT Brands in India (30,600 + Channel Partners) ~ The largest in Middle East, Africa & Turkey (11,000+ Channel partners)
3

Redington’s Supply Chain
4

5
Supply Chain
Value in Supply Chain

Competitive landscape
Global Players
~ Ingram Micro and Avnet present among Global Players
~ Redington and Ingram Micro of similar size;
~ Other smaller regional players include: Savex, Compuage, Rashi Peripherals
~ Ingram Micro and Arrow present in Middle East.
~ Local distributors such as BDL, Metra, Logicom are present in ME. ~ Arrow acquired Computer links in Middle East
~ Index (Listed in ISE) is the largest distributor in Turkey
~ Ingram Micro acquired Armada in Turkey.
Middle East , Africa & Turkey
Indian Market
~ Ingram Micro
~ Tech Data
~ Synnex
~ Avnet
6

7
9MCY15 [JAN - SEP]
Particulars Redington Ingram Micro Synnex Tech Tech data
Total revenue in US$ Mn 3,807 31,711 7,205 18,899
GM% 6.1% 6.1% 4.1% 5.0%
SG&A% 3.8% 5.5% 2.2% 3.6%
EBIT% 2.3% 0.6% 1.9% 1.4%
PAT% 1.3% 0.2% 1.5% 0.9%
Working capital days 53 25 56 21
FY15 FY 14 FY 13 FY 12 FY 15 FY 14 FY 13
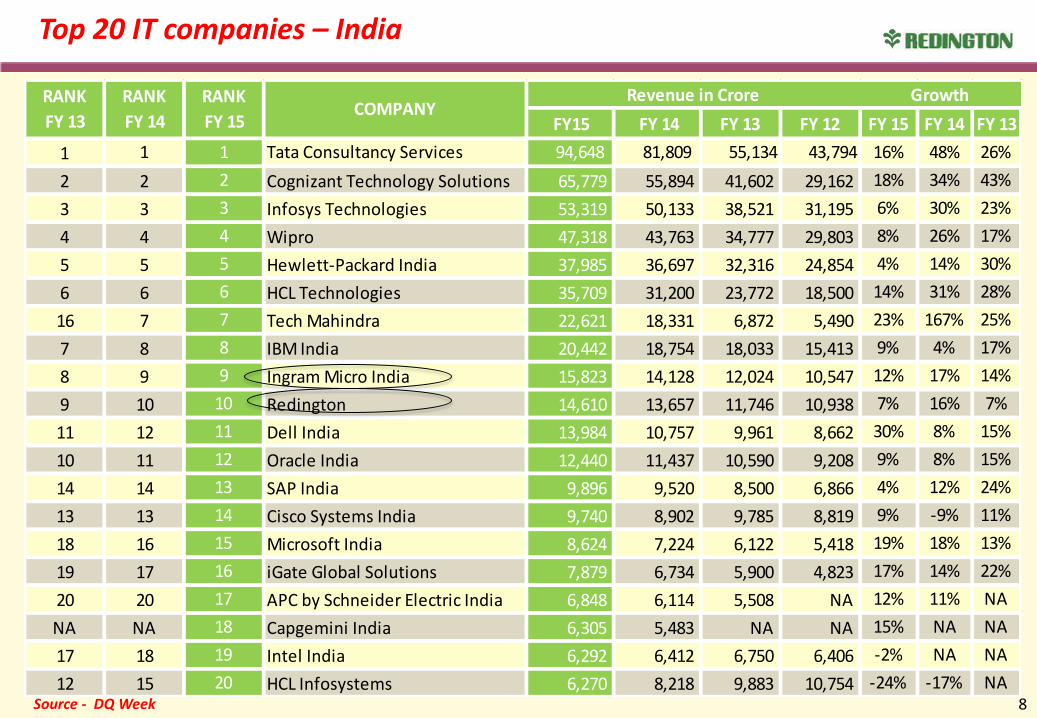
1 1 1 Tata Consultancy Services 94,648 81,809 55,134 43,794 16% 48% 26%
2 2 2 Cognizant Technology Solutions 65,779 55,894 41,602 29,162 18% 34% 43%
3 3 3 Infosys Technologies 53,319 50,133 38,521 31,195 6% 30% 23%
4 4 4 Wipro 47,318 43,763 34,777 29,803 8% 26% 17%
5 5 5 Hewlett-Packard India 37,985 36,697 32,316 24,854 4% 14% 30%
6 6 6 HCL Technologies 35,709 31,200 23,772 18,500 14% 31% 28%
16 7 7 Tech Mahindra 22,621 18,331 6,872 5,490 23% 167% 25%
7 8 8 IBM India 20,442 18,754 18,033 15,413 9% 4% 17%
8 9 9 Ingram Micro India 15,823 14,128 12,024 10,547 12% 17% 14%
9 10 10 Redington 14,610 13,657 11,746 10,938 7% 16% 7%
11 12 11 Dell India 13,984 10,757 9,961 8,662 30% 8% 15%
10 11 12 Oracle India 12,440 11,437 10,590 9,208 9% 8% 15%
14 14 13 SAP India 9,896 9,520 8,500 6,866 4% 12% 24%
13 13 14 Cisco Systems India 9,740 8,902 9,785 8,819 9% -9% 11%
18 16 15 Microsoft India 8,624 7,224 6,122 5,418 19% 18% 13%
19 17 16 iGate Global Solutions 7,879 6,734 5,900 4,823 17% 14% 22%
20 20 17 APC by Schneider Electric India 6,848 6,114 5,508 NA 12% 11% NA
NA NA 18 Capgemini India 6,305 5,483 NA NA 15% NA NA
17 18 19 Intel India 6,292 6,412 6,750 6,406 -2% NA NA
12 15 20 HCL Infosystems 6,270 8,218 9,883 10,754 -24% -17% NA
Revenue in Crore GrowthRANK
FY 13
RANK
FY 14
RANK
FY 15COMPANY
8
Top 20 IT companies – India
Source - DQ Week

RANK COMPANY REVENUE
FY15
REVENUE
FY14
REVENUE
FY13RANK COMPANY
REVENUE
FY15
REVENUE
FY14
REVENUE
FY13
1 Ingram Micro 15,823 14,128 12,024 26 Sakri IT Solutions 230 180 145
2 Redington 14,610 13,657 11,746 27 Datamation Services 228 228 225
3 HCL Infosystems 6,239 7,267 9,885 28 Savera Marketing Technologies 225 182 157
4 Savex Computers 5,980 5,678 4,681 29 Sogo Computers 220 330 300
5 Rashi Perpherals 2,980 2,180 1,765 30 Alco Infotech 215 185 165
6 IRIS Computers 2,723 1,893 1,605 31 Comexcell Technologies 200 190 185
7 Compuage Infocom 2,129 2,275 1,961 32 Elcom trading 199 176 158
8 Supertron Electronics 1,975 1,575 1,408 33 Creative peripherals and distribution 184 140 127
9 Neoteric Informatic 1,606 1,501 1,624 34 Supreme Technologies 178 156 140
10 Global Infonet 1,237 1,105 934 35 RX Infotech 171 155 131
11 Datacare Corp 600 500 400 36 Mega Compu World 168 140 125
12 Fortune Marketing 560 508 552 37 Aegis Infoware 165 165 151
13 Mediaman Infotech 438 325 321 38 Supreme Computers 164 178 188
14 Ample Technologies 400 300 250 39 Modi Infosol 160 180 150
15 Balaji Solutions 392 308 251 40 Park Network 150 150 116
16 Technocrat Infotec 350 324 303 41 Galaxy computech 129 109 102
17 Compage Computers 350 370 370 42 Peripherals engineers 125 123 105
18 Roop Technologies 348 270 263 43 Aldous Glare Trade and Export 120 110 159
19 Eastern Logica 310 250 210 44 Suntronic systems 120 125 110
20 Lalani Infotech 300 260 240 45 Sujatha Computers 110 100 120
21 Maxtron Electronics 289 365 360 46 SV Electronics 105 125 140
22 Agmetal India 280 207 221 47 Champion computers 98 86 73
23 PacifiC Infotel 241 232 195 48 Microcare Computers 95 126 77
24 Vishal Peripherals 236 185 158 49 Saboo Computers 91 95 75
25 Swetha Computers and peripherals 230 250 200 50 Aarvee computers 91 84 89
9
Top 50 IT distributors – India
Source - DQ Channels
Revenue in Crore

Company Position 2014 2013 Auditor Staff
Redington Gulf FZE Same $2.62bn $ 2.32bn Deloitte & Touché 1,750
BDL Group Same $ 903m $ 770M Dr. Usaama Tabbara 322
Metra Computer FZCO Same $ 830m $ 723m Ernst & Young 800
Global Distribution FZE $ 607.99m $ 464m Moore Stephans 120
Logicom Group Middle East $ 575m $ 510m KPMG 325
FDC International FZE $ 571m $ 465m Puthran Chartered Acc 141
Almasa IT Distribution Same $ 410m $ 370m Deloitte & Touche 225
Mitsumi Distribution Same $ 390m $ 320m PKF 205
Mindware FZ LCC Same $ 328m $ 240.7m Deloitte & Touche 145
Asbis Middle East FZCO Same $ 229m $ 231.9m KPMG 87
Westcon ME Group Same $ 207m $ 181m Deloitte & Touche 165
Golden Systems Middle East New Entry $ 177m NA Salim Rajkutwala 80
Al-Jammaz Distribution $ 160m $ 125m AlHoshan 180
Gulf Shadow Computer Systems $ 156m $ 135m Awni Farsakh & Co., 135
Prologix Distribution $ 153m $ 100.2m Morrison Menon 200
Trigon LLC $ 150m $ 168.5m KPMG 102
Despec MERA FZE $ 124.8m $ 140.9m KPMG 75
10
Top 15 IT distributor - MIDDLE EAST
Source – Channel Middle East

Redington – Strong Brand Recall
~ Only company with distribution (110+Warehouses) and Service Network (360+ Service centres)
~ India ~ Middle East & Africa
~ 200 leading Brands in distribution ~ 115 leading brands in services
~ People power of 7,100+
Customer Centric Differentiating
Service
Sustained Leadership
Position
Vendor Centric Business
Relationships
Strong & Loyal Management
REDINGTON
11

Wide pan-India presence
125 brands… Brand Categories IT- Peripherals, PCs , PC components, UPS, Networking products, Packaged software, Storage products, High- end servers Non-IT- Telecom devices, Consumer durables, Digital printing press, Tablets & Gaming consoles.
Distribution / Service Network
12
30,676 56 91* 71 241
Channel Partners
Sales Offices
Warehouses Service Centres
Partner Centres
* Including 2 ADCs

India - VAT Structure
Import Duty
Mumbai
VAT
LBT
13
~ Multiple Tax structures across different provinces
~ Single / Uniform VAT (GST)
will bring competitive advantage to Redington.

GST – Proposed framework
14
Coverage
Framework
Rate
Credit
• Excise duties / Service tax / CVD / SAD • VAT / Entry tax / Purchase tax / Entertainment tax / Luxury tax • Cesses & Surcharges on supply of goods & services
• Dual GST for Centre and States, IGST on inter-state transactions • Additional 1% tax on inter-state supply of goods, not eligible for set-
off • Separate legislation, levy & administration • Place of Supply Rules for determining ‘situs’ of services and goods
• Varying rates proposed, no final consensus yet • Concessional rate for select goods (not for services)? • Free credit flow - No cross credit between CGST & SGST
• Order of Utilization: IGST = IGST, CGST, SGST SGST = SGST, IGST CGST = CGST, IGST

Benefits of GST
15
GST
Credit Fungibility
Focus on Business
Simplified Compliance
No Tax
Cascading
Uniformity
Simple Tax Structure
GST is neutral to factors of production, business processes, business models, organizational structures and geographical
locations

Benefits of GST to Redington
16
• Ambiguity in classification as ‘goods’ or ‘service’ made irrelevant, being a common goods and services tax
• Credit fungibility across the board reducing the cascading effect of taxes on inventory cost
• Ease of administrative compliance thru’ simplified tax structure and unified returns and payments process
• Ease of movement of material pan-India thru’ elimination of entry taxes / octroi / multitude of forms
• Possibility for consolidation of warehouses provided there is clarity on the 1% additional tax on inter-state movement of goods

META Presence
100+ Brands…. Brand categories IT - Peripherals, PCs , PC components, UPS, Networking products, Packaged software, Storage products, High- end servers Non-IT- Mobile handsets, Tablets
Distribution / Service Network
17
11,000 21 27 24* 26 22
Channel Partners
No of countries Present
Sales Offices
Warehouses Service Centres
Partner Centres
* Including 1 ADC

Longstanding Vendor Relationships
18

Growth Strategy
19
BY ADDING - :
“ - BRANDS”
Apple, Samsung (2012)
Oracle (2013) Motorola (2014)
“ – PENETRATED NEW PRODUCT CATEGORIES” Digital Printing
Press (2005)
Smartphones (2008)
Tablets (2011)
3D Printers (2012)
“- FORAYED INTO NEW BUSINESS” 3PL Logistics
(2008)
Cloud services (2015)
“- EXPANDED INTO NEW MARKETS” Turkey (2010)
Kazakhstan (2011)

Acquired Land in
~ Chennai - 11.56 acres
~ Kolkata - 13.76 acres
~ New Delhi - 13.32 acres
~ Mumbai - in process
• Chennai ADC operational since July 2009
• Kolkata ADC is Operational since Feb 2014.
• Delhi ADC : Land approval in final stages.
• Intention to build a network of warehouses
Logistics Facilities – India
CHENNAI
KOLKATA
20

Logistics Facilities - Gulf
21
Long Lease
~ Dubai - 5.16 acres
Dubai ADC operational since Sep 2010

ProConnect Customers
22

Ensure Support Services
End to End Support Capabilities - Single Point of Contact for all service needs
Technical Call Center
Bench & on-site support,
Warehousing, forward & reverse logistics,
Re-exports,
No Fault Found (NFF) validations,
Business specific CRM & SCM support and integration with customers’ global systems
Diverse business verticals
Warranty – IT & Telecom products
Annual Maintenance Contracts
Infrastructure Management Services
Spare Parts Logistics Support
Enterprise Product Support – Pre-sale, Professional and Support Services.
23

– 90% of the customer locations can be reached in 1 business day.
– 95+Owned Service centers and 260+ partner service centers
• Brands supported :
24
Ensure Support Services

Procurement Warehousing
Logistics & Procurement
Credit to
Resellers
After Sales Service
25
Inventory Risk Market Risk
Logistics Company
Services Company
Redington Value Chain

Redington – India
26
REDINGTON (INDIA) LIMITED
Nook Micro Distribution
Limited 100%
Cadensworth (India) Limited
100%
Ensure Support Services (India)
Limited 100%
ProConnect Supply Chain Solutions Ltd,
100%
Redington (India) Investment Ltd
47.6%
Currents Technology Retail
India Ltd 100%

Redington Gulf FZE, Dubai
100%
Redington - Overseas
27
^ Yet to commence operations
* Holding Beneficial ownership upto 100%
REDINGTON (INDIA) LIMITED
Redington International Mauritius Ltd,
Mauritius 100%
Redington Egypt Ltd,
Cairo, 100%
Redington Kenya Ltd (Nairobi)
100%
Redington Gulf and Co, LLC
(Oman) 70%
Redington Middle East LLC, Dubai
49%
Redington Africa
Distribution FZE, Dubai 100%
Cadensworth FZE , Dubai
100%
Redington Qatar WLL,
Qatar 49%
Redington Nigeria Ltd
(Lagos) 100%
Redington Qatar Distribution WLL, Qatar
49%
Redington Uganda Ltd,
Uganda 100%
Redington Rwanda Ltd,
Rwanda 100%
Redington Ltd, Ghana 100%
Redington Kenya EPZ Ltd, Kenya
100%
Redington Morocco Ltd ,
Morocco 100%
Cadensworth UAE LLC,
Dubai 49%
Redington Tanzania Ltd
Tanzania 100%
Africa Joint Technical
Services Libya, 65%
Redington Gulf FZE,
Iraq 100%
Redington Angola Ltd,
Angola 100%
Ensure Gulf FZE, Dubai
100%
ProConnect Supply chain Logistics
LLC, Dubai 49%
Ensure Services
Bahrain SPC, Bahrain 100%
Ensure IT Services (PTY)
Ltd, Johannesburg,
100%
Ensure Services Arabia LLC,
Saudi Arabia, 100%
Redington Kazakshtan
LLP, 100%
Redington Turkey Holdings
S.A.R.L , Luxembourg
100%
Arena International FZE, Dubai 100%
Sensonet Teknoloji Elelektronık , Turkey 99.8%
ADEO Bilisim Danismanlik, Turkey 51.0%
Ensure Solutions
Nigeria Ltd, 99.9%
Ensure Technical
Services Kenya Ltd, 100%
Ensure Middle East Trading LLC , UAE
49%
Ensure Services
Uganda Ltd, 99%
Ensure Ghana Ltd ,
Ghana 100%
Ensure Technical Services
Tanzania Ltd, 99%
Ensure Technical
Services PTY Ltd, South Africa
100%
Ensure Technical Services Morocco
Ltd, Morocco 100%
Ensure Digital FZ
LLC, Dubai 100%
Arena Bilgisayar Sanayi Ve
Ticaret Anonim Sirketi 49.4%
Redington Distribution Pvt Ltd, Singapore
100%
Redington Bangladesh Ltd,
Bangladesh 99%
Redington SL (Pvt) Ltd, Sri Lanka
100%
^
^
Redington Senegal
S.A.R.L, 100%
Redington Saudi Arabia Distribution
Co., 75%
Middle East Africa Turkey South Asia
Paynet Ödemet Hizmetleri A.Ş. 100%
^
CDW International Trading FZE,
100%
^
Linkplus Bilgisayar Sistemleri Sanayi Ve Ticaret AS, Turkey 70%
RNDC Alliance
West Africa Ltd,
100%

Management
Management with sound execution capabilities
Board of Directors
M.Raghunandan Whole - time Director
P.S. Neogi Joint Chief Operating Officer– IT Division, India
E.H.KasturiRangan Joint Chief Operating Officer – Non-IT Division,
India
Stephen Aranha
President – Service Division
S.V.Krishnan CFO
Aloysius Fernandes President – IT Volume Distribution
Africa
Raj Shankar Managing Director
Ramkumar B President– IT Value Added Distribution
ME & A
Jim Mathew VP – Telco Distribution
Africa
Ashish Bharti President – IT Volume Distribution
ME
Sriram Ganeshan CFO – ME & A
Sethuraman S Sr. VP – Support Services/Ensure Services
ME & A
28
Okay Nasir CEO – Arena, Turkey
Serkan Celik CFO – Arena, Turkey

Board of Directors
29 Proactive Board with significant global corporate experience
NON EXECUTIVE DIRECTORS EXECUTIVE DIRECTORS INDEPENDENT DIRECTORS
Mr.R.JAYACHANDRAN Ex.Chairman
Olam International, Singapore
Mr. RAJ SHANKAR Managing Director
PROF.RAMACHANDRAN BOC Professor of Business Policies
IIM, Bangalore
Mr. R. SRINIVASAN Vice Chairman
Mr. M. RAGHUNANDAN Whole Time Director
Mr. V. S. HARIHARAN Ex. Vice president
Hewlett-Packard, Singapore
Mr. TU, SHU-CHYUAN General Manager
Business Development Synnex Tech, Taiwan
Mr. KEITH WF BRADLEY Ex.President Ingram Micro
North America
Mr. LIN, TAI-YANG Director of Finance Planning and
Management Synnex Tech , Taiwan
Ms. SUCHITRA RAJAGOPALAN, Director Corporate Governance, Volvo UK
Mr. NAINESH JAISINGH MD & Global Co-Head
Standard Chartered Pvt Equity
Mr. N. SRINIVASAN Professional Director
Business & Management
Financial Summary
Risk Management
30
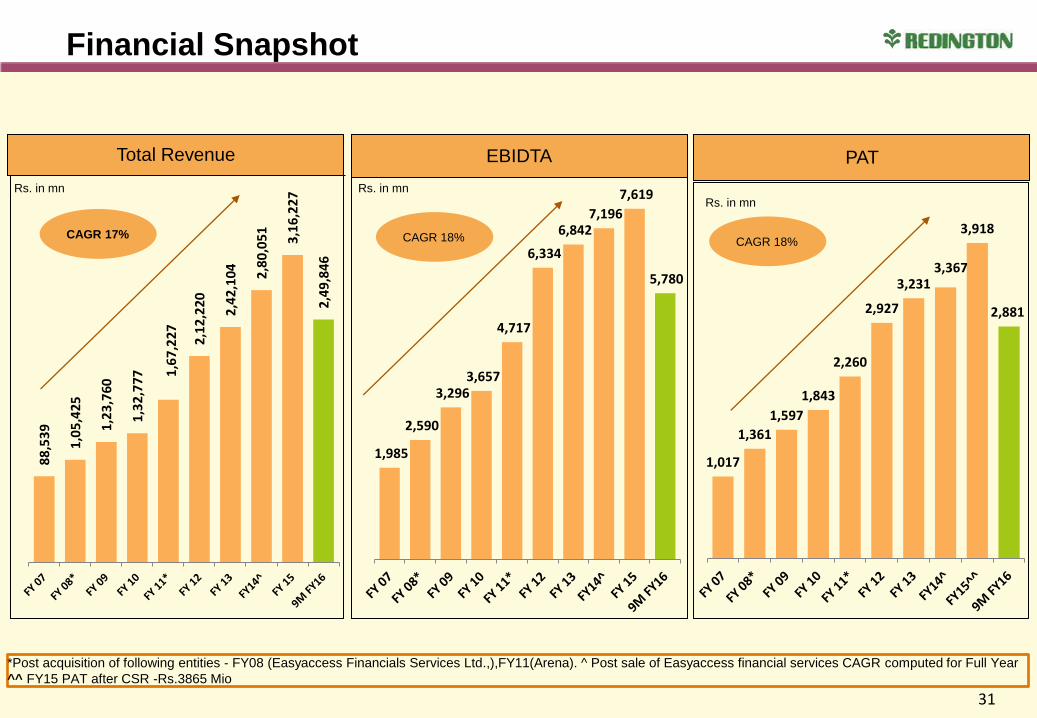
1,017
1,361
1,597
1,843
2,260
2,927
3,231 3,367
3,918
2,881
1,985
2,590
3,296 3,657
4,717
6,334
6,842 7,196
7,619
5,780
88
,53
9
1,0
5,4
25
1,2
3,7
60
1,3
2,7
77
1,6
7,2
27
2,1
2,2
20
2,4
2,1
04
2,8
0,0
51
3,1
6,2
27
2,4
9,8
46
Total Revenue
CAGR 17% CAGR 18% CAGR 18%
Rs. in mn Rs. in mn Rs. in mn
EBIDTA PAT
Financial Snapshot
31
*Post acquisition of following entities - FY08 (Easyaccess Financials Services Ltd.,),FY11(Arena). ^ Post sale of Easyaccess financial services CAGR computed for Full Year ^^ FY15 PAT after CSR -Rs.3865 Mio

Financial Snapshot (cont’d)
Earnings Per Share^^ (Rs.) Book Value per share (Rs.)
*Post Acquisition of following entities - FY08*( (Easyaccess Financials Services Ltd.,) FY11(Arena) ^ Post sale of Easyaccess financial services ^^ For EPS calculation - weighted average number of equity shares have been considered. For EPS & Book Value Calculation, the post split number of shares (From Rs.10/- to Rs.2/- per share )has been considered; EPS is for the period and not annualized.
3.1 3.5
4.1 4.7
5.7
7.4 8.1 8.4
9.8
7.2
0
2
4
6
8
10
12
16.1 18.5
25.7 27.4
31.7 33.2
39.5
48.8
57.6
66.4
0
10
20
30
40
50
60
70
32

Financial Snapshot (cont’d)
ROCE (%) ROE (%)
*Post acquisition of following entities - FY08 (Easyaccess Financials Services Ltd.,), FY11(Arena). ^ Post sale of Easyaccess financial services
18.2% 18.9% 18.5%
14.6%
16.0%
18.4% 17.7%
17.2% 17.2%
14.2%
0%
5%
10%
15%
20%
21.2% 21.7%
19.0% 17.7%
20.0%
23.9% 22.8%
19.1% 18.2%
15.4%
0%
5%
10%
15%
20%
25%
33
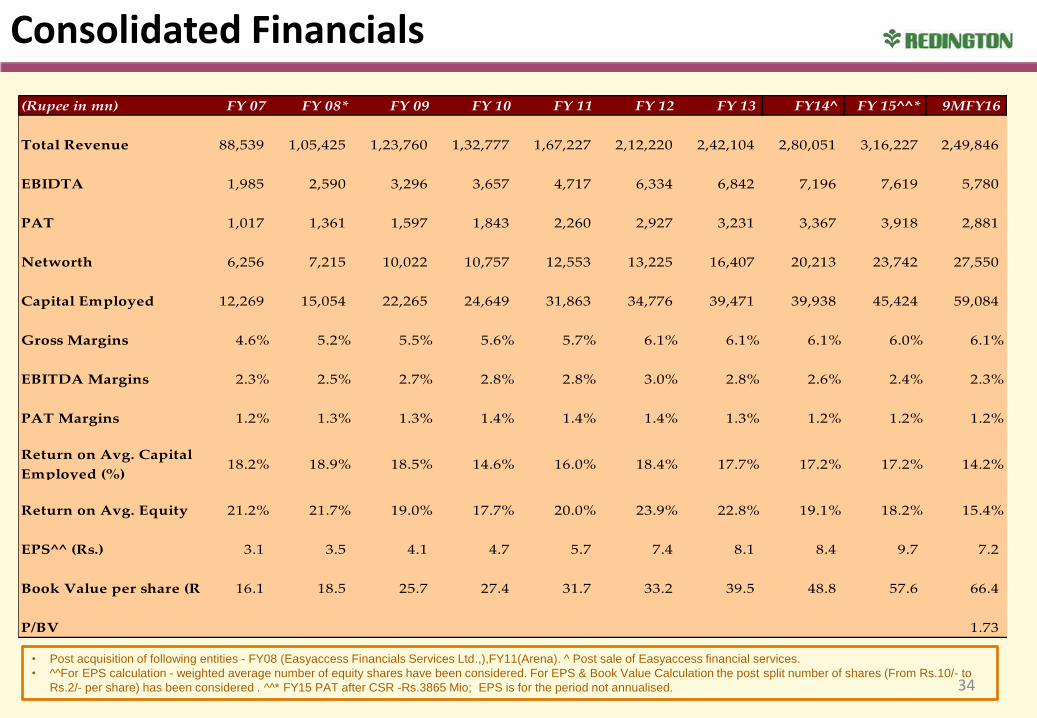
Consolidated Financials
34
• Post acquisition of following entities - FY08 (Easyaccess Financials Services Ltd.,),FY11(Arena). ^ Post sale of Easyaccess financial services. • ^^For EPS calculation - weighted average number of equity shares have been considered. For EPS & Book Value Calculation the post split number of shares (From Rs.10/- to
Rs.2/- per share) has been considered . ^^* FY15 PAT after CSR -Rs.3865 Mio; EPS is for the period not annualised.
(Rupee in mn) FY 07 FY 08* FY 09 FY 10 FY 11 FY 12 FY 13 FY14^ FY 15^^* 9MFY16
Total Revenue 88,539 1,05,425 1,23,760 1,32,777 1,67,227 2,12,220 2,42,104 2,80,051 3,16,227 2,49,846
EBIDTA 1,985 2,590 3,296 3,657 4,717 6,334 6,842 7,196 7,619 5,780
PAT 1,017 1,361 1,597 1,843 2,260 2,927 3,231 3,367 3,918 2,881
Networth 6,256 7,215 10,022 10,757 12,553 13,225 16,407 20,213 23,742 27,550
Capital Employed 12,269 15,054 22,265 24,649 31,863 34,776 39,471 39,938 45,424 59,084
Gross Margins 4.6% 5.2% 5.5% 5.6% 5.7% 6.1% 6.1% 6.1% 6.0% 6.1%
EBITDA Margins 2.3% 2.5% 2.7% 2.8% 2.8% 3.0% 2.8% 2.6% 2.4% 2.3%
PAT Margins 1.2% 1.3% 1.3% 1.4% 1.4% 1.4% 1.3% 1.2% 1.2% 1.2%
Return on Avg. Capital
Employed (%) 18.2% 18.9% 18.5% 14.6% 16.0% 18.4% 17.7% 17.2% 17.2% 14.2%
Return on Avg. Equity 21.2% 21.7% 19.0% 17.7% 20.0% 23.9% 22.8% 19.1% 18.2% 15.4%
EPS^^ (Rs.) 3.1 3.5 4.1 4.7 5.7 7.4 8.1 8.4 9.7 7.2
Book Value per share (Rs.) 16.1 18.5 25.7 27.4 31.7 33.2 39.5 48.8 57.6 66.4
P/BV 1.73

Dividend Distribution
35
On
fac
e va
lue
of
Rs.
2/-
per
sh
are
25%
35% 40%
50% 55%
20% 20%
45%
95%
FY 07 FY 08 FY 09 FY 10 FY 11 FY 12 FY 13 FY 14 FY 15

Harrow Investment
Holding Limited 13.3%
Synnex Mauritius
Limited 23.6%
Foreign Institutional Investors &
FPIs 26.9%
Standard Chartered
Private Equity 11.9%
Mutual Funds 15.8%
Others 8.4%
Shareholding structure
36
30-SEP-2015
Harrow Investment
Holding Limited 13.3%
Synnex Mauritius
Limited 23.6%
Foreign Institutional Investors &
FPIs 27.4%
Standard Chartered
Private Equity 11.9%
Mutual Funds 15.7%
Others 8.1%
31-DEC-15

80
120
160
200
CNX NIFTY REBASED REDIL@ NSE REBASED
REDIL Stock Performance Vs. Index
37
80
130
180
REDIL @BSE REBASED BSE MIDCAP REBASED

Business & Management
Financial Summary
Risk Management
38

Inventory Management
Market knowledge, forecasting ability.
Stock rotation policy price supported by vendors
Price erosion broadly supported by vendor discounts
Inventory Risk
Increasing proportion of Non –IT business with less cash conversion cycle
Working Capital Intensive
Sound Credit Policies Dedicated credit team spread across the country Bad debts (including provisions) at an average of less than 0.10% of
sales at the consolidated level
Receivables Risk
Broad basing Vendors, Depth in major Product lines Relationship with over 200 vendors, many of which are for more
than 10 years Range of 125 brands in India and 125+ brands in international
operations Conscious movement into Non-IT Categories
Vendor And Product Spread Concentration
Increasing Value Portfolio, New Initiatives Gross Margins
Risk Mitigation Strategy Business Risks
Prudent Risk Management
39
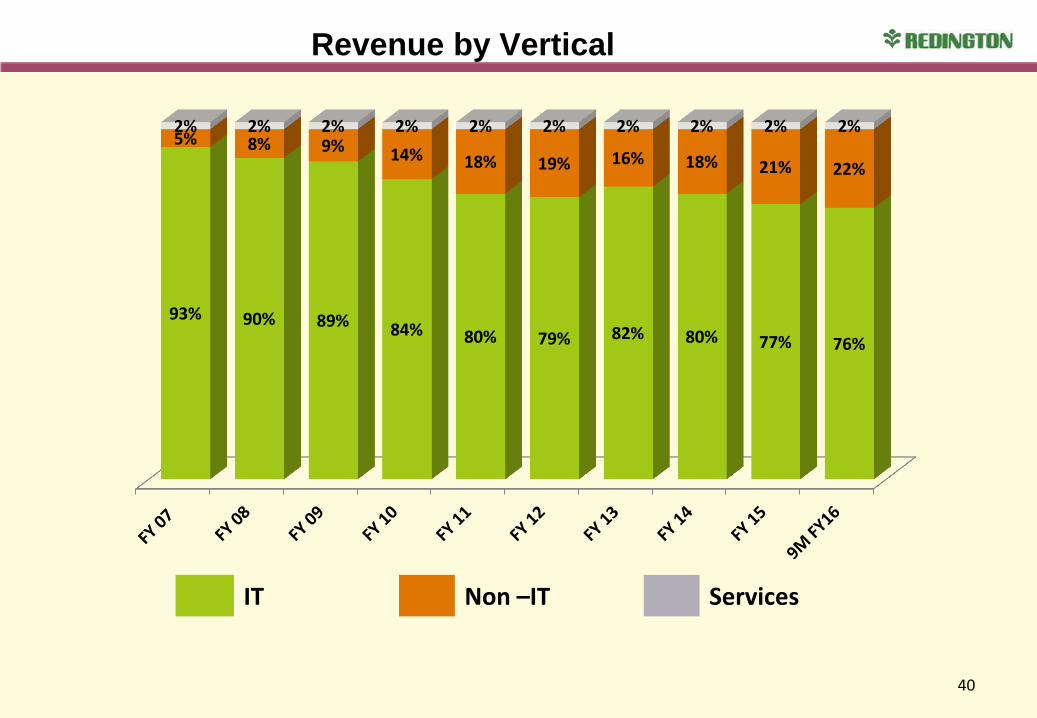
Revenue by Vertical
40
93% 90% 89% 84% 80% 79% 82% 80% 77% 76%
5% 8% 9% 14% 18% 19% 16% 18% 21% 22%
2% 2% 2% 2% 2% 2% 2% 2% 2% 2%
IT Non –IT Services

In Closing
41

Thank you