Embed Size (px)
Citation preview

An integrated experimental and computational approach for the study of low
radiation induced signaling
Marianne B. SowaPacific Northwest National Laboratory
Richland, WA
1

Matrix Remodeling
2
Goal: develop a process-level model for radiation induced matrix remodeling.
Radiation forms reactive oxygen species (ROS).ROS inhibits phosphatases, activates the ERK/MAPK pathway.ERK phosphorylates and activates the transcription factor Ets-1Ets-1 controls the expression of several matrix metalloproteases (MMPs). MMPs are critical regulators of the extracellular matrix.
ROS
ERK
Matrix Remodeling
Signaling pathways
Gene expression
Matrix GenesMMPs, TIMPs
Hypothesized mechanistic model for
radiation‐induced matrix remodeling
Ets‐1

Cells in a 3-D tissue respond to intra- and extra-cellular cues mediated by endocrine, autocrine, and paracrine signaling pathways.
Model systems available that are metabolically active, have the same architecture and differentiation patterns as normal human skin.
Can compare component parts to identify important processes regulated by radiation in these biological states.
Human skin is our model system
Fibrobasts
Keratinocytes
Stratum Corneum
Epidermis
Dermis

A systems level understanding entails the elucidation of the
relationships between these.
ROS
Signaling pathways
Gene expression
Matrix Remodeling
Apoptosis ProliferationSurvival
KeratinocyteKeratinocyte
ROS
Signaling pathways
Gene expression
FibroblastFibroblastMatrixMatrix
Soluble
mediators
How can we describe the system?Model should describe the links between radiation-induced ROS, the activation of cell signaling pathways, the associated gene expression changes in individual cell types, as well as tissue level outcomes.

Experimental Design
5
Peel Layers Apart
mRNAprotein
mRNAprotein
keratinocytes
fibroblasts
Secreted proteins
air interface
media10cGy
1h 3h 24h 48h 72h
Protein phosphorylation
Altered transcription
Oxidative stressImmune response
InflammationMatrix modifications
6
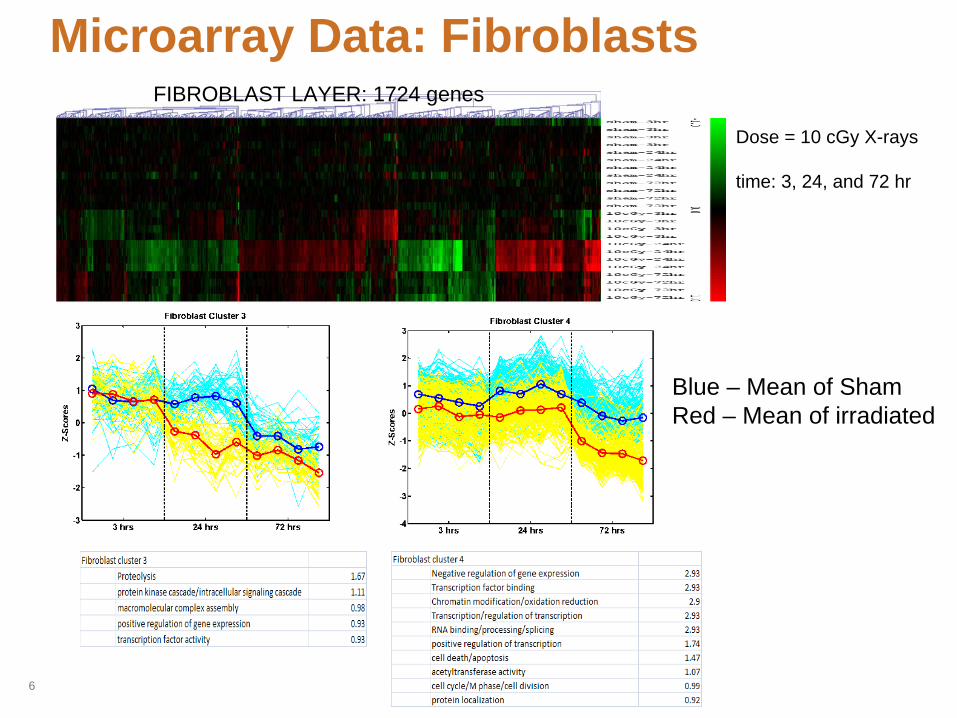
Microarray Data: FibroblastsFIBROBLAST LAYER: 1724 genes
Dose = 10 cGy X-rays
time: 3, 24, and 72 hr
Blue – Mean of Sham Red – Mean of irradiated
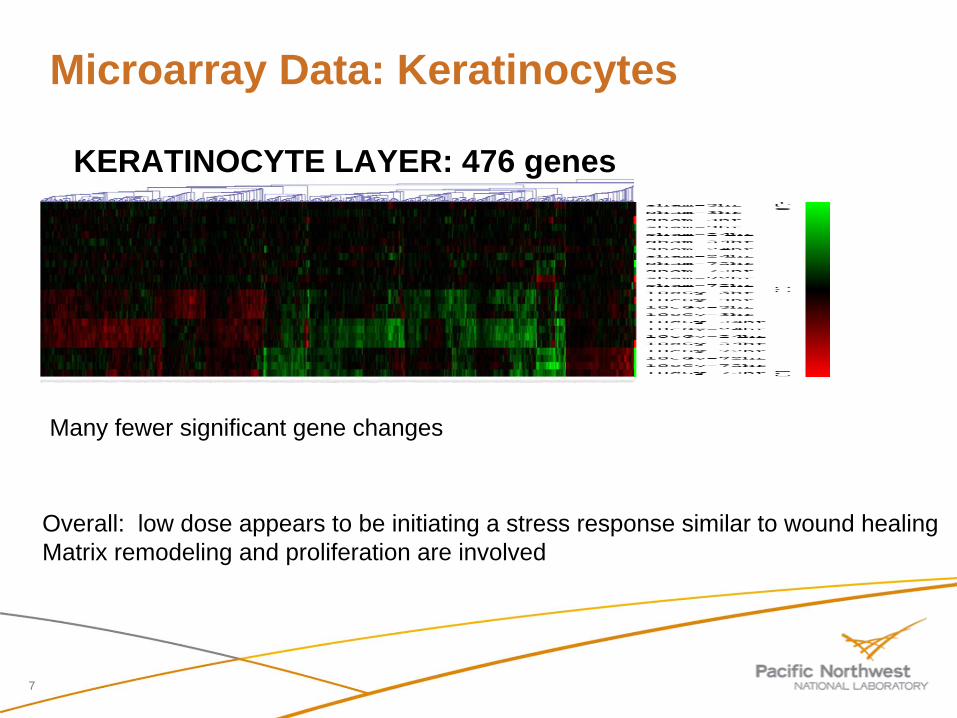
Microarray Data: Keratinocytes
7
KERATINOCYTE LAYER: 476 genes
Many fewer significant gene changes
Overall: low dose appears to be initiating a stress response similar to wound healingMatrix remodeling and proliferation are involved
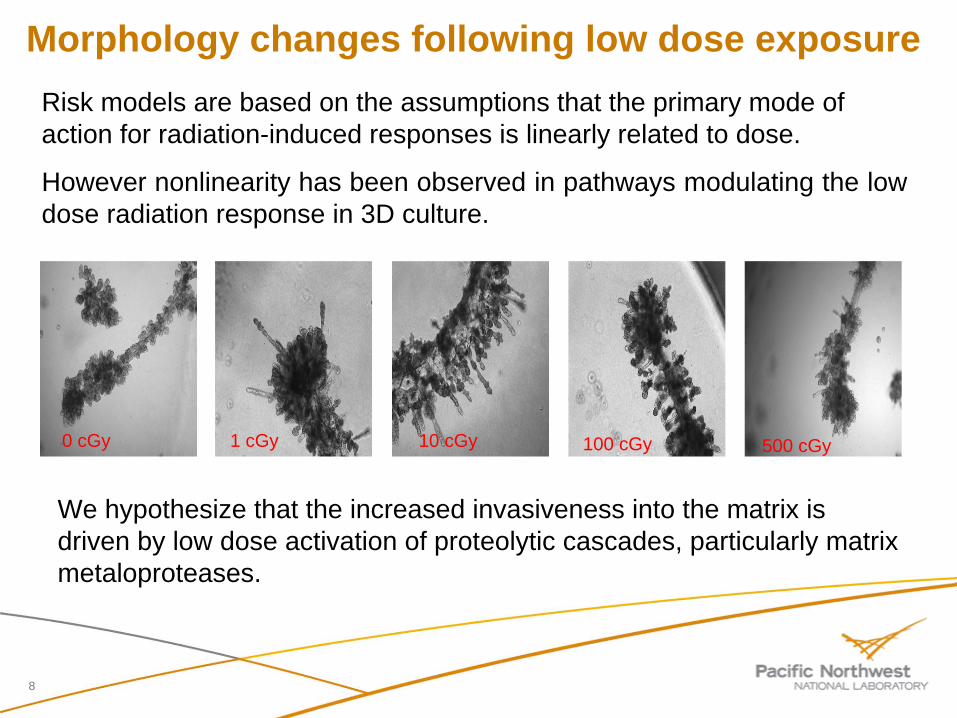
Morphology changes following low dose exposure
8
Risk models are based on the assumptions that the primary mode of action for radiation-induced responses is linearly related to dose.
However nonlinearity has been observed in pathways modulating the low dose radiation response in 3D culture.
1 cGy 100 cGy10 cGy 500 cGy0 cGy
We hypothesize that the increased invasiveness into the matrix is driven by low dose activation of proteolytic cascades, particularly matrix metaloproteases.
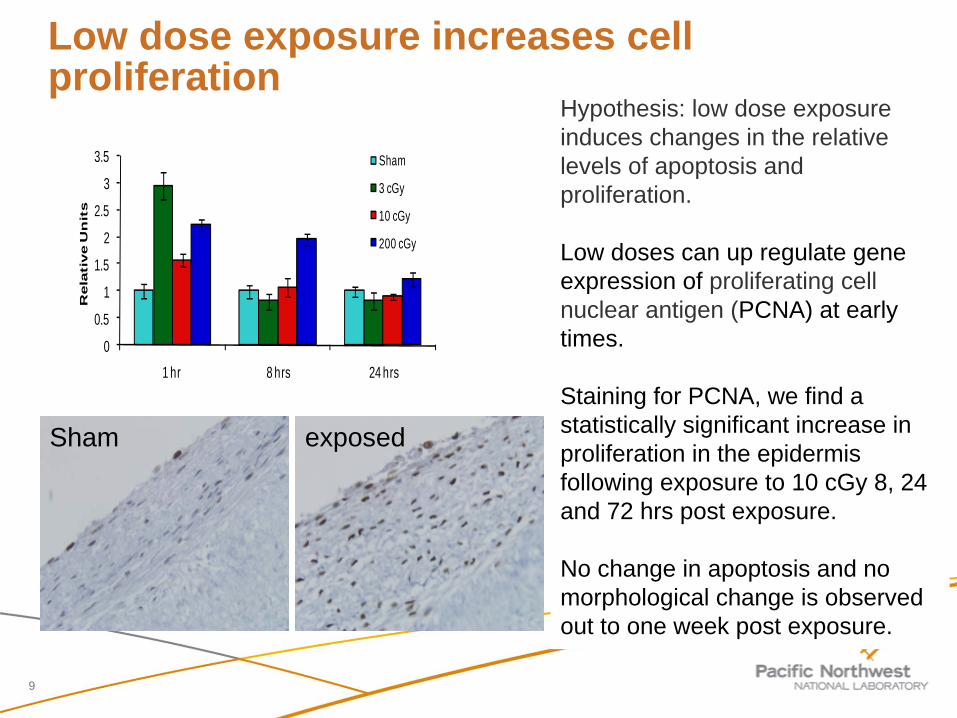
Low dose exposure increases cell proliferation
9
Sham exposed
0
0.5
1
1.5
2
2.5
3
3.5
1 hr 8 hrs 24 hrs
Rela
tive U
nit
s
Sham
3 cGy
10 cGy
200 cGy
Hypothesis: low dose exposure induces changes in the relative levels of apoptosis and proliferation.
Low doses can up regulate gene expression of proliferating cell nuclear antigen (PCNA) at early times.
Staining for PCNA, we find a statistically significant increase in proliferation in the epidermis following exposure to 10 cGy 8, 24 and 72 hrs post exposure.
No change in apoptosis and no morphological change is observed out to one week post exposure.

10
Key Regulators of Matrix Remodeling
pERKpAKT
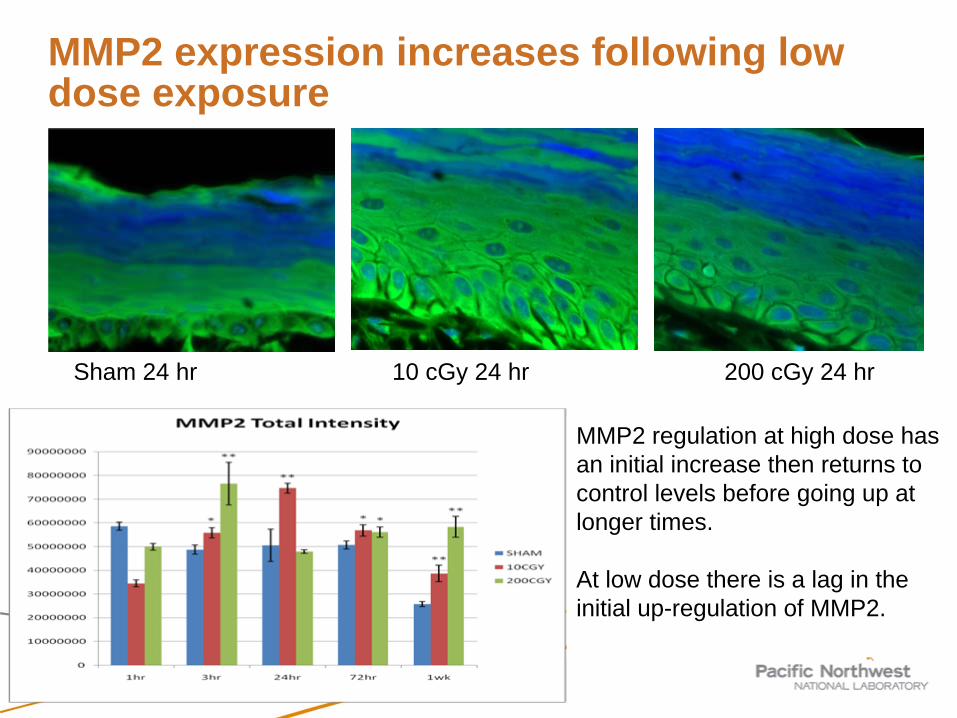
MMP2 expression increases following low dose exposure
11
Sham 24 hr 10 cGy 24 hr 200 cGy 24 hr
MMP2 regulation at high dose has an initial increase then returns to control levels before going up at longer times.
At low dose there is a lag in the initial up-regulation of MMP2.

MMP14 expression increases following low dose exposure
12
Sham 1 hr 10 cGy 1 hr
MMP14 changes are much less dramatic and occur at earlier times.
No longer time component observed and no dramatic dose dependence.
MMP9: no changes

AKT activity
13
Using Western blotting, we have quantified the level of AKT activation
We see no significant activation in either the dermis or the epidermis
sham 10 200 TPAsham 10 200 TPA

ERK activation
14
No change in ERK activity in the keratinocytes
Slight up regulation at early time and 10 cGy for the fibroblasts
Low dose may be working predominantly through one of the other MAPK pathways to cause up regulation of MMPs: p38 and junk
sham 10 200 TPA sham 10 200 TPA

Integrating data
15
Katrina Waters

Network modularizationNetwork modularization
Really difficult to model dynamics
• Quantitatively predict – amplitude of response; duration of response: Dynamics
• Design principles of the network ?• How to re-engineer the network to generate particular
responses?
Tractable problem
Harish Shankaran

Cell as a MIMO systemCell as a MIMO system• Multiple-input multiple-output system
I1
I2
I3
O1
O2
O3
Cytokines, cell-cell contact, pH, metabolites
Grow, divide, migrate, cytokines
To understand network dynamics, we need to know the input-output relationships of the individual boxes – i.e. the modules
Course Grained Model of Cell Signaling Circuit
18
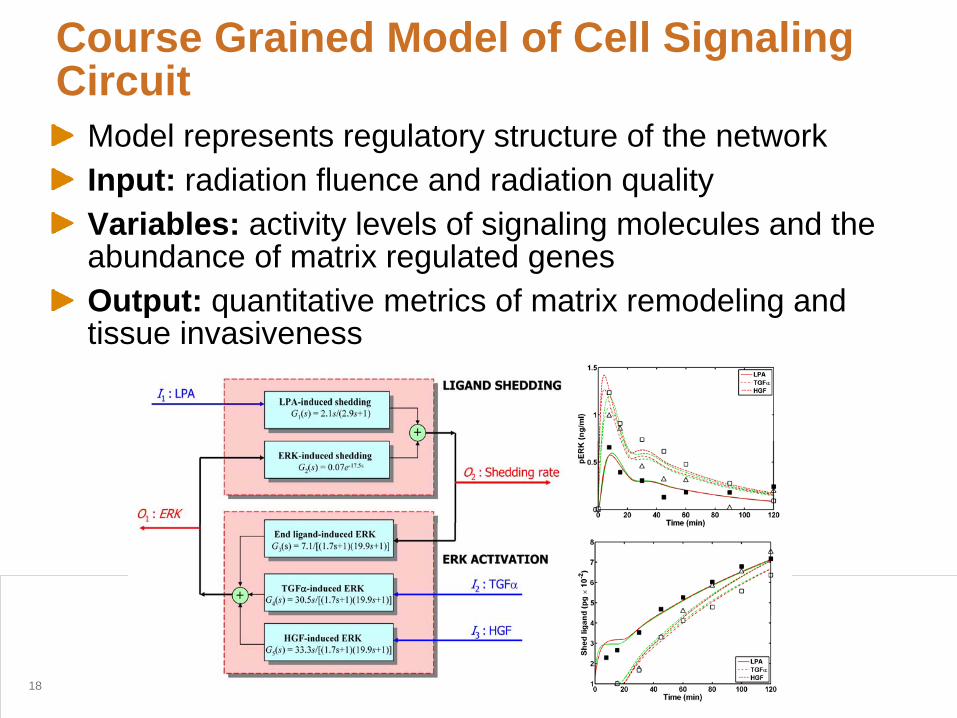
Model represents regulatory structure of the networkInput: radiation fluence and radiation qualityVariables: activity levels of signaling molecules and the abundance of matrix regulated genesOutput: quantitative metrics of matrix remodeling and tissue invasiveness

AcknowledgementsPNNLWilliam F. MorganHarish ShankaranNorm KarinXihai WangPaula KoehlerSavanna CastilloJoe RobinsonWill ChrislerKatrina WatersBill Morgan
WSU, Tri-CitiesJohn H. Miller
Funding:Department of EnergyLow Dose Radiation Research Program
NASA

Simulation of Electron Beam Irradiation of Skin Tissue Model
Our results show spatially heterogenous signaling is involved in the low dose responseIt is possible to selectively expose the epidermal layer in the presence of a non-irradiated dermal layer. To determine what the dose-depth profile, perform Monte Carlo simulation
20
Sowa, M. B., McDonald, J. C., Miller, J. H., Murphy, M. K., Strom, D. J., and Kimmel, G. A., Rad. Res. 164, 677- 679 (2005).
Sowa Resat, M. B., and Morgan, W. F., Cancer and Metastasis Reviews, 23, 323-331 (2004).

FilamentBeam Pulsing
Aperture
xy
z
Vibration IsolationTable
Magnetic Lens
Electron Gun
Faraday Cup
Optical MicroscopeSampleStage
CollimationAperture
Microbeam Schematic• Variable Electron energy: 20 – 90 keV• Built around a commercially available pulsed electron gun• High spatial resolution – target individual cells• Variable “Dose” – from one to 100’s of electrons deposited in the target cell• Variable “Dose Rate”• Integrate with standard optical microscope• Irradiate thin tissues and tissue analogs

Electron Irradiator – Cell Interface
e- e- e- e- e- e- e- e- e- e- e- e- e- e- e- e- e- e- e- e- e- e- e- e- e- e-
. ....
...... .. ..... .........
........ .. ......... ..
......... .. . ...
......
.....
... .
......... ..........
.. ...
.
.... . .... ... .. ....
..... .. ........ .. .........
..
....... .............. .. .......
.... .
........ ....... ..... ........ .. .. .... ... .. ....... . ... ...... ... .. ...... . ... ....... ...
. .... . ..... . ... ... .. ..... ... ... ....... . ... ...... ... .. ...... . ... ....... ....... ......... .
..
.. . ...... ... ...... ........ . ... .... . ..
.... .. ......... .. .... .... ....
. ..
........... ......... .......
.. ..... ........
....... .... . ..
...
... .... ...
.... .......
............
....
CellMylar filmElectron track
200 nm polyimide vacuum window
~250 m Ta
~10 m laser drilled hole
Aqueous media
Vacuum

Electron Penetration
Tissue samples were imaged using a Nikon Eclipse TE300 inverted microscope using Nikon Plan APO 20/0.75 objective .
Stratum Corneum measurements were made by using Volocity software . The stratum corneum layer was isolated using % - intensities (0.5-15%).
The area of tissue separation was measured, i.e. the air pockets in the stratum corneum, were isolated using % -intensities (23-100%).
•Electron track structure in the condensed phase includes large angle scattering of energetic primary and secondary electrons•electron beam incident on a tissue will have significant radial spreading •Fluctuations in total path length are relatively small, however contributions from penetration and radial motion vary greatly from one electron track to another.

Defining the depth dose distribution
24
As electron traverse the skin and interact with nuclei, they will lose energy.
The greater the energy loss, the greater the dose.
Use high resolution imaging to help define the average electron-cellular interaction as a function of energy.
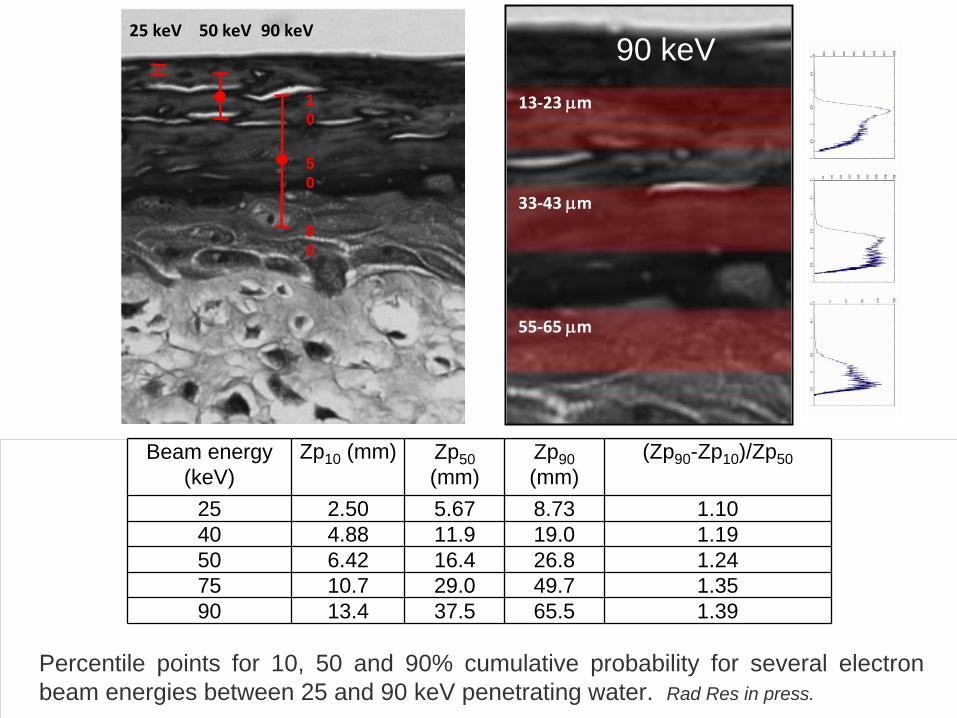
Beam energy (keV)
Zp10 (mm) Zp50 (mm)
Zp90 (mm)
(Zp90 -Zp10 )/Zp50
25 2.50 5.67 8.73 1.1040 4.88 11.9 19.0 1.1950 6.42 16.4 26.8 1.2475 10.7 29.0 49.7 1.3590 13.4 37.5 65.5 1.39
13‐23 m
33‐43 m
55‐65 m
1 0
5 0
9 0
90 keV50 keV25 keV
Percentile points for 10, 50 and 90% cumulative probability for several electron beam energies between 25 and 90 keV penetrating water. Rad Res in press.
90 keV