Embed Size (px)
Citation preview

Summer Training Report
On
“An Insight into the Indian Capital Market”
At
Kolkata, West Bengal
Prepared by:
Vasundhara Kedia
Enrollment No. 10111161
PGPM
Under the Guidance of
Mr. Rohit Pasari (Cluster Manager) Mr. Krishnendu Ghosh
Industry Guide Faculty Guide
As a Partial Fulfilment of PGPM
At
Globsyn Business School, Kolkata

An Insight Into the Indian Capital Market
ACKNOWLEDGEMENT
This project work has been made possible through the direct and indirect cooperation of various people for whom I wish to express my appreciation and gratitude.
I would specially like to mention about my Industry guide, Mr. Santanu Basu ( Zonal Broking Head- East) and Mr. Rohit Pasari ( Cluster Manager- Business Development) of Karvy Stock Broking Ltd., whom I owe a profound sense of obligation and respect for guiding me and playing a pivotal role right from the start till the completion of this project. I also thank them for motivating and encouraging me to refine the work done at every stage.
My grateful appreciation is also extended to Professor Krishnendu Ghosh (Faculty Guide & Mentor, Globsyn Business School) and cordially thank him for his support and inculcating in me the focus and also for his ever enriching suggestions.
I would also take this opportunity to thank all my senior colleagues in KSBL for their unlisted encouragement, timely support and suggestions.
Page 2

An Insight Into the Indian Capital Market
DECLARATION
I, Vasundhara Kedia, hereby declare that this project entitled “An Insight into the Indian Capital Market,” submitted by me under the guidance of Mr. Rohit Pasari (Cluster Manager- Business Development, KSBL) and Professor Krishnendu Ghosh ( Faculty Guide & Mentor at Globsyn Business School) is my own work. The report has been prepared in partial fulfilment of requirements towards the Summer Internship Project at Karvy Stock Broking Ltd., Kolkata. I further declare that this dissertation has not been submitted earlier to any other university or institution for the award of any other degree or diploma.
………………………………………
Vasundhara Kedia
PGPM 11
Enrollment No. 10111161
Date-
Place-
Page 3

An Insight Into the Indian Capital Market
TABLE OF CONTENTS
PAGE NO.
1. Introduction to Karvy Stock Broking Ltd................................................ 5
2. Work done during Summer Training Program....................................... 15
3. Design............................................................................................................ 17
4. Introduction to The Indian Capital Market.............................................. 19
5. Legal Framework and Regulatory Bodies................................................ 67
6. Participants in the Indian Capital Market................................................ 73
7. Reforms in the Indian Capital Market...................................................... 77
8. Stock Exchanges in India............................................................................ 83
9. Risk and Risk Management in Indian Capital Market........................... 110
10. Presentation & Analysis of Data
a) Comparative study of KSBL.................................................................... 108
b) Sensex v/s Nifty........................................................................................... 115
c) Sensex vis-à-vis International Markets.................................................... 137
d) Analysis of Indian Capital Market........................................................... 143
11. Recommendations..................................................................................... 148
12. Summary & Conclusions.......................................................................... 156
BIBLIOGRAPHY
Page 4
An Insight Into the Indian Capital Market
INTRODUCTION TO THE COMPANY
Page 5

An Insight Into the Indian Capital Market
“Success is a journey, not a destination.” If we look for examples to prove this quote then we can find many but there is none like that of Karvy. Back in the year 1981, five people created history by establishing Karvy and company which is today known as Karvy, the largest financial service provider of India.
Vision of Karvy:
To achieve & sustain market leadership, Karvy shall aim for complete customer satisfaction, by combining its human and technological resources, to provide world class quality services. In the process Karvy shall strive to meet and exceed customer’s satisfaction and set industry standards.
Mission statement:
“Our mission is to be a leading and preferred service provider to our customers, and we aim to achieve this leadership position by building an innovative, enterprising , and technology driven organization which will set the highest standards of service and business ethics.”
Company overview:
Karvy was established as ‘Karvy & Co.’ by five chartered accountants during the year 1979-80, and then its work was confined to audit and taxation only. Later on it diversified into financial and accounting services during the year 1981-82 with a capital of Rs.150000. It achieved its first milestone after its first investment in technology. Karvy became a known name during the year 1985-86 when it forayed into capital market as registrar.
Evolution of KARVY:
In 1982, a group of Hyderabad based practicing chartered accountants started KARVY consultant Ltd, with a capital of Rs.150,000 offering auditing and taxation services initially, later, it forayed into the registrar activities and into financial services.
KARVY- the letter in the work K,A,R,V,Y stands for 5 directors names.
K – Mr.Kutumba Rao.v. A- Mr. Ajay kumar.k. R- Mr.Ramakrishna.M.S. V-Mr.singh Y-Mr.Yugandhur
They along with, KARVY’s strong work ethic and professional background leverage with information technology enable it to deliver to the individual.
It is well said that success is a journey not a destination and we can see it being proved by Karvy. Under this section we will see that how this ‘Karvy & Co.’ of 1980 became “Karvy” of 2008. Karvy blossomed with the setting up of its first branch at Mumbai during the year 1987-88. The turning point came in the year 1989 when it decided to enter into one of the not
Page 6
An Insight Into the Indian Capital Market
only emerging rather potential field too i.e. stock broking. It added the feather of stock broking into its cap. At the same time it became the member of Hyderabad Stock Exchange through associate firm Karvy Securities Ltd and then Karvy never looked back, it went on adding services one after another, it entered into retail stock broking in the year 1990. Karvy investor service centers were set up in the year 1992. Karvy which already enjoyed a wide
network through its investor service centers, entered into financial product distribution services in the year 1993. One year more and Karvy was now dealing into mutual fund services too in the year 1994 but it didn’t stopped there, it stepped into corporate finance and investment banking in the year 1995.
Karvy’s strategy has always been being the first entrant in the market. Karvy again hit the limelight by becoming the first registrar in the country to be awarded ISO 9002 in the year 1997. Then it stepped into the other most happening sector i.e. IT enabled services by establishing its own BPO units and at a gap of just 1 year it took the path of e-Business through its website www.karvy.com . Then it entered into insurance services in the year 2001 with the launch of its retail arm “Karvy- The Finapolis: your personal finance advisor”. Then in the year 2002 it launched its PCG (Private Client Group) which looks after its High Networth Individuals .and maintain their portfolio and provides them with other financial services. In the year 2003, it commenced secondary debt and WDM trading.
It was a decade which saw many Indian companies going global. So, why should the largest financial service provider of India should lag behind? Hence, Karvy launched “Karvy Global
Page 7

An Insight Into the Indian Capital Market
Services Limited” after entering into a joint venture with Computershare, in Australia the year 2004. The year 2004 also saw Karvy entering into commodities marketing through Karvy Comtrade Ltd.
Year 2005 saw Karvy establishing a separate branch for its insurance services under the head “Karvy Insurance Broking Ltd” and in the same year, after being impressed with the rapid growth of Karvy Stock Broking Limited, PCG group of Hong Kong acquired 25% stake at KSBL. In the year 2006, Karvy entered into one of the hottest sector of present time i.e. real estate through Karvy Realty & Services (India) Ltd. Hence, we can see now Karvy being established as the largest financial service provider of the country.
KARVY GROUP – 11 RENOWNED ENTITIES :
The first securities registry to receive ISO 9002 certification in India. Registered with SEBI as Category I Registrar, is Number 1 Registrar in the Country. The award of being ‘Most Admired’ Registrar is one among many of the acknowledgements we received for our customer friendly and competent services.
Karvy stock broking ltd. Consists of five units namely stock broking services, depository participant, advisory services, distribution of financial products, advisory services and private client groups.
It is registered with SEBI as a category 1 merchant banker. Its clientele includes leading corporate, State Governments, foreign institutional investors, public and private sector companies and banks, in Indian and global markets.
Page 8

An Insight Into the Indian Capital Market
Karvy insurance broking ltd is also a part of Karvy Stock Broking Ltd. At Karvy Insurance Broking Limited both life and non-life insurance products are provided to retail individuals, high net-worth clients and ulfillin.
The company provides investment, advisory and brokerage services in Indian Commodities Markets. And most importantly, it offers a wide reach through our branch network of over 225 branches located across 180 cities.
Karvy Global is a leading business and knowledge process outsourcing Services Company offering creative business solutions to clients globally. It operates in banking and financial services, insurance, healthcare and pharmaceuticals, media, telecom and technology. It has its sales and business development office in New York, USA and the offshore global delivery center in Hyderabad, India.
Karvy Realty (India) Limited is engaged in the business of real estate and property services offering:
Buying/ selling/ renting of properties
Identifying valuable investments opportunities in the real estate sector
Facilitating financial support for real estate and investments in properties
Real estate portfolio advisory services
Page 9

An Insight Into the Indian Capital Market
Karvy Computershare Private Limited is a joint venture between Computershare, Australia and Karvy Consultants Limited, India in the registry management services industry. Computershare, Australia is the world’s largest and only global share registry providing financial market services and technology to the global securities industry. Karvy Corporate and Mutual Fund Share Registry and Investor Services business, India’s No. 1 Registrar and Transfer Agent and rated as India’s “Most Admired Registrar” for its overall excellence in volume management, quality processes and technology driven services.
KDMSL is emerging as a leading service provider in the areas of E-governance processing, insurance back office processing, record keeping, back office for BFSI clientele and is in pursuit to establish credentials in the areas of Telecom processing, Data management requirements of large corporate.
KDMSL is striving to achieve leadership position by tapping the Indian retail sector boom, through a combination of our extensive branch network and proprietary IT backbone. Needless to say, KDMSL is run as an independent outfit with seasoned professionals on board, who have decades of expertise in the industry.
KDMSL is a fully owned subsidiary of Karvy Stock Broking Limited (KSBL), incorporated in April 2008 and is head quartered at Hyderabad.
Karvy Fortune is a correlate opportunity from India’s foremost financial services provider, Karvy. It offers complete Karvy’s spectrum of financial products. Karvy fortune gives the opportunity to associate with “Karvy Family” as Franchisee, Remisser, E– Franchisee or as an Independent Financial Advisors.
Page 10

An Insight Into the Indian Capital Market
In its ambition to emerge as a complete financial advisor, KARVY has recently launched its personal financial planning wing, KARVY Financial Planning. It proposes to cater all advice to its customer pertaining to personal finance.
With India emerging as a strong market, the investments avenues have also increased, to advice our customers the right avenue according to their suitability.
Our vision is “To cater to the unique needs and requirements of the mass affluent by providing complete financial solutions and thereby enabling them to transform their dreams into reality.”
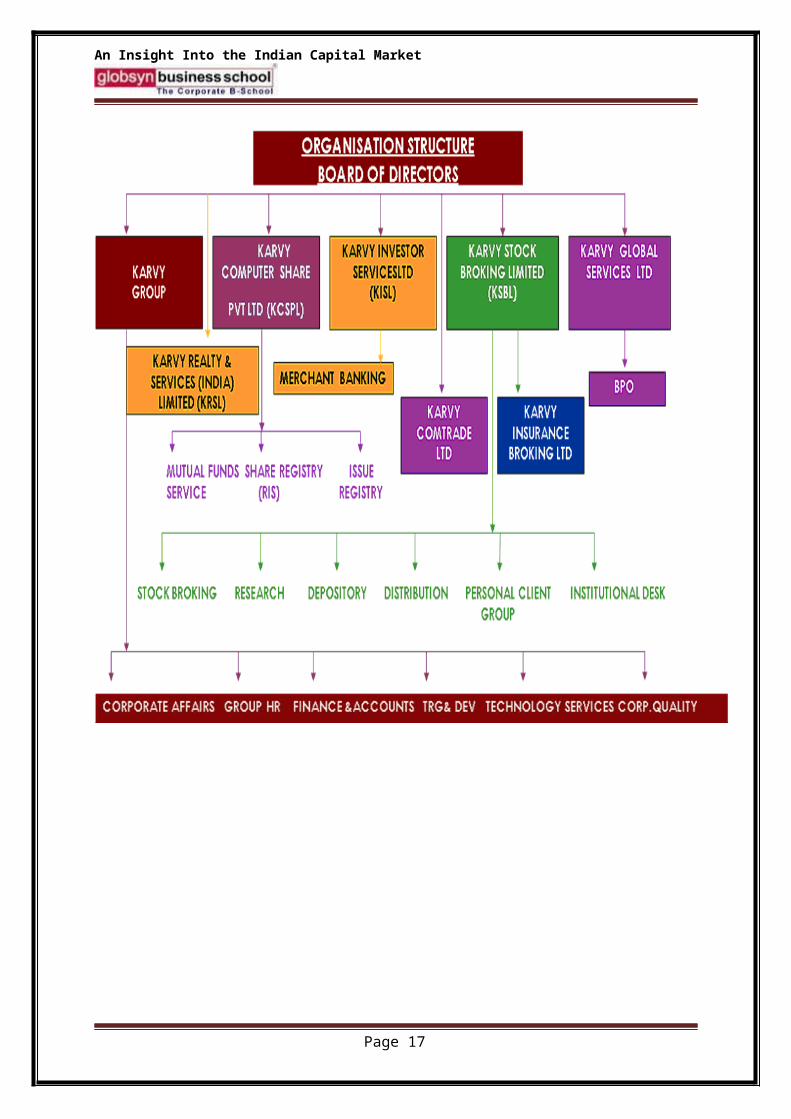
ORGANISATION STRUCTURE OF KARVY :
Page 11

An Insight Into the Indian Capital Market
Talking about the organization structure, the board of directors as the supreme governing body. The chairman being Mr. C Parthasarthy, Mr. M Yugandhar as the managing director and M S Ramakrishna as the Executive Director.
The Board of Directors head the Karvy Group, Karvy Computershares limited, Karvy Investors Services Ltd., Karvy Comtrade, Karvy Stock Broking Ltd., and Karvy Global Services Ltd.
Karvy group being the flagship company looks after the functional departments such as corporate affairs, group human resources, finance & accounting, training & development, technology services and corporate quality.
Page 12

An Insight Into the Indian Capital Market
Facilities Offered by KSBL :
Free online stock-broking and attractive margin funding options
Life time free demat account
Free online commodities broking account
Free Mutual Fund transactions to an unlimited extent ,including unlimited SIP transactions
Application in IPOs with attractive loan options for applications
Loans against securities
Daily equity market research reports and calls through SMS
Access to research reports on Mutual Fund, IPO sand Insurance
Regular portfolio statement for better planned future investments
Free financial advise on portfolio allocation in various asset classes
Free subscription of ‘KARVYF FinaPolis’ magazine
If there are disputes in the case of orders placed over phone, how can they be resolved?
Orders over the telephone can be placed only through designated telephone numbers. We have a voice recording system to record all orders placed over the telephone. We will ask for customer ID details before processing the order. Still, if a dispute arises, the voice recording would be the final proof for settling the dispute.
Trading Package of Karvy Online:
I-Zone ‘+’ : One-Stop Registration for Investment Zone
Equities & Derivates (NSE / BSE)
Mutual FundsAll major AMCs)
IPOs & DP services (NSDL/CDSL)
Commodities (NCDEX & MCX)
Facilities:
Page 13

An Insight Into the Indian Capital Market
Live market news
Quality research live on the trading screen
Top analysts providing inputs on strategies and recommendations
Alert facility for tracking
Seamless integration between bank, broking, mf and DP Accounts
Comprehensive net worth statement
Live tracking of investments
Corporate news a click away
Streaming quotes and news from the exchange on your desktop
Links to existing Karvy relations:
Offline Broking ID – The same UCC would be allotted for the I-Zone account.
Offline Mutual Fund Code – The existing Offline Folios if held singly in the name of Sole / First Applicant would be available for display in the online Login of the client. The portfolio would be updated on a daily basis. However, online transactions can be executed in such offline folios only after conversion of such offline folios to online folios. For conversion the client needs to provide one letter to each AMC in whose scheme he/she has invested mentioning the offline Folio number.
Demat ID –If the client already holds a demat account with Karvy where the holder(s) in demat is same as applicants in the I-Zone form and in the same sequence, the existing demat account can be connected to the I-Zone account. All IPO bids, in such case, would be placed in the name of joint holders as in demat account.
Page 14

An Insight Into the Indian Capital Market
WORK DONE DURING SUMMER TRAINING
PROGRAM
WORK DONE DURING SUMMER TRAINING PROGRAM :
Page 15

An Insight Into the Indian Capital Market
Engaged in:
1. Selling Discounted Brokerage Plans to Active Clients.
2. KYC Updation of Clients Inactive/Never Traded/Dormant from 2009 and before
3. Making inactive clients from 2010 and after resume trading.
4. Handling Client Grievances- meeting clients and enabling Inactive HNI Clients resume activity.
5. Client interaction with respect to Physical Contract Note wherein, the client e-mail was invalid thus creating ECN issue.
6. Attending and briefing Interns from other B-Schools with respect to the project & job role.
7. Assisting Industry Guide in preparing his Clusters’ Employee KRA Evaluation.
Page 16
An Insight Into the Indian Capital Market
RESEARCH DESIGN
DESIGN
Page 17

An Insight Into the Indian Capital Market
Research can be defined as a scientific and systematic search for pertinent information on a specific topic. Research is a careful investigation of inquiry especially through search for new facts in any branch of knowledge. In simple terms, research refers to search for knowledge. Research comprises defining and redefining problems, formulating hypothesis or suggested solutions collecting, organizing and evaluating data, making deductions and reaching conclusions and at last carefully testing the conclusion to determine whether they fit the formulating hypothesis.
Research methodology is away to systematically solve the research problem. It may understand as a science of studying how research is done scientifically. In it, we study the various steps that are generally adopted by the researcher in study of his research problem along with logic behind them.
A Research design is a framework or blueprint for conducting the research of a project. It details the procedures necessary for obtaining the information needed. A research design lays the foundation for conducting the project.
Secondary Data was largely used for the purpose of data interpretation and analysis.
For the purpose of the review, research has been defined as doctoral dissertations, papers published in academic journals, books (including expository, but excluding obviously popular books) and working papers or occasional unpublished papers (where such information was available) on Indian capital markets. I have reviewed articles published in the popular media such as financial dailies, business magazines and other popular magazines and journals. I have also reviewed dissertations for Masters’ degrees, reports of government committees or commissions, seminar and conference papers. I have also included publications in foreign journals. It is possible that, in the process, the list of works reviewed may have excluded some excellent works published in popular media or included some sub-standard works published in academic journals.
Page 18

An Insight Into the Indian Capital Market
OVERVIEW
The past decade in many ways has been remarkable for securities market in India. It has grown exponentially as measured in terms of amount raised from the market, number of stock
Page 19

An Insight Into the Indian Capital Market
exchanges and other intermediaries, the number of listed stocks, market capitalization, trading volumes and turnover on stock exchanges, and investor population. Along with this growth, the profiles of the investors, issuers and intermediaries have changed significantly. The market has witnessed several institutional changes resulting in drastic reduction in transaction costs and significant improvements in efficiency, transparency, liquidity and safety. In a short span of time, Indian derivatives market has got a place in list of top global exchanges. In single stock futures category, the Futures Industry Association (FIA) placed NSE in second position in the year 2000.
INTRODUCTION
The market for long-term securities like bonds, equity stocks and preferred stocks is divided into primary market and secondary market. The primary market deals with the new issues of securities. Outstanding securities are traded in the secondary market, which is commonly known as stock market or stock exchange. In the secondary market, the investors can sell and buy securities. Stock markets predominantly deal in the equity shares. Debt instruments like bonds and debentures are also traded in the stock market. Well-regulated and active stock market promotes capital formation. Growth of the primary market depends on the secondary market. The health of the economy is reflected by the growth of the stock market.
Companies raise funds to finance their projects through various methods. The promoters can bring their own money or borrow from the financial institutions or mobilize capital by issuing securities. The funds may be raised through issue of fresh shares at par or premium, preference shares, debentures or global depository receipts. The main objectives of a capital issue are given below:
To promote a new company To expand an existing company To diversify the production To meet the regular working capital requirements To capitalize the reverses
Securities markets provide a channel for allocation of savings to those who have a productive need for them. As a result, the savers and investors are not constrained by their individual abilities, but by the economy’s abilities to invest and save respectively, which inevitably enhances savings and investment in the economy.
MARKET SEGMENT
Page 20

An Insight Into the Indian Capital Market
The securities market has two interdependent and inseparable segments: the primary and the secondary market. The primary market provides the channel for creation of new securities through issuance of financial instruments by public companies as well as Governments and Government agencies and bodies whereas the secondary market helps the holders of these financial instruments to sale for exiting from the investment. The price signals, which subsume all information about the issuer and his business including associated risk, generated in the secondary market, help the primary market in allocation of funds. The primary market issuance is done either through public issues or private placement. A public issue does not limit any entity in investing while in private placement, the issuance is done to select people. In terms of the Companies Act, 1956, an issue becomes public if it results in allotment to more than 50 persons. This means an issue resulting in allotment to less than 50 persons is private placement.
There are two major types of issuers who issue securities. The corporate entities issue mainly debt and equity instruments (shares, debentures, etc.), while the governments (central and state governments) issue debt securities (dated securities, treasury bills). The secondary market enables participants who hold securities to adjust their holdings in response to changes in their assessment of risk and return. They also sell securities for cash to meet their liquidity needs. The exchanges do not provide facility for spot trades in a strict sense. Closest to spot market is the cash market in exchanges where settlement takes place after some time. Trades
Page 21

An Insight Into the Indian Capital Market
taking place over a trading cycle (one day under rolling settlement) are settled together after a certain time. All the 23 stock exchanges in the country provide facilities for trading of corporate securities. Trades executed on NSE only are cleared and settled by a clearing corporation which provides novation and settlement guarantee. Nearly 100% of the trades in capital market segment are settled through demat delivery. NSE also provides a formal trading platform for trading of a wide range of debt securities including government securities in both retail and wholesale mode. NSE also provides trading in derivatives of equities, interest rate as well indices. In derivatives market (F&O market segment of NSE), standardized contracts are traded for future settlement. These futures can be on a basket of securities like an index or an individual security. In case of options, securities are traded for conditional future delivery. There are two types of options – a put option permits the owner to sell a security to the writer of options at a predetermined price while a call option permits the owner to purchase a security from the writer of the option at a predetermined price. These options can also be on individual stocks or basket of stocks like index.
Two exchanges, namely NSE and the Stock Exchange, Mumbai (BSE) provide trading of derivatives of securities. Today the market participants have the flexibility of choosing from a basket of products like:
• Equities
• Bonds issued by both Government and Companies
• Futures on benchmark indices as well as stocks
• Options on benchmark indices as well as stocks
• Futures on interest rate products like Notional 91-day T-Bills, 10 year notional zero
Page 22

An Insight Into the Indian Capital Market
HISTORY OF INDIAN CAPITAL MARKET
HISTORY OF INDIAN CAPITAL MARKET
Page 23

An Insight Into the Indian Capital Market
The history of the Indian capital markets and the stock market, in particular can be traced back to 1861 when the American Civil War began. The opening of the Suez Canal during the 1860s led to a tremendous increase in exports to the United Kingdom and United States. Several companies were formed during this period and many banks came to the fore to handle the finances relating to these trades. With many of these registered under the British Companies Act, the Stock Exchange, Mumbai, came into existence in 1875.
It was an unincorporated body of stockbrokers, which started doing business in the city under a banyan tree. Business was essentially confined to company owners and brokers, with very little interest evinced by the general public. There had been much fluctuation in the stock market on account of the American war and the battles in Europe. Sir Premchand Roychand remained a kingpin for many years.
Sir Phiroze Jeejeebhoy was another who dominated the stock market scene from 1946 to 1980. His word was law and he had a great deal of influence over both brokers and the government. He was a good regulator and many crises were averted due to his wisdom and practicality. The BSE building, icon of the Indian capital markets, is called P.J. Tower in his memory.
The planning process started in India in 1951, with importance being given to the formation of institutions and markets The Securities Contract Regulation Act 1956 became the parent regulation after the Indian Contract Act 1872, a basic law to be followed by security markets in India. To regulate the issue of share prices, the Controller of Capital Issues Act (CCI) was passed in 1947.
The stock markets have had many turbulent times in the last 140 years of their existence. The imposition of wealth and expenditure tax in 1957 by Mr. T.T. Krishnamachari, the then finance minister, led to a huge fall in the markets. The dividend freeze and tax on bonus issues in 1958-59 also had a negative impact. War with China in 1962 was another memorably bad year, with the resultant shortages increasing prices all round. This led to a ban on forward trading in commodity markets in 1966, which was again a very bad period, together with the introduction of the Gold Control Act in 1963.
The markets have witnessed several golden times too. Retail investors began participating in the stock markets in a small way with the dilution of the FERA in 1978. Multinational companies, with operations in India, were forced to reduce foreign share holding to below a certain percentage, which led to a compulsory sale of shares or issuance of fresh stock. Indian investors, who applied for these shares, encountered a real lottery because those were the days when the CCI decided the price at which the shares could be issued. There was no free pricing and their formula was very conservative.
The next big boom and mass participation by retail investors happened in 1980, with the entry of Mr. Dhirubhai Ambani. Dhirubhai can be said to be the father of modern capital markets. The Reliance public issue and subsequent issues on various Reliance companies generated
Page 24

An Insight Into the Indian Capital Market
huge interest. The general public was so unfamiliar with share certificates that Dhirubhai is rumoured to have distributed them to educate people.
Mr. V.P. Singh’s fiscal budget in 1984 was path-breaking for it started the era of liberalization. The removal of estate duty and reduction of taxes led to a swell in the new issue market and there was a deluge of companies in 1985. Mr. Manmohan Singh as Finance Minister came with a reform agenda in 1991 and this led to a resurgence of interest in the capital markets, only to be punctured by the Harshad Mehta scam in 1992. The mid-1990s saw a rise in leasing company shares, and hundreds of companies, mainly listed in Gujarat, and got listed in the BSE. The end- 1990s saw the emergence of Ketan Parekh and the information, communication and entertainment companies came into the limelight. This period also coincided with the dotcom bubble in the US, with software companies being the most favoured stocks. There was a meltdown in software stock in early 2000. Mr. P Chidambaram continued the liberalization and reform process, opening up of the companies, lifting taxes on long-term gains and introducing short-term turnover tax. The markets have recovered since then and we have witnessed a sustained rally that has taken the index over 13000.
Several systemic changes have taken place during the short history of modern capital markets. The setting up of the Securities and Exchange Board (SEBI) in 1992 was a landmark development. It got its act together, obtained the requisite powers and became effective in early 2000. The setting up of the National Stock Exchange in 1984, the introduction of online trading in 1995, the establishment of the depository in 1996, trade guarantee funds and derivatives trading in 2000, have made the markets safer. The introduction of the
Fraudulent Trade Practices Act, Prevention of Insider Trading Act, Takeover Code and Corporate Governance Norms, are major developments in the capital markets over the last few years that has made the markets attractive to foreign institutional investors. This history shows us that retail investors are yet to play a substantial role in the market as long-term investors. Retail participation in India is very limited considering the overall savings of households.
Investors who hold shares in limited companies and mutual fund units are about 20-30 million. Those who participated in secondary markets are 2-3 million. Capital markets will change completely if they grow beyond the cities and stock exchange centers reach the Indian villages. Both SEBI and retail participants should be active in spreading market wisdom and empowering investors in planning their finances and understanding the markets.
Page 25

An Insight Into the Indian Capital Market
Page 26

An Insight Into the Indian Capital Market
Financial markets facilitate the reallocation of savings from savers to entrepreneurs. Savings are linked to investments by a variety of intermediaries through a range of complex financial products called “securities” which is defined in the Securities Contracts (Regulation) Act, 1956 to include shares, bonds, scrips, stocks or other marketable securities of like nature in or of any incorporate company or body corporate, government securities, derivatives of securities, units of collective investment scheme, interest and rights in securities, security receipt or any other instruments so declared by the central government.
It is not that the users and suppliers of funds meet each other and exchange funds for securities. It is difficult to accomplish such double coincidence of wants. The amount of funds supplied by the supplier may not be the amount needed by the user. Similarly, the risk, liquidity and maturity characteristics of the securities issued by the issuer may not match preference of the supplier. In such cases, they incur substantial search costs to find each other. Search costs are ulfillin by the intermediaries who match and bring the suppliers and users of funds together. These intermediaries may act as agents to match the needs of users and suppliers of funds for a commission, help suppliers and users in creation and sale of securities for a fee or buy the securities issued by users and in turn, sell their own securities to suppliers to book profit. It is, thus, a misnomer that securities market disintermediates by establishing a direct relationship between the savers and the users of funds. The market does not work in a vacuum; it requires services of a large variety of intermediaries. The disintermediation in the securities market is in fact an intermediation with a difference, it is a risk-less intermediation,
Page 27
An Insight Into the Indian Capital Market
where the ultimate risks are borne by the savers and not the intermediaries. A large variety and number of intermediaries provide intermediation services in the Indian securities market. The securities market has essentially three categories of participants, namely the issuers of securities, investors in securities and the intermediaries and products include equities, bonds and derivatives. The issuers and investors are the consumers of services rendered by the intermediaries while the investors are consumers (they subscribe for and trade in securities) of securities issued by issuers.
In pursuit of providing a product to meet the needs of each investor and issuer, the intermediaries churn out more and more complicated products. They educate and guide them in their dealings and bring them together. Those who receive funds in exchange for securities and those who receive securities in exchange for funds often need the reassurance that it is safe to do so. This reassurance is provided by the law and by custom, often enforced by the regulator. The regulator develops fair market practices and regulates the conduct of issuers of securities and the intermediaries so as to protect the interests of suppliers of funds. The regulator ensures a high standard of service from intermediaries and supply of quality securities and non-manipulated demand for them in the market.
The past decade in many ways has been remarkable for securities market in India. It has grown exponentially as measured in terms of amount raised from the market, number of stock exchanges and other intermediaries, the number of listed stocks, market ulfillingion, trading volumes and turnover on stock exchanges, and investor population. Along with this growth, the profiles of the investors, issuers and intermediaries have changed significantly. The market has witnessed fundamental institutional changes resulting in drastic reduction in transaction costs and significant improvements in efficiency, transparency and safety.
Page 28

An Insight Into the Indian Capital Market
CAPITAL MARKET AT A GLANCE
Page 29
An Insight Into the Indian Capital Market
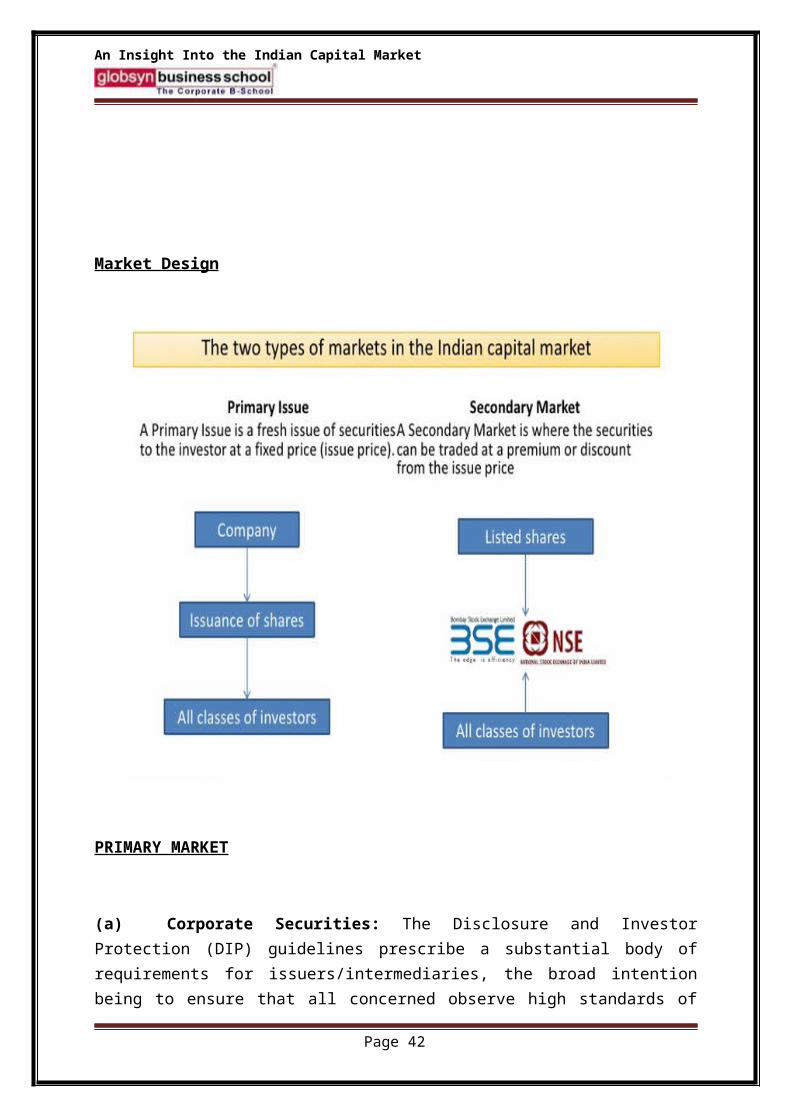
Market Design
PRIMARY MARKET
(a) Corporate Securities: The Disclosure and Investor Protection (DIP) guidelines prescribe a substantial body of requirements for issuers/intermediaries, the broad intention being to ensure that all concerned observe high standards of integrity and fair dealing, comply with all the requirements with due skill, diligence and care, and disclose the truth, whole truth and nothing but truth. The guidelines aim to secure fuller disclosure of relevant information about the issuer and the nature of the securities to be issued so that investors can take informed decisions. For example, issuers are required to disclose any material ‘risk factors’ and give justification for pricing in their prospectus. An unlisted company can access the market up to 5 times its pre-issue net-worth only if it has track record of distributable profits and net worth of Rs. 1 crore in 3 out of last five years. A listed company can access up to 5 times of its pre-issue net-worth. In case a company does not have track record or wishes to raise beyond 5 times of its pre-issue net-worth, it can access the market only through book building with minimum offer of 60% to qualified institutional buyers. Infrastructure companies are exempt
Page 30

An Insight Into the Indian Capital Market
from the requirement of eligibility norms if their project has been appraised by a public financial institution and not less than 5% of the project cost is financed by any of the institutions, jointly or severally, by way of loan and/or subscription to equity. The debt instruments of maturities more than 18 months require credit rating. If the issue size exceeds Rs. 100 crore, two ratings from different agencies are required. Thus the quality of the issue is demonstrated by track record/appraisal by approved financial institutions/credit rating/subscription by QIBs. The lead merchant banker discharges most of the pre-issue and post-issue obligations. He satisfies himself about all aspects of offering and adequacy of disclosures in the offer document. He issues a due diligence certificate stating that he has examined the prospectus, he finds it in order and that it brings out all the facts and does not contain anything wrong or misleading. He also takes care of allotment, refund and ulfilli of certificates. The admission to a depository for dematerialization of securities is a prerequisite for making a public or rights issue or an offer for sale. The investors, however, have the option of subscribing to securities in either physical form or dematerialized form. All new IPOs are compulsorily traded in I form. Every public listed company making IPO of any security for Rs. 10 crore or more is required to do so only in I form.
(b) Government Securities: The government securities market has witnessed significant transformation in the 1990s. With giving up of the responsibility of allocating resources from securities market, government stopped expropriating seigniorage and started borrowing at near – market rates. Government securities are now sold at market related coupon rates through a system of auctions instead of earlier practice of issue of securities at very low rates just to reduce the cost of borrowing of the government. Major reforms initiated in the primary market for government securities include auction system (uniform price and multiple price method) for primary issuance of T-bills and central government dated securities, a system of primary dealers and non-competitive bids to widen investor base and promote retail participation, issuance of securities across maturities to develop a yield curve from short to long end and provide benchmarks for rest of the debt market, innovative instruments like, zero coupon bonds, floating rate bonds, bonds with embedded derivatives, availability of full range ( 91-day and 382-day) of T-bills, etc.
Page 31
An Insight Into the Indian Capital Market
Page 32

An Insight Into the Indian Capital Market
Functions of Primary Market
The main service functions of the primary market are organization, underwriting and distribution. Origination deals with the origin of the new issue. The proposal is analyzed in terms of the nature of the security, the size of the issue, and timing of the issue and floatation method of the issue. Underwriting contract makes the share predictable and removes the element of uncertainty in the subscription. Distribution refers to the lead managers and brokers to the issue.
In the new issue market stocks are offered for the first time. The functions and the organization of the new issue market is different from the secondary market. In the new issue the lead mangers manage the issue, the underwriters assure to take up the unsubscribed portion according to his commitment for a commission and the bankers take up the responsibility of the collecting the application form and the money. Advertising agencies promote the new issue through advertising. Financial institutions and underwriter lend term loans to the company. Government agencies regulate the issue. The new issues are offered through prospectus. The prospectus is drafted according to SEBI guidelines disclosing the needed information to the investing public. In the bought out deal banks or a company buys the promoters shares and they offer them to the public at a later date. This reduces the cost of raising the fund. Private placement means placing of the issue with financial institutions. They sell shares to the investors at a suitable price. Right issue means the allotment of shares to the previous shareholders at a pro-ratio basis. Book building involves firm allotment of the instrument to a syndicate created by the lead managers. The book runner manages the issue. Norms are given by the SEBI to price the issue. Proportionate allotment method is adopted in the allocation of shares. Project appraisal, disclosure in the prospectus and clearance of the prospectus by the stock exchanges protect the investors in the primary market along with the active role played by the SEBI.
Page 33

An Insight Into the Indian Capital Market
Page 34
An Insight Into the Indian Capital Market
SECONDARY MARKET
(a) Corporate Securities: The stock exchanges are the exclusive centres for trading of securities. Though the area of operation/jurisdiction of an exchange is specified at the time of its recognition, they have been allowed recently to set up trading terminals anywhere in the country. The three newly set up exchanges (OTCEI, NSE and ICSE) were permitted since their inception to have nation-wide trading. The trading platforms of a few exchanges are now accessible from many locations. Further, with extensive use of information technology, the trading platforms of a few exchanges are also accessible from anywhere through the Internet and mobile devices. This made a huge difference in a geographically vast country like India.
(b) Exchange Management: Most of the stock exchanges in the country are organized as “mutuals” which was considered beneficial in terms of tax benefits and matters of compliance. The trading members, who provide brokering services, also own, control and manage the exchanges. This is not an effective model for self-regulatory ulfillingio as the regulatory and public interest of the exchange conflicts with private interests. Efforts are on to demutualise the exchanges whereby ownership, management and trading membership would be segregated from one another. Two exchanges viz. OTCEI and NSE are demutualised from inception, where ownership, management and trading are in the hands of three different sets of people. This model eliminates conflict of interest and helps the exchange to pursue market efficiency and investor interest aggressively.
I Membership: The trading platform of an exchange is accessible only to brokers. The broker enters into trades in exchanges either on his own account or on behalf of clients. No stock broker or sub-broker is allowed to buy, sell or deal in securities, unless he or she holds a certificate of registration granted by SEBI. A broker/sub-broker complies with the code of conduct prescribed by SEBI. Over time, a number of brokers – proprietor firms and partnership firms – have converted themselves into ulfillin. The standards for admission of members stress on factors, such as corporate structure, capital adequacy, track record, education, experience, etc. and reflect a conscious endeavor to ensure quality broking services.
(d) Listing: A company seeking listing satisfies the exchange that at least 10% of the securities, subject to a minimum of 20 lakh securities, were offered to public for subscription, and the size of the net offer to the public (i.e. the offer price multiplied by the number of securities offered to the public, excluding reservations, firm allotment and promoters’ contribution) was not less than Rs.100 crore, and the issue is made only through book building method with allocation of 60% of the issue size to the qualified institutional buyers.
Page 35

An Insight Into the Indian Capital Market
In the alternative, it is required to offer at least 25% of the securities to public. The company is also required to maintain the minimum level of non-promoter holding on a continuous basis. In order to provide an opportunity to investors to invest/trade in the securities of local companies, it is mandatory for the companies, wishing to list their securities, to list on the regional stock exchange nearest to their registered office. If they so wish, they can seek listing on other exchanges as well. Monopoly of the exchanges within their allocated area, regional aspirations of the people and mandatory listing on the regional stock exchange resulted in multiplicity of exchanges. The basic norms for listing of securities on the stock exchanges are uniform for all the exchanges. These norms are specified in the listing agreement entered into between the company and the concerned exchange. The listing agreement prescribes a number of requirements to be continuously complied with by the issuers for continued listing and such compliance is monitored by the exchanges. It also stipulates the disclosures to be made by the companies and the corporate governance practices to be followed by them.
SEBI has been issuing guidelines/circulars prescribing certain norms to be included in the listing agreement and to be complied with by the companies. A listed security is available for trading on the exchange. The stock exchanges levy listing fees – initial fees and annual fees – from the listed companies. It is a major source of income for many exchanges. A security listed on other exchanges is also permitted for trading. A listed company can voluntary delist its securities from non-regional stock exchanges after providing an exit opportunity to holders of securities in the region where the concerned exchange is located. An exchange can, however, delist the securities compulsorily following a very stringent procedure.
(e) Trading Mechanism: The exchanges provide an on-line fully-automated screen based trading system (SBTS) where a member can punch into the computer quantities of securities and the prices at which he likes to transact and the transaction is executed as soon as it finds a matching order from a counter party. SBTS electronically matches orders on a strict price/time priority and hence cuts down on time, cost and risk of error, as well as on fraud resulting in improved operational efficiency. It allows faster incorporation of price sensitive information into prevailing prices, thus increasing the informational efficiency of markets. It enables market participants to see the full market on real-time, making the market transparent. It allows a large number of participants, irrespective of their geographical locations, to trade with one another simultaneously, improving the depth and liquidity of the market. It provides full anonymity by accepting orders, big or small, from members without revealing their identity, thus providing equal access to everybody. It also provides a perfect audit trail, which helps to resolve disputes by logging in the trade execution process in entirety.
(f) Trading Rules: Regulations have been framed to prevent insider trading as well as unfair trade practices. The acquisitions and takeovers are permitted in a well defined and orderly manner. The companies are permitted to buy back their securities to improve liquidity and enhance the shareholders’ wealth.
Page 36

An Insight Into the Indian Capital Market
(g) Price Bands: Stock market volatility is generally a cause of concern for both policy makers as well as investors. To curb excessive volatility, SEBI has prescribed a system of price bands. The price bands or circuit breakers bring about a coordinated trading halt in all equity and equity derivatives markets nation-wide. An index-based market-wide circuit breaker system at three stages of the index movement either way at 10%, 15% and 20% has been prescribed. The movement of either S&P CNX Nifty or Sensex, whichever is breached earlier, triggers the breakers. As an additional measure of safety, individual scrip-wise price bands of 20% either way have been imposed for all securities except those available for stock options.
(h) Demat Trading: The Depositories Act, 1996 was passed to proved for the establishment of depositories in securities with the objective of ensuring free transferability of securities with speed, accuracy and security by
(a) making securities of public limited companies freely transferable subject to certain exceptions;
(b) ulfillingion the securities in the depository mode; and
I providing for maintenance of ownership records in a book entry form. In order to streamline both the stages of settlement process, the Act envisages transfer of ownership of securities electronically by book entry without making the securities move from person to person. Two depositories, viz. NSDL and CDSL, have come up to provide instantaneous electronic transfer of securities. At the end of March 2002, 4,172 and 4,284 companies were connected to NSDL and CDSL respectively. The number of I securities increased to 56.5 billion at the end of March 2002. As on the same date, the value of dematerialsied securities was Rs. 4,669 billion and the number of investor accounts was 4,605,588. All actively traded scrips are held, traded and settled in demat form. Demat settlement accounts for over 99% of turnover settled by delivery. This has almost eliminated the bad deliveries and associated problems. To prevent physical certificates from sneaking into circulation, it has been mandatory for all new IPOs to be compulsorily traded in dematerialized form. The admission to a depository for I of securities has been made a prerequisite for making a public or rights issue or an offer for sale. It has also been made compulsory for public listed companies making IPO of any security for Rs. 10 crore or more to do the same only in I form.
(i) Charges: A stock broker is required to pay a registration fee of Rs.5,000 every financial year, if his annual turnover does not exceed Rs. 1 crore. If the turnover exceeds Rs. 1 crore during any financial year, he has to pay Rs. 5,000 plus one-hundredth of 1% of the turnover in excess of Rs.1 crore. After the expiry of five years from the date of initial registration as a broker, he has to pay Rs. 5,000 for a block of five financial years. Besides, the exchanges collect transaction charges from its trading members. NSE levies Rs. 4 per lakh of turnover. The maximum brokerage a trading member can levy in respect of securities transactions is
Page 37

An Insight Into the Indian Capital Market
2.5% of the contract price, exclusive of statutory levies like SEBI turnover fee, service tax and stamp duty. However, brokerage charges as low as 0.15% are also observed in the market.
(j) Trading Cycle: Rolling settlement on T+3 basis gave way to T+2 from April 2003. The market has moved close to spot/cash market.
(k) Risk Management: To pre-empt market failures and protect investors, the regulator/exchanges have developed a comprehensive risk management system, which is constantly monitored and upgraded. It encompasses capital adequacy of members, adequate margin requirements, limits on exposure and turnover, indemnity insurance, on-line position monitoring and automatic disablement, etc. They also administer an efficient market surveillance system to curb excessive volatility, detect and prevent price manipulations. Exchanges have set up trade/settlement guarantee funds for meeting shortages arising out of nonfulfillment/partial fulfillment of funds obligations by the members in a settlement. A clearing corporation assures the counterparty risk of each member and guarantees financial settlement in respect of trades executed on NSE.
(l) Government Securities: The reforms in the secondary market include Delivery versus Payment system for settling scrip less SGL transactions to reduce settlement risks, SGL Account II with RBI to enable financial intermediaries to open custody (Constituent SGL) accounts and facilitate retail transactions in scrip less mode, enforcement of a trade-for-trade regime, settlement period of T+0 or T+1 for all transactions undertaken directly between SGL participants and up to T+5 days for transactions routed through NSE brokers, routing transactions through brokers of NSE, OTCEI and BSE, repos in all government securities with settlement through SGL, liquidity support to PDs to enable them to support primary market and undertake market making, special fund facility for security settlement, etc. As part of the ongoing efforts to build debt market infrastructure, two new systems, the Negotiated Dealing System (NDS) and the Clearing Corporation of India Limited (CCIL) commenced operations on February 15, 2002. NDS, facilitates screen based negotiated dealing for secondary market transactions in government securities and money market instruments, online reporting of transactions in the instruments available on the NDS and dissemination of trade information to the market. Government Securities (including T-bills), call money, notice/term money, repos in eligible securities, Commercial Papers and Certificate of Deposits are available for negotiated dealing through NDS among the members. The CCIL facilitates settlement of transactions in government securities (both outright and repo) on Delivery versus Payment (DvP-II) basis which provides for settlement of securities on gross basis and settlement of funds on net basis simultaneously. It acts as a central counterparty for clearing and settlement of government securities transactions done on NDS.
Page 38

An Insight Into the Indian Capital Market
Relationship between the Primary and Secondary Market
1. The new issues market cannot function without the secondary market. The secondary market or the stock market provides liquidity for the issued securities. The issued securities are traded in the secondary market offering liquidity to the stocks at a fair price.
2. The stock exchanges through their listing requirements, exercise control over the primary market. The company seeking for listing on the respective stock exchange has to comply with all the rules and regulations given by the stock exchange.
3. The primary market provides a direct link between the prospective investors and the company. By providing liquidity and safety, the stock markets encourage the public to subscribe to the new issues. The marketability and the capital appreciation provided in the
Page 39
An Insight Into the Indian Capital Market
stock market are the major factors that attract the investing public towards the stock market. Thus, it provides an indirect link between the savers and the company.
4. Even though they are complementary to each other, their functions and the organizational set up are different from each other. The health of the primary market depends on the secondary market and vice versa.
Page 40

An Insight Into the Indian Capital Market
CURRENT STATUS OF INDIAN CAPITAL
MARKET
CURRENT STATUS OF INDIAN CAPITAL MARKET
Page 41
An Insight Into the Indian Capital Market
Market ulfillingion and turnover
As on March 31, 2000, the Indian stock market had a market ulfillingion of over Rs 10 trillion ($ 230 billion) representing 58per cent of GDP. The annual trading volume in all the exchanges put together amounted to Rs 20 trillion (approximately twice the market ulfillingion). The average daily trading volume is about $2 billion and there are days on which the turnover is twice this level.
India has 9,871 listed companies; this number is second only to that of the United States. However, most of the trading volume is concentrated in a few hundred stocks, and even within this, the top hundred stocks account for a disproportionate share of the trading volume.
The Indian capital market is well-diversified in terms of ownership pattern and industry structure. Most of the top 50 companies are domestic private sector companies with no single family or business group accounting for a disproportionate share. There is no foreign owned corporation, public sector ulfillingi or newly ulfilling company in the top five stocks by market ulfillingion. Companies with a market ulfillingion of $1 billion or more are present in industries as diverse as software, petrochemicals, oil refining, consumer goods, telecom, banking, pharmaceuticals, and entertainment.
In the last few years, however, new economy stocks have shown rapid increase in their market ulfillingion and turnover. In the BSE 500 index covering the top 500 listed companies, new economy stocks account for about 49per cent of market ulfillingion and 50per cent of the average daily turnover.
Stock exchanges
India boasts of the oldest stock exchange in Asia – the Bombay Stock Exchange is 125 years old. There are 23 recognised exchanges spread across the country, but a process of consolidation is now under way. Many of the regional stock exchanges have started aligning themselves with one or both of the two large exchanges (the Bombay Stock Exchange and the National Stock Exchange) both of which have VSAT networks that give them a nation wide reach.
The National Stock Exchange is an unlisted for-profit company set up by some of the leading financial institutions of India. Most of the remaining stock exchanges are broker-owned (mutual) ulfillingio, but the Bombay Stock Exchange is actively considering ulfillingion. The Securities and Exchange Board of India (SEBI), the apex regulator of the capital market has regulations that mandate a minimum number of outside directors on the governing board and provide greater autonomy to the professional executives in the day-to-day running of the exchange.
Trading and settlement
Page 42

An Insight Into the Indian Capital Market
India’s stock exchanges are fully ulfillingi order driven or order-cum-quote driven systems. The country has made rapid strides towards a I trading environment on the basis of a competing depositories model. Investors have the choice of holding their stocks in physical or I form, but trading in the exchanges is in mandatory I mode in most important stocks. As of October 2000, about 98per cent of the trading in the stock exchanges is in I mode.
India has put in place a regulatory regime for internet trading of stocks. A large number of online brokers have started operations. More brokers are expected to follow when the exchanges put in place an ASP (Application Service Provider) model for online trading software. However, currently, the level of penetration of online trading is extremely small.
The stock exchanges currently run two parallel settlement systems. Practically all the trading takes place in the account period settlement system in which all trades during a weekly account period are netted off and the net obligations are settled five business days after the end of the period. The other unpopular system is that of rolling settlements where trades of each day are settled on a T+5 basis. SEBI is currently working on mandatorily shifting all stocks in a phased manner to the rolling settlement system. Further improvements in the settlement system to T+3 or beyond would have to wait for improvements in the payment system.
However, account period settlement does not give rise to significant systemic risks in India because of stringent end of day and intra-day margining systems. Put simply, the weekly settlement is regarded as akin to a one-week futures contract, and the systemic risk is taken care of by using futures style margining. The exchange imposes daily mark to market and initial margins on the brokers to eliminate settlement risk. Exchanges also have clearing houses to guarantee settlements on the exchange. As a result, there have been no settlement failures in the principal stock exchanges during the last five years.
Primary market
India enjoyed a major boom of IPOs in the mid 1990s. This hot IPO period came to an end in 1995-96 with a fall in the stock market and a downturn in the economy. Investors who subscribed at the height of the boom suffered significant losses, and the primary market has yet to recover from this debacle. In the late 1990s, moreover, the Indian corporate sector was in the midst of a structural transformation with the old economy companies stocks doing badly in the face of global competition while software companies delivered outstanding financial results. The stock market also rewarded the new economy stocks with high valuations. In this environment, it was difficult for most old economy companies to come to the market with a credible business plan. Software companies in India have used a stock market listing primarily to establish a valuation and create an acquisition currency as their large positive cash flows leave them with little need for additional funding.
At the same time, SEBI has been concerned about public capital raising by companies with no track record. Newly set up software companies, entertainment companies and internet
Page 43

An Insight Into the Indian Capital Market
companies with no tangible assets pose particular problems of valuation. In this situation, SEBI has moved half-way towards a QIB (Qualified Institutional Buyers) market for some of these stocks. This mandatory gatekeeping approach is discussed later in this paper. In 1999-2000, a total of Rs 78 billion was raised in the Indian capital market, of which about Rs 45 billion was in the form of equity and the balance in the form of debt.
Disclosure and corporate governance
India moved from a merit based regulation to a disclosure based regulation of the primary market with the establishment of the Securities and Exchange Board of India (SEBI) in 1992. The level of disclosure has increased progressively in recent years as SEBI has attempted to bring disclosure requirements up to international levels. This is an ongoing exercise.
In the field of continuing disclosure, listed companies are now required to disclose unaudited financial results on a quarterly basis, and there is now a subject these results to limited auditor review. The Accounting Standards Board set up by the accounting profession is engaged in a major exercise to bring Indian accounting standards on par with those of the IASC (International Accounting Standards Committee).
SEBI is now in the process of implementing the Corporate Governance Code framed by the Birla Committee through the listing agreement. Under this code, companies are required to have a minimum number of independent directors, and to have an audit committee.
Globalisation
India operates a rigorous system of exchange controls on the capital account. However, a window has been created for foreign portfolio investment. As on March 31, 2000, there were 506 Foreign Institutional Investors (FIIs) registered with SEBI. These FIIs had in the aggregate invested $11.23 billion in the Indian stock market; this represents about 5 per cent of the market ulfillingion.
Indian companies have also been allowed to issue shares outside the country in the form of GDRs (Global Depository Receipts) and ADRs (American Depository Receipts). From 1992-93 to 1998-99, Indian companies raised Rs 274 billion in this form. Any holder of ADRs and GDRs can convert these into the underlying domestic shares. However conversion in the opposite direction is not permitted.
Mutual funds
Page 44

An Insight Into the Indian Capital Market
As on March 31, 2000, there were 37 mutual funds registered with SEBI. This is in addition to the country’s largest and oldest mutual fund, the Unit Trust of India, which is not yet under SEBI’s regulatory purview. These mutual funds had floated a total of 330 different mutual fund schemes, which together controlled assets of Rs 1.1 trillion ($ 25 billion) representing about 11per cent of the market ulfillingion.
Investor population and profile
According to the investor survey carried out by the National Council of Applied Economic Research (NCAER) together with SEBI, about 8per cent of all households hold equity shares or debentures. This constitutes an investor base of 19 million individuals. Investors in mutual funds numbered about 23 million thanks mainly to the long established Unit Trust of India. Allowing for common ownership of shares and mutual funds, there are probably about 30 million direct and indirect investors in the Indian capital market.
The share of household financial savings that goes to the capital market is very small at around 3 per cent. This share had reached a level of 23 per cent in early 1990s towards the end of a long boom in the capital markets and has been steadily declining since then.
Derivatives market
India’s fledgling index futures market is less than six months old and the trading volume is far below even one per cent of the cash market volumes. Global experience suggests that the market may still be in the initial stage of low awareness and low acceptance, and that the market could pick up in coming months. There are also plans to introduce new derivative products.
Page 45

An Insight Into the Indian Capital Market
CLASSIFICATION OF INDIAN CAPITAL
MARKET
CLASSIFICATION OF INDIAN CAPITAL MARKET:
Page 46

An Insight Into the Indian Capital Market
PRIMARY MARKET
The primary is that part of the capital markets that deals with the issuance of new securities. Companies, governments or public sector institutions can obtain funding through the sale of a new stock or bond issue. This is typically done through a syndicate of securities dealers. The process of selling new issues to investors is called underwriting. In the case of a new stock issue, this sale is an initial public offering (IPO). Dealers earn a commission that is built into the price of the security offering, though it can be found in the prospectus.
The primary market for equity, which consists of both the ‘initial public offering’ (IPO)market and the ‘seasoned equity offering’ (SEO) markets, experienced considerable activity in 2005 and 2006 (Table 4.1). In 2006,Rs.30,325 crore of resources were raised onthis market, of which Rs.9,918 crore were made up by 55 companies which were listed for the first time (IPOs). The number of IPOs per year has risen steadily from 2002 onwards. A level of 55 IPOs in the year translates to roughly 4 IPOs every month. The mean IPO size, which was elevated in 2005, returned to Rs.180 crore, which is similar to the value prevalent in 2003. 4.3 The primary issuance of debt securities, as per SEBI, fell to a low of around Rs. 66 crore in 2006, which is one facet of the far-reaching difficulties of the debt market. Unlike equity securities, debt securities issued at previous dates are redeemed by companies every year. Hence, a year with a low issuance of fresh debt securities is a year in which the stock of outstanding debt securities drops. In addition to resource ulfillingi by the issuance of debt and equity securities, one of the most important mechanisms of financing that has been used by Indian firms is retained earnings, which are also a part of equity financing.
Page 47

An Insight Into the Indian Capital Market
New issue market instruments
The term initial public offering (IPO) slipped into everyday speech during the tech bull market of the late 1990s. Back then, it seemed you couldn’t go a day without hearing about a dozen new dotcom millionaires in Silicon Valley who were cashing in on their latest IPO. The phenomenon spawned the term siliconaire, which described the dotcom entrepreneurs in their early 20s and 30s who suddenly found themselves living large on the proceeds from their internet companies’ IPOs.
Selling Stock
An initial public offering, or IPO, is the first sale of stock by a company to the public. A company can raise money by issuing either debt or equity. If the company has never issued equity to the public, it’s known as an IPO.
Companies fall into two broad categories: private and public.
A privately held company has fewer shareholders and its owners don’t have to disclose much information about the company. Anybody can go out and incorporate a company: just put in some money, file the right legal documents and follow the reporting rules of your jurisdiction. Most small businesses are privately held. But large companies can be private too.
Page 48

An Insight Into the Indian Capital Market
It usually isn’t possible to buy shares in a private company. You can approach the owners about investing, but they’re not obligated to sell you anything. Public companies, on the other hand, have sold at least a portion of themselves to the public and trade on a stock exchange. This is why doing an IPO is also referred to as “going public.” Public companies have thousands of shareholders and are subject to strict rules and regulations. They must have a board of directors and they must report financial information every quarter. In the United States, public companies report to the Securities and Exchange Commission (SEC). In other countries, public companies are overseen by governing bodies similar to the SEC. From an investor’s standpoint, the most exciting thing about a public company is that the stock is traded in the open market, like any other commodity. If you have the cash, you can invest. The CEO could hate your guts, but there’s nothing he or she could do to stop you from buying stock.
Going public raises cash, and usually a lot of it. Being publicly traded also opens many financial doors:
Because of the increased scrutiny, public companies can usually get better rates when they issue debt.
As long as there is market demand, a public company can always issue more stock. Thus, mergers and acquisitions are easier to do because stock can be issued as part of the deal.
Trading in the open markets means liquidity. This makes it possible to implement things like employee stock ownership plans, which help to attract top talent.
Being on a major stock exchange carries a considerable amount of prestige. In the past, only private companies with strong fundamentals could qualify for an IPO and it wasn’t easy to get listed.
The internet boom changed all this. Firms no longer needed strong financials and a solid history to go public. Instead, IPOs were done by smaller startups seeking to expand their businesses. There’s nothing wrong with wanting to expand, but most of these firms had never made a profit and didn’t plan on being profitable any time soon. Founded on venture capital funding, they spent like Texans trying to generate enough excitement to make it to the market before burning through all their cash. In cases like this, companies might be suspected of doing an IPO just to make the founders rich. This is known as an exit strategy, implying that there’s no desire to stick around and create value for shareholders. The IPO then becomes the end of the road rather than the beginning.
SECONDARY MARKET:
Page 49
An Insight Into the Indian Capital Market
Outstanding securities are traded in the secondary market, which is commonly known as stock market or stock exchange. In the secondary market, the investors can sell and buy securities. Stock markets predominantly deal in the equity shares. Debt instruments like bonds and debentures are also traded in the stock market.
Dematerialization
Indian investor community has undergone sea changes in the past few years. India now has a very large investor population and ever increasing volumes of trades. However, this continuous growth in activities has also increased problems associated with stock trading. Most of these problems arise due to the intrinsic nature of paper based trading and settlement, like theft or loss of share certificates. This system requires handling of huge volumes of paper leading to increased costs and inefficiencies. Risk exposure of the investor also increases due to this trading in paper.
Some of these risks are:
Delay in transfer of shares.
Possibility of forgery on various documents leading to bad deliveries, legal disputes etc.
Possibility of theft of share certificates.
Prevalence of fake certificates in the market.
Mutilation or loss of share certificates in transit.
The physical form of holding and trading in securities also acts as a bottleneck for broking community in capital market operations.
The introduction of NSE and BOLT has increased the reach of capital market manifolds. The increase in number of investors participating in the capital market has increased the possibility of being hit by a bad delivery. The cost and time spent by the brokers for rectification of these bad deliveries tends to be higher with the geographical spread of the clients. The increase in trade volumes lead to exponential rise in the back office operations thus limiting the growth potential of the broking members. The inconvenience faced by investors (in areas that are far flung and away from the main metros) in settlement of trade also limits the opportunity for such investors, especially in participating in auction trading. This has made the investors as well as broker wary of Indian capital market. In this scenario dematerialized trading is certainly a welcome move.
What is Dematerialization?
Page 50

An Insight Into the Indian Capital Market
Dematerialization or “Demat” is a process whereby your securities like shares, debentures etc, are converted into electronic data and stored in computers by a Depository. Securities registered in your name are surrendered to depository participant (DP) and these are sent to the respective companies who will cancel them after “Dematerialization” and credit your depository account with the DP. The securities on Dematerialization appear as balances in your depository account. These balances are transferable like physical shares. If at a later date, you wish to have these “demat” securities converted back into paper certificates, the Depository helps you to do this.
Depository
Depository functions like a securities bank, where the dematerialized physical securities are traded and held in custody. This facilitates faster, risk free and low cost settlement. Depository is much like a bank and perform many activities that are similar to a bank.
Following table compares the two.
Bank Depository
Holds funds in accounts Holds securities in account
Transfers funds between accounts Transfers securities between accounts
Transfers without handling money Transfers without handling securities
Safekeeping of money Safekeeping of securities
NSDL and CDSL
At present there are two depositories in India, National Securities Depository Limited (NSDL) and Central Depository Services (CDS). NSDL is the first Indian depository, it was inaugurated in November 1996. NSDL was set up with an initial capital of US$28mn, promoted by Industrial Development Bank of India (IDBI), Unit Trust of India (UTI) and National Stock Exchange of India Ltd. (NSEIL). Later, State Bank of India (SBI) also became a shareholder.
The other depository is Central Depository Services (CDS). It is still in the process of linking with the stock exchanges. It has registered around 20 DPs and has signed up with 40 companies. It had received a certificate of commencement of business from Sebi on February 8, 1999.
Page 51

An Insight Into the Indian Capital Market
These depositories have appointed different Depository Participants (DP) for them. An investor can open an account with any of the depositories’ DP. But transfers arising out of trades on the stock exchanges can take place only amongst account-holders with NSDL’s DPs. This is because only NSDL is linked to the stock exchanges (nine of them including the main ones-National Stock Exchange and Bombay Stock Exchange).
In order to facilitate transfers between investors having accounts in the two existing depositories in the country the Securities and Exchange Board of India has asked all stock exchanges to link up with the depositories. Sebi has also directed the companies’ registrar and transfer agents to effect change of registered ownership in its books within two hours of receiving a transfer request from the depositories. Once connected to both the depositories the stock exchanges have also to ensure that inter-depository transfers take place smoothly. It also involves the two depositories connecting with each other. The NSDL and CDS have signed an agreement for inter-depository connectivity.
Depositiory Participant
NSDL carries out its activities through various functionaries called business partners who include Depository Participants (DPs), Issuing ulfillin and their Registrars and Transfer Agents, Clearing corporations/ Clearing Houses etc. NSDL is electronically linked to each of these business partners via a satellite link through Very Small Aperture Terminals (VSATs). The entire integrated system (including the VSAT linkups and the software at NSDL and each business partner’s end) has been named as the “NEST” [National Electronic Settlement & Transfer] system.
The investor interacts with the depository through a depository participant of NSDL. A DP can be a bank, financial institution, a custodian or a broker
Just as one opens a bank account in order to avail of the services of a bank, an investor opens a depository account with a depository participant in order to avail of depository facilities.
Page 52

An Insight Into the Indian Capital Market
Page 53

An Insight Into the Indian Capital Market
Benefits of demat:
Transacting the depository way has several advantages over the traditional system of transacting using share certificates. Some of the benefits are:
Trading in demat segment completely eliminates the risk of bad deliveries, which in turn eliminates all cost and wastage of time associated with follow up for rectification. This reduction in risk associated with bad delivery has lead to reduction in brokerage to the extent of 0.5% by quite a few brokerage firms.
In case of transfer of electronic shares, you save 0.5% in stamp duty.
You also avoid the cost of courier/ notarization/ the need for further follow-up with your broker for shares returned for company objection
In case the certificates are lost in transit or when the share certificates become mutilated or misplaced, to obtain duplicate certificates, you may have to spend at least Rs500 for indemnity bond, newspaper advertisement etc, which can be completely eliminated in the demat form.
You can also receive your bonuses and rights into your depository account as a direct credit, thus eliminating risk of loss in transit.
You can also expect a lower interest charge for loans taken against demat shares as compared to the interest for loan against physical shares. This could result in a saving of about 0.25% to 1.5%. Some banks have already announced this.
RBI has increased the limit of loans against dematerialized securities as collateral to Rs2mn per borrower as against Rs1mn per borrower in case of loans against physical securities.
RBI has also reduced the minimum margin to 25% for loans against dematerialized securities as against 50% for loans against physical securities.
Following are the main financial products/instruments dealt in the secondary market:
Equity: The ownership interest in a company of holders of its common and preferred stock. The various kinds of equity shares are as follows –
Equity Shares:
An equity share, commonly referred to as ordinary share also represents the form of fractional ownership in which a shareholder, as a fractional owner, undertakes the maximum entrepreneurial risk associated with a business venture. The holders of such shares are
Page 54

An Insight Into the Indian Capital Market
members of the company and have voting rights. A company may issue such shares with differential rights as to voting, payment of dividend, etc.
Rights Issue/ Rights Shares: The issue of new securities to existing shareholders at a ratio to those already held.
Bonus Shares: Shares issued by the companies to their shareholders free of cost by capitalization of accumulated reserves from the profits earned in the earlier years.
Preferred Stock/ Preference shares: Owners of these kind of shares are entitled to a fixed dividend or dividend calculated at a fixed rate to be paid regularly before dividend can be paid in respect of equity share. They also enjoy priority over the equity shareholders in payment of surplus. But in the event of liquidation, their claims rank below the claims of the company’s creditors, bondholders / debenture holders.
Cumulative Preference Shares: A type of preference shares on which dividend accumulates if remains unpaid. All arrears of preference dividend have to be paid out before paying dividend on equity shares.
Cumulative Convertible Preference Shares: A type of preference shares where the dividend payable on the same accumulates, if not paid. After a specified date, these shares will be converted into equity capital of the company.
Participating Preference Share: The right of certain preference shareholders to participate in profits after a specified fixed dividend contracted for is paid. Participation right is linked with the quantum of dividend paid on the equity shares over and above a particular specified level.
Security Receipts: Security receipt means a receipt or other security, issued by a securitisation company or reconstruction company to any qualified institutional buyer pursuant to a scheme, evidencing the purchase or acquisition by the holder thereof, of an undivided right, title or interest in the financial asset involved in securitisation.
Government securities (G-Secs): These are sovereign (credit risk-free) coupon bearing instruments which are issued by the Reserve Bank of India on behalf of Government of India, in lieu of the Central Government’s market borrowing programme. These securities have a fixed coupon that is paid on specific dates on half-yearly basis. These securities are available in wide range of maturity dates, from short dated (less than one year) to long dated (upto twenty years).
Page 55

An Insight Into the Indian Capital Market
Debentures: Bonds issued by a company bearing a fixed rate of interest usually payable half yearly on specific dates and principal amount repayable on particular date on redemption of the debentures. Debentures are normally secured/ charged against the asset of the company in favour of debenture holder.
Bond: A negotiable certificate evidencing indebtedness. It is normally unsecured. A debt security is generally issued by a company, municipality or government agency. A bond investor lends money to the issuer and in exchange, the issuer promises to repay the loan amount on a specified maturity date. The issuer usually pays the bond holder periodic interest payments over the life of the loan. The various types of Bonds are as follows-
Zero Coupon Bond: Bond issued at a discount and repaid at a face value. No periodic interest is paid. The difference between the issue price and redemption price represents the return to the holder. The buyer of these bonds receives only one payment, at the maturity of the bond.
Convertible Bond: A bond giving the investor the option to convert the bond into equity at a fixed conversion price.
Commercial Paper: A short term promise to repay a fixed amount that is placed on the market either directly or through a specialized intermediary. It is usually issued by companies with a high credit standing in the form of a promissory note redeemable at par to the holder on maturity and therefore, doesn’t require any guarantee. Commercial paper is a money market instrument issued normally for a tenure of 90 days.
Treasury Bills: Short-term (up to 91 days) bearer discount security issued by the Government as a means of financing its cash requirements.
DEBT INSTRUMENTS
To meet the long term and short term needs of finance, firms issue various kinds of Securities to the public. Securities represent claims on a stream of income and /or particular assets. Debentures are debt securities, and there is a wide range of them. Market loans are raised by the government and public sector institutions through debt securities. Equity shares issued by cooperates are ownership securities. Preference shares are a hybrid security. It is a mixture of an ownership security and debt security.
Page 56

An Insight Into the Indian Capital Market
DEBENTURES
A debenture is a document which either creates a debt or acknowledges it. Debenture issued by a company is in the form of a certificate acknowledging indebtedness. The debentures are issued under the Company’s Common Seal. Debentures are one of a series issued to a number of lenders. The date of repayment is specified in the debentures. Debentures are issued against a charge on the assets of the Company. Debentures holders have no right to vote at the meetings of the companies.
KINDS OF DEBENTURES
(a)Bearer Debentures:
They are registered and are payable to the bearer. They are negotiable instruments and are transferable by delivery.
(b) Registered Debentures:
They are payable to the registered holder whose name appears both on the debentures and in the Register of Debenture Holders maintained by the company. Registered Debentures can be transferred but have to be registered again. Registered Debentures are not negotiable instruments. A registered debenture contains a commitment to pay the principal sum and interest. It also has a description of the charge and a statement that it is Issued subject to the conditions endorsed therein.
I Secured Debentures:
Debentures which create a change on the assets of the company which may be fixed or floating are known as secured Debentures. The term “bonds” and “debentures”(secured) are used interchangeably in common parlance. In USA, BOND is a long term contract which is secured, whereas a debentures is an unsecured one.
(d) Unsecured or Naked Debentures:
Debentures which are issued without any charge on assets are insecured or naked debentures. The holders are like unsecured creditors and may see the company for the recovery of debt.
(e) Redeemable Debentures:
Normally debentures are issued on the condition that they shall be redeemed after a certain period. They can however, be reissued after redemption.
(f) Perpetual Debentures:
When debentures are irredeemable they are called perpetual. Perpetual Debentures cannot be issued in India at present.
Page 57

An Insight Into the Indian Capital Market
(g) Convertible Debentures:
If an option is given to convert debentures into equity shares at the stated rate of exchange after a specified period, they are called convertible debentures. Convertible Debentures have become very popular in India. On conversion the holders cease to be lenders and become owners.
Debentures are usually issued in a series with a pari passu (at the same rate) clause which entitles them to be discharged rateably though issued at different times. New series of debentures cannot rank pari passu with the old series unless the old series provides so.
New debt instruments issued by public limited companies are participating debentures, convertible debentures with options, third party convertible debentures convertible debentures redeemable at premiums, debt equity swaps and zero coupon convertible notes. These are discussed below:
(h) Participating Debentures:
They are unsecured corporate debt securities which participate in the profits of the company. They might find investors if issued by existing dividend paying companies.
(i) Convertible Debentures with options:
They are a derivative of convertible debentures with an embedded option, providing flexibility to the issuer as well as the investor to exit from the terms of the issue. The coupon rate is specified at the time of issue.
(j) Third Party Convertible Debentures:
They are debt with a warrant allowing the investor to subscribe to the equity of third firm at a preferential price visa vis the market price. Interest rate on third party convertible debentures is lower than pure debt on account of the conversion option.
(k) Convertible-Debentures Redeemable at a Premium:
Convertible Debentures are issued at face value with ‘a put option entitling investors to sell the bond to the issuer at a premium. They are basically similar to convertible debentures but embody less risk.
(I) Debt-Equity Swaps:
Debt-Equity Swaps are an offer from an issuer of debt to swap it for equity. The instrument is quite risky for the investor because the anticipated capital appreciation may not ulfilling.
(m) Deep discount Bonds:
They are designed to meet the long term funds requirements of the issuer and investors who are not looking for immediate return and can be sold with a long maturity of 25-30 years at a
Page 58
An Insight Into the Indian Capital Market
deep discount on the face value of debentures. IDBI deep discount bonds for Rs 1 lakh repayable after 25 years were sold at a discount price of Rs. 2,700.
(n) Zero-Coupon Convertible Note:
A zero-coupon convertible note can be converted into shares. If choice is exercised investors forego all accured and unpaid interest. The zero-coupon convertible notes are quite sensitive to changes in interest rates.
(o) Secured Premium Notes (SPN) with Detachable Warrants:
SPN which is issued along with a detachable warrant, is redeemable after a notice period, say four to seven years. The warrants attached to it ensure to the holder the right to apply and get allotted equity shares; provided the SPN is fully paid.
There is a lock-in period for SPN during which no interest will be paid for an invested amount. The SPN holder has an option to sell back the SPN to the company at par value after the lock in period. If the holder exercises this option, no interest/ premium will be paid on redemption. In case the SPN holder holds its further, the holder will be repaid the principal amount along with the additional amount of interest/ premium on redemption in installments as decided by the company. The conversion of detachable warrants into equity shares will have to be done within the time limit notified by the company.
(p) Floating Rate Bonds:
The rate on the floating Rate Bond is linked to a benchmark interest rate like the prime rate in USA or LIBOR in Euro currency market. The State Bank of India’s floating rate bond was linked to maximum interest on term deposits which was 10 percent. Floating rate is quoted in terms of a margin above or below the bench mark rate. The-floor rate in the State Bank of India case was 12 per cent. Interest rates linked to the bench mark ensure that neither the borrower nor the lender suffer from the changes in interest rates. When rates are fixed, they are likely to be inequitable to the borrower when interest rates fall subsequently, and the same bonds are likely to be inequitable to the lender when interest rates rise subsequently.
WARRANTSA warrant is a security issued by a company granting the holder of the warrant the right to purchase a specified number of, shares at a specified price any time prior to an expirable date. Warrants may be issued with debentures or equity shares. The specific rights are set out in the warrant. The main features-of a warrant are number of shares entitled, expiry date and state price exercise price. Expiry date of warrants, generally in USA, is 5 to 10 years from the original issue date. The exercise price is 10 to 30 percent above the prevailing market price. The Warrants have a secondary market. The minimum value of a warrant represents the exchange value between the current price of the share and the shares purchased at the exercise price. Warrants have no flotation costs and when they are exercised the firm receives
Page 59

An Insight Into the Indian Capital Market
additional funds at a price lower than the current market, yet about those prevailing at issue time. New or growing firms and venture capitalists issue warrants. They are also issued in mergers and acquisitions. Warrants are called sweeteners and have been issued in the recent past by several companies in India. Debentures issued with warrants, like convertible debentures, carry lower coupon rates.
Non-Convertible Debentures (NCDS) With Detachable Equity WarrantsThe holder of NCDs with detachable equity warrants is given an option to buy a specific number of shares from the company at a predetermined price within a definite time-frame.
The warrants attached to NCDs will be issued subject to full payment of NCD is a value. There is a specific lock-in period after which there detachable option to apply for equities. If the option to apply for equities is not exercised, the unapplied portion of shares would be disposed off by the company at its liberty.
Zero-Interest Fully Convertible Debentures (FCDS)
The investors in zero-interest fully convertible debentures will not be paid any interest. However, there is a notified period after which fully paid FCDs will be automatically and compulsorily converted into shares.
There is a lock-in period upto which no interest will be paid. Conversion is allowed only for fully paid FCDs. In the event of the company going for rights issue prior to the allotment of equity resulting from the conversion of equity shares into FCDs, FCD holders shall be offered securities as may be determined by the company.
Secured Zero-Interest Partly Convertible Debentures (PCDS) With Detachable And Separately Tradable Warrants:
This instrument has two parts; A and B. Part A is convertible into equity shares at a fixed amount on the date of allotment. Part B is non-convertible, to be redeemed at par at the end of a specific period from the date of allotment. Part B will carry a detachable and separately tradable warrant which will provide an option to the warrant holder to receive equity shares for every warrant held at a price as worked out by the company.
Fully Convertible Debentures (FCDS) With Interest (Optional)
This instrurnent does not yield interest in the initial period of say, 6 months. After this period option is given to the holder of FCDs to apply for equity at a “premium” for which no additional amourit needs to be paid. The option has to be indicated in the application form itself. However, interest on FCDs is payable at a determined rate from the date of first conversion to the second / final conversion and in lieu of it, equity shares are issued.
Page 60

An Insight Into the Indian Capital Market
OTHER DEBT SECURITIES IN VOGUE ABROAD
Income Bonds:
Here interest is paid only when cash flows are adequate. Income Bonds are like cumulative preference shares on which the fixed dividend is not paid if there is no profit in a year, but is carried forward and paid in the following year. On Income Bonds, there is no default if interest is not paid. Unlike dividend on cumulative preference shares, interest on income bond is tax deductible. Income Bonds are issued abroad by companies in ulfillingion or by firms whose financial situation does not make it feasible to issue bonds with a fixed interest payment
Asset-Backed Securities:
Assets-backed securities are a category of marketable securities that are ulfillingion by financial assets such as instalment loan contracts. Asset-backed financing involves a process called ulfillingion. Securitisation is a disintermediation process in which credit from financial intermediaries is replaced by marketable debentures that can be issued at lower cost. Financial assets are pooled so that debentures can be sold to third parties to finance the pool. Repos are the oldest asset-backed security in our country. In USA, ulfillingion has been undertaken for insured mortgages (Ginnie Mae, 1970), mortgage backed loans, student loans (Sallie Mae 1973), trade credit receivable backed bonds (1982), equipment leasing backed bonds (1984), certificates of automobile receivable securities (1985) and small business administration loans. More recently, credit card receivables have been securitized. The decade of the eighties witnessed large expansion of asset backed security financing.
Junk Bonds:
Junk Bond is a high risk, high yield bond to finance either a leveraged buyout (LBO), a merger of a company in financial distress. Coupon rates range from 16 to 25 per cent. Old line established companies which were inefficient and. Financed conservatively were objects of take over and restructuring. To finance such take-over, high yield bonds were sold. Attractive deals were put together establishing their feasibility in terms of adequacy of cash flows to meet interest payments. Michael Milken (the JUNK BOND KING) of Drexel Buraham Lambert was the real developer of the market. The junk bond market was tarnished by the fines ($ 650 million) levied in 1989 on the investment banking firm Drexel Burnham Lambert for various Securities Law violations and thus was forced into bankruptcy in 1990 and the indictment of Milken in 1990 on charges of fraud $ 600 million fines and penalties.
Page 61

An Insight Into the Indian Capital Market
CLEARING AND SETTLEMENT
Page 62

Transaction cycle
Decision to trade
Settlement of trades
Funds/securities
Clearing of trades
Placing order
Trade execution
An Insight Into the Indian Capital Market
CLEARING AND SETTLEMENT
TRANSACTION CYCLE
SETTLEMENT PROCESS
While NSE provides a platform for trading to its trading members, the National Securities Clearing Corporation Ltd. (NSCCL) determines the funds/securities obligations of the trading members and ensures that trading members meet their obligations. NSCCL becomes the legal counterparty to the net settlement obligations of every member. This principle is called ``novation’’ and NSCCL is obligated to meet all settlement obligations, regardless of member defaults, without any discretion. Once a member fails on any obligations, NSCCL immediately cuts off trading and initiates recovery. The clearing banks and depositories provide the necessary interface between the custodians/clearing members (who clear for the trading members or their own transactions) for settlement of funds/securities obligations of trading members. The core processes involved in the settlement process are:
(a) Determination of Obligation: NSCCL determines what counter-parties owe, and what counter-parties are due to receive on the settlement date. The NSCCL interposes itself as a central counterparty between the counterparties to trades and nets the positions so that a member has security wise net obligation to receive or deliver a security and has to either pay or receive funds.
Page 63

An Insight Into the Indian Capital Market
(b) Pay-in of Funds and Securities: The members bring in their funds/securities to the NSCCL. They make available required securities in designated accounts with the depositories by the prescribed pay-in time. The depositories move the securities available in the accounts of members to the account of the NSCCL. Likewise members with funds obligations make available required funds in the designated accounts with clearing banks by the prescribed pay-in time. The NSCCL sends electronic instructions to the clearing banks to debit member’s accounts to the extent of payment obligations. The banks process these instructions, debit accounts of members and credit accounts of the NSCCL.
I Pay-out of Funds and Securities: After processing for shortages of funds/securities and arranging for movement of funds from surplus banks to deficit banks through RBI clearing, the NSCCL sends electronic instructions to the depositories/clearing banks to release pay-out of securities/funds. The depositories and clearing banks debit accounts of NSCCL and credit settlement accounts of members. Settlement is complete upon release of pay-out of funds and securities to custodians/members.
(d) Risk Management: A sound risk management system is integral to an efficient settlement system. NSCCL has put in place a comprehensive risk management system, which is constantly monitored and upgraded to pre-empt market failures. It monitors the track record and performance of members and their net worth; undertakes on-line monitoring of members’ positions and exposure in the market, collects margins from members and automatically disables members if the limits are breached.
Page 64

An Insight Into the Indian Capital Market
SETTLEMENT AGENCIES
The NSCCL, with the help of clearing members, custodians, clearing banks and depositories settles the trades executed on exchanges. The roles of each of these entities are explained below:
(a) NSCCL: The NSCCL is responsible for post-trade activities of a stock exchange. Clearing and settlement of trades and risk management are its central functions. It clears all trades, determines obligations of members, arranges for pay-in of funds/securities, receives funds/securities, processes for shortages in funds/securities, arranges for pay-out of funds/securities to members, guarantees settlement, and collects and maintains margins/collateral/base capital/other funds.
(b) Clearing Members: They are responsible for settling their obligations as determined by the NSCCL. They have to make available funds and/or securities in the designated accounts with clearing bank/depository participant, as the case may be, to meet their obligations on the settlement day. In the capital market segment, all trading members of the Exchange are required to become the Clearing Member of the Clearing Corporation. (c) Custodians: A custodian is a person who holds for safekeeping the documentary evidence of the title to property belonging like share certificates, etc. The title to the custodian’s property remains vested with the original holder, or in their nominee(s), or custodian trustee, as the case may be. In NSCCL, custodian is a clearing member but not a trading member. He settles trades assigned to him by trading members. He is required to confirm whether he is going to settle a particular trade or not. If it is confirmed, the NSCCL assigns that obligation to that custodian and the custodian is required to settle it on the settlement day. If the custodian rejects the trade, the obligation is assigned back to the trading /clearing member.
Normal Market
In a rolling settlement, trade day is T day, T+1 day and T+2 day for NSCCL. The trades executed each trading day are considered as a trading period and trades executed during the day are settled based on the net obligations for the day. At NSE, trades in rolling settlement are settled on a T+2 basis i.e. on the 2nd working day. Typically trades taking place on Monday are settled on Wednesday, Tuesday’s trades settled on Thursday and so on.
Page 65

An Insight Into the Indian Capital Market
A tabular representation of the settlement cycle for rolling settlement is given below:
Activity Day
Trading Rolling Settlement Trading T
Clearing Custodial Conformation T+1 working days
Delivery Generation T+1 working days
Settlement Securities and Funds pay in T+2 working days
Securities and Funds pay out T+2 working days
Valuation of shortages based on closing prices T+1 closing prices
Post settlement
Auction T+3 working days
Bad delivery reporting T+4 working days
Auction settlement T+5 working days
Rectified bad delivery pay in and pay out T+6 working days
Re-bad delivery reporting and pick up T+8 working days
Close out of re-bad delivery and funds pay-in & pay out
T+9 working days
Page 66

An Insight Into the Indian Capital Market
LEGAL FRAMEWORK AND REGULATORY
BODIES
Page 67

An Insight Into the Indian Capital Market
LEGAL FRAMEWORK
This section deals with legislative and regulatory provisions relevant from the viewpoint of a trading member.
The four main legislations governing the securities market area) the Securities Contracts (Regulation) Act, 1956, which provides for regulation of transactions in securities through control over stock exchanges; (b) the Companies Act, 1956, which sets out the code of conduct for the corporate sector in relation to issue, allotment and transfer of securities, and disclosures to be made in public issues; (c) the SEBI Act, 1992 which establishes SEBI to protect investors and develop and regulate securities market; and (d) the Depositories Act, 1996 which provides for electronic maintenance and transfer of ownership of dematerialized securities.
LEGISLATIONS
Capital Issues (Control) Act, 1947
The Act had its origin during the war in 1943 when the objective was to channel resources to support the war effort. It was retained with some modifications as a means of controlling the raising of capital by companies and to ensure that national resources were ulfilling into proper lines, i.e., for desirable purposes to serve goals and priorities of the government, and to protect the interests of investors. Under the Act, any firm wishing to issue securities had to obtain approval from the Central Government, which also determined the amount, type and price of the issue. As a part of the liberalization process, the Act was repealed in 1992 paving way for market determined allocation of resources.
Securities Contracts (Regulation) Act, 1956
It provides for direct and indirect control of virtually all aspects of securities trading and the running of stock exchanges and aims to prevent undesirable transactions in securities. It gives Central Government regulatory jurisdiction over (a) stock exchanges through a process of recognition and continued supervision, (b) contracts in securities, and (c) listing of securities on stock exchanges. As a condition of recognition, a stock exchange complies with conditions prescribed by Central Government. Organized trading activity in securities takes place on a specified recognized stock exchange. The stock exchanges determine their own listing regulations which have to conform to the minimum listing criteria set out in the Rules.
Page 68
An Insight Into the Indian Capital Market
SEBI Act, 1992
The SEBI Act, 1992 was enacted to empower SEBI with statutory powers for (a) protecting the interests of investors in securities, (b) promoting the development of the securities market, and (c) regulating the securities market. Its regulatory jurisdiction extends over corporate in the issuance of capital and transfer of securities, in addition to all intermediaries and persons associated with securities market. It can conduct enquiries, audits and inspection of all concerned and adjudicate offences under the Act. It has powers to register and regulate all market intermediaries and also to penalise them in case of violations of the provisions of the Act, Rules and Regulations made there under. SEBI has full autonomy and authority to regulate and develop an orderly securities market.
Depositories Act, 1996
The Depositories Act, 1996 provides for the establishment of depositories in securities with the objective of ensuring free transferability of securities with speed, accuracy and security by (a) making securities of public limited companies freely transferable subject to certain exceptions; (b) dematerializing the securities in the depository mode; and (c) providing for maintenance of ownership records in a book entry form. In order to streamline the settlement process, the Act envisages transfer of ownership of securities electronically by book entry without making the securities move from person to person. The Act has made the securities of all public limited companies freely transferable, restricting the company’s right to use discretion in effecting the transfer of securities, and the transfer deed and other procedural requirements under the Companies Act have been dispensed with.
Companies Act, 1956
It deals with issue, allotment and transfer of securities and various aspects relating to company management. It provides for standard of disclosure in public issues of capital, particularly in the fields of company management and projects, information about other listed companies under the same management, and management perception of risk factors. It also regulates underwriting, the use of premium and discounts on issues, rights and bonus issues, payment of interest and dividends, supply of annual report and other information.
Rules and Regulations
The Government has framed rules under the SC(R) A, SEBI Act and the Depositories Act. SEBI has framed regulations under the SEBI Act and the Depositories Act for registration and regulation of all market intermediaries, for prevention of unfair trade practices, insider trading, etc. Under these Acts, Government and SEBI issue notifications, guidelines, and
Page 69
An Insight Into the Indian Capital Market
circulars, which need to be complied with by market participants. The self-regulatory organizations (SROs) like stock exchanges have also laid down their rules of game.
Regulators
The regulators ensure that the market participants behave in a desired manner so that the securities market continues to be a major source of finance for corporate and government and the interest of investors are protected. The responsibility for regulating the securities market is shared by Department of Economic Affairs (DEA), Department of Company Affairs (DCA), Reserve Bank of India (RBI), Securities and Exchange Board of India (SEBI) and Securities Appellate Tribunal (SAT).
Most of the powers under the SC(R)A are exercisable by Department of Economic Affairs (DEA), while a few others by SEBI. The powers of the DEA under the SC(R)A are also con-currently exercised by SEBI. The powers in respect of the contracts for sale and purchase of securities, gold-related securities, money market securities and securities derived from these securities and ready forward contracts in debt securities are exercised concurrently by RBI. The SEBI Act and the Depositories Act are mostly administered by SEBI. All these are administered by SEBI. The powers under the Companies Act relating to issue and transfer of securities and non-payment of dividend are administered by SEBI in case of listed public companies and public companies proposing to get their securities listed. The SROs ensure compliance with their own rules relevant for them under the securities laws.
Registration of Intermediaries
The intermediaries and persons associated with securities market shall buy sell or deal in securities after obtaining a certificate of registration from SEBI, as required by Section 12:
1) Stock-broker,
2) Sub- broker,
3) Share transfer agent,
4) Banker to an issue,
5) Trustee of trust deed,
6) Registrar to an issue,
7) Merchant banker,
8) Underwriter,
9) Portfolio manager,
Page 70
An Insight Into the Indian Capital Market
10) Investment adviser
11) Depository,
12) Depository Participant
13) Custodian of securities,
14) Foreign institutional investor,
15) Credit rating agency or
16) Collective investment schemes,
17) Venture capital funds,
18) Mutual fund, and
19) Any other intermediary associated with the securities market
SEBI (Prohibition of Fraudulent and Unfair Trade Practices Relating To Securities Markets) Regulations, 1995
The SEBI (Prohibition of Fraudulent and Unfair Trade Practices in relation to the Securities Market) Regulations, 1995 enable SEBI to investigate into cases of market manipulation and fraudulent and unfair trade practices. The regulations specifically prohibit market manipulation, misleading statements to induce sale or purchase of securities, unfair trade practices relating to securities. SEBI can conduct investigation, suo moto or upon information received by it, by an investigating officer in respect of conduct and affairs of any person dealing, buying/selling/dealing in securities. Based on the report of the investigating officer, SEBI can initiate action for suspension or cancellation of registration of an intermediary.
The term “fraud” has been defined by Regulation 2(1)(c). Fraud includes any of the following acts committed by a party to a contract, or with his connivance, or by his agent, with intent to deceive another party thereto or his agent, or to induce him to enter into the contract:-
1. The suggestion, as to a fact which is not true, by one who does not believe it to be true;
2. The active concealment of a fact by one having knowledge or belief of the fact;
3. A promise made without any intention of performing it;
4. Any other act fitted to deceive; and
5. Any such act or omission as the law specially declares to be fraudulent; and ‘fraudulent’ shall be construed accordingly.
Page 71
An Insight Into the Indian Capital Market
The regulation prohibits:
(1) Dealings in securities in a fraudulent manner,
(2) Market manipulation,
(3) Misleading statements to induce sale or purchase of securities, and
(4) Unfair trade practice relating to securities
Page 72
An Insight Into the Indian Capital Market
PARTICIPANTS IN THE INDIAN CAPITAL
MARKET
Page 73

An Insight Into the Indian Capital Market
ENTITIES DEPENDING ON THE INDIAN SECURITIES MARKET
Three main sets of entities depend on securities market. While the ulfillin and governments raise resources from the securities market to meet their obligations, the households invest their savings in the securities.
Corporate Sector
The 1990s witnessed emergence of the securities market as a major source of finance for trade and industry. A growing number of companies are accessing the securities market rather than depending on loans from Fis/banks. The corporate sector is increasingly depending on external sources for meeting its funding requirements. There appears to be growing preference for direct financing (equity and debt) to indirect financing (bank loan) within the external sources. According to CMIE data, the share of capital market based instruments in resources raised externally increased to 53% in 1993-94, but declined thereafter to 33% by 1999-00 and further to 21% in 2001-02. In the sector-wise shareholding pattern of companies listed on NSE, it is observed that on an average the promoters hold more than 55% of total shares. Though the non-promoter holding is about 44%, Indian public held
Page 74

An Insight Into the Indian Capital Market
only 17% and the public float (holding by FIIs, MFs, Indian public) is at best 25%. There is not much difference in the shareholding pattern of companies in different sectors. Strangely, 63% of shares in companies in media and entertainment sector are held by private corporate bodies though the requirement of public offer was relaxed to 10% for them. The promoter holding is not strikingly high in respect of companies in the IT and telecom sectors where similar relaxation was granted.
Governments
Along with increase in fiscal deficits of the governments, the dependence on market borrowings to finance fiscal deficits has increased over the years. During the year 1990-91, the state governments and the central government financed nearly 14% and 18% respectively of their fiscal deficit by market borrowing. In percentage terms, dependence of the state governments on market borrowing did not increase much during the decade 1991-2001. In case of central government, it increased to 77.6% by 2002-03.
Households
According to RBI data, household sector accounted for 82.4% of gross domestic savings during 2001-02. They invested 38% of financial savings in deposits, 33% in insurance/provident funds, 11% on small savings, and 8% in securities, including government securities and units of mutual funds during 2001- 02. Thus the fixed income bearing instruments are the most preferred assets of the household sector. Their share in total financial savings of the household sector witnessed an increasing trend in the recent past and is estimated at 82.4% in 2001- 02. In contrast, the share of financial savings of the household sector in securities (shares, debentures, public sector bonds and units of UTI and other mutual funds and government securities) is estimated to have gone down from 22.9% in 1991-92 to 4.3% in 2000-01, which increased to 8% in 2001-02. Though there was a major shift in the saving pattern of the household sector from physical assets to financial assets and within financial assets, from bank deposits to securities, the trend got reversed in the recent past due to high real interest rates, prolonged subdued conditions in the secondary market, lack of confidence by the issuers in the success of issue process as well as of investors in the credibility of the issuers and the systems and poor performance of mutual funds. The portfolio of household sector remains heavily weighted in favour of physical assets and fixed income bearing instruments.
Investor Population
The Society for Capital Market Research and Development carries out periodical surveys of household investors to estimate the number of investors. Their first survey carried out in 1990
Page 75

An Insight Into the Indian Capital Market
placed the total number of share owners at 90-100 lakh. Their second survey estimated the number of share owners at around 140-150 lakh as of mid-1993. Their latest survey estimates the number of shareowners at around 2 crore at 1997 end, after which it remained stagnant up to the end of 1990s. The bulk of increase in number of investors took place during 1991-94 and tapered off thereafter. 49% of the share owners at the end of 2000 had, for the first time, entered the market before the end of 1990, 44% entered during 1991-94, 6.3% during 1995-96 and 0.8% since 1997. The survey attributes such tapering off to persistent depression in the share market and investors’ bad experience with many unscrupulous company promoters and managements.
Distribution of Investors
The Society for Capital Market Research & Development estimates that 15% of urban households and only 0.5-1.0% of semi-urban and rural households own shares. It is estimated that 4% of all households own shares.
An indirect, but very authentic source of information about distribution of investors is the data base of beneficial accounts with the depositories. By February 2003, there were 3 million beneficial accounts with the National Securities Depository Limited (NSDL). The state-wise distribution of beneficial accounts with NSDL expected Maharashtra and Gujarat account for nearly 45% of total beneficial accounts.
Page 76

An Insight Into the Indian Capital Market
REFORMS IN INDIAN CAPITAL MARKET
Page 77

An Insight Into the Indian Capital Market
INDIAN CAPITAL MARKET REFORMS
Reforms in the capital market consist of: reforms in the primary market and the reforms in the secondary markets.
1. Establishment of SEBI
2. Establishment of Creditors Rating Agencies
3. Increasing of Merchant Banking Activities
4. Candid Performance of Indian Economy
5. Rising Electronic Transactions
6. Growing Mutual Fund Industry
7. Growing Stock Exchanges
8. Investor’s Protection
9. Growth of Derivative Transactions
10. Insurance Sector Reforms
11. Commodity Trading
PRIMARY MARKET REFORMS
One of the first and major reforms that took place in the Capital Markets was the abolition of Capital Issues Controls and introduction of free pricing. Along with this came the regulations regarding disclosures to be made before going for a primary issue, the liberalization of entry norms, stipulation of eligibility norms for primary and secondary market intermediaries, specification of minimum promoter capital requirement and lock in period for the same etc.
Besides, the above reforms, the book-building route for issue price discovery has increased the efficiency of the capital raising process. In anticipation of these reforms, the capital market started becoming a major source of finance for the corporate sector. Money raised in Capital Markets accounted for only 1 per cent of gross fixed capital formation in the economy in the 1970s and early 1980s. This figure rose to 6 per cent in 1990 and peaked to 13 per cent in 1993- 94, but then fell to 2 per cent by the end of the decade. This phenomenon can be attributed to the series of scams that shook the Indian Securities Markets in the last decade, the regulators were forced to become more conservative and this slowed down the process of liberalization
Page 78

An Insight Into the Indian Capital Market
SECONDARY MARKET REFORMS
The reforms in the secondary market have played a very important role in increasing the width and depth of the market. The major reforms that have taken place in the Secondary market are the reforms in the trading system as regards to electronic trading, Dematerialised trading of securities, clearing & settlement mechanism, reforms in the carry forward & margin trading system and the introduction of new investment instruments.
Market oriented economic reforms began in 1991. As a result of financial liberalisation, the administrative controls on bank credit and on the primary market for securities, were relaxed.
This made the role of capital markets in the economy all the more important. Almost immediately after the reforms began, there was a prominent scandal of fixed income securities and equity markets. This scam led to the empowerment of Securities and Exchange Board of ndia (SEBI) and creation of National Stock Exchange (NSE) by the Government of India. NSE was one of the first securities exchanges in the world to pioneer the demutualised structure, where brokerage firms did not own the exchange. Besides this, NSE pioneered many important innovations in the market design in India. The most important innovations being the setting up of nationwide electronic trading in the year 1994, setting up of central counterparty and paperless settlement at the depository in the year 1996 etc.
CLASSIFICATION OF REFORMS:
The reforms brought about a sea change in the Indian bourses. The paper tries to encapsulate these changes into three categories:
1. Institutional Reforms
2. Process and Service Reforms
3. Instrument Reforms
1. Institutional Reforms
As a part of the reform process, four new institutions were created: The Securities and Exchanges Board of India (SEBI), the National Stock Exchange (NSE), the National Securities Clearing Corporation Limited (NSCCL) and the National Securities Depository Ltd. (NSDL).
SEBI
The Securities and Exchanges Board of India (SEBI) was formed in 1988. It has gradually adopted many important roles in the area of policy formulation, regulation, enforcement and
Page 79

An Insight Into the Indian Capital Market
market development. This is in contrast with conditions prior to SEBI, where exchanges underwent little scrutiny or enforcement. It was after the securities scam of 1992 that
SEBI as empowered. SEBI vets every element of market design in India’s securities markets; it attempts enforcement against problems such as market manipulation and payments crises and performs oversight of market intermediaries.
NSE
In November 1992, leading Financial Institutions at the behest of the Government
Of India set up the National Stock Exchange. NSE is owned by IDBI, UTI and other public sector institutions. NSE brought following key innovations in the way the market used to operate:
1. The physical floor was replaced by anonymous, computerised order matching with strict price-time priority.
2. The constraints due to public telecom network were avoided by using satellite communications with the help of very small aperture terminal (VSAT).
3. The form of organization of NSE itself is innovative. NSE is a limited liability company and brokers are franchisees. Hence NSE’s staff is free of pressures from brokers and is better able to perform regulatory and enforcement functions.
Hence NSE improved the performance and efficiency of the stock exchange in the following manner:
1. It increased the transparency in the trading mechanism. Users could look at price on a computer screen before placing an order.
2. It brought about complete anonymity regarding identity of the traders. This has reduced greatly the scope for cartel formation and hence market manipulation.
3. It increased the competition in the brokerage industry by setting up a vast network of brokers. This led to a sharp reduction in transaction costs through lower brokerage fees.
4. It increased the operational efficiency of the markets. The automation brought about in the securities market effectively eliminated the vagaries of manual trading.
5. The satellite based trading system gave equal access to the trading floor from all locations in India. This was a major step towards development of the financial sector in cities outside Bombay.
Page 80
An Insight Into the Indian Capital Market
2. Process & Service Reforms
Nationwide Electronic Trading
Earlier, an investor willing to transact in a security not traded on the nearest exchange had to route orders through a series of correspondent brokers to the appropriate exchange. This resulted in a great deal of uncertainty and high transaction costs. With the advent of screen based trading system, it has been made possible for an investor to access the same market and order book, irrespective of location, at the same price and at the same cost.
Central Counterparty
Unlike the floor trading system, anonymous trading greatly limits the scope for cartel formation and hence limits market manipulation. However, in doing so, it also eliminates the limited control over counterparty risk exercised by the traders. Hence, a central counterparty was established which assumes the counterparty risk of each member. The establishment of the Central counterparty supplemented by the setting up of a settlement guarantee fund which acts as an insurance against possible default have played a major role in increasing the investor confidence in the market mechanism.
Rolling Settlement
The Indian equity markets were based on the equity market design followed in England.
Hence, the Indian markets followed account period settlement. In July 2001, it was replaced by rolling settlement wherein major stocks in the Indian market were moved to rolling settlement. In case of rolling settlement, trades are netted through the day, and all open positions at the end of the day are settled n days later unlike account period settlement where large leveraged positions can be present which do not normally unwind. The smaller is n, lesser is the delay between the trading date and the settlement date. As a result, the systemic risk associated with investing in the market is reduced. Earlier, the Institutional investors were forbidden from entering into badla and short selling contract, rolling settlement would enable the Institutional investors to buy on one day and sell on the other. Hence, Rolling settlement has a positive impact on the Institutional investors. This would increase the flexibility in transacting of the Institutional Investors. It is widely perceived that rolling settlement would drastically reduce the trading volumes but the reality is that, only the speculative volumes will reduce, which is already very high in India. The trading volume is almost three times the market capitalization. This is thrice the ratio prevailing in US and UK, thus indicating towards the existence of very high speculative volume. Also, it can be noted from the 52 week high and low statistics that in most cases the share price rises to more than double and falls to less
Page 81
An Insight Into the Indian Capital Market
than half within a year. This also points towards a very high level of speculative pricing of securities. (Gupta, 2001)
3. Instrument Innovation
The introduction of derivatives trading in India started with the, advent of trading on index futures in June 2000. Within a year trading in index option and trading in options on individual securities commenced in June 2001 and July 2001 respectively. This was followed by trading in individual stock futures in November 2001. Before the introduction of stock futures, the maximum trading took place in case of stock options. Later, the maximum trading in terms of number of trades as well as in rupee term took place in case of stock futures followed by stock options. The derivatives market turnover has increased from over 26 per cent of the total equity market turnover in May 2002 to over 39 per cent in July 2002. It was noted that by and large, in all the stock derivative instruments, the number of contracts as well as the values of contracts transacted is much more in the NSE than in the BSE. The volumes in futures and options trading in NSE were 10-15 times that of BSE. Hence, NSE has turned out to be the most preferred exchange for investors in the derivative products. (Stock Holding Corporation of India Limited, 2001.)
Page 82

An Insight Into the Indian Capital Market
STOCK EXCHANGES IN INDIA
Page 83
An Insight Into the Indian Capital Market
STOCK EXCHANGES IN INDIA
History of Stock Broking
The history of stock brokers can be traced back to the origins of the first stock exchange in 1602 at Amsterdam. Even before that brokers are said to have existed in France dealing with government securities. The Amsterdam Stock Exchange was involved in buying and selling of shares for the Dutch East India Company.
However, the first real stock exchange came up in Philadelphia in the United States during the late 18th century. Later it was the New York stock exchange which saw a rise in its popularity. Wall Street, as it was called, became the hub of brokerage activities. Earlier stock brokers were largely unorganized, but later most of them joined hands to form institutes and organizations.
Till the 1980’s stock broking services were used only by the wealthy class who could afford them. Later with the advent of the Internet, stock broking became very easy. Thus, the price tag on stock brokers lowered considerably and their services became available even to the common man.
The stock broking duties are now mostly taken up by major organizations with the smaller companies being absorbed by them. In India, too with increasing globalization the major corporations are penetrating deeper into the society.
History of Stock Exchanges in India:
Stock markets refer to a market place where investors can buy and sell stocks. The price at which each buying and selling transaction takes is determined by the market forces (i.e. demand and supply for a particular stock).
Let us take an example for a better understanding of how market forces determine stock prices. ABC Co. Ltd. Enjoys high investor confidence and there is an anticipation of an upward movement in its stock price. More and more people would want to buy this stock (i.e. high demand) and very few people will want to sell this stock at current market price (i.e. less supply). Therefore, buyers will have to bid a higher price for this stock to match the ask price from the seller which will increase the stock price of ABC Co. Ltd. On the contrary, if there are more sellers than buyers (i.e. high supply and low demand) for the stock of ABC Co. Ltd. In the market, its price will fall down.
In earlier times, buyers and sellers used to assemble at stock exchanges to make a transaction but now with the dawn of IT, most of the operations are done electronically and the stock
Page 84

An Insight Into the Indian Capital Market
markets have become almost paperless. Now investors don’t have to gather at the Exchanges, and can trade freely from their home or office over the phone or through Internet.
HISTORY OF INDIAN STOCK MARKET- THE ORIGIN:
One of the oldest stock markets in Asia, the Indian Stock Markets has a 200 years old history.
Year 1800 : East India Company was the dominant institution and by end of the century, business in its loan securities gained full momentum.
Year 1830 : Business on corporate stocks and shares in Bank and Cotton presses started in Bombay. Trading list by the end of 1839 got broader
Year 1840 : Recognition from banks and merchants to about half a dozen brokers
Year 1850 : Rapid development of commercial enterprise saw brokerage business attracting more people into the business
Year 1860 : The number of brokers increased to 60
Year 1860-61 : The American Civil War broke out which caused a stoppage of cotton supply from United States of America; marking the beginning of the “Share Mania” in India
Year 1862-63 : The number of brokers increased to about 200 to 250
Year 1865 : A disastrous slump began at the end of the American Civil War (as an example, Bank of Bombay Share which had touched Rs. 2850 could only be sold at Rs. 87)
Pre-Independence Scenario – Establishment of Different Stock Exchanges
Year 1874 : With the rapidly developing share trading business, brokers used to gather at a street (now well known as “Dalal Street”) for the purpose of transacting business.
Year 1875 : “The Native Share and Stock Brokers’ Association” (also known as “The Bombay Stock Exchange”) was established in Bombay
Year 1880 : Development of cotton mills industry and set up of many others
Year 1894 : Establishment of “The Ahmedabad Share and Stock Brokers’ Association”
Year 1900 : Sharp increase in share prices of jute industries in 1870’s was followed by a boom in tea stocks and coal
Year 1908 : “The Calcutta Stock Exchange Association” was formed.
Page 85

An Insight Into the Indian Capital Market
Year 1920 : Madras witnessed boom and business at “The Madras Stock Exchange” was transacted with 100 brokers.
Year 1923 : When recession followed, number of brokers came down to 3 and the Exchange was closed down
Year 1934 : Establishment of the Lahore Stock Exchange.
Year 1936 : Merger of the Lahore Stock Exchange with the Punjab Stock Exchange.
Year 1937 : Re-organization and set up of the Madras Stock Exchange Limited (Pvt.)
Limited led by improvement in stock market activities in South India with establishment of new textile mills and plantation companies.
Year 1940 : Uttar Pradesh Stock Exchange Limited and Nagpur Stock Exchange Limited was established
Year 1944 : Establishment of “The Hyderabad Stock Exchange Limited”
Year 1947 : “Delhi Stock and Share Brokers’ Association Limited” and “The Delhi Stocks and Shares Exchange Limited” were established and later on merged into “The Delhi Stock Exchange Association Limited”
Post Independence Scenario
The depression witnessed after the Independence led to closure of a lot of exchanges in the country. Lahore Stock Exchange was closed down after the partition of India, and later on merged with the Delhi Stock Exchange. Bangalore Stock Exchange Limited was registered in 1957 and got recognition only by 1963. Most of the other Exchanges were in a miserable state till 1957 when they applied for recognition under Securities Contracts (Regulations) Act, 1956. The Exchanges that were recognized under the Act were:
1. Bombay
2. Calcutta
3. Madras
4. Ahmedabad
5. Delhi
6. Hyderabad
7. Bangalore
8. Indore
Page 86

An Insight Into the Indian Capital Market
Many more stock exchanges were established during 1980’s, namely:
Cochin Stock Exchange (1980) Uttar Pradesh Stock Exchange Association Limited (at Kanpur, 1982) Pune Stock Exchange Limited (1982) Ludhiana Stock Exchange Association Limited (1983) Gauhati Stock Exchange Limited (1984) Kanara Stock Exchange Limited (at Mangalore, 1985) Magadh Stock Exchange Association (at Patna, 1986) Jaipur Stock Exchange Limited (1989) Bhubaneswar Stock Exchange Association Limited (1989) Saurashtra Kutch Stock Exchange Limited (at Rajkot, 1989) Vadodara Stock Exchange Limited (at Baroda, 1990) Coimbatore Stock Exchange Meerut Stock Exchange
At present, there are twenty one recognized stock exchanges in India which does not include the Over The Counter Exchange of India Limited (OTCEI) and the National Stock Exchange of India Limited (NSEIL).
Government policies during 1980’s also played a vital role in the development of the Indian Stock Markets.
There was a sharp increase in number of Exchanges, listed companies as well as their capital, which is visible from the following table:
Indian Stock Exchange Growth
1946 1961 1971 1975 1980 1985 1991 1995
No. of Stock Exchanges 7 7 8 8 9 14 20 22
No. of Listed Cos. 1125 1203 1599 1552 2265 4344 6229 8593
No. of Stock Issues of Listed Cos. 1506 2111 2838 3230 3697 6174 8967 11784
Capital of Listed Cos. (Cr. Rs.) 270 753 1812 2614 3973 9723 32041 59583
Page 87

Forward Transaction
Transactions in which Delivery and Payment can be extended by further period of 14 days each.The overall period should not exceed 90 days from the date of contractTransactions permitted only in case of specified shares
Spot Delivery Transaction
Includes Transactions that require delivery and payment within stipulated time period at the time of entering into the contractThis period shall not be more that 14 days following the date of contract
An Insight Into the Indian Capital Market
Trading Pattern of the Indian Stock Market
Indian Stock Exchanges allow trading of securities of only those public limited companies that are listed on the Exchange(s). They are divided into two categories:
Types of Transactions
The flowchart below describes the types of transactions that can be carried out on the Indian stock exchanges:
Page 88
Transaction on Indian Stock Exchange

An Insight Into the Indian Capital Market
Indian stock exchange allows a member broker to perform following activities:
Act as an agent,
Buy and sell securities for his clients and charge commission for the same,
Act as a trader or dealer as a principal,
Buy and sell securities on his own account and risk.
Over The Counter Exchange of India (OTCEI)
Traditionally, trading in Stock Exchanges in India followed a conventional style where people used to gather at the Exchange and bids and offers were made by open outcry.
This age-old trading mechanism in the Indian stock markets used to create many functional inefficiencies. Lack of liquidity and transparency, long settlement periods and benami transactions are a few examples that adversely affected investors. In order to overcome these inefficiencies, OTCEI was incorporated in 1990 under the Companies Act 1956. OTCEI is the first screen based nationwide stock exchange in India created by Unit Trust of India, Industrial Credit and Investment Corporation of India, Industrial Development Bank of India, SBI Capital Markets, Industrial Finance Corporation of India, General Insurance Corporation and its subsidiaries and CanBank Financial Services.
Page 89
Securities Traded on the OTCEI
Listed Securities
Securities of the companies listed on the OTC
Can be bought and sold at any OTC Center across India
Should not be listed anywhere else
Permitted Securities
Certain Securities (Shares and Debentures) listed on other Exchanges
Units of Mutual Fund can be Traded
Initiated Debentures
An equity holding a minimum of 1 Lakh Debentures of a particular scrip can offer them for trading on the OTC

An Insight Into the Indian Capital Market
Advantages of OTCEI
Greater liquidity and lesser risk of intermediary charges due to widely spread trading mechanism across India
The screen-based scripless trading ensures transparency and accuracy of prices
Faster settlement and transfer process as compared to other exchanges
Shorter allotment procedure (in case of a new issue) than other exchanges
National Stock Exchange (NSE)
In order to lift the Indian stock market trading system on par with the international standards. On the basis of the recommendations of high powered Pherwani Committee, the National Stock Exchange was incorporated in 1992 by Industrial Development Bank of India, Industrial Credit and Investment Corporation of India, Industrial Finance Corporation of India, all Insurance Corporations, selected commercial banks and others.
NSE provides exposure to investors in two types of markets, namely
Wholesale debt market
Capital market
Wholesale Debt Market- Similar to money market operations, debt market operations involve institutional investors and corporate bodies entering into transactions of high value in financial instruments like treasury bills, government securities, commercial papers etc.
Trading at NSE
Fully automated screen-based trading mechanism
Strictly follows the principle of an order-driven market
Trading members are linked through a communication network
This network allows them to execute trade from their offices
The prices at which the buyer and seller are willing to transact will appear on the screen
When the prices match the transaction will be completed
Page 90
An Insight Into the Indian Capital Market
A confirmation slip will be printed at the office of the trading member
Page 91

An Insight Into the Indian Capital Market
Page 92

An Insight Into the Indian Capital Market
Advantages of trading at NSE
Integrated network for trading in stock market of India
Fully automated screen based system that provides higher degree of transparency
Investors can transact from any part of the country at uniform prices
Greater functional efficiency supported by totally computerized network
NSE Indexes
Equities trading at NSE began in November 1994. By late 1995, NSE became India’s largest equity market and was looking for a market index to ulfill this unique information source. NSE also wanted to have a vehicle for the futures and options market. NSE approached the economists Dr. Ajay Shah and Dr. Susan Thomas, then at CMIE (and now at IGIDR), to do research on methods in index construction. This work was funded by the USAID FIRE project and led to the S&P CNX Nifty.
Index futures
NSE has been gearing up from 1995 onwards to start an index futures market. Trading in S&P CNX Nifty futures will soon commence here. With NSE’s expertise, this futures market is expected to become reliable and liquid.
S&P CNX Nifty is uniquely equipped as an index for the index futures market owing to (a) low market impact cost and (b) high hedging effectiveness. The good diversification of S&P CNX Nifty will generate low initial margin requirements.
Finally, S&P CNX Nifty is calculated using NSE prices, and NSE is the most liquid exchange in India, thus making it easier to do arbitrage for S&P CNX Nifty index futures.
S&P CNX Defty
S&P CNX Defty is S&P CNX Nifty, measured in dollars. If the S&P CNX Nifty rises by 2% it means that the Indian stock market rose by 2%, measured in rupees. If the S&P CNX Defty rises by 2%, it means that the Indian stock market rose by 2%, measured in dollars.
The S&P CNX Defty is calculated in realtime. Data for the S&P CNX Nifty and the dollar-rupee is absorbed in realtime, and used to calculate the S&P CNX Defty in realtime. Realtime currency data is obtained from Knight Ridder. When there is currency volatility, the S&P CNX Defty is an ideal device for a foreign investor to know where he stands, even intraday.
Page 93
An Insight Into the Indian Capital Market
S&P CNX Nifty
S&P CNX Nifty is the first rung of the largest, highly liquid stocks in India. CNX Nifty Junior is an index built out of the next 50 large, liquid stocks in India. It is not as liquid as the S&P CNX Nifty, which implies that the information in the CNX Nifty Junior is not as noise-free as that of the S&P CNX Nifty.
It may be useful to think of the S&P CNX Nifty and the CNX Nifty Junior as making up the 100 most liquid stocks in India. S&P CNX Nifty is the front line blue-chips, large and highly liquid stocks. The CNX Nifty Junior is the second rung of growth stocks which are not as established as those in the S&P CNX Nifty. Stocks like Infosys and NIIT, which recently graduated into the S&P CNX Nifty, were in the CNX Nifty Junior for a long time prior to this. CNX Nifty Junior can be viewed as an incubator where young growth stocks are found. As with the S&P CNX Nifty, stocks in the CNX Nifty Junior are filtered for liquidity, so they are the most liquid of the stocks excluded from the S&P CNX Nifty. Buying and selling the entire CNX Nifty Junior as a portfolio is feasible.
The maintenance of the S&P CNX Nifty and the CNX Nifty Junior are ulfillingi so that the two indexes will always be disjoint sets; i.e. a stock will never appear in both indexes at the same time. Hence it is always meaningful to pool the S&P CNX Nifty and the CNX Nifty Junior into a composite 100 stock index or portfolio.
S&P CNX Nifty is based upon solid economic research. A trillion calculations were expended to evolve the rules inside the S&P CNX Nifty index. The results of this work are remarkably simple:
(a) the correct size to use is 50,
(b) stocks considered for the S&P CNX Nifty must be liquid by the `impact cost’ criterion,
I the largest 50 stocks that meet the criterion go into the index.
S&P CNX Nifty is a contrast to the adhoc methods that have gone into index construction in the preceding years, where indexes were made out of intuition and lacked a scientific basis. The research that led up to S&P CNX Nifty is well-respected internationally as a pioneering effort in better understanding how to make a stock market index.
Page 94

An Insight Into the Indian Capital Market
Bombay Stock Exchange (BSE):
Bombay Stock Exchange is the oldest stock exchange in Asia with a rich heritage, now spanning three centuries in its 133 years of existence. What is now popularly known as BSE was established as “The Native Share & Stock Brokers’ Association” in 1875.
BSE is the first stock exchange in the country which obtained permanent recognition (in 1956) from the Government of India under the Securities Contracts (Regulation) Act 1956. BSE’s pivotal and pre-eminent role in the development of the Indian capital market is widely recognized. It migrated from the open outcry system to an online screen-based order driven trading system in 1995. Earlier an Association Of Persons (AOP), BSE is now a ulfillingi and
Page 95

An Insight Into the Indian Capital Market
demutualised entity incorporated under the provisions of the Companies Act, 1956, pursuant to the BSE (Corporatisation and Demutualisation) Scheme, 2005 notified by the Securities and Exchange Board of India (SEBI). With ulfillingion, BSE has two of world’s best exchanges, Deutsche Börse and Singapore Exchange, as its strategic partners.
Over the past 133 years, BSE has facilitated the growth of the Indian corporate sector by providing it with an efficient access to resources. There is perhaps no major corporate in India which has not sourced BSE’s services in raising resources from the capital market.
Today, BSE is the world’s number 1 exchange in terms of the number of listed companies and the world’s 5th in transaction numbers. The market capitalization as on December 31, 2007 stood at USD 1.79 trillion . An investor can choose from more than 4,700 listed companies, which for easy reference, are classified into A, B, S, T and Z groups.
The BSE Index, SENSEX, is India’s first stock market index that enjoys an iconic stature, and is tracked worldwide. It is an index of 30 stocks representing 12 major sectors. The SENSEX is constructed on a “free-float Market Capitalization-Weighted” methodology, and is sensitive to market sentiments and market realities. Apart from the SENSEX, BSE offers 21 indices, including 12 sectoral indices. BSE has entered into an index cooperation agreement with Deutsche Börse. This agreement has made SENSEX and other BSE indices available to investors in Europe and America. Moreover, Barclays Global Investors (BGI), the global leader in ETFs through its iShares® brand, has created the ‘iShares® BSE SENSEX India Tracker’ which tracks the SENSEX. The ETF enables investors in Hong Kong to take an exposure to the Indian equity market.
The launch of SENSEX in 1986 was later followed up in January 1989 by introduction ofBSE National Index (Base: 1983-84 = 100). It comprised of 100 stocks listed at five major stock exchanges in India at Mumbai, Calcutta , Delhi , Ahmedabad and Madras . The BSE National Index was renamed as BSE-100 Index from October 14, 1996 and since then it is calculated taking into consideration only the prices of stocks listed at BSE. The Exchange launched dollar-linked version of BSE-100 index i.e. Dollex-100 on May 22, 2006.
With a view to provide a better representation of the increased number of companies listed, increased market ulfillingion and the new industry groups, the Exchange constructed and launched on 27th May, 1994, two new index series viz., the ‘BSE-200’ and the ‘DOLLEX-200’ indices. Since then, BSE has come a long way in attuning itself to the varied needs of investors and market participants. In order to fulfill the need of the market participants for still broader, segment-specific and sector-specific indices, the Exchange has continuously been increasing the range of its indices. The launch of BSE-200 Index in 1994 was followed by the launch of BSE-500 Index and 5 sectoral indices in 1999. In 2001, BSE launched the BSE-PSU Index, DOLLEX-30 and the country’s first free-float based index – the BSE TECk Index. The Exchange shifted all its indices to a free-float methodology (except BSE PSU index) in a phased manner.
Page 96

An Insight Into the Indian Capital Market
The Exchange also disseminates the Price-Earnings Ratio, the Price to Book Value Ratio and the Dividend Yield Percentage on day-to-day basis of all its major indices.
The values of all BSE indices are updated every 15 seconds during the market hours and displayed through the BOLT system, BSE website and news wire agencies.
All BSE-Indices are reviewed periodically by the “Index Committee” of the Exchange. The Committee frames the broad policy guidelines for the development and maintenance of all BSE indices. Department of BSE Indices of the Exchange carries out the day to day maintenance of all indices and conducts research on development of new indices.
BSE provides an efficient and transparent market for trading in equity, debt instruments and derivatives. It has a nation-wide reach with a presence in more than 359 cities and towns of
Page 97

An Insight Into the Indian Capital Market
India. BSE has always been at par with the international standards. The systems and processes are designed to safeguard market integrity and enhance transparency in operations. BSE is the first exchange in India and the second in the world to obtain an ISO 9001:2000 certification. It is also the first exchange in the country and second in the world to receive Information Security Management System Standard BS 7799-2-2002 certification for its BSE On-line Trading System (BOLT). This totally automated screen based trading in securities was put into practice nation-wide within a record time of just 50 days.
BSE Ltd places great deal of emphasis on Information Technology to strengthen its functioning and performance. ‘Operations & Trading Department’ continuously upgrades the hardware, software and networking systems, thus enabling the Exchange to enhance the quality and standard of service provided to its members and other market intermediaries.
Exchange has also introduced the world’s first centralized exchange based Internet trading system, BSEWEBx.com. The initiative enables investors anywhere in the world to trade on the BSE platform.
BSE’s website http://www.bseindia.com/ provides comprehensive information on the stock market. It is one of the most popular financial websites in India and is regularly visited by financial organizations and other stakeholders for updates.
The first Exchange Traded Fund (ETF) on SENSEX, called “SPICE” is listed on BSE. It brings to the investors a trading tool that can be easily used for the purposes of investment, trading, hedging and arbitrage. SPICE allows small investors to take a long-term view of the market.
BSE continues to innovate. In recent times, it has become the first national level stock exchange to launch its website in Gujarati and Hindi to reach out to a larger number of investors. It has successfully launched a reporting platform for corporate bonds in India christened the ICDM or Indian Corporate Debt Market and a unique ticker-cum-screen aptly named ‘BSE Broadcast’ which enables information dissemination to the common man on the street.
In 2006, BSE launched the Directors Database and ICERS (Indian Corporate Electronic Reporting System) to facilitate information flow and increase transparency in the Indian capital market. While the Directors Database provides a single-point access to information on the boards of directors of listed companies, the ICERS facilitates the ulfillin in sharing with BSE their corporate announcements
Page 98

An Insight Into the Indian Capital Market
Following are the main BSE Indexes
BSE PSU Index
BSE TECK Index
BSE Mid Cap & Small Cap Index
BSE BANKX
BSE 100 Index
BSE 200 Index
BSE 500 Index
How do S&P CNX Nifty and the `BSE sensitive index’ compare?
Every technical reason favours the S&P CNX Nifty.
S&P CNX Nifty is a more diversified index, accurately reflecting overall market conditions. The BSE index is more vulnerable to movements of individual stocks. The reward-to-risk ratio of S&P CNX Nifty is higher (5.74 as compared with 5.12), making it a more attractive portfolio – both indices offer similar returns, but S&P CNX Nifty costs less risk.
S&P CNX Nifty is a more liquid index. Trades on the S&P CNX Nifty suffer lower market impact cost.
Several important issues lead back to the fact that the S&P CNX Nifty is calculated using NSE prices while the `BSE sensitive index’ is calculated using BSE prices.
S&P CNX Nifty is calculated from a more liquid market, which features the safety of novation at the clearing corporation. Users of the BSE index would be forced to trade on BSE, a less liquid exchange where there is settlement risk owing to the lack of novation and the lack of a clearing corporation.
S&P CNX Nifty has fully articulated and professionally implemented rules governing index revision, corporate actions, etc. These rules are carefully thought out, under Indian conditions, to dovetail with operational problems of index funds and index arbitrageurs. Many of the BSE procedures are adhoc and undocumented, and do not reflect an awareness of modern applications of an index.
S&P CNX Nifty is calculated using modern computer systems with great care about data accuracy.
S&P CNX Nifty is more likely to rapidly benefit from a liquid index futures market. (The BSE has long campaigned against the introduction of index futures in India.)
Page 99
An Insight Into the Indian Capital Market
The hedging effectiveness for randomly selected portfolios in India is better using the S&P CNX Nifty.
S&P CNX Nifty is relatively free of manipulation, for three reasons: (a) the index levels are calculated from the more liquid exchange with better surveillance procedures (it is easier for a manipulator to move prices at BSE), (b) S&P CNX Nifty has a larger market Capitalization so the consequence (upon the index) of a given move in an individual stock price is smaller and (c) S&P CNX Nifty calculation intrinsically requires liquidity in proportion to market Capitalization, thus avoiding weak links which a manipulator can attack.
Users of the S&P CNX Nifty benefit from the research that is possible owing to the long time-series available: both S&P CNX Nifty and S&P CNX Nifty TR series are observed from July 1990 onwards. Owing to the large changes in the `BSE sensitive index’ in 1996, the comparable series available is only two years old, and no TR index is available.
S&P CNX Nifty is backed by solid economic research and three most respected institutions: NSE, CRISIL and S&P.
Key Information
Base Minimum Capital deposited with the Exchange
The Base Minimum Capital is taken as security for due performance and fulfillment by the member of his operations and obligations towards the Exchange. The minimum base capital is Rs. 4 lakhs. All members have to comply with the Base Minimum Capital requirements before their activation. The members may opt for Base Minimum Capital by way of Cash, FDRs, Bank Guarantee or Securities.
Cash to be deposited with the Exchange- minimum 25 % i.e. Rs. 1 lakh
Deposit of Fixed Deposit Receipts (FDRs)- (25 %) issued by approved banks
Deposit /lodgement of Securities- (maximum 50 %) with approved custodian (HDFC Bank Ltd.) with 20% margin. OR
Irrevocable Bank guarantees (in lieu of securities – maximum 50 %) from approved banks
Members can also deposit additional base capital with the Exchange. The cash component of the additional base capital to be deposited should be a minimum 30%.
Page 100

An Insight Into the Indian Capital Market
RISK MANAGEMENT IN INDIAN CAPITAL
MARKET
Page 101

An Insight Into the Indian Capital Market
Page 102

An Insight Into the Indian Capital Market
A ) SYSTEMATIC RISK
Systematic risk is due to the influence of external factors on an organization. Such factors are normally uncontrollable from an organization’s point of view. Systematic risk is a macro in nature as it affects a large number of organizations operating under a similar stream or same domain. It cannot be planned by the organization. Types of risk under the group of systematic risk are listed as follows:
1. Interest rate risk
Interest-rate risk arises due to variability in the interest rates from time to time. It particularly affects debt securities as they carry the fixed rate of interest. The interest-rate risk is further classified into following types:
Price risk arises due to the possibility that the price of the shares, commodity, investment, etc. may decline or fall in the future.
Reinvestment rate risk results from fact that the interest or dividend earned from an investment can’t be reinvested with the same rate of return as it was acquiring earlier.
2. Market risk
Market risk is associated with consistent fluctuations seen in the trading price of any particular shares or securities. That is, it is a risk that arises due to rise or fall in the trading price of listed shares or securities in the stock market. The market risk is further classified into following types:
Absolute Risk is the risk without any content. For e.g., if a coin is tossed, there is fifty percentage chance of getting a head and vice-versa.
Relative risk is the assessment or evaluation of risk at different levels of business functions. For e.g. a relative risk from a foreign exchange fluctuation may be higher if the maximum sales accounted by an organization are of export sales.
Directional risks are those risks where the loss arises from an exposure to the particular assets of a market. For e.g. an investor holding some shares experience a loss when the market price of those shares falls down.
Non-Directional risk arises where the method of trading is not consistently followed by the trader. For e.g. the dealer will buy and sell the share simultaneously to mitigate the risk.
Basis risk is due to the possibility of loss arising from imperfectly matched risks. For e.g. the risks which are in offsetting positions in two related but non-identical markets.
Volatility risk is the risk of a change in the price of securities as a result of changes in the volatility of a risk factor. For e.g. volatility risk applies to the portfolios of derivative instruments, where the volatility of its underlying is a major influence of prices.
Page 103
An Insight Into the Indian Capital Market
3. Purchasing power or inflationary risk
Purchasing power risk is also known as inflation risk. It is so, since it emanates (originates) from the fact that it affects a purchasing power adversely. It is not desirable to invest in securities during an inflationary period. The purchasing power or inflationary risk is classified into following types:
Demand inflation risk arises due to increase in price, which result from an excess of demand over supply. It occurs when supply fails to cope with the demand and hence cannot expand anymore. In other words, demand inflation occurs when production factors are under maximum utilization.
Cost inflation risk arises due to sustained increase in the prices of goods and services. It is actually caused by higher production cost. A high cost of production inflates the final price of finished goods consumed by people.
B) UNSYSTEMATIC RISK
Unsystematic risk is due to the influence of internal factors prevailing within an organization. Such factors are normally controllable from an organization’s point of view.
Unsystematic risk is a micro in nature as it affects only a particular organization. It can be planned, so that necessary actions can be taken by the organization to mitigate (reduce the effect of the risk. The types of risk grouped under unsystematic risk are given below:
1. Business or liquidity risk
Business risk is also known as liquidity risk. It is so, since it emanates (originates) from the sale and purchase of securities affected by business cycles, technological changes, etc. The business or liquidity risk is further classified into following types:
Asset liquidity risk is the risk of losses arising from an inability to sell or pledge assets at, or near, their carrying value when needed. For e.g. assets sold at a lesser value than their book value.
Funding liquidity risk is the risk of not having an access to sufficient funds to make a payment on time. For e.g. when commitments made to customers are not fulfilled as discussed in the SLA (service level agreements).
2. Financial or credit risk
Financial risk is also known as credit risk. This risk arises due to change in the capital structure of the organization. The capital structure mainly comprises of three ways by which funds are sourced for the projects. These are as follows:
1. Owned funds. For e.g. share capital.
Page 104

An Insight Into the Indian Capital Market
2. Borrowed funds. For e.g. loan funds.
3. Retained earnings. For e.g. reserve and surplus.
The financial or credit risk is further classified into following types:
Exchange rate risk is also called as exposure rate risk. It is a form of financial risk that arises from a potential change seen in the exchange rate of one country’s currency in relation to another country’s currency and vice-versa. For e.g. investors or businesses face an exchange rate risk either when they have assets or operations across national borders, or if they have loans or borrowings in a foreign currency.
Recovery rate risk is an often neglected aspect of a credit risk analysis. The recovery rate is normally needed to be evaluated. For e.g. the expected recovery rate of the funds tendered (given) as a loan to the customers by banks, non-banking financial companies (NBFC), etc.
Sovereign risk is the risk associated with the government. In such a risk, government is unable to meet its loan obligations, reneging (to break a promise) on loans it guarantees, etc.
Settlement risk is the risk when counterparty does not deliver a security or its value in cash as per the agreement of trade or business.
3. Operational risk
Operational risks are the business process risks failing due to human errors. This risk will change from industry to industry. It occurs due to breakdowns in the internal procedures, people, policies and systems. The operational risk is further classified into following types:
Model risk is the risk involved in using various models to value financial securities. It is due to probability of loss resulting from the weaknesses in the financial model used in assessing and managing a risk.
People risk arises when people do not follow the organization’s procedures, practices and/or rules. That is, they deviate from their expected ulfillin.
Legal risk arises when parties are not lawfully competent to enter an agreement among themselves. Furthermore, this relates to regulatory risk, where a transaction could conflict with a government policy or particular legislation (law) might be amended in the future with retrospective effect.
Political risk is the risk that occurs due to changes in government policies. Such changes may have an ulfillingi impact on an investor. This risk is especially prevalent in the third-world countries.
Page 105

An Insight Into the Indian Capital Market
RISK INVOLVED IN SETTLEMENT
The following two kinds of risks are inherent in a settlement system:
(1) Counterparty Risk: This arises if parties do not discharge their obligations fully when due or at any time thereafter. This has two components, namely replacement cost risk prior to settlement and principal risk during settlement.
(a) The replacement cost risk arises from the failure of one of the parties to transaction. While the non-defaulting party tries to replace the original transaction at current prices, he loses the profit that has accrued on the transaction between the date of original transaction and date of replacement transaction. The seller/buyer of the security loses this ulfilling profit if the current price is below/above the transaction price. Both parties encounter this risk as prices are uncertain. It has been reduced by reducing time gap between transaction and settlement and by legally binding netting systems.
(b) The principal risk arises if a party discharges his obligations but the counterparty defaults. The seller/buyer of the security suffers this risk when he delivers/makes payment, but does not receive payment/delivery. This risk can be eliminated by delivery vs. payment mechanism which ensures delivery only against payment. This has been reduced by having a central counterparty (NSCCL) which becomes the buyer to every eller and the seller to every buyer. A variant of counterparty risk is liquidity risk which arises if one of the parties to transaction does not settle on the settlement date, but later. The seller/buyer who does not receive payment/delivery when due, may have to borrow funds/securities to complete his payment/delivery obligations. Another variant is the third party risk which arises if the parties to trade are permitted or required to use the services of a third party which fails to perform. For example, the failure of a clearing bank which helps in payment can disrupt settlement. This risk is reduced by allowing parties to have accounts with multiple banks. Similarly, the users of custodial services face risk if the concerned custodian becomes insolvent, acts negligently, etc.
(2) System Risk: This comprises of operational, legal and systemic risks. The operational risk arises from possible operational failures such as errors, fraud, outages etc. The legal risk arises if the laws or regulations do not support enforcement of settlement obligations or are uncertain. Systemic risk arises when failure of one of the parties to discharge his obligations leads to failure by other parties. The domino effect of successive failures can cause a failure of the settlement system. These risks have been contained by enforcement of an elaborate margining and capital adequacy standards to secure market integrity, settlement guarantee funds to provide counter-party guarantee, legal backing for settlement activities and business continuity plan, etc.
Page 106

An Insight Into the Indian Capital Market
RISK MANAGEMENT SYSTEM
SEBI has taken several measures to improve the integrity of the secondary market. Legislative and regulatory changes have facilitated the corporatization of stockbrokers. Capital adequacy norms have been prescribed and are being enforced. A mark-to-market margin and intraday trading limit have also been imposed. Further, the stock exchanges have put in place circuit breakers, which are applied in times of excessive volatility. The disclosure of short sales and long purchases is now required at the end of the day to reduce price volatility and further enhance the integrity of the secondary market.
1. MARK-TO-MARKET MARGIN AND INTRADAY LIMIT
Under the current clearing and settlement system, if an Indian investor buys and subsequently sells the same number of shares of stock during a settlement period, or sells and subsequently buys, it is not necessary to take or deliver the shares. The difference between the selling and buying prices can be paid or received. In other words, the squaring-off of the trading position during the same settlement period results in non-delivery of the shares that the investor traded. A short-term and speculative investment is thus possible at a relatively low cost. FIIs and domestic institutional investors are, however, not permitted to trade without delivery, since non-delivery transactions are limited only to individual investors.
One of SEBI’s primary concerns is the risk of settlement chaos that may be caused by an increasing number of non-delivery transactions as the stock market becomes excessively speculative. Accordingly, SEBI has introduced a daily mark-to-market margin and intraday trading limit. The daily mark-to-market margin is a margin on a broker’s daily position. The intraday trading limit is the limit to a broker’s intraday trading volume. Every broker is subject to these requirements.
Each stock exchange may take any other measures to ensure the safety of the market. BSE and NSE impose on members a more stringent daily margin, including one based on concentration of business.
A daily mark-to-market margin is 100 percent of the notional loss of the stockbroker for every stock, calculated as the difference between buying or selling price and the closing price of that stock at the end of that day. However, there is a threshold limit of 25 percent of the base minimum capital plus additional capital kept with the stock exchange or Rs1 million, whichever is lower. Until the notional loss exceeds the threshold limit, the margin is not payable.
This margin is payable by a stockbroker to the stock exchange in cash or as a bank guarantee from a scheduled commercial bank, on a net basis. It will be released on the pay-in day for the settlement period. The margin money is held by the exchange for 6-12 days. This costs the broker about 0.4-1.2 percent of the notional loss, assuming that the broker’s funding cost is
Page 107

An Insight Into the Indian Capital Market
about 24-36 percent (Endo 1998). Thus, speculative trading without the delivery of shares is no longer cost-free.
Each broker’s trading volume during a day is not allowed to exceed the intraday trading limit. This limit is 33.3 times the base minimum capital deposited with the exchange on a gross basis, i.e., purchase plus sale. In the event of brokers wishing to exceed this limit, they have to deposit additional capital with the exchange and this cannot be withdrawn for six months.
2. CIRCUIT BREAKER
SEBI has imposed price limits for stocks whose market prices are above Rs10 up to Rs20, a daily price change limit and weekly price change limit of 25 percent. BSE imposes price limits as a circuit breaker system to maintain the orderly trading of shares on the exchange.
BSE’s computerized trading system rejects buy or sell orders of a stock at prices outside the price limits. The daily price limit of a stock is measured from the stock’s closing price in the previous trading session. The weekly price limit is based on its closing price of the last trading in the previous week, usually its closing price on the previous Friday.
3. SHORT SALES AND LONG PURCHASES
SEBI regulates short selling in the stock market by requiring all stock exchanges to enforce reporting by members of their net short sale and long purchase positions in each stock at the end of each trading day.
Page 108

An Insight Into the Indian Capital Market
PRESENTATION AND ANALYSIS OF DATA
(COMPARATIVE STUDY OF KARVY)
Page 109

An Insight Into the Indian Capital Market
COMPETITORS OF KARVY STOCK BROKING LTD.
A diversified financial services group with a pan-India presence and presence in multiple international locations, Religare Enterprises Limited (“REL”) offers a comprehensive suite of customer-focused financial products and services targeted at retail investors, high net worth individuals and corporate and institutional clients.
REL, along with its joint venture partners, offers a range of products and services in India, including asset management, life insurance, wealth management, equity and commodity broking, investment banking, lending services, private equity and Mutual Fund.
With a view to expand and diversify, REL operates in the life insurance space under ‘Aegon Religare Life Insurance Company Limited’ and has launched India’s first wealth management joint venture under the brand name ‘Religare Macquarie Private Wealth’.
REL operates from seven domestic regional offices, 43 sub-regional offices, and has a presence in 498 cities and towns controlling 1,837* business locations all over India.
The India Infoline group, comprising the holding company, India Infoline Limited and its wholly-owned subsidiaries, straddle the entire financial services space with offerings ranging from Equity research, Equities and derivatives trading, Commodities trading, Portfolio Management Services, Mutual Funds, Life Insurance, Fixed deposits, GoI bonds and other small savings instruments to loan products and Investment banking. India Infoline also owns and manages the websites www.indiainfoline.com and www.5paisa.com
The company has a network of 976 business locations (branches and sub-brokers) spread across 365 cities and towns. It has more than 800,000 customers.
Page 110
An Insight Into the Indian Capital Market
Reliance Money, a Reliance Capital company and part of the Reliance Anil Dhirubhai Ambani Group is a comprehensive financial services and solution provider. It is a one-stop-shop, providing end-to-end financial solutions (including mobile and web-based services). It has the largest non-banking distribution channel with over 10,000 outlets and 20,000 touch points spread across 5,165 cities/ towns; catering to the diverse needs of over 3 million existingcustomers.
Reliance Money endeavors to change the way investors transact in financial markets and avails financial services. It provides customers with access to Equity, Equity and Commodity Derivatives, Offshore Investments, Portfolio Management Services, Wealth Management Services, Investment Banking, Mutual Funds, IPOs, Life and General Insurance products and Gold Coins. Customers can also avail Loans, Credit Card, Money Transfer and Money Changing services.
Kotak Securities Ltd. 100 % subsidiary of Kotak Mahindra Bank is one of the oldest and largest broking firms in the Industry. Kotak Securities offers include stock broking through the branch and Internet, Investments in IPO, Mutual funds and Portfolio management service. Kotak Securities is also a depository participant with National Securities Depository Limited (NSDL) and Central Depository Services Limited (CDSL), Kotak process more than 400000 trades a day which is much higher even than some of the renowned international brokers. The Network of Kotak Securities spans over 331 cities with 843 outlets.
Kotak Securities Limited has Rs. 2599 crore of Assets Under Management (AUM) as of 30 th
June, 2009. The portfolio Management Service provides top class service, catering to the high end of the market. Portfolio Management from Kotak Securities comes as an answer to those who would like to grow exponentially on the crest of the stock market, with the backing of an expert.
Page 111

An Insight Into the Indian Capital Market
Edelweiss Financial Services Ltd. Is a financial services company based in Mumbai, India. Edelweiss Financial Services Ltd. Provides investment banking, institutional equities, private client broking, asset management, wealth management, insurance broking and wholesale financing services to corporate, institutional and high net worth individual clients. It operates from 43 other offices in 19 Indian cities. Since its commencement of business in 1996, it has grown into a diversified Indian financial services company organised under agency and capital business lines operated by the Company and its thirteen subsidiaries.
Page 112

An Insight Into the Indian Capital Market
COMPARISON OF KSBL WITH IT’S COMPETITORS:
Page 113

An Insight Into the Indian Capital Market
Page 114

An Insight Into the Indian Capital Market
SWOT ANALYSIS OF KSBL
Strengths:
Quality service. Wide range of products and services. Less brokerage commission compared to others. Qualified and experienced work force. Flexibility to changing environment. Wide range of network and Good working condition.
Weaknesses:
High Employee Turnover. The company turnover is dependent on market performance. Low investment in R & D. Non existence of dematerialization form of IPO.
Opportunity:
Expansion of business into foreign exchange market. Opportunity for global entry’s. Introduction in wealth management and special advisory services. Introduction of new branches at Taluka places, which is untapped market by anyone
Threats:
Increasing number of local players. Fluctuation and increasing bank rates through monitory policy. Unstable government (political instability). Reduced brokerage charges by new entrants
Page 115

An Insight Into the Indian Capital Market
PRESENTATION AND ANALYSIS OF DATA
(SENSEX V/S NIFTY)
Ups and Downs of Sensex
Page 116

An Insight Into the Indian Capital Market
Published since January 1, 1986, the SENSEX is regarded as the pulse of the domestic stock markets in India. The base value of the SENSEX is taken as 100 on April 1, 1979, and its base year as 1978-79.
The historical data of SENSEX and other BSE indices can be obtained from BSE Indices Historical Data.
Data from 1991 to Sep 2012 from BSE is as follows:
Data from 1997 to Sep 2012 when plotted by Yahoo Finance appears as follows from
Page 117

An Insight Into the Indian Capital Market
Sensex Milestones
Milestone Date Description
100 Apr 1, 1979 Base value of Sensex
1000July 25, 1990
SENSEX touched the four-digit figure for the first time and closed at 1,001 in the wake of a good monsoon and excellent corporate results
2000January 15, 1992
SENSEX crossed the 2,000-mark and closed at 2,020 followed by the liberal economic policy initiatives undertaken by the then finance minister and current Prime Minister Dr Manmohan Singh.
3000 February 29, SENSEX surged past the 3000 mark in the wake of the market-
Page 118

An Insight Into the Indian Capital Market
1992 friendly Budget announced by Manmohan Singh.
4000March 30, 1992
SENSEX crossed the 4,000-mark and closed at 4,091 on the expectations of a liberal export-import policy. It was then that the Harshad Mehta scam hit the markets and SENSEX witnessed unabated selling.
5000 October 11, 1999
SENSEX crossed the 5,000-mark as the Bharatiya Janata Party-led coalition won the majority in the 13th Lok Sabha election
6000 February 11, 2000
The information technology boom helped the SENSEX to cross the 6,000-mark and hit and all time high of 6,006.
7000June 21, 2005
News of the settlement between the Ambani brothers boosted investor sentiments and the scrips of RIL, Reliance Energy, Reliance Capital and IPCL made huge gains. This helped the SENSEX crossed 7,000 points for the first time.
8000September 8, 2005
SENSEX crossed the 8000 level following brisk buying by foreign and domestic funds in early trading.
9000December 9, 2005
SENSEX on November 28, 2005 crossed 9000 to touch 9000.32 points during mid-session at the Bombay Stock Exchange on the back of frantic buying spree by foreign institutional investors and well supported by local operators as well as retail investors.
10,000February 7, 2006
SENSEX on February 6, 2006 touched 10,003 points during mid-session. The SENSEX finally closed above the 10,000-mark on February 7, 2006.
11,000 March 27, 2006
SENSEX on March 21, 2006 crossed 11,000 and touched a peak of 11,001 points during mid-session at the BSE for the first time. However, it was on March 27, 2006 that the SENSEX first closed at over 11,000 points.
12,000 April 20, 2006
SENSEX on April 20, 2006 crossed 12,000 and touched a peak of 12,004 points during mid-session at the BSE for the first time.
13,000 October 30,
It touched a peak of 13,039.36 and finally closed at 13,024.26.It took 135 days for the Sensex to move from 12,000 to 13,000 and
Page 119
An Insight Into the Indian Capital Market
2006 123 days to move from 12,500 to 13,000.
14000 December 5, 2006
SENSEX on December 5, 2006 crossed 14,000. It took 36 days for the Sensex to move from 13,000 to the 14,000 mark.
15,000 July 6, 2007 SENSEX on July 6, 2007 crossed 15,000 mark.It took seven months for the Sensex to move from 14,000 to 15,000 points.
16,000September 19, 2007
17,000September 26, 2007
18,000October 9, 2007 It took just 8 days to cross 18,000 points from the 17,000 mark.
19,000October 15, 2007 The index gained the 1,000 points in just four trading days.
20,000December 11, 2007
Sensex actually crossed the 20,000-mark on October 29, 2007 during intra-day trading but closed at 19,977.67 points. However, it was on December 11, 2007 that it finally closed at a figure above 20,000 points on the back of aggressive buying by funds.
21,000 Jan 08, 2008 SENSEX on January 8, 2008 touched all time peak of 21078 before closing at 20873.
November 5, 2010
SENSEX on November 5, 2010 closes at 20,893.6 with highest peak in two years.
Sensex fall from 21000 to 8000
Page 120
An Insight Into the Indian Capital Market
Sensex fell from 21,000 on Jan 21, 2008 to hit 7,697.39 and end at 8,509.56 on Oct 27, 2008. From Yahoo Finance Jan 2008 to Dec 2008 the chart of fall is as follows
Jan 21, 2008
Sensex saw its highest ever loss of 1,408 points at the end of the session on Monday. The Sensex recovered to close at 17,605.40 after it tumbled to the day’s low of 16,963.96
Jan 22, 2008:
The Sensex saw its biggest intra-day fall on Tuesday when it hit a low of 15,332, down 2,273 points. However, it recovered losses and closed at a loss of 875 points at 16,730
Mar 17, 2008 Sensex below 15000 and ended at 14,810
Jun 24, 2008 Sensex went below 14000 and on Jun 27 2008 ended at 13,802
Page 121
An Insight Into the Indian Capital Market
Jul 1, 2008 Sensex went below 13000 to end at 12,962.
Oct 6, 2008 Sensex went below 12000 to end at 11,802.
Oct 8, 2008 Sensex went below 11000 and ended on Oct 10 2008 at 10,527.
Oct 17, 2008 Sensex went below 10000 to end at 9,975.35
Oct 24, 2008 Sensex went below 9000 to end at 8,701.07
Oct 27, 2008 Sensex touched 7,697.39 and ended at 8,509.56
Sensex’s trek back to 18000:
After touching a low of 7,697.39 on Oct 27,2008 Sensex slowly recovered to touch 21,000 on Nov 5 2010. The chart of journey from 8k to 21k by Yahoo Finance Jan 2009 to Sep 2012 is as follows
Oct 27, Sensex touched 7,697.39 and ended at 8,509.56
Page 122
An Insight Into the Indian Capital Market
2008
Oct 28, 2008 Sensex crosses 9,000 to end at 9,008.08
Nov 3, 2008
Sensex crosses 10,000 to end at 10,337.68 but only from Mar 26,2009 when sensex closes at 10,003.10 does it resume it’s upward journey
Apr 15, 2009 Sensex crosses 11000
May 4, 2009 Sensex crosses 12000
May 19, 2009
Sensex crosses 13000 as Sensex salutes Manmohan’s Singh return to power. Soon it also surpasses 14000-mark
Jun 4, 2009 Sensex crosses 15000
Sep 7, 2009 Sensex crosses 16000 to end at 16,016.32
Sep 30, 2009 Sensex crosses 17,000 to end at 17,126.84 again crosses on Jun 3 2010
Jul 12, 2010 Sensex crosses 18000 for second time (after Apr 2010)
Sep 13,2010 Sensex crosses 19000 to end at 19,208.33
Nov 5, 2010 Sensex crosses 21,000 to hit 21,108.64 and end at 21,004.96
Page 123

An Insight Into the Indian Capital Market
Here are the biggest single-day falls of the Sensex:
DateSensex Fell by Reason
Jan 21, 2008 1,408.35
Sensex plunged by 1,408.35 points — the biggest one-day loss so far — due to deepening global economic worries.
Oct 24, 2008 1070.63
Sensex lost 1070.63 points after RBI lowered its GDP growth forecasts on global economic concerns.
Mar 17, 2008 951.03
Sensex dropped by 951.03 points on the global credit crisis and distress—sale of US banking major Bear Stearns.
Mar 3, 2008 900.84
The Sensex lost 900.84 points on concerns emanating from growing credit losses in the US.
Jan 22, 2008 875
Intraday movement more than 2000 points down at one point. Trading was suspended due to the ferocity of the fall. In the evening, news breaks that American Federal Reserve reduced interest rate by 75 bps fearing the US market collapse at open.
Jul 6, 2009 869.65
The index plunged by 869.65 points on the day of Union Budget presentation in Parliament on concerns over high fiscal deficit. This was the biggest Budget-day loss for the Sensex
Feb 11, 2008 833.98
The market benchmark lost 833.98 points on a day when Reliance Power fell below its IPO price in its debut trade after a high-profile public offer.
May 18, 2006 826
The Sensex registered a fall of 826 points to close at 11,391, following heavy selling by FIIs, retail investors and a weakness in global markets.
Oct 10, 2008 800.51
Sensex dropped by 800.51 points amid weak industrial production data and concerns over impact of global economic crisis on IT and banking firms in India.
Page 124

An Insight Into the Indian Capital Market
Mar 13, 2008 770.63 The index plummeted by 770.63 points on global economic jitters.
Dec 17, 2007
769
A heavy bout of selling in the late noon deals saw the index plunge to a low of 19,177 – down 856 points from the day’s open. The Sensex finally ended with a huge loss of 769 points
Jan 7, 2009 749.05
The market barometer dropped by 749.05 points on a day when the Satyam fraud came to light.
Mar 31, 2008 726.85
The index shed 726.85 points after heavy selling in blue-chip stocks on global economic fears.
Oct 6, 2008 724.62
The index went spiralling down 724.62 points amid fears of the US recession and attempts by governments across the world to save their failing banks.
Sep 22, 2011 704
The Sensex lost 704 points on fresh fears of a global economic slowdown and a fall in rupee value to lowest in two
ANALYSIS OF SENSEX AND NIFTY
Page 125
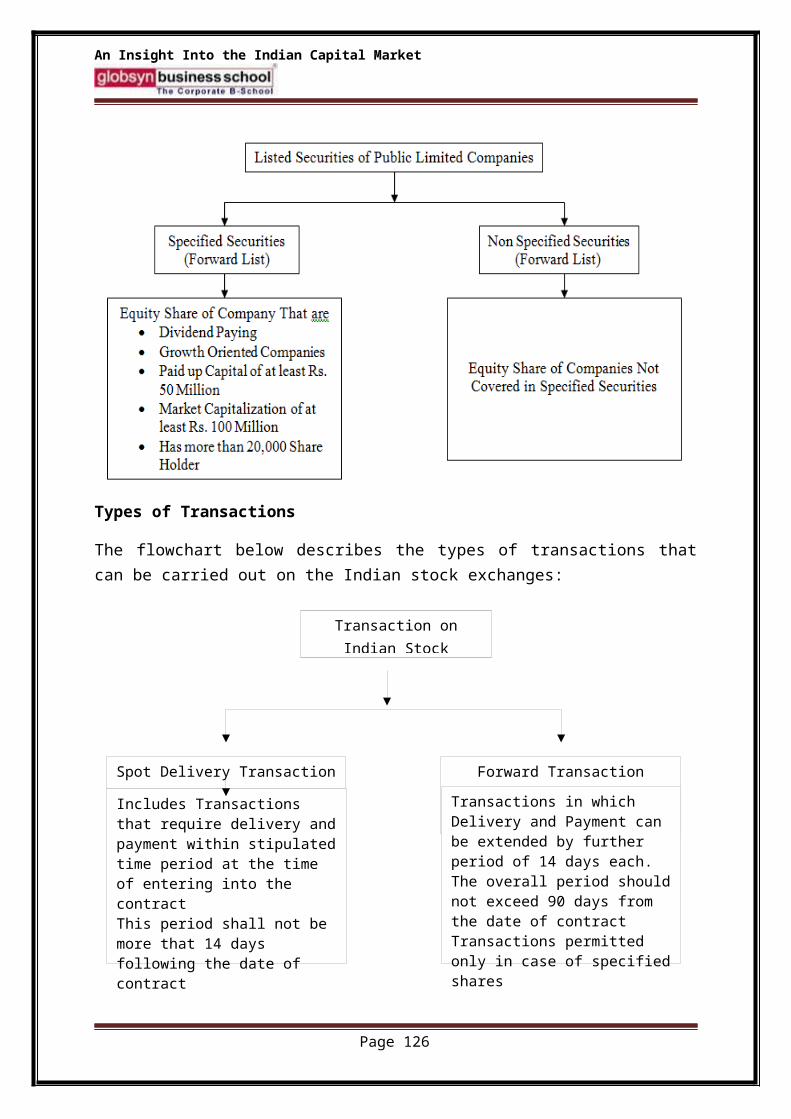
An Insight Into the Indian Capital Market
Consider Chart 1, which provides a long view of movements in the Sensex since liberalisation began, and Chart 2, which focuses on trends over the last decade, which began with a bull market run that lasted for a long stretch.
4 performance features
These charts reveal four features of “market performance” since liberalisation as indicated by the Sensex. The first is that, liberalisation — which changed the rules of the game in stock markets, replaced the Controller of Capital Issues with the Securities and Exchange Board of India, and allowed Foreign Institutional Investors (FIIs) to invest in India’s equity markets — did substantially increase market activity.
The Sensex, which was well below the 1,000 mark in 1990, moved up to 4,000 by the first quarter of 1992 and remained (despite fluctuations) in the 3,000 to 4,000 range through most of the period till 2003. This was the decade when the Indian stock market had reportedly “arrived”.
The second feature is that a remarkable boom began in 2003, which took the Sensex from 3,100 in March 2003 to a closing peak of close to 20,700 at the beginning of April 2008. That remarkable run was cut off and reversed only by the onset of the global financial crisis, which saw the Sensex slump to around 8,200 by early March 2009.
Third, we observe a smart recovery after March 2009 with the Sensex crossing the 15,000 mark in June 2009. After that, the Sensex almost never fell significantly and in fact climbed to a new peak of close to 20,900 in November 2010.
Finally, after this recovery and despite the recent difficulties in the global economy and India, the Sensex has never fallen below 15,000, let alone even approach its post-crisis trough of
Page 126

An Insight Into the Indian Capital Market
8,000-plus. In sum, notwithstanding the poor real economy trends, the Sensex has fluctuated in the 15,000-20,000 band since June 2009, as brought out more clearly by Chart 2.
Boom factors
Explaining some of these features is not difficult. Liberalisation not merely facilitated increased trading in the market, but also engineered such increased activity by allowing for investment by pure portfolio investors in equity markets.
While initially this did not result in any foreign portfolio investment boom, it did attract some investors willing to risk a small portion of their globally available capital. The net result was the moderately enhanced activity during the 1992-2002 period noted earlier.
The government helped sustain the trend with measures adopted from time to time in the form of relaxation of ceilings on foreign ownership in individual industries and allowing for the greater presence in a single firm of individual FIIs and FIIs as a group.
As per the original September 1992 policy permitting foreign institutional investment, registered FIIs could individually invest in a maximum of 5 per cent of a company’s issued capital and all FIIs together up to a maximum of 24 per cent. The 5 per cent individual-FII limit was raised to 10 per cent in June 1998.
As of March 2001, FIIs as a group were allowed to invest in excess of 24 per cent and up to 40 per cent of the paid-up capital of a company with the approval of the general body of the shareholders granted through a special resolution. This aggregate FII limit was raised to the sectoral cap for foreign investment in any sector as of September 2001.
However, these and other measures such as tax benefits provided through the tax treaty with Mauritius did not result in any runaway boom.
Page 127

An Insight Into the Indian Capital Market
That had to wait till 2003, when two events favoured such a boom. The first was the global spike in cross-border capital flows that found capital flowing in larger measure to many emerging markets. The second was domestic policy change that ensured that India emerged as a special favourite among investment destinations at the time of this cross-border capital flow surge.
To recall, in an explicit statement of intent, the Indian Finance Minister’s Budget speech for 2003-04 declared: “In order to give a further fillip to the capital markets, it is now proposed to exempt all listed equities that are acquired on or after March 1, 2003, and sold after the lapse of a year, or more, from the incidence of capital gains tax.
Long term capital gains tax will, therefore, not hereafter apply to such transactions. This proposal should facilitate investment in equities.” Long-term capital gains tax was being levied at the rate of 10 per cent up to that point in time.
This significant tax concession, which made the Indian market a tax haven, is likely to have contributed to the remarkable rise of the Sensex, given the structural features of the Indian stock market.
As Chart 3 indicates, the number of shares listed in India’s stock markets, which increased significantly in the immediate aftermath of liberalisation, has seen only marginal increase over the past decade.
Page 128
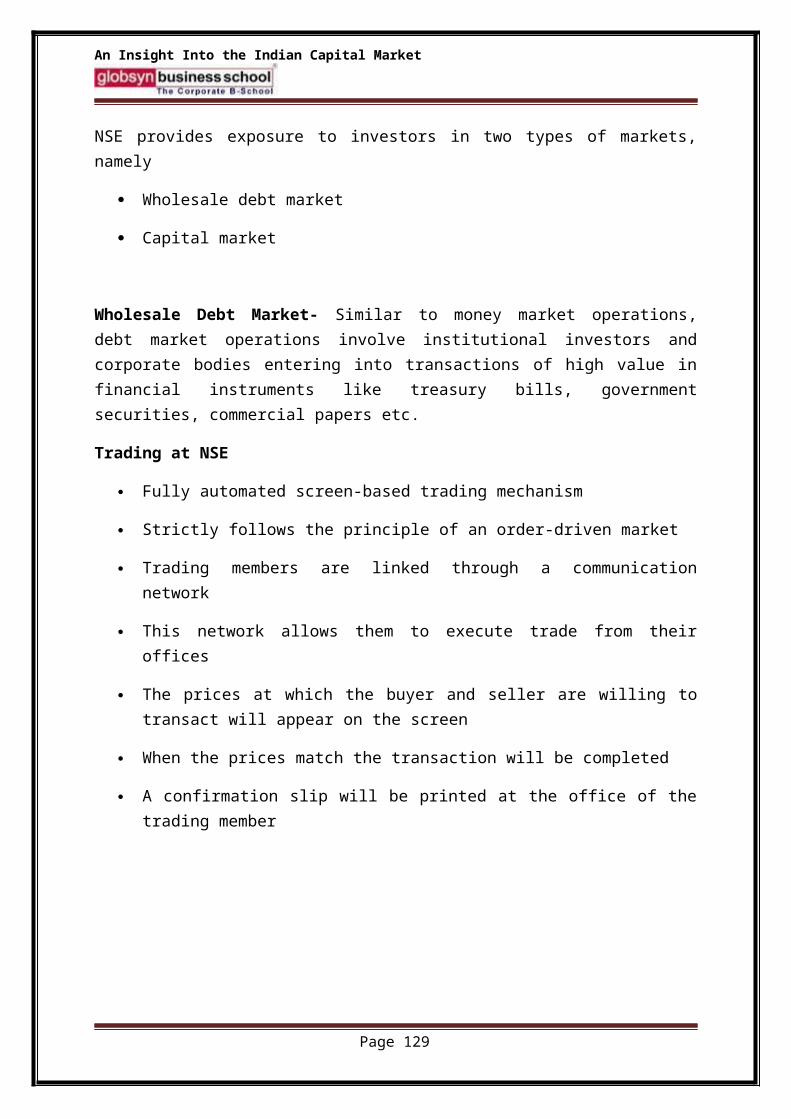
An Insight Into the Indian Capital Market
Moreover, only the shares of a very small proportion of these companies are actively traded. Finally even in the case of the actively traded companies, the proportion of shares that are free-floating, or are readily available for trading in the market, is a fraction of the total.
The free-float fraction provided by the Bombay Stock Exchange for companies included in the Sensex (which are among the most actively traded in the market) “excludes promoters’ holding, government holding, strategic holding and other locked-in shares that will not come to the market for trading in the normal course.”
As Chart 4 shows, in the case of 16 of the 30 companies included in the Sensex, only 50 per cent or less of shares are available for regular trading.
The number goes up to 25 out of 30 if a free-float factor of 75 per cent or less is considered. Some time back, the Securities and Exchange Board of India’s committee on market making had concluded that: “The number of shares listed on the BSE since 1994 has remained almost around 5800 taking into account delisting and new listing. While the number of listed shares remained constant, the aggregate trading volume on the exchange increased significantly.
For example, the average daily turnover, which was around Rs 500 crore in January 1994 increased to Rs 1,000 crore in August 1998. But, despite this increase in turnover, there has not been a commensurate increase in the number of actively traded shares. On the contrary, the number of shares not traded even once in a month on the BSE has increased from 2199
Page 129

An Insight Into the Indian Capital Market
shares in January 1997 to 4311 shares in July 1998.” This does make the market susceptible to boom-bust cycles.
The real puzzle
With only a limited proportion of the shares of even actively traded companies available for trading at any given time, any increase in demand for equity in the secondary market would result in a spike in share values. This is exactly what happened when there was a surge in capital flows into India after 2003.
On the other hand, when there was a sudden exit of capital immediately after the crisis, the index collapsed. At that time, foreign investors, who had experienced losses at home and needed resources to cover those losses or meet commitments that fell due, booked profits in emerging markets, including India, and pulled out their capital.
The net result was a collapse of the market and the index. It was the huge infusion of liquidity by central banks and governments in the developed countries, especially the US, which halted and reversed this tendency.
“Emerging markets” such as India benefited hugely from this infusion of liquidity, inasmuch as investors accessing near-zero interest rate capital used part of those resources to invest in asset markets in these countries.
This explains the V-shaped movement of markets in many emerging markets with the immediate post-crisis downturn being followed by a quick recovery.
The real puzzle is why this recovery persisted when the global crisis refused to go away, the focus of the crisis shifted to Europe and its effects began to be felt in India with greater intensity.
This also coincided with a period when developments within India were resulting in the emergence and intensification of stagflationary tendencies. Growth has been low and inflation high.
Cheap liquidity
The only explanation is that, though the fiscal stimulus resorted to in countries across the globe immediately after the onset of the 2008 crisis has not been continued because of rising fiscal conservatism, central banks have persisted with their cheap credit and easy money policies.
The most recent initiatives by the ECB and the Federal Reserve, especially the latter’s announcement of a third round of quantitative easing, involving unlimited lending against poor collateral, have kept the cheap and easy liquidity situation going in global markets. It is
Page 130

An Insight Into the Indian Capital Market
this cheap money that is finding its way to asset and commodity markets in developing countries, leading to asset and commodity price booms even when the real economy is sluggish across the globe.
However, the way in which the effects of this cheap-liquidity overhang are transmitted to countries such as India is complex. As Chart 5 shows, one effect since the 2008 crisis is that, in rupee terms, the net inflows of FII investment every month have become much more volatile since the crisis. The amplitude of the monthly variations in net inflows has increased hugely.
This suggests that what is being experienced is not a stable and rising inflow of FII capital into the country. Rather, there are even signs of a reduction of the stock of foreign portfolio investments in the country. But that reduction occurs through short-term movements that are large.
What appears to be happening is that whenever stock prices fall, investors are buying into Indian equity in the expectation that the fall would get reversed, offering opportunities for profit.
Their actions, supported with financing by the cheap liquidity available in international markets, result in fluctuations that ensure the expected short-term gains are realised. But this also would imply that there is a temporary floor to the prices of actively traded stocks, depending on mere expectations of when any price decline would hit its trough.
Poor destination
Page 131

An Insight Into the Indian Capital Market
Given the nature of the market noted above, the actions of such speculators do trigger a rise in the Sensex.
But that rise would be followed by a decline when short-term investors book profits, till such time as expectations encourage another bull run. Such runs are also facilitated by periodic bouts of liberalisation by the government.
This appears to be having two effects. One is increased volatility in stock price movements, around a medium term (say, annual) trend, in which medium and long-term returns are low or even negative.
The other is the persistence of a relatively high range within which the Sensex fluctuates, since there is a temporary psychological floor to the prices of leading shares and declines in their values provide the incentive for another speculative foray.
The net result would be that for medium-term investors, the Indian market is a poor destination. And real economy factors do suggest that there are no grounds to expect a boom in the Indian market.
However, this does not deter short-term speculators armed with cheap capital. As a result, the Sensex remains relatively high, though volatile.
There is a divergence between market performance and real economy trends.
This only goes to prove once again that the market is a casino and does not reflect in any way trends in the real “fundamentals” of the economy.
A TALE OF TWO INDICES : SENSEX & NIFTY
Page 132

An Insight Into the Indian Capital Market
Heated exchanges are not uncommon in dealing rooms and at times the argument revolves around which of the two benchmarks should be followed, Sensex or Nifty. Loyalists of the two camps are equally divided and on most occasions these discussions end inconclusively.
The Sensex or the Bombay Stock Exchange Sensitive Index has the first mover advantage. It was launched in 1986 when neither the National Stock Exchange nor the Nifty were present. It also has the distinction of belonging to a venerable 100 year old institution (BSE). So at a time when global investors were making tentative inroads into Indian stock market in early 1990s, they had only the Sensex to benchmark against.
Since old habits die hard, most global investors continue to use the 30-share Sensex to track the movement in the Indian stock market. The BSE is, therefore, not far off the mark when it states that the Sensex is the index that the world tracks. The ‘Sensex’ brand is one of the most valuable assets that BSE possesses.
If we consider brand recall within India, again the Sensex will win hands down. Many would remember the day this index crossed the 5,000 mark. Five thousand balloons were set loose from the top of Jeejobhoy Towers to mark the occasion. All of us remember the festoons and party hats that TV anchors wore as the Sensex rose beyond the 10,000 or other milestones. The Nifty crossing a 1,000-point milestone does not however evoke similar reaction.
However what the Nifty has lost in brand recall, it has made up by being the index that is most widely traded. It is common knowledge that the derivative segment on the NSE is the active one with traders milling to this exchange drawn by greater liquidity and better price
Page 133

An Insight Into the Indian Capital Market
discovery. Volumes on Nifty futures and options account for more than 60 per cent of the total derivative volume on the NSE.
Again since the Nifty is more broad-based and has greater sector-representation, many global funds that invest in India, benchmark themselves to the Nifty.
So which index should technical analysts track? Many traders prefer to use the top-down approach in which they form an opinion regarding the market as a whole. Then depending on the trend in the market, they would decide whether to initiate a short trade or a long trade.
For instance if the trend in the benchmark index is down and it has closed below a major support level, it would be best to initiate short positions in stocks that are also trending lower. Trading in a stock helps generate higher returns (than trading the benchmark) since many stocks register larger moves due to higher impact costs.
Such traders would find it easier to draw a conclusion regarding the trend in the market with the help of Sensex rather than the Nifty. For instance if the Sensex was approaching the 20,000 level, that is a major psychological resistance, it is highly likely that a downward reversal could be in the offing. Traders can therefore anticipate a reversal and initiate fresh shorts.
Similarly if Sensex was close to marking a new life-time high or was on the verge of closing above its 200 day moving average, all the stocks in the market would experience selling pressure. The Nifty does not have this kind of influence on the broader market as yet though it could be getting there.
The stock market has shown greater amount of volatility from past decade due to fluctuations in various economy factors both domestically as well as worldwide. The fluctuations are
Page 134

An Insight Into the Indian Capital Market
shown in the above graph. The closing value of year 2000 stands at 3990.65 points and the decline was observed in 2001, index closed at 3262 indicating a sharp decline. The reason may be associated with the happenings of September 2001 attack on U.S twin towers. The SENSEX in this year experienced 8 year low value. SENSEX regained a few points in the coming year and there after showed a constant upward trend. In year 2008, the SENSEX crashed below by almost 10,000 points, the reason behind was Sub-prime crises and the global melt down. The crises started in US by the shutdown of 120 year old bank Lehman Brothers. The heat of this meltdown was felt across the world and in India also. The downward trend can been seen in the above graph.
There was a decline in the value of NIFTY in 2001 on account of global economic recession. There is also a downward slope in the year 2008 reason being Sub-prime crises and the global meltdown. NIFTY was down more than 1000 points in this year. There was again drop in the value of SENSEX and NIFTY in the year 2011 on account of same economic global crises.
The return on an index can be defined as return from a portfolio of stocks representing that particular index. The closing price data for Nifty has been taken from NSE website (www.nseindia.com) and Sensex from BSE website (www.bseindia.com). The returns are calculated as yearend price differences in order to treat positive and negative returns.
The returns calculated as:
Page 135

An Insight Into the Indian Capital Market
rt = (pt/pt-1)*100
Where as
n= number of observation
rt= return on year t.
Pt= price at the end of the year.
Pt-1= price at the beginning of the year.
It is observed that year end returns offered by the indices fluctuates depending on various economic factors both domestically as well as worldwide. Nifty offered negative returns to the extent of -16% (2001) and positive returns to the extent of 42% (2005) and in the coming years return have increased. Again we notice negative returns -51% in the year 2008. Average return for the given period is 20.46% with a standard deviation of 38.79%. SENSEX exhibits similar pattern of fluctuations, the returns ranging from -52% (2008) to 81% (2009). The average return for the given period is 21.21%
A thumb-rule that can be used while selecting indicators to work with in technical analysis is to select those indicators that have the larger following. Larger following results in reversals occurring at the expected juncture. Since Sensex is watched by a larger number of market participants, this becomes a more reliable indicator for suggesting market reversals.
So the Sensex is the index the world tracks and Nifty is the traders’ favourite. But technical analysts would do well to stick to the Sensex for anticipating market turning points.
Page 136

An Insight Into the Indian Capital Market
Page 137
An Insight Into the Indian Capital Market
PRESENTATION AND ANALYSIS OF DATA
(SENSEX vis-à-vis INTERNATIONAL
MARKETS)
Page 138

An Insight Into the Indian Capital Market
SENSEX PERFORMANCE AND LINK WITH INTERNATIONAL MARKETS:
International stock markets have become further integrated in the recent years. Factors such as the progressive removal of restrictions and relaxation of controls on capital movements have helped further towards this and have indirectly increased the flow of funds across countries. Hence, the national stock exchanges are becoming more integrated and moving towards a single international stock exchange.
Page 139

An Insight Into the Indian Capital Market
The point when the correlation between the returns of the equity markets increases, the risk exposure of the portfolio (all else being constant) will start to increase and, at a, certain point international diversification will no longer look beneficial. However this allows investors to spread their portfolio across markets which in return reduce risk when diversified effectively.
With the rapid growth in India and China, many investors would certainly consider investing in the two markets rather than in the advanced or developed markets. However, the question of whether both markets are integrated with other stock markets so that investing in India and
China will provide the benefit of diversification is a major concern for investors. This leads to investigate whether, despite the growing importance and contribution of the two major emerging markets i.e., India and China to the world economy, their stock markets are interdependent with other stock markets? Therefore the aim of this paper is to present the linkages or relationship of Indian and Chinese with four other major developed markets namely United States, United Kingdom, Japan and Hong Kong using various econometric techniques.
Numerous studies have been carried out to investigate stock market linkages, integration or interdependence. Stock market is said to be integrated when correlation exists between markets. However the results of these studies are mixed, inconsistent and sometimes even contradict with each other (Hilliard (1997), Aggarwal et. Al. (2003), Abbas and Chancharat(2008). If evidence of stock market linkage were found, it would imply that there is a common force that brings these markets together (Choudhry et. Al. (2007)) Hence, the benefit of diversification would be limited. Apart from analyzing only the interdependencies of stock markets, many researchers have also focused on the impact of major events such as market crisis, market liberalization, etc on the stock market linkages (Tan and Tse (2002), Lim and McAleer (2004), Aggarwal et. Al. (2008)).
Golaka et. Al. (2003) examined the interdependence of the three major stock markets in South Asia. Using daily stock market indices of India (NSE-Nifty), Singapore (STI) and Taiwan (Taiex) from January 1994 to November 2002, employed bivariate and multivariate co-integration test. The result shows that no co-integration was found for the entire period which leads one to conclude that there is no long run equilibrium between India, Singapore and Taiwan.
In the mid twentieth century, Chi et. Al. (2006) examined the bilateral relations between three pairs of stock markets, namely India-U.S., India-China and China-U.S. They used weekly stock index of Bombay Stock Exchange National Index for India, All Shares Index from
Shanghai Stock Exchange for China, and the S&P 500 index for U.S. market from January 2, 1991 to December 29, 2004. Augmented Dickey-Fuller and Phillip-Perron unit root test were used to test the stationary of the series and subsequently employ the Fractionally Integrated Vector Error Correction Model (FIVECM) to detect the co-movement of the pairs of stock markets. Result shows that the three markets are fractionally co-integrated with each other. It was also found that U.S. market leads the Indian market in information spill-over and leads
Page 140

An Insight Into the Indian Capital Market
the Chinese market in return transmission. These results suggest that the two emerging markets appear to be more closely linked to each other relative to the U.S.
Page 141

An Insight Into the Indian Capital Market
According to Asian Journal of Finance & Accounting ( ISSN 1946-052X) 2010, Vol. 2, No. 2: E2- Both Chinese and Indian markets are found to be highly correlated. The increasing economic interdependence between the China and India has contributed to the high correlation between the two markets. Overall, the results from the correlation coefficients suggest some insight on the short-term co-movement between China and India with other major markets which suggests that the benefits of any short-term diversification, or speculative activities, are limited between them.
Study by Dr. M.V. Subha and Mr. S. Thirupparkadal Nambi in their paper ‘A study on cointegration between ulfil and ulfilli stock markets’ concluded that the Indian Stock Market shows no dependence with the NASDAQ and the S&P 500 confirming the absence of cointegration between the Indian and American Stock markets.
Sonik et al (1996) studied the correlation of world stock markets and found international correlations for stocks and bonds fluctuate widely over time. They also found that international correlation increases in periods of high market volatility.
Ramchand&Susmel (1997) found correlations between the U.S. and other world markets are on average 2 to 3.5 times higher when the U.S. market is in a high variance state as compared to a low variance regime by using switching ARCH.
Richard Heaney& et al.(2002) studied the Latin American Stock markets to find out the regional integration in which they found average correlations with other countries in the region and with the world suggest that the Latin American stock markets have become more regionally integrated over the study period (1986-2001).
Wong et al (2004) studied the time period between 1981-2002 found that there is comovement between some of the developed and emerging markets, but some emerging markets do differ from the developed markets with which they share a long-run equilibrium relationship.
Chukwuogor (2007) by comparing 40 stock exchanges of the world (Developed and developing) in the time frame of 1997-2004 found that despite the impact of globalization there still exists opportunities to maximize global portfolio returns through diversification which is quite opposite to what Som Sanker Senanalysed in 2011. Chukwuogor&Feridun (2007) found that the major stock exchanges of Europe had high volatility of returns in the market in between 1997 – 2004
Meric et al (2007) to study the co-movement patterns of the correlations of the market use Principal Component Analysis and found a very low correlation between the middleeast countries stock market.
Michalis Glezakos et al, (2007), studied the impact of major stock exchanges of the world with Athens stock exchange, in which they concluded that both the long-run cointegrating relationships and the short-run dynamic linkages among major world financial markets are strengthened through time. The US global influence is noticeable on all major world financial
Page 142

An Insight Into the Indian Capital Market
markets. They also found that the Athens stock market is strongly affected by the US and the German markets.
In 2008 Bekaert et al. By aggregating country portfolio they observe weaker evidence of a trend in the correlations between the U.S. and European countries. Bose and Mukherjee (2005) studied the co-movement of Indian Stock market with developed markets (1999- 2004) and found that US market may not be playing unique role in integration of Asian markets with the help of pairwise and group-wise co-integration and Granger-causality tests.
Malabika et al. (2008), Subramanian (2008) covered the major Asian stock exchanges and had found a significant relationship between trading volume and the absolute value of price changes.
Ulaganathan Subramanian (2008) found the existence of a linear combination of the five indices of East Asia that forces these indices to have a long-term equilibrium relationship implies that the indices are perfectly correlated in the long run and diversification among these five equity markets cannot benefit international portfolio investors.
Ashwin Modi et al. (2010) studied selected developed and developing countries stock exchanges co-movement with BSE SENSEX (India) by using the tools like Granger Causality Test, Augmented Dicky Fuller Test and Principal Component Analysis, they found that an US investor has good portfolio diversification potential with Hong Kong, Russian, and Indian market. They also have observed that the eight stock markets are fragmented into two major components that is American Region (DJIA, NASDAQ, MXX and BVSP) and second other emerging markets (BSE, HANGSENG and RTS).
Darshan Ranpura et al. (2011) studied the co-movement and interdependence of selected stock exchanges from July 1997 to December 2009 in which they found that The SENSEX has given highest Risk adjusted return for the whole period followed by BVSP, whereas Nikkei has given negative Risk adjusted return for the same period. They also found that that SENSEX is interdependent on Developed countries stock markets except NIKKEI.
Gulser Meric et al (2011) analysed the effects of the 2008 global financial/economic crisis on the co-movement patterns of the Indian stock market with 13 countries. They found a considerable time-varying volatility in the correlation of the Indian stock market with the other stock markets.
Som Sankar Sen (2011) found that investors may diversify risk and gain abnormal returns by investing in stock markets up to some point, since Asia-Pacific markets move in tandem in the long run.
Sharma and Kennedy (1977) examined the price ulfillin of Indian market with the US and UK markets and found that the ulfillin of the Indian market is statistically indistinguishable from that of the US and UK markets and found no evidence of systematic cyclical component or periodicity found for these markets.
Page 143

An Insight Into the Indian Capital Market
PRESENTATION AND ANALYSIS OF DATA
(ANALYSIS OF INDIAN CAPITAL
MARKET)
Page 144

An Insight Into the Indian Capital Market
SWOT ANALYSIS OF INDIAN STOCK MARKET:
Strength:
1. The first and for most thing of strength of Indian stock market is its ability to provide high return.
2. SEBI a regulatory body of Indian stock market who protects the interest of the investors.
3. Large number of securities which provides medium for investment.
4. Large number of Brokers who plays a role of facilitator for investment.
Weakness:
1. The weak point of Indian stock market is its volatility i.e. High risk.
2. It is a kind of gambling where no guarantee of return and some time it depends on luck also.
Opportunity:
1. Stock market provides an opportunity to money lender and money seeker to Invest and use money for their plan.
2. It provides an opportunity to the investor to be the owner of the company and contribute in the business decision of the company.
3. Stock market is a kind of indicator of the economic growth of the country where it provides an opportunity to gain according to the inflation of the country or more than that.
Threats:
1. There are many competitors of stock market such as post office savings, public provident fund, company fixed deposits, fixed deposits with bank etc. which provides fixed and assured returns.
Page 145

An Insight Into the Indian Capital Market
PESTEL ANALYSIS OF INDIAN CAPITAL MARKET:
POLITICAL:
The capital market of India is very vulnerable. India has been politically instable in the past but it is a little politically stable now-a-days.the political instability of the country has a very strong impact on the capital market. The share market of India changes as the political changes took place. The BSE Index, SENSEX goes up and down with any kind of small and big political news, like, if there is news that a particular political party has withdrawn its support from the ruling party, and then the capital market will go down with a bang. The capital market of India is too weak and is based on speculations. The political stability of the country is very important for the stability and growth of capital market in India. The political imbalance or balance of the country is the major factor in deciding the capital market of India. The political factors include:
employment laws
tax policy
trade restrictions and tariffs
political stability
ECONOMICAL:
The economical measures taken by the government of India has a very strong relationship with the capital market. Whenever the annual budget is announced the capital market goes up and down with the economical policies of the government .If the policies are supportive to the companies then the capital market takes it positively and if there is any other policy that is not supportive and it is not welcomed then the capital market goes down. Like, in the case of allocation of 3-G spectrum, those companies that got the license for 3-G, they witnessed sharp growth in their share values so the economic policies play a major part in the growth and decline of the capital market and again if there is relaxation on any kind of taxes on items of automobile industry then the share of automobile sector goes up and virtually strengthen the capital market .The economical factors include:
inflation rate
economic growth
exchange rates
interest rates
Page 146

An Insight Into the Indian Capital Market
SOCIAL:
India is a country of unity in diversity .India is socially rich but the capital market is not very attached with the social factors .Yes, there is some relation between the social factors with the capital market. If there is any big social factor then to some extent it affects the capital market but small social factors don’t impact at all. Like, there was opposition of reliance fresh in many cities and many stores were closed. The share prices of the reliance fresh went down but the impact was on and individual firm there was not much impact on the capital market on a whole the social factors have not much of impact on the capital market in India. The social factors include:
emphasis on safety
career attitudes
population growth rate
age distribution
health consciousness
TECHNOLOGICAL:
The technological factors have not that much effect on the capital market. India is technological backward country. Same as social factors, technological factor can have an effect on an individual form but it cannot have a big impact on a whole of capital market. The Bajaj got a patent on its dts-i technology, and launched it in its new bike but it does not effect on capital market. The technological change in India is always on a lower basis and it doesn’t effect on country as a whole. The technological factors include:
R&D activity
technology incentives
rate of technological change
automation
ENVIORNMENTAL FACTORS:
Initially, the environmental factors don’t play a vital role in the capital market. However, the time has changed and people are more eco-friendly. This is really bothering them that if any firm or industry is environment friendly or not. An increasing number of people, investors, corporate executives are paying importance to these facts, the capital markets still see the
Page 147

An Insight Into the Indian Capital Market
environment as a liability. They belie that it is of no use for their strategy. The environmental performance is even under-valued by the markets.
LEGAL FACTORS:
Legal factors play an important role in the development and sustain the capital market. Legal issues relating to any industry or firm decides the fate of the capital market. If the govt. Of India or the parliament introduces a new law that can affect the running of the industry then the industry will be demotivated and this demonization will lead to the demonization of the investors and will result in the fall of capital market. Like after the Hardhat Mehta scam, new rules and regulations were introduced like PAN card was made necessary for trading, if any investor was investing too much money in a small firm, then the investors were questioned,etc. These regulations were meant to maintain transparency in the capital market, but at that time, investment was discouraged. Legal factors are necessary for the improvement and stability of the capital market.
Page 148

An Insight Into the Indian Capital Market
SUGGESTIONS AND RECOMMENDATIONS
Page 149

An Insight Into the Indian Capital Market
PROBLEMS OF PRIMARY AND SECONDARY MARKET
Its ten years since the Securities and Exchange Board of India (SEBI) started to put in place the regulatory framework for the capital market. And investors have certainly benefited from the availability of more information and a contemporary secondary market structure.
SEBI began to put in place regulations a decade ago, starting with its Guidelines for Disclosure and Investor Protection (primary markets) in 1992. A fairly broad-based regulatory framework is now in place, though, going forward, SEBI has to make the market a friendlier place for investors by plugging the gaps in its performance, especially in the following areas:
Enhancing disclosures
Despite a plethora of disclosure requirements, there are still key areas where investors get precious little information of value. This mainly relates to big-ticket corporate action, such as mergers, de-mergers, acquisitions, asset sell-offs, takeovers and inter-corporate investments. In each of these areas, no doubt, the minimum information required under the Companies Act is made available.
The disclosure level varies from one instance to another, though a lot of information is made available on the financials and the synergies of a merger. But the manner in which the swap ratio is fixed and what the management thinks of the same is largely taken for granted.
Page 150

An Insight Into the Indian Capital Market
The valuation of the two companies and the swap ratio are key aspects in any merger. No doubt, valuation reports are made available for inspection, but access is not easy for all investors. A comprehensive and mandated list of disclosures, like the one that accompanies an IPO or a rights offer, should be made available to all shareholders.
Aspects such as risks from these actions, mode of deployment of resources, the benefits, reasons for such action and management perception of the issues involved, can form part of such a disclosure list.
SEBI has much to do to make its existing disclosure requirements work better. This can be done only by making all disclosures available freely to every one. Take, for instance, mutual funds. Trustee and asset management companies are required to file monthly/quarterly reports with SEBI. These must be available on the Internet.
Only public scrutiny and comment can improve the level of disclosures mandated by SEBI. While this is not a job that SEBI can do on its own, due partly to resource constraints and also because of the varying types of expertise needed, it has made a small beginning with its Web site http://www.edifar.nic.in/ and must make sure as much information as possible is pumped in through this Web site.
Quality of decisions
The effectiveness of any regulatory body is judged by the quality of implementation, in general, and the rate of convictions achieved in cases where there are violations.
What is worrying is the poor rate of conviction in major cases. Virtually every SEBI decision involving major cases — such as Sterlite, BPL, Videocon, Anand Rathi and Associates and Hindustan Lever — has been overturned by the appeals process (or the Securities Appellate Tribunal).
This hardly sends the right signals about SEBI’s penal actions when regulations are violated. There is clearly something seriously amiss if the SAT can overturn SEBI orders by pointing to lacunae on almost every possible ground — ranging from the merely technical aspects to substantive issues involving the regulator’s subjective judgment.
This is what happened in the Sterlite, BPL and Videocon cases (they were barred from capital market access for their role in price manipulation in 1998). . Quite clearly, the quality of SEBI’s investigative work has to improve considerably so that penal actions stick.
Take a larger view
There are quite a few instances where shareholders have suffered due to specific corporate actions. Whenever an issue of this kind has come up, , SEBI has generally shied away from
Page 151

An Insight Into the Indian Capital Market
taking up the cudgels (unless nudged by some extraneous pressure) on behalf of the investors to ensure that they get a fair deal.
In some of the global development-triggered `changes in control’, SEBI’s actions have been mixed . In some cases, such as Castrol, it has acted with alacrity and ordered open offers. But in quite a few others, its stance has virtually enabled elaborate structures to be created that helped avoid open offers or its actions have come rather late in the day — Color Chem-Clariant, for example — imposing unfair costs on acquirers and shareholders.
There have been a quite a few decisions on whether open offers are triggered by global developments or not, both by SEBI and/or by SAT. But no parameters have been laid down so far and eachissue is handled on a case-by-case basis.
When it comes todomestic acquisitions, SEBI’s interpretation of `change in control’ is questionable. When Gujarat Ambuja picked up the entire 14.4 per cent of the Tatas in ACC, it was clear that effective control had passed. But SEBI offered no view and, only when directed by the court, took the stance that there was `no change in control’ on technical grounds. In such situations, SEBI has to come out and clearly say why it thinks there is change in control or not. The absence of a convincing rationale only creates precedents that can be used by others, as happened with Grasim-L & T.
Every time there is a major corporate action, SEBI should proactively examine if there are issues of a contentious nature. In most major cases SEBI has tended to take up matters only when there is a referral from a court or investor forum or the government (like in the UTI’s assured return schemes).
Accounting, audit quality
SEBI can now act proactively on the issue of accounting and auditing quality. In several recent instances in the US, such as Enron, WorldCom, Global Crossing, Merck, to name a few, companies put out blatantly false numbers and auditors went along with this charade.
In India, hundreds of companies came out with IPOs and vanished subsequently, and in many companies, accounting and audit information has proved to be of poor quality and unreliable. This is where SEBI can step in and work with the government to have special audits done of the top 100 or 200 firms that account for more than 90 per cent of market ulfillingion and trading.
There is no reason to assume that everything is hunky-dory on the accounting-auditing front in Indian companies. Just look at the problems in the finance sector — the likes of IFCI, IDBI, UTI and Centurion Bank, to name a few — and one cannot help feeling there may be problems elsewhere too.
The plethora of inter-corporate investments, intra-company and intra-group transactions, guarantees and contingent liabilities are areas where there is room for considerable concern.
Page 152

An Insight Into the Indian Capital Market
A one-time special audit, efforts to ensure that audit assignments are rotated at three- or five-year intervals and fast-tracking the process of accounting standards with relevant authorities are actions that SEBI can pursue before a crisis breaks out on this front.
Perhaps the most significant change in the market in the last decade is the complete transformation of the trading, clearing and settlement infrastructure. From a market burdened with heavy problems of paper and an opaque trading structure (where brokers and sub-brokers ruled the roost), there has been a dramatic transformation to a paperless market and transparent trading system.
The last six months or so, all trades on the National Stock Exchange are settled in demat (paperless mode). Full marks to SEBI.
No doubt, the process of electronic trading was set off by the NSE, but SEBI too moved rapidly to force other exchanges, especially the Bombay Stock Exchange, to adopt contemporary trading systems.
Page 153

An Insight Into the Indian Capital Market
By also moving towards rolling settlement (albeit after a considerable and unnecessary delay), cutting the settlement cycle and now going forward towards a T+1 settlement system, SEBI has made the markets much safer for investors. But when it comes to addressing price manipulation, the story is different.
Price manipulation — no dent: One area where SEBI has barely made any difference is in the manipulation of stock prices ahead of key corporate actions and even at other times when operator driven activity is rampant. The most recent instance was the manner in which all Ketan Parekh favoured stocks, such as Himachal Futuristic, Global Tele-Systems, SSI, Silverline, surged, recording heavy trading volumes.
But one was left completely in the dark on what was behind the sudden spurt in interest in these stocks and the rise in prices (even if not of the 1999-2000 kind). This was the kind of situation where SEBI should have stepped in proactively and told investors what was going in. This would do much more for investors than the mundane investor education programmes talked about often.
Price manipulation, informed trading and insider trading with key operators/investors is now routine. This is an area that is difficult to tackle for any regulator. But over the last ten years, SEBI has taken action on such price manipulation in just two cases (Bayer ABS and Amara Raja Batteries). Here, too, the penal action has hardly been stringent.
Act on corporate actions: Perhaps as a matter of routine, SEBI should take up all cases of corporate action and subject them to scrutiny for share price ulfilli ahead of and after the action.
Trading action is generally confined to a small list of 150 stocks, on which SEBI can focus its attention. It can also draw up a list of another 150 stocks of companies with reasonable standing but poor liquidity, for tracking. At the end of the day, SEBI’s effectiveness will be enhanced only if it can make a dent in this crucial area. Else, the larger body of shareholders will be shortchanged by such price manipulation.
SUGGESTIONS AND RECOMMENDATIONS:
India does not have a legacy of employer provided pensions. The OASIS report is right in making the proposed pension system completely portable and independent of employers. India does not also have a legacy of social security, and does not have to contend with the nightmare of politically determined defined-benefit plans. The OASIS report is right in keeping its proposals for pension funds totally on a defined-contribution basis and providing market determined rates of return. The OASIS report is also right in eschewing any attempt to use the pension fund assets as a pool of funds for financing infrastructure or any other socially
Page 154

An Insight Into the Indian Capital Market
useful purpose other than on the basis of a competitive risk-return tradeoff decided by the fund manager. The broad framework of the OASIS Committee report therefore has much to be commended.
However, it attempts to create a class of financial intermediaries to manage pensions which are isolated from other financial institutions. In any economy, there are institutions like mutual funds and insurance companies that provide services that have similarities to what the pension funds would offer. By keeping them as distinct entities, regulated by a new regulator different from either the capital market regulator (SEBI) or the insurance regulator (IRDA), the OASIS proposals would perhaps impede the full play of scale and scope economies and restrict the pace of financial innovation. Investors would probably have more choice if pension products were fully integrated into the panoply of financial products available in the economy. The financial sector would also be more efficient and vibrant if that were done.
In this context, this paper argues that pension fund reforms should be placed in the broader context of capital market development aimed at providing investors with a range of choices on risk, liquidity and maturity. It must be recognized that investors save for life cycle reasons as well as for shorter term income smoothing and for hedging human capital. Since there are no watertight compartments between these various investment needs, artificial barriers between different types of financial products and services do not serve investor interests.
Recommendations for Karvy:
Having worked with KSBL was a ulfilling and enriching experience. Some of my recommendations are summarized below as follows:-
1. It was observed that the most vital problem spotted is of ignorance. Investors should be made aware of the benefits. Nobody will invest until and unless he is fully convinced. Investors should be made to realize that ignorance is no longer bliss and what they are losing by not investing.
2. It is necessary for a growing company like Karvy to adopt some promotional tools to make it present before the willing investors of the country. Many people who are interested to invest in the share market but cannot rely upon Karvy because of its less popularity among the general public.
3. Infrastructure of a company plays a vital role for attracting customers from the market. From this side also, the Karvy has to improve more in order to be caught up in the eye of the customers
Page 155

An Insight Into the Indian Capital Market
4. Due to higher AMC charges and demat account opening charges, most of the customers are allowed to choose another companies rather than Karvy. So, it is necessary for the company to evaluate market condition and based on that, take appropriate steps in order to attract the potential customers through providing low charges for opening of demat account.
Recommendations for Indian Capital Market:
1. Need for greater integration with international markets in terms of capital flows, products and processes
2. Need to introduce new age financial products and to encourage participation of new age investors.
3. Indian Economic conditions can be improved if the SEBI and Government of India ease the FDI norms furthermore which will have a positive impact on the Indian Capital Market.
Page 156

An Insight Into the Indian Capital Market
SUMMARY AND CONCLUSION
Page 157
An Insight Into the Indian Capital Market
2013 Capital Markets Industry Perspective
Investment banks and financial-services firms are reorganizing to meet the challenges they face: cost pressures, electronic trading, demand for complex analytics, and a fundamental shift in the European debt market.
About this time each year, we pause to reflect on the critical issues the financial-services industry will face in the coming 12 months and how capital markets companies can position themselves to benefit.
Page 158

An Insight Into the Indian Capital Market
The capital markets are a diverse segment, and it’s often difficult to make sweeping generalizations, but we are keenly watching several trends likely to have wide-reaching effects in 2013. These trends are continued sell-side cost pressure, central clearing and electronification of certain assets, shifting opportunities in Europe, growing demand for analytics, and pressure on management fees among buy-side firms.
Continued Sell-Side Cost Pressure
Sell-side firms are under intense pressure to trim costs. The traditional approach—across-the-board job and budget cuts—has been implemented almost everywhere but has not generated sufficient impact on the bottom line. Instead, banks must look across organizational silos to find process inefficiencies and redundancies that they can consolidate or eliminate.
In 2013, more firms will realize they need to rethink their operating models, geographic footprint, and even which businesses to pursue in order to align their cost structures with today’s business and regulatory environment. Some of these changes will require additional investments in technology—though successful firms will be able to fund these investments through savings realized from initial waves of cost cutting, thus showing continuous improvement in their expense base. While these programs are driven by the need to improve near-term financial results, successful programs will also industrialize processes that can enable future growth when customer risk appetites improve.
Central Clearing and Electronification
A major theme of 2013 will be the central clearing of over-the-counter (OTC) derivatives, as well as the increased electronification of trading. After several years of regulatory delays, we’re finally close to a concrete time line for moving OTC derivatives to a centrally cleared model. This shift will begin in 2013, forcing firms to adjust to tighter margin and collateral requirements. Complicating this transition is the fact that the new model will have to coexist with the old model, since some bespoke derivatives will still clear in a bilateral fashion.
Concurrently, plain vanilla OTC derivatives such as interest-rate swaps and index credit-default swaps (CDS) will begin to shift to transparent electronic venues in earnest in 2013. In 2010, just 10 percent of the index CDS market was traded electronically, but by 2015 we expect the percentage to increase to somewhere between 60 and 90 percent.
We also expect to see more electronic trading of corporate bonds in 2013. As dealer inventories continue to decrease, buy-side crossing solutions are being introduced to the market and established trading platforms are seeing more activity. In 2011, less than 20 percent of the corporate bond market traded on electronic exchanges, but in two to five years that could jump to 35 to 45 percent, led by the most liquid, investment-grade issues.
Shifting Opportunities in Europe
Another broad theme in 2013 will be significant new opportunities in European debt markets for Wall Street firms and some of the healthiest European investment banks. As the current
Page 159
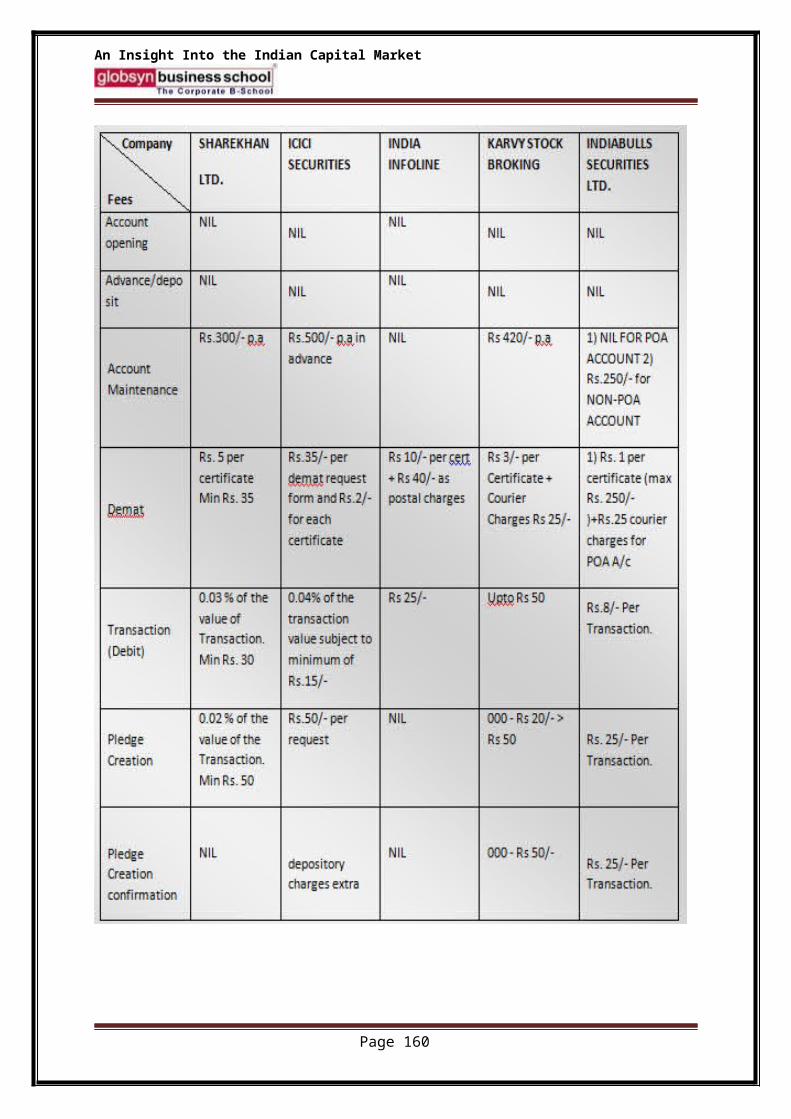
An Insight Into the Indian Capital Market
macroeconomic challenges continue, bank lending—traditionally the dominant form of corporate finance in Europe—will increasingly be supplanted by bond issuance. This presents opportunities not only for investment banks but also for investors, who will be able to participate in the European corporate debt market in a more meaningful way than in the past.
Growing Demand for Analytics
Another 2013 theme that we believe will touch both sell-side and buy-side firms is a growing focus on analytics and data. The increasing complexity of the market—including greater risk and regulatory focus and more stringent reporting requirements—now requires more powerful analytics in order for market participants to do business. Underlying these analytics must be high-quality, consistent data.
None of this is simple, which creates both a burden and an opportunity. We recently sized the market for financial data and analytics at about US$35 billion. Ultimately, new products, such as real-time collateral management and intraday risk analytics, will allow companies to be more sophisticated in their ability to manage risk and deploy capital. Given the size of this market opportunity, we believe entrants will move aggressively into the data and analytics space in the coming year. Established players need to craft competitive responses.
Pressure on Management Fees
Finally, one key trend impacting buy-side firms is the intense pressure on management fees. The issue has been developing for some time but in 2012 seemed to reach a tipping point in which lower costs began to trump incremental performance. Performance is still important, but brokers now prefer low-cost funds even if they slightly underperform higher-cost funds.
A telling skirmish in the price wars took place in October 2012, when money manager BlackRock, the biggest provider of exchange-traded funds (ETFs) in the U.S., slashed fees on some of those funds and introduced new low-fee ETFs. A month earlier, Charles Schwab had cut fees on more than a dozen ETFs. Also in October, Vanguard announced it was dropping many of its MSCI indices for less expensive options.
The stakes are high to accumulate ETF assets and settle for their razor-thin fees because so many investors are abandoning actively managed funds. In the first nine months of 2012, actively managed stock funds saw outflows of about $58.5 billion while ETF inflows topped $136 billion. Given the tiny margins of ETFs, it’s imperative that buy-side firms drive efficiencies throughout the enterprise to lower their own costs.
It’s no secret that the financial crisis fundamentally altered the structure of the capital markets business that had been developed over the previous decades. At the same time, increasing technology capacity and sophistication is fragmenting the market and forcing participants to compete more aggressively for a millisecond’s advantage.
Today’s industry faces overcapacity, profit margins that are slim to none at all, and a damaged reputation that attracts regulation and repels leading talent to join in its redevelopment. Firms
Page 160

An Insight Into the Indian Capital Market
are expected to be challenged to redesign their industry – and themselves – but reality suggests there is no other way out.
True, some opportunity for innovation in product and process may offer some glimmer of hope, but it may be that the best way out is by going backward.
Perhaps capital markets firms should consider revisiting the concept that launched this industry – the vision of independent, privately held firms whose core business is really promoting the development of capital and applying that capital to business growth – rather than trading on the margin for a millisecond advantage.
For the capital markets industry, 2013 may not be the end of the world, but, instead, a new beginning.
Page 161

An Insight Into the Indian Capital Market
BIBLIOGRAPHY
Page 162

An Insight Into the Indian Capital Market
WEBSITES:
http://www.booz.com/global/home/what-we-think/industry-perspectives/display/2013-FS-capitalmarkets-industry-perspective#sthash.MI9ePm11.dpuf
http://www.economywatch.com/market/capital-market/market-risk.html
http://www.dalalstreetwinners.com/sensex-and-world-market-performance/
http://investorstreet.blogspot.in/2008/08/sensex-17-years-of-mimicking-nasdaq.html
http://www.thehindubusinessline.com/features/investment-world/market-strategy/a-tale-of-two-indices-sensex-and-nifty/article1159361.ece
http://www.indiansharebroker.com/top-5-stock-brokers-in-india/
http://www.indian-stockmarket.com/2013/07/06/indian-stock-market-evolution/
http://www.mimts.org/Pranjana%20-%20The%20Journal%20of%20Management%20Awareness/28-EXPLOR~1.PDF
http://investorstreet.blogspot.in/2008/08/sensex-17-years-of-mimicking-nasdaq.html
http://www.karvy.com/articles/bsenasd.htm
http://www.utiicm.com/cmc/PDFs/2002/abhilashnair%5E13.pdf
http://finance.mapsofworld.com/capital-market/risk.html
http://www.moneycontrol.com/news/market-edge/chronologynifty%E2%80%99s-milestones_305139.html
http://www.nseindia.com/global/content/about_us/history_milestones.htm
http://www.thehindubusinessline.com/opinion/columns/c-p-chandrasekhar/the-insensitive-sensex/article3955616.ece
http://www.bemoneyaware.com/blog/ups-and-downs-of-sensex/
http://qna.rediff.com/questions-and-answers/1-what-are-reasons-for-fluctuations-in-the-graph/8755914/answers/8756229
http://valueinvestinginindia.wordpress.com/2012/11/24/sensex-an-analysis-of-historical-valuations/
http://www.researchgate.net/publication/222833437_Difference_in_nature_of_correlation_between_NASDAQ_and_BSE_indices
http://investmentsfordummieslikeme.blogspot.in/2013/05/global-indices-vs-sensex.html
Page 163

An Insight Into the Indian Capital Market
http://www.thehindubusinessline.com/markets/sensex-nifty-to-go-the-dow-jones-way/article4686597.ece
http://hindu.com/2000/04/26/stories/0626000a.htm
http://www.sebi.gov.in/sebiweb/home/list/4/32/0/0/Handbook%20of%20Statistics
http://www.sebi.gov.in/cms/sebi_data/attachdocs/1366948941976.pdf
BOOKS & JOURNALS:
Ashwin Modi et al. (2010), “The Study on Co-Movement of Selected Stock Markets”, ,International Research Journal of Finance and Economics, Issue 47, June 2010, pp. 164-179
Chukwuogor (2007), “Stock Markets Returns and Volatilities: A Global Comparison”Global Journal of Finance and Banking Issues Vol. 1. No. 1. 2007.
Darshan Ranpura et al. (2011), “Study Of Co Movement And Interdependence Of Indian Stock Market With Selected Foreign Stock Markets”, Asian Journal of Research Banking and Finance, Volume 1, Issue 3, December 2011, pp. 74 – 92
GulserMeric et al. (2011), “Co-Movements Of The Indian Stock Market With OtherStock Markets: Implications For Portfolio Diversification”, Indian Journal of Finance,Volume 5, Number 10, October 2011, pp. 13–20
SomSankarSen (2011), “Relationship between Sensex and Some Selected Stock PriceIndices of the Asia-Pacific Region” The IUP Journal of Applied Finance, Vol. 17, No. 1.2008
Suchismita Bose et al. (2006), “A Study of InterlinkgagesBetween the Indian StockMarket and Some Other Emerging and Developed Markets” Indian Institute of CapitalMarkets 9th Capital Markets Conference Paper.
Raj, Janak and Dhal, Chandra Sarat (2009), “Is India’s stock market integrated with global and major regional markets?” , The ICFAI Journal of Applied Finance, Vol. 15,No. 2, 6-37.
Rao, B.S.R. and UmeshNaik (1990), “Inter-relatedness of stock market spectralinvestigation of USA, Japan and Indian markets note”,ArthaVignana, Vol. 32, No. 3&4,pp. 309-321.
Mukharjee, K.N. and Mishra , R.K (2005), “Stock Market Interlink ages: A study of Indian and World Equity Markets”, Indian journal of Commerce, 58(1),17-42.
Page 164
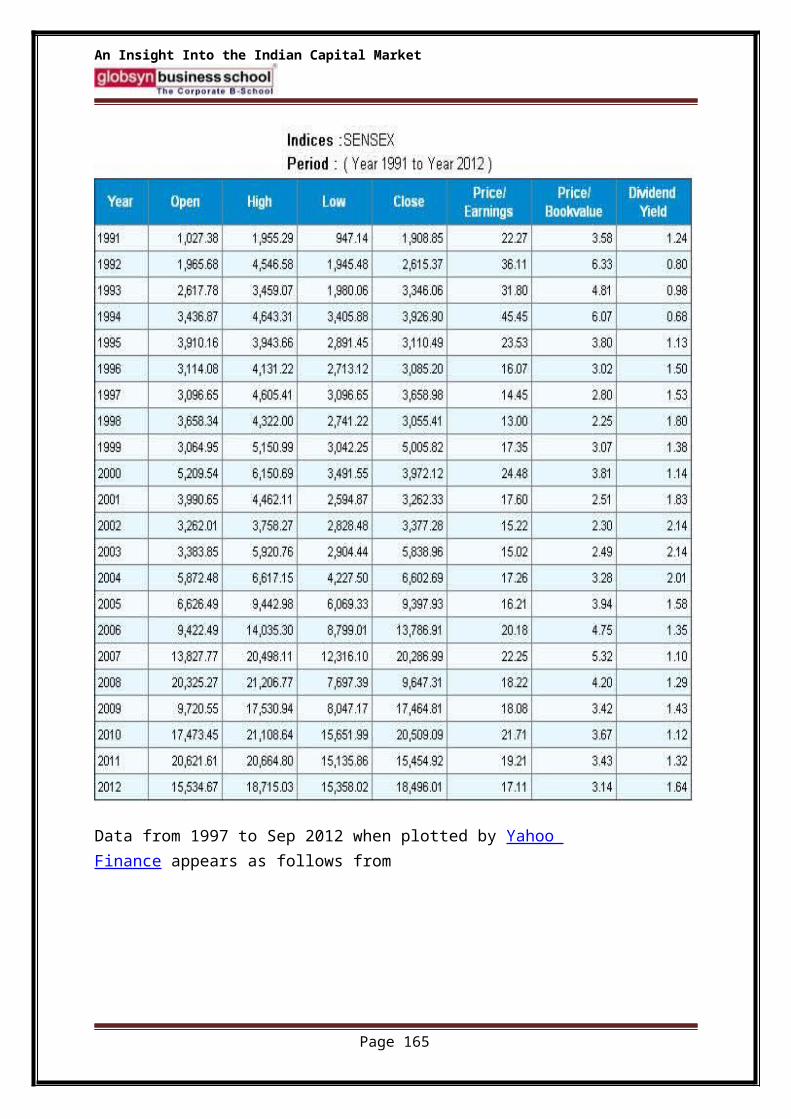
An Insight Into the Indian Capital Market
Varma J.R., 1998, “Indian Financial Sector Reforms: A Corporate Perspective”, Vikalpa, 23(1), pp. 27-38.
Joseph, L. and Pinto, R., 2000, “Kabhi Haan, Kabhi Naah: The markets Obsession withNasdaq has to end some day”, Business India, April 17-30.
Chattopadhyay and Behera. (2006). Financial Integration for Indian Stock Market Working Paper, 12th Annual Conference On Money And Finance In The Indian Economy
Page 165