Embed Size (px)
Citation preview

An insect-plant pathogen interaction between
two biocontrol agents, the stem-gall fly and
leaf-spot pathogen released against crofton
weed, Ageratina adenophora.
Lisa Buccellato
A thesis submitted to the Faculty of Science, University of the
Witwatersrand, in fulfilment of the academic requirements for
the degree of Doctor of Philosophy.
November 2012
Johannesburg

i
Declaration
I declare that this thesis is my own, unaided work, unless otherwise noted
within the text. It is being submitted for the Degree of Doctor of Philosophy
at the University of the Witwatersrand, Johannesburg. It has not been
submitted before for any degree or examination at any other University.
________________________________________________
______day of______________ 20____ in ________________

ii
Acknowledgements
Firstly, I would like to thank my two supervisors, Prof. Marcus Byrne and
Prof. Ed Witkowski, for their never-ending support, patience, guidance and
invaluable knowledge. Thank you for believing in me and making this PhD
a reality, it has been an amazing journey for me as an individual and
student.
I am grateful for funding from the Working for Water Capacity Building
Programme of DWAF, the National Research Foundation (NRF2069152)
and the University of the Witwatersrand.
Dr. Stefan Neser is thanked for his invaluable knowledge of biocontrol,
crofton weed and the two biocontrol agents in South Africa, information
regarding crofton weed infestations, guidance at the proposal stage and
introducing me to relevant people along the way. The Plant Protection
Research Institute in Stellenbosch is thanked for identifying the pathogen
collected from the Barberton field sites. Thank you to John Hoffmann for
sending me the first culture of flies at the beginning of my research. I am
grateful to the Laburn family and Kloofwaters staff for their unlimited
access and help to the Magaliesberg field site, SAPPI Escarpment
Plantation for access to the Barberton field sites and Dr M. Morris for his
information about crofton weed infestations in the KwaZulu-Natal area.
The South African Weather Service is thanked for rainfall data at the field
sites. Thank you to Prof. Dave Mycock for help at the proposal stage and
assistance relating to the pathogen throughout my research. Thank you to
the many people I have met along the way, particularly at the Weeds
Workshops and biocontrol conferences, who have provided guidance and
advice on my research.
This research required many hours of work in the greenhouse and field,
none of which would have been possible without the amazing research
assistance I received from Kate Lorentz, Anthony King, Ryan Brudvig,

iii
Samantha Bush, Lone Poulsen, Pedro Buccellato and Andrew Petrie.
Thank you for all the time and energy you contributed, as well as the
companionship to keep me sane through it all.
This has been an incredible experience for me, as well as the joys there
has been blood, sweat and many tears along the way. I am incredibly
grateful to my close friends who have kept me sane along the way with
many coffee breaks and chats. To my wonderful mom, dad and brother
thank you for always loving, supporting and motivating me unconditionally
throughout my life, and especially through this research. Your love,
shoulders to cry on, hugs and belief in me are how I have persevered
through this journey. To my amazing husband, who has been with me
through every step of this study, your love, support and patience is more
than I could ever have asked for, without you this PhD would not have
materialised. Lastly, to my incredible son, thank you for enduring the
stress of my write up while you were still unborn and for giving me the
motivation to complete the corrections.

iv
Abstract
Classical biological control (biocontrol) of invasive plants involves the
deliberate introduction of biocontrol agents, termed natural enemies, such
as insects, mites and pathogens, from the country of origin into the
invaded country to control an invasive alien plant (weed) infestation. This
thesis evaluates the biocontrol of crofton weed, Ageratina adenophora, in
South Africa, with a stem gall fly, Procecidochares utilis, and a leaf-spot
pathogen, Passalora ageratinae. The issues of multiple biocontrol agents,
pathogen-insect interactions, the assessment of agent efficacy and post-
release evaluations in biocontrol are addressed using crofton weed
biocontrol as a case study.
Laboratory trials showed an additive interaction between the fly and
pathogen on crofton weed control. The fly inhibited vertical stem growth,
with the gall acting as a nutrient sink, but crofton weed compensated with
increased sideshoot growth. The pathogen inhibited sideshoot (vegetative
reproduction) growth. Field trials showed an equivalent interaction
between the two biocontrol agents. The pathogen inhibited sideshoot
growth, however the fly did not inhibit stem height but the galled stems had
less biomass allocated to bare stems, than sideshoots or live leaves,
indicating weakened stems. Growth of crofton weed stems was slower in
the field than the laboratory, therefore the effect of the biocontrol agents
on the vegetative growth of crofton weed may be different in the
laboratory, or field trials may need to run for a longer period to see an
effect of the biocontrol agents. The fly reduced the reproductive output of
crofton weed by 53.8% in both the laboratory and field, and the pathogen
reduced the reproductive output by 26.7%. There was an equivalent effect
with the agents in combination.
The fly and pathogen together have an equivalent effect on crofton weed
ecophysiology, with the pathogen being the predominant agent. The
pathogen reduced the transpiration, stomatal conductance and
photosynthetic rate, as well as the functioning of Photosystem II of crofton

v
weed leaves. These ecophysiological results show that crofton weed
compensated for infection by investing resources into vertical growth with
healthy new leaves, thereby leaving fewer resources for sideshoot growth.
Three crofton weed infestations were surveyed at Barberton (pathogen
present), Magaliesberg (pathogen present) and Pietermaritzburg
(pathogen and fly present). The Barberton site was located under a pine
forest canopy, with 30-50 stems/m2 ranging in height from 100-1200mm.
The Magaliesberg site, along a stream bank, had 20-50 stems/m2 with
stems of 100-2200mm in height, even after manual clearing. Stems at
Pietermaritzburg, along a roadside, were 100-2000mm high and stem
density was 80 stems/m2. The pathogen infected up to 95% of stems, but
only infected 1-30% of leaves per stem. Fly prevalence was low, 20% of
stems were galled, and repeated galling of stems was rare. Parasitism
was expected to explain the low fly population, however only 30% of galls
were parasitised. The fly did however reduce the reproductive output of
crofton weed stems. These post-release evaluations highlight the
necessity to define success and collect pre-release data in biocontrol
programmes prior to agent releases.
Surveys for new biocontrol agents for crofton weed have been undertaken.
The selection of the new agent will need to consider the interaction with
the fly and pathogen. In addition, based on this study, the new agent will
need to inflict damage which will minimise compensatory growth in crofton
weed.
.
Keywords: Crofton weed, Procecidochares utilis, Passalora ageratinae,
multiple biocontrol agents, insect-pathogen interactions, post-release
evaluations

vi
Table of Contents
ACKNOWLEDGEMENTS ........................................................................ ii
ABSTRACT ............................................................................................. iv
TABLE OF CONTENTS .......................................................................... vi
LIST OF FIGURES ................................................................................... x
LIST OF TABLES ................................................................................... xv
CHAPTER 1: INTRODUCTION ............................................................. 1-1
1.1 Background ................................................................................ 1-2
1.2 Aims and objectives .................................................................. 1-6
1.2.1 Objectives of the laboratory and field trials ......................... 1-7
1.2.2 Objectives of the field surveys ............................................ 1-7
1.3 Study species ............................................................................. 1-9
1.3.1 Ageratina adenophora ......................................................... 1-9
1.3.2 Procecidochares utilis ....................................................... 1-11
1.3.3 Passalora ageratinae ........................................................ 1-12
1.4 Multiple biocontrol agent releases ......................................... 1-14
1.5 Post-release evaluations ......................................................... 1-17
1.6 Field sites ................................................................................. 1-19
1.7 Structure of the thesis ............................................................. 1-21
CHAPTER 2: INTERACTIONS BETWEEN A STEM GALL FLY AND A
LEAF-SPOT PATHOGEN IN THE BIOLOGICAL CONTROL OF
AGERATINA ADENOPHORA. .............................................................. 2-1
2.1 Abstract ...................................................................................... 2-2
2.2 Introduction ................................................................................. 2-3
2.3 Material and methods ................................................................ 2-6
2.3.1 Laboratory trials .................................................................. 2-7
2.3.2 Data analysis .................................................................... 2-10
2.4 Results ....................................................................................... 2-10
2.4.1 Impact of AMISTAR ® on Ageratina adenophora growth ... 2-10
2.4.2 Agent establishment and infection severity ........................ 2-10
2.4.3 Stem height ........................................................................ 2-13
2.4.4 Stem growth above the oviposition site ............................. 2-13
2.4.5 Internode length above oviposition site .............................. 2-14
vii
2.4.6 Percentage of live leaves per stem .................................... 2-15
2.4.7 Number of sideshoots per stem ......................................... 2-16
2.5 Discussion ................................................................................ 2-17
2.6 Conclusion ............................................................................... 2-22
CHAPTER 3: CAN LABORATORY TRIALS TESTING AGENT
EFFICACY BE EXTRAPOLATED TO FIELD CONDITIONS? A TEST
CASE USING MULTIPLE AGENTS IN THE BIOCONTROL OF
CROFTON WEED ................................................................................. 3-1
3.1 Abstract ...................................................................................... 3-2
3.2 Introduction ................................................................................. 3-3
3.3 Material and methods ................................................................ 3-5
3.3.1 Field site .............................................................................. 3-5
3.3.2 Field trials ............................................................................ 3-6
3.3.3 Data analysis ...................................................................... 3-8
3.4 Results ........................................................................................ 3-8
3.4.1 Stem death ........................................................................... 3-8
3.4.2 Agent establishment and infection severity .......................... 3-8
3.4.3 Stem height ........................................................................ 3-11
3.4.4 Stem growth above the oviposition site ............................. 3-11
3.4.5 Percentage of live leaves per stem .................................... 3-12
3.4.6 Number of sideshoots per stem ......................................... 3-13
3.4.7 Biomass ............................................................................. 3-14
3.5 Discussion ................................................................................ 3-15
3.6 Conclusion ............................................................................... 3-18
CHAPTER 4: DO MULTIPLE AGENTS REDUCE THE REPRODUCTIVE
OUTPUT OF THE INVASIVE ALIEN PLANT, AGERATINA
ADENOPHORA, IN LABORATORY AND FIELD TRIALS? ................. 4-1
4.1 Abstract ...................................................................................... 4-2
4.2 Introduction ................................................................................. 4-3
4.3 Material and methods ................................................................ 4-5
4.3.1 Laboratory trials .................................................................. 4-5
4.3.2 Field trials ............................................................................ 4-6
4.3.3 Reproductive output measurements ................................... 4-7
4.3.4 Data analysis ...................................................................... 4-8
viii
4.4 Results ............................................................................................ 4-9
4.4.1 Impact of AMISTAR ® on Ageratina adenophora reproductive
output ........................................................................................... 4-9
4.4.2 Number of synflorescences per stem ................................... 4-9
4.4.3 Number of capitula per synflorescence ............................. 4-10
4.4.4 Number of filled, empty and aborted achenes per capitulum ...
.......................................................................................... 4-12
4.4.5 Number of filled and germinable achenes per stem ........... 4-13
4.4.6 Percentage germination of achenes................................... 4-14
4.5 Discussion ................................................................................ 4-16
4.6 Conclusion ............................................................................... 4-20
CHAPTER 5: ECOPHYSIOLOGICAL RESPONSE OF THE INVASIVE
ALIEN PLANT AGERATINA ADENOPHORA TO MULTIPLE
BIOLOGICAL CONTROL AGENTS ...................................................... 5-1
5.1 Abstract ...................................................................................... 5-2
5.2 Introduction ................................................................................. 5-3
5.3 Material and methods ................................................................ 5-5
5.3.1 Laboratory trials .................................................................. 5-5
5.3.2 Leaf ecophysiological measurements ................................. 5-6
5.3.3 Data analysis ...................................................................... 5-8
5.4 Results ........................................................................................ 5-8
5.4.1 Transpiration, stomatal conductance, photosynthesis and
instantaneous water-use efficiency (WUE) ................................... 5-8
5.4.2 Chlorophyll fluorescence kinetics ....................................... 5-12
5.4.3 Chlorophyll content ............................................................ 5-12
5.5 Discussion ................................................................................ 5-14
5.6 Conclusion ............................................................................... 5-17
CHAPTER 6: POST-RELEASE EVALUATION OF TWO BIOCONTROL
AGENTS RELEASED AGAINST AGERATINA ADENOPHORA
(ASTERACEAE) AT THREE SITES IN SOUTH AFRICA ..................... 6-1
6.1 Abstract ...................................................................................... 6-2
6.2 Introduction ................................................................................. 6-3
6.3 Material and methods ................................................................ 6-5
6.3.1 Field sites ............................................................................ 6-5
6.3.2 Field sites soil texture and fertility ....................................... 6-7

ix
6.3.3 Rainfall, temperature and humidity ..................................... 6-8
6.3.4 Field measurements ............................................................ 6-9
6.3.5 Data analysis .................................................................... 6-11
6.4 Results ...................................................................................... 6-12
6.4.1 Rainfall, temperature and humidity ..................................... 6-12
6.4.2 Density and size distribution of A. adenophora populations .....
........................................................................................... 6-14
6.4.3 Biomass of A. adenophora populations ............................. 6-17
6.4.4 Prevalence and severity of P. ageratinae populations ...... 6-19
6.4.5 Prevalence and severity of P. utilis populations ................ 6-19
6.4.6 Reproductive output of A. adenophora populations ........... 6-23
6.5 Discussion ................................................................................ 6-27
6.6 Conclusion ............................................................................... 6-32
CHAPTER 7: GENERAL DISCUSSION ................................................ 7-1
7.1 Aims of this chapter .................................................................. 7-2
7.2 Multiple biocontrol agents ........................................................ 7-2
7.3 Field and laboratory trials ......................................................... 7-5
7.4 Post-release evaluations ........................................................... 7-6
7.5 Future of Ageratina adenophora biocontrol in South Africa .. 7-8
REFERENCES ........................................................................................... I

x
List of Figures
Chapter 1
Figure 1.1: Distribution of Ageratina adenophora in South Africa. (Drawn by L.
Henderson; data source: SAPIA data base, ARC-Plant Protection Research
Institute, Pretoria), and location of three field sites, Barberton, Magaliesberg
and Pietermaritzburg, where A. adenophora infestations were surveyed for
this study ................................................................................................ 1-6
Figure 1.2: Photographs of Ageratina adenophora plants in cages during
laboratory (a) and field (b) trials .............................................................. 1-8
Figure 1.3: (a) Ageratina adenophora shoot and inflorescence (A). (Drawn by G.
Condy, South African National Biodiversity Institute, Pretoria. First
published in Kulge (1991).) (b) Ageratina adenophora foliage .............. 1-10
Figure 1.4: Ageratina adenophora synflorescences and achenes ..................... 1-10
Figure 1.5: Procecidochares utilis gall with emergence holes on a flowering
Ageratina adenophora stem, and a P. utilis gall developing on the leaf
petiole. .................................................................................................. 1-12
Figure 1.6: Passalora ageratinae leaf-spots on the lower leaves of Ageratina
adenophora stems. ............................................................................... 1-14
Figure 1.7: Photographs of the three Ageratina adenophora infestations surveyed
in the post-release evaluation conducted in this study. ......................... 1-20
Chapter 2
Figure 2.1: The percentage of living leaves infected with the fungal pathogen
Passalora ageratinae per Ageratina adenophora stem, when either galled
or ungalled by the fly Procecidochares utilis, from June 2007 to November
2007. For each month, means followed by the same letter are not
significantly different, at P<0.05 (LSD). (Means ± SE). ......................... 2-11
Figure 2.2: Gall size index (gall diameter x length) of the first generation of
Procecidochares utilis on Ageratina adenophora double galled treatment
stems infected and uninfected with the fungal pathogen Passalora
ageratinae. The number of first generation P. utilis adults (represented by
the number of emergence holes) emerging from galls on double galled
stems infected and uninfected with the pathogen; from the first release of P.
utilis in June 2007. Means followed by the same letter are not significantly
different, at P<0.05 (t-test). (Mean; Box: Mean ± SE; Whisker: Mean ±
1.96*SE). ............................................................................................... 2-12
Figure 2.3: Gall size index (gall diameter x length) of the first generation (single
galled stems) and the second generation (double galled stems) of
Procecidochares utilis on Ageratina adenophora stems infected and
uninfected with the fungal pathogen Passalora ageratinae. The number of
P. utilis adults (represented by the number of emergence holes) emerging
from the first generation galls (single galled stems) and the second
generation galls (double galled stems) on pathogen infected and uninfected
stems; from the second release of P. utilis in September 2007. Means
followed by the same letter are not significantly different, at P<0.05 (LSD).
(Means ± SE). ....................................................................................... 2-12

xi
Figure 2.4: Height of Ageratina adenophora stems in response to six different
treatment conditions, of pathogen infection and/or fly galling (single or
double), from June 2007 to November 2007. For each month, means
followed by the same letter are not significantly different, at P<0.05 (LSD).
(Means ± SE). ........................................................................................ 2-14
Figure 2.5: Monthly growth of Ageratina adenophora stems above the oviposition
site, in response to six different treatment conditions, of pathogen infection
and/or fly galling (single or double), after the first fly release in June 2007
until November 2007. For each month, means followed by the same letter
are not significantly different, at P<0.05 (LSD). (Means ± SE). .............. 2-15
Figure 2.6: Percentage of living leaves on Ageratina adenophora stems in
response to six different treatment conditions, of pathogen infection and/or
fly galling (single or double), from June 2007 to November 2007. For each
month, means followed by the same letter are not significantly different, at
P<0.05 (LSD). (Means ± SE). ................................................................ 2-16
Figure 2.7: The number of sideshoots on Ageratina adenophora stems in response
to six different treatment conditions, of pathogen infection and/or fly galling
(single or double), at the end of November 2007. Means followed by the
same letter are not significantly different, at P<0.05 (LSD). (Means ± SE).
.............................................................................................................. 2-17
Chapter 3
Figure 3.1: Percentage of live leaves infected with the fungal pathogen Passalora
ageratinae per Ageratina adenophora stem, when either galled (single or
double) or ungalled by the fly Procecidochares utilis, from June 2007 to
April 2008. For each month, means followed by different letters are
significantly different, at P<0.05 (LSD). (Means ± SE). ............................ 3-9
Figure 3.2: (a) Gall size index (gall diameter x length) of Procecidochares utilis on
Ageratina adenophora stems infected with the fungal pathogen Passalora
ageratinae, and (b) the number of P. utilis adults (represented by the
number of emergence holes) emerging from galls on pathogen infected
stems; from the release of P. utilis in August 2007 and January 2008.
Means followed by different letters are significantly different, at p<0.05
(LSD). (Means ± SE).. ........................................................................... 3-10
Figure 3.3: Figure 3: Height of Ageratina adenophora stems in response to three
different treatments, of pathogen infection with or without galling (single or
double), from June 2007 to April 2008. For each month, means followed by
different letters are significantly different, at P<0.05 (LSD). (Means ± SE)
. ............................................................................................................. 3-11
Figure 3.4: Growth of Ageratina adenophora stems above the oviposition site, in
response to three different treatments, of pathogen infection with or without
galling (single or double), after the second fly release in January 2008 until
April 2008. For each month, means followed by different letters are
significantly different, at P<0.05 (LSD). (Means ± SE). .......................... 3-12
Figure 3.5: Percentage of live leaves on Ageratina adenophora stems in response
to three different treatments, of pathogen infection with or without galling
(single or double), from June 2007 to April 2008. For each month, means

xii
followed by different letters are significantly different, at P<0.05 (LSD).
(Means ± SE). ........................................................................................ 3-13
Figure 3.6: Number of sideshoots on Ageratina adenophora stems in response to
three different treatments, of pathogen infection with or without galling
(single or double), at the end of April 2008. Means followed by different
letters are significantly different, at P<0.05 (LSD). (Means ± SE). .......... 3-13
Figure 3.7: The percentage of biomass allocation of Ageratina adenophora stems
to live leaves, sideshoots and bare stems, and the total biomass (g) of
stems in response to three different treatment conditions, of pathogen
infection with or without galling, at the end of April 2008. Means followed by
different letters are significantly different, at P<0.05 (LSD). (Means ± SE). ...
.. ............................................................................................................. 3-14
Chapter 4
Figure 4.1: Number of synflorescences per Ageratina adenophora stem in
response to different treatments, of pathogen infection and/or fly galling
(single or double) in a laboratory and field trial. For field and laboratory
trials separately, means followed by the same letter are not significantly
different, at P<0.05 (LSD: laboratory trial, t-test: field trial). (Means ± SE).
For comparing specific treatments between the field and laboratory trials,
means followed by the same number of * or # are not significantly different,
at P<0.05 (t-test). ................................................................................... 4-10
Figure 4.2: Number of capitula per Ageratina adenophora synflorescence in
response to different treatments, of pathogen infection and/or fly galling
(single or double) in a laboratory trial and field trial. For field and laboratory
trials separately, means followed by the same letter are not significantly
different, at P<0.05 (LSD: laboratory trial, t-test: field trial). (Means ± SE).
For comparing specific treatments between the field and laboratory trials,
means followed by the same number of * or # are not significantly different,
at P<0.05 (t-test). ................................................................................... 4-11
Figure 4.3: Number of filled, empty/aborted and total achenes per Ageratina
adenophora capitula in response to different treatments, of pathogen
infection and/or fly galling (single or double) in a laboratory trial and field
trial. For field and laboratory trials separately, means followed by the same
letter are not significantly different, at P<0.05 (LSD: laboratory trial, t-test:
field trial). (Means ± SE). For comparing specific treatments between the
field and laboratory trials, means followed by the same number of * or # are
not significantly different, at P<0.05 (t-test). ........................................... 4-13
Figure 4.4: Number of filled achenes per Ageratina adenophora stem in response
to different treatments, of pathogen infection and/or fly galling (single or
double) in a laboratory trial and field trial. For field and laboratory trials
separately, means followed by the same letter are not significantly different,
at P<0.05 (LSD: laboratory trial, t-test: field trial). (Means ± SE). For
comparing specific treatments between the field and laboratory trials,
means followed by the same number of * or # are not significantly different,
at P<0.05 (t-test). ................................................................................... 4-15
Figure 4.5: Number of germinable achenes per Ageratina adenophora stem in
response to different treatments, of pathogen infection and/or fly galling

xiii
(single or double) in a laboratory trial and field trial. For field and laboratory
trials separately, means followed by the same letter are not significantly
different, at P<0.05 (LSD: laboratory trial, t-test: field trial). (Means ± SE).
For comparing specific treatments between the field and laboratory trials,
means followed by the same number of * or # are not significantly different,
at P<0.05 (t-test). ................................................................................... 4-15
Figure 4.6: Percentage germination of Ageratina adenophora achenes in response
to different treatments, of pathogen infection and/or fly galling (single or
double) in a laboratory trial and field trial. For field and laboratory trials
separately, means followed by the same letter are not significantly different,
at P<0.05 (LSD: laboratory trial, t-test: field trial). (Means ± SE). For
comparing specific treatments between the field and laboratory trials,
means followed by the same number of * or # are not significantly different,
at P<0.05 (t-test). ................................................................................... 4-16
Chapter 5 Figure 5.1: Transpiration rate of the seventh fully-expanded Ageratina adenophora
leaf in response to six different treatments, of pathogen infection and/or fly
galling (single or double). Means followed by the same letter are not
significantly different, at P<0.05 (LSD). (Means ± SE). .......................... 5-10
Figure 5.2: Stomatal conductance of the seventh fully-expanded Ageratina
adenophora leaf in response to six different treatments, of pathogen
infection and/or fly galling (single or double). Means followed by the same
letter are not significantly different, at P<0.05 (LSD). (Means ± SE). ...... 5-10
Figure 5.3: Photosynthetic rate of the seventh fully-expanded Ageratina
adenophora leaf in response to six different treatments, of pathogen
infection and/or fly galling (single or double). Means followed by the same
letter are not significantly different, at P<0.05 (LSD). (Means ± SE). ...... 5-11
Figure 5.4: Instantaneous water-use efficiency (WUE) of the seventh fully-
expanded Ageratina adenophora leaf in response to six different
treatments, of pathogen infection and/or fly galling (single or double).
Means followed by the same letter are not significantly different, at P<0.05
(LSD). (Means ± SE). ............................................................................ 5-11
Figure 5.5: Chlorophyll fluorescence parameters of the top (youngest) and seventh
(older) fully-expanded leaves of Ageratina adenophora in response to six
different treatments, of pathogen infection and/or fly galling (single or
double). Means followed by a different letter are significantly different, at
P<0.05 (LSD). (Means ± SE). ................................................................ 5-13
Figure 6: Chlorophyll content of the top (youngest) and seventh (older) fully-
expanded leaves of Ageratina adenophora in response to six different
treatments, of pathogen infection and/or fly galling (single or double).
Means followed by the same letter are not significantly different, at P<0.05
(LSD). (Means ± SE). ............................................................................ 5-14
Chapter 6
Figure 6.1: Distribution of Ageratina adenophora in South Africa. (Drawn by L.
Henderson; data source: SAPIA data base, ARC-Plant Protection Research

xiv
Institute, Pretoria), and location of three field sites, Barberton, Magaliesberg
and Pietermaritzburg, where A. adenophora infestations were surveyed for
this study. ................................................................................................ 6-5
Figure 6.2: Mean monthly rainfall (mm) at the three field sites surveyed from
December 2005 to December 2006. Data provided by the South African
Weather Service). ................................................................................. 6-12
Figure 6.3: Monthly temperature and relative humidity at the three field sites
surveyed from December 2005 to December 2006. (Means ± SE). ...... 6-13
Figure 6.4: Density of Ageratina adenophora adult stems and seedlings per m2 of
invasion at three field sites from December 2005 to December 2006. For
each month, means followed by different letters are significantly different, at
P<0.05 (LSD). (Means ± SE). ................................................................ 6-15
Figure 6.5: Size structure based on stem height distribution of Ageratina
adenophora infestations at three field sites from December 2005 to
December 2006. .................................................................................... 6-16
Figure 6.6: The linear relationship between stem height and total above-ground
biomass of Ageratina adenophora stems at three field sites from December
2005 to October 2006. For each month, lines followed by different letters
are significantly different, at P<0.05 (LSD). ............................................ 6-18
Figure 6.7: Estimated total above-ground biomass per m2 of Ageratina adenophora
stems within three invaded sites from December 2005 to October 2006.
Means followed by different letters are significantly different, at P<0.05
(LSD). (Means ± SE). ............................................................................ 6-19
Figure 6.8: Percentage Ageratina adenophora stems infected with the fungal
pathogen Passalora ageratinae or galled by the fly Procecidochares utilis,
from December 2005 to December 2006, at three field sites. ................ 6-20
Figure 6.9: Percentage of Ageratina adenophora pathogen-infected stems with
leaves infected with 1-10%, 10-30% or 30-50% by Passalora ageratinae,
from December 2005 to December 2006, at three field sites. ................ 6-21
Figure 6.10: Percentage Ageratina adenophora galled stems with one, two or three
Procecidochares utilis galls, from December 2005 to December 2006, at
Pietermaritzburg.. .................................................................................. 6-22
Figure 6.11: Percentage of flowering and galled Ageratina adenophora stems, and
percentage of new Procecidochares utilis galls at Pietermaritzburg from
April 2006 to December 2006. ............................................................... 6-22
Figure 6.12: Number of filled achenes and germinable achenes per Ageratina
adenophora stem in relation to six different attack levels, of pathogen
infection and/or fly galling at three field sites in October 2006. Means
followed by the same letter are not significantly different, at P<0.05 (LSD).
(Means ± SE). ........................................................................................ 6-26
Figure 6.13: Mean total germinable achene production of Ageratina adenophora
per m2 of invasion at three field sites in October 2006. Means followed by
the same letter are not significantly different, at P<0.05 (LSD). (Means ±
SE). ....................................................................................................... 6-27

xv
List of Tables
Chapter 5
Table 5.1: Air and leaf temperatures and relative humidity (mean±SE) during the
measurements of transpiration, stomatal conductance and photosynthesis
for leaves of Ageratina adenophora in response to six different treatments,
of pathogen infection and/or fly galling (single or double) in the greenhouse
trial over two days. (NS, P>0.05 (LSD)). .................................................. 5-9
Chapter 6
Table 6.1: Details of three Ageratina adenophora field sites sampled from
December 2005 to December 2006. ........................................................ 6-7
Table 6.2: Comparison of soil texture and fertility of three Ageratina adenophora
field sites. Comparisons between the three sites were made using one-way
ANOVA’s, different superscripts within rows are significantly different, at
P<0.05 (LSD). (Means ± SE). Significant P-values are in bold. ................ 6-8
Table 6.3: Percentage of Procecidochares utilis and parasitoid adults emerging
from galls on Ageratina adenophora stems collected at Pietermaritzburg. . 6-
22
Table 6.4: Percentage of Ageratina adenophora stems flowering at three field sites
in July 2006 and October 2006. ............................................................. 6-23
Table 6.5: Results of two-way ANOVA’s assessing the site (df=2), level of
biocontrol agent attack (df=5) and their interaction effect on the number of
Ageratina adenophora synflorescences per stem, capitula per
synflorescence, filled achenes per capitula, empty/aborted achenes per
capitula, total number of achenes per capitula, percentage germination of
filled achenes, filled achenes/stem and germinable achenes/stem. n= 120
stems. The corresponding data are resented in Table 6.6 and Figure 6.12.
Significant P-values are in bold.. ............................................................ 6-24
Table 6.6: Number of Ageratina adenophora synflorescences per stem, capitula
per synflorescence, filled achenes per capitula, empty/aborted achenes per
capitula, total number of achenes per capitula and percentage germination
of filled achenes at three field sites in October 2006. Different superscripts
within rows are significantly different, at P<0.05 (LSD). (Means ± SE). .. 6-25

Chapter 1: Introduction

1 - 2
1.1 Background
Infestations of invasive alien plants (‘weeds’) worldwide have resulted in
major ecological and economic impacts, instigating widespread concern
and the initiation of control programmes. Invasive weeds pose major
problems for natural environments. They compete with other plants for
nutrients, water and light, and can be allelopathic (produce growth-
inhibiting toxins) (Anderson, 1996; Mack et al., 2000). This often leads to
major alterations of ecosystem functioning and native biodiversity
(Witkowski, 1991; Day et al., 2003; Barton et al., 2007). Economically,
weeds may entail a high cost in their control and eradication (Mack et al.,
2000).
Once invasive species have established and spread it is generally not
possible, or feasible, to eradicate them, therefore programmes are
instigated to control and reduce the invasions. Three principal methods of
controlling weeds are currently in use; namely chemical, mechanical and
biological control (Wittenberg & Cock, 2001). However, recently there has
been a move towards integrating all three of these methods into control
programmes of invasive weeds (Zimmermann & Neser, 1999; Ainsworth,
2003; Hatcher & Melander, 2003).
Classical biological control (biocontrol) involves the deliberate introduction
of biocontrol agents, termed natural enemies, such as insects, mites and
pathogens, from the country of origin into the invaded country (McFadyen,
1998; Müller-Schärer & Schaffner, 2008). The aim of biocontrol is not to
eradicate the weed population but to reduce the invasion to ‘acceptable
levels’, where the plants may survive and reproduce but do not invade or
impact negatively on the surrounding environment. The natural enemies
reduce the target weed population by affecting plant performance such as
reducing biomass and decreasing reproductive output (Müller-Schärer &
Schaffner, 2008)
Biocontrol has many positive aspects that make it a preferred method of
invasive weed control in comparison to chemical and mechanical control

1 - 3
(McFadyen, 1998; Wittenberg & Cock, 2001, Zimmermann et al., 2004;
Müller-Schärer & Schaffner, 2008). Firstly, it is safe and often referred to
as ‘environmentally friendly’. There are no records of weed biocontrol
agents becoming economically important pests and weed biocontrol
agents are almost exclusively host-specific (McFadyen, 1998). There are
very few recorded instances of non-target effects of weed biocontrol
agents (Louda et al., 1997; Pemberton, 2000). One of the most
advantageous aspects of biocontrol is that it is self-sustaining. Once
agents are established in the field, their populations ideally increase and
spread throughout the weed invasion, so that no further introductions are
usually necessary. Also, as the host plants are not eradicated, small
populations of agents persist in the field, and can control the weed if it
reinvades. The self-sustainability of biocontrol leads to substantial
economic savings in weed management programmes and as the weed
populations are no longer invasive there is an increase in land productivity
resulting in financial returns (van Wilgen et al., 2004, van Wilgen & De
Lange, 2011).
Worldwide more than 400 species of biocontrol agents have been
released against approximately 280 weed species in more than 75
countries (Julien & Griffiths, 1998). In South Africa, 284 biocontrol agents
have been considered, of these 284 organisms 106 have been released,
and 75 of these have established on 48 plant species (Klein, 2011). Of the
48 target weeds, 21% are completely controlled by the biocontrol agents,
so that no other control measures are necessary, and 38% of the target
weeds are under substantial control through biocontrol. Additional
management practices are needed to keep these weeds at acceptable
levels, but the intensity of these practices is reduced after the introduction
of biocontrol methods (Klein, 2011). Twenty-nine percent of the target
weeds are under negligible control, where agents damage the target weed
but are not adequate for total control, necessitating the use of additional
control methods to reduce the weed infestations. The impact of biocontrol
agents is unknown for 10% of the target weeds (Klein, 2011).

1 - 4
Ageratina adenophora, (Sprengel) King and Robinson (syn. Eupatorium
adenophorum Sprengel) (Asteraceae), also known as crofton weed or the
Mexican Devil weed, originates from Mexico, and was probably first
introduced into South Africa as an ornamental before 1948 (Hilliard, 1977).
It is naturalised and an invasive weed in several countries worldwide,
including Australia, New Zealand, Hawaii, India, Thailand, Taiwan and
China (Peng et al., 1998, Trounce, 2003). Within South Africa crofton
weed is found in KwaZulu-Natal, Western Cape, North West,
Mpumalanga, Limpopo and Gauteng provinces (Henderson, 2001;
Heystek et al., 2011) (Fig. 1.1). The initial major infestation was along the
Natal mistbelt, where it spread rapidly causing some concern (Plant
Protection News, 1988). Since 1997 crofton weed has appeared and
spread rapidly in the Magaliesberg, a natural heritage site, particularly in
the Easter Kloof (Heystek et al., 2011).
In South Africa crofton weed is a Category 1 invasive plant under the
Conservation of Agricultural Resources Act (CARA) and is referred to as
the inland equivalent of its close relative chromolaena, Chromolaena
odorata King and Robinson (Asteraceae) (Plant Protection News, 1987a).
It is listed as a widespread-abundant, special effect weed, indicating that
its range and abundance significantly impacts on natural and semi-natural
environments, degrading their value or purpose (Henderson, 2001; Nel et
al., 2004). Crofton weed has many adverse affects on the areas in which it
invades, necessitating its control (Erasmus et al., 1992; Land Protection,
2001; Page & Lacey, 2006). Firstly, it is a serious weed on agricultural
land, reducing the carrying capacity and crop yields. Forestry is negatively
impacted where expansive dense stands prohibit the growth of seedlings.
When eaten by horses it causes a fatal lung disease, and it is toxic to
other livestock (Plant Protection News, 1988). Conservation areas are
adversely affected by this weed, as it is allelopathic, alters soil microbial
communities and displaces natural vegetation (Erasmus et al. 1992;
Henderson, 2001; Niu et al., 2007).

1 - 5
In South Africa a relatively small biocontrol programme for the control of
crofton weed was initiated in 1984 (Plant Protection News, 1987b). Two
biocontrol agents were released against crofton weed, a stem gall fly,
Procecidochares utilis Stone (Tephritidae), and a leaf-spot pathogen,
Passalora ageratinae Crous and A.R. Wood (Mycosphaerellaceae). The
stem gall fly was released near Pietermaritzburg between 1984 and 1987
(Kluge, 1991), and later in the Magaliesberg. The leaf-spot pathogen, the
second pathogen to be imported for biocontrol in South Africa, was
released in Natal (now KwaZulu-Natal) and south-west Cape in 1987
(Plant Protection News, 1988), and in the Magaliesberg. Both agents are
established in South Africa.
The gall fly has been very successful in Hawaii, clearing large infestations
of crofton weed (Bess & Haramoto, 1959, 1972). Up to 100% of crofton
weed stems were galled, with 1-7 galls per stem, which resulted in stunted
plants, weakened stems and death of some plants (Bess & Haramoto,
1972). In Australia, the gall fly initially galled most stems, but now galls
less than 50% of stems in crofton weed infestations (Page & Lacey, 2006).
In China, galling levels are low with 10-37% of stems galled (Zhang et al.,
2008). The gall fly and fungal pathogen together have slowed the
encroachment of crofton weed and thinned infestations along the east
coast of Australia (Dodd, 1961; Page & Lacey, 2006). The fungal
pathogen has led to death of seedlings and major or complete defoliation
of stems in Australia in the drier months (Page & Lacey, 2006), and high
levels of galling reduced plant vigour and killed plants (Dodd, 1961).
Bennett (1986) initially evaluated the effectiveness of the fly in South
African laboratory trials, however since then no formal evaluation of the
efficacy of the fly and pathogen on crofton weed control has been
undertaken in South Africa. Surveys for new biocontrol agents for crofton
weed in South Africa are currently underway (Heystek et al., 2011).

1 - 6
Figure 1.1: Distribution of Ageratina adenophora (O) in South Africa. (Drawn by L.
Henderson; data source: SAPIA data base, ARC-Plant Protection Research Institute,
Pretoria), and location of three field sites, Barberton ( ), Magaliesberg ( ) and
Pietermaritzburg ( ), where A. adenophora infestations were surveyed for this study.
1.2 Aims and objectives
The overall aim of this study was to evaluate the effectiveness of
Procecidochares utilis and Passalora ageratinae as biocontrol agents,
individually and in combination, for Ageratina adenophora in South Africa.
The study consisted of two components. Firstly, laboratory trials of the two
agents in various combinations on crofton weed at the University of the
Witwatersrand and field trials of the two agents in various combinations on
crofton weed in the Magaliesberg (Fig. 1.2), and secondly, field surveys of
the two biocontrol agents and crofton weed populations in the
Pietermaritzburg, Magaliesberg, and Barberton areas.

1 - 7
1.2.1 Objectives of the laboratory and field trials
1.2.1.1 Assessment of the impact of both biocontrol agents on the
vegetative growth of A. adenophora.
Measure the vegetative growth of A. adenophora without biocontrol
agents.
Reassess the impact of P. utilis on the vegetative growth of A.
adenophora (done by Bennett, 1986).
Assess the impact of P. ageratinae on the vegetative growth of A.
adenophora.
Assess the combined impact of both P. utilis and P. ageratinae on the
vegetative growth of A. adenophora.
1.2.1.2 Assessment of the impact of both biocontrol agents on the
reproductive output of A. adenophora.
Measure the reproductive output of A. adenophora without biocontrol
agents.
Reassess the impact of P. utilis on the reproductive output of A.
adenophora (done by Bennett, 1986).
Assess the impact of P. ageratinae on the reproductive output of A.
adenophora.
Assess the combined impact of both P. utilis and P. ageratinae on the
reproductive output of A. adenophora.
1.2.1.3 Compare results obtained from laboratory trials and field trials.
1.2.2 Objectives of the field surveys
Survey the A. adenophora population, in terms of plant density, size
distribution and biomass, over four seasons.
Survey the P. utilis population, in terms of galling prevalence and
severity of gall attack, over four seasons.

1 - 8
Survey the P. ageratinae populations, in terms of disease prevalence
and severity of infection, over four seasons.
Survey the reproductive output of A. adenophora in the field.
Survey the level of parasitism of P. utilis in the field, over four seasons.
Figure 1.2: Photographs of Ageratina adenophora plants in cages during laboratory (a)
and field (b) trials.
(a)
(b)

1 - 9
1.3 Study species
1.3.1 Ageratina adenophora
Ageratina adenophora, (Sprengel) King and Robinson (syn. Eupatorium
adenophorum Sprengel) (Asteraceae), crofton weed, is a perennial herb,
with a woody rootstock, and many stems reaching up to 2m in height
(Bess & Haramoto, 1959; Henderson, 2001; Page & Lacey 2006). Stems
consist of purplish to chocolate-brown branches, and are covered in
stalked glandular hairs (Muniappan et al., 2009). The leaves are dark
green, rhombic, opposite, purple underneath and are approximately10cm
long (Muniappan et al., 2009) (Fig. 1.3). As the plant grows the bottom
leaves senesce, eventually falling off. The tall main stems bend over and
trail along the ground, rooting where they touch the soil, forming dense,
tangled impenetrable stands (Dodd, 1961). Sideshoots develop in the
nodes of tall stems, therefore where the horizontal stems root, these
sideshoots root and grow, so that many stems may arise from one main
stem (Wang et al., 2011). This original stem eventually forms a
rudimentary rhizome. Crofton weed has a shallow tap-root system with
short, lateral rootstocks in the upper soil, which may reach depths of 40cm
(Bennett, 1986).
The inflorescences are arranged in terminal capitula (flower-like heads
made up of many small white florets) surrounded by protective bracts
(Peng et al., 1998) (Fig. 1.4). In South Africa flowering occurs between
August and December (Henderson, 2001). The fruits are glabrous
achenes (smooth, hard dry fruits) approximately 2mm long, with 8-10
apical bristles (Dodd, 1961; Peng et al., 1998). Crofton weed seeds
prolifically, each plant can produce up to 100 000 achenes per season,
and dense stands can contribute up to 60 000 viable seeds per m2
(Muniappan et al., 2009). The seeds are dispersed by wind over long
distances, as well as by water and humans, allowing invasion of new
areas. Crofton weed is apomictic, producing seeds without fertilisation

1 - 10
(Rambuda & Johnson, 2004). Therefore, crofton weed can seed and
spread in the absence of other individuals or pollinators.
The weed favours moist areas near water and along stream banks, but
may also invade margins of forests, agricultural plantations and roadsides
(Henderson, 2001). Crofton weed often grows in inaccessible areas, such
as high up on waterfalls and in the crevices of mountain ridges, where
these infestations are very difficult to clear manually.
Figure 1.3: (a) Ageratina adenophora shoot and inflorescence (A). (Drawn by G. Condy,
South African National Biodiversity Institute, Pretoria. First published in Kluge (1991)).
(b) Ageratina adenophora foliage.
Figure 1.4: Ageratina adenophora synflorescences and achenes.
(a)
(b)

1 - 11
1.3.2 Procecidochares utilis
Procecidochares utilis Stone (Tephritidae) originates from Mexico and was
first introduced into Hawaii in 1945; and later into Australia in 1952 (Bess
& Haramoto, 1959; Dodd, 1961). Populations of the fly, imported from
Australia, were released in South Africa in 1984 (near Stellenbosch) and in
1987 (near Pietermaritzburg) (Kluge, 1991), and more recently in 2009 in
the Magaliesberg area (Heystek et al., 2011). The gall fly has persisted
and is now considered to be widely established in South Africa, although
this has not been systematically tested.
One female gall fly can produce up to 160 eggs, laying eggs in batches, of
2-23 eggs, on or near the apical bud (Bennett & Van Staden, 1986).
Larvae hatch 3-7 days later, after which they feed on young leaf tissue as
they move to the base of the leaves and tunnel into the stem, where they
feed on plant tissues, resulting in the formation of galls (Bennett, 1986).
The gall fly has 3 larval instars. Before pupating the third larval instar
excavates a tunnel from the centre of the gall to the outside of the gall,
leaving only the epidermis intact, creating an emergence window (Fig.
1.5). The larval stage usually lasts for 20 days. Pupation occurs in the
galls with adult flies emerging 2-3 weeks later. The life-cycle of the gall fly
ranges from 48 days in summer to 92 days in winter, with an average of
five generations per year (Dodd, 1961).
Laboratory trials show that the fly is an effective biocontrol agent that
should significantly reduce weed populations (Bennett, 1986). The fly is
capable of halting stem growth, and if the stem is subjected to repeated
generations of flies (i.e. more than one gall per stem) the stem may die,
and even whole plants may die (Erasmus et al., 1992). The above
laboratory trials also showed that the fly reduces the reproductive potential
of crofton weed by approximately 60% (Erasmus et al., 1992). The galls
did not reduce the viability of the seeds, but the number of seeds
produced was significantly reduced. This reduction was achieved as galled
stems produced underdeveloped capitula and a reduced number of

1 - 12
capitula, in comparison with ungalled stems. However, in contrast to these
laboratory results, Kluge (1991) reported no visible impact of the fly on the
size or density of the crofton weed infestations in Pietermaritzburg.
Parasitism of the gall fly has been recorded in South Africa. Bennett
(1986) identified three wasp parasitoids; a member of the Pteromalidae
family, Dimeromicrus spp. and an Eupelmus spp..
Figure 1.5: Procecidochares utilis gall with emergence holes on a flowering Ageratina
adenophora stem, and a P. utilis gall developing on the leaf petiole.
1.3.3 Passalora ageratinae
Passalora ageratinae Crous and A.R. Wood (Mycosphaerellaceae)
(previously named Cercospora eupatorii Peck or Phaeoramularia sp.)
(Crous et al., 2009) is a fungal leaf-spot pathogen native to Central
America. The pathogen was first recorded in Queensland, Australia in
1954, where it was accidentally introduced with a shipment of the gall fly
(Dodd, 1961). It was found that when adult flies were artificially laden with
spores they were able to carry viable spores on their legs and among their
body hairs, and therefore transmit the pathogen between host plants
(Dodd, 1961). The pathogen spores are also spread by wind and water
(Dodd, 1961).

1 - 13
Cultures of the pathogen were imported from Australia and released in
South Africa in 1987 and 1988 near Stellenbosch and into areas
surrounding Pietermaritzburg (Morris, 1991). A further three releases were
made in Natal (now KwaZulu-Natal) in 1989. The pathogen established
and some defoliation was recorded but there has been little monitoring on
the impact of the pathogen since then (Morris, 1991). The introduction of
the pathogen into the Magaliesberg kloofs (riverine gorges) was not a
large-scale, formally organised biocontrol programme. Dr. Stefan Neser, of
the Plant Protection Research Institute (PPRI) Pretoria, inoculated crofton
weed infestations in the Easter Kloof, Magaliesberg, with the pathogen
opportunistically in the late 1990’s. A survey in 2004 showed that the
pathogen has established and spread to other kloofs within the
Magaliesberg (Buccellato, 2004).
The pathogen only infects the leaves of crofton weed. A dew period of 24
hours, 24/19°C (day/night), is required (Wang et al., 1997). Conidia
germinate at 20-25°C and the optimum temperature for fungal growth is
25°C. Conidia germinate within 24 hours of inoculation, germ tubes from
the conidia branch across the leaf surface and penetrate the stomata
within five days (Morris, 1989; Wang et al., 1997). The penetration hyphae
then branch in the substomatal chambers and form networks in the
mesophyll tissue. Conidiophores are produced from the hyphal networks
or on the surface hyphae. Leaf-spots are visible on the leaves three weeks
after inoculation and five to seven weeks later the infected leaves die
(Morris, 1989) (Fig. 1.6).
A survey in the Magaliesberg in 2004 showed that the pathogen may
increase the proportion of dead leaves on plants, but does not seem to
significantly influence any other part of the plant (Buccellato, 2004). The
lower leaves on the stems of mature plants naturally senesce and fall off,
therefore it is predicted that the predominant impact of the pathogen on
crofton weed is to reduce the life-span of leaves on a plant (i.e. increase
the number of leaves senescing on a plant) and thereby possibly reduce
the amount of nutrients and energy available for other parts of the plant.

1 - 14
Any possible effect of the pathogen on the reproductive potential of crofton
weed is not known. However, if a shorter leaf life-span reduces the
availability of nutrients and energy, it is possible that the reproductive
potential of the plant will be reduced.
Currently crofton weed is considered to be under negligible control by
either of the biocontrol agents in South Africa. Even though there is
obvious damage by the agents the management of crofton weed generally
relies on other means of control, such as chemical and mechanical
(Zimmermann et al., 2004).
Figure 1.6: Passalora ageratinae leaf-spots on the lower leaves of Ageratina adenophora
stems.
1.4 Multiple biocontrol agent releases
Often weed biocontrol programmes involve the release of more than one
agent. However, the number of biocontrol agents needed for the
successful control of a weed has not been determined. A review of 59
weed biocontrol projects showed that multiple species released against
weeds did not adversely affect the establishment rate of agents, and most
importantly the success of biocontrol projects increased with multiple
agents (Denoth et al., 2002). Of the 59 projects, 28 projects were
successful using multiple agents, 75% of which involved between two and

1 - 15
five agents, and 25% of which involved from six to 25 species (Denoth et
al., 2002). However, of all the projects 54% attributed success to only one
of the agents and two to three species were responsible for the success of
39% of the projects.
Two models have been proposed to explain the higher success rate of
biocontrol projects with multiple agents in comparison with single agents.
The cumulative stress model proposes that several agents are involved in
the control of the weed (Harris, 1985). In this model the agents interact
synergistically, increasing the stress on the plant and thereby increasing
the efficacy of biocontrol on the target weed (Hoffmann & Moran, 1998;
Stiling & Cornelissen, 2005; Campanella et al., 2009; Rayamajhi et al.,
2010; Turner et al., 2010). The lottery model predicts that only one agent
is responsible for the control of the weed, and that the release of multiple
agents increases the chance that this ‘right’ agent will be released (Myers,
1985, 2008; McEvoy & Coombs, 2000). The lottery model also proposes
that different agents may be more or less suitable in different locations.
The biocontrol programme in Hawaii and New Zealand, for mistflower,
Ageratina riparia (Regel) R. King and H. Robinson (Asteraceae), closely
related to crofton weed, has been successful using three biocontrol
agents. Together the leaf pathogen, Entyloma ageratinae Barreto and
Evans (Ustilaginomycetes), leaf-attacking plume moth, Oidaematophorus
benefices Yano and Heppner (Pterophoridae), and stem galler,
Procecidochares alani Steyskal (Tephritidae), have resulted in substantial
to complete control of mistflower throughout Hawaii (Gardner & Davis,
1982; Julien & Griffiths, 1998). The stem galler is capable of controlling
mistflower by halting stem growth (Morin et al., 1997). Further research in
both Hawaii and New Zealand shows that the fungus is the primary
biocontrol agent of mist flower, significantly reducing mist flower
infestations (Morin et al., 1997; Trujillo, 2005; Barton et al., 2007). The gall
fly is established at some of these infestations and provides control along
with the fungus. The plume moth is not as significant in controlling

1 - 16
mistflower, but is the preferred biocontrol agent in drier areas, which are
not suitable for the leaf pathogen (Morin et al., 1997).
Synergistic relationships between insects and pathogens are responsible
for the first successes in biocontrol for Opuntia stricta and Hypericum
perforatum (Caesar, 2000). However, biocontrol agent selection has
focused largely on insect species, with little attention given to plant
pathogens. In South Africa, of the 284 biocontrol agents that have been
considered, 83% were phytophagous insects and only 15% plant
pathogens (Klein, 2011). Biocontrol programmes may improve their
success by including plant pathogens that work synergistically with the
insects released (Caesar, 2000, 2003). The relationship between insects
and pathogens may be synergistic in terms of pathogen transmission by
the insect, and insects in addition to pathogens may increase the impact
on the target weed (Hatcher, 1995).
One way to understand the interaction between two biocontrol agents of a
target weed is to measure the impact they have on the plant (Hatcher &
Paul, 2001). Hatcher (1995) proposed four response categories;
synergistic, additive, equivalent and inhibitory; to explain the effects of the
interactions between an herbivorous insect and a fungal pathogen on plant
productivity. These categories are defined as the interactions that cause a
reduction in a plant variable:
significantly greater than that obtained from adding damage from
the insect and pathogen acting alone (synergistic)
equivalent to that obtained from adding damage from the insect and
pathogen acting alone (additive)
equivalent to the damage obtained from either the insect or the
pathogen alone (equivalent)
significantly less than that caused by the weaker of the two agents
alone (inhibitory) (Hatcher, 1995).
Turner et al. (2010) further modified the additive category to that the
combined impact of the two agents is greater than the highest impacting

1 - 17
agent acting alone, but less than or equal to the sum of the impacts
caused by each agent acting alone.
1.5 Post-release evaluations
There is a skewed distribution of priorities in biocontrol programmes, with
preference given to selecting, screening and releasing agents and little
attention given to post-release evaluations (Thomas & Willis, 1998; Kluge,
2000; McEvoy & Coombs, 2000; Morin et al., 2009). However, post-
release evaluations are very important in biocontrol programmes,
providing valuable information on (i) the effectiveness of the agent, (ii)
ecological interactions occurring in the field and, (iii) evaluations of plant
ecology and response to the agents. All of which provide improved
understanding, prediction and management guidelines for controlling weed
invasions (McEvoy & Coombs, 2000; Raghu et al., 2006).
(i) The only way to evaluate the effectiveness of a biocontrol agent in the
field is through post-release evaluations (Kluge, 2000). If the evaluation
shows the biocontrol agent to be effective, the programme can be reported
as successful and provide lessons and guidance for future programmes.
For instance, the example of the Azolla filiculoides Lamarck (Azollaceae)
biocontrol programme in South Africa (McConnachie et al., 2004) shows
how adequate release and establishment techniques, as well as good
climatic matching enhanced the potential for success. In addition, if the
agent is successful, other control mechanisms, such as mechanical and
chemical control, which are expensive and time-consuming can be
reduced or stopped. If the agent is ineffective, the post-release evaluation
can show why and steps can be taken to improve the biocontrol
programme. Specifically, post-release evaluations allow a biocontrol
programme on a weed to be an iterative process.
(ii) Post-release evaluation provides information on the ecological
interactions of the agent, target weed and components of the ecosystem in
which the weed is invasive. It reveals the factors influencing the

1 - 18
effectiveness of the biocontrol programme. Firstly, these evaluations often
show any interactions between the introduced agent and native enemies
(Thomas & Willis, 1998). This knowledge informs scientists that a new
agent may be needed, and that taxa which are not susceptible to
parasitism by native enemies should be given priority. Secondly, any
interaction of the agent with native vegetation can be assessed (Thomas &
Willis, 1998). Thereby, alerting scientists to any early non-target affects,
increasing the potential to rectify the situation, and also to prohibit further
releases of the agent.
(iii) Another valuable contribution of post-release evaluation is an improved
understanding of the target weed’s ecology and response to the biocontrol
agent in the ‘invaded’ country. Firstly, knowing the weed’s life cycle, such
as at what time of the year flowering occurs, and relating this to the life-
cycle of the agent can highlight phenological asynchrony. For example,
the damage caused by an agent may be too late in the weeds life-cycle to
reduce seed output, such as with Solanum sisymbriifolium Lamarck
(Solanaceae) (King et al., 2011). Secondly, understanding the response of
weeds to the biocontrol agents is beneficial in understanding the ecology
of the weed (Pearson & Callaway, 2003).
Failure of lantana biocontrol programmes is attributed to many factors, one
of which is indecision over the best part of the plant to attack (Broughton,
2000), as can be seen from the range of lantana feeders introduced into
South Africa (Urban et al., 2011). Many of the currently released agents
were collected opportunistically, but future agent selection programmes
should move towards more rational and disciplined approaches (Kluge,
2000; Morin et al., 2009). That is, instead of collecting natural enemies of
the weed in the country of origin, screening them for host-specificity and
then releasing them into the field; agent selection should involve
investigation into the weed and its weaknesses, giving guidelines for the
type of agent which should be sought in the country of origin (Briese,
2006; Raghu et al., 2006). One such suggestion is to simulate herbivory

1 - 19
on different parts of the target weed, allowing insight into which part of the
plant is best attacked for optimal control (Raghu & Dhileepan, 2005).
In South Africa, no comprehensive post-release evaluations have been
conducted to assess whether the fly and/or pathogen are controlling
crofton weed infestations, or if another agent is needed. A recent survey of
the pathogen and crofton weed populations in the Magaliesberg, suggests
that the pathogen is not having an effective impact on the vegetative
growth of crofton weed (Buccellato, 2004). A post-release evaluation and
assessment of crofton weed and the two biocontrol agents released
against it allows for the opportunity to examine some key issues in
biocontrol. Namely multiple versus single agent releases, pathogen and
insect interactions, parasitism of biocontrol agents, and new agent
selection.
1.6 Field sites
The field surveys in this study were undertaken at three field sites across
South Africa (Fig. 1.1, 1.7). Initially it was decided to survey crofton weed
infestations in three provinces of South Africa based on the presence or
absence of the fly and pathogen. Pietermaritzburg (KwaZulu-Natal) was
chosen as both the fly and pathogen are present, and Magaliesberg (North
West Province) was chosen as only the pathogen was present when the
surveys were conducted. Barberton (Mpumalanga) was chosen as it was
believed not to have any agents present, because the infestations were
previously unknown and no release of biocontrol agents had been
undertaken in this area. However, the pathogen was subsequently found
on plants in Barberton, and it is believed that the pathogen dispersed over
300km on its own from the Magaliesberg area (Heystek et al., 2011). The
Magaliesberg site is along a river on a privately owned farm, which is
mainly used for school camps. There were two sub-sites chosen at the
beginning of the study at Pietermaritzburg (along a roadside and in a
forest area) and at Barberton (along a roadside and under a pine forest

1 - 20
canopy), however the forest site in Pietermaritzburg and roadside site in
Barberton were completely cleared after the first survey, and therefore
were subsequently excluded from this study.
Figure 1.7: Photographs of the three Ageratina adenophora infestations surveyed in the
post-release evaluation conducted in this study.
Ba
rbe
rton
Ma
ga
liesbe
rg
Pie
term
aritz
bu
rg

1 - 21
1.7 Structure of the thesis
This thesis is divided into seven chapters, each chapter is written as a
stand-alone paper, and therefore unfortunately some repetition occurs
between the chapters. In order to reduce the repetition, detailed
descriptions of the study species have not been included in all the
chapters, and where methodology is repeated between chapters the initial
chapter is referred to. The thesis layout is as follows:
Chapter 1: A general introduction to the thesis, study species, aims and
objectives, and thesis layout.
Chapter 2: Assesses the impact of the biocontrol agents on crofton
weed vegetative growth under laboratory conditions.
Chapter 3: Assesses the impact of the biocontrol agents on crofton
weed vegetative growth under field conditions.
Chapter 4: Assesses the impact of the biocontrol agents on crofton
weed reproductive output under laboratory and field conditions.
Chapter 5: Assesses the impact of the biocontrol agents on the
ecophysiology of crofton weed under laboratory conditions.
Chapter 6: Field surveys of crofton weed, and the fly and pathogen
populations at three field sites in South Africa.
Chapter 7: A general discussion of the thesis overall findings, as well
considerations for the future biocontrol of crofton weed in South Africa.

Chapter 2: Interactions between a stem
gall fly and a leaf-spot pathogen in the
biological control of Ageratina
adenophora.
Parts of this chapter have been published in the journal
Biological Control.
Buccellato, L., Byrne, M.J. and Witkowski, E.T.F. (2012).
Interactions between a stem gall fly and a leaf-spot pathogen in
the biological control of Ageratina adenophora. Biological
Control, 61, 222-229.

2 - 2
2.1 Abstract
Many biological control projects involve the release of multiple agents.
Ageratina adenophora (crofton weed) has had two biocontrol agents,
Procecidochares utilis, a stem gall fly, and Passalora ageratinae, a leaf-
spot fungal pathogen, released against it in South Africa. This study
investigated whether the two biocontrol agents, individually or together,
increased or decreased the impact on crofton weed under greenhouse
conditions. Six month old plants were exposed to one of six treatments
(n=15 plants/treatment): control (no agents), pathogen-only, single-galled
only, double-galled only, pathogen-single galled, and pathogen-double
galled, all for a period of six months. Individually, both agents, reduced
stem height and percentage of live leaves; however there was no
synergistic effect of the two agents together. Pathogen-double galled
plants had significantly fewer pathogen infected leaves relative to the other
pathogen infected treatment plants, suggesting a negative interaction
between the two agents on pathogen establishment. Pathogen infection
did not affect the size of the fly’s galls. Double galling by the fly inhibited
stem growth above the gall position on the stem. Crofton weed
compensated for galling through vegetative reproduction, by increasing
the number of sideshoots. The pathogen inhibited sideshoot growth,
thereby adding to the stress on the weed. Overall, repeated galling by the
fly caused the greatest impact on the growth of crofton weed and the
pathogen inhibited sideshoot growth, resulting in an additive interaction
between the two agents on the biocontrol of crofton weed.

2 - 3
2.2 Introduction
Are two biocontrol agents better than one? Weed biocontrol programs
often involve the release of more than one agent (Julien & Griffiths, 1998,
McEvoy & Coombs, 2000). However, the ideal number of biocontrol
agents needed for the successful control of a weed has not been
established (Myers, 1985; Denoth et al., 2002; Stiling & Cornelissen,
2005). If several agents are released the question arises as to whether
their interactions will be synergistic, complimentary, or antagonistic and if
biological control will be improved or deterred (Myers, 1985).
A review of 59 weed biocontrol projects showed that multiple species
released against weeds did not affect the establishment rate of the agents,
and most importantly, the success of biocontrol projects increased with
multiple agent releases (Denoth et al., 2002). However, of all the projects,
54% attributed success to only one of the agents and two to three species
were responsible for the success of 39% of the projects (Denoth et al.,
2002).
Ageratina adenophora, (Sprengel) King and Robinson (syn. Eupatorium
adenophorum Sprengel) (Asteraceae), also known as crofton weed or
Mexican Devil weed, originates from Mexico, and is an invasive weed in
several countries worldwide, including South Africa, Australia, New
Zealand, Hawaii, India and China (Julien & Griffiths, 1998). Crofton weed
is a perennial herb, with a woody rootstock, and many stems reaching up
to 2m in height (Bess & Haramoto, 1959; Henderson, 2001; Page & Lacey
2006). Trailing crofton weed stems root where they touch the soil, resulting
in dense infestations (Bess & Haramoto, 1959; Morris, 1991). Crofton
weed was probably first introduced into South Africa as an ornamental
before 1948 (Hilliard, 1977). Within South Africa crofton weed invades
steep slopes and wet areas along streams, roadsides, forests and
plantations in the KwaZulu-Natal, Western Cape, North West, Limpopo,
Mpumalanga and Gauteng provinces (Henderson, 2001; Heystek, 2008).

2 - 4
In South Africa, two biocontrol agents have been released against crofton
weed, a stem gall fly, Procecidochares utilis Stone (Tephritidae), and a
leaf-spot fungal pathogen, Passalora ageratinae Crous and A.R. Wood
(Mycosphaerellaceae) (previously named Cercospora eupatorii Peck or
Phaeoramularia sp.) (Plant Protection News, 1987a; Kluge, 1991; Crous et
al., 2009). The stem gall fly was released near Pietermaritzburg, KwaZulu-
Natal, between 1984 and 1987, and more recently in the Magaliesberg,
North West Province (Kluge, 1991; Heystek et al., 2011). The leaf-spot
pathogen was released in KwaZulu-Natal and the south-western Cape in
1987 (Plant Protection News, 1988), and later in the Magaliesberg, North
West Province (Heystek et al., 2011). Both agents are well established in
South Africa (Kluge, 1991).
Female gall flies lay eggs on or near the apical bud; larvae move to the
base of the leaves and tunnel into the stem, where they feed on plant
tissues, resulting in the formation of galls (Haseler, 1965; Bennett, 1986;
Bennett & Van Staden, 1986). Previous laboratory trials concluded that the
fly is an effective biocontrol agent that should significantly reduce weed
populations in the field (Bennett, 1986). Erasmus et al. (1992) found that
the fly is capable of halting stem growth in the laboratory, and if the stem is
subjected to repeated generations of flies (i.e. more than one gall per
stem) the stem may die, and even whole plants may die.
In South Africa, the pathogen has to date only had a negligible impact on
crofton weed (Olckers, 2004; Heystek, 2008). A preliminary survey in the
Magaliesberg, North West, in 2004 showed that the pathogen may
increase the proportion of dead leaves on plants, but does not significantly
influence any other plant variable (L.Buccellato, unpublished data).
The gall fly has however successfully controlled crofton weed infestations
in Hawaii (Bess & Haramoto, 1959, 1972). Along the east coast of
Australia both the gall fly and pathogen have reduced plant vigour and
slowed encroachment of crofton weed populations (Page & Lacey, 2006).

2 - 5
The control of crofton weed infestations in New Zealand has been partially
successful as a result of the release of the gall fly (Fowler et al., 2000).
Insect-plant pathogen interactions may be synergistic when the action of
one agent increases the ability of the other agent to attack the target weed
(Caesar, 2000, 2003; Moran, 2005). However, it is also possible for insect-
plant pathogen interactions to be antagonistic. In Hawaii, two biocontrol
agents, a gall fly, Procecidochares alani Steyskal (Tephritidae), and a
white smut fungus, Entyloma ageratinae Barreto and Evans
(Ustilaginomycetes), were released against mist flower, Ageratina riparia
(Regel) R. King and H. Robinson (Asteraceae). It was initially suggested
that antagonism might arise if the fungal infection defoliated the whole
plant, thereby removing the gall fly oviposition sites, which are the new
leaves at the shoot tip (Morin et al., 1997). However, the biocontrol
programme of mist flower in both Hawaii and New Zealand has been
successful with the combination of both agents. Further research in both
Hawaii and New Zealand shows that the fungus is the primary biocontrol
agent of mist flower, significantly reducing mist flower infestations (Morin
et al., 1997; Trujillo, 2005; Barton et al., 2007). The gall fly is established
at some of these infestations and provides control along with the fungus.
One way to understand the interaction between two biocontrol agents of a
target weed is to measure the impact they have on the plant (Hatcher &
Paul, 2001). Hatcher (1995) proposed four categories; synergistic,
additive, equivalent and inhibitory; to explain the effects of the interactions
between an herbivorous insect and a fungal pathogen on plant
productivity. These categories are defined as the interactions that causes
a reduction in a plant variable: (a) significantly greater than that obtained
from adding damage from the insect and pathogen acting alone
(synergistic), (b) equivalent to that obtained from adding damage from the
insect and pathogen acting alone (additive), (c) equivalent to the damage
obtained from either the insect or the pathogen alone (equivalent) and (d)
significantly less than that caused by the weaker of the two agents alone
(inhibitory) (Hatcher, 1995). Turner et al. (2010) further modified the

2 - 6
additive category to that the combined impact of the two agents is greater
than the highest impacting agent acting alone, but less than or equal to the
sum of the impacts caused by each agent acting alone.
While previous laboratory trials have investigated the fly, P. utilis, as a
biocontrol agent for crofton weed in South Africa (Bennett, 1986, Erasmus
et al., 1992), no evaluation of the leaf-spot pathogen, P. ageratinae, as a
biocontrol agent has been done (Morris, 1991). The aim of this study was
to evaluate the effectiveness of P. utilis and P. ageratinae as biocontrol
agents, individually and jointly, on the vegetative growth of A. adenophora,
and to assess what type of interaction occurs between these two
biocontrol agents, under controlled laboratory conditions.
2.3 Material and methods
In September 2005, achenes (fruits) were randomly collected from several
plants within A. adenophora infestations in the Magaliesberg area, South
Africa (25˚49’45.1”S, 27˚26’26.0”E). Achenes were dried and stored in
brown paper bags, at room temperature, in a laboratory at the University of
the Witwatersrand, Johannesburg, Gauteng (26˚11’20.97”S,
28˚01’55.37”E) for 11 months, and then used to grow plants for laboratory
trials. A stock culture of the pathogen was garnered by collecting leaves
infected with P. ageratinae, from several plants at the same site in
Magaliesberg, in October 2006. These infected leaves were tied to crofton
weed plants in the greenhouse, on the University of the Witwatersrand
campus. Fungal leaf spots were visible on the plants eight weeks later.
These infected plants were then kept outside the greenhouse and used as
a source of fresh, pathogen-infected leaves for the laboratory trials. In
order to initiate a fly breeding programme for the laboratory trial, galls were
collected in December 2006, from A. adenophora infestations in
Pietermaritzburg (29˚33’12.4”S, 30˚20’04.0”E). Pupae were dissected out
of the galls and placed on moist cotton wool in glass vials, and kept at
room temperature until adults emerged. Procecidochares utilis adults were

2 - 7
allowed to mate and then placed onto plants, in cages, in the above
greenhouse. These plants were successfully galled, and emerging flies
were allowed to mate and gall the plants further, providing a stock culture
of flies for the laboratory trial.
2.3.1 Laboratory trials
The laboratory trial was run in a separate section of the above
greenhouse, which had 30% shading, and summer temperatures of
26.7±1.5ºC (mean ± SE) and winter temperatures of 15.6±1.5ºC. The
relative humidity ranged from 41% to 100% (mean=78.5%) in the summer
months (December 2006 to February 2007), and 30% to 100%
(mean=77.6%) in the winter months (June 2007 to August 2007).
Approximately 100 crofton weed seedlings were grown from stored
achenes, sown in August 2006, into 5-litre plant bags filled with potting
soil. Seeds were sown just below soil surface and were not given any
germination pre-treatment. Seedlings started to emerge after seven days
and continued for a further 21 days. In January 2007 the approximately
50cm tall plants were cut back to soil level, to promote new stem and leaf
growth. Plants were well watered once a day for half an hour, in the
morning, and fertilized once a month with Nitrosol (N 8%: P 2%: K 5.8%).
At the end of March 2007, 15 plants were randomly allocated to each of
the following six treatments:
(i) no biocontrol agents (control);
(ii) plants infected with the fungal pathogen P. ageratinae only
(hereafter referred to as pathogen-only);
(iii) plants exposed to one release of P. utilis (hereafter referred to
as single-galled);
(iv) plants exposed to two releases of P. utilis (hereafter referred to
as double-galled);
(v) plants infected with P. ageratinae and exposed to one release of
P. utilis (hereafter referred to as pathogen-single galled);

2 - 8
(vi) plants infected with P. ageratinae and exposed to two releases
of P. utilis (hereafter referred to as pathogen-double galled).
In order to restrict the spread of the pathogen between the treatments,
plants in the non-pathogen treatments were sprayed with a broad-
spectrum fungicide, AMISTAR ®. A mechanical pressurized sprayer was
calibrated to a spray volume of 60-litre/ha; AMISTAR was sprayed at
500ml/ha every four weeks. Plants that were infected with the pathogen
were sprayed with the same volume of water.
A control trial was run, from March 2007 to November 2007, to measure
any stimulatory or inhibitory influence AMISTAR may have had on A.
adenophora growth. Thirty plants were grown concurrently in the
greenhouse, under the same conditions as the laboratory trial plants.
Fifteen of these plants were sprayed with the fungicide AMISTAR, as
above, and the other fifteen plants were sprayed with water as above.
In order to prevent P. utilis ovipositing on non-fly treatment plants, the
plants of all treatments were placed in separate cages. The cages were
1m tall x 1.2m x 0.9m frames of conduit piping, covered in fine white
netting.
The trial A. adenophora plants in the pathogen treatments were infected
with the pathogen by tying fresh infected leaves, from the stock culture,
onto their stems in mid-April 2007. Plants from all treatments were then
covered with plastic bags, to create a dew period of 24 hours (Wang et al.,
1997). The first fungal leaf spots appeared in late May 2007, and
continued to naturally infect new leaf growth under greenhouse conditions.
Pathogen infection occurred before stems were galled in these trials.
However, up to 95% of crofton weed stems are infected with the pathogen
from an early stage in the field, therefore in the field stems are infected
with the pathogen before galling occurs (L. Buccellato, unpublished data).
The first flies were released onto plants at the beginning of June 2007.
One pair of flies was released per plant into the cages of the double galled
treatments (treatments iv and vi). Single galled treatment plants were not

2 - 9
exposed to flies in the initial release as there were insufficient flies to infest
these plants. Flies emerged from galls 10 weeks later and were collected,
for 3 weeks, in order to stop the emerging flies from further ovipositing on
the treatment plants. The second release of flies took place in September
2007. One pair of flies was released per plant onto all four of the single
and double galled treatments (treatments iii–vi).
Due to the large number of stems per plant (approximately 15 to 20
stems), four stems were randomly selected per plant for measurements of
vegetative growth. Pre-treatment and then monthly post-treatment
measurements per trial plant included stem height, number of sideshoots,
number of living leaves, number of dead leaves attached to the stem and
number of abscised leaves, from January 2007 to November 2007. The
dry biomass of the roots of the whole plants were weighed, however there
was no significant interaction or effect and the results have not been
included. Prior to the first fly release, oviposition sites (apical leaf buds)
were marked, with a piece of sewing thread, on all the stems in order to
measure the growth of the stem above the point of oviposition, and the
internode length below and above the oviposition site. Oviposition site
therefore refers to the position of these apical leaf buds, on all of the stems
of the six treatments, at the time of the first fly release. Oviposition sites
were not marked for the second fly release as the stems were flowering
and no apical leaf buds were present. Monthly assessments also included
the number of leaves per stem infected with the pathogen. Gall
measurements included gall length and diameter (at the longest/broadest
point respectively); which were used to calculate a gall size index (gall
diameter x gall length, as calculated by Bennett (1986)). The number of
emergence holes was counted 10 weeks after flies were released, and
used as an index of the number of adult flies successfully emerging from
galls.

2 - 10
2.3.2 Data analysis
Student t-tests were used to assess differences in gall indices between the
first generation of flies on the double-galled and pathogen-double galled
stems during the first P. utilis release in June 2007. One-way ANOVA’s
were used to assess differences in gall indices between the galled
treatment stems after the second P. utilis release in September 2007. The
influence of the biocontrol agents on the vegetative growth of crofton weed
over the trial period was assessed using repeated measures ANOVA with
nesting (stems nested within plants) (GLM procedure, StatSoft, 2007).
One-way ANOVA with nesting and LSD tests were used to assess
differences in stem measurements between treatments for each month.
Two-way ANOVA’s were also used to determine significant interactions
between single galled and pathogen infection, and double galled and
pathogen infection.
2.4 Results
2.4.1 Impact of AMISTAR ® on Ageratina adenophora growth
The fungicide, AMISTAR, caused no significant impact on stem height
(F1,89=0.51, P=0.482), percentage of live leaves (F1,89=2.64, P=0.108) and
the number of sideshoots (F1,89=0.04, P=0.836) relative to untreated plants
during the laboratory trials.
2.4.2 Agent establishment and infection severity
The pathogen did not infect more than 40% of living leaves per stem at
any time during the six months of the experiment (Fig. 2.1). A repeated
measures ANOVA showed a significant difference between the treatments
(F5,103=405.04, P<0.001). At the end of the trial there was no significant
interaction between single galled and pathogen infection (F1,132=1.66,
P=0.199). However, in July (F1,132=7.25, P=0.008), August (F1,132=5.03,
P=0.027) and September (F1,132=3.76, P=0.044) there was a significant
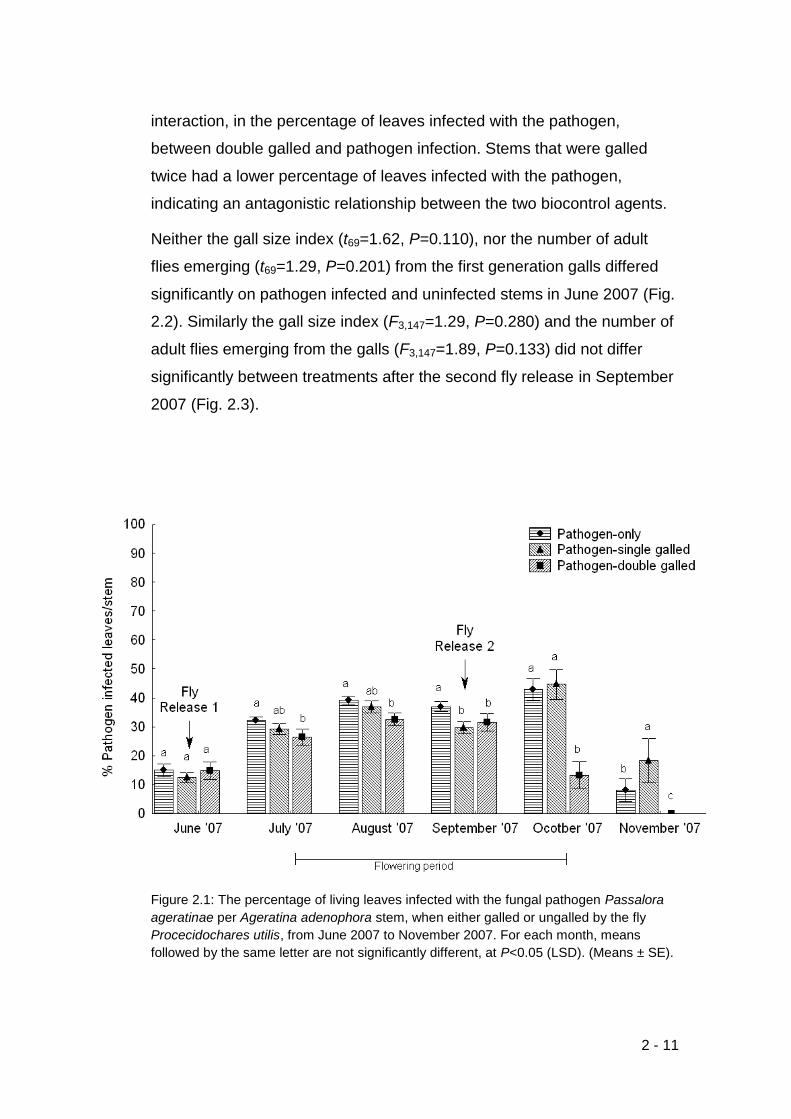
2 - 11
interaction, in the percentage of leaves infected with the pathogen,
between double galled and pathogen infection. Stems that were galled
twice had a lower percentage of leaves infected with the pathogen,
indicating an antagonistic relationship between the two biocontrol agents.
Neither the gall size index (t69=1.62, P=0.110), nor the number of adult
flies emerging (t69=1.29, P=0.201) from the first generation galls differed
significantly on pathogen infected and uninfected stems in June 2007 (Fig.
2.2). Similarly the gall size index (F3,147=1.29, P=0.280) and the number of
adult flies emerging from the galls (F3,147=1.89, P=0.133) did not differ
significantly between treatments after the second fly release in September
2007 (Fig. 2.3).
Figure 2.1: The percentage of living leaves infected with the fungal pathogen Passalora
ageratinae per Ageratina adenophora stem, when either galled or ungalled by the fly
Procecidochares utilis, from June 2007 to November 2007. For each month, means
followed by the same letter are not significantly different, at P<0.05 (LSD). (Means ± SE).

2 - 12
Figure 2.2: Gall size index (gall diameter x length) of the first generation of
Procecidochares utilis on Ageratina adenophora double galled treatment stems infected
and uninfected with the fungal pathogen Passalora ageratinae. The number of first
generation P. utilis adults (represented by the number of emergence holes) emerging
from galls on double galled stems infected and uninfected with the pathogen; from the
first release of P. utilis in June 2007. Means followed by the same letter are not
significantly different, at P<0.05 (t-test). (Mean; Box: Mean ± SE; Whisker: Mean ±
1.96*SE).
Figure 2.3: Gall size index (gall diameter x length) of the first generation (single galled
stems) and the second generation (double galled stems) of Procecidochares utilis on
Ageratina adenophora stems infected and uninfected with the fungal pathogen Passalora
ageratinae. The number of P. utilis adults (represented by the number of emergence
holes) emerging from the first generation galls (single galled stems) and the second
generation galls (double galled stems) on pathogen infected and uninfected stems; from
the second release of P. utilis in September 2007. Means followed by the same letter are
not significantly different, at P<0.05 (LSD). (Means ± SE).

2 - 13
2.4.3 Stem height
Over the duration of the trial there was a general trend for stem height to
increase into the flowering period, thereafter it decreased in all treatments
when the flower stalks were shed, there was also a significant difference
between the treatments (F5,103=2.69, P=0.025) (Fig. 2.4). Within two
months of the initial fly release, growth in stem height slowed on double-
galled and pathogen-double galled plants (F5,103=4.16, P=0.002). The
pathogen alone suppressed stem growth from September onwards. At the
end of the trial, both of the biocontrol agents, individually and in
combination, had significantly inhibited stem height (F5,103=4.92, P<0.001).
The control stems were the tallest in November 2007, having resumed
vertical growth after the flowering period. Stems that had been galled
twice, with or without the pathogen, were significantly the shortest. There
was no significant interaction between one fly release and pathogen
infection (F1,132=0.05, P=0.818) or two fly releases and pathogen infection
(F1,132=1.35, P=0.247) on stem height. In terms of stem height, there was
an equivalent interaction between the agents, with the fly causing the
greatest damage.
2.4.4 Stem growth above the oviposition site
Monthly stem growth above the oviposition site differed significantly over
the trial period (F5,103=23.85, P<0.001) (Fig. 2.5). Double galling clearly
suppressed growth above the oviposition site. By November the control
and pathogen-only treatment stems had a significantly greater growth
above the oviposition site compared to the double galled treatments
(F5,103=4.29, P<0.001). Double galling halted growth above the oviposition
site after flowering. There was no significant interaction between the
pathogen and single galled treatments (F1,132=0.09, P=0.755). However,
the pathogen and double galled treatments showed a significant
interaction in July (F1,132=4.76, P=0.031). Stems that had been galled and
infected with the pathogen had a slower growth above the oviposition site.

2 - 14
The interaction between the fly and pathogen is equivalent, and as with
stem height the fly caused the greatest damage.
2.4.5 Internode length above oviposition site
Reduced stem growth was also seen in shorter internode lengths above
the oviposition site of the double-galled (mean±SE = 22.9 ± 3.34mm) and
pathogen-double galled (25.8 ± 3.26 mm) treatments. In comparison, the
control (57.98 ± 2.91 mm), pathogen-only (55.05 ± 2.63 mm), single-
galled (44.65 ± 4.94 mm) and pathogen-single galled (45.25 ± 4.77 mm)
treatments had much longer internodes (F5,103=7.15, P<0.001).
Figure 2.4: Height of Ageratina adenophora stems in response to six different treatment
conditions, of pathogen infection and/or fly galling (single or double), from June 2007 to
November 2007. For each month, means followed by the same letter are not significantly
different, at P<0.05 (LSD). (Means ± SE).

2 - 15
Figure 2.5: Monthly growth of Ageratina adenophora stems above the oviposition site, in
response to six different treatment conditions, of pathogen infection and/or fly galling
(single or double), after the first fly release in June 2007 until November 2007. For each
month, means followed by the same letter are not significantly different, at P<0.05 (LSD).
(Means ± SE).
2.4.6 Percentage of live leaves per stem
Overall there was a general decrease in live leaves per stem in all
treatments; however this decrease became significantly different from the
control stems over time (F5,103=16.91, P<0.001) (Fig. 2.6). The agent-
infected stems had significantly fewer leaves than the control in August
(F5,103=12.99, P<0.001), September (F5,103=9.72, P<0.001), October
(F5,103=25.99, P<0.001) and November (F5,103=5.02, P<0.001). In
November there was no significant interaction between the pathogen and
single galled (F1,132=0.42, P=0.519), but there was a significant interaction
between the pathogen and double galled (F1,132=5.81, P=0.017). Stems
that were infected with the pathogen and double galled had fewer live

2 - 16
leaves, than stems that were double galled or infected with the pathogen
only, resulting in an additive interaction between the two biocontrol agents.
Figure 2.6: Percentage of living leaves on Ageratina adenophora stems in response to six
different treatment conditions, of pathogen infection and/or fly galling (single or double),
from June 2007 to November 2007. For each month, means followed by the same letter
are not significantly different, at P<0.05 (LSD). (Means ± SE).
2.4.7 Number of sideshoots per stem
The number of sideshoots per stem differed significantly between
treatments by the end of the trial (F5,61=5.1, P<0.001) (Fig. 2.7). Sideshoot
growth was promoted on galled stems without the pathogen present.
There was no significant interaction between the pathogen and single
galled (F1,132=0.22, P=0.102), but there was between the pathogen and
double galled (F1,132=4.06, P=0.045). Stems that were galled twice and
infected with the pathogen had fewer sideshoots than stems that were
galled twice without pathogen infection. Once again there is an equivalent

2 - 17
interaction between the two agents; however in contrast to stem growth
the pathogen caused the greatest damage.
Figure 2.7: The number of sideshoots on Ageratina adenophora stems in response to six
different treatment conditions, of pathogen infection and/or fly galling (single or double),
at the end of November 2007. Means followed by the same letter are not significantly
different, at P<0.05 (LSD). (Means ± SE).
2.5 Discussion
Two models have been proposed to explain the higher success rate of
weed biocontrol projects with multiple agents in comparison to those with
single agents. The lottery model predicts that only one agent is
responsible for the control of the weed, and that the release of multiple
agents increases the chance that this ‘right’ agent will be released (Myers,
1985, 2008; McEvoy & Coombs, 2000). The cumulative stress model
proposes that all the agents are needed to achieve successful control
(Harris, 1985). In this model the agents interact synergistically, increasing
the stress on the plant and thereby increasing the efficacy of biocontrol on
the target weed (Hoffmann & Moran, 1998; Stiling & Cornelissen, 2005;

2 - 18
Campanella et al., 2009; Rayamajhi et al., 2010; Turner et al., 2010). The
interaction between the agents may be synergistic, additive, equivalent or
inhibitory (Hatcher, 1995; Turner et al., 2010). The present study revealed
that whilst the gall fly, P. utilis, is predominantly responsible for the
greatest control of the vegetative growth of crofton weed, A. adenophora,
the pathogen, P. ageratinae plays the predominant role in reducing
vegetative reproduction (sideshoot growth). Combining the impacts of the
two agents acting together on different plant variables leads to an overall
additive effect on the damage caused to crofton weed. This study also
shows that the impact of biocontrol agents can differ, depending on what
is measured, such as stem height, at different points in the phenology of
the weed.
The use of multiple agents in the cumulative model is based on the
hypothesis that if the agents utilize different parts of the plant, there should
be little negative interaction between them in terms of establishment and
survival on the target weed (Denoth et al., 2002). However, although the
gall flies attack the apical meristem while the pathogen infects the lower
leaves of crofton weed in this system, they may still influence the
establishment of each other in terms of the severity of each agent’s impact
on the plant.
Double galled plants had the lowest percentage of leaves infected with the
pathogen, suggesting an antagonistic relationship between the fly and
pathogen infection of leaves. It is possible if the gall is acting as a nutrient
sink, that it reduces the health of the lower leaves (Florentine et al., 2005;
Dorchin et al., 2006; Moseley et al., 2009), making them less likely to
become infected. However, the severity of pathogen infection was
generally low even on ungalled plants, and field observations indicate that
the pathogen only infects up to 30% of live leaves per stem at sites where
only the pathogen is present (L. Buccellato, unpublished data). Even when
leaf loss was high after the flowering period, the pathogen infected a small
percentage of the remaining live leaves. Field observations in New
Zealand and greenhouse trials in Australia have shown that the pathogen
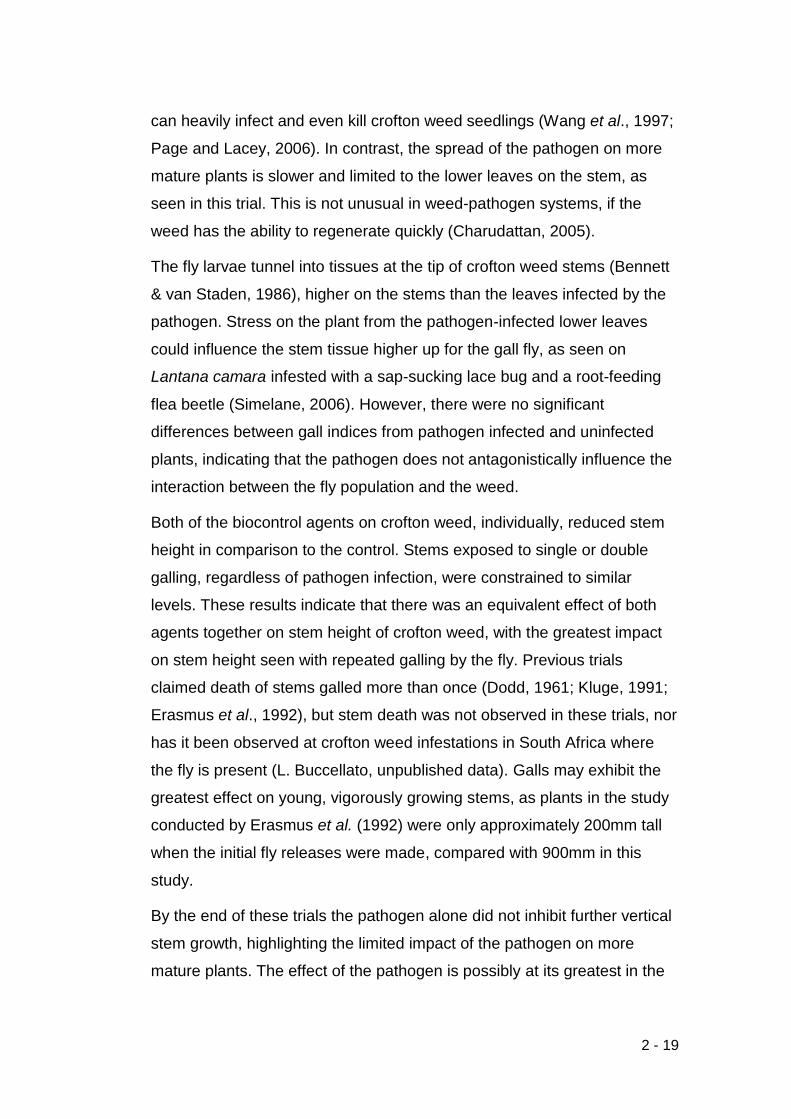
2 - 19
can heavily infect and even kill crofton weed seedlings (Wang et al., 1997;
Page and Lacey, 2006). In contrast, the spread of the pathogen on more
mature plants is slower and limited to the lower leaves on the stem, as
seen in this trial. This is not unusual in weed-pathogen systems, if the
weed has the ability to regenerate quickly (Charudattan, 2005).
The fly larvae tunnel into tissues at the tip of crofton weed stems (Bennett
& van Staden, 1986), higher on the stems than the leaves infected by the
pathogen. Stress on the plant from the pathogen-infected lower leaves
could influence the stem tissue higher up for the gall fly, as seen on
Lantana camara infested with a sap-sucking lace bug and a root-feeding
flea beetle (Simelane, 2006). However, there were no significant
differences between gall indices from pathogen infected and uninfected
plants, indicating that the pathogen does not antagonistically influence the
interaction between the fly population and the weed.
Both of the biocontrol agents on crofton weed, individually, reduced stem
height in comparison to the control. Stems exposed to single or double
galling, regardless of pathogen infection, were constrained to similar
levels. These results indicate that there was an equivalent effect of both
agents together on stem height of crofton weed, with the greatest impact
on stem height seen with repeated galling by the fly. Previous trials
claimed death of stems galled more than once (Dodd, 1961; Kluge, 1991;
Erasmus et al., 1992), but stem death was not observed in these trials, nor
has it been observed at crofton weed infestations in South Africa where
the fly is present (L. Buccellato, unpublished data). Galls may exhibit the
greatest effect on young, vigorously growing stems, as plants in the study
conducted by Erasmus et al. (1992) were only approximately 200mm tall
when the initial fly releases were made, compared with 900mm in this
study.
By the end of these trials the pathogen alone did not inhibit further vertical
stem growth, highlighting the limited impact of the pathogen on more
mature plants. The effect of the pathogen is possibly at its greatest in the

2 - 20
early stages of infection and on younger plants, thereby killing seedlings,
but not influencing adult plant growth over a longer period. It is possible for
weeds to overcome the pressure of disease infection from pathogens by
rapidly increasing vegetative (compensatory) growth (Charudattan, 2005,
2010). Crofton weed may initially be affected by the pathogen infection,
but is able to outgrow the disease if it survives through the seedling stage.
Galls are known to act as nutrient sinks by redirecting plant resources to
the galls, causing an imbalance in source-sink tissues of the weed
(Florentine et al., 2005; Dorchin et al., 2006; Moseley et al., 2009). The
reduction in stem growth and the shorter internode lengths above the
oviposition site may indicate that P. utilis galls act as nutrient sinks, with
the weed supplying nutrients to tissues within the galls for larval feeding
(Bennett & van Staden, 1986; Erasmus et al., 1992). The larvae of the fly
tunnel into the apical and differentiating tissues of the stem, thereby
slowing vertical stem growth (Bennett & van Staden, 1986). The control
stems increased their vertical growth after flowering, whereas the double
galled stems halted any vertical growth after flowering. These results
indicate once again an equivalent interaction, where repeated galling has
the largest impact on growth of the stem, regardless of pathogen infection.
The percentage of live leaves decreased more quickly on stems attacked
by the biocontrol agents, both individually and together, relative to the
control stems, which also lost their leaves naturally. There was an additive
interaction at the end of the flowering period (October 2007), where
pathogen-double galled stems had fewer live leaves than the double-
galled and pathogen-only stems. Plants may compensate for pathogen
infection by shedding diseased leaves more quickly, so that new leaf
growth is uninfected (Charudattan, 2005, 2010). An example is the ability
of water hyacinth, Eichhornia crassipes (Martius) Solms-Laubach
(Pontederiaceae), to accelerate senescence of leaves infected with the
pathogen, Cercospora rodmanii Conway (Hyphomycetes), so that new
leaves may grow unaffected (Charudattan et al., 1985). Therefore, this

2 - 21
impact on crofton weed may not have a long term control effect, as leaf
loss is not sufficient to completely defoliate stems in a short span of time.
Tall A. adenophora stems eventually bend over and trail along the soil,
where the sideshoots can then root and subsequently grow into new
plants (Muniappan et al., 2009). Stems that were only galled, without
pathogen infections, produced a higher number of sideshoots than the
control or pathogen-only treatments. The loss of apical dominance as a
result of galling promotes the growth of sideshoots (Erasmus et al., 1992).
However, the presence of the pathogen inhibits the number of sideshoots
produced by the stems on galled plants, resulting in an equivalent
interaction between the agents, with the pathogen causing the greatest
damage.
This study highlights that measuring the effects of multiple agents on the
biocontrol of a target weed may not always be straightforward. In order to
accurately assess the impact of the interaction between biocontrol agents,
consideration needs to be given to what plant parameters are measured,
and when these measurements are taken in terms of the plant’s life-cycle.
For example, if sideshoot growth was not measured, or if monthly
measurements had not been taken, the conclusion about the efficacy of
the agents in combination would be different. The study was conducted
under controlled greenhouse conditions, which could under- or
overestimate the impacts of the agents, as these optimum conditions are
not always representative of conditions in the field (Morin et al., 2006,
2009). The efficacy of the agents may differ during different times of the
year and at different crofton weed infestations across South Africa. In
Hawaii the fly is less successful in high rainfall areas (Bess & Haramoto,
1959, 1972), and in Australia the pathogen is more successful during the
drier months of the year (Dodd, 1961).

2 - 22
2.6 Conclusion
There is an overall additive effect of the two agents together increasing the
stress on A. adenophora. Repeated galling by the fly is responsible for the
greatest impact on the stem growth of crofton weed. There was an additive
effect of the two agents together on the percentage of live leaves per stem
after the flowering period; however this is only a short-term effect as
crofton weed eventually loses its leaves naturally. The pathogen inhibits
sideshoot growth, which is promoted by galling. Therefore, the sum of the
impacts of both the fly and pathogen, on reduced stem growth and limited
sideshoot growth, suggests the two agents together have an overall
additive effect on crofton weed biocontrol. Based on this laboratory trial,
we should expect to observe some control of crofton weed in the field.
Hence a study of the two agents in the field has been undertaken. The
results presented here indicate that in terms of assessing biocontrol agent
efficacy, the interactions between agents may not always be clear and
may depend on what plant growth parameters are measured and when
these measurements are taken.

Chapter 3: Can laboratory trials testing
agent efficacy be extrapolated to field
conditions? A test case using multiple
agents in the biocontrol of crofton weed.

3 - 2
3.1 Abstract
Two biocontrol agents, a leaf-spot pathogen, Passalora ageratinae, and a
stem gall fly, Procecidochares utilis, have been released against crofton
weed, Ageratina adenophora, in South Africa. An earlier controlled
greenhouse trial using both the fungal pathogen and the gall fly,
individually and in combination, predicted an additive interaction between
the two biocontrol agents on the control of crofton weed. With galling
reducing stem height and growth, and the pathogen reducing sideshoot
growth. This study investigated whether the pathogen and fly work in
combination to control the vegetative growth of crofton weed, under field
conditions, in South Africa, as predicted by greenhouse studies. The field
trial was conducted at a site in the Magaliesberg. Four month old stems
were exposed to one of the following three treatments
(n=20plants/treatment): pathogen-only, pathogen-single galled and
pathogen-double galled, for a period of 11 months. The percentage of
leaves on stems infected with the pathogen ranged from 10% to 80%
through the trial period, with no significant difference in infection between
galled and ungalled stems. Small galls developed during the flowering
period, as a result of more galls developing in leaf nodes compared to
apical leaf buds. Growth above the oviposition site was slower on galled
stems; however there was no significant effect of any treatment on overall
stem height. Crofton weed compensated for repeated galling with
increased sideshoot (vegetative reproduction) growth. Overall, the total
biomass of the treatment stems did not differ, but more biomass was
allocated to sideshoots, in comparison to leaves and bare stems, on galled
stems. The interaction between the agents did not lead to cumulative
control of crofton weed growth. However, the fly may reduce stem vigour
over a longer time period, and the pathogen may reduce the
compensatory effect of increased sideshoot growth. This study showed
that greenhouse trials are not always predictive of field conditions, as the
interaction between the biocontrol agents in the field was not an additive
interaction as predicted by greenhouse trials.

3 - 3
3.2 Introduction
Classical biocontrol of invasive alien plants involves the deliberate
introduction of biocontrol agents, such as insects and pathogens, to
negatively influence the invasive plant’s growth parameters and population
dynamics (McFadyen, 1998; Zimmermann et al., 2004, Morin et al., 2006).
Over the years, more than one biocontrol agent has often been released
onto a specific target weed, based on the theory that the combined effects
of multiple biocontrol agents will increase control of the weed (Myers,
1985, 2008; Julien & Griffiths, 1998; Denoth et al., 2002; Stiling &
Cornelissen, 2005). Of these, synergistic relationships between insects
and pathogens are considered responsible for the first successes in
biocontrol of Opuntia stricta (Caesar, 2000, 2003).
There is an increasing call to not release ineffective agents (Raghu et al.,
2006), therefore the effectiveness of biocontrol agents is often first
assessed under controlled conditions in laboratory or greenhouse studies
(Morin et al., 2009). However, under such controlled conditions the impact
of the agents can be under- or overestimated, as these are not always
representative of conditions in the field (Rosskopf et al., 1999; Morin et al.,
2006, 2009). For example, the Eucalyptus weevil, Gonipterus “scutellatus”
Gyllenhal (Curculionidae), was found to be more selective in feeding and
oviposition behaviour on Eucalyptus species in the field in comparison to
laboratory trials. This has implications for the realised host range of the
weevil in comparison to the predicted host range. There is also the need
for biocontrol research to move beyond the initial host-specificity and
greenhouse trials research stage into field and post-release evaluation
studies (Raghu et al., 2006; Morin et al., 2009). This work examined the
impact of two biocontrol agents in the field, released against Ageratina
adenophora, following greenhouse trials of the efficacy of these two
biocontrol agents.
Originating from Mexico, Ageratina adenophora, (Sprengel) King and
Robinson (syn. Eupatorium adenophorum Spreng.) (Asteraceae), also

3 - 4
known as crofton weed or the Mexican Devil is an invasive weed in several
countries worldwide, including South Africa, Australia, New Zealand,
Hawaii, India and China (Julien & Griffiths, 1998). Crofton weed is a
perennial herb, with a woody rootstock, and many stems reaching up to
2m in height (Bess & Haramoto, 1959; Henderson, 2001; Page & Lacey
2006). Trailing crofton weed stems root when in contact with the soil,
resulting in dense infestations (Bess & Haramoto, 1959; Morris, 1991).
Crofton weed invades steep slopes and wet areas along streams,
roadsides, forests and plantations (Dodd, 1961; Henderson, 2001;
Trounce, 2003; Page & Lacey, 2006). Conservation areas are adversely
affected by this weed, as it is allelopathic, alters soil microbial communities
and displaces natural vegetation (Erasmus et al., 1992; Henderson, 2001;
Niu et al., 2007). Crofton weed also reduces crop yield, the carrying
capacity of grazing land, is unpalatable to cattle and causes a fatal lung
disease in horses (Plant Protection News, 1988; Land Protection, 2001;
Page & Lacey, 2006).
In 1984 a small, opportunistic biocontrol programme for the control of
crofton weed was initiated in South Africa (Plant Protection News, 1987a;
Kluge, 1991). Two biocontrol agents, a stem gall fly, Procecidochares utilis
Stone (Tephritidae), and a leaf-spot pathogen, Passalora ageratinae
Crous and A.R. Wood (Mycosphaerellaceae) (previously named
Cercospora eupatorii Peck or Phaeoramularia sp.) (Crous et al., 2009),
have been released in South Africa (Kluge, 1991). The biology and impact
of the fly have been described by Haseler (1965) and Bennett (1986) and
the pathogen has been described by Morris (1989), Wang et al. (1997)
and Crous et al. (2009). Heystek et al. (2011) reviews the crofton weed
biocontrol programme in South Africa to date.
A controlled greenhouse trial using both the fungal pathogen and the gall
fly, individually and in combination, showed that the fly reduced plant
height and growth of crofton weed, in particular, repeated galling by the fly
was the most effective (Chapter 2). The pathogen reduced the number of
sideshoots, representing vegetative reproduction of crofton weed, which

3 - 5
was promoted by galling (Chapter 2). The combined effects of the
interaction between the two agents led to additive control of crofton weed.
In South Africa, recent anecdotal field observations suggested that neither
the fly nor fungal pathogen are successfully controlling crofton weed
(Heystek et al., 2011), however the impact of the two agents has not been
formally assessed in the field in South Africa. The aim of this study,
therefore, was to evaluate whether the pathogen and fly in combination
control the vegetative growth of crofton weed, under field conditions, in
South Africa, as predicted by the greenhouse studies.
3.3 Material and methods
3.3.1 Field site
The field trial was run on the 150ha Kloofwaters farm (1380m ASL), in the
Magaliesberg, North West Province, South Africa (25˚49’45.1”S,
27˚26’26.0”E). The farm is privately owned, and predominantly used for
school camps; however a low stocking level of cattle is present. The field
site was located within A. adenophora infestations along a flat stream
embankment, facing eastwards. Plants were in full sunshine, with late
afternoon shading and only the fungal pathogen, P. ageratinae, was
present. The field site is on Moot Plains Bushveld (central bushveld,
Savanna Biome), with thorny savanna, dominated by Acacia species and
woodlands (Mucina et al., 2006a; Rutherford et al., 2006). The
Magaliesberg experience summer rainfall and very dry winters with frost
(Mucina et al., 2006a). In winter, temperatures at the field site ranged from
2.6ºC to 18.3ºC (mean = 9.9ºC), and from 14.0ºC to 29.5ºC (mean =
20.5ºC) during summer. The mean relative humidity was 55% (min =
10.2%, max = 100%) during the winter months (June 2007 to August
2007) and 87.5% (min = 45.0%, max = 100%) during the summer months
(December 2007 to February 2008).

3 - 6
3.3.2 Field trials
In February 2007 all crofton weed plants within a 50m2 area within the field
site were cut back to soil level and labelled. Plants were cut back to
promote growth of new stems from the woody rootstock.
The fungicide, AMISTAR ®, used in greenhouse trials to restrict P.
ageratinae infection, resulted in phytotoxic symptoms (chlorotic spots) on
crofton weed seedling leaves. Therefore, it was not possible to chemically
exclude the pathogen from the new stems, as they had already been
infected when they were at the seedling stage from surrounding plants.
Fungal leaf spots were visible on new stems by April 2007.
In June 2007, 20 plants were randomly allocated to each of the following
three treatments:
(i) plants infected with the fungal pathogen, P. ageratinae
(pathogen-only);
(ii) plants infected with the fungal pathogen, P. ageratinae, and
exposed to one release of the fly, P. utilis (hereafter referred to
as pathogen-single galled);
(iii) plants infected with the fungal pathogen, P. ageratinae, and
exposed to two releases of the fly, P. utilis (hereafter referred to
as pathogen-double galled).
Cages were used to restrict flies from ovipositing on non-galled treatment
plants. The cages were constructed from fine white netting, attached to a
1m central pole with a steel ring at the top, and pegged into the soil. All
plants in all treatments were covered with cages. Cages were removed
two weeks after flies were released, as the average life span of adult flies
is 10 days. No galling on pathogen-only stems was observed during the
trial period.
Adult P. utilis were collected from a colony on galled plants at the
University of the Witwatersrand, Johannesburg, Gauteng (26˚11’20.97”S,
28˚01’55.37”E). The first release of flies was made in August 2007. One
pair of flies per plant was released into the cages with plants of the

3 - 7
pathogen-double galled treatment (treatment iii). Flies emerged from galls
12 weeks later (November 2007), and were collected weekly from the
cages with a pooter, over a five week period, to prevent further galling of
the treatment plants. In January 2008 one pair of flies per plant was
released onto the pathogen-single galled and pathogen-double galled
plants (treatments ii and iii).
Four stems per plant were randomly selected for measurements of
vegetative growth. Monthly measurements of stem height, number of
living, dead and abscised leaves per stem, and the number of sideshoots
per stem, were recorded from June 2007 to April 2008. The number of
leaves per stem infected with the pathogen was also recorded monthly. On
the day of the fly release the oviposition site (apical leaf bud) was marked
on all the treatment stems with a piece of sewing thread. Monthly
measurements of stem growth above this oviposition site were then taken
for all treatment stems. These measurements were only taken after the
second fly release, as stems were flowering during the first fly release and
no apical leaf buds were present. Gall length and diameter (at the longest
and broadest point respectively) were measured and used to calculate a
gall size index (Bennett, 1986). The number of emergence holes per gall
was used as an index of the number of adult flies successfully emerging
per gall. The position of galls was classified into two categories, stem or
side (galls formed on the leaf petiole or leaf node). At the end of the trial
the treatment stems were cut, collected and separated into bare stems,
live leaves, dead leaves and sideshoots. The bare stems, leaves and
sideshoots were then dried in a forced-draught oven for seven days at
60ºC and weighed. The total dry mass of the treatment stems was
calculated. In addition the allocation of biomass to live leaves, bare stems
and sideshoots per stem was calculated as a percentage of stem total
biomass.

3 - 8
3.3.3 Data analysis
Repeated measures ANOVA with nesting (stems nested within plants)
were used to assess the influence of the biocontrol agents on the
vegetative growth of crofton weed over the trial period (GLM procedure,
StatSoft, 2007). One-way ANOVA with nesting and LSD tests were used
to assess differences in stem measurements between treatments for each
month. One-way ANOVA’s were used to assess differences in the gall size
index and number of emergence holes per gall between the single and
double galling treatments. A Chi-squared 2x3 contingency table was used
to compare the association between stem death and treatments. Chi-
squared 2x2 contingency tables were used to compare the association
between the position of galls and the incidence of flowering. The
difference in biomass between the three treatments was assessed with a
one-way ANOVA with nesting.
3.4 Results
3.4.1 Stem death
Over the trial 15% of the pathogen-only stems died, while 6% of pathogen-
single galled stems died and 10% of pathogen-double galled stems died.
There was no significant association between stem death and treatment
(χ2=3.31, df=3, P=0.653).
3.4.2 Agent establishment and infection severity
The pathogen infected 10-40% of living leaves from June to October 2007
(Fig.3.1). The number of infected living leaves increased to 70-80% by
November 2007, and thereafter 50% of living leaves were infected with the
pathogen. There was no significant difference in the percentage of leaves
infected with the pathogen on galled and ungalled stems over the trial
period (F2,45=1.14, P=0.331).

3 - 9
Figure 3.1: Percentage of live leaves infected with the fungal pathogen Passalora
ageratinae per Ageratina adenophora stem, when either galled (single or double) or
ungalled by the fly Procecidochares utilis, from June 2007 to April 2008. For each month,
means followed by different letters are significantly different, at P<0.05 (LSD). (Means ±
SE).
The gall size index differed significantly between release 1 (August 2007)
and release 2 (January 2008) (F2,93=3.05, P=0.049) (Fig. 3.2a). Galls that
formed in August 2007, during the flowering period, were smaller than
galls formed in January 2008. There was an association between the
position of galls and flowering (Χ 2=4.09, df=1, P=0.043), with more galls
formed on stems, in comparison to the side of stems, when crofton weed
is not flowering. There was no significant difference between the sizes of
galls formed on stems for either the first or second time, in January 2008.
The number of adult flies emerging did not differ significantly between
release 1 and 2, or between single and double galled stems (F2,93=2.29,
P=0.106) (Fig. 3.2b).

3 - 10
(a)
(b)
Figure 3.2: (a) Gall size index (gall diameter x length) of Procecidochares utilis on
Ageratina adenophora stems infected with the fungal pathogen Passalora ageratinae,
and (b) the number of P. utilis adults (represented by the number of emergence holes)
emerging from galls on pathogen infected stems; from the release of P. utilis in August
2007 and January 2008. Means followed by different letters are significantly different, at
p<0.05 (LSD). (Means ± SE).

3 - 11
3.4.3 Stem height
The stem height under all the treatments increased until the flowering
period, but decreased after flowering, and thereafter increased again for
the remainder of the trial period (Fig. 3.3). A repeated measures ANOVA
showed no overall significant difference between the treatments
(F2,41=0.92, P=0.405). However, in September (F2,41=5.63, P=0.007) and
October (F2,41=6.41, P=0.004), the pathogen-double galled treatment
stems were significantly shorter than the pathogen-only and the pathogen-
single galled stems.
Figure 3.3: Height of Ageratina adenophora stems in response to three different
treatments, of pathogen infection with or without galling (single or double), from June
2007 to April 2008. For each month, means followed by different letters are significantly
different, at P<0.05 (LSD). (Means ± SE).
3.4.4 Stem growth above the oviposition site
Growth above the oviposition site differed significantly between the three
treatments after the second fly release in January 2008 (F2,41=4.69,

3 - 12
P=0.015) (Fig. 3.4). Pathogen-galled stems showed significantly less
growth above the oviposition site compared to pathogen-only stems.
Figure 3.4: Growth of Ageratina adenophora stems above the oviposition site, in
response to three different treatments, of pathogen infection with or without galling (single
or double), after the second fly release in January 2008 until April 2008. For each month,
means followed by different letters are significantly different, at P<0.05 (LSD). (Means ±
SE).
3.4.5 Percentage of live leaves per stem
The percentage of live leaves decreased until the end of the flowering
period, after which stems maintained 30-40% live leaves (Fig. 3.5). There
was no significant difference in the percentage of live leaves between the
treatments (F2,39=0.11, P=0.893).

3 - 13
Figure 3.5: Percentage of live leaves on Ageratina adenophora stems in response to
three different treatments, of pathogen infection with or without galling (single or double),
from June 2007 to April 2008. For each month, means followed by different letters are
significantly different, at P<0.05 (LSD). (Means ± SE).
3.4.6 Number of sideshoots per stem
At the end of the trial the number of sideshoots differed significantly
between treatments (F2,39=3.26, P=0.049) (Fig. 3.6). Repeated galling of
stems promoted sideshoot growth in comparison to pathogen-only stems.
Figure 3.6: Number of sideshoots on Ageratina adenophora stems in response to three
different treatments, of pathogen infection with or without galling (single or double), at the
end of April 2008. Means followed by different letters are significantly different, at P<0.05
(LSD). (Means ± SE).

3 - 14
3.4.7 Biomass
The galled stems allocated more biomass to sideshoots than pathogen-
only stems (F2,41=4.74, P=0.014) (Fig. 3.7). The pathogen-only stems had
a higher percentage of their biomass allocated to live leaves (F2,41=4.12,
P=0.024), and bare stems (F2,41=3.33, P=0.046) (Fig. 3.7). Although the
three treatments allocated their biomass to different areas of the stem
there was no significant difference in the total biomass of the stems
(F2,41=0.14, P=0.873) (Fig. 3.7).
Figure 3.7: The percentage biomass allocation of Ageratina adenophora stems to live
leaves, sideshoots and bare stems, and the total biomass (g) of stems in response to
three different treatment conditions, of pathogen infection with or without galling, at the
end of April 2008. Means followed by different letters are significantly different, at P<0.05
(LSD). (Means ± SE).

3 - 15
3.5 Discussion
Two models have been proposed to explain the higher success rate of
biocontrol projects with multiple agents in comparison with single agents.
The lottery model predicts that only one agent is responsible for the control
of the weed (Myers, 1985, 2008; McEvoy & Coombs, 2000), and the
cumulative stress model proposes that more than one of the released
agents contribute to successful control of the target weed (Harris, 1985;
Hoffmann & Moran, 1998; Stiling & Cornelissen, 2005; Campanella et al.,
2009; Rayamajhi et al., 2010; Turner et al., 2010). This study revealed that
there is no overall cumulative effect of both the pathogen and gall fly in
combination on the control of crofton weed vegetative growth parameters,
in contrast to predictions from greenhouse trials.
In this insect-pathogen system the agents partition the resources of crofton
weed plants in space by the fly galling the shoot tips, and the pathogen
infecting the lower leaves. These results show that in the field, galling does
not influence the severity of pathogen infection of crofton weed. The
percentage of pathogen infected leaves peaked at 80%, when leaf loss
was high after flowering, and thereafter only half the leaves were infected
at a time. Death of seedlings and severe or complete defoliation of
pathogen infected stems was seen in Australia (Wang et al., 1997; Page &
Lacey, 2006). While death of seedlings was observed in the field, most
stems were able to limit pathogen infection to leaves on the lower half of
the stem.
Flowering stems have fewer apical leaf buds or oviposition sites available
(Bennett, 1986), therefore smaller galls develop in the leaf nodes. In the
greenhouse trials there was no significant difference between the gall size
index or the number of adult flies emerging from galls on pathogen
infected or uninfected stems (Chapter 2). As the pathogen could not be
excluded from stems in the field, it was not possible to account for
antagonism or synergism between the pathogen and fly establishment.
However, galls in the field were significantly larger in size (1.54±0.12,

3 - 16
mean ± SE) compared to those observed in the greenhouse (1.16±0.06)
(t-test, t364=2.47, P<0.001).
In greenhouse trials stem height was shortest when crofton weed was
galled more than once (Erasmus et al., 1992; Chapter 2). However, in
these field trials galls did not significantly affect stem height. The
greenhouse trials suggest that galls should have a large impact on
younger, shorter crofton weed plants (Erasmus et al., 1992). This was not
seen in the field, even though the field plants were shorter than the
greenhouse plants. Regrowth of stems after having been cut back was not
as vigorous in the field as under more favourable growing conditions in a
greenhouse. Stems grew slower in the field (250mm stem height
increment in 5 months) than in the greenhouse (900mm stem height in 6
months), after being cut down to the root stock.
The pathogen with single or double galling slowed stem growth above the
oviposition site, in comparison to pathogen-only stems. Weeds are often
able to compensate for the pressure of diseased leaves by increasing
vegetative growth (Charudattan, 2005, 2010). The slowed growth above
the oviposition site highlights the ability of the fly galls to potentially act as
nutrient sinks, as seen in other systems (Florentine et al., 2005; Dorchin et
al., 2006; Moseley et al., 2009).
All treatment stems maintained approximately 30% of their living leaves.
The pathogen alone, and the combination of pathogen and galling, was
not sufficient to completely defoliate crofton weed as has been seen in
Australia (Dodd, 1961). As crofton weed naturally sheds its lower leaves,
this impact may not be sufficient to control crofton weed.
Tall A. adenophora stems eventually bend over and trail along the soil,
where the sideshoots can then root and eventually grow into new plants
(Muniappan et al., 2009). As galling influences apical dominance, as seen
with growth above the oviposition site, crofton weed compensates by
producing more sideshoots (Erasmus et al., 1992; Chapter 2). Pathogen-
only stems had significantly less sideshoots. In the greenhouse the

3 - 17
pathogen was able to reduce the number of sideshoots produced, in
comparison to stems that were only galled. Considering only the sideshoot
growth there is an antagonistic effect between these biocontrol agents on
the control of crofton weed, however we do not know what sideshoot
growth would be like on galled stems, without pathogen-infection, in the
field.
There was no cumulative effect of both biocontrol agents on the total
biomass of crofton weed stems. Stems infected only with the fungal
pathogen had less biomass allocated to sideshoots, however galling
allocated less biomass to the bare stems and live leaves of stems. The
lower bare stem biomass in galled stems indicates that although galled
plants have similar heights to pathogen-only stems, the galled stems may
be weaker and thinner than the pathogen-only stems. Therefore, the fly
may be effective over a longer time period if growth above the oviposition
site is weak. Stems galled in Hawaii were weaker and thinner than
ungalled stems (Bess & Haramoto, 1959, 1972). In addition a smaller
biomass being allocated to live leaves on galled stems supports the
hypothesis that P. utilis galls may act as nutrient sinks, removing
assimilates and nutrients from the leaves to provide nutrition for the fly
larvae developing within the galls (Harris & Shorthouse, 1996).
Morin et al. (2009) reviews how field trials in the introduced range are
necessary to understand the response of the agents to the new
environmental conditions, as well as the response of the weed to the
agents. Research and funding is focused on the initial host-specificity
stages of a biocontrol programme, however it is necessary to continue
research into the field to fully understand the dynamics of a biocontrol
programme (Briese, 2006; Raghu et al., 2006; Morin et al., 2009). Factors
which may affect the success or failure of biocontrol agents include
parasitism (King et al., 2011), climate (Zachariades et al., 2011) and
acquired natural enemies (Muniappan & McFadyen, 2005); which are not
always present in the controlled conditions of greenhouse trials.

3 - 18
Based on this comparison of results the greenhouse trials were not
predictive of the field results. However, based on the growth of crofton
weed in the field and environmental conditions, more time may be needed
for field trials to show any effect of the agents. In addition, these field trials
have assessed the impact of the fly and pathogen on crofton weed
vegetative growth within one area of South Africa, where the fly had not
been previously released and therefore no parasitoids were present. Field
surveys of crofton weed infestations across South Africa may yield
different results, as based on the effect of the fly and pathogen in other
countries, the impact of the agents may differ depending on the severity
and prevalence of agent attack, parasitism of the fly, and environmental
factors. In Hawaii crofton weed has been successfully controlled by the
gall fly alone, where crofton weed has been eliminated over large tracks of
land, in low rainfall areas (Bess & Haramoto, 1959, 1972; Muniappan et
al., 2009). Heavy galling in Hawaii, up to seven galls per stem, resulted in
stunted plants, weakened stems and death of some plants (Bess &
Haramoto, 1972), but the fly was not as successful in high rainfall areas
(Bess & Haramoto, 1959, 1972). The gall fly and fungal pathogen together
have slowed the encroachment of crofton weed and thinned infestations
along the east coast of Australia (Dodd, 1961; Page & Lacey, 2006). The
pathogen has led to death of seedlings and major or complete defoliation
of stems in Australia in the drier months (Page & Lacey, 2006), and high
levels of galling reduced plant vigour and killed plants (Dodd, 1961). In
addition, this study has only assessed vegetative growth of crofton weed,
the efficacy of agents to control reproductive output of the target weed is
also important in biocontrol (Pysěk & Richardson, 2007; Morin et al.,
2009).
3.6 Conclusion
From the greenhouse trial, control of crofton weed by the fly in the field
was expected, with repeated galling controlling stem growth, and the

3 - 19
fungal pathogen reducing sideshoot growth. However, in the field the
fungal pathogen alone is the predominant biocontrol agent, and no
additional cumulative control is achieved with the addition of the gall fly.
The pathogen decreases vegetative reproduction, by reducing the number
of sideshoots. However, the allocation of biomass is different when both
biocontrol agents are used. The reduction in stem biomass by galling may
be effective in controlling crofton weed over a longer time period. Is it
better to reduce the quality of stems and live leaves, or to reduce the
biomass of sideshoots which may become new plants? This study has
highlighted that caution should be used when using only greenhouse trials,
with controlled conditions, to predict the effectiveness of multiple biocontrol
agents.

Chapter 4: Do multiple agents reduce the
reproductive output of the invasive alien
plant, Ageratina adenophora, in
laboratory and field trials?

4 - 2
4.1 Abstract
Biocontrol aims to reduce the population density and spread of target
weeds, and one way this can be achieved is by reducing the reproductive
output of the target weed. Two biocontrol agents, a stem gall fly,
Procecidochares utilis, and a leaf-spot pathogen, Passalora ageratinae,
have been released against crofton weed, Ageratina adenophora, in South
Africa. This study investigated whether the two biocontrol agents,
individually or together, affected crofton weed reproductive output, under
both greenhouse and field conditions. Six month old plants were exposed
to one of six treatments (n=15plants/treatment) in the greenhouse: control
(no agents), pathogen-only, single-galled, double-galled, pathogen-single
galled, and pathogen-double galled before the flowering period. The field
trial was conducted at a site in the Magaliesberg. Four month old stems
were exposed to one of the following two treatments
(n=20plants/treatment): pathogen-only and pathogen-single galled before
the flowering period. Similar results were found in both the greenhouse
and field trials. Galling by the fly resulted in fewer synflorescences per
stem, capitula per synflorescences and filled achenes per capitula, in
comparison to the ungalled treatments. Overall, galled stems had 53.8%
less filled and germinable achenes than control stems. The pathogen did
not reduce the number of synflorescences per stem or the number of
capitula per stem. However pathogen infected stems did have 26.7% less
filled and germinable achenes per stem in comparison to the control. The
combination of the two agents together provided equivalent control, with
the fly being the most damaging. The percentage germination of filled
achenes was lower in the field (71%) in comparison to the laboratory
(74%). Whilst the gall fly is the most effective agent in terms of reducing
crofton weed sexual reproductive output, crofton weed compensates for
galling with increased sideshoot (vegetative reproduction) growth. The
pathogen inhibits the growth of sideshoots. Therefore, the pathogen may
not reduce the sexual reproductive output of a stem to the extent of the fly,
but it may reduce the number of potentially asexual reproductive

4 - 3
sideshoots in the next flowering season. The fly does not gall all the stems
in the field, and therefore both agents in combination are better for the
control of crofton weed in South Africa.
4.2 Introduction
Classical biological control (biocontrol) of weeds involves the deliberate
introduction of biocontrol agents, termed natural enemies, such as insects,
mites and pathogens, from the country of origin into the invaded country
(McFadyen, 1998; Müller-Schärer & Schaffner, 2008; Morin et al., 2009).
The aim of biocontrol is not necessarily to eradicate the weed population
but to reduce the invasion to ‘acceptable levels’, where the plants may
survive and reproduce but do not invade or impact negatively on the
surrounding environment. When successful, biocontrol reduces the weed
population’s density, distribution and/or rate of spread (Zimmermann et al.,
2004). Biocontrol agents that reduce the reproductive output of weeds are
often used to reduce the invasiveness of a weed population (van Klinken
et al., 2004; Morin et al., 2009). Some desired outcomes may include
reducing the number of seeds, seed quality and dispersal characteristics
(van Klinken et al., 2004). There is some debate over whether seed and
flower feeders improve the success of biocontrol programmes (Myers &
Risley, 2000). However, some plant traits, such as few large seeds and
low seed viability, have been highlighted that may allow for better success
with seed and flower feeders (van Klinken et al., 2004).
Ageratina adenophora, (Sprengel) King and Robinson (syn. Eupatorium
adenophorum Spreng.) (Asteraceae), also known as crofton weed or the
Mexican Devil, originates from Mexico and is an invasive weed in several
countries worldwide, including South Africa, Australia, New Zealand,
Hawaii, India and China (Julien & Griffiths, 1998). The weed favours moist
areas near water and along stream banks, but may also invade forest
margins, agricultural plantations and roadsides (Dodd, 1961; Henderson,
2001; Trounce, 2003; Page & Lacey, 2006). Crofton weed often grows in

4 - 4
inaccessible areas, such as high up on waterfalls and in the crevices of
mountain ridges, where these infestations are very difficult to clear
manually.
Crofton weed inflorescences are arranged in terminal corymbs; flower-like
heads made up of many small white capitula surrounded by protective
bracts, hereafter referred to as synflorescences (Peng et al., 1998;
Henderson, 2001; Muniappan et al., 2009). In South Africa flowering
occurs between August and December. The fruits are glabrous achenes
(smooth, hard dry fruits) approximately 2mm long, with 8-10 apical bristles
(Peng et al., 1998; Henderson, 2001; Muniappan et al., 2009). Crofton
weed seeds prolifically, adult plants may produce 10 000 - 100 000 seeds
per season, contributing up to 60 000 viable seeds/m2 to the seed bank
annually (Trounce, 2003; Muniappan et al., 2009). The very light seeds
are dispersed by wind and water as well as by humans on clothing and
vehicles, over long distances, allowing invasion of new areas (Muniappan
et al., 2009) and rapid rates of spread. Crofton weed is apomictic,
producing seeds without fertilisation (Rambuda & Johnson, 2004).
Therefore, crofton weed can seed and spread in the absence of other
individuals or pollinators.
In South Africa, two biocontrol agents, a stem gall fly, Procecidochares
utilis Stone (Tephritidae), and a leaf-spot fungal pathogen, Passalora
ageratinae Crous and A.R. Wood (Mycosphaerellaceae) (previously
named Cercospora eupatorii Peck or Phaeoramularia sp.) (Crous et al.,
2009), have been released against crofton weed (Plant Protection News,
1988; Kluge 1991). Laboratory trials predict that repeated galling reduces
stem growth and the pathogen reduces sideshoot growth, resulting in an
additive effect on crofton weed biocontrol (Chapter 2). Field trials show
that there is no increased control, on vegetative growth of crofton weed,
when the two biocontrol agents are used in combination, however the fly
may reduce stem vigour over a longer time period, and the pathogen may
reduce the compensatory effect of increased sideshoot growth (Chapter
3).

4 - 5
The aim of this study was to evaluate whether the pathogen and fly,
individually and in combination, reduce the seed production of crofton
weed, under both laboratory and field conditions, in South Africa.
4.3 Material and methods
4.3.1 Laboratory trials
The laboratory trial was run in a greenhouse at the University of the
Witwatersrand, Johannesburg, Gauteng (26˚11’20.97”S, 28˚01’55.37”E). A
detailed description of greenhouse conditions, biocontrol agent rearing
and trial set up is provided in Chapter 2.
Approximately 100 crofton weed seedlings were grown from stored
achenes, sown in August 2006, into 5-litre plant bags filled with potting
soil. In January 2007 the approximately 50cm tall plants were cut back to
soil level, to promote new stem growth.
At the end of March 2007, 15 plants were randomly allocated to each of
the following six treatments:
(i) no biocontrol agents (control);
(ii) plants infected with the fungal pathogen P. ageratinae only
(hereafter referred to as pathogen-only);
(iii) plants exposed to one release of P. utilis (hereafter referred to
as single-galled);
(iv) plants exposed to two releases of P. utilis (hereafter referred
to as double-galled);
(v) plants infected with P. ageratinae and exposed to one release
of P. utilis (hereafter referred to as pathogen-single galled);
(vi) plants infected with P. ageratinae and exposed to two releases
of P. utilis (hereafter referred to as pathogen-double galled).
In order to restrict the spread of the pathogen between the treatments,
plants in the non-pathogen treatments were sprayed with a broad-
spectrum fungicide, AMISTAR ®. A control trial was run concurrently to

4 - 6
measure any stimulatory or inhibitory influence that AMISTAR may have
had on A. adenophora sexual reproduction. In order to prevent P. utilis
ovipositing on non-fly treatment plants, the plants of all treatments were
placed in separate cages.
The trial A. adenophora plants in the pathogen treatments were infected
with the pathogen by tying fresh infected leaves, from a stock culture, onto
their stems in mid-April 2007. Plants from all treatments were then covered
with plastic bags, to create a dew period of 24 hours (Wang et al., 1997).
The first fungal leaf spots appeared in late May 2007.
One pair of flies was released per plant into only the cages of the double
galled treatments (treatments iv and vi), in June 2007 before the flowering
period. Flies emerged from galls 10 weeks later and were collected for 3
weeks, in order to stop the emerging flies from further ovipositing on the
treatment plants. The second release of flies took place in September
2007 during the flowering period. One pair of flies was released per plant
onto all four of the single and double galled treatments (treatments iii–vi).
4.3.2 Field trials
The field trial was run on the 150ha Kloofwaters farm, in the Magaliesberg,
North West Province, South Africa (25˚49’45.1”S, 27˚26’26.0”E). A
detailed description of the field site, biocontrol agent rearing and trial set
up is provided in Chapter 3.
In February 2007 all crofton weed plants within a 50m2 area within the field
site were cut back to soil level and labelled. Plants were cut back to
promote growth of new stems from the woody rootstock.
It was not possible to chemically exclude the pathogen from the new
stems in the field, as they were infected as seedlings from surrounding
plants, and AMISTAR is phytotoxic in small plants. Fungal leaf spots were
visible on new stems by April 2007.

4 - 7
In June 2007, 20 plants were randomly allocated to each of the following
two treatments:
(i) plants infected with the fungal pathogen, P. ageratinae
(pathogen-only);
(ii) plants infected with the fungal pathogen, P. ageratinae,
and exposed to one release of the fly, P. utilis (hereafter
referred to as pathogen-single galled);
Cages were used to restrict flies from ovipositing on non-galled treatment
plants. All plants in the two treatments were covered with cages. Flies
were released in August 2007, just before flowers appeared. One pair of
flies per plant was released into the cages with plants of the pathogen-
single galled treatment (treatment ii). Flies emerged from galls 12 weeks
later (November 2007), and were collected from the cages with a pooter,
over a five week period, to prevent further galling of the treatment plants.
No unaccounted galling on non-treatment plants was observed during the
trial period.
4.3.3 Reproductive output measurements
Due to the large number of stems per plant (approximately 15 to 20), four
stems were randomly selected per plant for measurements of reproductive
potential. All measurements were taken at the end of the flowering period
in October 2007.
Seed production
For the laboratory and field trials, the total number of synflorescences per
stem was counted. A subsample of five synflorescences was randomly
selected and the number of capitula per synflorescence was recorded and
a mean calculated.
Erasmus et al. (1992) recorded three categories of achenes: filled, empty
and aborted (shrunken and undeveloped). A subsample of 15 capitula per

4 - 8
stem was randomly chosen and the number of achenes in each category
per capitula counted. Very few aborted achenes were recorded; therefore
they were grouped in the empty achenes category. Empty and aborted
achenes are not viable (Erasmus et al., 1992). The total number of filled
achenes per stem was calculated as follows:
Number filled achenes/ stem = (synflorescences/stem) x (mean
capitula/synflorescence) x (mean filled achenes/capitula).
Number of germinable achenes/stem = (synflorescences/stem) x (mean
capitula/synflorescence) x (mean filled achenes/capitula) x %germination/100.
Seed germinability and viability
Ten filled achenes per stem were randomly selected for germination trials
to test percentage viability and germinability of achenes. Achenes for
germination trials were placed on moist Whatman No.1 filter paper in 12cm
petri-dishes and placed in a Phytotron controlled growth chamber, at the
University of the Witwatersrand, Johannesburg, set at 20oC with
continuous white light or 12 hours of every 24 hours (as per Erasmus et
al., 1992). The filter paper was moistened daily as required, and sprayed
with the fungicide Benlate to control any fungal growth. Germination of
achenes was recognised by protrusion of the radical by 2mm, and
observed daily for 28 days. Germinated achenes were removed once they
had been recorded.
4.3.4 Data analysis
One-way ANOVA with nesting and LSD tests were used to assess
differences in reproductive output measurements between the six
treatments for the laboratory trials (GLM procedure, StatSoft, 2007). Two-
way ANOVA’s were also used to determine significant interactions
between single galled and pathogen infection, and double galled and
pathogen infection. Student t-tests were used to assess differences in

4 - 9
reproductive output measurements between the two treatments for the
field trials.
The laboratory and field trials cannot formally be statistically compared as
they are two different experiments; however there is advantage and value
to make these comparisons. Therefore, student t-tests were used to
compare pathogen-only stems in the field and laboratory trials, and
pathogen-single galled stems in the field and laboratory.
4.4. Results
4.4.1 Impact of AMISTAR ® on Ageratina adenophora reproductive output
In the laboratory, the fungicide, AMISTAR, caused no significant impact on
the number of synflorescences per stem (t118=0.05, P=0.957), the number
of capitula per stem (t118=0.64, P=0.523), the number of filled (t118=0.48,
P=0.633), empty and aborted (t118=1.21, P=0.228) and total (t118=1.09,
P=0.274) achenes per capitulum, and the number of filled achenes per
stem (t118=0.48, P=0.636) in the laboratory trials. There was also no
significant difference in percentage germination of achenes between
plants sprayed with AMISTAR and unsprayed plants (t118=0.02, P=0.983).
4.4.2 Number of synflorescences per stem
A One-way ANOVA showed a significant difference in the number of
synflorescences per stem between the six treatments in the laboratory
trials (F5,164=7.75, P<0.001) (Fig. 4.1). The control and pathogen-only
stems had the most synflorescences per stem, and stems galled twice had
the lowest number of synflorescences per stem. There was no significant
interaction between one fly release and pathogen infection (F1,193=0.19,
P=0.662) or two fly releases and pathogen infection (F1,189=0.11,
P=0.742) on the number of synflorescences per stem. The effect of the
interaction between the fly and pathogen is equivalent, with the primary
agent being the fly.
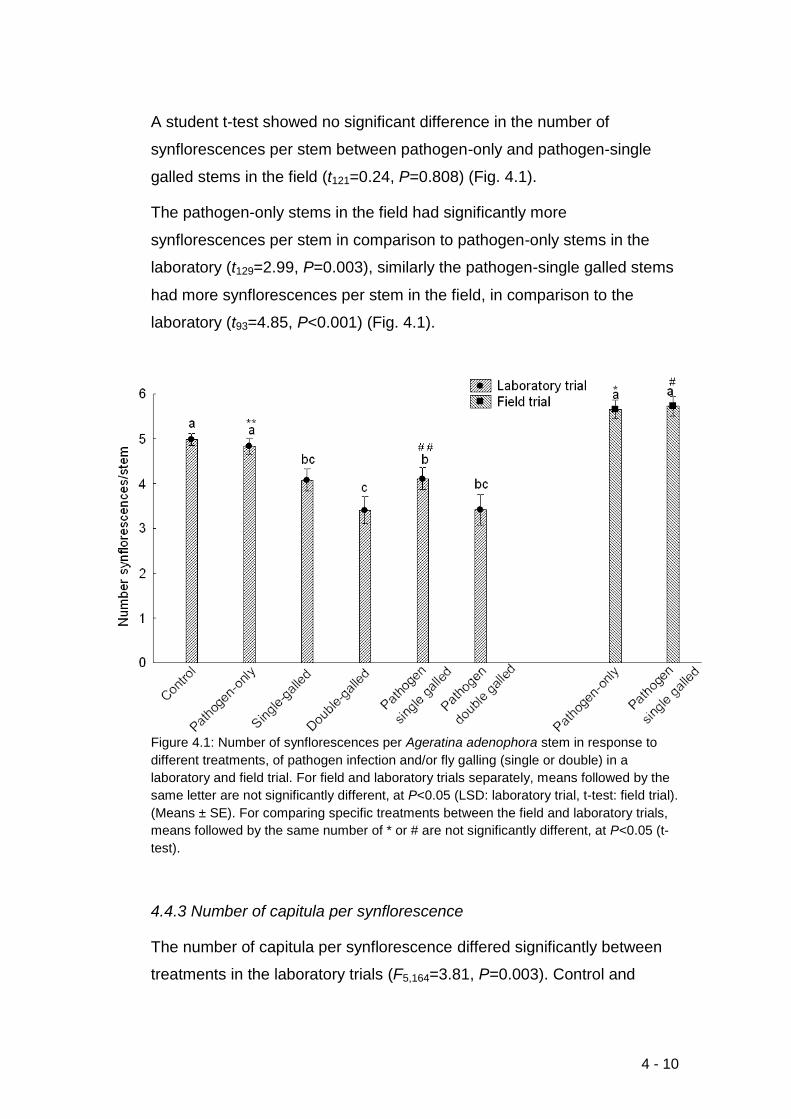
4 - 10
A student t-test showed no significant difference in the number of
synflorescences per stem between pathogen-only and pathogen-single
galled stems in the field (t121=0.24, P=0.808) (Fig. 4.1).
The pathogen-only stems in the field had significantly more
synflorescences per stem in comparison to pathogen-only stems in the
laboratory (t129=2.99, P=0.003), similarly the pathogen-single galled stems
had more synflorescences per stem in the field, in comparison to the
laboratory (t93=4.85, P<0.001) (Fig. 4.1).
Figure 4.1: Number of synflorescences per Ageratina adenophora stem in response to
different treatments, of pathogen infection and/or fly galling (single or double) in a
laboratory and field trial. For field and laboratory trials separately, means followed by the
same letter are not significantly different, at P<0.05 (LSD: laboratory trial, t-test: field trial).
(Means ± SE). For comparing specific treatments between the field and laboratory trials,
means followed by the same number of * or # are not significantly different, at P<0.05 (t-
test).
4.4.3 Number of capitula per synflorescence
The number of capitula per synflorescence differed significantly between
treatments in the laboratory trials (F5,164=3.81, P=0.003). Control and

4 - 11
pathogen-only stems had a higher number of capitula per stem, in
comparison to the other four treatments (Fig. 4.2). There was no
significant interaction between one fly release and pathogen infection
(F1,193=2.57, P=0.111) or two fly releases and pathogen infection
(F1,189=0.19, P=0.662) on the number of capitula per synflorescence. The
interaction between the agents led to an equivalent effect, the fly reduced
the number of capitula per synflorescence the most.
There were significantly more capitula per synflorescence on pathogen-
only stems compared to pathogen-single galled stems in the field
(t121=3.62, P<0.001) (Fig. 4.2).
The number of capitula per synflorescence was lowest in pathogen-only
stems (t129=3.16, P=0.002) and pathogen-single galled stems (t93=4.42,
P<0.001) in the field, relative to the same treatments in the laboratory (Fig.
4.2).
Figure 4.2: Number of capitula per Ageratina adenophora synflorescence in response to
different treatments, of pathogen infection and/or fly galling (single or double) in a
laboratory trial and field trial. For field and laboratory trials separately, means followed by
the same letter are not significantly different, at P<0.05 (LSD: laboratory trial, t-test: field
trial). (Means ± SE). For comparing specific treatments between the field and laboratory
trials, means followed by the same number of * or # are not significantly different, at
P<0.05 (t-test).

4 - 12
4.4.4 Number of filled, empty and aborted achenes per capitulum
The treatments in the laboratory trial had a significantly different number of
filled (F5,164=84.93, P<0.001), empty and aborted (F5,164=12.63, P<0.001)
and total (F5,164=23.40, P<0.001) achenes per capitulum (Fig. 4.3). Control
stems had the highest number of filled and total achenes per capitulum,
and the lowest number of empty and aborted achenes per capitulum.
Double-galled stems, regardless of pathogen infection, had the lowest
number of filled achenes per capitulum. There was a significant interaction
between one fly release and pathogen infection on the number of filled
(F1,193=16.43, P<0.001) and total achenes per capitulum (F1,193=14.61,
P<0.001), but not with the number of empty and aborted achenes per
capitulum (F1,193=0.02, P=0.877). The interaction of two fly releases and
pathogen infection was significant for the number of filled (F1,189=28.15,
P<0.001), empty and aborted (F1,189=4.41, P=0.037) and total (F1,189=4.98,
P=0.027) achenes per capitulum. The interaction between the agents has
an equivalent effect on the number of filled, empty and aborted, and total
achenes, where the fly caused the greatest damage.
There were significantly more empty and aborted achenes on pathogen-
single galled stems compared to pathogen-only stems in the field
(t121=3.01, P=0.003) (Fig. 4.3). However, there was no significant
difference between the two treatments in terms of filled achenes
(t121=1.66, P=0.099) and the total number of achenes (t121=0.63, P=0.527)
per capitulum.
In comparison to the laboratory, the pathogen-only stems (t129=3.45,
P<0.001) and pathogen-single galled stems (t93=3.61, P<0.001) in the field
had fewer filled achenes per capitulum (Fig. 4.3). The number of empty
and aborted achenes per capitulum was not different between pathogen-
only stems in the field and laboratory (t129=1.71, P=0.090), but was higher
in the pathogen-single galled field stems (t93=2.28, P=0.025). The total
number of achenes per capitulum was lowest on field pathogen-only stems

4 - 13
(t129=2.29, P=0.023), but was similar between pathogen-single galled
stems in the field and laboratory (t93=1.15, P=0.254).
Figure 4.3: Number of filled, empty/aborted and total achenes per Ageratina adenophora
capitula in response to different treatments, of pathogen infection and/or fly galling (single
or double) in a laboratory trial and field trial. For field and laboratory trials separately,
means followed by the same letter are not significantly different, at P<0.05 (LSD:
laboratory trial, t-test: field trial). (Means ± SE). For comparing specific treatments
between the field and laboratory trials, means followed by the same number of * or # are
not significantly different, at P<0.05 (t-test).
4.4.5 Number of filled and germinable achenes per stem
There was a significant difference between the treatments in the laboratory
trials in terms of the number of filled achenes per stem (F5,164=16.46,
P<0.001) (Fig. 4.4) and germinable achenes per stem (F5,164=16.09,
P<0.001) (Fig. 4.5). The control stems had the highest number of filled and
germinable achenes per stem. There was a significant interaction between
single fly releases and pathogen infection on the number of filled
(F1,193=5.99, P=0.015) and germinable (F1,193=6.22, P=0.013) achenes per

4 - 14
stem. However, there was no significant interaction between double fly
releases and pathogen infection on the number of filled (F1,193=1.81,
P=0.180) and germinable (F1,193=1.55, P=0.215) achenes per stem. The
effect of the interaction between the agents is equivalent, with the fly being
the most damaging agent as regardless of pathogen infection; galled
stems had the lowest number of filled and germinable achenes per stem.
Pathogen-only stems had significantly more filled achenes (t121=2.77,
P<0.001) (Fig. 4.4) and germinable achenes (t121=2.89, P=0.004) (Fig. 4.5)
per stem than pathogen-single galled stems in the field.
The number of filled (t129=0.04, P=0.967) and germinable (t129=0.59,
P=0.559) achenes per stem did not differ between pathogen-only stems in
the field or laboratory, similarly the number of filled (t93=0.18, P=0.856)
and germinable (t93=0.45, P=0.653) achenes per stem did not differ
between pathogen-single galled stems in the field or laboratory (Fig. 4.4,
Fig. 4.5).
4.4.6 Percentage germination of achenes
The percentage germination of achenes did not differ significantly between
treatments in the laboratory trials (F5,164=0.29, P=0.918) (Fig. 4.6), or in the
field trials (t121=1.13, P=0.262) (Fig. 4.6).
The percentage germination of filled achenes was lower in the field than
the laboratory on pathogen-only stems (t129=3.08, P=0.003) and pathogen-
single galled stems (t93=3.25, P=0.002) (Fig. 4.6).

4 - 15
Figure 4.4: Number of filled achenes per Ageratina adenophora stem in response to
different treatments, of pathogen infection and/or fly galling (single or double) in a
laboratory trial and field trial. For field and laboratory trials separately, means followed by
the same letter are not significantly different, at P<0.05 (LSD: laboratory trial, t-test: field
trial). (Means ± SE). For comparing specific treatments between the field and laboratory
trials, means followed by the same number of * or # are not significantly different, at
P<0.05 (t-test).
Figure 4.5: Number of germinable achenes per Ageratina adenophora stem in response
to different treatments, of pathogen infection and/or fly galling (single or double) in a
laboratory trial and field trial. For field and laboratory trials separately, means followed by
the same letter are not significantly different, at P<0.05 (LSD: laboratory trial, t-test: field
trial). (Means ± SE). For comparing specific treatments between the field and laboratory
trials, means followed by the same number of * or # are not significantly different, at
P<0.05 (t-test).

4 - 16
Figure 4.6: Percentage germination of Ageratina adenophora achenes in response to
different treatments, of pathogen infection and/or fly galling (single or double) in a
laboratory trial and field trial. For field and laboratory trials separately, means followed by
the same letter are not significantly different, at P<0.05 (LSD: laboratory trial, t-test: field
trial). (Means ± SE). For comparing specific treatments between the field and laboratory
trials, means followed by the same number of * or # are not significantly different, at
P<0.05 (t-test).
4.5 Discussion
It is not easy to identify a set of traits that predict the invasiveness of
plants (Pysěk & Richardson, 2007). However, there are some reproductive
traits that are important in invasive plants, such as early and extended
flowering periods, efficient seed dispersal, seed size and long-term seed
banks which allow them to spread and persevere in new areas rapidly
(Rejmánek & Richardson, 1996; Pysěk & Richardson, 2007). Ageratina
adenophora has the ability to produce a high number of light, wind-
dispersed seeds. From the laboratory trials an individual stem can produce
1827±114 (mean±SE) germinable achenes, this calculates to potentially
36 540 germinable seeds per 20-stemmed plant. In addition crofton weed
is apomictic, and is not reliant on the availability of pollinators to produce

4 - 17
these high numbers of viable seeds (Rambuda & Johnson, 2004). It is for
this reason that manual clearing, within the Magaliesberg, is implemented
before the flowering period. However crofton weed grows in inaccessible
areas within the mountain range, therefore leaving a few plants behind still
leads to a high number of achenes produced. The stem gall fly, P. utilis,
reduces the reproductive output of each stem by an average of 53.8%,
particularly with repeated galling (65.3%); the leaf-spot pathogen, P.
ageratinae, has a lesser (reduced by 26.7%) but still significant effect on
the reproductive output of the stems.
Galls are known to act as nutrient sinks, because resources destined for
growth sites (sinks) from production or storage areas (sources) are
redirected towards the gall, resulting in an imbalance of the plant’s source-
sink relationship (Larson & Whitman, 1997; Florentine et al., 2005; Dorchin
et al., 2006; Moseley et al., 2009). This imbalance may lead to less
resources being available for seed production (Woods et al., 2008).
Procecidochares utilis galls are nutrient sinks (Bennett & van Staden,
1986; Erasmus et al., 1992), vegetative trials have shown decreased stem
growth above the position of the gall (Chapter 2 and 3). Fewer resources
reach the apex of the stem, in both single and double galled stems,
leading to a reduced number of synflorescences and fewer capitula per
synflorescence, in comparison to the control stems. Within the capitula,
fewer filled achenes, and more empty and aborted achenes develop,
particularly with stems galled twice. This results in 49.67% (single-galled),
45.5% (pathogen-single galled), 54.8% (double-galled) and 65.3%
(pathogen-double galled) less filled and germinable achenes per stem, in
comparison to the control stems.
In both the laboratory and field trials only 20-40% of the leaves on crofton
weed stems were infected with the pathogen before flowering (Chapter 2
and 3). Weeds can shed pathogen infected leaves and increase the
vegetative growth of new uninfected leaves, in order to outgrow the
disease pressure (Charudattan, 2005, 2010); this was observed on crofton
weed stems in both the laboratory and field trials (Chapter 2 and 3). The

4 - 18
level of the leaf-spot pathogen infection on crofton weed stems is not
severe enough to decrease the number of synflorescences, or the number
of capitula per synflorescence on pathogen-only stems in comparison to
control stems. However, the disease pressure does result in fewer
resources for the number of filled (viable) achenes per capitulum, resulting
in a 26.7% reduction of filled achenes and hence seed production on
pathogen-only stems. However, this impact of the pathogen is less than on
galled-only stems. The extent to which a pathogen influences a weed
depends on the severity of the pathogen infection (Charudattan, 2005),
therefore defoliation by the pathogen may need to be more severe for a
longer period of time to decrease the reproductive output of crofton weed
to a higher level.
Two theories explain successful biocontrol programmes using multiple
biocontrol agents (Denoth et al., 2002), the cumulative stress model states
that the stress of all the agents in combination increases the impact on the
target weed (Harris, 1985; Hoffmann & Moran, 1998; Turner et al., 2010),
whilst the lottery model states that only one agent is needed to sufficiently
control the target weed (Myers, 1985, 2008; McEvoy & Coombs, 2000). In
these laboratory trials, the stem gall fly and pathogen in combination
provided better control than the pathogen-only treatment, with reduced
numbers of synflorescences, capitula per synflorescence, filled achenes
per capitula and filled achenes produced on each crofton weed stem.
However, the combination of the agents did not increase the cumulative
stress on the reproductive potential of the crofton weed stems in
comparison to the galled-only stems. The percentage germination of filled
achenes did not differ between any of the treatments, including the
absence of agents (control). In the field trials pathogen-single galled stems
did not differ significantly from pathogen-only stems in terms of the number
of synflorescences, but the addition of galling did reduce the number of
capitula within the synflorescence and the number of filled achenes per
stem. Therefore, the overall interaction between the biocontrol agents in
the laboratory and field leads to an equivalent effect on crofton weed

4 - 19
reproductive output (Hatcher, 1995; Hatcher & Paul, 2001). That is the
effect of the two agents together is equivalent to the highest impacting
agent, which in this system is the fly. However, crofton weed
compensates for galling with increased sideshoot (vegetative
reproduction) growth (Chapter 2 and 3). These sideshoots will reproduce
sexually in the next flowering season; therefore if these sideshoots are not
galled in the following season, the reproductive output of the stem could
increase over a longer term period. The pathogen inhibits sideshoot
growth (Chapter 2 and 3); therefore whilst the pathogen may not directly
increase the cumulative control of crofton weed reproductive output
immediately, over the longer term period it may have a role to play in
reducing sideshoot growth, thereby reducing future sexual reproduction
induced by galling. In addition, field observations indicate that up to 95%
of stems are infected with the pathogen and only 20% are galled, therefore
the pathogen may play a role in reducing the reproductive output of
ungalled stems. The agents may also differ in their efficacy under different
environmental conditions.
The success of biocontrol agents is often predicted by using laboratory
trials; however these controlled conditions are not always representative of
field conditions (Rosskopf et al., 1999; Morin et al., 2006, 2009).
Laboratory trials predicted an additive effect on crofton weed vegetative
growth with both the fly and pathogen used in combination; however the
field trials showed the agents in combination did not have a cumulative
effect, with the pathogen being the highest impacting agent (Chapter 2
and 3). Conversely, these trials on reproductive output show similar
results between the laboratory and field, the number of germinable
achenes per stem did not differ between pathogen-only or pathogen-single
galled stems in the laboratory and field.
This study has shown that galling and pathogen infection can reduce the
reproductive output of individual crofton weed stems. Does this impact
translate to a population level impact on infestations of crofton weed?
Plant populations may be seed-limited, where not enough seeds are

4 - 20
produced to increase the plant’s population, or micro-site limited where
there are not enough suitable micro-sites available to increase the plant
population (Turnbull et al., 2000; Clark et al., 2007; Herrera & Laterra,
2009). Factors affecting seed-limitation include disturbance, seed size and
seed bank longevity (Clark et al., 2007). However, if plant populations are
not seed-limited herbivory of reproductive structures has a small effect at
the population level (Turnbull et al., 2000). Therefore, if the level of agent
attack is not severe and prevalent throughout the whole infestation, then
there may not be an overall net reduction in seed output (Rieder et al.,
2001; Woods et al., 2008). For example, the flower-bud destroying
Trichapion lativentre reduces the seed set of Sesbania punicea by 98%,
which reduces the density of immature plants but there is no effect on the
density of mature plants (Hoffmann & Moran, 1998). If crofton weed is not
seed-limited, then the reduction of reproductive output by these agents
may not be enough to successfully control the spread of crofton weed.
Weeds are able to maintain high density levels through soil seed banks
(Witkowski & Wilson, 2001; Davis, 2006). If the soil seed bank of crofton
weed is only composed of 50% of seeds produced, then the reduction of
seed output through galling may not have a population effect on crofton
weed infestations. However, crofton weed may not be micro-site limited,
as infestations occur along roadsides and water courses, and are easily
carried to areas outside of the adult population. Therefore, a reduction in
the number of viable seeds being carried to new suitable areas will be
beneficial for the control of crofton weed in South Africa.
4.6 Conclusion
The gall fly and pathogen reduce the reproductive output of crofton weed
by 53.8% and 26.7% respectively. However, the most effective single
agent is the gall fly, particularly if there is repeated galling on a stem. The
combination of the gall fly and pathogen is equivalent as the agents
together do not cumulatively decrease crofton weed reproductive output in

4 - 21
comparison to the gall fly alone. However, as crofton weed compensates
for galling with increased sideshoot growth, the pathogen is still important
in the biocontrol programme.

Chapter 5: Ecophysiological response of
the invasive alien plant Ageratina
adenophora to multiple biological control
agents.

5 - 2
5.1 Abstract
As photosynthesis is vital to a plant’s survival, any negative influence on it
could result in reduced growth and reproduction. Ageratina adenophora
(crofton weed) has had two biocontrol agents, Procecidochares utilis, a
stem gall fly, and Passalora ageratinae, a leaf-spot fungal pathogen,
released against it in South Africa. This study investigated the effect of the
two biocontrol agents, individually and together, on a number of leaf
ecophysiological responses in crofton weed. Crofton weed plants were
exposed to one of six treatments (n=10plants/treatment): control (no
agents), pathogen-only, single-galled only, double-galled only, pathogen-
single galled, and pathogen-double galled, all for a period of six months.
Pathogen-only and pathogen-galled plants had significantly lower
transpiration, stomatal conductance and photosynthetic rates in
comparison to the control and galled-only plants. The instantaneous water-
use efficiency was highest for the control plants in comparison to agent
infected plants. The chlorophyll fluorescence parameters show that galling
stresses the efficiency of photosystem II in the lower (older) leaves of
crofton weed plants, but the most stress is inflicted by the pathogen.
Galled plants compensate for this stress by increasing sideshoot growth,
whilst pathogen infected plants compensate for the stress by increasing
vertical growth with new healthy leaves. Chlorophyll content was lowest in
the lower (older) leaves with visible leaf-spots. These results correspond
well with what was predicted from laboratory and field trials. Overall the
interaction between the agents results in an equivalent effect on crofton
weed, with the pathogen causing the most direct damage to the lower,
older leaves of the plants.

5 - 3
5.2 Introduction
Classical biocontrol of weeds is the deliberate introduction of a target
weed’s natural enemies from the native range, into the invaded area, to
reduce the weeds abundance (Morin et al., 2009). Biocontrol agents affect
the growth, reproductive output and survival of the target weed (van
Klinken & Raghu, 2006; Morin et al., 2009). Insect feeding affects the
photosynthetic capacity and functioning, transpiration, fluid and nutrient
transport, and chlorophyll content of plants (Buntin et al., 1993; Macedo et
al., 2007; Nabity et al., 2009). However, with a few exceptions such as
water hyacinth, Eichhornia crassipes, (Ripley et al., 2006), few studies
have tested the ecophysiological response of weeds to their biocontrol
agents.
Ageratina adenophora, (Sprengel) King and Robinson (syn. Eupatorium
adenophorum Spreng.) (Asteraceae), crofton weed, is an invasive weed in
South Africa, Australia, New Zealand, Hawaii, India and China (Julien &
Griffiths, 1998). Two biocontrol agents, a stem gall fly, Procecidochares
utilis Stone (Tephritidae), and a leaf-spot fungal pathogen Passalora
ageratinae Crous and A.R. Wood (Mycosphaerellaceae) (previously
named Cercospora eupatorii Peck or Phaeoramularia sp.) (Crous et al.,
2009) have been released against crofton weed and are established in
South Africa (Kluge, 1991; Heystek et al., 2011).
Previously biocontrol success has predominantly been defined as a
reduction in density of weed populations (Hoffmann & Moran, 2008). In
Hawaii the gall fly alone has been very successful at reducing the density
of crofton weed infestations (Bess & Haramoto, 1959, 1972; Muniappan et
al., 2009). However, success in biocontrol may be more subtle than
reducing the density of weed infestations, such as reducing the rate of
plant growth (Hoffmann & Moran, 2008). Laboratory trials predict the
interaction between the two agents leads to an additive effect on crofton
weed, that is repeated galling by the fly reduces stem growth, and the
pathogen inhibits sideshoot growth promoted by galling (Chapter 2). Field

5 - 4
trials showed an equivalent effect (Hatcher, 1995; Hatcher & Paul, 2001)
of the two agents together, the gall fly may reduce stem vigour over a
longer time period and the pathogen may reduce the compensatory effect
of increased sideshoot growth (Chapter 3). Laboratory and field trials
showed that the fly reduced the number of germinable achenes per crofton
weed stem by 53.8% and the pathogen reduced germinable achenes by
26.7% (Chapter 4).
The galls may act as a nutrient sink redirecting plant growth resources for
their own growth, and the pathogen, through direct damage to the leaf,
may interfere with the photosynthetic capacity of leaves. Photosynthesis,
the process of absorbing light energy in the chloroplasts to produce
organic compounds, is vital to plant growth and survival (McDowell, 2002;
Lambers et al., 2008). Therefore, another way of evaluating plant stress is
by measuring leaf physiological variables such as photosynthesis,
stomatal conductance, transpiration, water use efficiency, chlorophyll
fluorescence kinetics and chlorophyll pigment content of the plant
(Lambers et al., 2008; Resco et al., 2008; Govender et al., 2009). These
measurements have been used to compare the photosynthetic capacity of
invasive and non-invasive plant species (McDowell, 2002; Feng et al.,
2007a, 2007b), under different environmental conditions (Field et al.,
1983; Meir et al., 2007; Santiago & Wright, 2007; Resco et al., 2008),
plants with different leaf life spans (Witkowski et al., 1992), the effect of
biocontrol agents under different nutrient conditions (Ripley et al., 2006)
and to ground truth remote sensing data (Govender et al., 2009).
Previous studies have evaluated the effect of low temperature and low
irradiance levels on the photosynthetic capacity of crofton weed (Feng et
al., 2007a, 2007b; Li et al., 2008). Crofton weed is able to tolerate low
temperatures and low irradiance levels. However, no studies have
evaluated the effect of the stem gall fly and leaf-spot pathogen on the
photosynthetic system of crofton weed leaves. The aim of this study was
to evaluate the effects of the pathogen and fly, individually and in
combination, on the ecophysiology of crofton weed, and whether these

5 - 5
results correspond with the effects of the agents seen on crofton weed’s
vegetative growth and reproductive output.
5.3 Material and methods
5.3.1 Laboratory trials
The laboratory trial was run in a greenhouse on the University of the
Witwatersrand campus, Johannesburg (26˚11’20.97”S 28˚01’55.37”E).
The greenhouse had 30% shading, with mean summer temperatures of
25.9ºC (min=18 ºC, max=35 ºC) and mean winter temperatures of 16.3ºC
(min=5 ºC, max=27 ºC). The relative humidity ranged from 43% to 100%
(mean=81.5%) in the summer months (December 2007 to February 2008),
and 28% to 100% (mean=67.8%) in the winter months (June 2008 to
August 2008).
In December 2007, 100 crofton weed seeds (collected from plants grown
in the greenhouse in September 2007) were sown in 5-litre plant bags
filled with potting soil. Three weeks later seedlings emerged. Plants were
well watered once a day for half an hour, in the morning, and fertilised
once a month with Nitrosol (N 8%: P 2%: K 5.8%).
In mid- March 2008, 10 plants, approximately 30cm tall, were randomly
allocated to each of the following six treatments:
(i) no biocontrol agents (control);
(ii) plants infected with the fungal pathogen, P. ageratinae
(pathogen-only);
(iii) plants exposed to one release of P. utilis (hereafter referred to
as single-galled);
(iv) plants exposed to two releases of P. utilis (hereafter referred to
as double-galled);
(v) plants infected with P. ageratinae and exposed to one release of
P. utilis (hereafter referred to as pathogen-single galled);

5 - 6
(vi) plants infected with P. ageratinae and exposed to two releases
of P. utilis (hereafter referred to as pathogen-double galled).
In order to prevent the pathogen spreading to non-pathogen treatment
plants, plants in treatment i, iii and iv were sprayed with a broad-spectrum
fungicide AMISTAR ®. A mechanical pressurised sprayer was calibrated
to a spray volume of 60-litre/ha; AMISTAR ® was sprayed at 500ml/ha
every four weeks. Plants that were infected with the pathogen were
sprayed with the same volume of water.
Plants were infected with the pathogen by tying fresh infected leaves, from
a stock culture at the University of the Witwatersrand, onto the stems at
the end of March 2008. Plants from all treatments were then covered with
plastic bags, to create a dew period of 24 hours (Wang et al., 1997). At the
end of April 2008 the first fungal leaf-spots became visible, but throughout
the trial no more than 30-40% of the leaves on plants were infected.
To prevent galling on non-fly treatment plants, the plants of all treatments
were placed in separate cages. The cages were 1m tall x 1.2m x 0.9m
frames of conduit piping, covered in fine white netting.
One pair of flies was released per plant for the galled treatments
(treatment iii-vi) at the end of March 2008. Flies emerged from galls 10
weeks later and were collected, for 3 weeks, in order to stop the emerging
flies from ovipositing on the treatment plants. The second release of flies
took place in July 2008. One pair of flies was released per plant onto the
double-galled treatments (treatments v–vi).
5.3.2 Leaf ecophysiological measurements
All measurements were taken using the top and/or seventh fully-
expanded leaves of the treatment plants at the end of August 2008. The
top leaf was above the gall/s (on galled plants) and did not have visible
leaf-spots (on pathogen infected plants), the seventh leaf was below the

5 - 7
gall/s (on galled plants) and had visible leaf-spots (on pathogen infected
plants).
Photosynthesis, Stomatal Conductance, Transpiration, Water-Use
Efficiency
Transpiration, stomatal conductance and photosynthesis of only the
seventh fully-expanded leaf were measured using a LI-6200 Portable
Photosynthesis System (LI-COR, Lincoln, NE, USA). The leaves were
measured in the morning, between 09:00 and 11:00, on the 20th and 21st
August 2008. The weather during measurements was clear and cloudless.
Leaf measurements were alternated between the treatments to minimise
any variation in environmental conditions during the time of readings.
Instantaneous water-use efficiency was calculated as
photosynthesis/transpiration.
Chlorophyll fluorescence kinetics
Chlorophyll fluorescence parameters give an indication of how well
photosystem II (PSII) is functioning in terms of light energy use during
photosynthesis (Lambers et al., 2008; Li et al., 2008). A decrease in the
Fv/Fm value shows that PSII is not functioning efficiently, and therefore the
plant is under physiological stress. Chlorophyll fluorescence parameters
were measured with a portable OS5-FL chlorophyll fluorometer (Opti-
Sciences, Tyngsboro, MA, USA). The top and seventh fully-expanded
leaves of the treatment plants were dark adapted for 10 minutes before
been measured, on clear, cloudless mornings between 09:00 and 11:00,
on the 29th and 31st August 2008. Each leaf was sampled twice over the
two days.

5 - 8
Chlorophyll content
The chlorophyll content of leaves was measured using a SPAD-502
Chlorophyll Meter (Spectrum Technologies Inc., Illinois, USA). The top and
seventh fully-expanded leaves per plant in each of the six treatments were
used for chlorophyll content measurements. Three measurements were
taken along the length of the leaf and the mean chlorophyll content
calculated, on the 28th August 2008, between 14:00 and 16:00.
5.3.3 Data analysis
One-way ANOVA and LSD tests were used to assess differences in leaf
physiological measurements between the six treatments for the laboratory
trials (GLM procedure, StatSoft, 2007). Two-way ANOVA’s were also used
to determine significant interactions between single galled and pathogen
infection, and double galled and pathogen infection.
5.4 Results
5.4.1 Transpiration, Stomatal Conductance, Photosynthesis and
Instantaneous Water-Use Efficiency (WUE).
There was no significant difference (P>0.05) in the air temperature, leaf
temperature or relative humidity whilst measurements were been taken
between treatments (Table 5.1). Transpiration rate (F5,52=5.88, P<0.001)
(Fig. 5.1) and stomatal conductance (F5,52=9.81, P<0.001) (Fig. 5.2) were
significantly higher for the control and galled-only treatments, resulting in
more water loss and movement through the stomata, in comparison to
pathogen-only and pathogen-galled treatments. Pathogen-only and
pathogen-galled treatment leaves had the lowest photosynthetic rate
(F5,52=11.82, P<0.001) (Fig. 5.3). There was no significant interaction
between single fly releases and pathogen infection for transpiration
(F1,33=2.46, P=0.126), stomatal conductance (F1, 33=2.60, P=0.117) or
photosynthetic rate (F1,33=0.12, P=0.733). There was also no significant

5 - 9
interaction between double fly releases and pathogen infection for
transpiration (F1,45=1.57, P=0.216) and stomatal conductance (F1, 45=0.02,
P=0.897), however the interaction was significant for the photosynthetic
rate (F1,45=4.93, P=0.019). The effect of the interaction between the two
agents on crofton weed transpiration, stomatal conductance and
photosynthesis was equivalent, with the pathogen causing the most
ecophysiological stress. All the treatment plants had a significantly lower
instantaneous water-use efficiency in comparison to the control
(F5,52=4.42, P=0.002) (Fig. 5.4).
Table 5.1: Air and leaf temperatures and relative humidity (mean±SE) during the
measurements of transpiration, stomatal conductance and photosynthesis for leaves of
Ageratina adenophora in response to six different treatments, of pathogen infection
and/or fly galling (single or double), in the greenhouse trial over two days. (NS, P>0.05
(LSD)).
Factor Day Control Pathogen-only
Single-galled
Double-galled
Pathogen-single galled
Pathogen-double galled
P
Air temperature (oC)
20/08/08 28.8±0.7 28.4±0.7 28.7±0.7 29.4±1.1 28.5±0.6 27.8±1.3 NS
21/08/08 26.8±0.9 27.0±0.8 26.9±1.4 26.8±0.6 25.2±1.9 27.7±1.2 NS
Leaf temperature (oC)
20/08/08 28.3±0.6 28.4±0.6 28.2±0.7 28.9±0.8 27.5±0.7 28.4±1.3 NS
21/08/08 26.5±0.9 27.1±0.7 26.8±1.3 26.5±0.4 28.8±0.6 28.0±1.3 NS
Relative humidity (%)
20/08/08 62.3±1.2 55.1±4.3 61.4±3.4 58.2±1.3 59.0±3.0 57.5±5.3 NS
21/08/08 69.1±2.1 67.4±2.4 66.9±2.4 64.5±3.7 64.9±3.7 57.8±4.8 NS

5 - 10
Figure 5.1: Transpiration rate of the seventh fully-expanded Ageratina adenophora leaf in
response to six different treatments, of pathogen infection and/or fly galling (single or
double). Means followed by the same letter are not significantly different, at P<0.05
(LSD). (Means ± SE).
Figure 5.2: Stomatal conductance of the seventh fully-expanded Ageratina adenophora
leaf in response to six different treatments, of pathogen infection and/or fly galling (single
or double). Means followed by the same letter are not significantly different, at P<0.05
(LSD). (Means ± SE).

5 - 11
Figure 5.3: Photosynthetic rate of the seventh fully-expanded Ageratina adenophora leaf
in response to six different treatments, of pathogen infection and/or fly galling (single or
double). Means followed by the same letter are not significantly different, at P<0.05
(LSD). (Means ± SE).
Figure 5.4: Instantaneous water-use efficiency (WUE) of the seventh fully-expanded
Ageratina adenophora leaf in response to six different treatments, of pathogen infection
and/or fly galling (single or double). Means followed by the same letter are not
significantly different, at P<0.05 (LSD). (Means ± SE).

5 - 12
5.4.2 Chlorophyll fluorescence kinetics
The fluorescence (Fv) and Fv/Fm values for the top leaf of the plants were
not significantly different across treatments (F5,102=0.47, P=0.801;
F5,102=0.49, P=0.781 respectively) (Fig. 5.5); therefore the top leaves were
not considered to be under physiological stress from the biocontrol agents.
There was a significant difference between treatments in terms of Fv
(F5,102=36.53, P<0.001) and Fv/Fm (F5,102=40.82, P<0.001) for the seventh
leaf of the plants (Fig. 5.5). There was a significant interaction between
single galled and pathogen infection on the Fv (F1, 69=12.25, P<0.001) and
Fv/Fm (F1, 69=5.23, P=0.025) values for the seventh leaf of the plants.
Similarly the Fv (F1, 94=9.65, P=0.003) and Fv/Fm (F1, 94=8.44, P=0.005)
values for the seventh leaf of the plants showed a significant interaction
between double galled and pathogen. The pathogen-only and pathogen-
galled plants were under physiological stress (in terms of photosystem II)
from the pathogen infection. Therefore, combining the two agents has an
equivalent effect with the pathogen influencing photosystem II the most.
5.4.3 Chlorophyll content
The chlorophyll content did not differ significantly between treatments on
the top leaf (F5,52=0.79, P=0.562), however there was a significant
difference between treatments for chlorophyll content in the seventh leaf
(F5,52=11.35, P<0.001) (Fig. 5.6). The pathogen-only and pathogen-galled
treatment plants had the lowest chlorophyll content in the seventh leaf, in
comparison to the other treatments. There was no significant interaction
between single galled and pathogen (F1, 45=3.38, P=0.072) and double
galled and pathogen (F1, 33=1.43, P=0.240) on the chlorophyll content of
the seventh leaf. As with the other measurements the interaction between
the two agents is equivalent, with the pathogen decreasing chlorophyll
content the most.

5 - 13
Figure 5.5: Chlorophyll fluorescence parameters of the top (youngest) and seventh (older)
fully-expanded leaves of Ageratina adenophora in response to six different treatments, of
pathogen infection and/or fly galling (single or double). Means followed by a different
letter are significantly different, at P<0.05 (LSD). (Means ± SE).

5 - 14
Figure 5.6: Chlorophyll content of the top (youngest) and seventh (older) fully-expanded
leaves of Ageratina adenophora in response to six different treatments, of pathogen
infection and/or fly galling (single or double). Means followed by the same letter are not
significantly different, at P<0.05 (LSD). (Means ± SE).
5.5 Discussion
Photosynthesis is vital to a plant’s survival, providing the products used for
growth and reproduction (Feng et al., 2007b; Lambers et al., 2008). A
reduction in photosynthetic capacity of plants leads to less resources
being available for these life processes (McDowell, 2002). The results from
this study, on the influence of biocontrol agents on the photosynthetic
capacity of crofton weed, correspond well with the results from previous
laboratory and field trials on the effect of the fly and pathogen on crofton
weed vegetative growth and seed production. This study provides
information on how crofton weed responds physiologically to infection by
the agents.

5 - 15
Galls act as nutrient sinks, taking available plant resources from other
parts of the plant for their own growth (Florentine et al., 2005; Dorchin et
al., 2006; Moseley et al., 2009). The P. utilis gall acts as a nutrient sink, as
repeated galling alone by the fly on crofton weed leads to reduced vertical
stem growth and decreased germinable seed production by 53.8%
(Chapter 2 and 4). However crofton weed compensates for galling with
increased sideshoot growth. Galls may increase (Dorchin et al., 2006) or
decrease photosynthetic rates (Florentine et al., 2005) of weeds. In this
study photosynthesis in double-galled plants was significantly lower than
the control plants, leading to fewer resources for growth and reproduction.
Under such conditions crofton weed reallocates the limited resources to
compensatory growth of sideshoots, which may develop into new plants
(Muniappan et al., 2009; Chapter 2 and 3) and these will therefore not be
stressed by the galls; rather than investing further resources into the
growth and reproduction of the original stressed stem.
Fungal leaf-spots are usually only visible on the lower (older) leaves of
crofton weed, and no significant effect of the pathogen on the vertical
vegetative growth of crofton weed is seen. However there is less sideshoot
growth on pathogen infected stems (Chapter 2 and 3). But if pathogen
infection is not aggressive, weeds are able to overcome the pressure of
the pathogens by shedding the infected leaves and increasing vegetative
(compensatory) growth (Charudattan, 2005, 2010). The reduced stomatal
conductance and transpiration rate in pathogen-only and pathogen-galled
treatment plants resulted in less water-use and CO2 available for
photosynthesis (Lambers et al., 2008). This is seen with pathogen-only
and pathogen-galled plants having a significantly lower photosynthetic
rate, compared to the control and galled-only treatment plants. The
reduced resources available to crofton weed, as a result of pathogen
infection on the lower leaves, are used to produce new healthy leaves on
the upward vertical growth of stems, therefore leaving fewer resources
available for sideshoot growth. The new compensatory leaf growth on the
stem produces resources for reproduction, however the initial effect of

5 - 16
infection of the lower, older leaves is not completely eliminated and seed
production is still reduced by 26.7% in comparison to the control stems
(Chapter 4).
Weeds may be good invaders as they are able to have a high rate of
photosynthesis relative to water loss, and hence a high water-use
efficiency (WUE) (McDowell, 2002). Control plants had significantly higher
WUE than agent infected plants. However, there was no significant
difference in the WUE between the different types of agent infection; this
may be a result of the experiment being run in a greenhouse where water
was readily available. The results may be more variable under field
conditions, where water availability is highly variable over time (Rosskopf
et al., 1999; Morin et al., 2006, 2009).
Chlorophyll fluorescence values provide an indication of the
photochemical efficiency of photosystem II (PSII), quantifying stress on a
plant (Witkowski et al., 1992; Lambers et al., 2008; Li et al., 2008; Resco
et al., 2008; Govender et al., 2009). A healthy plant will have high
chlorophyll content and an Fv/Fm value of about 0.8 (Lambers et al., 2008;
Resco et al., 2008; Govender et al., 2009). The chlorophyll fluorescence
and chlorophyll content results further correspond with the photosynthetic
results; indicating that crofton weed is under physiological stress from both
the pathogen and fly. The top (youngest) leaves of crofton weed were not
stressed by the fly or pathogen, whilst the lower (older) leaves had
significantly lower Fv/Fm values and chlorophyll content on pathogen-only
and pathogen-galled plants. This further highlights that whilst the pathogen
negatively affects the lower leaves, crofton weed is able to compensate by
producing new leaf growth higher up on the stem that functions normally.
Ecophysiological measurements may be a good way to assess the
influence of agents on weed growth during host-specificity testing at the
beginning of a biocontrol programme, and to highlight what type of agents
will be successful. These results show that crofton weed is negatively
affected by leaf attack, and a leaf-chewer or leaf-galler may be good future

5 - 17
biocontrol agents for crofton weed. The overall interaction between the
pathogen and fly is equivalent, with both agents affecting the state of
crofton weed plants. This is important, as the fly and pathogen populations
may differ at crofton weed infestations across South Africa, depending on
the environmental conditions. Field observations indicate that neither of
the agents are controlling crofton weed in South Africa (Heystek et al.,
2011). However, they do influence the health of crofton weed, and the
infestations in South Africa may have spread quicker, or be denser, if they
had not been introduced.
5.6 Conclusion
This study highlights how we see success in biological control. Whilst the
agents may not seem to have drastic visible impacts on the vegetative
growth of crofton weed, they are inflicting stress on crofton weed at a
physiological level. However, crofton weed is able to compensate for this
stress by producing sideshoots in terms of the fly, and producing healthy
leaf growth in terms of the pathogen. Therefore, the combination of the two
agents complement each other, as the fly restricts upward growth and the
pathogen inhibits sideshoot growth. These ecophysiological results
correspond well with the laboratory and field results.

Chapter 6: Post-release evaluation of two
biocontrol agents released against
Ageratina adenophora (Asteraceae) at
three sites in South Africa.

6 - 2
6.1 Abstract
Ageratina adenophora is a multi-stemmed invasive shrub in South Africa.
Two biocontrol agents a stem gall fly, Procecidochares utilis, and a leaf-
spot pathogen, Passalora ageratinae; have been released against A.
adenophora in South Africa. This study surveyed three A. adenophora
infestations across South Africa in Barberton (Mpumalanga), Magaliesberg
(North West) and Pietermaritzburg (KwaZulu-Natal) from December 2005
to December 2006. The pathogen was present at all three field sites; and
the fly was only present at Pietermaritzburg. The infestation in Barberton
was located under dense shade from a pine forest canopy, predominantly
composed of short (100 to 1200mm high) younger plants, with little
seedling recruitment after flowering and with 30-50 stems per m2. The
infestation in Magaliesberg was along an unshaded stream bank, and was
manually cleared in June 2006. The A. adenophora population recovered
quickly after clearing, with 20-50 stems per m2, adults of 100 to 2200mm in
height and seedling recruitment after flowering. The Pietermaritzburg site,
located along a road on abandoned land, was in full sunlight and had an
established A. adenophora population, with 80 stems per m2 and stems of
100 to 2000mm in height. Ageratina adenophora above-ground biomass
per m2 was lowest at Barberton, whilst Magaliesberg and Pietermaritzburg
were similar (except after clearing), indicating that the agents may affect
the health, for example the thickness, of the stems. The pathogen was
prevalent at all three sites, infecting up to 95% of stems. However the
severity of infection was low, no more than 50% of living leaves were
infected at a time, and in general only 1-30% of leaves were infected. The
gall fly population was low in Pietermaritzburg, only 20% of stems were
galled, and repeated galling of stems was rare. Parasitism levels of the
stem gall fly were 30%. The gall fly reduced reproductive output of A.
adenophora stems, in comparison to stems only infected with the
pathogen at Pietermaritzburg. This study highlights the importance of
defining success at the start of a biocontrol programme and collecting
baseline data prior to biocontrol agent introductions, in order to evaluate

6 - 3
the efficacy of biocontrol agents. In addition this study will provide baseline
data for future studies, as investigations into new biocontrol agents for A.
adenophora in South Africa are currently underway.
6.2 Introduction
Biocontrol involves the introduction of biocontrol agents, termed natural
enemies, such as insects, mites and pathogens, from the country of origin
into the invaded country to reduce the abundance of a weed population
(McFadyen, 1998; Müller-Schärer & Schaffner, 2008). Many biocontrol
programmes have focused on the initial stages of biocontrol, such as
finding biocontrol agents, testing for host-specificity and biocontrol agent
releases, with less focus on post-release evaluations (Morin et al., 2009).
However, post-release evaluations are essential to understanding the
effectiveness of the biocontrol agents in the invaded country and
determining the success of the biocontrol programme. Invasions of the
weed may differ between different localities depending on climate, land-
use, disturbance and native species composition (Lonsdale, 1999). Agent
efficacy and establishment may also differ between localities depending
on climate and environmental conditions (Müller-Schärer & Schaffner,
2008).
Ageratina adenophora (Sprengel) King and Robinson (syn. Eupatorium
adenophorum Spreng.) (Asteraceae), also known as Crofton weed or
Mexican devil weed is a multi-stemmed perennial herb, native to Mexico,
with a woody rootstock, and stems reaching up to 2m in height (Bess &
Haramoto, 1959; Henderson, 2001; Page & Lacey 2006). Crofton weed is
invasive in many countries, including China, Thailand, Australia, New
Zealand, India and South Africa (Julien & Griffiths, 1998, Muniappan et al.,
2009). In South Africa, six of the nine provinces, KwaZulu-Natal, Western
Cape, North West, Limpopo, Mpumalanga and Gauteng, are invaded by
crofton weed (Henderson, 2001; Heystek, 2008). Crofton weed is found in
moist habitats, with high rainfall, along stream banks, roadsides, under

6 - 4
forest canopies and on steep slopes (Dodd, 1961; Henderson, 2001;
Trounce, 2003; Page & Lacey, 2006; Heystek et al., 2011).
The biological control programme of A. adenophora in South Africa has
involved the release of a stem gall fly Procecidochares utilis Stone
(Tephritidae), and a leaf-spot pathogen Passalora ageratinae Crous and
A.R. Wood (Mycosphaerellaceae) (previously named Cercospora eupatorii
Peck or Phaeoramularia sp.) (Crous et al., 2009). The stem gall fly was
released near Pietermaritzburg, KwaZulu-Natal, between 1984 and 1987
(Kluge, 1991), and more recently has been released in the Magaliesberg,
North West Province (Heystek et al., 2011). The leaf-spot fungal pathogen
was released in KwaZulu-Natal and the south-western Cape in 1987
(Morris, 1991), and later on in the Magaliesberg, North West Province
(Heystek et al., 2011). The pathogen has also been found on crofton weed
infestations in the Limpopo and Mpumalanga Provinces, even though it
was never officially released in these areas, it is assumed to have
dispersed the approximately 300km from the nearest infestation in the
Magaliesberg (Heystek et al., 2011).
No formal post-release evaluation has been done in South Africa since the
release of these two biocontrol agents; however field observations indicate
that crofton weed is spreading and has the potential to invade a larger
area than it currently does (Heystek, 2008; Heystek et al., 2011). Surveys
for additional agents have been undertaken in 2007, 2008 and 2009, and
new potential biocontrol agents are being evaluated (Heystek et al., 2011).
Little is known about the crofton weed infestations and its biocontrol agent
populations within the invaded areas of South Africa. Therefore, the aim of
this study was to undertake a post-release evaluation survey of crofton
weed, as well as its two biocontrol agents, the gall fly and leaf-spot
pathogen, within three provinces of South Africa. The objectives included
evaluating crofton weed populations in terms of stem and seedling density,
size structure, above-ground biomass and reproductive output over a year.
The biocontrol agent populations were assessed in terms of prevalence

6 - 5
and severity of infection over a year (Morin et al., 2009). In addition
parasitism of the gall fly was measured. This survey will allow for a better
understanding of the current populations and whether agents have
established, as well as provide baseline data for comparison of future
crofton weed and agent populations if new agents are to be released.
6.3 Material and methods
6.3.1 Field sites
Three A. adenophora infestations at Barberton, Magaliesberg and
Pietermaritzburg were surveyed in South Africa in December 2005, April
2006, July 2006, October 2006 and December 2006 (Fig. 6.1). The three
sites chosen are in areas of known infestations where biocontrol measures
are currently been implemented and researched.
Figure 6.1: Distribution of Ageratina adenophora (O) in South Africa. (Drawn by L.
Henderson; data source: SAPIA data base, ARC-Plant Protection Research Institute,
Pretoria), and location of three field sites, Barberton ( ), Magaliesberg ( ) and
Pietermaritzburg ( ), where A. adenophora infestations were surveyed for this study.

6 - 6
Barberton
The Barberton field site was located in the pine forests of the SAPPI
Escarpment Plantation, outside the city of Barberton, Mpumalanga
Province, South Africa (25˚37’33.8”S, 30˚46’41.9”E) (Table 6.1). The A.
Adenophora infestation was along a dirt forest road, which is typical of all
the crofton weed infestations in this area. Only the fungal pathogen, P.
ageratinae is present in the Barberton area. The field site is located on
Northern Mistbelt Forest (Zonal and Intrazonal units, Forests); within tall,
evergreen afrotemperate mistbelt forests (Mucina et al., 2006a, Mucina &
Geldenhuys, 2006). The area has high summer rainfall and dry winters
(Mucina & Geldenhuys, 2006).
Magaliesberg
Ageratina adenophora infestations in the Magaliesberg area are located
along stream embankments and in crevices within the mountain rock
formations. The Magaliesberg field site was located on the 150ha
Kloofwaters farm, in the Magaliesberg, North West Province, South Africa
(25˚50’0.25”S, 27˚26’20.9”E) (Table 6.1). Kloofwaters farm is privately
owned, and predominantly used for school camps; however a low stocking
level of cattle is present. The A. adenophora infestation was along a flat
stream embankment, facing eastwards, with only the fungal pathogen, P.
ageratinae present. The field site is on Moot Plains Bushveld (central
bushveld, Savanna Biome), with thorny savanna, dominated by Acacia
species and woodlands (Mucina et al., 2006a; Rutherford et al., 2006).
The Magaliesberg experiences summer rainfall and very dry winters with
frost (Rutherford et al., 2006). The Magaliesberg field site was manually
cleared in October 2005 and June 2006. Manual clearing involved groups
of people walking through the Magaliesberg, hand-pulling crofton weed
plants out at the root and then leaving them along the stream bank to
senesce. Manual clearing of crofton weed occurs before the flowering
period.

6 - 7
Pietermaritzburg
Many of the crofton weed infestations in the KwaZulu-Natal region are
along roadsides and abandoned land; therefore the infestations are often
manually cleared and cut by the municipality. The Pietermaritzburg field
site was located on abandoned land, on the corner of Quarry Road, Hilton,
outside the town of Pietermaritzburg, KwaZulu-Natal Province, South
Africa (29˚33’31.8”S, 30˚18’11.2”E) (Table 6.1). The A. Adenophora
infestation was along an urban road, with both the fungal pathogen, P.
ageratinae, and the gall fly, P. utilis present. The field site is on Midlands
Mistbelt Grassland (Sub-Escarpment Grassland, Grassland Biome), a hilly
landscape dominated by forb-rich, sour Themeda triandra grasslands
(Mucina et al., 2006a, 2006b). This area experiences summer rainfall and
frequent occurrences of mist (Mucina et al., 2006b).
Table 6.1: Details of three Ageratina adenophora field sites sampled from December
2005 to December 2006.
Barberton Magaliesberg Pietermaritzburg
Altitude (m ASL) 1500 1380 1195
Area of infestation (m2) 120 165 410
Aerial cover (%) 90 30 0
Mean annual rainfall (mm) (Zucchini & Nenadić, 2006)
1300 690 1233
Vegetation type (Mucina et al., 2006a)
Northern Mistbelt Forest
Moot Plains Bushveld
Midlands Mistbelt Grassland
6.3.2 Field sites soil texture and fertility
At each site five samples of soil (0cm-10cm depth) were collected and
sent for analysis of soil texture and fertility to the Soil Fertility and
Analytical Services, KwaZulu-Natal Department of Agriculture and
Environmental Affairs (Table 6.2).

6 - 8
Table 6.2: Comparison of soil texture and fertility of three Ageratina adenophora field
sites. Comparisons between the three sites were made using one-way ANOVA’s,
different superscripts within rows are significantly different, at P<0.05 (LSD). (Means ±
SE). Significant P-values are in bold.
Soil property Barberton Magaliesberg Pietermaritzburg F2,12 P-value
Texture Sandy loam Loamy sand Sandy clay loam
Clay (<0.002mm) (%) 8.4±0.68b 10.4±0.24
b 25.0±0.89
a 186.64 <0.001
Fine silt (0.02-0.002mm) (%)
14.2±1.16a 4.4±0.24
b 13.4±0.75
a 45.33 <0.001
Coarse silt & sand (0.02-2mm) (%)
77.0±1.67b 85.2±0.47
a 61.8±1.39
c 84.92 <0.001
Available P (mg/L) 2.0±0.00b 10.2±1.07
a 2.2±0.26
b 55.63 <0.001
Exchangeable K (mg/L) 110.8±1.02b 122.8±14.99
b 247.8±11.69
a 47.62 <0.001
Exchangeable Ca (mg/L)
962.2±48.32 1267.0±198.51 819.2±56.05 3.50 0.064
Exchangeable Mg (mg/L)
416.8±3.65a 378.2±26.56
a 201.6±15.58
b 41.07 <0.001
Total cations (cmol/L) 8.6±0.26ab
9.8±1.14a 6.6±0.39
b 5.05 0.026
pH (KCl) 4.6±0.01b 4.8±0.11
a 4.3±0.05
c 12.26 0.001
Total Zn (mg/L) 1.8±0.07b 7.9±1.54
a 8.8±0.43
a 16.81 <0.001
Total Mn (mg/L) 7.2±0.49b 4.2±0.66
b 38.0±2.86
a 118.25 <0.001
Total Cu (mg/L) 2.1±0.12c 4.4±0.15
b 5.3±0.27
a 77.56 <0.001
Total N (%) 0.1±0.01b 0.2±0.03
a 0.2±0.03
a 14.49 <0.001
Organic C (%) 1.8±0.06b 4.9±1.26
a 2.5±0.10
b 5.17 0.024
6.3.3 Rainfall, temperature and humidity
A mean annual rainfall value for the sites was obtained from the South
African Rainfall Atlas (Zucchini & Nenadić, 2006). Mean monthly rainfall
data for the three sites from December 2005 to December 2006 was
provided by the South African Weather Service (SAWS). Temperature and
humidity were measured every 90 minutes from December 2005 to
December 2006 at each site using Hygrochron iButtons (DS1923, Maxim
Dallis, Semiconductor Corporation). The iButtons were placed in a nearby
tree at a height of 2m and out of direct sunlight.

6 - 9
6.3.4 Field measurements
At each site, a transect of ten quadrats (1m x 1m) was taken through the
middle of the infestation, parallel to the road or river, running from one
margin of the infestation to the other side. The quadrats were placed at
equal distances from each other, with a maximum distance of 10m
between quadrats, to spread across the infestation. These were used to
measure all the traits listed below.
Density and size distribution of A. adenophora populations
As crofton weed infestations are often tangled stands of trailing and
upright stems it is difficult to distinguish individual plants, therefore
measurements were taken for individual stems that emerge upright from
the ground. Within each 1m2 quadrat the total number of stems was
counted, and the stem height of each stem was measured. A 15cm x
15cm quadrat was placed in the middle of each 1m2 quadrat and the
number of seedlings counted. Seedlings were defined as stems less than
10cm high.
Biomass of A. adenophora populations
At each site, in December 2005, April 2006, July 2006 and October 2006,
50 randomly selected stems were cut at ground level, collected and
separated into stem, live leaves and dead leaves, placed in brown bags
and brought back to the laboratory at the University of the Witwatersrand.
These were dried in a forced-draught oven at 60oC for seven days, and
weighed. The allometric relationship between stem height and total above-
ground biomass was determined by regression analyses. These
regression equations were then used to estimate the biomass of each
stem, along the transect, to calculate a measure of the above-ground
biomass at each site.

6 - 10
Reproductive output of A. adenophora populations
In July 2006 flowering had started and the number of stems with flowers
was counted at each site. In October 2006 the total number of
synflorescences per stem was counted. A subsample of five
synflorescences was randomly selected from 50 stems and the number of
capitula per synflorescence was recorded and a mean calculated.
Erasmus et al. (1992) recorded three categories of achenes: filled, empty
and aborted (shrunken and undeveloped). A subsample of 15 capitula per
stem was randomly chosen and the number of achenes in each category
per capitula counted. Very few aborted achenes were recorded; therefore
they were grouped with the empty achenes category. Empty and aborted
achenes are not viable (Erasmus et al., 1992).
The total number of filled achenes per stem was calculated as follows:
Number filled achenes/stem = (synflorescences/stem) x (mean
capitula/synflorescence) x (mean filled achenes/capitula).
The total number of germinable seeds per stem was calculated as follows:
Number germinable seeds/stem = (synflorescences/stem) x (mean
capitula/synflorescence) x (mean filled achenes/capitula) x %germination/100.
Ten filled achenes per stem were randomly selected for germination trials
to test percentage viability and germinability of achenes. Achenes for
germination trials were placed on moist Whatman No.1 filter paper in 12cm
petri-dishes and placed in a Phytotron controlled growth chamber, at the
University of the Witwatersrand, Johannesburg, set at 20oC with
continuous white light for 12 hours per 24 hours (Erasmus et al., 1992).
The filter paper was moistened daily as required, and fungi controlled by
spraying the filter paper with the fungicide Benlate. Germination of
achenes was recognised by protrusion of the radical by 2 mm, and
observed daily for 28 days. Germinated achenes were removed once they
had been recorded.

6 - 11
Prevalence and severity of P. ageratinae populations
The number of stems with and without pathogen-infected leaves was
counted within each 1m2 quadrat. Each pathogen-infected stem was
recorded as having 1-10%, 10-30%, 30-50%, 50-70% or 70-100% leaves
infected, also referred to as the level of biocontrol agent attack.
Prevalence and severity of P. utilis populations
The number of ungalled and galled stems was counted in each 1m2
quadrat. The number of galls (also referred to as the level of biocontrol
agent attack), and whether the galls were new or old (dried and withered),
was recorded for each galled stem.
Fifty galls, with intact emergence windows, were collected in April, July
and December 2006 and brought back to the laboratory at the University
of the Witwatersrand. The galls were dissected and the pupae placed on
moist cotton wool in glass vials. The number of gall flies and parasitoids
emerging from the pupae was counted.
6.3.5 Data analysis
Stem and seedling density and above-ground biomass were compared
between the three field sites across the sampling period using repeated
measures ANOVA (GLM procedure, StatSoft, 2007). Differences in the
size structure between the field sites were assessed using Kolmogorov-
Smirnov tests. One-way ANOVA and LSD tests were used to assess
differences in density and biomass measurements between sites for each
month. Regressions were used to test for relationships between stem
height and above-ground biomass of the three sites during each sample
period. Chi-squared tests were used to assess associations between the
level of parasitism and time of year, and the percentage flowering plants at
the three field sites at different times of the year. Two-way ANOVA’s were

6 - 12
used to assess the influence of site and level of biocontrol agent attack on
reproductive output variables.
6.4 Results
6.4.1 Rainfall, temperature and humidity
All three sites experience summer rainfall and dry winter months (Fig 6.2).
The temperature and relative humidity of all three sites decreases during
the winter months (Fig. 6.3). Magaliesberg tends to have higher
temperatures in comparison to the other two sites. Barberton and
Pietermaritzburg have a higher relative humidity in comparison to the
Magaliesberg field site, and these two sites experience mist frequently.
Figure 6.2: Mean monthly rainfall (mm) at the three field sites surveyed from December
2005 to December 2006. (Data provided by the South African Weather Service).

6 - 13
Figure 6.3: Monthly temperature and relative humidity at the three field sites surveyed
from December 2005 to December 2006. (Means ± SE).

6 - 14
6.4.2 Density and size distribution of A. adenophora populations
Stem density differed significantly between the sites over the year
(F2,27=13.70, P<0.001) (Fig. 6.4). In December 2005 (F2,27=4.66, P=0.018),
October (F2,27=9.30, P<0.001) and December 2006 (F2,27=9.29, P<0.001)
Pietermaritzburg had a significantly higher number of stems per m2.
Magaliesberg stem density decreased in July 2006 as a result of manual
clearing in June 2006. Seedling density differed significantly between sites
over the year (F2,27=5.11, P=0.013) (Fig. 6.4). Pietermaritzburg had a
significantly higher number of seedlings per m2 in December 2005
(F2,27=4.32, P=0.024) and December 2006 (F2,27=4.86, P=0.016) after the
flowering season.
The Kolmogorov-Smirnov tests showed that the size structure, based on
stem height distribution, differed significantly (P<0.001) between each
month for each site, and between each site, except for between April and
July at Barberton (P>0.100) and April and October at Pietermaritzburg
(P>0.100) (Fig. 6.5). Barberton had a population dominated by small
stems in December 2005, and April and July 2006. These stems continued
to make up the population in December 2006, with only a few smaller
stems growing. Magaliesberg initially had a young population, after
clearing in October 2005, which grew into taller stems in April 2006. By
July 2006 the field site had been cleared again; however not all the stems
were removed, as taller plants were still present. The Magaliesberg
infestation recovered from clearing with an increase in young stems from
October 2006. Pietermaritzburg had a recruiting population of young
(shorter) stems in December 2005. This population continued to grow until
October 2006, after which an increase in smaller plants occurred. These
smaller plants may be a result of taller plants trailing along the ground,
giving rise to new plants through sideshoot growth, and seedlings growing
after the flowering period.
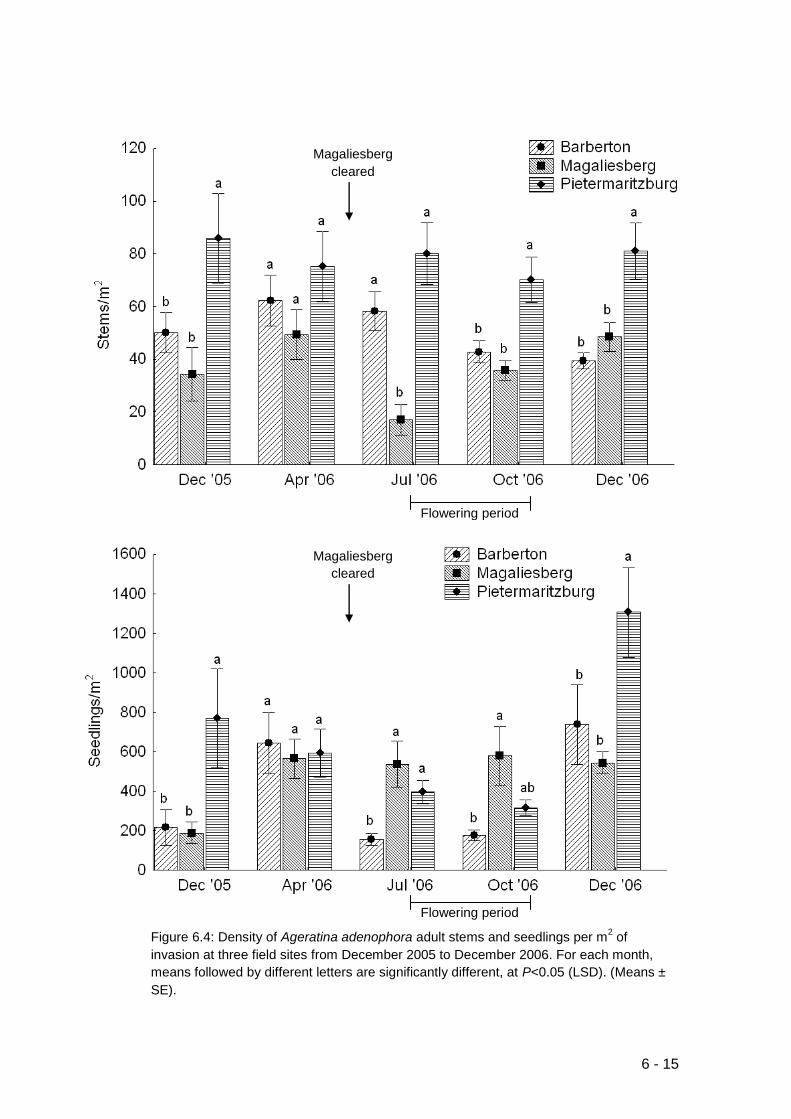
6 - 15
Figure 6.4: Density of Ageratina adenophora adult stems and seedlings per m2 of
invasion at three field sites from December 2005 to December 2006. For each month,
means followed by different letters are significantly different, at P<0.05 (LSD). (Means ±
SE).
Flowering period
Flowering period
Magaliesberg
cleared
Magaliesberg
cleared
6 - 16
Barberton Dec ‘05
Pietermaritzburg
Magaliesberg
Apr ‘06 Jul ‘06 Oct ‘06 Dec ‘06
Figure 6.5: Size structure based on stem height distribution of Ageratina adenophora infestations at three field sites from December 2005 to December 2006.
Flowering period
Magaliesberg
cleared

6 - 17
6.4.3 Biomass of A. adenophora populations
The regressions between stem height and biomass differed significantly
between sites in December 2005 (F2,207=41.20, P<0.001), and April
(F2,260=45.36, P<0.001), July (F2,256=46.59, P<0.001) and October 2006
(F2,236=24.06, P<0.001) (Fig. 6.6). The best fit for all sites during all sample
times was linear. During all sampled times stems in Magaliesberg had a
higher biomass in relation to stem height, in comparison to the other two
sites.
There was a significant difference in total above-ground biomass per m2
between sites throughout the year (F2,27=10.79, P<0.001) (Fig. 6.7). At the
Barberton field site biomass per m2 decreased from December 2005 to
October 2006. Above-ground biomass per m2 did not differ significantly
between Pietermaritzburg and Magaliesberg except for July 2006, after
clearing in the Magaliesberg.

6 - 18
Figure 6.6: The linear relationship between stem height and total above-ground biomass
of Ageratina adenophora stems at three field sites from December 2005 to October 2006.
For each month, lines followed by different letters have significantly different slopes, at
P<0.05 (LSD).
a b
c
a
b
c
a
b
c
a
b
c
December 2005
Barberton
Biomass = -1.32+0.0055*stemheight P < 0.001; R
2 = 0.821
Magaliesberg
Biomass = -1.56+0.0105*stemheight P < 0.001; R
2 = 0.807
Pietermaritzburg
Biomass = -1.43+0.0009*stemheight P < 0.001; R
2 = 0.819
April 2006
Barberton
Biomass = -0.86+0.0043*stemheight P < 0.001; R
2 = 0.843
Magaliesberg
Biomass = -1.83+0.0098*stemheight P < 0.001; R
2 = 0.887
Pietermaritzburg
Biomass = -0.73+0.0064*stemheight P < 0.001; R
2 = 0.737
July 2006
Barberton
Biomass = -0.36+0.0032*stemheight P < 0.001; R
2 = 0.802
Magaliesberg
Biomass = -2.04+0.0094*stemheight P < 0.001; R
2 = 0.876
Pietermaritzburg
Biomass = -0.31+0.0043*stemheight P < 0.001; R
2 = 0.773
October 2006
Barberton
Biomass = 0.04+0.0011*stemheight P < 0.001; R
2 = 0.675
Magaliesberg
Biomass = -0.62+0.0046*stemheight P < 0.001; R
2 = 0.782
Pietermaritzburg
Biomass = -0.33+0.0028*stemheight P < 0.001; R
2 = 0.345

6 - 19
Figure 6.7: Estimated total above-ground biomass per m2 of Ageratina adenophora stems
within three invaded sites from December 2005 to October 2006. For each month
separately means followed by different letters are significantly different, at P<0.05 (LSD).
(Means ± SE).
6.4.4 Prevalence and severity of P. ageratinae populations
The pathogen was prevalent at Pietermaritzburg, 60% to 100% of stems
had leaf-spots (Fig. 6.8). Pathogen-infected stems increased from 5% to
90% at Barberton. Pathogen prevalence was low at Magaliesberg after
manual clearing, but recovered quickly. At all three sites no more than
50% of the leaves showed leaf-spots on pathogen-infected stems (Fig.
6.9). The severity of pathogen infection was generally low, with the
majority of pathogen-infected stems only having 1-10% or 10-30% of their
leaves infected.
6.4.5 Prevalence and severity of P. utilis populations
No more than 20% of stems were galled at Pietermaritzburg throughout
the year (Fig.6.8), indicating a very low prevalence of the gall fly in crofton
weed infestations. The severity of galling on galled stems was low (Fig.
Flowering period
Magaliesberg
cleared

6 - 20
6.10). Of the galled stems, 80-95% were only galled once throughout the
year at Pietermaritzburg.
Levels of parasitism of the fly were low at Pietermaritzburg, 23% (April
2006), 33% (July 2006) and 34% (December 2006) of emerging adults
from galls being parasitoids (Table 6.3). The emerging parasitoids have
not yet been identified. There was no association between the level of
parasitism and time of year (χ2=3.52, df=5, P=0.620).
The percentage of new galls decreased as the percentage of flowering
stems increased (Fig. 6.11), which may indicate asynchrony with the host-
plant phenology.
Figure 6.8: Percentage Ageratina adenophora stems infected with the fungal pathogen
Passalora ageratinae or galled by the fly Procecidochares utilis, from December 2005 to
December 2006, at three field sites.
Flowering period
Magaliesberg
cleared

6 - 21
Barberton
Magaliesberg
Pietermaritzburg
Figure 6.9: Percentage of Ageratina adenophora pathogen-infected stems with leaves
infected with 1-10%, 10-30% or 30-50% by Passalora ageratinae, from December 2005
to December 2006, at three field sites.
Magaliesberg cleared
Flowering
period

6 - 22
Figure 6.10: Percentage Ageratina adenophora galled stems with one, two or three
Procecidochares utilis galls, from December 2005 to December 2006, at
Pietermaritzburg.
Table 6.3: Percentage of Procecidochares utilis and parasitoid adults emerging from galls
on Ageratina adenophora stems collected at Pietermaritzburg.
% of adults emerging
Gall fly Parasitoid
April 2006 77 23 July 2006 67 33 December 2006 66 34 Mean 70 30
Figure 6.11: Percentage of flowering and galled Ageratina adenophora stems, and
percentage of new Procecidochares utilis galls at Pietermaritzburg from April 2006 to
December 2006.
Flowering
period

6 - 23
6.4.6 Reproductive output of A. adenophora populations
The percentage of flowering stems was lowest at Barberton in July and
October 2006 (Table 6.4). After stems were cleared from Magaliesberg,
the percentage of flowering stems decreased from 86% to 39%. There is
an association between the percentage of flowering stems and sampling
time at the three field sites (χ2=20.16, df=5, P=0.001).
Table 6.4: Percentage of Ageratina adenophora stems flowering at three field sites in July
2006 and October 2006.
% flowering stems
July 2006 October 2006
Barberton 28 44 Magaliesberg 87 39 Pietermaritzburg 86 90
There were no flowering stems that were not infected with the pathogen
and/or galled. There were significant differences between sites and level of
biocontrol agent attack for number synflorescences/stem, number
capitula/synflorescence, number filled achenes/capitula, number empty
and aborted achenes/capitula and total number achene/capitula (Table
6.5, Table 6.6). The least number of synflorescences per stem was on
pathogen infected stems at Barberton and galled stems with 30-50%
pathogen infection at Pietermaritzburg. Pathogen infected stems at
Barberton and Magaliesberg, and galled stems with 30-50% pathogen
infection at Pietermaritzburg had the east number of capitula per
synflorescence. The number of filled and total achenes per capitula was
lowest on galled stems with 30-50% pathogen infection at Pietermaritburg.
There was no significant difference between the germinability of achenes
at the three sites (Table 6.5, Table 6.6). The number of filled achenes per
stem (potential viable achene production) and the number of germinable
achenes per stem (viable achene production) differed significantly
between sites and levels of biocontrol agent attack (Table 6.5, Fig. 6.12).
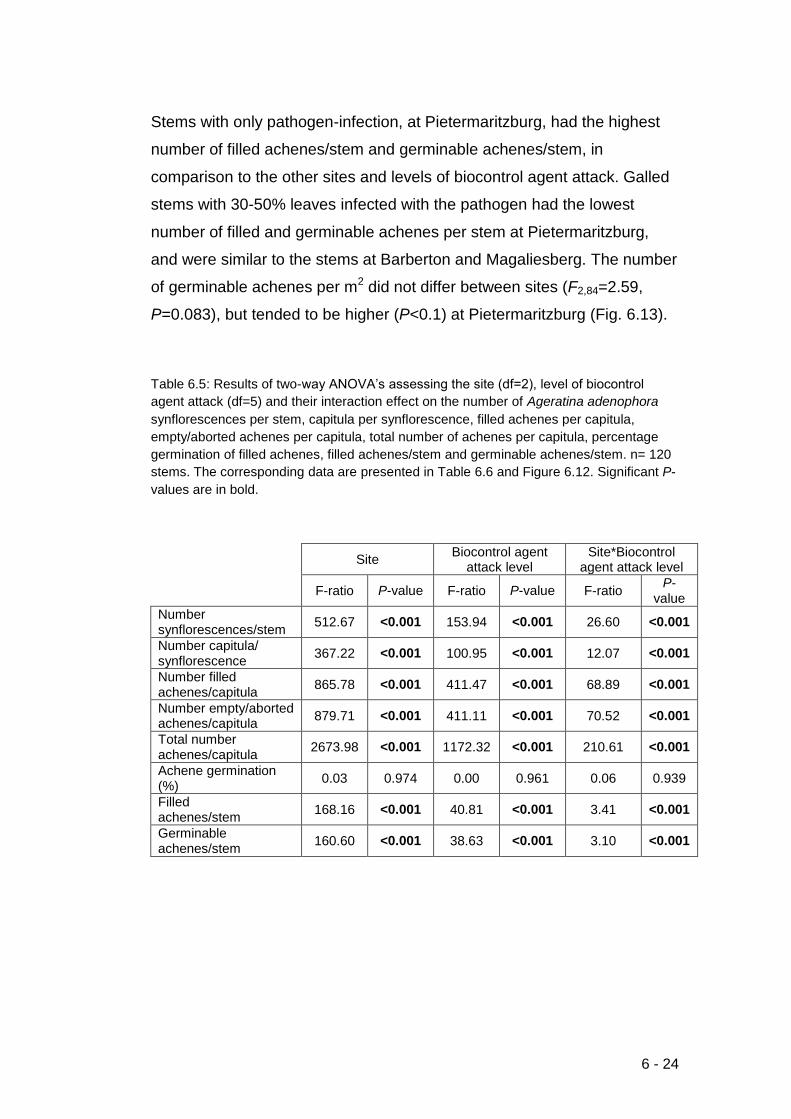
6 - 24
Stems with only pathogen-infection, at Pietermaritzburg, had the highest
number of filled achenes/stem and germinable achenes/stem, in
comparison to the other sites and levels of biocontrol agent attack. Galled
stems with 30-50% leaves infected with the pathogen had the lowest
number of filled and germinable achenes per stem at Pietermaritzburg,
and were similar to the stems at Barberton and Magaliesberg. The number
of germinable achenes per m2 did not differ between sites (F2,84=2.59,
P=0.083), but tended to be higher (P<0.1) at Pietermaritzburg (Fig. 6.13).
Table 6.5: Results of two-way ANOVA’s assessing the site (df=2), level of biocontrol
agent attack (df=5) and their interaction effect on the number of Ageratina adenophora
synflorescences per stem, capitula per synflorescence, filled achenes per capitula,
empty/aborted achenes per capitula, total number of achenes per capitula, percentage
germination of filled achenes, filled achenes/stem and germinable achenes/stem. n= 120
stems. The corresponding data are presented in Table 6.6 and Figure 6.12. Significant P-
values are in bold.
Site
Biocontrol agent attack level
Site*Biocontrol agent attack level
F-ratio P-value F-ratio P-value F-ratio
P-value
Number synflorescences/stem
512.67 <0.001 153.94 <0.001 26.60 <0.001
Number capitula/ synflorescence
367.22 <0.001 100.95 <0.001 12.07 <0.001
Number filled achenes/capitula
865.78 <0.001 411.47 <0.001 68.89 <0.001
Number empty/aborted achenes/capitula
879.71 <0.001 411.11 <0.001 70.52 <0.001
Total number achenes/capitula
2673.98 <0.001 1172.32 <0.001 210.61 <0.001
Achene germination (%)
0.03 0.974 0.00 0.961 0.06 0.939
Filled achenes/stem
168.16 <0.001 40.81 <0.001 3.41 <0.001
Germinable achenes/stem
160.60 <0.001 38.63 <0.001 3.10 <0.001

6 - 25
Table 6.6: Number of Ageratina adenophora synflorescences per stem, capitula per synflorescence, filled achenes per capitula, empty/aborted achenes
per capitula, total number of achenes per capitula and percentage germination of filled achenes at three field sites in October 2006. Different
superscripts within rows are significantly different, at P<0.05 (LSD). (Means ± SE).
Sites Barberton Magaliesberg Pietermaritzburg
Level of biocontrol agent infection 1-10%
pathogen 10-30%
pathogen 1-10%
pathogen 10-30%
pathogen 1-10%
pathogen 10-30%
pathogen 30-50%
pathogen
1-10% pathogen
1 gall
10-30% pathogen
1 gall
30-50% pathogen
1 gall Reproductive output
Number synflorescences/stem
4.4±0.30e
4.8±0.20de
5.6±0.33abc
5.4±0.38bc
6.3±0.37a
6.3±0.23a
6.1±0.33ab
5.9±0.42ab
5.9±0.47ab
4.9±0.38cde
Number capitula/ synflorescence
7.8±0.56f
8.9±0.58ef
9.8±0.79cde
8.7±0.72ef
12.2±0.94ab
13.8±1.02a
13.3±0.89a
10.7±0.82bcd
11.2±0.92bc
9.0±0.83def
Number filled achenes/capitula
63.9±0.79abc
43.9±1.10ab
40.6±1.26bcd
37.2±2.44d
45.5±1.13a
42.6±1.60ab
38.8±2.58cde
37.3±2.06de
38.8±1.49ce
36.2±1.61e
Number empty/aborted achenes/capitula
21.6±0.97a
19.8±0.77bcd
18.2±0.80ab
19.8±0.86bcd
21.2±0.73ab
21.6±0.95a
20.2±0.83abc
16.7±0.68e
17.6±0.76e
19.4±0.90cd
Total number achenes/capitula
63.9±0.79a
63.7±0.92a
58.8±1.17a
56.9±2.01b
66.7±1.07a
64.2±1.19a
59.0±2.18b
53.9±1.82c
56.4±1.40bc
55.6±1.35c
Achene germination (%)
75.8±1.16 75.8±1.13 75.9±1.15 74.7±1.11 75.9±1.04 75.6±1.11 75.5±0.92 75.5±1.46 75.5±1.15 75.4±0.92

6 - 26
Figure 6.12: Number of filled achenes and germinable achenes per Ageratina
adenophora stem in relation to six different attack levels, of pathogen infection and/or fly
galling at three field sites in October 2006. Means followed by the same letter are not
significantly different, at P<0.05 (LSD). (Means ± SE).

6 - 27
Figure 6.13: Mean total germinable achene production of Ageratina adenophora per m2 of
invasion at three field sites in October 2006. Means followed by the same letter are not
significantly different, at P<0.05 (LSD). (Means ± SE).
6.5 Discussion
Controlled laboratory and field trials showed that the gall fly is able to
restrict stem growth and the pathogen is able to inhibit sideshoot growth of
crofton weed (Chapter 2 and 3), and both biocontrol agents reduce
reproductive output and inflict stress on crofton weed at a ecophysiological
level (Chapter 4 and 5). This study showed that the crofton weed
infestations and the effect of the two agents differed at the three different
localities in South Africa. In general Pietermaritzburg had the highest stem
density and seedling recruitment in comparison to the Magaliesberg site,
which was manually cleared during the study, and the Barberton field site,
which was under a forest canopy. The pathogen was prevalent throughout
the infestations but did not severely infect individual stems. In
Pietermaritzburg the gall fly population was low, but did reduce the
reproductive output of crofton weed.

6 - 28
Disturbance is a factor that influences the potential invasibility of an area
(Lonsdale, 1999). An example of an invasive weed in South Africa is
pompom weed, Campuloclinium macrocephalum, which favours disturbed
lands such as abandoned agricultural fields, unutilised land and roadsides
(Goodall et al., 2011). Mechanical clearing of crofton weed in
Magaliesberg involves teams of people who manually pull the plant out of
the ground, thereby disturbing the area. Clearing decreased the stem
density of crofton weed infestations immediately. However, not all of the
plants were removed in July and crofton weed was able to recover rapidly,
with stem density doubling in five months. The infestation was renewed
with new young plants, which may have emerged from soil-stored seed
banks or from sideshoots rooting from trailing stems. Crofton weed seeds
require light for germination (Zhang et al., 2008; Muniappan et al., 2009);
therefore clearing taller plants may leave bare, open areas for seeds to
germinate and seedlings to grow. Mechanical removal will not be effective
on its own to control crofton weed in South Africa. Similar results have
been found in China, where large labour-intensive and expensive chemical
and mechanical control programmes have not been successful alone
(Zhang et al., 2008). Therefore, for clearing to be effective plants should
be cleared before the flowering season, and then follow-up clearing
organised for soon after the flowering period.
One of the attributes that makes crofton weed a good invader is that it is
invasive even in light-limited areas (Feng et al., 2007b). The crofton weed
infestation at Barberton was under a pine forest canopy, with low light
levels. The stems at this site were smaller than at the other two sites,
therefore whilst crofton weed may be able to grow in low light areas; its
growth may be inhibited. Even though crofton weed seeds require light for
germination, a small percentage can germinate under low light levels (Lu
et al., 2006). Seedling density was high in Barberton in December 2006,
but the number of young plants was low after flowering compared to
Magaliesberg and Pietermaritzburg; therefore the seedlings may not
survive to adult stems, or their growth may be slower.

6 - 29
Stems in Magaliesberg had a higher biomass in relation to stem height in
comparison to the other two sites. Barberton had the smallest biomass,
this may be because the stems are smaller, and more resources are
allocated to larger leaves to accommodate for low light levels rather than
to stem growth (Muniappan et al., 2009). Above-ground biomass per m2
did not differ significantly between Pietermaritzburg and Magaliesberg
(except after clearing), therefore it may be possible that both the pathogen
and gall fly have influenced the health of the crofton weed stems at
Pietermaritzburg, therefore even though they are tall stems they may be
weaker and thinner.
Pathogens can be very important in biocontrol programmes; however their
ability to control the target weed depends on the pathogen’s ability to inflict
damage and the intensity or severity of the damage caused by the
pathogen (Charudattan, 2005). Controlled field and laboratory experiments
showed that the leaf-spot pathogen does not infect more than 20-50% of
living leaves on crofton weed stems (Chapter 3 and 4). Weeds are able to
outgrow pathogen infection by increasing uninfected vegetative growth
(Charudattan, 2010). This is evident in the field surveys, where the
pathogen infects up to 90% of crofton weed stems at a time, and was able
to recover after manual clearing of crofton weed in a short time. However,
on these infected stems no more than 50% of the living leaves are
infected, and generally only up to 30% of leaves are infected at a time.
This low severity of infection, or ability of crofton weed to outgrow
pathogen infection, reduces the amount of control. In contrast, in Australia
the majority of leaves are infected, leading to severe defoliation of whole
stems (Dodd, 1961; Page & Lacey, 2006). These results in Australia were
seen during the dry season, with less damage evident in damp shaded
areas, and may be why the pathogen is less aggressive in the moist
infestations of South Africa.
The gall fly has been very successful in Hawaii, killing crofton weed plants
and clearing large infestations (Bess & Haramoto, 1959, 1972). Up to
100% of crofton weed stems were galled, with 1-7 galls per stem (Bess &

6 - 30
Haramoto, 1972). In Australia, the gall fly initially galled most stems, but
now galls less than 50% of stems in crofton weed infestations (Page &
Lacey, 2006). In China, galling levels are low with 10-37% of stems galled
(Zhang et al., 2008). In this South African survey only up to 20% of crofton
weed stems were galled at Pietermaritzburg, and of these stems most
were only galled once. These levels are not high enough for the gall fly to
be as prevalent and severe in its attack as is seen in Hawaii. In Australia
low fly populations are explained by the 30-70% parasitism levels of the
gall fly (Dodd, 1961, Page & Lacey, 2006). Parasitism of the gall fly is also
seen in China (Li et al., 2006). However, in Hawaii parasitism levels of the
gall fly reached 71-93% in the warmer months and 7-69% in the cooler
months (Bess & Haramoto, 1972). When the gall fly was initially released
in Pietermaritzburg, Bennett (1986) reported parasitism levels of 76%.
However, this survey showed only 30% parasitism of the gall fly and a
recent survey of the gall fly in the Magaliesberg also found 30% parasitism
levels (Heystek et al., 2011). In Hawaii the gall fly was less successful in
high rainfall areas (Bess & Haramoto, 1972); hence in the moist, high
rainfall areas of South African crofton weed infestations the fly may be
inhibited. An alternate explanation for low gall fly populations may be limits
imposed by host-plant phenology. The female fly lays her eggs on or near
the apical leaf bud at the tips of stems (Bennett & Van Staden, 1986),
during the flowering season these oviposition sites are not available (Li et
al., 2006). In Pietermaritzburg there was a decrease in the percentage of
new galls when the percentage of flowering stems increased. As 90% of
the crofton weed stems were flowering in October, the number of
oviposition sites available for the gall fly may be very low.
In contrast, the younger plants at Barberton had a lower percentage of
stems that flowered. Clearing at Magaliesberg did not stop the remaining
stems from flowering but the number of flowering stems was reduced by
50%. Controlled laboratory and field trials showed that galling can reduce
reproductive output by 53.8% (Erasmus et al., 1992; Chapter 4). Galled
stems at Pietermaritzburg had a reduced reproductive output, in
6 - 31
comparison to stems infected with the pathogen only. However, because
only 20% of stems were galled the number of germinable achenes per m2
was highest at Pietermaritzburg compared to the other two sites. These
results, along with laboratory and field trials, highlight the ability of the fly
to reduce reproductive output. The effect is not seen at a population level
as the fly population is low, suggesting that follow-up releases of the fly
may be needed in Pietermaritzburg, and this should also be considered
when releasing the fly at Magaliesberg and Barberton.
It is important to define what will be seen as successful biocontrol at the
start of a biocontrol programme (Hoffmann & Moran, 2008; Müller-Schärer
& Schaffner, 2008). Definitions of success can be at individual (e.g. plant
growth), population (e.g. weed density) and community (e.g. native
species composition) levels (van Klinken & Raghu, 2006). This study
highlights the importance of defining success at the beginning of the
programme. As the biocontrol of crofton weed in South Africa was a small
opportunistic programme initiated in 1984 (Kluge, 1991), success was not
defined, and baseline data on which to assess the success was not
collected. This is not uncommon in biocontrol programmes as limited time
and funding often restrict the amount of field data collected (Morin et al.,
2009). The success of biocontrol programmes does not have to be limited
to drastic reductions in the weed’s density (Hoffmann & Moran, 2008).
Based on field and laboratory experiments we do know that the agents,
individually and together, affect crofton weed growth, reproduction and
physiology at the individual plant level. Even though the area invaded by
crofton weed in South Africa is increasing (Heystek et al., 2011), without
previous infestation data it is not possible to say whether these two
biocontrol agents have been unsuccessful, as we do not know what the
situation would have been without them. Long term monitoring of weed
infestations and their biocontrol agents is necessary to understand the
efficacy of biocontrol agents (Morin et al., 2009). Monitoring the field sites
in this study over a period of more than one year, may yield more
information as to whether the infestations are increasing, if the biocontrol

6 - 32
agents are effective and if the effects of the agents at the individual level
are carried forward to the population, community and ecosystem level.
6.6 Conclusion
Crofton weed infestations differ across South Africa, with factors such as
disturbance (mechanical clearing) and light availability playing a role.
Crofton weed can grow and withstand low levels of light; in addition
mechanical clearing is not suitable as the only control option for crofton
weed. Although the pathogen was prevalent throughout the sites it did not
infect stems severely, as crofton weed was able to outgrow the infection.
The gall fly population was low in Pietermaritzburg, with a low proportion of
stems galled, and only galled once. Reasons for low fly population
numbers could include parasitism, high rainfall and phenological
asynchrony. Galling reduced reproductive output of crofton weed, but low
galling levels means this does not influence the total number of
germinable achenes at the site. It is not possible to say this biocontrol
programme has been unsuccessful as we know the agents affect crofton
weed at the individual stem level and we do not have baseline data prior to
1984 on which to make comparisons. Longer term monitoring of the sites
may yield more information as to whether the invasions are growing or
being controlled by the pathogen and fly.

Chapter 7: General discussion
7 - 2
7.1 Aims of this chapter
The aim of this chapter is to synthesise the overall findings of this thesis:
Discuss the efficacy of the fly and pathogen as biocontrol agents of
crofton weed.
Discuss the use of field and laboratory trials in predicting the efficacy of
biocontrol agents.
Discuss the post-release evaluation of the fly and pathogen on crofton
weed in South Africa, and possible future considerations when
evaluating crofton weed.
Considerations for the future of crofton weed biocontrol in South Africa.
7.2 Multiple biocontrol agents
This study evaluated the efficacy of the two biocontrol agents, a gall fly
Procecidochares utilis and a leaf spot pathogen Passalora ageratinae,
released against crofton weed in South Africa. Manipulative laboratory and
field experiments were used to assess the agents, individually and in
combination, in terms of the effect on vegetative growth (Chapter 2 and 3),
reproductive output (Chapter 4) and ecophysiological variables (Chapter
5).
Individually both the fly and pathogen affect crofton weed growth and
reproduction. The fly galls act as nutrient sinks inhibiting vertical growth of
the plant, and reduce the reproductive output by 53.8%. These effects are
particularly seen if the plant is galled more than once. However, crofton
weed compensates for this inhibited vertical growth by producing
sideshoots. These results correlate with the biomass of stems from the
field trials, with galled stems allocating more biomass to sideshoots than
bare stems and live leaves. The pathogen affects the lower leaves of the
plant, which compensates by dropping the infected leaves and producing
healthy new leaves upwardly. However, as the plant is assigning
resources to new leaf growth there are less sideshoots produced. The

7 - 3
pathogen reduces reproductive output of crofton weed stems by 26.7%. In
terms of the effect on crofton weed ecophysiology, the pathogen is the
more influential biocontrol agent, reducing the photosynthetic rate and
functioning of photosystem II of the lower (older) leaves. Neither agent
influenced the ecophysiology of the top (younger) leaves. This study did
not take a detailed look at the effect of the agents on the roots of crofton
weed plants. Initial studies, in the laboratory trials, indicated that the
agents did not affect biomass allocation to the roots, and the results are
not reported in this thesis. Future studies could examine the effect of the
agents on the roots using root chambers with glass fronts.
These two agents have been released in combination at some sites in
South Africa, therefore it is important to understand the effect of the
interaction between the fly and pathogen; a negative interaction between
the agents could hinder crofton weed biocontrol. One of the best ways to
understand the interaction between biocontrol agents is to look at the
combined effect the agents have on the target weed (Hatcher & Paul,
2001). This study used Hatcher‟s (1995) four categories of interactions
between herbivores and plant pathogens to assess the efficacy of the fly
and pathogen together on crofton weed. The laboratory trials showed an
additive interaction between the agents in terms of vegetative growth, with
the fly reducing vertical plant growth and the pathogen inhibiting sideshoot
growth. In contrast, an equivalent interaction between the fly and pathogen
was found in the field trials, with the pathogen reducing sideshoot growth,
and the fly weakening stems. The reproductive output results indicated an
equivalent interaction with the fly reducing reproductive output the most.
The interaction between the agents on crofton weed leaf physiology was
equivalent, with the pathogen causing the most damage. Therefore, the
agents are compatible, and each has an influence, and should continue to
be released together at all infestations.
This study highlights that measuring the effects of multiple agents on the
biocontrol of a target weed may not always be straightforward. In order to
accurately assess the impact of the interaction between biocontrol agents,

7 - 4
consideration needs to be given to what plant parameters are measured,
and when these measurements are taken in terms of the plant‟s life-cycle.
For example, if sideshoot growth was not measured, or if monthly
measurements had not been taken in the field and laboratory trials, the
conclusion about the efficacy of the agents in combination might be
different. In this case, the pathogen would not be seen to play a role in
crofton weed biocontrol. In addition, evaluating the influence of the agents
on the ecophysiology of crofton weed provided a better understanding of
the effect of the agents. For example, the field and laboratory trials
suggested that the pathogen does not inhibit crofton weed vertical growth.
However, the ecophysiology results shows that the vertical growth is
probably compensatory, as the pathogen affects the photosynthetic ability
of crofton weed‟s lower leaves, and therefore crofton weed compensates
for this with vertical plant growth with new healthy leaves.
The fly and pathogen do not inhibit each other in the control of crofton
weed, instead they complement each other. Overall the interaction
between the agents is equivalent, with both the agents influencing crofton
weed. The control of crofton weed by these two agents is better explained
by the cumulative model (Harris, 1985), rather than by the lottery model
(Myers, 1985, 2008). The degree to which the agents may be effective in
the field could depend on their prevalence and severity of agent infection
at crofton weed infestations, as well as the influence of environmental
conditions. The efficacy of the agents may differ during different times of
the year and at different crofton weed infestations across South Africa. In
Hawaii the fly has been very successful as it repeatedly galled, up to
seven galls per stem, and up to 100% of the stems (Bess & Haramoto,
1972). However, the fly was less successful in high rainfall areas (Bess &
Haramoto, 1959, 1972). In Australia the pathogen was more successful
during the drier months of the year and defoliated whole stems (Dodd,
1961; Page & Lacey, 2006). Therefore, both agents should be released at
all crofton weed infestations in South Africa, as they have been shown to
work together under a variety of conditions.

7 - 5
7.3 Field and laboratory trials
Very often the efficacy of biocontrol agents is evaluated under greenhouse
or laboratory conditions, rather than in the field (Raghu et al., 2006; Morin
et al., 2009). However, greenhouse conditions are not necessarily
representative of field conditions, and agent infection and efficacy can be
under- or over-estimated. This study shows how the growth of the plant
can differ between greenhouse and field conditions. The effect of the fly
and pathogen on crofton weed reproductive output was similar between
the greenhouse and field; however the vegetative growth was less in the
field trials, in comparison to predictions from the greenhouse trials. In both
trials plants were cut back to soil level, in the greenhouse stem regrowth
was over 1m in a 10 month period, and in the field stem regrowth was
65cm over 14 months. This suggests that the favourable greenhouse
conditions promote faster stem growth than seen in the field and that field
trials may need to be run for a longer period than greenhouse trials in
order to see the efficacy of biocontrol agents. In addition, once plants were
over 1m tall in the greenhouse they were difficult to maintain within plant
bags and prevent stems from breaking and trailing along the ground. In
this situation field trials are beneficial as the trials can be run for longer
and plants do not need to be maintained within bags within a limited area
of space. This is also valuable in understanding the proliferation of crofton
weed through sideshoot rooting. However, greenhouse trials can be useful
for identifying plant variables to measure within the field trials, helping to
reduce the work needed for field trials. Greenhouse trials can also be
useful at the pre-release stage of biocontrol, such as understanding the
interaction between multiple agents on a weed, and the ecophysiological
response of weeds to the biocontrol agents, and therefore have an
important role to play in biocontrol programmes.
The field trials in this study were one-sided as it was no possible to
remove the pathogen from field plants. Sine these field trials were run the
pathogen has been renamed and there may now be a fungicide available
that can be applied from an early stage, allowing for control and galled-

7 - 6
only stems to be studied in the field. Alternatively plants grown in the
greenhouse could be transplanted into the field. The field trials could then
formally assess the interaction between the fly and pathogen under field
conditions.
7.4 Post-release evaluations
The focus and funding for biocontrol programmes has predominantly been
to find biocontrol agents, test for host-specificity and release the agents,
with little attention given to the efficacy of the released agents in the field
(Morin et al., 2009). However, in order to determine the success of
biocontrol agents post-release evaluations are essential. In addition, the
efficacy of biocontrol agents is not always as drastic as was seen with the
release of the frond-feeding weevil, Stenopelmus rufinasus, against red
waterfern, Azolla filiculoides (McConnachie et al., 2004). The efficacy of
biocontrol agents may be more subtle as with the biocontrol of Opuntia
stricta with the cactus moth, Cactoblastis cactorum and the cochineal
insect, Dactylopius opuntiae (Hoffmann & Moran, 2008). Therefore, it is
very important to have pre-release baseline data of the weed infestations
and a pre-defined set of performance targets or definition of success.
These definitions and targets allow for comparison and evaluation post-
release of the agents and to define pre-release what plant parameters to
measure (Müller-Schärer & Schaffner, 2008; Morin et al., 2009). This study
highlights the limitation of defining a biocontrol programme as successful
without pre-release evaluations and targets. We now know the agents
negatively affect crofton weed, however we cannot ascertain clearly from
post-release evaluations if this effect is seen at the population level in
crofton weed infestations in South Africa. However, the laboratory and field
results together suggest that the invasion of crofton weed has been
curtailed by a small release effort.
This study shows that crofton weed and the two biocontrol agents are
established in South Africa (Chapter 6). Crofton weed infestations can

7 - 7
reach densities of 30-50 stems per m2 in Barberton, 20-50 stems per m2 in
Magaliesberg and 80 stems per m2 in Pietermaritzburg. The pathogen is
prevalent throughout the infestations but the severity of infection at the
stem level is low (up to 30% of leaves are infected). Fly populations are
low, 20% of stems are galled in Pietermaritzburg and stems are generally
only galled once. Parasitism levels are approximately 30% in
Pietermaritzburg and may play a role in the low fly population numbers.
Surveys in the Magaliesberg will provide better understanding if the fly is
more prevalent and severe in a lower rainfall area. Manual clearing of
crofton weed is not an effective control method on its own, as stem density
doubled in five months in the Magaliesberg after clearing. This study only
looked at one infestation within three Provinces of South Africa; future
studies could evaluate more infestations within the Provinces. Longer
term monitoring is also essential to collect reliable data about the
expansion of infestations and to assess the status of the surrounding
communities and ecosystem (Morin et al., 2009).
In china, a recent study has shown how biotic and abiotic factors play an
important role in the invasiveness of crofton weed (Wang et al., 2011).
Seed dispersal by wind and water currents, as well as by human activities
along transport routes play a large role in crofton weed invading new
areas and long-distance dispersal. Invasion within these areas is further
influenced by sideshoot growth from lateral stem nodes. This study is
aided by long term monitoring and information of the invaded areas.
Additional information, which was not gathered in this study, which could
help better understand the crofton weed infestations in South Africa
include soil seed bank viability and seed limitation. We know that the fly
and pathogen reduce the reproductive output of crofton weed, however
whether this extends to a population level effect is unknown as we do not
know how long crofton weed soil seed banks are viable and if crofton
weed is seed-limited. New growth could be distinguished as growth from
seeds, or sideshoots (identifiable by a rudimentary rhizome from the base
of the new „seedling‟). This will help with understanding whether the
7 - 8
recruitment of new plants in crofton weed infestations is through seeds or
sideshoot growth of older trailing stems.
7.5 Future of Ageratina adenophora biocontrol in South Africa
There is a call to reduce the number of biocontrol agents released in
biocontrol programmes to try and reduce the risks associated with
releasing ineffective organisms (Raghu et al., 2006). It has been proposed
that agents be released based on their possible efficacy versus the ease
of rearing and host-specificity testing (van Klinken & Raghu, 2006). In
order to assess the efficacy of possible agents it is necessary to
understand plant demography, ecology and response to herbivory, this
data can then be used with modelling to predict the efficacy of possible
biocontrol agents (Briese, 2006; Raghu et al., 2006). Raghu et al. (2006)
propose four “filters” to use in assessing and choosing possible biocontrol
agents. These are to determine the weak link in a plant‟s life-cycle, the
type of damage this stage is susceptible to, agents that will affect this
stage and the host range of these agents.
Whilst the fly and pathogen may exert some control over crofton weed, the
infestations of crofton weed are expanding in South Africa, but surveys for
new biocontrol agents have been undertaken, and potential biocontrol
agents include a stem-boring moth and rust fungus (Heystek et al., 2011).
Understanding if recruitment of new crofton weed plants is through seeds
or sideshoots will help with the selection of a new biocontrol agent. Based
on the success of the fly and pathogen on crofton weed in Hawaii and
Australia, death or severe weakening of crofton weed stems can lead to
effective control. However, the new agent will need to be more severe in
its attack, in comparison to the fly and pathogen, in order to achieve
control of crofton weed and inhibit compensatory growth. In addition, it is
important to take into account the interaction with the already established
fly and pathogen when selecting the new agents.

7 - 9
Until a new biocontrol agent is found it is important to increase the efforts
of the current biocontrol against crofton weed in South Africa. No follow-up
releases of the fly have occurred in Pietermaritzburg since its initial
release in the 1980‟s, further releases of the fly may increase the fly
population in Pietermaritzburg, which could improve the control of crofton
weed. In addition, the fly has recently been released in the Magaliesberg
area, from the findings in Pietermaritzburg consideration should be given
to further release efforts of the fly in this area. The fly is also not present in
the Barberton area and releases should be made there. The severity of
the pathogen infection on individual stems is low in the field. Future
studies may look into spraying an inoculum of the pathogen onto the field
infestations to investigate if it is possible to increase the severity of the
pathogen infection. This study has shown that the agents complement
each other and do affect crofton weed providing some control, therefore
until a new agent has been found the current programme should be
continued with renewed efforts.
I
References
Ainsworth, N. (2003). Integration of herbicides with arthropod biocontrol
agents for weed control. Biocontrol Science and Technology, 13, 547-
570.
Anderson, W.P. (1996). Weed science: Principles and applications 3rd ed.
West Publishing Company: New York.
Barton, J., Fowler, S.V., Gianotti, A.F., Winks, C.J., de Beurs, M., Arnold,
G.C. and Forrester, G. (2007). Successful biological control of mist flower
(Ageratina riparia) in New Zealand: Agent establishment, impact and
benefits to the native flora. Biological Control, 40, 370-385.
Bennett, P.H. (1986). An investigation into the biological control of crofton
weed, Ageratina adenophora (K. & R.) (Syn. Eupatorium adenophorum
Spreng.) by the gall fly Procecidochares utilis Stone. MSc Thesis,
University of Natal, South Africa.
Bennett, P.H. and Van Staden, J. (1986). Gall formation in crofton weed,
Eupatorium adenophorum Spreng. (syn. Ageratina adenophora), by the
Eupatorium gall fly Procecidochares utilis Stone (Diptera: Trypetidae).
Australian Journal of Botany, 34, 473-480.
Bess, H.A. and Haramoto, F.H. (1959). Biological control of pamakani,
Eupatorium adenophorum, in Hawaii by a tephritid gall fly,
Procecidochares utilis, 2. Population studies of the weed, the fly, and the
parasites of the fly. Ecology, 40, 244-249.
Bess, H.A. and Haramoto, F.H. (1972). Biological control of pamakani,
Eupatorium adenophorum, in Hawaii by a tephritid gall fly,
Procecidochares utilis, 3.Status of the weed, fly and parasites of the fly in
1966-71 versus 1950-57. Proceedings of the Hawaiian Entomological
Society, 21, 165-178.
Briese, D.T. (2006). Can an a priori strategy be developed for biological
control? The case of Onopordum spp. thistles in Australia. Australian
Journal of Entomology, 45, 317-323.

II
Broughton, S. (2000). Commentary: Review and evaluation of Lantana
biocontrol programs. Biological Control, 17, 272-286.
Buccellato, L. (2004). A post-release evaluation of the biocontrol agent, a
leaf-spot fungus, Phaeoramularia eupatorii-odorati, released against
crofton weed, Ageratina adenophora, in the Magaliesberg region of South
Africa. Unpublished Honours Dissertation, University of the
Witwatersrand, Johannesburg.
Buntin, D.G., Gilbertz, D.A. and Oetting, R.D. (1993). Chlorophyll loss and
gas exchange in tomato leaves after feeding injury by Bemisa tabaci
(Homoptera: Aleyrodidae). Journal of Economic Entomology, 86, 517-
522.
Caesar, A.J. (2000). Insect – pathogen synergisms are the foundation of
weed biocontrol. In Spencer, N.R. (Ed.), Proceedings of the X
International Symposium on Biological Control of Weeds, July 4-14,
1999. Montana State University: Montana. pp 793-798.
Caesar, A.J. (2003). Synergistic interaction of soilborne plant pathogens
and root-attacking insects in classical biological control of an exotic
rangeland weed. Biological Control, 28, 144-153.
Campanella, D.M., McEvoy, P.B. and Mundt, C.C. (2009). Interaction
effects of two biological control organisms on resistant and susceptible
weed biotypes of Chondrilla juncea in western North America. Biological
Control, 50, 50-59.
Charudattan, R., Linda, S.B., Kluepfel, M. and Osman, Y.A. (1985).
Biocontrol efficacy of Cercospora rodmanii on water hyacinth.
Phytopathology, 75, 1263-1269.
Charudattan, R. (2005). Ecological, practical, and political inputs into
selection of weed targets: What makes a good biological control target?
Biological Control, 35, 183-196.

III
Charudattan, R. (2010). A reflection on my research in weed biological
control: using what we have learned for future applications. Weed
Technology, 24, 208-217.
Clark, C.J., Poulsen, J.R., Levey, D.J. and Osenberg, C.W. (2007). Are
plant populations seed limited? A critique and meta-analysis of seed
addition experiments. The American Naturalist, 170, 128-142.
Crous, P.W., Schoch, C.L., Hyde, K.D., Wood, A.R., Gueidan, C., de
Hoog, G.S. and Groenewald, J.Z. (2009). Phylogenetic lineages in the
Capnodiales. Studies in Mycology, 64, 17-47.
Davis, A.S. (2006). When does it make sense to target the weed seed
bank? Weed Science, 54, 558-565.
Day, M.D., Broughton, S. and Hannan-Jones, M.A. (2003). Current
distribution and status of Lantana camara and its biological control
agents in Australia, with recommendations for further biocontrol
introductions into other countries. Biocontrol News and Information, 24,
63N-76N.
Denoth, M., Frid, L. and Myers, J.H. (2002). Multiple agents in biological
control: improving the odds? Biological Control, 24, 20-30.
Dodd, A.P. (1961). Biological control of Eupatorium adenophorum in
Queensland. Australian Journal of Science, 23, 356-365.
Dorchin, N., Cramer, M.D. and Hoffmann, J.H. (2006). Photosynthesis and
sink activity of wasp-induced galls in Acacia pycnantha. Ecology, 87,
1781-1791.
Erasmus, D.J., Bennett, P.H. and Van Staden, J. (1992). The effect of
galls induced by the gall fly Procecidochares utilis on vegetative growth
and reproductive potential of crofton weed, Ageratina adenophora.
Annals of Applied Biology, 120, 173-181.
Feng, Y.L., Wang, J.F. and Sang, W.G. (2007a). Irradiance acclimation,
capture ability, and efficiency in invasive and non-invasive alien plant
species. Photosynthetica, 45, 245-253.

IV
Feng, Y.L., Wang, J.F. and Sang, W.G. (2007b). Biomass allocation,
morphology and photosynthesis of invasive and noninvasive exotic
species grown at four irradiance levels. Acta oecologia, 31, 40-47.
Field, C., Merino, J. and Mooney, H.A. (1983). Compromises between
water-use efficiency and nitrogen-use efficiency in five species of
California evergreens. Oecologia, 60, 384-389.
Florentine, S.K., Raman, A. and Dhileepan, K. (2005). Effects of gall
induction by Epiblema strenuana on gas exchange, nutrients, and
energetics in Parthenium hysterophorus. BioControl, 50, 787-801.
Fowler, S.V., Syrett, P. and Hill, R.L. (2000). Success and safety in the
biological control of environmental weeds in New Zealand. Austral
Ecology, 25, 553-562.
Gardner, D.E. and Davis, C.J. (1982). The prospects for biological control
of nonnative plants in Hawaiian National Parks, Technical Report 45,
University of Hawaii at Manoa.
Goodall, J., Witkowski, E.T.F., Morris, C.D. and Henderson, L. (2011). Are
environmental factors important facilitators of pompom weed
(Campuloclinium macrocephalum) invasion in South African rangelands?
Biological Invasions, 13, 2217-2231.
Govender, M., Dye, P.J., Weiersbye, I.M., Witkowski, E.T.F. and Ahmed,
F. (2009). Review of commonly used remote sensing and ground-based
technologies to measure plant water stress. Water SA, 35, 741-752.
Harris, P. (1985). Biological control of weeds: bureaucrats, botanists,
beekeepers and other bottlenecks. In Delfosse, E.S. (Ed.), Proceedings
of the VI International Symposium on Biological Control of Weeds,
August 19-25, 1984. Agriculture Canada: Ottawa. pp 3-12.
Harris, P. and Shorthouse, J.D. (1996). Effectiveness of gall inducers in
weed biological control. The Canadian Entomologist, 128, 1021-1055.

V
Haseler, B.W. (1965). Life-history and behaviour of the crofton weed gall
fly Procecidochares utilis Stone (Diptera: Trypetidae). Australian Journal
of Entomology, 4, 27-32.
Hatcher, P. E. (1995). Three-way interactions between plant pathogenic
fungi, herbivorous insects and their host plants. Biological Reviews, 70,
639-694.
Hatcher, P. E. and Melander, B. (2003). Combining physical, cultural and
biological methods: Prospects for integrated non-chemical weed
management strategies. Weed Research, 43, 303-322.
Hatcher, P. E. and Paul, N.D. (2001). Plant pathogen-herbivore
interactions and their effects on weeds. In Jeger, M.J., Spence, N.J.
(Eds.), Biotic interactions in plant-pathogen associations. CABI
Publishing: Wallingford, UK. pp193-225.
Henderson, L. (2001). Alien weeds and invasive plants: A complete guide
to declared weeds and invaders in South Africa. ARC-PPRI, PPRI
Handbook No. 12: Pretoria.
Herrera, L.P. and Laterra, P. (2009). Do seed and microsite limitation
interact with seed size in determining invasion patterns in flooding
Pampa grasslands? Plant Ecology, 201, 457-469.
Heystek, F. (2008). Renewed biocontrol research on crofton weed
(Ageratina adenophora). Plant Protection News, 77, 15.
Heystek, F., Wood, A.R., Neser, S. and Kistensamy, Y. (2011). Biological
control of two Ageratina species (Asteraceae: Eupatorieae) in South
Africa. African Entomology, 19, 208-216.
Hilliard, O.M. (1977). Compositae in Natal. University of Natal Press:
Pietermaritzburg.
Hoffmann, J.H. and Moran, V.C. (1998). The population dynamics of an
introduced tree, Sesbania punicea, in South Africa, in response to long-

VI
term damage caused by different combinations of three species of
biological control agents. Oecologia, 114, 343-348.
Hoffmann, J.H. and Moran, V.C. (2008). Assigning success in biological
weed control: What do we really mean? In Julien, M.H., Sforza, R., Bon,
M.C., Hatcher, P.E., Hinz, H.L. and Rector, B.G. (Eds.), Proceedings of
the XII International Symposium on Biological Control of Weeds. CAB
International: Wallingford, UK. pp. 687-692.
Julien, M.H. and Griffiths, M.W. (1998). Biological control of weeds: A
world catalogue of agents and their target weeds, 4th ed. CSIRO
Entomology. CABI Publishing: Oxon.
King, A.M., Brudvig, R. and Byrne, M.J. (2011). Biological control of
dense-thorned bitter apple, Solanum sisymbriifolium Lam. (Solanaceae),
in South Africa. African Entomology, 19, 427-433.
Klein, H. (2011). A catalogue of the insects, mites and pathogens that
have been used or rejected, or are under consideration, for the biological
control of invasive alien plants in South Africa. African Entomology, 19,
515-549.
Kluge, R.L. (1991). Biological control of crofton weed, Ageratina
adenophora (Asteraceae), in South Africa. Agriculture, Ecosystems and
Environment, 37, 187-191.
Kluge, R.L. (2000). The future of biological control of weeds with insects:
No more „paranoia‟, no more „honeymoon‟. In Spencer, N.R. (Ed.),
Proceedings of the X International Symposium on Biological Control of
Weeds, July 4-14, 1999. Montana State University: Montana. pp 459-
467.
Lambers, H., Chapin, F.S. and Pons, T.L. (2008). Plant physiological
ecology. 2nd ed. Springer: New York, USA.
Land Protection. (2001). NRM Facts: Ageratina adenophora. Queensland
Government, Natural Resources and Mines: Queensland.

VII
Larson, K.C. and Whitman, T.G. (1997). Competition between gall aphids
and natural plant sinks: plant architecture affects resistance to galling.
Oecologia, 109, 575-582.
Li, A.F., Gao, X.M., Dang, W.G., Huang, R.X., Deng, Z.P. and Tang, H.C.
(2006). Parasitism of Procecidochares utilis and its effect on growth and
reproduction of Eupatorium adenophorum. Journal of Plant Ecology, 30,
496-503.
Li, H., Qiang, S. and Qian, Y. (2008). Physiological response of different
croftonweed (Eupatorium adenophorum) populations to low temperature.
Weed Science, 56, 196-202.
Lonsdale, W.M. (1999). Global patterns of plant invasions and the concept
of invasibility. Ecology, 80, 1522-1536.
Louda, S.M., Kendall, D., Connor, J. and Simberloff, D. (1997). Ecological
effects of an insect introduced for the biological control of weeds.
Science, 277, 1088-1090.
Lu, P., Sang, W. and Ma, K. (2006). Effects of environmental factors on
germination and emergence of Crofton weed (Eupatorium adenophorum).
Weed Science, 54, 452-457.
Macedo, T.B., Weaver, D.K. and Peterson, R.K.D. (2007). Photosynthesis
in wheat at the grain filling stage is altered by larval wheat stem sawfly
(Hymenoptera: Cephidae) injury and reduced water availability. Journal of
Entomological Science, 42, 228-238.
Mack, R.N., Simberloff, D., Lonsdale, W.M., Evans, H., Clout, M. and
Bazzaz, F. (2000). Biotic invasions: Causes, epidemiology, global
consequences and control. Issues in Ecology, 5, 1-18.
McConnachie, A.J., Hill, M.P and Byrne, M.J. (2004). Field assessment of
a frond-feeding weevil, a successful biological control agent of red
waterfern, Azolla filiculoides, in southern Africa. Biological Control, 29,
326-331.

VIII
McDowell, S.C.L. (2002). Photosynthetic characteristics of invasive and
noninvasive species of Rubus (Rosaceae). American Journal of Botany,
89, 1431-1438.
McEvoy, P.B. and Coombs, E.M. (2000). Why things bite back:
Unintended consequences of biological weed control. In Follett, P.A. and
Duan, J.J. (Eds.), Non-target effects of biological control. Kluwer
Academic. pp 167-194.
McFadyen, R.E.C. (1998). Biological control of weeds. Annual review of
Entomology, 43, 369-393.
Meir, P., Levy, P.E., Grace, J. and Jarvis, P.G. (2007). Photosynthetic
parameters from two contrasting woody vegetation types in West Africa.
Plant Ecology, 192, 277-287.
Moran, P.J. (2005). Leaf scarring by the weevils Neochetina eichhorniae
and N. bruchi enhances infection by the fungus Cercospora piaropi on
waterhyacinth, Eichhornia crassipes. BioControl, 50, 511-524.
Morin, L., Hill, R.L. and Matayoshi, S. (1997). Hawaii's successful
biological control strategy for mist flower (Ageratina riparia) – can it be
transferred to New Zealand? BiocontrolNews and Information, 18, 77-88.
Morin, L., Evans, K.J. and Sheppard, A.W. (2006). Selection of pathogen
agents in weed biological control: critical issues and peculiarities in
relation to arthropod agents. Australian Journal of Entomology, 45, 349-
365.
Morin, L., Reid, A.M., Sims-Chilton, N.M., Buckley, Y.M., Dhileepan, K.,
Hastwell, G.T., Nordblom, T.L. and Raghu, S. (2009). Review of
approaches to evaluate the effectiveness of weed biological control
agents. Biological Control, 51, 1-15.
Morris, M.J. (1989). Host specificity studies of a leaf spot fungus,
Phaeoramularia sp., for the biological control of crofton weed (Ageratina
adenophora) in South Africa. Phytophylactica, 21, 281-283.

IX
Morris, M.J. (1991). The use of plant pathogens for biological weed control
in South Africa. Agriculture, Ecosystems and Environment, 37, 239-255.
Moseley, C.T., Cramer, M.D., Kleinjan, C.A. and Hoffmann, J.H. (2009).
Why does Dasineura dielsi-induced galling of Acacia Cyclops not impede
vegetative growth? Journal of Applied Ecology, 46, 214-222.
Mucina, L., Rutherford, M.C. and Powrie, L.W. (2006a). Vegetation atlas of
South Africa, Lesotho and Swaziland. In Mucina, L. and Rutherford, M.C.
(Eds.), The vegetation of South Africa, Lesotho and Swaziland. South
African National Biodiversity Institute: Pretoria. pp 748-790.
Mucina, L., Hoare., D.B., Lotter, M.C., du Preez, P.J., Rutherford, M.C.,
Scott-Shaw, C.R., Bredenkamp, G.J., Powrie, L.W., Scott, L., Camp,
K.G.T, Cilliers, S.S., Bezuidenhout, H., Mostert, T.H., Siebert, S.J.,
Winter, P.J.D., Burrows, J.E. Dobson, L., Ward, R.A., Stalmans, M.,
Oliver, E.G.H., Siebert, F., Schmidt, E., Kobisi, K. and Kose, L. (2006b).
Grassland Biome. In Mucina, L. and Rutherford,M.C. (Eds.), The
vegetation of South Africa, Lesotho and Swaziland. South African
National Biodiversity Institute: Pretoria. pp 348-436.
Mucina, L. and Geldenhuys, C.J. (2006). Afrotemperate, Subtropical and
Azonal Forests. In Mucina, L. and Rutherford,M.C. (Eds.), The vegetation
of South Africa, Lesotho and Swaziland. South African National
Biodiversity Institute: Pretoria. pp 584-614.
Müller-Schärer, H. and Schaffner, U (2008). Classical biological control:
exploiting enemy escape to manage plant invasions. Biological Invasions,
10, 859-874.
Muniappan, R. and McFadyen, R. (2005). Gall-inducing arthropods in the
biological control of weeds. In Raman, A., Schaefer, C.W. and Withers,
T.M. (Eds.), Biology, Ecology, and Evolution of Gall-Inducing Arthropods.
Science Publishers Inc.: New Hampshire. Volume 1, pp 709-730.
Muniappan, R., Raman, A. and Reddy, G.V.P. (2009). Ageratina
adenophora (Sprengel) King and Robinson (Asteraceae). In Muniappan,

X
R., Reddy, G.V.P. and Raman, A. (Eds.), Biological control of tropical
weeds using arthropods. Cambridge University Press: Cambridge. pp 63-
73.
Myers, J.H. (1985). How many insect species are necessary for successful
biocontrol of weeds? In Delfosse, E.S. (Ed.), Proceedings of the VI
International Symposium on Biological Control of Weeds, August 19-25,
1984. Agriculture Canada: Ottawa. pp 77-82.
Myers, J.H. and Risley, C. (2000). Why reduced seed production is not
necessarily translated into successful biological weed control. In
Spencer, N.R. (Ed.), Proceedings of the X International Symposium on
Biological Control of Weeds, July 4-14, 1999. Montana State University:
Montana. pp. 569-581.
Myers, J.H. (2008). One agent is usually sufficient for successful biological
control of weeds. In Julien, M.H., Sforza, R., Bon, M.C., Hatcher, P.E.,
Hinz, H.L. and Rector, B.G. (Eds.), Proceedings of the XII International
Symposium on Biological Control of Weeds. CAB International:
Wallingford, UK. pp. 601-606.
Nabity, P.D., Zavala, J.A., and DeLucia, E.H. (2009). Indirect suppression
of photosynthesis on individual leaves by arthropod herbivory. Annals of
Botany, 103, 655-663.
Nel, J.L., Richardson, D.M., Rouget, M., Mgidi, T.N., Mdzeke, N., Le
Maitre, D.C., van Wilgen, B.W., Schonegevel, L., Henderson, L. and
Neser, S. (2004). A proposed classification of invasive alien plant species
in South Africa: Towards prioritising species and areas for management
action. South African Journal of Science, 100, 53-64.
Newete, S.W., Oberprieler, R.G., and Byrne, M.J. (2011). The host range
of the Eucalyptus Weevil, Gonipterus “scutellatus” Gylenhal (Coleoptera:
Curculionide) in South Africa. Annals of Forest Science, 68, 1005-1013.
Niu, H., Liu, W., Wan, F. and Liu, B. (2007). An invasive aster (Ageratina
adenophora) invades and dominates forest understories in China: altered

XI
soil microbial communities facilitate the invader and inhibit natives. Plant
Soil, 294, 73-85.
Olckers, T. (2004). Targeting emerging weeds for biological control in
South Africa: the benefits of halting the spread of alien plants at an early
stage of their invasion. South African Journal of Science, 100, 64-68.
Page, A.R. and Lacey, K.L. (2006). Economic impact assessment of
Australian weed biological control. CRC for Australian weed management
Technical Series #10, pp39.
Pearson, D.E. and Callaway, R.M. (2003). Indirect effects of host-specific
biological control agents. TREE, 18, 456-461.
Pemberton, R.W. (2000). Predictable risk to native plants in weed
biological control. Oecologia, 125, 489-494.
Peng, C., Chung, K. and Leu, W. (1998). Notes on three newly naturalised
plants (Asteraceae) in Taiwan. Taiwania, 43, 320-329.
Plant Protection News. (1987a). Crofton Weed. Plant Protection News, 7.
The Plant Protection Research Institute: Pretoria.
Plant Protection News. (1987b). Fungus against Port Jackson “Willow”.
Plant Protection News, 7. The Plant Protection Research Institute:
Pretoria.
Plant Protection News. (1988.) Fungus released against crofton weed.
Plant Protection News, 11. The Plant Protection Research Institute
Pretoria.
Pysěk, P. and Richardson, D.M. (2007). Traits associated with
invasiveness in alien plants: Where do we stand? In Nentwig, W. (Ed.),
Biological Invasions. Springer-Verlag: Berlin. pp 97-125.
Raghu, S. and Dhileepan, K. (2005). The value of simulating herbivory in
selecting effective weed biological control agents. Biological Control, 34,
265-273.

XII
Raghu, S., Wilson, J.R. and Dhileepan, K. (2006). Refining the process of
agent selection through understanding plant demography and plant
response to herbivory. Australian Journal of Entomology, 45, 308-316.
Rambuda, T.D. and Johnson, S.D. (2004). Breeding systems of invasive
alien plants in South Africa: Does Baker‟s rule apply? Diversity and
Distributions, 10, 409-416.
Rayamajhi, M.B., Pratt, P.D., Center, T.D. and Van, T.K. (2010). Insects
and a pathogen suppress Melaleuca quinquenervia cut-stump regrowth
in Florida. Biological Control, 53, 1-8.
Rejmánek, M. and Richardson, D.M. (1996). What attributes make some
plant species more invasive? Ecology, 77, 1655-1661.
Resco, V., Ignace, D.D., Sun, W., Huxman, T.E., Weltzin, J.F. and
Williams, D.G. (2008). Chlorophyll fluorescence, predawn water potential
and photosynthesis in precipitation pulse-driven ecosystems –
implications for ecological studies. Functional Ecology, 22, 479-483.
Rieder, J.P., Evans, E.W. and Durham, S.L. (2001). Distribution of insect
attacks in biological control of weeds: infestation of Centaurea virgata
flowerheads by a gall fly. Biological Control, 20, 254-260.
Ripley, B.S., Muller, E., Behenna, M., Whittington-Jones, G.M. and Hill,
M.P. (2006). Biomass and photosynthetic productivity of water hyacinth
(Eichhornia crassipes) as affected by nutrient supply and mirid
(Eccritotarus catarinensis) biocontrol. Biological Control, 39, 392-400.
Rosskopf, E.N., Charudattan, R. and Kadir, J.B. (1999). Use of plant
pathogens in weed control. In Bellows, T.S. and Fisher, T.W. (Eds.),
Handbook of biological control. Academic Press: London. pp 891-916.
Rutherford, M.C. Mucina, L., Lötter, M.C., Bredenkamp, G.J., Smit, J.H.L.,
Scott-Shaw, C.R., Hoare, D.B., Goodman, P.S., Bezuidenhout, H., Scott,
L., Ellis, F., Powrie, L.W., Siebert, F., Mostert, T.H., Henning, B.J.,
Venter, C.E., Camp, K.G.T., Siebert, S.J., Matthews, W.S., Burrows, J.E.,
Dobson, L., van Rooyen, N., Schmidt, E., Winter, P.J.D., du Preez, P.J.,

XIII
Ward, R.A., Williamson, S. and Hurter, P.J.H. (2006). Savanna biome. In
Mucina, L. and Rutherford,M.C. (Eds.), The vegetation of South Africa,
Lesotho and Swaziland. South African National Biodiversity Institute:
Pretoria. pp 438-539.
Santiago, L.S. and Wright, S.J. (2007). Leaf functional traits of tropical
forest plants in relation to growth form. Functional Ecology, 21, 19-27.
Simelane, D.O. (2006). Effect of herbivory by Teleonemia scrupulosa on
the performance of Longitarsus bethae on their shared host, Lantana
camara. Biological Control, 39, 385-391.
StatSoft, Inc. (2007). STATISTICA (data analysis software system),
version 8.0. www.statsoft.com
Stiling, P. and Cornelissen, T. (2005). What makes a successful biocontrol
agent? A meta-analysis of biological control agent performance.
Biological Control, 34, 236-246.
Thomas, M.B. and Willis, A.J. (1998). Biocontrol – risky but necessary?
TREE, 13, 325-329.
Trounce, B. (2003). Crofton weed. Agfact P7.6.36, 2nd ed. New South
Wales Agriculture.
Trujillo, E.E. (2005). History and success of plant pathogens for biological
control of introduced weeds in Hawaii. Biological Control, 33, 113-122.
Turnbull, L.A., Crawley, M.J. and Rees, M. (2000). Are plant populations
seed-limited? A review of seed sowing experiments. Oikos, 88, 225-238.
Turner, P.J., Morin, L., Williams, D.G. and Kriticos, D.J. (2010).
Interactions between a leafhopper and rust fungus on the invasive plant
Asparagus asparagoides in Australia: A case study of two agents being
better than one for biological control. Biological Control, 54, 322-330.
Urban, A.J., Simelane, D.O., Retief, E., Heystek, F., Williams, H.E. and
Madire, L.G. (2011). The invasive „Lantana camara L.‟ hybrid complex

XIV
(Verbenaceae): a review of research into its identity and biological control
in South Africa. African Entomology, 19, 315-348.
van Klinken, R.D., Kriticos, D., Wilson, J. and Hoffmann, J. (2004). Agents
that reduce seed production – essential ingredient or fools folly? In
Cullen, J.M., Briese, D.T., Kriticos, D.J., Lonsdale, W.M., Morin, L. and
Scott, J.K. (Eds.), Proceedings of the XI International Symposium on
Biological Control of Weeds. CSIRO Entomology: Australia. pp. 621-622.
van Klinken, R.D. and Raghu, S. (2006). A scientific approach to agent
selection. Australian Journal of Entomology, 45, 253-258.
van Wilgen, B.W., de Wit, M.P., Anderson, H.J., Le Maitre, D.C., Kotze,
I.M., Ndala, S., Brown, B. and Rapholo, M.B. (2004). Costs and benefits
of biological control of invasive alien plants: Case studies from South
Africa. South African Journal of Science, 100, 19-20.
van Wilgen, B.W. and De Lange, W.J. (2011). The costs and benefits of
biological control of invasive alien plants in South Africa. African
Entomology, 19, 504-514.
Wang, F., Summerell, B.A., Marshall, D. and Auld, B.A. (1997). Biology
and pathology of a species of Phaeoramularia causing a leaf spot of
crofton weed. Australian Plant Pathology, 26, 165-172.
Wang, R., Wang, J., Qiu, Z., Meng, B., Wan, F. and Wang, Y. (2011).
Multiple mechanisms underlie rapid expansion of an invasive alien plant.
New Phytologist, 191, 828-839.
Witkowski, E.T.F. (1991). Effects of invasive alien Acacias on nutrient
cycling in the coastal lowlands of the Cape Fynbos. Journal of Applied
Ecology, 28, 1-15.
Witkowski, E.T.F., Lamont, B.B., Walton, C.S. and Radford, S. (1992).
Leaf demography, sclerophyll and ecophysiology of two Banksias with
contrasting leaf life spans. Australian Journal of Botany, 40, 849-862.
Witkowski, E.T.F. and Wilson, M. (2001). Changes in density, biomass,
seed production and soil seed banks of the non-native invasive plant,

XV
Chromolaena odorata, along a 15 year chronosequence. Plant Ecology,
152, 13-27.
Wittenberg, R. and Cock, M.J.W. (2001). Invasive alien species: A toolkit
of best prevention and management practices. CABI Publishing: Oxon.
Woods, D.M., Pitcairn, M.J., Joley, D.B. and Turner, C.E. (2008). Seasonal
phenology and impact of Urophora sirunaseva on yellow starthistle seed
production in California. Biological Control, 47, 172-179.
Zachariades, C., Strathie, L.W., Retief, E. and Dube, N. (2011). Progress
towards the biological control of Chromolaena odorata (l.) R.M. King & H.
Rob.(Asteraceae) in South Africa. African Entomology, 19, 282-302.
Zhang, F., Liu, W.X., Wan, F.H. and Ellison, C.A. (2008). Sustainable
management based on biological control and ecological restoration of an
alien invasive weed, Ageratina adenophora (Asteraceae) in China. In
Julien, M.H., Sforza, R., Bon, M.C., Hatcher, P.E., Hinz, H.L. and Rector,
B.G. (Eds.), Proceedings of the XII International Symposium on Biological
Control of Weeds. CABI International: Wallingford, UK. pp. 699-703.
Zimmermann, H.G. and Neser, S. (1999). Trends and prospects for
biological control of weeds in South Africa. African Entomology Memoir
No.1, 165-173.
Zimmermann, H.G., Moran, V.C. and Hoffmann, J.H. (2004). Biological
control in the management of invasive alien plants in South Africa, and
the role of the Working for Water programme. South African Journal of
Science, 100, 34-40.
Zucchini, W. and Nenadić, O. (2006). A web-based rainfall atlas for
Southern Africa. Environmetrics, 17, 269-283.