Embed Size (px)
Citation preview

An Industrial Network Flow Information Integration Model for Supply Chain Management and Intelligent Transportation
Cheng Hsu and William A. Wallace
Decision Sciences and Engineering Systems
Rensselaer Polytechnic Institute Troy, NY 12180-3590
[email protected] and [email protected]
February, 2007
Revised April, 2007
To appear in Enterprise Information Systems

Abstract
Industrial network flow involves three domains: infrastructure, individual subjects of movement, and planning and control of the movement. Examples include supply chain and intelligent transportation. These traditionally isolated domains can be digitally connected to enhance their performance. Digitization of the infrastructure provides real-time data to facilitate its operation, while digitally connecting the subjects to the infrastructure allows for tailored services and support to particular subjects. Connection of both to the enterprise information systems enables adaptive control for the application (e.g., logistics) at a global optimization level. Previous results in the field cover separate aspects of planning/routing, real-time monitoring, and trip support. Toward this end, a new highway-based Subject-Infrastructure-Enterprise information integration model using digital connection is proposed to the field of industrial network flow control for application to intelligent transportation and supply chain management. The SIE model supports industrial network flow control in a way comparable to an adaptive control panel administering an automated material handling system. In this metaphor, the global infrastructure becomes “controllable” similar to factory conveyors and automated guided vehicles. The paper presents a conceptual design substantiated with information requirements analysis. An empirical experiment at locations in New York State shows the technical feasibility of the digital connection envisioned. Keywords global network flow, cyber-infrastructure, intelligent transportation, information integration, data fusion, RFID, wireless sensor networks

I. The Subject-Infrastructure-Enterprise Integration Approach
Digital connection is a proven approach to achieving enterprise integration, transformation, and
collaboration. To the extended enterprise of industrial network flows, such as supply chain and
intelligent transportation, digital connection entails “digitization” of the traditional infrastructure
and the users of the infrastructure by adding a digital layer to them. The digital layer can then be
connected with enterprise information systems to achieve integration, transformation, and
collaboration. Consider, in particular, wireless sensor networks and RFID (Radio Frequency
Identification) systems; which have been widely employed for environment monitoring (e.g.,
seismic study, animal habitats, and military applications), intelligent transportation systems (e.g.,
vehicle tags, rider smart cards, and rush-hour traffic control), and inventory management (see,
e.g., [1, 11, 22]). They prove to be capable of serving as real time data collectors, processors, and
even dispatchers for enterprise information systems (see, e.g., [12, 23] for techniques, and [7] for
design). The field has yet to fully explore this new class of opportunities.
One aspect of industrial network flows that stands out is highway. For example, Just-in-Time
production systems operated over a global supply chain tend to have a weak link in the freight on
highways, which could be enhanced by a new information integration enabled by new digital
connection. Previous results of highway-based network flows focus mainly on the planning of
delivery; i.e., routing, scheduling, and supply chain integration (see, e.g., [5, 6, 10, 14, 19]). The
topics of control have been studied primarily for local level monitoring and adjustment (see, e.g.,
[13, 14, 18, 21]. Compared to intra-factory network flows, such as material handling systems, the
field of inter-factory network flow control lacks reliable information on the real-time conditions
of the highways, lacks sufficient journey support for the individual subjects on the move (e.g.,
drivers, vehicles, and cargos), and lacks integration of these real-time data with enterprise
information systems (e.g., logistics, production/inventory, and infrastructure operation) - see, e.g.,
[17, 20]. A digital layer on highways could open up new designs to resolve these problems [8].
Therefore, we propose a digital layer design based on the emerging technologies to provide a
solution to support the adaptive control of industrial network flows, with a highway focus. The
digital layer effects real time information on the infrastructure (via wireless sensor networks), and
the availability of complete information on the subjects (via extended RFID capabilities). By
itself, it facilitates the operation of the infrastructure (using global or fleet data) and provision of

customized journey support to the users (through access to individual need and history). When it
is connected to enterprises databases along the global supply chain, this new capacity further
becomes an enabler for adaptive control of network flows at a global level.
A metaphoric reference point for this vision is the baggage handling system at some airports (e.g.,
the Hong Kong Airport and the I-Chon Airport of Korea) which attach an RFID label to every
piece of luggage and move them through material handling systems equipped with networks of
sensors interacting with the RFID labels. A control panel displays the status of the system, down
to the level of individual pieces of luggage, and directs their individual movement on the
conveyers to different dispatching points. This example serves as a thought model to illustrate
possible industrial network flow control. In the thought model, infrastructure works as the
conveyors and the subjects the baggage, with the network flow databases and processes
performing the control of the panel: dispatching operational decisions back to the infrastructure
and the subjects for actions, if necessary.
The above thought model is referred to in this paper as the Subject-Infrastructure-Enterprise
(SIE) model for industrial network flows. The model entails (1) adding a digital layer to the
infrastructure and the users (or, the subjects); (2) determining the information requirements for
adaptive control of the subjects (e.g., safety and journey decision support), infrastructure (e.g.,
operation), and enterprise processes (routing, scheduling, and production and inventory planning);
and (3) implementing the control through information integration over the extended enterprise of
global logistics. At present, adaptive control is feasible for air-cargos and maritime shipment.
However, open highways remain a blind spot since the infrastructure cannot be globally
monitored and operated. Without digital connection to the infrastructure, connection to the
subjects alone via, e.g., GPS, does not allow the network flow enterprises to perform globally
synchronized adaptive routing, scheduling, and journey assistance.
The technical elements of the SIE model required are available today, except for the common
standards of inter-operation among wireless sensor networks, RFID systems, and enterprise
databases. Of them, the central concern of global inter-operation under the SIE model is the
subjects that move globally, or the RFID bearers. Thus, the lack of international standard for
RFID systems is a major inhibitor to the global implementation of the SIE model. At present, a
number of national authorities exert considerable influence on the regulation and standard
development for RFID. They include USA/FCC; Canada/DOC; EU/ERO, CEPT, ETSI, etc.;

Japan/MPHPT; China/MII; Australia/AUMA; and Singapore/IDA. International standard groups
are also being organized under the auspices of the ISO and United Nations, in addition to
industrial consortia (e.g., EPCglobe). For the purpose of this paper, we consider the standards
beyond the scope of the research, and focus only on the generic design that can be implemented
by using common technologies, and promise to remain valid for working with future standards.
The SIE model is centered on the digital connection of infrastructure, subjects, and enterprises;
which, in turn, is predicated on the digitization of the infrastructure, especially the highways.
Thus, the foremost research task is the conceptual design for the implementation of the model.
Since infrastructure belongs to public domain, the design has to be consistent with the public need
of the infrastructure, especially intelligent transportation. Thus, analyzing the requirements of
intelligent transportation is a major task for the research. The remaining research tasks are
primarily the connection of wireless sensor networks with the existing operation processes of the
infrastructure, the interaction of RFID systems with the sensors, and the fusion of sensor data
with enterprise databases. These tasks are facilitated by the existing cyber-infrastructure which is
capable of transferring data between wireless sensor networks and enterprise databases. On this
basis, application-based information models could be developed to interpret raw sensor data and
thereby integrate them with enterprise data (see, e.g., [2, 3, 7, 9]).
This paper presents a complete highway-based conceptual design, along with a requirements
analysis and an experiment of the digital connection among the highways, the vehicles, and the
transportation databases, from the perspective of intelligent transportation. Specifically, the next
section, Section II, presents the highway-based conceptual SIE design, with the feasibility of the
implementation discussed in Section III. Section IV describes an empirical experiment that
deployed wireless sensor networks in some region in Upstate New York, USA to illustrate the
technical feasibility of the SIE model. Section V, the last section, concludes the paper with an
analysis of the potential benefits of the SIE model. The analysis also constitutes a research agenda
to bring about industrial network flow control using digital connection.
II Conceptual Design of the Highway-Based SIE Model
II.1 Digitization of the Highway: a new public asset
Infrastructure, including highways, is public asset controlled by national and local governments.
Therefore, enhancing highways with a digital layer would have to be considered as a public

policy and justified as such. An example is a recent I-87 Multimodal Study [20] conducted for
New York State with US Federal funding. The study proposed a “Smart Highway” vision, which
explored the concept of developing a digital layer for the I-87 highway from the perspective of
intelligent transportation. Our research further explores the vision and develops it into an enabler
for global logistics control. The general concept is depicted in Figure 1.
(Figure 1 goes about here.)
The idea of adding a digital layer to highways as public assets is simple: the digital ability
facilitates the highway authority’s operations and transportation control, the highway users’
activities, and regional economic growth. However, the same ability also facilitates logistics
control and turn highways into an integral element of global logistics models. Enterprises can
collaborate with highway authority to use the public data for their own logistics control. This way,
each enterprise’s logistics control becomes a user of the (digitized) infrastructure, which supports
any number of such concurrent users.
Figure 1 shows the basic system components of the digital layer. As a public asset, the digital
layer deployed will be integrated with the existing cyber-infrastructure, including among other
things the backbone networks and telecommunications systems. Therefore, the wireless sensor
networks will include the usual sensor nodes and central nodes, plus special nodes for
transceivers (RFID readers) and gateway nodes for connection with the cyber-infrastructure. In
the case of the New York State’s Smart Highway, the connection will be achieved through the
State’s backbone system and tier 1 providers of mobile telecommunications. A public sector
Transportation Management Center (TMC) is envisioned as the nervous center for the combined
facility of the new digital layer and the previous intelligent transportation systems. The logistics
enterprises will gain access to the logistics data from the digital layer through connection to the
TMC. The moving subjects on the highway carry RFID devices at the drivers, the vehicles, and/or
the cargo, per the requirements of the particular logistics control models in use. The information
feed from the RFID devices to the digital layer will pass through the TMC to reach the logistics
control models, which then direct the drivers through the usual channels of telecommunications to
complete the cycle of command and control. Drivers also gain journey support as the users of the
highway from the TMC and even directly from the digital layer. In the latter scenario, the
wireless sensor networks could trigger commands directed at the appropriate RFID devices, TMC
signs, or driver support portals.
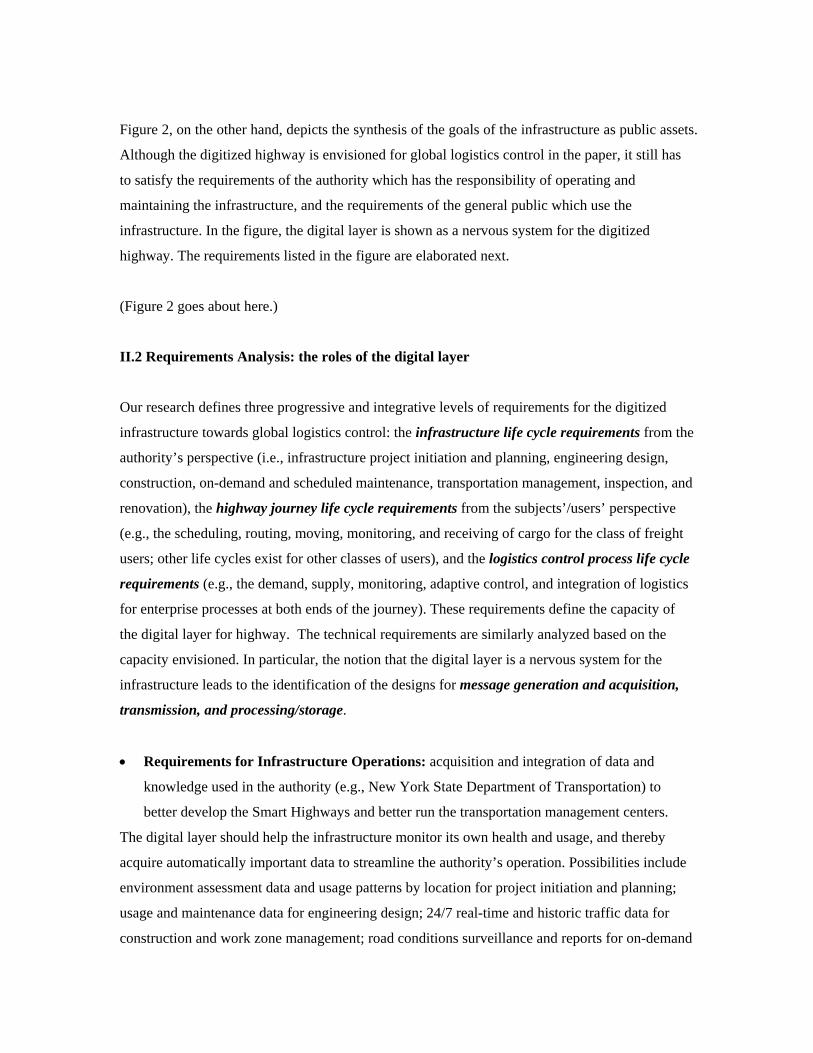
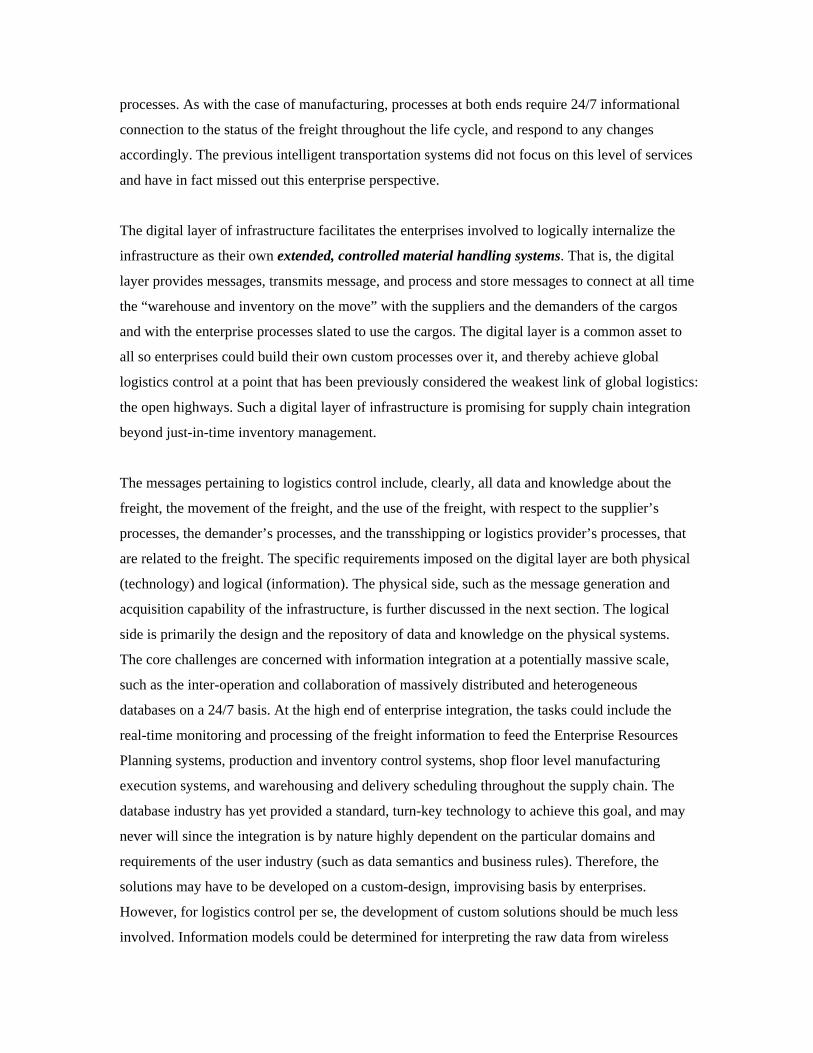
Figure 2, on the other hand, depicts the synthesis of the goals of the infrastructure as public assets.
Although the digitized highway is envisioned for global logistics control in the paper, it still has
to satisfy the requirements of the authority which has the responsibility of operating and
maintaining the infrastructure, and the requirements of the general public which use the
infrastructure. In the figure, the digital layer is shown as a nervous system for the digitized
highway. The requirements listed in the figure are elaborated next.
(Figure 2 goes about here.)
II.2 Requirements Analysis: the roles of the digital layer
Our research defines three progressive and integrative levels of requirements for the digitized
infrastructure towards global logistics control: the infrastructure life cycle requirements from the
authority’s perspective (i.e., infrastructure project initiation and planning, engineering design,
construction, on-demand and scheduled maintenance, transportation management, inspection, and
renovation), the highway journey life cycle requirements from the subjects’/users’ perspective
(e.g., the scheduling, routing, moving, monitoring, and receiving of cargo for the class of freight
users; other life cycles exist for other classes of users), and the logistics control process life cycle
requirements (e.g., the demand, supply, monitoring, adaptive control, and integration of logistics
for enterprise processes at both ends of the journey). These requirements define the capacity of
the digital layer for highway. The technical requirements are similarly analyzed based on the
capacity envisioned. In particular, the notion that the digital layer is a nervous system for the
infrastructure leads to the identification of the designs for message generation and acquisition,
transmission, and processing/storage.
• Requirements for Infrastructure Operations: acquisition and integration of data and
knowledge used in the authority (e.g., New York State Department of Transportation) to
better develop the Smart Highways and better run the transportation management centers.
The digital layer should help the infrastructure monitor its own health and usage, and thereby
acquire automatically important data to streamline the authority’s operation. Possibilities include
environment assessment data and usage patterns by location for project initiation and planning;
usage and maintenance data for engineering design; 24/7 real-time and historic traffic data for
construction and work zone management; road conditions surveillance and reports for on-demand

and regular maintenance; non-destructing, non-intrusive data collection and evaluation for
inspection; work zone monitoring, 24/7 traffic surveillance, incident reports, and computer
sign/signal systems for project control and transportation management centers; and integration of
these data for renovation of the Smart Highways. In a sense, the digital layer should facilitate its
own planning, design, construction, maintenance, inspection, control, and renovation to help the
authority’s mission. The digital layer could be likened to a map that “talks”; in the sense that each
ever-refining spot or locality on the map demands data and knowledge for its development and
functioning, while it also feeds back data and knowledge of same kind to its owner to operate it.
Therefore, the locality-identified messages become an agent of integration for the whole life cycle
of operation since tasks are traceable to these localities. At present, data collection and tasks
integration are difficult to achieve, and this problem results in high transaction cost and long
cycle time for infrastructure maintenance and development.
For instance, the New York State Department of Transportation uses different information
systems to maintain environmental impact assessments, geographical data (land, bodies of water,
etc.), initiation plans, design files, construction contracts, maintenance reports, inspection records,
and other mandated data for the operation of its projects. In addition, TMC operations add their
own computerized signs, signals, video cameras, and even Web-based systems. The digital layer
could provide location-based message feedings on a 24/7 basis to facilitate or supplement these
systems. It could add real time road conditions for maintenance and traffic data for control; even
the vehicles on the highways could, when equipped with proper sensors on board, serves as
probes for the Smart Highways to automatically generate these location-based data. Locations,
then, could provide a link to all groups within the Department, tying together different time
frames, too. In addition, an integrated life-cycle operation promises to be easier to provide
seamless support to users. Transportation management centers would become an immediate
beneficiary of the new capability, since they could use the integrated, 24/7 messages to better
coordinate with emergency services, schedule routine maintenance, and direct help trucks and
other rapid response systems.
• Requirements for Infrastructure Users: integration of journey information and driver
decision support to achieve Smart/Safe Driver and Smart Public Transportation, as well as
Smart Freight, for the general public.
The highway users include local commuters, tourists, and truckers doing transshipments. These
users are all drivers and hence have similar driver requirements: information and assistance to

enable them achieving zero-accident safety in all weather conditions, one-call/stop assistance to
personal needs of the passengers and crews, and 24/7 decision support throughout the journey.
The safety requirements and personal assistance are generic to all; however, the decision support
requirements for conducting the tasks of the journey are different, and need to be fleshed out from
the perspective of the life cycle of these tasks for each genre of users.
Safety is the first concern for all users. Safety is determined by the road conditions, the
interaction of the vehicle and the road, and the user’s ability to negotiate the road and the traffic.
The digital layer should help in providing the users with real-time information about the road and
making the delivery, assimilation, and implementation of such information automatic. That is, the
digitized infrastructure allows for direct digital connection with the vehicles and the users,
through information integration among, e.g., global positioning systems, driver information
support systems (such as On-Star), and user’s hand-held wireless devices. When vehicles are
equipped with on-board computers, they can interact directly with the road sensors and other
digital layer devices/systems; or even for the vehicles to function as mobile sensors to feed road
conditions to the digital layer. The interaction may go into the rapid response teams and help
trucks on the provider side, or into the control and maneuvering of the vehicles themselves on the
user side (trip guidance of the vehicles). When the infrastructure design dictates, the digital layer
can also complement highways that embed guiding cables, magnetic strips, or other systems to
help control the vehicle and help manage the traffic, on-demand.
Personal assistance extends the concerns for safety and includes all the services that a user
requires. The very nature of the assistance can be described as an e-business portal coupled with a
number of one-stop stations for service-telecommunication-computing along the highways. The
information-transaction portal connects the users to all kinds of service providers including
hospital, lodging, and local attractions that the extended cyber-infrastructure serves. Service-
telecommunications-computing stations, on the other hand, are physical facilities and can be
compared to an extended service station equipped with computing and telecommunicating
supports and gateways to local service providers. The global logistics control models will use
these personal assistance facilities as supplement to the usual control measures to enhance their
ability to direct the subjects and freight on a real time and adaptive basis.
The notion of 24/7 decision support for the journey goes beyond personal assistance and into
business assistance, whose nature depends on why the user makes a journey on the highways – or,

the genre of the user. The life cycle of a journey starts with its planning for the journey, followed
by executing the journey, adapting the journey as required, and completing the journey. A
common theme is to avoid traffic jams and find the optimal routes on the spot. In general, the
digital layer should help bring the journey planning decision support capabilities found in the
home and office to the vehicle for the user, by digitally connecting the user to similar capabilities
that s/he uses in home or at office. For industrial truckers of freight, the unique tasks are
characterized by business communications and monitoring associated with the freight. Similar to
the notion of the general public’s home and office on the move, the additional requirements for
industrial network flows are to enable the notion of a warehouse and inventory on the move. The
warehouse here is, of course, the vehicle, and the inventory the cargo on-board. The user here
needs ubiquitous and pervasive connection to his/her business or company networks not satisfied
by GPS and cell phone alone; and require more heightened decision support through the digital
layer of the infrastructure. One example is the handling of hazardous materials. A trucker needs
accurate, comprehensive, and on-demand information on the life cycle of the journey for situation
monitoring, exceptions handling, and, most acutely, damage control after a problem occurs. The
digital layer has to support these needs.
• Requirements for Logistic Processes and Control Activities: integration of logistic
processes and enterprise databases to achieve adaptive control of optimal routing and
scheduling, just-in-time supply, and reduction of logistics cost and cycle time.
The notion of “a warehouse and inventory on the move” is discussed above from the truckers’
perspective (the subjects). It is raised here to the level of the extended enterprise of global
logistics (the enterprises). To understand this enterprise perspective, one could compare the
infrastructure to the linkage of distributed production. The factory uses automated guided
vehicles or other material handling systems to connect physically the various workshops and
workstations within it. The Just-in-Time model of manufacturing conceptualizes highways and
railroads as the material handling systems among factories and enterprises. This model actually
accomplishes an “internalization” of public infrastructure as a part of extended enterprise
processes – i.e., enterprises rely on the public infrastructure to deliver JIT for their processes as if
it were their private material handling systems connecting the supply chain. Thus, the life cycle of
logistics from this extended enterprise view consists of the planning/initiation for the freight
between the processes that receive it (demand) and those originating (supply), the supervised and
monitored movement of the freight (transportation), the adaptive control of the freight on the
journey (change execution), and the incorporation of the cargos on the freight into the receiver’s
processes. As with the case of manufacturing, processes at both ends require 24/7 informational
connection to the status of the freight throughout the life cycle, and respond to any changes
accordingly. The previous intelligent transportation systems did not focus on this level of services
and have in fact missed out this enterprise perspective.
The digital layer of infrastructure facilitates the enterprises involved to logically internalize the
infrastructure as their own extended, controlled material handling systems. That is, the digital
layer provides messages, transmits message, and process and store messages to connect at all time
the “warehouse and inventory on the move” with the suppliers and the demanders of the cargos
and with the enterprise processes slated to use the cargos. The digital layer is a common asset to
all so enterprises could build their own custom processes over it, and thereby achieve global
logistics control at a point that has been previously considered the weakest link of global logistics:
the open highways. Such a digital layer of infrastructure is promising for supply chain integration
beyond just-in-time inventory management.
The messages pertaining to logistics control include, clearly, all data and knowledge about the
freight, the movement of the freight, and the use of the freight, with respect to the supplier’s
processes, the demander’s processes, and the transshipping or logistics provider’s processes, that
are related to the freight. The specific requirements imposed on the digital layer are both physical
(technology) and logical (information). The physical side, such as the message generation and
acquisition capability of the infrastructure, is further discussed in the next section. The logical
side is primarily the design and the repository of data and knowledge on the physical systems.
The core challenges are concerned with information integration at a potentially massive scale,
such as the inter-operation and collaboration of massively distributed and heterogeneous
databases on a 24/7 basis. At the high end of enterprise integration, the tasks could include the
real-time monitoring and processing of the freight information to feed the Enterprise Resources
Planning systems, production and inventory control systems, shop floor level manufacturing
execution systems, and warehousing and delivery scheduling throughout the supply chain. The
database industry has yet provided a standard, turn-key technology to achieve this goal, and may
never will since the integration is by nature highly dependent on the particular domains and
requirements of the user industry (such as data semantics and business rules). Therefore, the
solutions may have to be developed on a custom-design, improvising basis by enterprises.
However, for logistics control per se, the development of custom solutions should be much less
involved. Information models could be determined for interpreting the raw data from wireless

sensor networks based on the information feed into the standard databases that drive existing
logistics control systems. Then, some inter-operation protocols, including parsers, could complete
the cycle of information feed in both ways, using the information models. This information
model-centric solution approach is outlined next.
II.3 Information Integration: a methodology using a Metadatabase
The above discussion about fusing wireless sensor data into enterprise databases is summarized
below as a generic procedural methodology:
The Methodology
1. Identify the information requirements of the industrial network flow control model concerned,
including the databases in use and their information models.
2. Determine the data transfer regime and choice of technology for the interaction of RFID
devices and wireless sensor networks; such as using the sensor nodes as the RFID transceivers, of
incorporating RFID readers into the purview of central nodes.
3. Identify the possible information feed from the digital layer of the infrastructure (through
possibly the TMC and/or other authorities) into the databases.
4. Develop information models to describe the semantics of the data feeds and the feeds from the
databases into the freight driver/controller, for logistics control applications and control measures.
5. Develop protocols, procedures, and/or parsers to translate and transcribe the data feeds into the
logistics databases. Tools such as XML may be used to interact with the authority that provides
data from the digital layer.
6. Calibrate and store all information models, including those for the RFID (subjects), those for
the data feed (infrastructure), and those for the databases (enterprises), into a common schema for
semantic synthesis and logical integration.
Data fusion of the SIE model is achieved through first the interaction between RFID and wireless
sensor networks, and second the feeding of digital layer data into the logistic databases. The
common schema achieves integration for common information. The rest of the section is based on
the authors’ recent work on common schema [7], to establish the conceptual feasibility of
developing a common schema using a previously proven Metadatabase technology. The proposed
methodology is otherwise straightforward.

Common Schema is a generalization of the well-know three-schema database model from dealing
with a single database to a large collection of databases; however, the task has been proven to be
daunting. A common schema needs some ontology to provide it with structural stability and a
definitive scope of contents. The Metadatabase uses an ontology that comes directly from a class
of generic information modeling concepts that the field uses to design database. Therefore, the
ontology does not presume a comprehensive linguistics at one hand, nor a universal set of meta-
knowledge about all applications at the other; both of which are hard to acquire and hard to
maintain. The field offers a number of such modeling concepts, including Entity-Relationship-
Attribute and Object-Classification. To the extent that these concepts are applicable to all
participants and that a general methodology exists to reverse-engineer the participants’
proprietary data models into these concepts, a set of common TYPES of metadata is readily at
hand. This set is open and scalable as long as these conditions hold, and it is as simple as the
concepts themselves. This is the approach the Metadatabase follows.
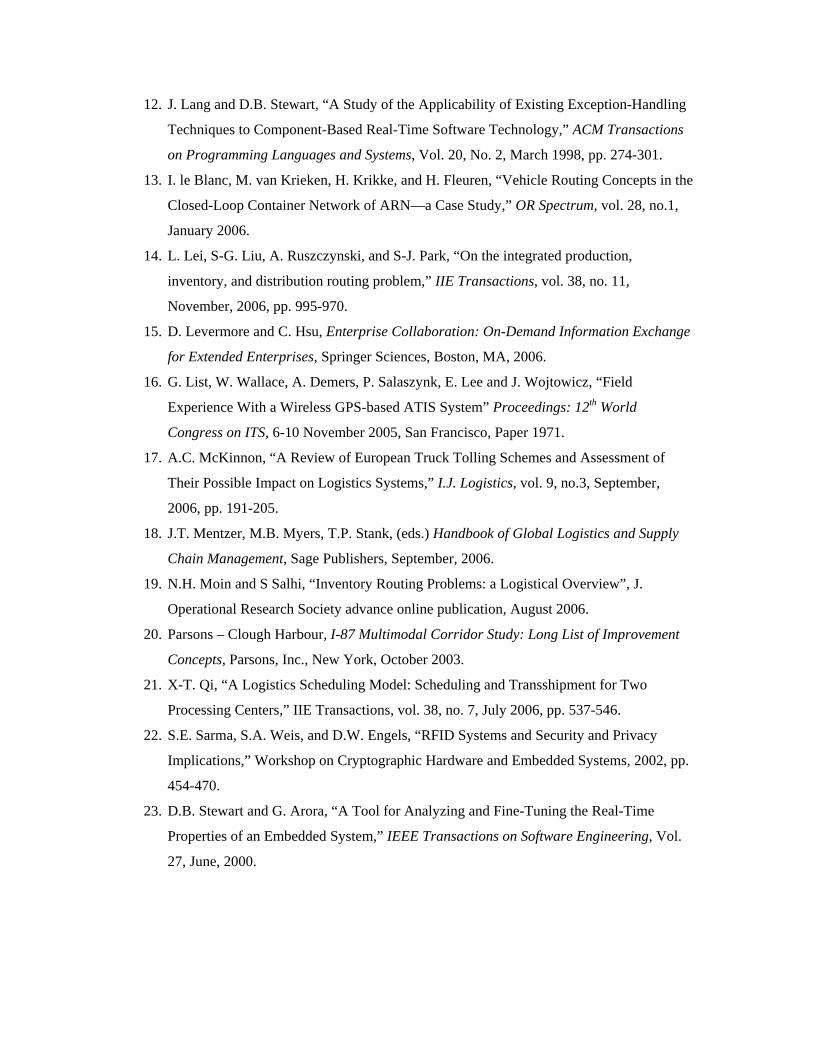
The conceptual schema of the Metadatabase is shown in Figure 3. It is based on the ontology of
an extended entity-relationship-attribute model called TSER, which encompasses the ERA and
the O-O methods with an attendant translation methodology [2, 3, 9]. Each icon in the figure
represents either a table of metadata or a particular type of integrity control rule. All metadata are
categorized into four inter-related groups: Users-Applications, Database Models, Contextual
Knowledge, and Software and Hardware Resources [9]. The Database Models group is comprised
of metadata types that define application data models for enterprises (hence, they correspond to
particular TSER modeling constructs). They include Subject (comparable to Object and View),
Entity-Relationship, and Data Item. The Contextual Knowledge is structured in terms of the
metadata types Rule, Condition, Action, Operator, and Fact. These types constitute a Rulebase
Model as a particular representation method for Rules. The Condition and Action metadata types
represent the declaration of conditions and actions for the predicates of rules, both of which are
further substantiated with Operator and Fact. Fact is corresponded to Data Items of the Database
Models, and thereby integrate it with Contextual Knowledge.
These two groups are linked, on the one direction with the aggregated definition of Users-
Applications, and on the other with Software and Hardware Resources. The User-Aplication
group is defined to represent multiple enterprises, application families, and user interface types
(including natural language input) of the Database Models and their Contextual Knowledge. The
Software and Hardware Resources group represents the local computing platforms, networking

middleware, and the particular digitization systems such as RFID systems and wireless sensor
networks, involved in the implementation design of databases and knowledge; or, the particular
SIE model design. The Equivalent meta-relationship cross-references data items from one
application data model to their equivalents in others. Together with the conversion routines
represented in Software and Hardware Resources, they achieve data semantics reconciliation for
the community. This conceptual schema defines meta-tables (of metadata) that constitute the
Metadatabase; which is implemented as a standard database for processing, and serves as the
common schema for network flow management.
(Figure 3 goes about here)
An enterprise application (participant) information model would be represented (reverse-
engineered) in terms of these concepts and saved in the Metadatabase as entries to the meta-tables.
Thus, a local model would have a constant number of entries in the Metadatabase, and the
average of these numbers for all models is a constant. When a new participant is added to the
community, a new Proxy Database Server will be fine-tuned for the participant to create a new
Local Site. The Local Site will register itself and create a TSER representation of its Export
Database(s) as new metadata entries to the Metadatabase. This process is amenable to using a
CASE tool. The Metadatabase does not need to shut down at any time during the update, since
only ordinary database operations are involved; and hence the whole community will not be
disrupted, either. Ongoing update to existing local models uses a similar process. In this sense,
the Common Schema is open and scalable, as required by the on-demand information exchange
for enterprises collaboration. (See [7] for more details of this process.)
A minimum Metadatabase design is attainable from Figure 3, to facilitate Efficient Computing on
sensors and RFID chips. That is, depending on the specific technology used for the sensor nodes,
the transceivers, and the transponders, the global Equivalent meta-table can be used as the core of
a minimum Metadatabase which can be implemented on any participating enterprises to facilitate
data transfer between them. It is also possible to decompose the Software and Hardware
Resources meta-tables of Figure 3 and include them in the Local Metadatabase to support the
onboard analytics and light databases on sensors and RFID chips. The actual design has to be
based on the implementation technology and be fine-tuned to save computing energy.

III Assessing the Technical Feasibility: Message Generation, Transmission, and
Processing/Storage for the Digital Layer of the Infrastructure
The above conceptual design provides a guideline for assessing the technology available today
for the SIE model. Since the digital layer serves as a nervous system for the infrastructure, we
could analyze its technical needs from the perspective of generating (acquiring) messages,
transmitting messages, and processing and storing messages. The analysis looks beyond the
existing cyber-infrastructure such as wired or wireless telecommunications, GPS and other
satellite-based technology, and Internet services, and focuses on new chip-based technology and
systems to garner their promises for seamlessly inter-operation among them as well as with
traditional enterprise databases and logistic information systems.
• Message Generation/Acquisition: Wireless Sensor Networks and Beyond
At the core of data acquisition technology – and hence the message generation technology – is
chip-based wireless sensor networks. This class of technology and systems has been proven in
numerous science and military applications. Their application to infrastructure, however, is still
novel. A wireless sensor network typically consists of a central node with significant computing
capacity and a large number of sensor nodes whose computing power tends to be limited by the
capacity of its battery. The chip on a sensor node performs data collection, on-board storage, and
wireless transmission to the central node, which could be further connected to enterprise
information systems. The contents of the chip are programmable and can be updated from
commands issued at the central node. Sensor nodes are rapidly becoming full-fledged processors
as the industry moves to realize the vision of a PC on a chip, and the power supply enhanced by
solar technology. It is entirely likely that sensor networks in the near future will have a database
and an operating system on board to function as a self-contained autonomous information system
capable of activating RFID devices and collaborating directly with enterprise databases.
A large number of wireless sensor networks can be deployed along major highways and their
significant limbs. Their purposes (and hence their control logic and configuration) are simply to
monitor the environment, including road conditions, and to monitor and interact with the users
and user activities. While the former can be performed by the sensor networks alone, the latter
could be enhanced by collaborating with appropriate RFID devices as well. The collaboration is
the innovation brought about by the SIE model. With the interaction with RFID devices, the
digitized infrastructure promises to not only monitor and direct the general traffic, but also

interact with the particular freight, vehicle, and cargo. The interaction could then extend from
there to enterprise databases supporting global logistics control. The specific design of the
complete system is a function of the requirements determined, as discussed above.
• Message Transmission and Inter-Operation: Chip-Based RFID
At present, infrastructure users already use any of the numerous mobile technologies to
communicate with rest of the world. However, the SIE model incorporates the entire
infrastructure into the adaptive control of logistics. From the perspective of the subjects,
automatic and non-intrusive interaction with the infrastructure for their particular need during
particular journey is the object. Therefore, the subjects need to be “digitized” beyond the usual
means of radio, GPS, and Internet services, which are non-ubiquitous and/or non-integrative with
the infrastructure. The emerging paradigm of Radio Frequency Identifier serves this purpose.
Defined in a broad and general sense, this paradigm uniquely calls for the users and user activities
to constantly and proactively report themselves to the infrastructure.
The current RFID specification is primarily a traditional bar-code on a chip embodied in a tiny,
inexpensive (a few cents a piece), label-like transponder that transmits the identifier on activation
through radio to a remote transceiver. However, chip-based RFID does not have to limit the
information contents to bar-code only and could store an entire smart card, for example, on a chip
and transmit it over radio frequency. In a broad sense, RFID devices also include technologies
that pre-code information on a chip embedded to some end-user items (engines, vehicles,
packages, containers, parts, etc.). For example, utilities companies apply RFID to their meters to
allow remote meter reading. Similarly, intelligent transportation systems also use RFID, such as
the pass to rapid transits and toll roads. As the chip technology continues to progress rapidly, an
RFID is expected to be able to store and transmit an array of data about, for instance, the whole
history of a cargo, a truck, and a driver; while it continues to miniaturize. Compared to wireless
sensor networks, an RFID device does not generate (new) data, only transmit pre-loaded data
upon activation by a reader. Technically, the only thing that separates these two classes of
technology is really the operating system on board the chip – the sensors need one while the
RFID does not. Therefore, inter-operating and even integrating these systems could be
accomplished by designing a special reader class of sensor node to accommodate RFID devices.
The design would depend on the standards used for RFID. The authorities of infrastructure might
actually become promoters of standards if they implement a digital layer along the infrastructure
that accommodates certain RFID standards.

• Message Processing/storage: Data Fusion of Messages and Enterprise Databases
The vision of a warehouse and inventory on the move involves data fusion at the wireless sensor
networks and RFID level as well as the enterprise databases level. Section II.3 discussed a
framework that serves these purpose. To be more specific, consider the needs of an international
logistics company. The global logistics control certainly involves databases at vastly distributed
localities, and it also needs to connect to their vastly distributed and heterogeneous client
databases, in order to facilitate coordination of the supply chain for the extended enterprise. The
newness of the SIE model is the further connection with the infrastructure: the data acquired by
the wireless sensor networks from the environment and by the RFID from the users and user
activities. The generic problem of databases collaboration is best handled by the industry, and
there have been increasingly powerful solutions developed by vendors. The specific data fusion
issues of the sensor networks and RFI/D, and their inter-operation with enterprise databases could
be addresses in the following manner.
The minimum requirement for data fusion is only to exchange messages obtained from sensor
networks and RFID, with data originated from enterprise databases. The methodology of Section
II.3 provides an approach for custom design without any common protocols. However, some
general protocols would help. A core element of the protocol is expected to be common metadata
that all sources subscribe to for the processing of messages and enterprise data. The definition,
structuring, and implementation of such metadata would help define an industry common
information model, which in turn would represent a major milestone for realizing the vision of the
SIE model. From the information integration perspective, a most interesting development would
be the integration of the usual database collaboration technology with that of sensor networks and
RFI/D, where an appropriate metadatabase (populated with sufficient metadata about the global
environment) would be stored on board a sensor node and a transponder. With this capacity, the
digital layer could inter-operate seamlessly with the users’ own enterprise databases and
information systems elsewhere for global logistics control, and becomes a true nervous system
satisfying all three levels of requirements: operation, user, and logistics.
Figure 4 depicts an overview of the information flow for the SIE model, and thereby culminating
the discussions in Sections II and III above. We refer to this overview the schema for the SIE
model, where the Global Network Flow Management System (GNFMS) embodies the “control
panel” thought model that we discussed in Section I.

(Figure 4 goes about here.)
As shown in the schema, we assume two classes of technology for Subjects: regular (current)
RFID chips and full-PC capable RFID nodes. In either case, the RFID systems possess own data
capability at the system (e.g., transceiver) level. Subjects connect themselves to the enterprise
databases through (a network of) Infrastructure, and all three are represented in a common
schema which may be distributed. The GNFMS node provides overall administration to the
processing and integration of the network flow information. All components use the common
cyber-infrastructure for data communication and, as available, embedded analytics support.
The whole environment, especially the digital connection for Subjects and Infrastructure, may be
developed in phases by following a progressive strategy. We discuss the strategy below.
Strategy I (Conservative): Assume that the central nodes and gateways of sensor networks and
the transceivers of the RFID systems possess PC-class computing capability or more, and can be
connected to the networks on which regular enterprise databases reside. This assumption allows
for regular Subjects (RFID only) shown in Figure 4. In this case, the implementation strategy
considers each (complete) sensor network and each (complete) RFID system as an enterprise data
source, and a common Local Site architecture will be implemented at the central sites of these
networks and systems. In fact, most sensor networks and RFID systems already manage their data
resources as databases; it is just that they need a new model such as the information model based
on the common schema (see Figure 3 and Section II.3) to treat them as enterprise-level data
sources and integrate them with the traditional enterprise databases. Strategy I can be
implemented today to facilitate the feeding of real-time enterprise data into enterprise databases
from these real-time data sources.
Strategy II (Moderate): Assume that sensor nodes and transceivers are widely distributed, and
each could possess light databases, such as the TinyDB technology for sensor nodes and the
transceiver nodes at the Toll Booths of the EZ-PASS technology. The full Subjects (RFID+DB)
shown in Figure 4 may be supported. The implementation strategy is two-fold. First, we still
implement the Local Site at the central sites and consider each complete network or system as an
enterprise data source; but second, we also represent the data models of the sensor nodes and the
distributed transceivers into a Local Metadatabase. That is, these data models, which would most

likely be homogeneous within each network or system, along with their on-board instructions that
use these local data will be represented as metadata and processed as such. This way, the central
nodes could perform queries against the distributed light databases, and to possibly update their
data-triggered rules and instructions there.
Strategy III (Aggressive): Assume that the capability of “system-on-chip” exists for sensor
nodes, distributed transceivers, and RFID chips. We further assume that their system design will
embrace a PC-class database component on the chip, along with its communication capabilities.
Finally, we assume that industrial standard exists to allow the RFID chips function as mobile
sensor nodes, and the sensor nodes transceivers. Therefore, the class of full Subjects (RFID+DB)
in Figure 4 is fully supported. As such, we will have the flexibility to consider each sensor node,
each distributed transceiver, and even each RFID chip an independent enterprise data source and
apply the Local Site architecture to it. A combination of this strategy and the above two will
become desirable when the number and heterogeneity of the myriad sensor networks and RFID
systems involved increases. This combination helps assure scalability.
The difference between these strategies (phases) is one of practicality vs. functionality. Strategy I
requires only the common RFID and wireless sensor network technology, but it does not support
full digital connection for individual Subjects with two-way interaction capabilities. Strategy III
requires new results, but offers full digital connection at the individual level. Strategy II is at the
middle of the above two, and its actual results will depend largely on the particular design of the
whole system and the particular technology used.
IV. Empirical Experiment: Interaction Between the Infrastructure and the Subject
IV.1 Settings of the experiment
The feasibility of digitizing the infrastructure to interact it with subjects was illustrated in an
experiment. Specifically, the experiment shows the conditions of Strategy I discussed above, and
proves the connection and information flow between the regular class of Subjects and road-based
Infrastructure shown in Figure 4. However, the other parts of the schema are not tested in the
experiment. This section draws from [15] to describe it. The experiment involved 200 route
guidance-equipped vehicles both acted as probes and engaged in real-time route guidance. The
geographic focus of the experiment was the Capital District ITS Testbed in upstate New York,

which comprises about 10 square kilometers and is bounded by four major highways on the west
by I-787, on the east by NYS-4, on the north by NYS-378, and on the south by I-90.
Each vehicle was equipped with a real-time route guidance package (RT-RGP), and a pocket PC
operated in conjunction with a 3G wireless card and a Bluetooth GPS device. The pocket PC
served as the platform on which CoPilot operated and around which the RT-RGP was based. The
Bluetooth capabilities were used to connect to the GPS device; and its voice production
capabilities were used to communicate the route guidance to the driver. The GPS receiver was
used to locate the vehicle and generate speed and direction of travel data. The Sprint 3G card
connected the unit to the internet to transfer data between the server and the various probe units.
The CoPilot software managed the data transmission activities and provides the route guidance.
A central server processed the incoming wireless data messages and sent out, upon request,
current travel times for the network. Data gathering and computing were merged with existing
GPS technology and navigational routing software to produce a smart route guidance system. To
help organize the travel time information, a set of virtual landmarks, called monuments, were
superimposed on the network. Travel times were tracked and estimated between monuments.
Each interaction experiment began with a new trip where the driver turned on the GPS device
(Figure 5, Arrow 1). Next the driver activated the 3G cellular card so wireless communication
capabilities could be established with the outside world. The driver then activated CoPilot so trip
planning could commence. As soon as CoPilot was live, position messages were sent every 30
seconds to the central server from the vehicle. The interval between these position messages was
adjustable and could have been set as short as every 5 seconds. Trip-related messages
commenced after the driver completed entering the destination and any intermediate stops (Arrow
2). CoPilot sent a “new route” message to the central server. That message got logged into a file
of “trip change events”. CoPilot then downloaded the current network travel times from the
server to check to see if a better path was possible based on new travel time data (Arrow 3).
CoPilot sent a “new route” message if the path changed as well as a “new route costs” message to
track changes in the estimated travel time to destination. When the trip started, CoPilot began
giving aural route guidance information to the driver. Each time a vehicle passed a monument,
CoPilot sent a “monument to monument travel time” message to the server (Arrow 4), which
indicated: the current monument that was passed, the last monument passed (or a null), the
current time, and the current GPS location.

(Figure 5 goes about here.)
The server used the monument-to-monument (M2M) travel time messages to develop up-to-date
travel times for the network (Figure 5, Step 5). Exponential smoothing was used to develop the
estimates. In batch mode, the server periodically drew new records from the M2M travel time
data table, updates the M2M travel times based on those records, and then copied the results into
a data table accessible to the vehicles. Periodically, on-board the vehicle, CoPilot queried the
server to download updated M2M travel times for the network (Arrow 6).
After the updated M2M travel times are received by the vehicle, CoPilot checks to see if there is a
new, quicker route. If so, it is selected and a “new route” message sent to the server. Similarly, if
the driver deviates from the intended route, CoPilot develops a new route, sends a “new route”
message to the server, and begins providing route guidance to the driver about how to follow the
new route. The vehicles could be tracked for logistics control by viewing their progress on a map-
based GUI. While the trip was underway, CoPilot sent several messages to the server and the
server maintained several tables in response to the messages received. All of the server data were
archived on a daily basis. The server is capable of running enterprise databases.
VI.2 Analysis of the Field Experiment
The experiment lasted from February 15 until May 15 of 2005, including 64 work days. This
section draws from [4] to show the results. Data from the field experiment came from data
generated by vehicles and stored on the server. These data verified the adequacy of the interaction
between the digitized infrastructure and the subjects, and more to the point, some of the potential
benefit of the interaction for real-time, on-the-spot logistics control.
Specifically, every trip was traced from its origin to its destination. From these data, not only is it
possible to tell exactly what path was followed, based on the GPS tracks, but also to see the
sequence of monuments, based on the M2M dataset. Moreover, travel times can be observed
between the monuments and for trips overall. The following basic classes of data were generated
and stored in the server database:
• Every 30 seconds a Vehicle Position message was sent to record every vehicle’s location over

time; it included the following data: Message Number, Probe Identity (ID), Heading, Speed,
Latitude, Longitude, Date, and Time.
• Every 60 seconds a Vehicle’s Estimated Time of Arrival (ETA) at the Destination message was
sent to record a current estimate including the Probe’s: ID, Destination, ETA, and the Time
Message was Sent.
• Every time a monument was passed a Vehicle M2M message was generated to fill a table with
the Message Number, Probe ID, Previous Monument ID, Date/Time the Previous Monument was
Passed, Current Monument ID, Date/Time the Current Monument was Passed, Next Monument
ID, Route Compliance (yes/no).
In the case of the records placed in the Vehicle M2M table, if the Route Compliance by Probe
field was 0, the driver followed the path suggested by CoPilot. If the Route Compliance by Probe
was 1, then the driver did something else. This might mean that the driver stopped at an
unplanned intermediate location, it might mean a wrong turn was taken, or it might mean the
recommended path was simply not followed. Only the records with a Route Compliance by Probe
value of 0 were used to update the M2M travel times. The server generated and saved the
following data based on the messages received:
• Vehicle Travel Times: Probe ID, From Monument ID, To Monument ID, Travel Time between
Monuments, Current Time (This is a log of the travel times between the monuments.)
• M2M: From Monument ID, To Monument ID, Nominal Travel Time between the From and To
Monuments, Estimated Travel Time between the From and To Monuments, Number of Vehicles
included in Travel Time Estimate (This is the working table of travel time estimates. It is updated
every time that a new monument-to-monument message is received.)
• M2M History: From Monument ID, To Monument ID, Estimated Travel Time between the
From and To Monuments, Current Date and Time (This table is a log of estimated travel times for
each monument pair.)
A number of measures in this experiment indicate the performance of the interaction between the
digitized infrastructure and the subjects. They include the following:
Link travel times: The most common travel time intensity on freeways for the through move is 20
sec/km. For the right turn and left turn ramp it is 40 sec/km. The distributions also have little
variance – see Figure 6. Figure 7 is similar in that it shows the travel time intensities for three

movements in the arterial network. The modes of the travel time intensities are 60 sec/km for the
through, 55 for the right, and 85. These numbers are consistent with the requirements of tracking
for logistics control.
(Figures 6 and 7 go about here.)
GPS cross-correlation: It relates the GPS tracks to the Vehicle M2M records. The GPS tracks are
generated every 30 seconds via the Vehicle Position message while the M2M records are created
every time a vehicle passes a monument. Figure 8 shows how these two sets of data relate to one
another, and hence verifies that wireless sensor networks can be coordinated with GPS for
logistics control. The locations of the monuments in the physical network are shown in the map in
the left-hand portion of Figure 8 (blue boxes with numbers below). The GPS track based on the
Vehicle Position messages (latitude and longitude) is shown in the right-hand portion of the
figure. The dotted lines show how the M2M records link to the GPS tracks. The value in creating
these cross-correlations is that the GPS tracks can help the analyst understand exactly what the
vehicle did between the monument pair. Then it may be easier to understand why the driver did
not comply with the route guidance provided.
(Figure 8 goes about here.)
V. Conclusion: Progressive Applications and Benefits
A new highway-based Subject-Infrastructure-Enterprise information integration model is
proposed to the field of industrial network flow control for application to intelligent
transportation and supply chain management. The novelty of the model is digital connection,
comprising the addition of a digital layer to the infrastructure and the integration of the digital
layer with the enterprise information systems of global logistics. A conceptual design is presented
for implementing the SIE model for highways (Sections II and III), which is completed with an
empirical experiment of some key concepts (Sections IV). The new concepts, including the
digital layer for infrastructure, the requirements analysis for smart highways (intelligent
transportation), and the SIE information integration, are contributions of the paper.
The paper also presents a few possibilities of major applications of the digital layer as a new
public asset, to illustrate its potential benefits to the public.

• Benefits to the Operations of the Infrastructure
The layer of wireless sensor networks per se would provide stored sensor data to facilitate the
infrastructure operation life cycle tasks at the highway authorities. The benefits are primary the
reduction of transaction cost and cycle time for certain data acquisition tasks. When the digital
layer connects to transportation information systems, then it could provide real-time sensor data
feeds to such applications as real-time driver guidance to improve safety. New variable
programmable text signs could be added to each ramp, on each bridge, and at all locations of high
risks of incidents, to feed on these sensor data. Further connection with GPS and geographic
information systems promises to proactively assist drivers and manage traffic in all weather, all
road conditions, and all year round. The connection also promises to support on-demand
maintenance and other infrastructure operations by the authorities.
• Benefits to Infrastructure Users: integrated freight services and hazardous material
monitoring
When subjects are digitized as well, with RFID and vehicle-embedded wireless computing
devices, they could interact with the digital layer of the infrastructure. Sensor nodes could serve
as transceivers to bring about direct, ubiquitous support to the users. Consider, in particular,
customized roadside services. Current public systems (e.g., 911) do not have data concerning the
particular vehicles, drivers, and cargos that they try to assist or handle, while private services (e.g.,
On-Star) do not connect to real-time conditions on the road and traffic. Moreover, all such
systems require the users to call to activate the services, and yet radio communications may not
work in all areas under all weather conditions. Therefore, an RFID system that stores the
owner/driver information and the cargo/vehicle information for activation by sensor networks,
which provide real-time conditions, will fill in the gaps. In some extreme cases, emergency
services may proactively reach out to the driver if the sensor networks detected incidents. Value-
added service centers could be developed for users and firms, including logistics providers.
The same technology and systems can monitor freight for hazardous materials monitoring.
From the public safety perspective, RFID may be required of cargos as well as vehicles. In the
event of incidents, the response teams can act quickly on the data about the hazardous materials,
the vehicles, and the origins and destinations, as well as the precise locations of the incidents.

• Benefits to Logistics: adaptive global routing, supply chain scheduling, and fast public
security checking
When the sensor network data and RFID information are fused with enterprise information
systems, the infrastructure would become a controllable of the network flow model, as discussed
in Section 1 for the concept of a “control panel”. Previous measures of logistics control rely on,
e.g., GPS and radio communications to adjust routing, which lack reliable information about the
choices, such as the conditions of all alternate routes at the time, to really make optimal decision
even just locally. The SIE model avails infrastructure information for conducting adaptive
logistics control at a global optimization level. Besides, the model also makes it possible to
connect logistics to production planning and control (i.e., the “warehouse-inventory on the move”
notion) across the supply chain, and thereby reduce the transaction cost and cycle time of the
whole extended enterprise. This is the purpose of connecting the infrastructure, the subjects of
shipment, and the enterprise information systems.
The digital connection can be further extended to include such public sector databases as
transportation management, national security control, and law enforcement to reap additional
benefits for both the public and the logistics industry. In particular, the SIE model promises to
facilitate security check at the roadside and the boarder crossings by providing real-time
comprehensive information on the drivers/passengers, the vehicles, and the cargos. The
federally mandated Commercial Vehicle Information Systems and Networks (CVISN) program in
the U.S. represents a harbinger to this concept.
Continuing work will focus on the engineering design and empirical investigation of the SIE
model. The particular control models and algorithms for particular intelligent transportation
systems, supply chain integration, and logistics using the SIE model will also be a major topic of
the research in the next phase. In addition, related scientific topics, including, information
integration and intelligent transportation, represent the next possibilities of new formulation using
the SIE concept. An interesting example is the connection of the digital layer with emerging
automatic vehicle guidance technology. The vehicle guidance systems could be some embedded
guidance cables on the designated lanes, or use on-board sensing and computing systems to
interact with the digitized infrastructure to adapt, by human drivers or by the on-board control
systems, their movement. The added capability allows virtual configuration of highway traffics,
such as separating the fast lanes designated for freights from the regular users. The designation of

the fast lanes could be adaptive and on-demand, and constitute a virtual rapid transit on the
highway, as illustrated in Figure 1.
References
1. I.F. Akyildiz, W. Su, Y. Sankarasubramaniam, and E. Cayirci, “Wireless Sensor
Networks: A Survey,” Computer Networks, vol. 38, 2002, pp. 393-422.
2. G. Babin and C. Hsu, "Decomposition of Knowledge for Concurrent Processing," IEEE
Transactions on Knowledge and Data Engineering, vol. 8, no. 5, 1996, pp 758-772.
3. W. Cheung and C. Hsu, "The Model-Assisted Global Query System for Multiple
databases in Distributed Enterprises," ACM Transactions on Information Systems, vol. 14,
no. 4, 1996, pp 421-470.
4. A. Demers, G.F. List, W. A. Wallace, E. Lee, and J. Wojtowicz, “Probes as Path
Seekers” Transportation Research Record: Journal of the Transportation Research Board,
No. 1944, TRB, National Research Council, Washington, DC, 2006, pp.107-114.
5. K.N. Gourdin, Global Logistics Management: a Competitive Advantage for the 21st
Century, Blackwell publishing, 2006.
6. S.E. Grasman, “Dynamic Approach to Strategic and Operational Multimodal Routing
Decisions,” I.J. Logistics Systems and Management, vol.2, no.1, 2006, pp. 96-106.
7. C. Hsu, D. Levermore, C. Carothers, and G. Babin, “Enterprise Collaboration: On-
Demand Information Exchange Using Enterprise Databases, Wireless Sensor Networks,
and RFID Systems”, to appear in IEEE Transactions on Systems, Man, and Cybernetics
Part A, 2007.
8. C. Hsu, “Models of Cyber-Infrastructure-Based Enterprises and Their Engineering”, in C.
Hsu, ed., Service Enterprise Integration: an Enterprise Engineering Perspective,
Springer Science, Boston, MA, 2007.
9. C. Hsu, M. Bouziane, L. Rattner and L. Yee, "Information Resources Management in
Heterogeneous Distributed Environments: A Metadatabase Approach," IEEE
Transactions on Software Engineering, vol. 17, no. 6, 1991, pp 604-625.
10. M.H. Hugos, Essentials of Supply Chain Management, John Wiley and Sons, 2006.
11. C.E. Koh, H.J. Kim, and E.Y. Kim, “The Impact of RFID in Retail Industry: Issues and
Critical Success Factors,” J. Shopping Center Research, vol. 25, November 2006.
12. J. Lang and D.B. Stewart, “A Study of the Applicability of Existing Exception-Handling
Techniques to Component-Based Real-Time Software Technology,” ACM Transactions
on Programming Languages and Systems, Vol. 20, No. 2, March 1998, pp. 274-301.
13. I. le Blanc, M. van Krieken, H. Krikke, and H. Fleuren, “Vehicle Routing Concepts in the
Closed-Loop Container Network of ARN—a Case Study,” OR Spectrum, vol. 28, no.1,
January 2006.
14. L. Lei, S-G. Liu, A. Ruszczynski, and S-J. Park, “On the integrated production,
inventory, and distribution routing problem,” IIE Transactions, vol. 38, no. 11,
November, 2006, pp. 995-970.
15. D. Levermore and C. Hsu, Enterprise Collaboration: On-Demand Information Exchange
for Extended Enterprises, Springer Sciences, Boston, MA, 2006.
16. G. List, W. Wallace, A. Demers, P. Salaszynk, E. Lee and J. Wojtowicz, “Field
Experience With a Wireless GPS-based ATIS System” Proceedings: 12th World
Congress on ITS, 6-10 November 2005, San Francisco, Paper 1971.
17. A.C. McKinnon, “A Review of European Truck Tolling Schemes and Assessment of
Their Possible Impact on Logistics Systems,” I.J. Logistics, vol. 9, no.3, September,
2006, pp. 191-205.
18. J.T. Mentzer, M.B. Myers, T.P. Stank, (eds.) Handbook of Global Logistics and Supply
Chain Management, Sage Publishers, September, 2006.
19. N.H. Moin and S Salhi, “Inventory Routing Problems: a Logistical Overview”, J.
Operational Research Society advance online publication, August 2006.
20. Parsons – Clough Harbour, I-87 Multimodal Corridor Study: Long List of Improvement
Concepts, Parsons, Inc., New York, October 2003.
21. X-T. Qi, “A Logistics Scheduling Model: Scheduling and Transshipment for Two
Processing Centers,” IIE Transactions, vol. 38, no. 7, July 2006, pp. 537-546.
22. S.E. Sarma, S.A. Weis, and D.W. Engels, “RFID Systems and Security and Privacy
Implications,” Workshop on Cryptographic Hardware and Embedded Systems, 2002, pp.
454-470.
23. D.B. Stewart and G. Arora, “A Tool for Analyzing and Fine-Tuning the Real-Time
Properties of an Embedded System,” IEEE Transactions on Software Engineering, Vol.
27, June, 2000.

Albany
US/Canada Border
Plattsburgh
I-90
Montreal
I-87
Smart Highway TMC
Guided “Virtual” Rapid Transit
Wireless Sensor Networks
Trucker
Passenger Car
Wireless Network
Wireless Sensor Networks communicate with RFID on drivers, vehicles, and cargos
RFI
Freight Truck
Authority (NYSDOT) o Highway Heath Self-Monitoring o Usage Patterns Analysis and Reporting o Transportation Management Center (TMC)
General Public
o Trip Information Portal o Driver Safety and Decision Support o Integrated Journey and Roadside Support
International Logistics
o Just-In-Time Logistics o Security Check at Border and Curbside o Virtual Rapid Transit Lanes
Figure 1: Smart Highway Digital Layer

Figure 2: GOALS OF SMART HIGHWAY
Highway Users: Vehicle Drivers
(Subjects) Requirements:
Driver-centric Integration of information for safety
and journey decision support from
authority and firms
Logistic Processes & Control Activities:
Concurrent Global Logistics Control Models
(Enterprises) Requirements:
Integration of logistic processes and databases
for driver support and global adaptive control
Highway Operation: Authority (Infrastructure)
Requirements: Acquisition and integration
of real-time data and knowledge used in
highway operation and transportation control,
made available to users
Smart Highway Digital Layer
Facilitates data acquisition,
transmission, and processing/storage for
each of the three levels of goals

Figure 3: The Structure of the Common Schema.
EnterpriseApplication
Appluser
Adminsiter
User
Integrates
Components
Defines
Itemin
Subject
Mapped to Describes Applies
Relates
Metamodeled
Context
Contains
RuleEntRel convert
ActofCondofERExist
Condition
Integrity
Fact
Action
Operator
Maintain
Bind-Fact
Calls
Namedas
Belongto
Item Equivalent
For
Storedin
Computes
Value
SoftwareResourses
HardwareResourses
Subjectin
Resides at
Module of
Uses
Intercomponent
Expr
Loper Roper
Value of
Opof

Figure 4: The Schema of the SIE Model
ex - 3
RFID+schema RFID+DB+schema RFID+schema RFID+DB+schema RFID+DB+schema
RFID/Sensor Network mapping
Sensor network Sensor networkDB/schema A DB/schemas B
Infrastructure/Global Infrastructure/Globalmapping A mapping B
GlobalMetadatabase
Global/Enterprise mapping
Collaborative/ Export DBSystem (DistributedMetadata/DB)
Subject System A
Full Subject System B
Subject System C
Full Subject System D
Full SubjectSystem E
Infrastructure A Infrastructure B
Network Flow Model
GlobalNetwork FlowManagement
System(GNFMS)
Independent Enterprise Databases
Cyber-Infrastructure
Interface

Figure 5: Interaction Process.

Figure 6: Travel time intensity distributions for three freeway M2M pairs.

Figure 7: Travel time intensity distributions for three arterial M2M pairs.

Figure 8: Cross-correlating GPS tracks to monument passing records.