Embed Size (px)
Citation preview

IOSR Journal Of Pharmacy
(e)-ISSN: 2250-3013, (p)-ISSN: 2319-4219
Www.Iosrphr.Org Volume 3, Issue 5 (June 2013), Pp 07-19
7
An Improved Rapid HPLC Method for the Separation of Five
Anti-Hypertensive Agents Using C18 Column: Application to
Hydrochlorothiazide Determination in Bulk and Tablet Dosage
Form
Ravisankar Panchumarthy*1, 2
, Devala Rao Garikapati 3
*1 Department of Pharmaceutical Analysis and Quality Assurance, Vignan Pharmacy College, Vadlamudi,
Guntur - 522213, A.P., India. 2 Faculty of Science, Sri Chandrasekharendra Saraswathi Viswa MahaVidyalaya (SCSVMV University),
Enathur, Kanchipuram – 631561, T.N., India. 3Department of Pharmaceutical Analysis, KVSR Siddhartha College of Pharmaceutical Sciences, Vijayawada -
521108, A.P., India.
ABSTRACT : A selective, sensitive and accurate HPLC method with UV detection was developed and
validated for the separation of five anti-hypertensive agents and applied for the determination of
hydrochlorothiazide in bulk and pharmaceutical dosage forms. One of the key goals of HPLC technique is to
achieve a consistent and reproducible separation. RP-HPLC method was developed by using Welchrom C18
Column (4.6 mm i.d. X 250 mm, 5 µm particle size), Shimadzu LC-20AT Prominence Liquid Chromatograph.
The mobile phase constituted of 10 mM Phosphate buffer (pH3.0, adjusted with triethylamine): acetonitrile
(50:50, v/v).The flow rate was set to 1.0 mL/min with the responses measured at 235nm using Shimadzu SPD-
20A Prominence UV-Visible detector. The retention times of atenolol hydrochloride, metoprolol succinate,
hydrochlorothiazide, amlodipine besylate and nebivolol hydrochloride were found to be 2.303 min, 2.827 min, 3.543 min, 4.253 min and 4.957 min respectively. This method successfully separated all five antihypertensive
drugs in less than 6 min. Hydrochlorothiazide was found to give linear response in the concentration range of
2-10µg/mL. Recovery studies were performed to ascertain the accuracy by standard addition method and
average recovery was found to be 99.70 to 100.17 %.The limit of detection and limit of quantification were
found to be 0.126616 µg/mL and 0.383686 µg/mL respectively. The developed method can be used for routine
quality control analysis of hydrochlorothiazide in pharmaceutical tablet dosage form. It can also be extended
for the determination of other four anti-hypertensive agents. This method provides simple and fast method with
excellent peak symmetry and high resolution.
KEYWORDS: Atenolol hydrochloride, Amlodipine besylate, Hydrochlorothiazide, Metoprolol succinate,
Nebivolol hydrochloride, Isocratic RP-HPLC method.
I. INTRODUCTION Atenolol hydrochloride (ATN) is a synthetic, relatively β1-selective adreno receptor blocking agent. It
is used primarily to treat angina pectoris (chest pain) and hypertension (high blood pressure). It is also used to
treat or prevent heart attack. ATN is chemically 2-[4-[2-hydroxy-3-(1-methylethylamino) propoxy] phenyl]
ethanamide (fig. 1(a)).Metoprolol succinate (MET) is used alone or in combination with other medicines to treat
high blood pressure. It also used to prevent angina and to improve survival after a heart attack. Extended-release
(long-acting) MET is also used in combination with other medications to treat heart failure. It works by relaxing
the blood vessels and slowing heart rate to improve blood flow and decrease blood pressure. MET belongs to
class of medications called beta blockers. It is chemically 1-(Isopropylamino)-3-[4-(2-methoxyethyl) phenoxy]-
2-propanol succinate (fig. 1(b)).Hydrochlorothiazide (HCT), 6-chloro-1,1-dioxo-3,4-dihydro-2H-1,2,4-
benzothiazine-7-sulfonamide (fig. 1(c)) is a diuretic drug of the thiazide class that acts by inhibiting the kidneys
ability to retain water. This reduces the volume of the blood, decreasing blood return to the heart and
thus cardiac output and by other mechanisms, is believed to lower peripheral vascular resistance. HCT is often used for the treatment of hypertension, congestive heart failure, symptomatic edema, diabetes insipidus, renal
tubular acidosis, and for prevention of renal calculi.Amlodipine besylate (AML) is used with or without other
medications to treat high blood pressure. Lowering high blood pressure helps prevent strokes, heart attacks and
kidney problems. AML belongs to a class of drugs known as calcium channel blockers of dihydropyridine
(DHP) class. It works by relaxing blood vessels so blood can flow more easily. AML is also used to prevent
certain types of chest pain (angina) except for unstable angina. AML is chemically 3-ethyl-5-methyl-2-[(2-
aminoethoxy)methyl]-4-(2-chlorophenyl)-6-methyl-3,5-pyridinedicarboxylate,

An Improved Rapid HPLC Method For The Separation…
8
monobenzenesulphonate (fig. 1(d)).Nebivolol hydrochloride (NEB) is used to treat high blood pressure
of unknown cause (essential hypertension) and chronic heart failure (the heart is unable to properly pump blood
around the body) in people aged 70 years or over. It is used to relax and widen blood vessels so that it is easier
for the heart to pump blood around the body and reduces the blood pressure. NEB is chemically 1-(6-
fluorochroman-2-yl)-{[2-(6-fluorochroman-2-yl)-2-hyroxy-ethyl]amino}ethanol (fig. 1(e)). It is a β1-receptor
blocker. It has a nitric oxide potentiating, vasodilatory effect and is used in treatment of hypertension.
Figure 1: Structures of Anti-Hypertensive drugs investigated in the present study
Literature survey reveals that for the determination of above said five anti-hypertensive agents in
biological fluids like plasma, blood, urine and pharmaceutical dosage forms by spectrophotometry[1-4], spectrofluorimetry[5], TLC[6-7], HPTLC[8], High Performance Liquid Chromatography (RP-HPLC) with UV
detection[9-18], fluorimetric detection[19], ion-pair HPLC[20], RP-UPLC[21] and Liquid Chromatography-Mass
Spectrometry[22-23], Capillary electrophoresis[24].In fact there is a need for the development of a novel, simple,
rapid, efficient RP-HPLC analytical method with reproducibility for determination of HCT in bulk and
pharmaceutical dosage forms. A group of five anti-hypertensive drugs investigated in the present study are listed
in Figure 1.
The combination of five anti-hypertensive agents has not been adopted by any official pharmacopoeia.
An extensive review of the literature did not revealed any HPLC method for simultaneous separation of five
drugs. Therefore attempts were made to develop and validate simple precise and sensitive isocratic RP-HPLC
method for simultaneous separation and determination of five drugs in pharmaceutical formulations. When
developing a new method one of the most outstanding goals is to achieve a consistent and good separation. The selection of a highly reproducible HPLC method is essential if this goal is to be accomplished. Thus the present
study illustrates development and validation of a novel, simple, rapid and efficient RP-HPLC analytical method
with successful separation of five most commonly used anti-hypertensive agents with short retention time. This
method also provides reduced run time with good resolution, excellent peak symmetry, use of reduced solvent
consumption, providing reduced costs achieved without resorting to high back pressure. The established method
was validated with respect to specificity, linearity, precision, accuracy, robustness, LOD and LOQ according to
ICH guidelines [25].
II. MATERIALS AND METHODS 2.1 Chemicals and Reagents
The reference standards of ATN, MET, HCT, AML and NEB obtained from Hetero Drugs Ltd.,
Hyderabad, Andhra Pradesh, India were used in this study. All the chemicals were analytical grade. Potassium

An Improved Rapid HPLC Method For The Separation…
9
dihydrogen orthophosphate was purchased from Rankem Ltd., Mumbai, India, while acetonitrile (HPLC grade)
and triethylamine (HPLC grade) from Merck Pharmaceuticals Private Ltd., Mumbai, India. O-Phosphoric acid
used was of HPLC grade and purchased from Merck Specialties Private Ltd., Mumbai, India. Commercial
tablets of HCT formulation was procured from local market. HYDRAZIDE tablets containing HCT (25 mg) are
manufactured by Cipla Ltd., Mumbai, India. HPLC grade water was used throughout the analysis. Mobile phase
was filtered using 0.45 μm nylon filter by Millipore (USA).
2.2 Instrumentation Quantitative HPLC was performed on a isocratic high performance liquid chromatograph (Shimadzu
LC-20AT Prominence Liquid Chromatograph) with a LC-20AT VP pump. Sample injection was performed via
a Rheodyne (USA) manual injector with loop volume of 20 µL, programmable variable wavelength Shimadzu
SPD-20A Prominence UV-Vis detector and Welchrom C18 Column (4.6 mm i.d. X 250mm, 5µm particle size).
The HPLC system was equipped with “Spinchrom” data acquisition software. The pH of the solution was
measured using digital pH meter (Systronics model 802). A UV spectrum of all drugs was recorded for selection
of working wavelength of detection by using a UV-Visible Spectrophotometer (Systronics model 2203). In
addition an electronic balance (Shimadzu TX223L), a sonicator (spectra lab, model UCB 40) were used in this
study.
2.3 Chromatographic conditions
HCT was analyzed by various reversed phase columns like C8 and C18 columns. Among C8 and C18 columns, C18 (4.6 mm i.d. X 250 mm, 5 µm particle size) column was selected. Various combinations of
acetonitrile, phosphate buffer and methanol with triethylamine as column modifier were tested. The mobile
phase consisting of a mixture of 10mM Phosphate buffer (pH adjusted to 3.0 using triethylamine) and
Acetonitrile in ratio of 50:50, v/v was selected as mobile phase and UV detection wavelength was 235nm with a
flow rate of 1 mL/min. the mobile phase was prepared freshly and filtered before use through a 0.45 μm
membrane filter and degassed for 15 min by sonication. The mobile phase was pumped from the solvent
reservoir to the column at a flow rate of 1 mL/min and the injection volume was 20 μL. The eluents were
monitored at 235 nm. Run time was 6 min and retention time for HCT was 3.543 min. the optimized
chromatographic conditions of HCT are presented below in Table 1.
Table 1: Optimized chromatographic conditions and system suitability parameters of proposed RP-
HPLC method for hydrochlorothiazide
Parameter Chromatographic conditions
Instrument SHIMADZU LC-20AT prominence liquid chromatograph
Column WELCHROM C18 Column
(4.6 mm i.d. X 250mm, 5µm particle size)
Detector SHIMADZU SPD-20A prominence UV-Vis detector
Diluents 10mM Phosphate Buffer(pH3.0) : Acetonitrile (50:50, v/v)
Mobile phase 10mM Phosphate Buffer (pH 3.0) : Acetonitrile (50:50, v/v)
Flow rate 1mL/min.
Detection wave length UV at 235nm.
Run time 6 minutes
Column back pressure 128-130 kgf
Temperature Ambient temperature(25oC)
Volume of injection loop 20µL
Retention time (tR) 3.543 min
Theoretical plates[th.pl] (Efficiency) 10,443
Theoretical plates per meter[t.p/m] 208,859
Tailing factor (asymmetry factor) 1.093
2.4. Preparation of solutions and Reagents
2.4.1 Mobile phase A 10mM Phosphate buffer was prepared by dissolving 6.056 g of potassium dihydrogen
orthophosphate in 445 mL of HPLC grade water. To this 55mL of 0.1M phosphoric acid was added and the pH
was adjusted to 3.0 with triethylamine. The above prepared buffer and acetonitrile were mixed in the proportion
of 50:50, v/v and was filtered through 0.45 µm nylon membrane filter and degassed by sonication.

An Improved Rapid HPLC Method For The Separation…
10
2.4.2 Stock and Working Standard Solutions
Accurately weigh 10 mg of HCT, dissolve in a 100 mL volumetric flask with mobile phase and
sonicate to mix well. This is stock standard solution of HCT with concentration of 100 μg/mL. Prepare five
working standard solutions for calibration by adding defined volumes of the stock standard solution and make
up volume with mobile phase. The concentrations of HCT are 2.0, 4.0, 6.0, 8.0, 10.0 µg/mL, respectively.
Likewise 10 µg/mL of each standard Anti-Hypertensive agent were prepared from 1000 µg/mL stock standard
solutions of ATN, MET, AML and NEB respectively into each 10ml volumetric flask.
2.4.3 Tablet Sample preparation
Accurately weighed and grind 20 tablets of HCT (HYDRAZIDE) in a mortar and triturated to a fine
powder. From this, tablet powder which is equivalent to 100 mg of HCT was taken and the drug was extracted
into 100 mL of mobile phase in a beaker, stir and place in an ultrasonic bath until dissolution is complete.
Transfer this solution into a 100 mL volumetric flask, rinse the beaker with mobile phase a few times, and
transfer into the same volumetric flask. Add mobile phase to bring to volume. The resulting solution was filtered
using 0.2 µm filter and degassed by sonication. This solution was further suitably diluted for chromatography to
give a concentration of approximately 5 μg/mL.
2.5 Selection of detection wavelength The overlain UV spectra of various diluted solutions of ATN, MET, HCT, AML and NEB in mobile
phase were recorded using UV spectrophotometer. The isobestic point of maximum absorbance was observed at
235nm. This wavelength was used for detection of HCT and other four anti-hypertensive agents.
2.6 Calibration curve for Hydrochlorothiazide
Replicates of each calibration standard solutions (2, 4, 6, 8, 10 µg/mL) were injected using a 20µL
fixed loop system and the chromatograms were recorded. Calibration curves were constructed by plotting
concentration of HCT on X-axis and peak areas of standard HCT on y-axis and regression equations were
computed for HCT. The linear regression data and calibration data of the proposed HPLC method for estimation
of HCT are presented in below in Table 2 and Table 3 respectively. The chromatograms of calibration standards
of HCT were shown in Figure 2 to Figure 6. Calibration plot is shown in Figure 7.
Table 2: Linear regression data of the proposed HPLC method of HCT
Parameter Method
Detection wavelength( λmax) UV at 235nm
Linearity range (µg/mL) 2-10 µg/mL
Regression equation (Y = a + bX) Y = 387.05X + 6.2599
Slope(b) 387.05
Intercept(a) 6.2599
Standard error of slope (Sb) 2.452508
Standard error of intercept (Sa) 14.850676
Standard error of estimation (Se) 20.519158
Regression coefficient (R2) 0.99983
% Relative standard deviation* i.e.,
Coefficient of variation(CV) 0.9682
Percentage range of errors(Confidence limits)
0.005significance level
0.001 significance level
0.569888
0.893911
Table 3: Calibration data of HPLC method for estimation of HCT
S.No Concentration, μg/ml. Retention time, (tR)min. Peak area, mV.s.
1. 0 0 0
2. 2 3.543 777.740
3. 4 3.543 1576.975
4. 6 3.543 2305.121
5. 8 3.543 3123.917
6. 10 3.473 3865.405
Slope 387.0525857 Correlation Coefficient [CC] (r) 0.9999
Intercept 6.259904762 Squared CC (R2) 0.9998

An Improved Rapid HPLC Method For The Separation…
11
Figure 2: Standard chromatogram of HCT (2 µg/mL)
Figure 3: Standard chromatogram of HCT (4 µg/mL)
Figure 4: Standard chromatogram of HCT (6 µg/mL)

An Improved Rapid HPLC Method For The Separation…
12
Figure 5: Standard chromatogram of HCT (8 µg/mL)
Figure 6: Standard chromatogram of HCT (10 µg/mL)
Figure 7: Calibration plot of HCT
2.7 Assay of marketed formulations
The prepared sample solution was injected 6 times into the column. From the peak area, the drug
content in the tablets was determined using the regression equation obtained from the pure sample. The assay results are represented below in Table 4. The chromatogram of sample preparation of HCT was shown in Figure
8.
An Improved Rapid HPLC Method For The Separation…
13
Table 4: assay results of HCT formulation
*Average of 6 determinations; SD is standard deviation.
Figure 8: Chromatogram of market formulation (HYDRAZIDE 25 mg tablets) of HCT
2.8 VALIDATION OF THE PROPOSED METHOD
Validation of the developed method of analysis was performed in accordance with the International
Conference on Harmonization (ICH). Validation parameters checked were specificity, precision, accuracy,
robustness, Limit of Detection (LOD) and Limit of Quantitation (LOQ).
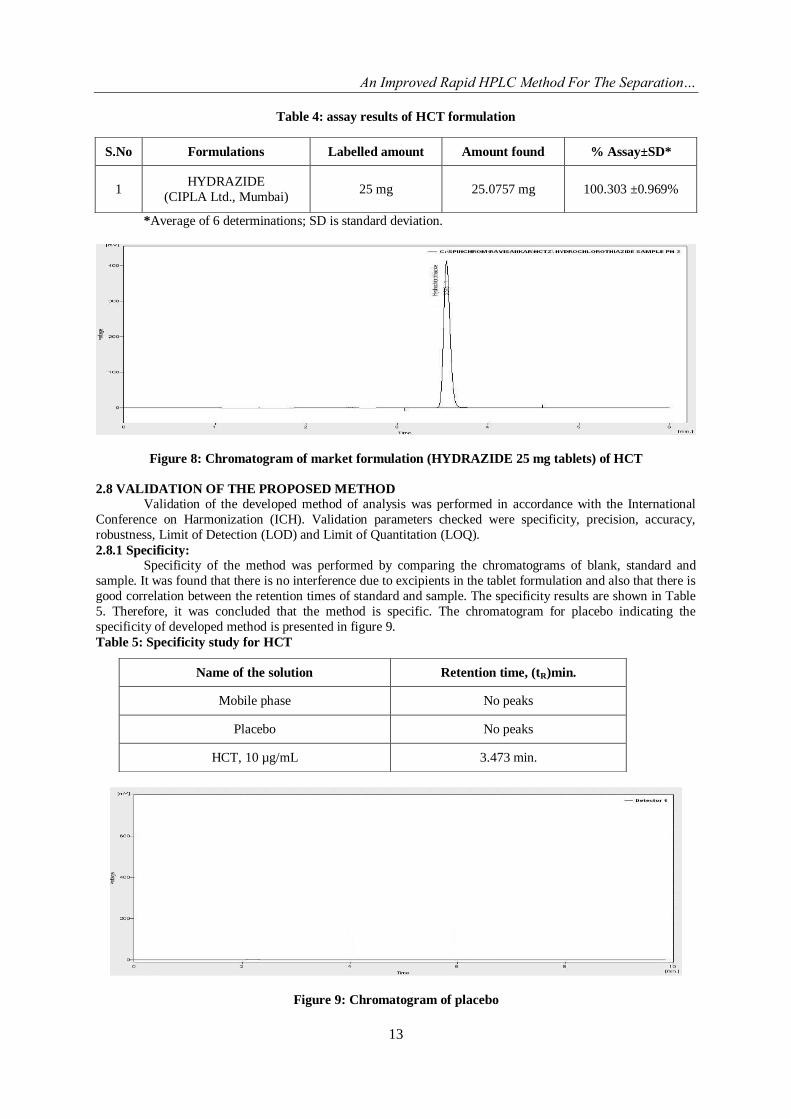
2.8.1 Specificity:
Specificity of the method was performed by comparing the chromatograms of blank, standard and
sample. It was found that there is no interference due to excipients in the tablet formulation and also that there is
good correlation between the retention times of standard and sample. The specificity results are shown in Table
5. Therefore, it was concluded that the method is specific. The chromatogram for placebo indicating the
specificity of developed method is presented in figure 9.
Table 5: Specificity study for HCT
Figure 9: Chromatogram of placebo
S.No Formulations Labelled amount Amount found % Assay±SD*
1 HYDRAZIDE
(CIPLA Ltd., Mumbai) 25 mg 25.0757 mg 100.303 ±0.969%
Name of the solution Retention time, (tR)min.
Mobile phase No peaks
Placebo No peaks
HCT, 10 µg/mL 3.473 min.

An Improved Rapid HPLC Method For The Separation…
14
2.8.2 Precision
Precision of the method was performed as intra-day and inter-day precision. To study the intra-day
precision, six replicate standard solutions of HCT were injected. The %RSD was calculated and it was found to
be 0.2721 which is within the acceptable criteria of not more than 2.0. Results of intra-day precision studies are
shown in Table 6.
Table 6: results of precision study (intra-day)
Sample Concentration
(µg/mL) Injection no. Peak area (mV.s) %RSD
#
HCT 10
1 3865.405
0.2721
2 3881.832
3 3854.625
4 3869.394
5 3857.512
6 3876.063 #Acceptance criteria < 2.0.
For inter-day precision, six-replicate standard solution of HCT was injected on the 2nd day of sample
preparation. The %RSD was calculated and it was found to be 0.3394 which is within the acceptable criteria of
not more than 2.0. Results of inter-day precision studies are shown in table 7.
Table 7: results of precision study (inter-day)
Sample Concentration
(µg/mL) Injection no. Peak area (mV.s) %RSD
#
HCT 10
1 3842.328
0.3394
2 3846.52
3 3859.629
4 3879.424
5 3861.724
6 3856.476 #Acceptance criteria < 2.0.
2.8.3 Accuracy (Recovery studies):
The accuracy was determined by adding a known amount of standard drug to the fixed amount of pre-
analyzed tablet solution. % Recovery was calculated by standard addition method which was performed at 80%,
100% and 120% level. The % recovery and %RSD was calculated and the results are presented in Table 8.
Satisfactory recoveries ranging from 99.30 to 99.99% were obtained by the proposed method.
Table 8: recovery data of the proposed RP_HPLC method for HCT
#Acceptance criteria < 2.0.
2.8.4 Robustness
Robustness of an analytical procedure is a measure of its capacity to remain unaffected by small, but
deliberate variations in method parameters. It provides an indication of the procedure’s reliability during normal
usage. Robustness study was evaluated by slight deliberate changes in mobile phase flow rate, detection
wavelength, composition of the mobile phase. It was observed that there were no marked changes in the
chromatograms and the parameters are within the limits which demonstrated that the developed method was
robust in nature. The complete results are shown in Table 9.
Recover
y level
Amount
added (mg)
Total
amount
(mg)
Amount
found (mg)
Amount
recovered (mg) % recovery
Mean %
Recovery ± SD %RSD
#
80%
19.92 44.99 44.87 19.79 99.36 99.73±
0.4378 0.4389 20.08 45.15 45.08 20.00 99.62
19.98 45.05 45.10 20.02 100.22
100%
24.96 50.03 49.97 24.89 99.73 99.72±
0.0226 0.0227 24.94 50.01 49.95 24.87 99.73
25.02 50.09 50.02 24.94 99.69
120%
30.04 55.11 55.12 30.04 100.01 99.81±
0.1852 0.1855 30.07 55.14 55.04 29.96 99.64
29.95 55.02 54.96 29.88 99.78

An Improved Rapid HPLC Method For The Separation…
15
Table 9: robustness results of metoprolol succinate
S.
no Parameter
a Optimized Used
Retention time
(tR), min
Plate
count$
Peak asymmetry# Remark
1.
Flow rate
(±0.2 mL/min)
1.0
mL/min
0.8 mL/min 3.962 10783 1.108 *Robust
1.2 mL/min 3.108 10128 1.101 *Robust
2. Detection wavelength
(±5 nm)
245 nm
240 nm 3.545 10452 1.112 Robust
250 nm 3.548 10437 1.106 Robust
3.
Mobile phase
composition
(±5 %)
50:50, v/v
55:45, v/v 3.726 10828 1.102 *Robust
45:55, v/v 3.382 10210 1.104 *Robust
*considerable change in retention time.
2.8.5 LOD and LOQ:
The Limit of Detection and Limit of Quantitation were calculated according to ICH Q2B
recommendations. Limit of Detection is the lowest concentration in a sample that can be detected, but not
necessarily quantified under the stated experimental conditions. The limit of quantitation is the lowest
concentration of analyte in a sample that can be determined with acceptable precision and accuracy. LOD and
LOQ were calculated by formula LOD= 3.3(SD)/S and LOQ= 10 (SD)/S, where SD=standard deviation of
response (peak area) and S= slope of the calibration curve. The LOD and LOQ of HCT by proposed method are
abridged in Table 10.
Table 10: Limit of detection (LOD) and limit of quantitation (LOD)
Limit of Detection(LOD) 0.126616 μg/mL
Limit of Quantitation(LOQ) 0.383686 μg/mL
III. RESULTS AND DISCUSSION One of the prominent goals for the present work is to achieve a consistent, reproducible separation. In
fact selection of a phenomenal method is essential if this goal is to be attained. Various extensive preliminary
experimental trials are performed using different combinations of buffers, organic components such as
methanol, acetonitrile and after trials using different C8 and C18 reversed phase columns, best chromatographic
conditions to obtain excellent resolution and symmetrical peaks for simultaneous separation of five anti-
hypertensive agents. Optimized separation of the five anti-hypertensive agents were achieved by using a C18
column (250 mm X 4.6 mm i.d, 5 μm particle size), a mobile phase mixture of 10 mM Phosphate buffer (pH 3.0, adjusted with triethylamine): Acetonitrile in a ratio of 50:50, v/v. runtime was less than 6 min. at a flow rate of 1
mL/min. the detection wavelength fixed at 235 nm obtained from UV overlain spectra of the five anti-
hypertensive drugs. The injection volume was 20 μL. Under the conditions described above, separation of the
mixture of five anti-hypertensive agents was achieved with a total run-time of 7 min, with an elution window of
3.4 min for all the five analytes. Good retention and separation of all five components with excellent resolution
power greater than 2.0 in all cases within short run-times was achieved under isocratic method conditions.
Outstanding low asymmetry values were found for each analyte and peak shape was excellent as demonstrated
by asymmetry values of less than 1.2 overall with the HCT peak having an asymmetry value of 1.092. In all
cases, the plate count was greater than 3000. The linear dynamic range of 2 – 10 μg/mL met all specifications
with R2 > 0.999. The data for separation chromatogram of mixture of five anti-hypertensive agents is given
below in Table 11. The separation chromatogram of five anti-hypertensive agents is shown in Figure 10.
Table 11: Chromatogram results of proposed combination of five anti-hypertensive agents
a theoretical plates > 3000, #acceptance criteria<1.5, $acceptance criteria>2.0
Name of the
Compound
Retention
time (tR), min
Peak
No. Assymmetry
#
Efficiency
(th.pl)a
Theoritical
plates/meter Resolution
$
ATN 2.310 1 1.066 5497 109941 -
MET 2.830 2 1.082 8250 165010 4.184
HCT 3.500 3 1.097 10604 212081 5.182
AML 4.260 4 1.068 11541 230826 5.460
NEB 4.960 5 1.184 13629 272586 4.272

An Improved Rapid HPLC Method For The Separation…
16
Figure 11: A typical chromatogram of Mixture of five standard Anti-Hypertensive agents
For the comparative evaluation of retention times and peak areas of anti-hypertensive drugs,
chromatograms of these five anti-hypertensive drug standards were recorded individually. The representative
individual standard chromatograms of five anti-hypertensive drugs are shown in fig numbers 12 to 16 and the
results are presented in Table 12.
Table 12: Individual chromatogram results of standards of five anti-hypertensive agents
Name of the Compound Retention time (tR), min. Assymmetry#
Efficiency
(theoretical plates)a
Atenolol hydrochloride 2.310 1.064 5497
Metoprolol succinate 2.827 1.082 8231
Hydrochlorothiazide 3.543 1.093 10443
Amlodipine besylate 4.293 1.090 12238
Nebivolol hydrochloride 4.957 1.182 13739 a theoretical plates > 3000, #acceptance criteria<1.5, $acceptance criteria>2.0
Figure 12: Standard chromatogram of Atenolol standard (10 µg/mL)

An Improved Rapid HPLC Method For The Separation…
17
Figure 13: A typical chromatogram of Metoprolol succinate standard (10 µg/mL)
Figure 14: Standard chromatogram of Hydrochlorothiazide standard (10 µg/mL)
Figure 15: Standard chromatogram of Amlodipine standard (10 µg/mL)

An Improved Rapid HPLC Method For The Separation…
18
Figure 16: Standard chromatogram of Nebivolol standard (10 µg/mL)
IV. CONCLUSION Rapid separation of selected five anti-hypertensive compounds were successfully separated with a
relatively short retention time, provides phenomenal resolution, excellent peak shape, gave consistent and highly
reproducible results on C18 HPLC column. The method overall proved to be economical, simple, rapid, precise,
very sensitive, cost- effective, time saving, robust and accurate. It can be reliably used for determination of the
said five anti-hypertensive drugs in short period and even in small concentrations. By using this method one can
elute all the five drugs within six minutes. This method was completely validated shows excellent results and
also free from interference of the other additives used in the formulations. Under the conditions described
above, separation of the five anti-hypertensive agent mixture was achieved with a total run time of 7 minutes
with an elution window of 3.4 minutes for all five analytes. The separation chromatogram is shown in Figure 10.
The ease in preparation of mobile phase and economy of the components of mobile phase make this method the
best choice in routine analysis of ATN, MET, HCT, AML, NEB in bulk and their pharmaceutical dosage forms.
This method provides decorous resolution power with short runtimes, good retention, superior peak shape and excellent reproducibility of the results achieved. Hence this method would be applied for quantifying the low
levels of the drugs in pharmaceutical dosage forms alone or in combinations of any two or three of the above
described anti-hypertensive drugs, irrespective of their concentration levels.
V. ACKNWOLEDGEMENTS
The authors are indebted to Hetero Labs, Hyderabad, India for providing the samples of atenolol,
metoprolol, hydrochlorothiazide, amlodipine, nebivolol. We are highly thankful to Dr.L.Rathaiah, Honorable
Chairman, Vignan group of institutions, Vadlamudi, Guntur, for providing the necessary facilities to carry out
this research work.
REFERENCES [1] Gupta KR, Tajne MR, Wadodkar SG, New spectrophotometric method for simultaneous determination of metoprolol tartarate
and hydrochlorthiazide in tablets, Indian. J. Pharm. Sci, 70(4), 2008, 511-513.
[2] Thomas AB, Chavan UB, Nanda RK, Kothapalli LP, Deshpande AD, Jagdale SN, Dighe SB, Simultaneous spectrophotometric
estimation of Hydrochlorothiazide, Atenolol and Losartan potassium in tablet dosage form, Hindustan Antibiot. Bull, 51(1-4),
2009, 33-8.
[3] Kamila MM, Mondal N, Ghosh LK, Gupta BK, A validated UV spectrophotometric method for estimation of nebivolol
hydrochloride in bulk and pharmaceutical formulation, Pharmazie, 62(7), 2007, 486-7.
[4] S Mohammadi-Samani, A Boostanian, The Effect of HLB on the Release Profile of Atenolol from Ethyl Cellulose-coated
Tablets, Iranian J. Pharm. Res, 3(3), 2004, 145-148.
[5] Mohamed I Walash, Fathallah F Belal, Nahed M El-Enany, Mahmoud H El-Maghrabey, Synchronous fluorescence
spectrofluorimetric method for the simultaneous determination of metoprolol and felodipine in combined pharmaceutical
preparation, Chem. Cent. J, 5, 2011, 70-9.
[6] Patole SM, Khodke AS, Potale LV, Damle MC, A validated densitometric method for analysis of atorvastatin calcium and
metoprolol tartarate as bulk drugs and in combined capsule dosage forms, J. Young Pharmacists, 3, 2011, 55-9.
[7] Shirkhedkar AA, Bugdane PM, Surana SJ, Stability-Indicating TLC-densitometric determination of nebivolol hydrochloride in
bulk and pharmaceutical dosage form, J. Chromatogr. Sci, 48(2), 2010, 109-13.
[8] Jain PS, Patel MK, Bari SB, Surana SJ, Development and Validation of HPTLC Method for Simultaneous Determination of
Amlodipine Besylate and Metoprolol Succinate in Bulk and Tablets, Indian J. Pharm. Sci, 74(2), 2012,152-6.

An Improved Rapid HPLC Method For The Separation…
19
[9] Rawool ND, Venkatchalam A. Analytical method for the simultaneous estimation of hydrochlorothiazide and metoprolol tartrate
using RP HPLC, Indian J. Pharm. Sci. 73, 2011,219-23.
[10] Jain PS, Patel MK, Gorle AP, Chaudhari AJ, Surana SJ, Stability-indicating method for simultaneous estimation of olmesartan
medoxomile, amlodipine besylate and hydrochlorothiazide by RP-HPLC in tablet dosage form, J. Chromatogr. Sci, 50(8), 2012,
680-7.
[11] Meyyanathan SN, Rajan S, Muralidharan S, Birajdar AS, Suresh B, A Validated RP-HPLC Method for Simultaneous Estimation
of Nebivolol and Hydrochlorothiazide in Tablets, Indian J. Pharm. Sci, 70(5), 2008, 687-9.
[12] Chitlange SS, Imran M, Sakarkar DM, RP-HPLC method for simultaneous estimation of amlodipine and metoprolol in tablet
formulation, Asian J. Pharm, 2, 2008, 232-4.
[13] Patel YP, Patil S, Bhoir IC, Sundaresan M, Isocratic, simultaneous reversed-phase high-performance liquid chromatographic
estimation of six drugs for combined hypertension therapy, J. Chromatogr. A, 828 (1-2), 1998, 283-6.
[14] Kaila HO, Ambasana MA, Thakkar RS, Saravaia HT, Shah AK, A Stability-indicating High Performance Liquid
Chromatographic Assay for the Simultaneous Determination of Atenolol and Lercanidipine Hydrochloride in Tablets, Indian. J.
Pharm. Sci, 73(4), 2011, 376-80.
[15] Patel DB, Mehta FA, Bhatt KK, Simultaneous Estimation of Amlodipine Besylate and Indapamide in a Pharmaceutical
Formulation by a High Performance Liquid Chromatographic (RP-HPLC) Method, Sci. Pharm, 80(3), 2012, 581-90.
[16] Shah S, Asnani A, Kawade D, Dangre S, Arora S, Yende S, Simultaneous Quantitative Analysis of Olmesartan Medoxomil and
Amlodipine Besylate in Plasma by High-performance Liquid Chromatography Technique, J. Young. Pharm, 4(2), 2012, 88-94.
[17] Alsarra IA, High-performance liquid chromatographic method for quantitative determination of amlodipine in human plasma and
pharmaceutical dosage form and its application to pharmacokinetic studies, J. Chromatogr. Sc, 47(10), 2009, 863-7.
[18] Shah DA, Bhatt KK, Mehta RS, Baldania SL, Gandhi TR, Stability Indicating RP-HPLC Estimation of Nebivolol Hydrochloride
in Pharmaceutical Formulations, Indian J. Pharm. Sci, 70(5), 2008, 591-5.
[19] Spanakis M, Niopas I, Determination of atenolol in human plasma by HPLC with fluorescence detection: validation and
application in a pharmacokinetic study, J Chromatogr. Sci, 51(2), 2013,128-32.
[20] Baheti KG, Shah N, Shaikh S, Ion-pairing reverse-phase high performance liquid chromatography method for simultaneous
estimation of atenolol and indapamide in bulk and combined dosage form. Indian J. Pharm. Sci, 74(3), 2012, 271-4.
[21] Seshadri RK, Desai MM, Raghavaraju TV, Krishnan D, Rao DV, Chakravarthy IE, Simultaneous quantitative determination of
metoprolol, atorvastatin and ramipril in capsules by a validated stability-indicating RP-UPLC method, Sci. Phar, 78(4), 2010,
821-34.
[22] Kallem RR, Mullangi R, Hotha KK, Ravindranath L, Spoorthy Y, Seshagirirao J, Simultaneous estimation of amlodipine and
atenolol in human plasma: a sensitive LC-MS/MS method validation and its application to a clinical PK study, Bioanalysis, 5(7),
2013, 827-37.
[23] Zou Q, Zhan Y, Ge Z, Wei P, Ouyang P, Liquid chromatography-mass spectrometry method for the determination of amlodipine
in human plasma and its application in a bioequivalence study, Arzneimittelforschung, 59(8), 2009, 383-91.
[24] Majid Zandkarimi, Alireza Shafaati, Sayyed Mohsen Foroutan, Charles A. Lucy, Improvement of Electrophoretic
Enantioseparation of Amlodipine by Polybrene, Iranian J. Pharm. Res, 11(1), 2012, 129-136.
[25] ICH, Q2B, Harmonized Tripartite Guideline, Validation of Analytical Procedure: Methodology, IFPMA, in: Proceedings of the
International Conference on Harmonization, Geneva, March 1996.