Embed Size (px)
Citation preview
Accepted Manuscript
An improved CPRG colorimetric ligand-receptor signaltransduction assay based on beta-galactosidase activity inmammalian BWZ-reporter cells
Charlotte Jendresen, Michael R. Daws, Lars N.G. Nilsson
PII: S1056-8719(17)30192-2DOI: doi:10.1016/j.vascn.2017.11.004Reference: JPM 6484
To appear in: Journal of Pharmacological and Toxicological Methods
Received date: 4 August 2017Revised date: 23 November 2017Accepted date: 29 November 2017
Please cite this article as: Charlotte Jendresen, Michael R. Daws, Lars N.G. Nilsson, An improved CPRG colorimetric ligand-receptor signal transduction assay based onbeta-galactosidase activity in mammalian BWZ-reporter cells. The address for thecorresponding author was captured as affiliation for all authors. Please check ifappropriate. Jpm(2017), doi:10.1016/j.vascn.2017.11.004
This is a PDF file of an unedited manuscript that has been accepted for publication. Asa service to our customers we are providing this early version of the manuscript. Themanuscript will undergo copyediting, typesetting, and review of the resulting proof beforeit is published in its final form. Please note that during the production process errors maybe discovered which could affect the content, and all legal disclaimers that apply to thejournal pertain.

ACCEP
TED M
ANUSC
RIPT
1
An improved CPRG colorimetric ligand-receptor signal transduction assay based on beta-galactosidase
activity in mammalian BWZ-reporter cells
Charlotte Jendresen [email protected], Michael R. Daws [email protected], Lars
N.G. Nilsson* [email protected]
Department of Pharmacology, Institute of Clinical Medicine, University of Oslo and Oslo University
Hospital, Oslo, Norway.
Postal address: Postboks 1057 Blindern, 0316 Blindern, Norway.
Division of Anatomy, Institute of Basic Medical Sciences, University of Oslo, Oslo, Norway.
Postal address: Postboks 1105 Blindern, 0317 Oslo, Norway.
Department of Pharmacology, Institute of Clinical Medicine, University of Oslo and Oslo University
Hospital, Oslo, Norway.
Postal address: Postboks 1057 Blindern, 0316 Blindern, Norway.
* Corresponding author. Phone: (+47) 47953038
ACCEPTED MANUSCRIPT
ACCEP
TED M
ANUSC
RIPT
2
Abstract
Introduction: Reporter cells expressing a chimeric receptor that activates a reporter can be used for
screening ligand-mediated signal transduction. In this study, we used reporter cells harboring an
NFAT/lacZ construct that express β-galactosidase when the chimeric receptor is stimulated. A
colorimetric β-galactosidase substrate, chlorophenol-red β-D-galactopyranoside (CPRG), was used to
detect enzymatic activity. Sub-optimal conditions have unfortunately extensively been reported with
such reporter-based β-galactosidase assays. Here, we aimed to improve the CPRG-based colorimetric
assay such that receptor ligands could be effectively screened with reporter cells.
Methods: After stimulation of reporter cells, we determined β-galactosidase activity by absorbance
measurement of -galactosidase-dependent CPRG hydrolysis. We systematically examined each
component in a standard lysis buffer most commonly reported for this type of reporter cells.
Furthermore, we evaluated literature in the field.
Results: An increased CPRG substrate concentration combined with a different detergent, Saponin, and
an optimal wavelength recording markedly increased the sensitivity for the detection of -galactosidase
activity ( 4-fold increase). Moreover, the improved protocol resulted in increased linear time-
dependent recording of enzymatic activity once cells had been lysed, and a more stable and reproducible
assay to detect a ligand-stimulus with the reporter cells. The optimal time length of exposure to a
stimulus was ligand-dependent.
Discussion: In conclusion, we provide an improved protocol with an optimized lysis buffer that gives up
to a six-fold higher and more robust specific signal when NFAT/lacZ-based receptor-expressing reporter
cells are exposed to a stimulus.
ACCEPTED MANUSCRIPT
ACCEP
TED M
ANUSC
RIPT
3
Keywords: methods; reporter cells; receptor stimulation; BWZ.36; -galactosidase; chlorophenol-red--
D-galactopyranoside; CPRG.
Introduction
The β-galactosidase enzyme has been studied extensively since the mid-1900s. It is encoded by the lacZ
gene, and its enzymatic activity was used in pioneering studies of genetic regulation in enteric bacteria
(Pardee, Jacob, & Monod, 1959). It has found use as a reporter of gene expression in a wide range of
organisms and assay formats. The protein functions as a homotetramer catalyzing the hydrolysis of an
aglycone from the glycosyl group on a glycoside (Tenu, Viratelle, Garnier, & Yon, 1971). While the natural
substrate is lactose, the reactions allow for colorimetric absorbance assays in which other substrates are
hydrolyzed by β-galactosidase and converted into colored, fluorescent, or luminescent products. A well-
known colorimetric substrate is ortho-nitrophenyl-β-D-galactopyranoside (ONPG). An alternative and
more sensitive colorimetric substrate, chlorophenol-red-β-D-galactopyranoside (CPRG), makes it possible
to detect lower levels of β-galactosidase activity (Eustice, Feldman, Colberg-Poley, Buckery, & Neubauer,
1991). In the present paper, we have used CPRG as a substrate to detect β-galactosidase expression and
activity in mammalian reporter cells.
The murine reporter cells used in this study originate from a cell line produced by White and colleagues
in 1989 (White et al., 1989). Three mutant cell lines were made from the murine thymoma BW5147 cell
line: cells devoid of either the endogenous T-cell receptor chain (TCR) α or chain β, or both the α- and β-
chain (White et al., 1989). The BWZ.36 cell line used in our studies was generated by transfecting α-β-
BW5147 cells with a DNA construct harboring a nuclear factor for activated T cells (NFAT) promoter
ACCEPTED MANUSCRIPT

ACCEP
TED M
ANUSC
RIPT
4
coupled to lacZ (Sanderson & Shastri, 1994). When used as reporter cells, they express a chimeric
antigen receptor. As a response to a receptor stimulus, the NFAT promotor is activated by an increased
intracellular Ca2+ concentration such that β-galactosidase is expressed. The reporter cells were used in an
antigen-presenting assay with CPRG colorimetry, and the referred study (Sanderson & Shastri, 1994)
forms the basis for our literature review and method optimization , and will henceforth be called “the
original report”.
By extensively reviewing the 277 publications citing the original report by Sanderson and Shastri
(Sanderson & Shastri, 1994), we found a general lack of information about the lysis buffer composition
used for the CPRG assay with reporter cells. The originally described lysis buffer recipe (Sanderson &
Shastri, 1994) was used in most of the publications that do report the buffer composition. The enzymatic
activity of β-galactosidase depends on pH, temperature (Roth & Huber, 1994; Tenu et al., 1971), on
monovalent and divalent ions (Hill & Huber, 1971; Huber, Parfett, Woulfe-Flanagan, & Thompson, 1979;
Juers, Matthews, & Huber, 2012; Tenu, Viratelle, & Yon, 1972) as well as on substrate concentration. The
enzyme might also be inhibited by components of the lysis buffer. When testing the original CPRG lysis
buffer recipe (Sanderson & Shastri, 1994), a non-linear time-dependent enzymatic reaction was observed,
indicating sub-optimal conditions for β-galactosidase or cell lysis (unpublished observations). We found it
essential to establish a modified protocol of this much-used reporter assay such that the readout related
to a linear time-dependent enzyme reaction. Moreover, we found it critical to optimize the cell lysis
buffer composition when monitoring β-galactosidase enzymatic activity. In the present study, we
generated a clearly improved reporter cell assay by systematically evaluating and changing lysis buffer
components. We discovered that there is an optimal time of stimulation which depends on the ligand
and therefore, rather than relying on the standard protocol, this parameter needs be empirically
determined.
ACCEPTED MANUSCRIPT
ACCEP
TED M
ANUSC
RIPT
5
Materials and methods
Literature review
The original report by Sanderson & Shastri (Sanderson & Shastri, 1994) in 1994 describes the use of β-
galactosidase-expressing α-β-BW5147 reporter cells with a CPRG colorimetric assay. The 277 publications
that have cited this report (according to Web of Knowledge, www.webofknowledge.com) until the time
of writing (July 2017) were systematically evaluated. Publications were omitted from the literature
review if they did not use reporter cells that were based on the β-galactosidase-expressing α-β-BW5147
cells. Furthermore, publications were excluded if they were review articles, they were not written in
English, or they did not use CPRG as a β-galactosidase substrate when performing the β-galactosidase
reporter assay. After exclusions, a total of 158 publications were included in the detailed CPRG method
analysis. An overview of the 277 publications is found in Supplementary Table 1.
Materials and Reagents
Transparent Maxisorp 96-well plates (#442404), Roswell Park Memorial Institute (RPMI) 1640 medium
(#61870-044), ionomycin (#I-24222), ethylenediamine tetra acetic acid (EDTA, #15575-020), 2-
mercaptoethanol (#31350-010), and Trypan Blue (#T10282) were all acquired from Thermo Fisher
Scientific (Waltham, MA, USA). Phorbol myristate acetate (PMA, #P1585), CPRG (#59767), fetal bovine
serum (FBS, #F7524), magnesium chloride hexahydrate (#M9272), potassium chloride (#P5405), sodium
phosphate dibasic dihydrate (#30412), sodium chloride (#71376), IGEPAL CA-630 (Nonidet P-40
substitution, #I8896), and Tergitol-type NP-40 (#NP40S) were all bought from Sigma-Aldrich (St. Louis,
MO, USA). An unconjugated, polyclonal rabbit anti-goat antibody (#ab97101), and a polyclonal goat
ACCEPTED MANUSCRIPT
ACCEP
TED M
ANUSC
RIPT
6
antibody against mouse Triggering Receptor Expressed on Myeloid cells 2 (anti-mTREM2, #ab95470)
were both from Abcam (Cambridge, UK). Saponin (#558255) was bought from Merck Millipore
(Darmstadt, Germany). Molecular biology grade 2-mercaptoethanol (#A1108) was from AppliChem
(Darmstadt, Germany). Electran 1,4-Dithiothreithol (Cleland’s reagent, DTT, #443853B) was from VWR
(Radnor, PA, USA). Human apolipoprotein E isoform ε3 (ApoE ε3; #4696) was from BioVision (Milpitas,
CA, USA).
Three specialized phosphate-buffered saline (PBS) buffers with pH7.3 were used in the assay: “regular
PBS” (10 mM Na2HPO4, 2 mM KH2PO4, 2.7 mM KCl, 137 mM NaCl), “S-PBS” (10 mM Na2HPO4, 2 mM
KH2PO4, 0.27 mM KCl, 13.7 mM NaCl), and “Hi-S-PBS” (60.7 mM Na2HPO4, 13.2 mM KH2PO4, 0.27 mM KCl,
13.7 mM NaCl).
Cell culture
All cells were grown in RPMI 1640 medium supplemented with 1 % (v/v) penicillin/streptomycin, 5 % (v/v)
FBS, 50 µM EDTA, and 50 µM 2-mercaptoethanol (cRPMI used as abbreviation) in a cell incubator at
+37 °C with 5 % CO2. The BWZ.36 cells were based on an immortalized T lymphocyte murine cell line
(Sanderson & Shastri, 1994; White et al., 1989) constitutively expressing NFAT/lacZ DNA. Naïve BWZ.36
cells (kindly provided by Dr. Nilabh Shastri, UC Berkeley, CA, USA) and BWZ.36 transfected with murine
TREM2-CD8-CD3ξ pcDNA4 construct (BWZ-mTREM2) (Daws et al., 2003) were used in the analyses.
Cell stimulation and CPRG colorimetry assay
We have previously found that human ApoE is an agonist to murine and human TREM2 (Jendresen,
Årskog, Daws, & Nilsson, 2017), and therefore used ApoE ε3 to stimulate the reporter cells in this study .
ACCEPTED MANUSCRIPT
ACCEP
TED M
ANUSC
RIPT
7
Transparent Maxisorp 96-well plates were coated with polyclonal anti-goat antibody (2.5 µg/mL in S-PBS)
or recombinant ApoE ε3 (15 nM or 300 nM in S-PBS) for 1 hour at +37 °C in a sterile environment.
Coating with S-PBS was used as a negative control. The coating solutions were aspirated and wells were
washed once with S-PBS at room temperature (RT). PMA (3.3 nM) was added to the BWZ-cells before
transferring to the coated Maxisorp plate at a final density of 2.4x10⁵ cells/well in 200 µL cRPMI. To a
proportion of the cells, goat anti-mTREM2 antibody (2 µg/mL) was added before the cells were
transferred to wells coated with anti-goat antibody. Cells treated only with PMA served as a negative
treatment control. The cells were incubated on the plate for 4 hours at +37 °C with 5 % CO2 unless
otherwise stated. The cell viability was tested with Trypan Blue and an Invitrogen Countess automated
cell counter (Thermo Fisher Scientific). The viability was always >90% when used in reporter assays.
Before lysis, cells were carefully washed once with Hi-S-PBS at RT. The lysis buffer consisted of Hi-S-PBS
or regular PBS supplemented with CPRG, MgCl2, a detergent (NP-40, Nonidet P-40, or Saponin), and a
reducing agent (DTT or 2-mercaptoethanol). Cell-free lysis buffer served as background control. The lysis
buffer was freshly prepared before cell lysis in order to avoid losing activity of the reducing agents and
detergents. The lysis buffer was added to all wells and absorbance was read immediately after adding
the lysis buffer (“time point 0”). Absorbance was monitored for another 20 hours.
Based on spectral analyses, specific absorbance was measured at 570 nm, while lysis buffer background
was measured at 700 nm with a SpectraMax 190 plate reader (Molecular Devices, Sunnyvale, CA, USA) or
with an EnVision2104 Multilabel Reader (#2104-0010; Perkin-Elmer Inc., Waltham, MA, USA). The plate
was tightly sealed with plastic adherent as to avoid evaporation and contamination, and incubated at
+37 °C on a VWR rocking platform shaker (40 rpm) between measurements. All experiments were
repeated to a total of three independent experiments performed on different days, and all
measurements were done in triplicates. Since all comparisons were planned before experiments were
ACCEPTED MANUSCRIPT
ACCEP
TED M
ANUSC
RIPT
8
performed, two-way ANOVAs were made and planned comparisons were corrected for multiple
comparisons using the a priori Bonferroni method. In this, the α-level was set at 0.05 and statistical level
defined individually in each experiment dependent on the number of comparisons made as indicated in
the figure legends (figures 3, 4, 5, and 6, and supplementary figures 1 and 2). A two-way ANOVA with
Dunnett’s multiple comparison test was used to evaluate the effect of stimulation time in Figure 7. Time-
dependent linearity of enzymatic recordings was tested with linear regression analysis (figures 2 and 6
and supplementary figures 3 and 4). In figures with data analyzed by two-way ANOVA and multiple
comparisons, the stated p-values are from multiple comparisons. All reported p-values are two-tailed.
A bullet point overview of a suggested experimental protocol is reported in Supporting Information.
Results
Wavelengths for optimal measurements of absorbance
Almost two thirds of the investigated publications (n=95 out of 158) measured absorbance at 595 nm
when monitoring the β-galactosidase activity, as was also done in the original report by Sanderson and
Shastri (Sanderson & Shastri, 1994). Only 30 out of 158 publications measured absorbance at 560-570
nm. Three papers reported absorbance measurement at 540 or 550 nm, while one paper measured at
610 nm. In some papers (n=21 out of 158) there was no information or reference to the wavelength used.
We performed spectral analyses with two different plate readers and compared the optimized lysis
buffer described in this paper (3 mM CPRG, 0.2 % Saponin, 5 mM DTT, and 20 mM MgCl2 in Hi-S-PBS)
with the most commonly used, which was described in the original report (Sanderson & Shastri, 1994);
hereafter referred to as the “standard lysis buffer” (0.15 mM CPRG, 0.125 % Nonidet P-40, 100 mM 2-
ACCEPTED MANUSCRIPT
ACCEP
TED M
ANUSC
RIPT
9
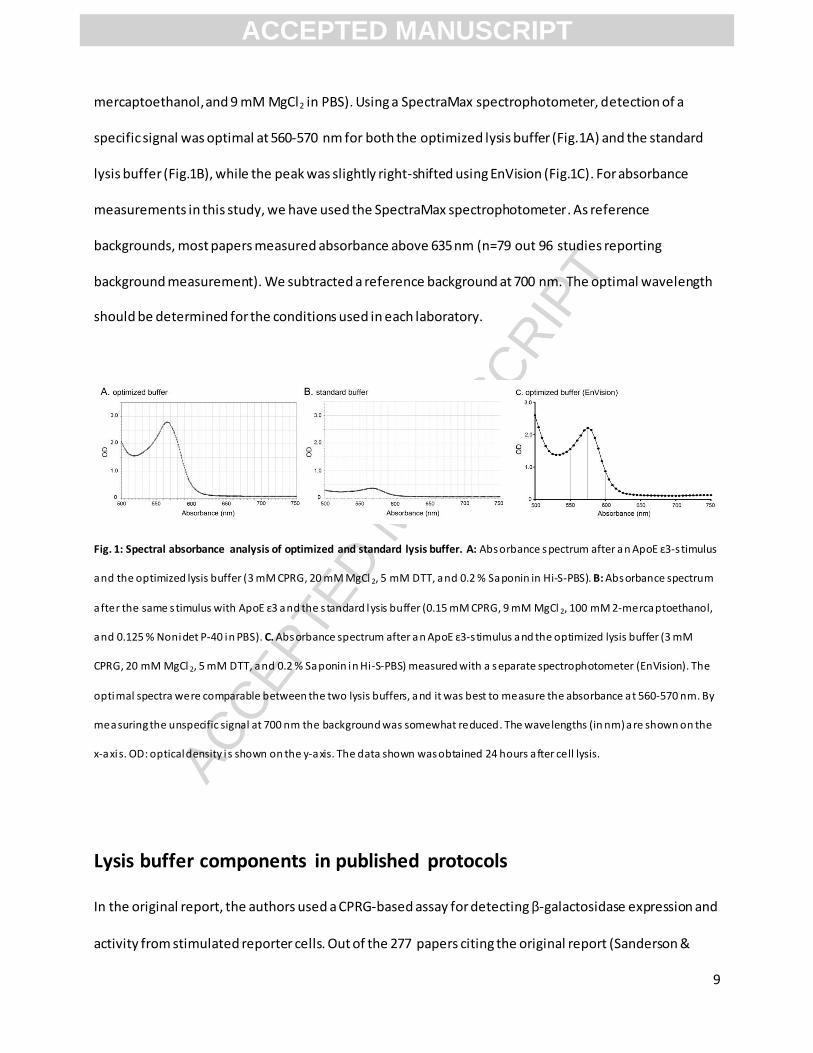
mercaptoethanol, and 9 mM MgCl2 in PBS). Using a SpectraMax spectrophotometer, detection of a
specific signal was optimal at 560-570 nm for both the optimized lysis buffer (Fig.1A) and the standard
lysis buffer (Fig.1B), while the peak was slightly right-shifted using EnVision (Fig.1C). For absorbance
measurements in this study, we have used the SpectraMax spectrophotometer. As reference
backgrounds, most papers measured absorbance above 635 nm (n=79 out 96 studies reporting
background measurement). We subtracted a reference background at 700 nm. The optimal wavelength
should be determined for the conditions used in each laboratory.
Fig. 1: Spectral absorbance analysis of optimized and standard lysis buffer. A: Absorbance s pectrum after an ApoE ε3-s timulus
and the optimized lysis buffer (3 mM CPRG, 20 mM MgCl 2, 5 mM DTT, and 0.2 % Saponin in Hi-S-PBS). B: Absorbance spectrum
after the same stimulus with ApoE ε3 and the s tandard lysis buffer (0.15 mM CPRG, 9 mM MgCl 2, 100 mM 2-mercaptoethanol,
and 0.125 % Nonidet P-40 in PBS). C. Absorbance spectrum after a n ApoE ε3-s timulus and the optimized lysis buffer (3 mM
CPRG, 20 mM MgCl 2, 5 mM DTT, and 0.2 % Saponin in Hi-S-PBS) measured with a separate spectrophotometer (EnVision). The
optimal spectra were comparable between the two lysis buffers, and it was best to measure the absorbance at 560-570 nm. By
measuring the unspecific signal at 700 nm the background was somewhat reduced. The wavelengths (in nm) are shown on the
x-axis. OD: optical density i s shown on the y-axis. The data shown was obtained 24 hours after cell lysis.
Lysis buffer components in published protocols
In the original report, the authors used a CPRG-based assay for detecting β-galactosidase expression and
activity from stimulated reporter cells. Out of the 277 papers citing the original report (Sanderson &
ACCEPTED MANUSCRIPT
ACCEP
TED M
ANUSC
RIPT
10
Shastri, 1994), 158 papers were selected for further methodological assessment as described in the
Methods section. By extensively reviewing the literature, we found that the large majority of the 158
papers used the originally reported protocol (Sanderson & Shastri, 1994): 0.15 mM CPRG, 100 mM 2-
mercaptoethanol, 9 mM MgCl2, and 0.125 % Nonidet P-40. Nonidet P-40 is an obsolete name which has
been replaced with IGEPAL CA-630 (Sigma-Aldrich). For consistency with previous publications, however,
we have used the name Nonidet P-40. Unfortunately, Nonidet P-40 (octyl phenoxypolyethoxyethanol)
can be abbreviated inaccurately as NP-40. However, there is a distinct detergent called NP-40 (nonyl
phenoxypolyethoxyethanol). As a consequence of the confusion on the name NP-40, and a general lack
of product numbers in the investigated publications, it is likely that some papers have used NP -40 but
written Nonidet P-40, or vice-versa. Table 1 shows an overview of lysis buffer components reported in
the literature. A total of 45 out of the 158 publications using CPRG did not provide information about
lysis buffer composition, nor did they refer to methods used in other publications.
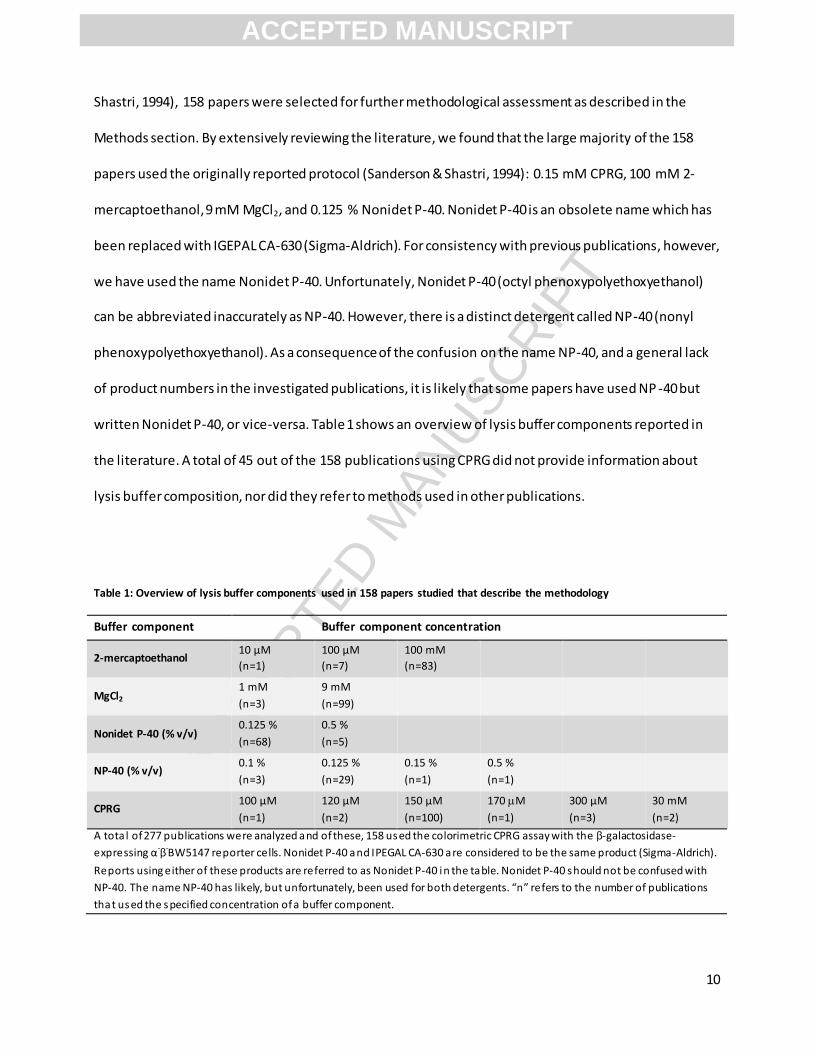
Table 1: Overview of lysis buffer components used in 158 papers studied that describe the methodology
Buffer component Buffer component concentration
2-mercaptoethanol 10 µM
(n=1)
100 µM
(n=7)
100 mM
(n=83)
MgCl2 1 mM
(n=3)
9 mM
(n=99)
Nonidet P-40 (% v/v) 0.125 %
(n=68)
0.5 %
(n=5)
NP-40 (% v/v) 0.1 %
(n=3)
0.125 %
(n=29)
0.15 %
(n=1)
0.5 %
(n=1)
CPRG 100 µM
(n=1)
120 µM
(n=2)
150 µM
(n=100)
170 M
(n=1)
300 µM
(n=3)
30 mM
(n=2)
A tota l of 277 publications were analyzed and of these, 158 used the colorimetric CPRG assay with the β-galactosidase-
expressing α-β
-BW5147 reporter cells. Nonidet P-40 and IPEGAL CA-630 are considered to be the same product (Sigma-Aldrich).
Reports using either of these products are referred to as Nonidet P-40 in the table. Nonidet P-40 should not be confused with
NP-40. The name NP-40 has likely, but unfortunately, been used for both detergents. “n” refers to the number of publications
that used the specified concentration of a buffer component.
ACCEPTED MANUSCRIPT
ACCEP
TED M
ANUSC
RIPT
11
As β-galactosidase activity is affected by the surrounding environment, we found it essential to ensure
that the conditions were optimal for the enzymatic activity. As enzyme activity should be linear with time
when collecting data, effects of each component in the original lysis buffer was tested (CPRG substrate,
reducing agent, detergent, as well as phosphates and ions) . This was done to ensure that 1) the chosen
component at the concentration used gave equal or higher specific signals than the component did in
the original report, and 2) the chosen component at the concentration used gave linear time-dependent
increasing signal when adding the CPRG substrate-containing lysis buffer to the reporter cells.
In our experiments, we used an altered PBS with six-fold increased phosphate concentration, two-fold
increased Mg2+ concentration, and three-fold reduced Cl- concentration. This buffer composition was
chosen since previous studies have shown that these ions affect -galactosidase activity (Crescimbeni,
Nolan, Clop, Marín, & Perillo, 2010; Hill & Huber, 1971; Juers et al., 2000, 2009, 2012; Roth & Huber,
1996; Sutendra, Wong, Fraser, & Huber, 2007; Tenu et al., 1972; Wutor, Togo, & Pletschke, 2007) .
However, these lysis buffer modifications of ion concentrations did not affect the results (Supplementary
figure 1).
A Saponin-containing lysis buffer gives a more sensitive monitoring of
β-galactosidase activity
In 73 of the 158 papers, Nonidet P-40 was used as detergent in the lysis buffer, while 34 studies used NP-
40. Nonidet P-40 and NP-40 were used at concentrations between 0.1 % and 0.5 %, with 0.125 % being
the most commonly used concentration for both detergents (n=68 for Nonidet P-40, and n=29 for NP-40).
No other detergent was reported in any of the 158 papers.
ACCEPTED MANUSCRIPT
ACCEP
TED M
ANUSC
RIPT
12
We tested the effect of using either 0.125 % or 0.5 % Nonidet P-40 as compared to 0.125 % NP-40 or 0.2 %
Saponin in a lysis buffer with 3 mM CPRG, 20 mM MgCl2, and 5 mM DTT in Hi-S-PBS. Saponin was chosen
due to its ability to permeate the cell membrane, but not organelle membranes, as to avoid releasing
factors from organelles that could possibly influence the expression of β-galactosidase or its activity.
At optimal conditions of cell lysis and β-galactosidase enzyme activity, reactions between β-galactosidase
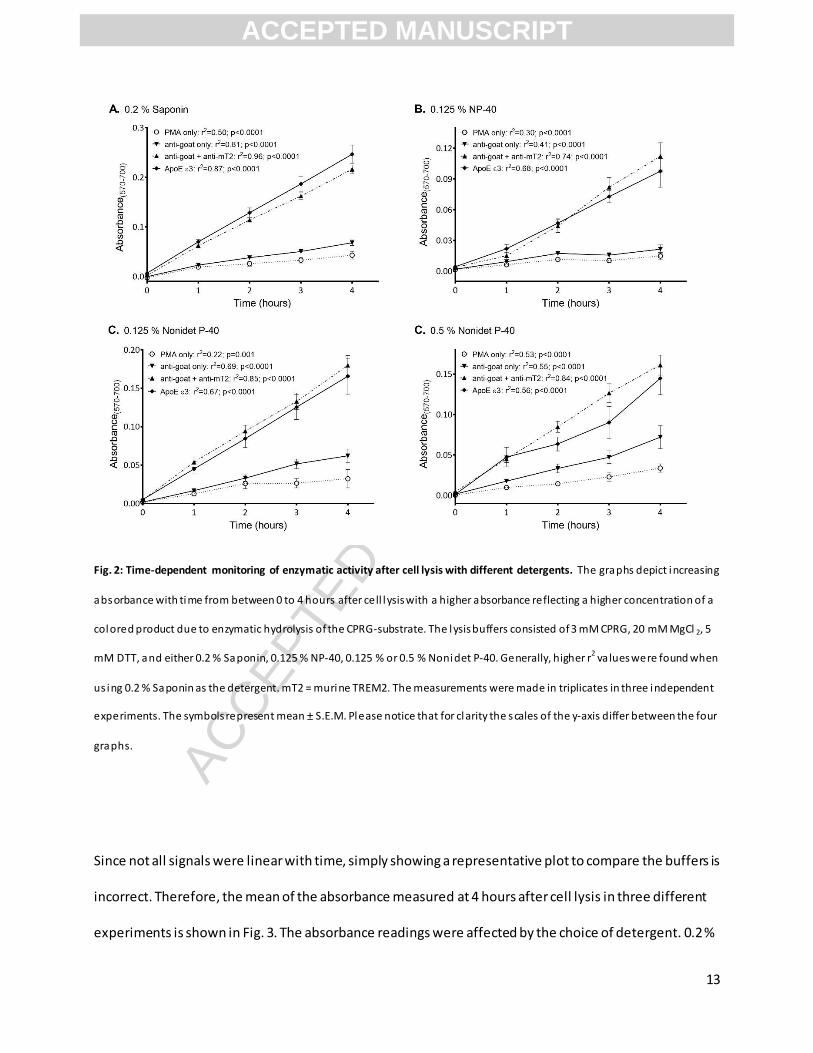
and its substrate (here CPRG) should be linear with time. Interestingly, lysis buffers containing 0.5 %
Nonidet P-40 (Fig. 2D) or 0.125 % NP-40 (Fig. 2B) resulted in partially non-linear absorbance recording of
enzymatic activity, which contrasted with linear recording when instead using Saponin (Fig. 2A). The
detergents might interrupt the interactions between β-galactosidase and its substrate, or they might
permeate nuclear membranes, interfering with measurements of β-galactosidase activity.
ACCEPTED MANUSCRIPT
ACCEP
TED M
ANUSC
RIPT
13
Fig. 2: Time-dependent monitoring of enzymatic activity after cell lysis with different detergents. The graphs depict increasing
absorbance with time from between 0 to 4 hours after cell lysis with a higher absorbance reflecting a higher concentration of a
colored product due to enzymatic hydrolysis of the CPRG-substrate. The lysis buffers consisted of 3 mM CPRG, 20 mM MgCl 2, 5
mM DTT, and either 0.2 % Saponin, 0.125 % NP-40, 0.125 % or 0.5 % Nonidet P-40. Generally, higher r2 va lues were found when
us ing 0.2 % Saponin as the detergent. mT2 = murine TREM2. The measurements were made in triplicates in three independent
experiments. The symbols represent mean ± S.E.M. Please notice that for clarity the scales of the y-axis differ between the four
graphs.
Since not all signals were linear with time, simply showing a representative plot to compare the buffers is
incorrect. Therefore, the mean of the absorbance measured at 4 hours after cell lysis in three different
experiments is shown in Fig. 3. The absorbance readings were affected by the choice of detergent. 0.2 %
ACCEPTED MANUSCRIPT
ACCEP
TED M
ANUSC
RIPT
14
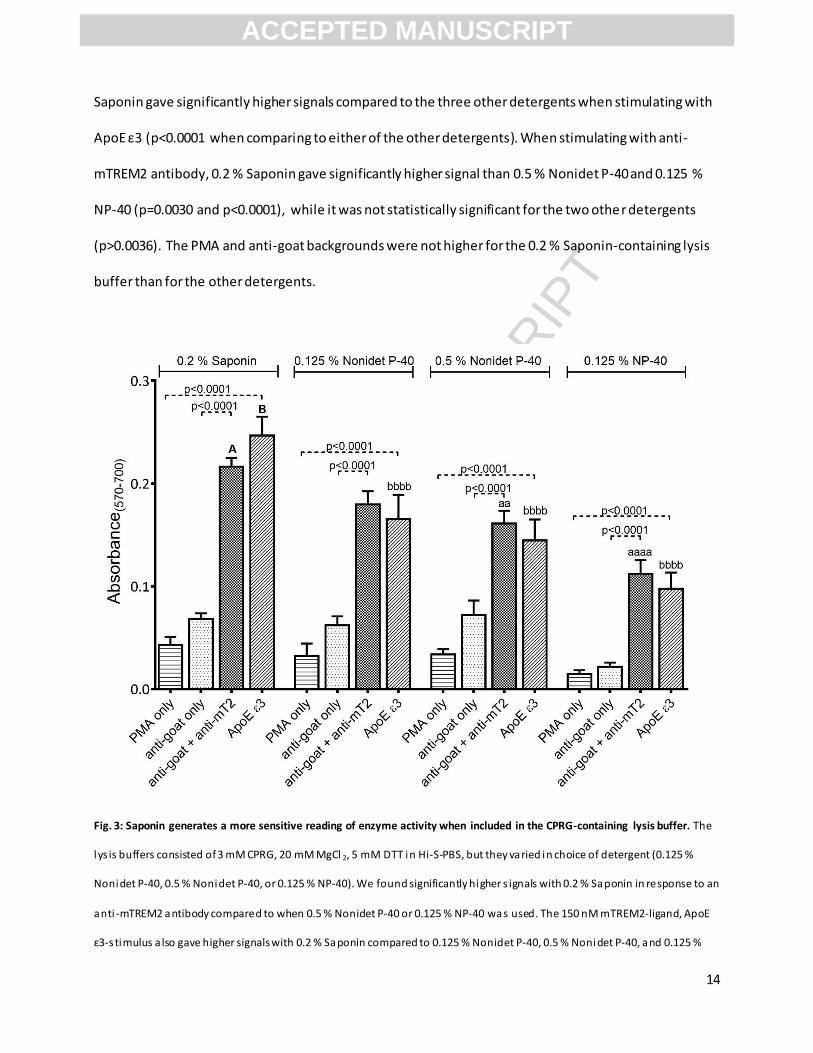
Saponin gave significantly higher signals compared to the three other detergents when stimulating with
ApoE ε3 (p<0.0001 when comparing to either of the other detergents). When stimulating with anti-
mTREM2 antibody, 0.2 % Saponin gave significantly higher signal than 0.5 % Nonidet P-40 and 0.125 %
NP-40 (p=0.0030 and p<0.0001), while it was not statistically significant for the two other detergents
(p>0.0036). The PMA and anti-goat backgrounds were not higher for the 0.2 % Saponin-containing lysis
buffer than for the other detergents.
Fig. 3: Saponin generates a more sensitive reading of enzyme activity when included in the CPRG-containing lysis buffer. The
lys is buffers consisted of 3 mM CPRG, 20 mM MgCl 2, 5 mM DTT in Hi-S-PBS, but they varied in choice of detergent (0.125 %
Nonidet P-40, 0.5 % Nonidet P-40, or 0.125 % NP-40). We found significantly higher s ignals with 0.2 % Saponin in response to an
anti -mTREM2 antibody compared to when 0.5 % Nonidet P-40 or 0.125 % NP-40 was used. The 150 nM mTREM2-ligand, ApoE
ε3-s timulus a lso gave higher signals with 0.2 % Saponin compared to 0.125 % Nonidet P-40, 0.5 % Nonidet P-40, and 0.125 %
ACCEPTED MANUSCRIPT
ACCEP
TED M
ANUSC
RIPT
15
NP-40. The background signals did not vary s ignificantly between the detergents. For a ll detergents, the signals for s timulation
with antibody or l igand were significantly higher than the corresponding backgrounds. The number of planned comparisons
were 14, and with an α level at 0.05, s tatistical s ignificance level was set at p<0.0036. Small letters indicate statistical
s ignificance level: aa: p=0.0030 compared to column A, aaaa: p<0.0001 compared to column A, bbbb: p<0.0001 compa red to
column B. mT2 = murine TREM2. The graphs depict mean S.E.M. from three independent experiments each performed with
tripl icates. Data shown was obtained by reading enzyme activity at 4 hours after cell lysis.
DTT as an alternative to 2-mercaptoethanol
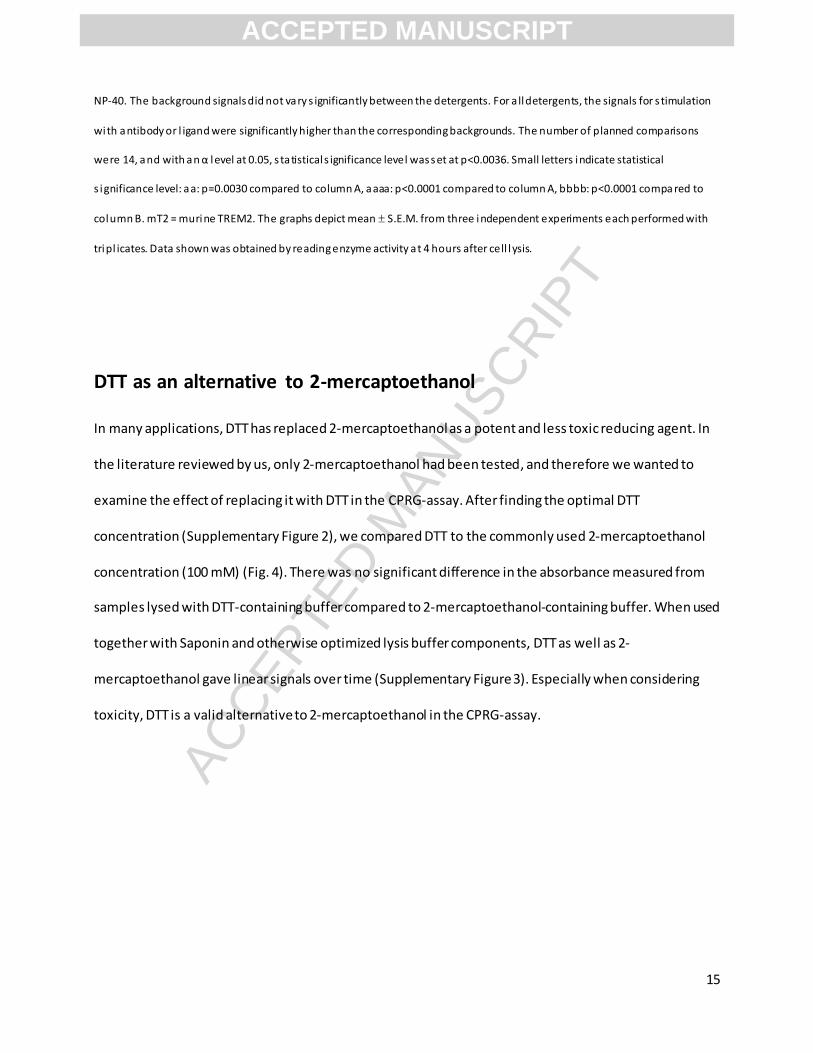
In many applications, DTT has replaced 2-mercaptoethanol as a potent and less toxic reducing agent. In
the literature reviewed by us, only 2-mercaptoethanol had been tested, and therefore we wanted to
examine the effect of replacing it with DTT in the CPRG-assay. After finding the optimal DTT
concentration (Supplementary Figure 2), we compared DTT to the commonly used 2-mercaptoethanol
concentration (100 mM) (Fig. 4). There was no significant difference in the absorbance measured from
samples lysed with DTT-containing buffer compared to 2-mercaptoethanol-containing buffer. When used
together with Saponin and otherwise optimized lysis buffer components, DTT as well as 2-
mercaptoethanol gave linear signals over time (Supplementary Figure 3). Especially when considering
toxicity, DTT is a valid alternative to 2-mercaptoethanol in the CPRG-assay.
ACCEPTED MANUSCRIPT
ACCEP
TED M
ANUSC
RIPT
16
Fig. 4: Replacing 2-mercaptoethanol with DTT does not significantly affect β-galactosidase activity in the CPRG assay. When
us ing a lysis buffer with DTT (5 mM) or 2-mercaptoethanol (100 mM), the enzymatic activity did not statistically differ. The lysis
buffer consisted of 3 mM CPRG, 20 mM MgCl 2, 0.2 % Saponin in Hi-S-PBS with either 5 mM DTT or 100 mM 2-mercaptoethanol.
mT2 = murine TREM2. For both reducing agents, the signals for s timulation with antibody or l igand were significantly higher
than the corresponding backgrounds. The number of planned comparisons were 6, and with an α level at 0.05, s tatistical
s ignificance level was set at p<0.008. The measurements were ma de in triplicates in three independent experiments. The bars
represent mean S.E.M. The data shown was obtained 4 hours after cell lysis.
Increased reproducibility with a higher CPRG concentration
In most publications, the CPRG concentration in the lysis buffer was 0.15 mM (n=100 out of 158)
consistent with what was originally reported (Sanderson & Shastri, 1994). When first using the lysis
buffer described in the original report, we found a slightly decreased signal with time (after
ACCEPTED MANUSCRIPT
ACCEP
TED M
ANUSC
RIPT
17
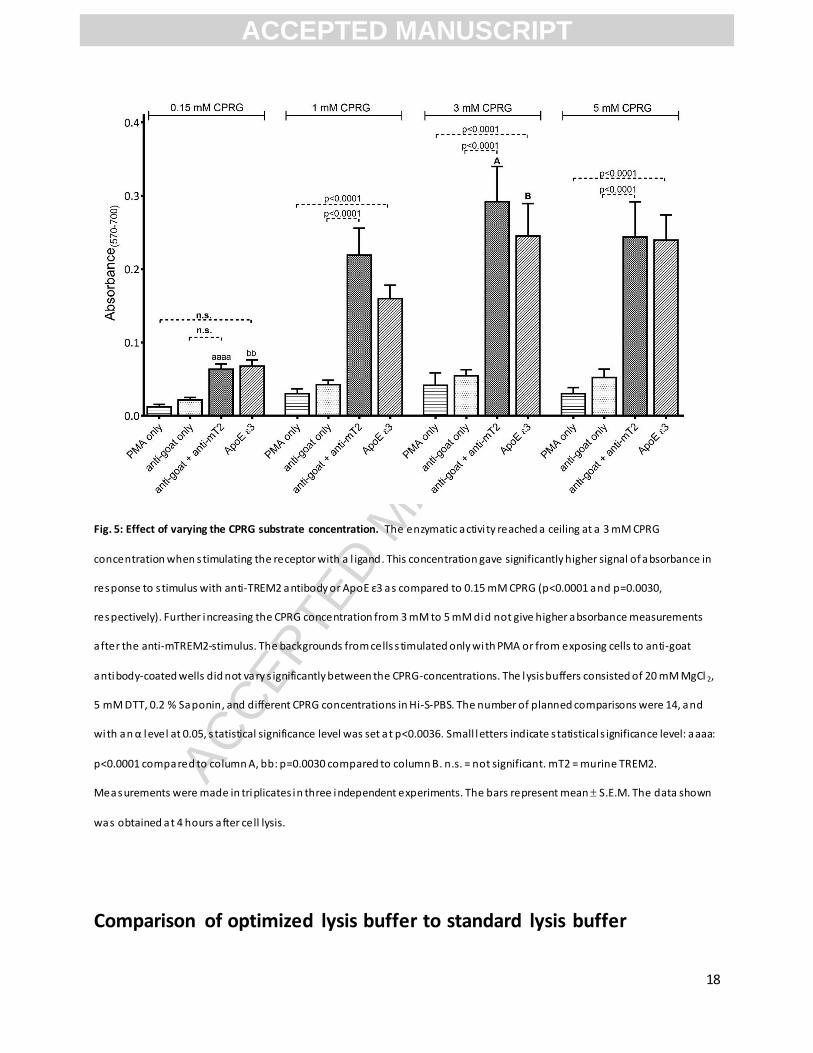
approximately 20 hours). To ensure that the CPRG substrate concentration was not a limiting factor to
the enzyme activity, we tested higher concentrations of CPRG (1-5 mM) and found that the enzymatic
reaction was far from saturated with substrate. The signal reached a maximum at a 3 mM CPRG-
concentration (Fig. 5), which was then used in the optimized lysis buffer. The signal for anti-mTREM2
antibody-stimulation and ApoE ε3-stimulation were both significantly higher when using 3 mM CPRG
than 0.15 mM CPRG (p<0.0001 and p=0.0030, respectively). For 1, 3, and 5 mM CPRG, both stimulation
with antibody and with ApoE ε3 gave significantly higher signals than the corresponding backgrounds.
When 0.15 mM CPRG was used, these signals were not significantly higher than the corresponding
backgrounds. The enzymatic reactions were linear over time (Supplementary Figure 4) indicating high
enzymatic stability, minimal substrate depletion, and no product inhibition. In general we found that
using substrate at a saturating concentration increased reproducibility.
ACCEPTED MANUSCRIPT
ACCEP
TED M
ANUSC
RIPT
18
Fig. 5: Effect of varying the CPRG substrate concentration. The enzymatic activi ty reached a ceiling at a 3 mM CPRG
concentration when s timulating the receptor with a l igand. This concentration gave significantly higher signal of absorbance in
response to s timulus with anti-TREM2 antibody or ApoE ε3 as compared to 0.15 mM CPRG (p<0.0001 and p=0.0030,
respectively). Further increasing the CPRG concentration from 3 mM to 5 mM did not give higher absorbance measurements
after the anti-mTREM2-stimulus. The backgrounds from cells s timulated only with PMA or from exposing cells to anti-goat
antibody-coated wells did not vary s ignificantly between the CPRG-concentrations. The lysis buffers consisted of 20 mM MgCl 2,
5 mM DTT, 0.2 % Saponin, and different CPRG concentrations in Hi-S-PBS. The number of planned comparisons were 14, and
with an α level at 0.05, s tatistical significance level was set at p<0.0036. Small letters indicate s tatistical s ignificance level: aaaa:
p<0.0001 compared to column A, bb: p=0.0030 compared to column B. n.s. = not significant. mT2 = murine TREM2.
Measurements were made in triplicates in three independent experiments. The bars represent mean S.E.M. The data shown
was obtained at 4 hours after cell lysis.
Comparison of optimized lysis buffer to standard lysis buffer
ACCEPTED MANUSCRIPT
ACCEP
TED M
ANUSC
RIPT
19
We compared the effectiveness of the optimized lysis buffer with higher substrate concentration (3 mM
CPRG) and an alternative detergent (0.2 % Saponin) to that of the standard lysis buffer (Sanderson &
Shastri, 1994) with 0.125 % Nonidet P-40 and lower substrate concentration (0.15 mM CPRG). We also
tested 0.125 % NP-40 as this was used in 29 papers at the same concentration as Nonidet P-40.
Absorbance measured following specific stimulation of TREM2 was two-fivefold higher in the optimized
lysis buffer when measured 4 hours after lysis, and three-sixfold higher when measuring 20 hours after
lysis when compared to both standard lysis buffer and an NP-40-containing variant (Fig. 6). The signals
after a stimulus with ApoE ε3 (300 nM) or an anti-mTREM2 antibody were significantly higher when
using the optimized lysis buffer as compared to the standard lysis buffer with 0.125 % Nonidet P-40 or
0.125 % NP-40 (p<0.0001 for both stimulations at both time points). The 300 nM ApoE ε3 stimulation
gave up to 4-5x higher signals using the optimized lysis buffer as compared to the standard lysis buffer,
while the anti-mTREM2 gave up to a 3x higher signal. Importantly, signals from anti-mTREM2- or 300
nM ApoE ε3-stimulation were significantly higher than the corresponding backgrounds in the optimized
lysis buffer (p<0.0001 for both stimulations), while only the 300 nM ApoE ε3-stimulation gave
significantly higher signals than the background when using the standard buffer with Nonidet P -40, but
only at the 4-hour time point (p=0.002). In the NP-40-containing buffer neither the ApoE ε3- nor the
antibody-stimulation gave signals that were significantly higher than the backgrounds. Backgrounds from
PMA only or anti-goat only did not vary significantly between the three buffers at either time point.
When using the optimized lysis buffer, the absorbance was linear over time. Conversely, absorbance was
not linear over time when using the standard lysis buffer or the NP-40 variant of it, as indicated by the
increasing ratio from 4 hours (Fig. 6A) to 20 hours (Fig. 6B) of specific signals between the optimized lysis
buffer and the standard lysis buffer including the NP-40 variant. The linearity of the signals when using
the three different lysis buffers varied, as can be observed in Fig. 6C-E.
ACCEPTED MANUSCRIPT

ACCEP
TED M
ANUSC
RIPT
20
Fig. 6: Comparison of the optimized lysis buffer with the standard lysis buffer and an NP-40-containing variant of it. The
optimized lysis buffer gave more linear time-dependent response and higher signals than the s tandard lysis buffer with either
0.125 % Nonidet P-40 or 0.125 % NP-40. A: Absorbance measured at 4 hours after lysis. B: Absorbance measured at 20 hours
after lysis. C: Absorbance from start until 4 hours when using the optimized lysis buffer. D: Absorbance from start until 4 hours
when using the standard lysis buffer containing 0.125 % Nonidet P-40. E: Absorbance from start until 4 hours when using the
s tandard lysis buffer containing 0.125 % NP-40. The number of planned comparisons were 13, and with an α level at 0.05,
statistical significance level was set at p<0.0038. Small letters indicate statistical significance level: aaaa: p<0.0001 compared to
column A, bbbb: p<0.0001 compared to column B. n.s. = not significant. mT2 = murine TREM2. For the sake of clarity, there are
di fferent scales on the y-axis in graphs shown in A-E. The measurements were made in triplicates in three independent
experiments. The bars and symbols represent mean S.E.M.
The signal depends on the time of reporter cell stimulation
ACCEPTED MANUSCRIPT

ACCEP
TED M
ANUSC
RIPT
21
As time is important when studying interactions between receptors and their ligands, we were intrigued
to find that most papers used overnight stimulation or equivalent (15-20 hours) independent on whether
they were performing co-culture experiments (n=100 out of total 123 reports) or direct stimulations
between a ligand and receptor-expressing cells (n=20 out of 31). Some papers reported stimulation
times of 24 hours (n=18 for co-culturing, and n=4 for direct stimulation), while few reported direct
stimulation of >24 hours (n=3). Likewise, <15 hours stimulation was rarely used (n=5 for co-culturing,
n=4 for direct stimulation) (Supplementary Table 2). Some reports (n=15) did not specify stimulation
time.
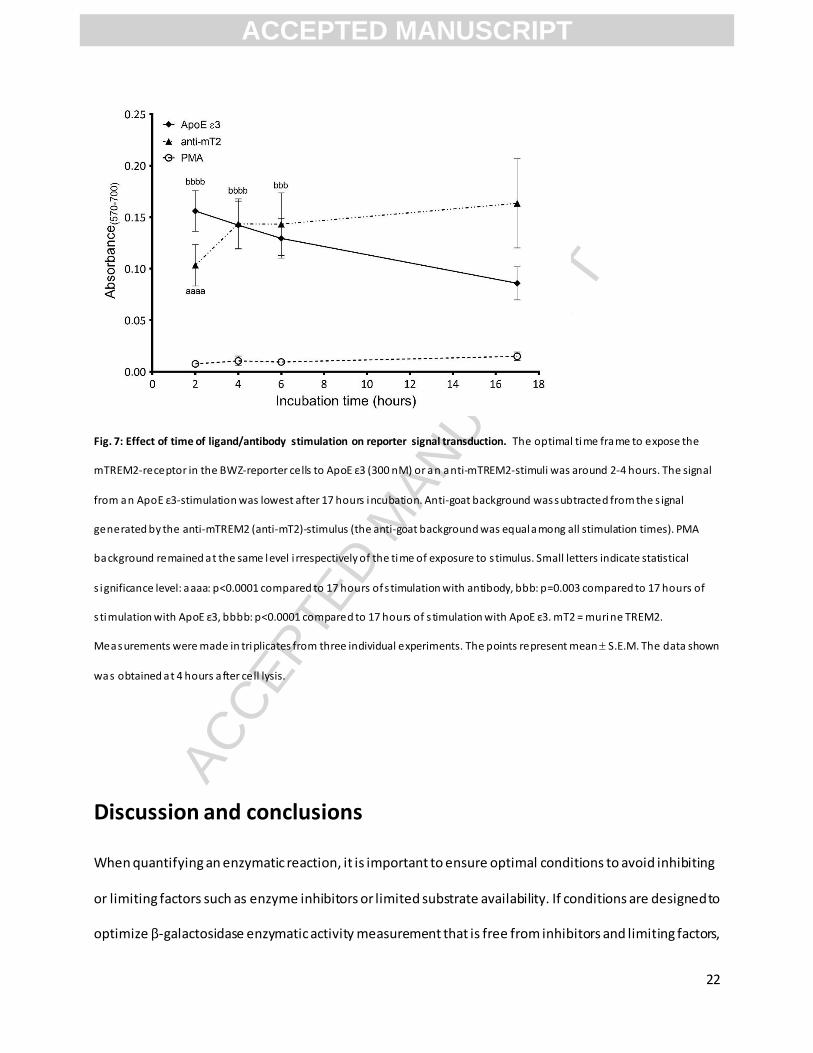
As many receptor/ligand-interactions are fast reactions and too prolonged stimulation can lead to
desensitization, we investigated the optimal stimulation time between mTREM2 and its ligand , ApoE ε3.
We explored stimulations in a range of 2-6 hours as well as 17 hours, and found that a short stimulation
time of 2-4 hours gave a significantly higher signals, as shown by increased absorbance, than when the
stimulation lasted for 17 hours (Fig. 7); for anti-mTREM2 stimulation (p<0.0001 for 2h vs. 17h, while n.s.
for 4h vs. 17h) and for ApoE ε3-stimulation (p<0.0001 for both 2h and 4h vs. 17h). Conversely,
stimulation with antibody cross-linking gave increasing absorbance over the same time-period (Fig. 7).
Thus, the optimal timing might be different for various receptor/ligand-interactions. It is likely that direct
interactions between ligands and reporter cells are quicker than between reporter cells and ligand-
bearing living cells. However, in general it is worth determining the optimal stimulation time when
searching for and quantifying ligand stimulation of the reporter cells, and to report the stimulation time
used.
ACCEPTED MANUSCRIPT
ACCEP
TED M
ANUSC
RIPT
22
Fig. 7: Effect of time of ligand/antibody stimulation on reporter signal transduction. The optimal time frame to expose the
mTREM2-receptor in the BWZ-reporter cells to ApoE ε3 (300 nM) or an anti-mTREM2-stimuli was around 2-4 hours. The signal
from an ApoE ε3-stimulation was lowest after 17 hours incubation. Anti-goat background was subtracted from the s ignal
generated by the anti-mTREM2 (anti-mT2)-stimulus (the anti-goat background was equal among all stimulation times). PMA
background remained at the same level i rrespectively of the time of exposure to s timulus. Small letters indicate statistical
s ignificance level: aaaa: p<0.0001 compared to 17 hours of s timulation with antibody, bbb: p=0.003 compared to 17 hours of
s timulation with ApoE ε3, bbbb: p<0.0001 compared to 17 hours of s timulation with ApoE ε3. mT2 = murine TREM2.
Measurements were made in triplicates from three individual experiments. The points represent mean S.E.M. The data shown
was obtained at 4 hours after cell lysis.
Discussion and conclusions
When quantifying an enzymatic reaction, it is important to ensure optimal conditions to avoid inhibiting
or limiting factors such as enzyme inhibitors or limited substrate availability. If conditions are designed to
optimize β-galactosidase enzymatic activity measurement that is free from inhibitors and limiting factors,
ACCEPTED MANUSCRIPT

ACCEP
TED M
ANUSC
RIPT
23
the reaction between β-galactosidase and CPRG substrate should be linear with time. Optimal conditions
were ensured by thorough testing of ideal pH, temperature, ion concentrations, and substrate
concentration in the presence of different reducing agents and cell-lysing detergents. After an extensive
literature review, we found a general lack of information about concentrations of lysis buffer
components and sometimes even lack of information about time during which reporter cells were
exposed to the ligand stimulus. Among the publications that did provide information about lysis buffer
and stimulation time, the large majority referred to the lysis buffer used in the original report (Sanderson
& Shastri, 1994) and stimulated cells 15-20 hours. With 277 citations, the original paper has laid the
foundations for a vast number of experiments investigating ligands for specific chimeric antigen
receptors in reporter cells. With 96 citations in recent years (2010-2017), the paper is still highly cited,
and of the 96 citing papers, 61 of the papers used CPRG colorimetry. In 158 of the publications citing the
original paper, the colorimetric CPRG assay was used to detect of stimulation of receptor signal
transduction in the reporter cells. Presumably, most published results are valid, but unfortunately many
experiments were likely done with suboptimal lysis conditions meaning that small signals or variations in
signals might have gone unnoticed. We propose using a higher concentration of CPRG in the lysis buffer
and to substitute Nonidet P-40 or NP-40 with Saponin. For decreased toxic exposure, 2-mercaptoethanol
can be substituted with DTT. We also showed that it is important to test and report various times of
ligand stimulation when using the reporter cells. Our suggested optimized method is provided as bullet
points in Supporting Information.
With our studies, we provide evidence for an optimized protocol for the CPRG-based colorimetric assay
in antigen-presenting reporter cell assays using the α -β-BW5147-based cell lines as originally described
(Sanderson & Shastri, 1994). With up to six-fold higher signals from stimulated cells and more stable,
linear absorbance readout over time, the protocol should be valuable to many researchers examining
ACCEPTED MANUSCRIPT
ACCEP
TED M
ANUSC
RIPT
24
ligand-receptor interactions since it gives more consistent and reproducible results and enables
detection of ligands only exerting weak receptor stimulation.
Acknowledgements
We thank senior research engineer Vibeke Årskog for valuable discussions. This work was supported by
funding from University of Oslo, Anders Jahres stiftelse and a JPND grant (APGeM – NFR #237250;
Tormod Fladby) to LNGN.
References
Crescimbeni, M. C., Nolan, V., Clop, P. D., Marín, G. N., & Perillo, M. A. (2010). Activity modulation and
reusability of β-D-galactosidase confined in sol-gel derived porous silicate glass. Colloids and
Surfaces B: Biointerfaces, 76(2), 387–396. https://doi.org/10.1016/j.colsurfb.2009.11.005
Daws, M. R., Sullam, P. M., Niemi, E. C., Chen, T. T., Tchao, N. K., & Seaman, W. E. (2003). Pattern
recognition by TREM-2: binding of anionic ligands. The Journal of Immunology, 171(2), 594–599.
https://doi.org/10.4049/jimmunol.171.2.594
Eustice, D. C., Feldman, P. A., Colberg-Poley, A. M., Buckery, R. M., & Neubauer, R. H. (1991). A sensitive
method for the detection of β-galactosidase in transfected mammalian cells. BioTechniques, 11(6),
739-740-743.
ACCEPTED MANUSCRIPT
ACCEP
TED M
ANUSC
RIPT
25
Hill, J. A., & Huber, R. E. (1971). Effects of various concentrations of Na+ and Mg2+ on the activity of β -
galactosidase. Biochimica et Biophysica Acta, 250, 530–537.
https://doi.org/10.1017/CBO9781107415324.004
Huber, R. E., Parfett, C., Woulfe-Flanagan, H., & Thompson, D. J. (1979). Interaction of divalent cations
with β-galactosidase (Escherichia coli). Biochemistry, 18(19), 4090–4095.
https://doi.org/10.1021/bi00586a005
Jendresen, C., Årskog, V., Daws, M. R., & Nilsson, L. N. G. (2017). The Alzheimer’s disease risk factors
apolipoprotein E and TREM2 are linked in a receptor signaling pathway. Journal of
Neuroinflammation, 14(1), 59. https://doi.org/10.1186/s12974-017-0835-4
Juers, D. H., Jacobson, R. H., Wigley, D., Zhang, X.-J., Huber, R. E., Tronrud, D. E., & Matthews, B. W.
(2000). High resolution refinement of β-galactosidase in a new crystal form reveals multiple metal-
binding sites and provides a structural basis for alpha-complementation. Protein Science, 9, 1685–
1699. https://doi.org/10.1110/ps.9.9.1685
Juers, D. H., Matthews, B. W., & Huber, R. E. (2012). LacZ β-galactosidase: Structure and function of an
enzyme of historical and molecular biological importance. Protein Science, 21(12), 1792–1807.
https://doi.org/10.1002/pro.2165
Juers, D. H., Rob, B., Dugdale, M. L., Rahimzadeh, N., Giang, C., Lee, M., … Huber, R. E. (2009). Direct and
indirect roles of His-418 in metal binding and in the activity of β-galactosidase (E. coli). Protein
Science, 18(6), 1281–1292. https://doi.org/10.1002/pro.140
Pardee, A. B., Jacob, F., & Monod, J. (1959). The genetic control and cytoplasmic expression of
“inducibility” in the synthesis of β-galactosidase by E. coli . Journal of Molecular Biology, 1, 165–
178. https://doi.org/10.1016/S0022-2836(59)80045-0
Roth, N. J., & Huber, R. E. (1994). Site directed substitutions suggest that His-418 of β-galactosidase ( E.
coli ) is a ligand to Mg2+. Biochemical and Biophysical Research Communications, 201(2), 866–870.
ACCEPTED MANUSCRIPT
ACCEP
TED M
ANUSC
RIPT
26
https://doi.org/doi.org/10.1006/bbrc.1994.1781
Roth, N. J., & Huber, R. E. (1996). Glu-416 of β-galactosidase (Escherichia coli) is a Mg2+ ligand and β-
galactosidases with substitutions for Glu-416 are inactivated, rather than activated, by MG2+.
Biochemical and Biophysical Research Communications, 219(1), 111–115.
https://doi.org/10.1006/bbrc.1996.0190
Sanderson, S., & Shastri, N. (1994). LacZ inducible, antigen/MHC-specific T cell hybrids. International
Immunology, 6(3), 369–376.
Sutendra, G., Wong, S., Fraser, M. E., & Huber, R. E. (2007). β-galactosidase (Escherichia coli) has a
second catalytically important Mg2+ site. Biochemical and Biophysical Research Communications,
352(2), 566–570. https://doi.org/10.1016/j.bbrc.2006.11.061
Tenu, J.-P., Viratelle, O. M., Garnier, J., & Yon, J. (1971). pH dependence of the activity of β-galactosidase
from Eschericia coli. European Journal of Biochemistry, 20, 363–370.
https://doi.org/10.1111/j.1432-1033.1971.tb01402.x
Tenu, J.-P., Viratelle, O. M., & Yon, J. (1972). Kinetic study of the activation process of β-galactosidase
from Escherischia coli by Mg2+. European Journal of Biochemistry / FEBS, 26(1), 112–118.
White, J., Blackman, M., Bill, J., Kappler, J., Marrack, P., Gold, D. P., & Born, W. (1989). Two better cell
lines for making hybridomas expressing specific T cell receptors. The Journal of Immunology, 143(6),
1822–1825.
Wutor, V. C., Togo, C. A., & Pletschke, B. I. (2007). The effect of physico-chemical parameters and
chemical compounds on the activity of β-D-galactosidase (B-GAL), a marker enzyme for indicator
microorganisms in water. Chemosphere, 68, 622–627.
https://doi.org/10.1016/j.chemosphere.2007.02.050
ACCEPTED MANUSCRIPT
ACCEP
TED M
ANUSC
RIPT
27
Fig. 8: Spectral absorbance analysis of optimized and standard lysis buffer. A: Absorbance spectrum after an ApoE ε3-s timulus
and the optimized lysis buffer (3 mM CPRG, 20 mM MgCl 2, 5 mM DTT, and 0.2 % Saponin in Hi-S-PBS). B: Absorbance spectrum
after the same stimulus with ApoE ε3 and the s tandard lysis buffer (0.15 mM CPRG, 9 mM MgCl 2, 100 mM 2-mercaptoethanol,
and 0.125 % Nonidet P-40 in PBS). C. Absorbance spectrum after an ApoE ε3-s timulus and the optimized lysis buffer (3 mM
CPRG, 20 mM MgCl 2, 5 mM DTT, and 0.2 % Saponin in Hi-S-PBS) measured with a separate spectrophotometer (EnVision). The
optimal spectra were comparable between the two lysis buffers, and it was best to measure the absorbance at 560-570 nm. By
measuring the unspecific signal at 700 nm the background was somewhat reduced. The wavelengths (in nm) are shown on the
x-axis. OD: optical density i s shown on the y-axis. The data shown was obtained 24 hours after cell lysis.
Fig. 9: Time-dependent monitoring of enzymatic activity after cell lysis with different detergents. The graphs depict increasing
absorbance with time from between 0 to 4 hours after cell lysis with a higher absorbance reflecting a higher concentration of a
colored product due to enzymatic hydrolysis of the CPRG-substrate. The lysis buffers consisted of 3 mM CPRG, 20 mM MgCl 2, 5
mM DTT, and either 0.2 % Saponin, 0.125 % NP-40, 0.125 % or 0.5 % Nonidet P-40. Generally, higher r2 va lues were found when
us ing 0.2 % Saponin as the detergent. mT2 = murine TREM2. The measurements were made in triplicates in three independent
experiments. The symbols represent mean ± S.E.M. Please notice that for clarity the scales of the y-axis differ between the four
graphs.
Fig. 10: Saponin generates a more sensitive reading of enzyme activity when included in the CPRG-containing lysis buffer. The
lys is buffers consisted of 3 mM CPRG, 20 mM MgCl 2, 5 mM DTT in Hi-S-PBS, but they varied in choice of detergent (0.125 %
Nonidet P-40, 0.5 % Nonidet P-40, or 0.125 % NP-40). We found significantly higher s ignals with 0.2 % Saponin in response to an
anti -mTREM2 antibody compared to when 0.5 % Nonidet P-40 or 0.125 % NP-40 was used. The 150 nM mTREM2-ligand, ApoE
ε3-s timulus a lso gave higher signals with 0.2 % Saponin compared to 0.125 % Nonidet P-40, 0.5 % Nonidet P-40, and 0.125 %
NP-40. The background signals did not vary s ignificantly between the detergents. For a ll detergents, the signals for s timulation
with antibody or l igand were significantly higher than the corresponding backgrounds. The number of planned comparisons
were 14, and with an α level at 0.05, s tatistical s ignificance level was set at p<0.0036. Small letters indicate statistical
s ignificance level: aa: p=0.0030 compared to column A, aaaa: p<0.0001 compared to column A, bbbb: p<0.0001 compared to
ACCEPTED MANUSCRIPT

ACCEP
TED M
ANUSC
RIPT
28
column B. mT2 = murine TREM2. The graphs depict mean S.E.M. from three independent experiments each performed with
tripl icates. Data shown was obtained by reading enzyme activity at 4 hours after cell lysis.
Fig. 11: Replacing 2-mercaptoethanol with DTT does not significantly affect β-galactosidase activity in the CPRG assay. When
us ing a lysis buffer with DTT (5 mM) or 2-mercaptoethanol (100 mM), the enzymatic activity did not statistically differ. The lysis
buffer consisted of 3 mM CPRG, 20 mM MgCl 2, 0.2 % Saponin in Hi-S-PBS with either 5 mM DTT or 100 mM 2-mercaptoethanol.
mT2 = murine TREM2. For both reducing agents, the signals for s timulation with antibody or l igand were significantly higher
than the corresponding backgrounds. The number of planned comparisons were 6, and with an α level at 0.05, s tatistical
s ignificance level was set at p<0.008. The measurements were made in triplicates in three independent experiments. The bars
represent mean S.E.M. The data shown was obtained 4 hours after cell lysis.
Fig. 12: Effect of varying the CPRG substrate concentration. The enzymatic activi ty reached a ceiling at a 3 mM CPRG
concentration when s timulating the receptor with a l igand. This concentration gave significantly higher signal of absorbance in
response to s timulus with anti-TREM2 antibody or ApoE ε3 as compared to 0.15 mM CPRG (p<0.0001 and p=0.0030,
respectively). Further increasing the CPRG concentration from 3 mM to 5 mM did not give higher absorbance measurements
after the anti-mTREM2-stimulus. The backgrounds from cells s timulated only with PMA or from exposing cells to anti-goat
antibody-coated wells did not vary s ignificantly between the CPRG-concentrations. The lysis buffers consisted of 20 mM MgCl 2,
5 mM DTT, 0.2 % Saponin, and different CPRG concentrations in Hi-S-PBS. The number of planned comparisons were 14, and
with an α level at 0.05, s tatistical significance level was set at p<0.0036. Small letters indicate s tatistical s ignificance level: aaaa:
p<0.0001 compared to column A, bb: p=0.0030 compared to column B. n.s. = not significant. mT2 = murine TREM2.
Measurements were made in triplicates in three independent experiments. The bars represent mean S.E.M. The data shown
was obtained at 4 hours after cell lysis.
Fig. 13: Comparison of the optimized lysis buffer with the standard lysis buffer and an NP-40-containing variant of it. The
optimized lysis buffer gave more linear time-dependent response and higher signals than the s tandard lysis buffer with either
ACCEPTED MANUSCRIPT
ACCEP
TED M
ANUSC
RIPT
29
0.125 % Nonidet P-40 or 0.125 % NP-40. A: Absorbance measured at 4 hours after lysis. B: Absorbance measured at 20 hours
after lysis. C: Absorbance from start until 4 hours when using the optimized lysis buffer. D: Absorbance from start until 4 hours
when using the standard lysis buffer containing 0.125 % Nonidet P-40. E: Absorbance from start until 4 hours when using the
s tandard lysis buffer containing 0.125 % NP-40. The number of planned comparisons were 13, and with an α level at 0.05,
statistical significance level was set at p<0.0038. Small letters indicate statistical significance level: aaaa: p<0.0001 compared to
column A, bbbb: p<0.0001 compared to column B. n.s. = not significant. mT2 = murine TREM2. For the sake of clarity, there are
di fferent scales on the y-axis in graphs shown in A-E. The measurements were made in triplicates in three independent
experiments. The bars and symbols represent mean S.E.M.
Fig. 14: Effect of time of ligand/antibody stimulation on reporter signal transduction. The optimal time frame to expose the
mTREM2-receptor in the BWZ-reporter cells to ApoE ε3 (300 nM) or an anti-mTREM2-stimuli was around 2-4 hours. The signal
from an ApoE ε3-stimulation was lowest after 17 hours incubation. Anti-goat background was subtracted from the s ignal
generated by the anti-mTREM2 (anti-mT2)-stimulus (the anti-goat background was equal among all stimulation times). PMA
background remained at the same level i rrespectively of the time of exposure to s timulus. Small letters indicate statistical
s ignificance level: aaaa: p<0.0001 compared to 17 hours of s timulation with antibody, bbb: p=0.003 compared to 17 hours of
stimulation with ApoE ε3, bbbb: p<0.0001 compared to 17 hours of s timulation with ApoE ε3. mT2 = murine TREM2.
Measurements were made in triplicates from three individual experiments. The points represent mean S.E.M. The data shown
was obtained at 4 hours after cell lysis.
ACCEPTED MANUSCRIPT