Embed Size (px)
Citation preview

Accepted Manuscript
Title: An improved approach for evaluating the semicrystallinelamellae of starch granules by synchrotron SAXS
Author: Binjia Zhang Fengwei Xie David K. Wang SimingZhao Meng Niu Dongling Qiao Shanbai Xiong Fatang JiangJie Zhu Long Yu
PII: S0144-8617(16)31370-4DOI: http://dx.doi.org/doi:10.1016/j.carbpol.2016.12.002Reference: CARP 11808
To appear in:
Received date: 29-8-2016Revised date: 24-11-2016Accepted date: 1-12-2016
Please cite this article as: Zhang, Binjia., Xie, Fengwei., Wang, David K.,Zhao, Siming., Niu, Meng., Qiao, Dongling., Xiong, Shanbai., Jiang, Fatang.,Zhu, Jie., & Yu, Long., An improved approach for evaluating the semicrystallinelamellae of starch granules by synchrotron SAXS.Carbohydrate Polymershttp://dx.doi.org/10.1016/j.carbpol.2016.12.002
This is a PDF file of an unedited manuscript that has been accepted for publication.As a service to our customers we are providing this early version of the manuscript.The manuscript will undergo copyediting, typesetting, and review of the resulting proofbefore it is published in its final form. Please note that during the production processerrors may be discovered which could affect the content, and all legal disclaimers thatapply to the journal pertain.
1
An improved approach for evaluating the semicrystalline lamellae of starch
granules by synchrotron SAXS
Binjia Zhanga,e
, Fengwei Xiec, David K. Wangc, Siming Zhao
a, Meng Niu
a, Dongling Qiao
b,*,
Shanbai Xionga, Fatang Jiang
b, Jie Zhu
d, Long Yu
e
a Key Laboratory of Environment Correlative Dietology (Ministry of Education), College of Food
Science and Technology, Huazhong Agricultural University, Wuhan 430070, China
b Glyn O. Philips Hydrocolloid Research Centre at HUT, Hubei University of Technology, Wuhan
430068, China
c School of Chemical Engineering, The University of Queensland, Brisbane, Qld 4072, Australia
d College of Chemistry and Environmental Engineering, Dongguan University of Technology,
Dongguan 523808, China
e Guangdong Province Key Laboratory for Green Processing of Natural Products and Product
Safety, South China University of Technology, Guangzhou 510640, China
* Corresponding author. E-mail address: [email protected] (D. Qiao)
2
Highlights:
An improved method was developed for analyzing starch semicrystalline lamellae
The proportion of the lamellae within the starch granule was calculated
The profile of linear correlation function was largely improved
The lamellar parameters of starch were obtained with increased accuracy

3
Nomenclature
WMS, waxy maize starch
RMS, regular maize starch
GMS, Gelose 50 high-amylose maize starch
PS, potato starch
SAXS, small-angle X-ray scattering
WAXS, wide-angle X-ray scattering
φc, the volume fraction of crystalline lamellae within semicrystalline lamellae
d, the thickness of semicrystalline lamellae for starch
dc, the thickness of crystalline lamellae for starch
da, the thickness of amorphous lamellae for starch
Δρ, the electron density difference between the crystalline and amorphous lamellae of starch
PSL, the proportion of the semicrystalline lamellae within the starch granule
PL+B, power-law scattering (PL) plus scattering background (B)
Xc, the relative crystallinity of starch
L(r), linear correlation function
α, power-law exponent
Apeak, area under the net lamellar peak of the SAXS pattern for starch
Atotal, total scattering area of the SAXS pattern for starch
APL+B, area under the PL+B profile of the SAXS pattern for starch
RX/φ, the ratio of Xc to φc

4
Abstract: A fitting method combined with a linear correlation function was developed as an
improved approach for the SAXS analysis of the semicrystalline lamellae of starch granules. Using a
power-law function with two Gaussian plus Lorentz functions, the SAXS pattern was resolved into
sub-patterns of the net lamellar peak and the power-law scattering plus scattering background
(PL+B). The ratio of the net lamellar peak area (Apeak) to the total scattering area (Atotal) was proposed
equal to the proportion of the lamellae within the starch granule (PSL). Along with this fitting method,
we obtained a better profile of linear correlation function, with the elimination of the interference of
non-lamellar amorphous starch (i.e., amorphous growth rings). Then, we could accurately calculate
the lamellar parameters, e.g., PSL, the thicknesses of semicrystalline (d), crystalline (dc) and
amorphous (da) lamellae, and the volume fraction (φc) of crystalline lamellae within semicrystalline
lamellae. Quantitative analysis revealed that PSL was positively correlated with the crystallinity (Xc)
of starch. It was confirmed that the distribution of lamellar thickness was more important than the
starch botanical origin in affecting the validity of the developed fitting method. We also proposed a
criterion to test the validity of the proposed method. Specifically, the total SAXS pattern should be
mostly tangent to the profile of PL+B at a high q tail (close to 0.2 Å-1
).
Keywords: starch; granule; semicrystalline lamellae; X-ray scattering; methodology
Chemical compounds studied in this article
Starch (PubChem CID: 24836924); Water (PubChem CID: 962)
5
1. Introduction
As the main storage carbohydrate in higher plants, starch is normally used as a food ingredient
providing energy for humans (Juansang, Puttanlek, Rungsardthong, Puncha-arnon & Uttapap, 2012).
Also, starch has attracted huge interest in the development of functional foods (Fuentes-Zaragoza et
al., 2011), bioactive carriers (Pu, Chen, Li, Xie, Yu & Li, 2011) and biomaterials (Situ, Li, Liu &
Chen, 2015). There are two kinds of starch polymers, i.e., amylose and amylopectin (Jiang, Gao, Li
& Zhang, 2011; Liu, Halley & Gilbert, 2010). These two biopolymers are organized on multiple
scales in the starch granule to form its semicrystalline structure, including the whole granule, the
growth rings, the semicrystalline lamellae and the crystallites (Buleon, Colonna, Planchot & Ball,
1998; Luengwilai & Beckles, 2009; Perez & Bertoft, 2010; Pikus, 2005; Zhang et al., 2015). The
semicrystalline structural features of starch such as crystallinity and lamellar ordering are crucial in
the determination of the physicochemical properties, e.g., digestibility (Blazek & Gilbert, 2010;
Lopez-Rubio, Flanagan, Shrestha, Gidley & Gilbert, 2008) and thermal behaviors (Liu, Xie, Yu,
Chen & Li, 2009; Xie, Halley & Avérous, 2012). Thus, to understand a specific functionality of
starch, analytical techniques should be used to accurately evaluate the semicrystalline structure of
starch.
Small-angle X-ray scattering (SAXS) is a powerful technique for the characterization of starch
lamellae on the nanoscale (Doutch & Gilbert, 2013; Lopez-Rubio, Flanagan, Gilbert & Gidley, 2008;
Zhang, Chen, Li, Li & Zhang, 2015). Particularly, the average thickness (d) of the semicrystalline
lamellae is normally calculated with Woolf-Bragg’s equation (Zhang, Chen, Li, Li & Zhang, 2015;
Zhang et al., 2014). Additional lamellar parameters can be obtained using the paracrystalline model
(Cameron & Donald, 1993a, b), the liquid-crystalline model (Daniels & Donald, 2004) and the linear
correlation function (Zhang, Chen, Li, Li & Zhang, 2015; Zhang et al., 2015). Those parameters
include the thicknesses of crystalline (dc) and amorphous (da) lamellae, the electron density
difference (Δρ) between the crystalline and amorphous lamellae, and the volume fraction (φc) of the
6
crystalline lamellae within the semicrystalline lamellae. The distribution of lamellar thickness has
also been studied using the interface distribution function (Cardoso & Westfahl, 2010).
However, though numerous studies have evaluated the lamellar structure of starch, the relative
proportion (named as PSL) of the semicrystalline lamellae within the starch granule has never been
calculated. Also, among above mentioned methods, the linear correlation function is fairly
straightforward, as no predefined assumptions of the starch structure are needed. Nonetheless, the
non-lamellar amorphous starch (i.e., amorphous growth rings) exists as a third-phase fraction in the
starch granule. The third-phase starch reduces the accuracy of the linear correlation function to
calculate the parameters of the two-phase semicrystalline lamellae. This interference prevents us
from establishing accurate links between the functionalities and the semicrystalline features of starch,
which is undesired for the rational design of starch products with tailored performance. Thus, if the
scattering arising from the semicrystalline lamellae could be properly resolved from the total SAXS
pattern of starch, it would be possible to calculate PSL. Also, using the net scattering of the lamellae,
the lamellar parameters of starch would be accurately obtained from the linear correlation function,
due to the elimination of the interference of the third-phase starch.
To this end, a fitting equation based on a power-law function with two Gaussian plus Lorentz
functions was developed to aid the decomposition of starch SAXS pattern into sub-patterns of the net
lamellar peak and a profile of power-law scattering plus scattering background (PL+B). Then, the
profile of linear correlation function was largely improved using the fitted net scattering for starch
lamellae. Based on this, we obtained not only PSL but also other lamellar parameters (e.g., d, dc, da
and φc) with increased accuracy.
7
2. Materials and methods
2.1 Materials
Waxy maize starch (WMS), regular maize starch (RMS) and Gelose 50 high-amylose maize
starch (GMS) were purchased from Penford Australia Ltd. (Lane Cove, NSW Australia). WMS,
RMS and GMS had amylose contents of ca. 3%, 24% and 56%, respectively, as measured using an
iodine colorimetric method (Tan, Flanagan, Halley, Whittaker & Gidley, 2007). Potato starch (PS)
(amylose content, ca. 36%) was supplied by Avebe (Netherlands). The moisture content of starch
was determined using a moisture analyzer (MA35, Sartorius Stedim Biotech GmbH, Germany).
2.2 Small/Wide Angle X-ray Scattering (SAXS/WAXS)
SAXS/WAXS measurements with 1s acquisition were performed on the SAXS/WAXS beam-
line (flux, 1013
photons/s) installed at the Australian Synchrotron (Clayton, Australia) at a
wavelength λ = 1.54 Å. A slight overlap in q was established, and the configuration covered 0.015 <
q < 2.9 Å−1
simultaneously. The scattering vector, q, was defined as q = 4πsinθ/λ, where 2θ is the
scattering angle and λ is the wavelength of the X-ray source. The 2D scattering patterns were
collected using a Pilatus 1M camera (active area 169 × 179 mm and pixel size 172× 172 μm) and a
Pilatus 200K camera (active area 169× 33 mm and pixel size 172 × 172 μm). The Scatterbrain
software was used to acquire the 1D data from the 2D scattering patterns. The starch slurries with a
starch concentration of 40wt% were used as the samples, which were prepared by adding a desired
amount of water to the starch. The scattering of pure water with a Kapton tape (5413 AMBER 3/4IN
X 36YD, 3M, USA) on the stage window was used as the background data. All data were
background subtracted and normalized using the Scatterbrain software. In particular, the background
subtraction was conducted with care through a subtraction between the scattering of the starch slurry
with Kapton tape and the scattering of pure water with Kapton tape. Each test was carried out in
triplicate to acquire reliable SAXS/WAXS data.
8
The data in the range of 0.28 < q < 2.8 Å−1
(ca. 4° < 2θ for Cu Kα < 40°) were used as the
WAXS patterns. The relative crystallinity (Xc, %) of starch was calculated using the PeakFit software
(Ver. 4.12), according to Eq. (1).
∑
In which, Aci is the area under each crystalline peak with index i, and At is the total area of the
WAXS pattern.
The data in the range of 0.015 < q < 0.20 Å−1
were used as the SAXS patterns. The linear
correlation function L(r), as given in Eq. (2) (below) and Fig. S1 (see the supplementary data), was
used to calculate the parameters of semicrystalline lamellae, with Eq. (3).
∫
∫
Here, r (nm) is the distance in real space. T is the insection of the linear region on L(r) with the
abscissa (L(r) = 0) (cf. Fig. S1 in supplimentary data); d is the second maximum of L(r) (i.e., the
average thickness of the semicrystalline lamellae); φc is the volume fraction of the crystalline
lamellae within the semicrystalline lamellae. Fig. S1 also shows a parameter da, representing the
average thickness of amorphous lamellae, which is acquired by the solution of the linear region and
the flat L(r) minimum. Then, dc, the average thickness of crystalline lamellae is obtained by dc = d –
da.
9
2.3 Statistical analysis
Data were expressed as means ± standard deviations (SD), and were analyzed by the one-way
ANOVA and multiple comparison tests with a least significant difference using IBM SPSS software
version 20.0 (Chicago, IL, USA). A statistical difference of P < 0.05 was considered to be significant.
3. Results and discussion
3.1 Synchrotron WAXS analysis
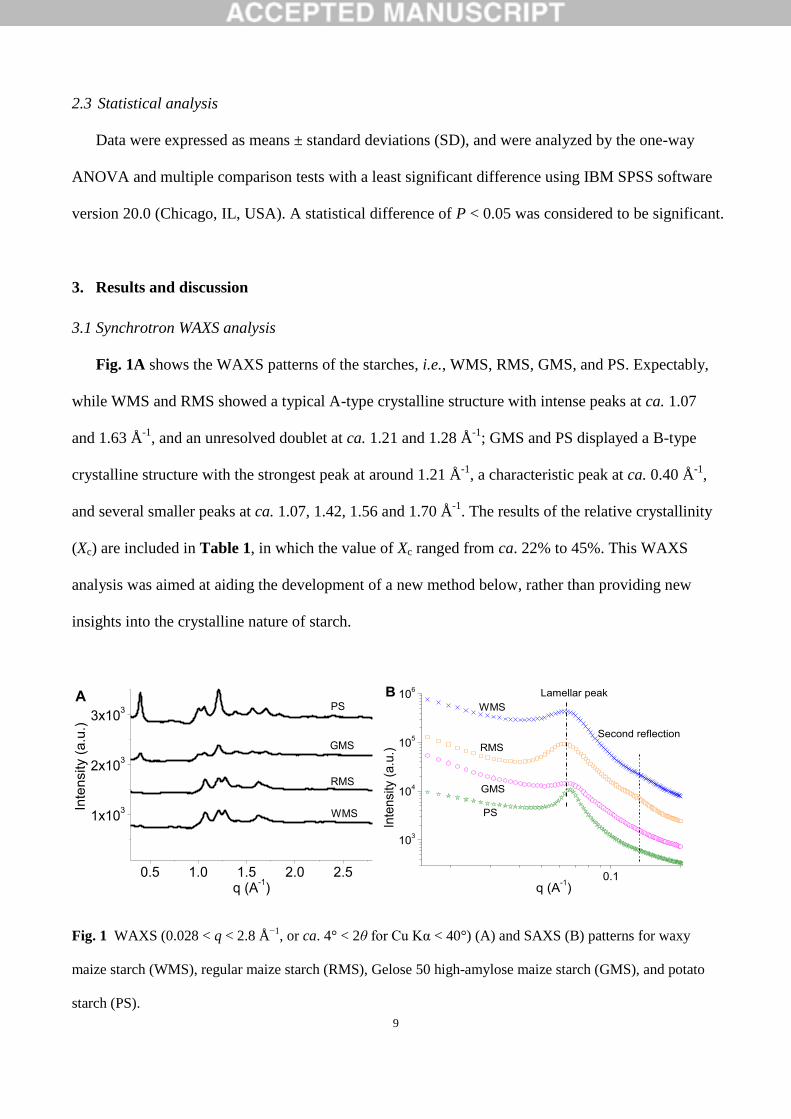
Fig. 1A shows the WAXS patterns of the starches, i.e., WMS, RMS, GMS, and PS. Expectably,
while WMS and RMS showed a typical A-type crystalline structure with intense peaks at ca. 1.07
and 1.63 Å-1
, and an unresolved doublet at ca. 1.21 and 1.28 Å-1
; GMS and PS displayed a B-type
crystalline structure with the strongest peak at around 1.21 Å-1
, a characteristic peak at ca. 0.40 Å-1
,
and several smaller peaks at ca. 1.07, 1.42, 1.56 and 1.70 Å-1
. The results of the relative crystallinity
(Xc) are included in Table 1, in which the value of Xc ranged from ca. 22% to 45%. This WAXS
analysis was aimed at aiding the development of a new method below, rather than providing new
insights into the crystalline nature of starch.
Fig. 1 WAXS (0.028 < q < 2.8 Å−1
, or ca. 4° < 2θ for Cu Kα < 40°) (A) and SAXS (B) patterns for waxy
maize starch (WMS), regular maize starch (RMS), Gelose 50 high-amylose maize starch (GMS), and potato
starch (PS).
0.5 1.0 1.5 2.0 2.5
1x10³
2x10³
3x10³
RMS
Inte
nsity (
a.u
.)
q (A-1)
A
WMS
PS
GMS
0.1
103
104
105
106
Second reflection
Lamellar peak
PS
GMS
RMS
Inte
nsity (
a.u
.)
q (A-1)
BWMS
10
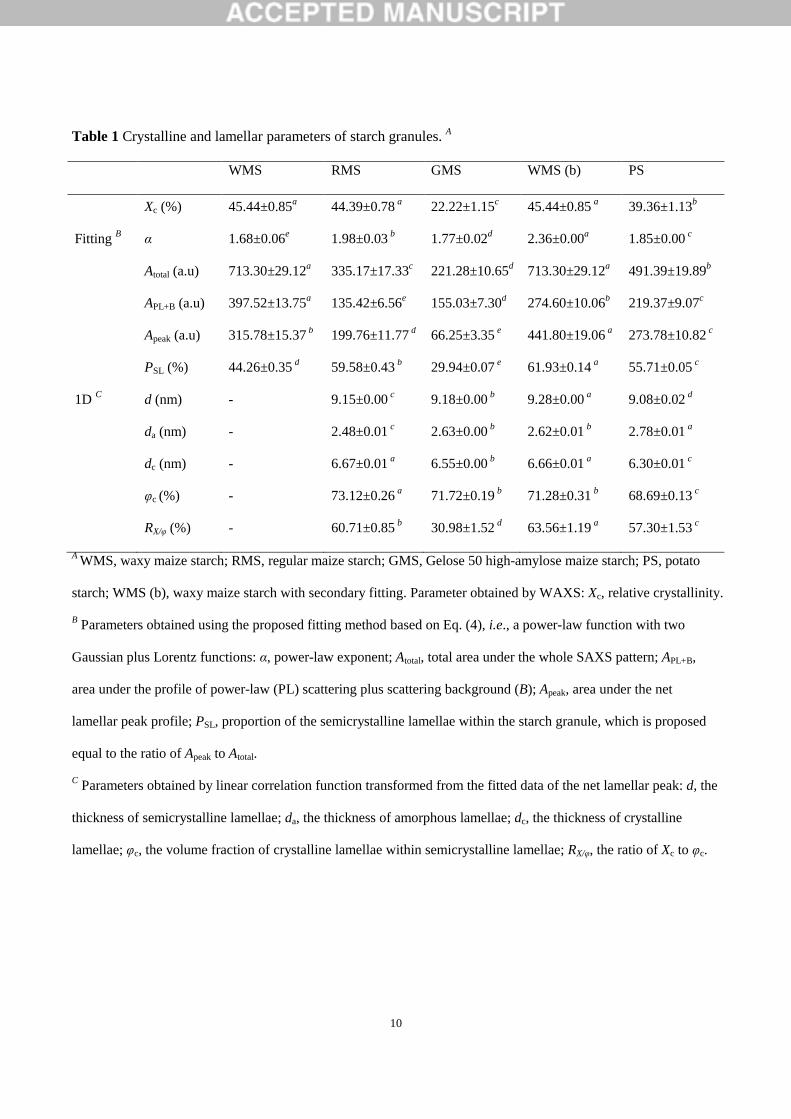
Table 1 Crystalline and lamellar parameters of starch granules. A
WMS RMS GMS WMS (b) PS
Xc (%) 45.44±0.85a 44.39±0.78
a 22.22±1.15
c 45.44±0.85
a 39.36±1.13
b
Fitting B α 1.68±0.06
e 1.98±0.03
b 1.77±0.02
d 2.36±0.00
a 1.85±0.00
c
Atotal (a.u) 713.30±29.12a 335.17±17.33
c 221.28±10.65
d 713.30±29.12
a 491.39±19.89
b
APL+B (a.u) 397.52±13.75a 135.42±6.56
e 155.03±7.30
d 274.60±10.06
b 219.37±9.07
c
Apeak (a.u) 315.78±15.37 b 199.76±11.77
d 66.25±3.35
e 441.80±19.06
a 273.78±10.82
c
PSL (%) 44.26±0.35 d 59.58±0.43
b 29.94±0.07
e 61.93±0.14
a 55.71±0.05
c
1D C d (nm) - 9.15±0.00
c 9.18±0.00
b 9.28±0.00
a 9.08±0.02
d
da (nm) - 2.48±0.01 c 2.63±0.00
b 2.62±0.01
b 2.78±0.01
a
dc (nm) - 6.67±0.01 a 6.55±0.00
b 6.66±0.01
a 6.30±0.01
c
φc (%) - 73.12±0.26 a 71.72±0.19
b 71.28±0.31
b 68.69±0.13
c
RX/φ (%) - 60.71±0.85 b 30.98±1.52
d 63.56±1.19
a 57.30±1.53
c
A WMS, waxy maize starch; RMS, regular maize starch; GMS, Gelose 50 high-amylose maize starch; PS, potato
starch; WMS (b), waxy maize starch with secondary fitting. Parameter obtained by WAXS: Xc, relative crystallinity.
B Parameters obtained using the proposed fitting method based on Eq. (4), i.e., a power-law function with two
Gaussian plus Lorentz functions: α, power-law exponent; Atotal, total area under the whole SAXS pattern; APL+B,
area under the profile of power-law (PL) scattering plus scattering background (B); Apeak, area under the net
lamellar peak profile; PSL, proportion of the semicrystalline lamellae within the starch granule, which is proposed
equal to the ratio of Apeak to Atotal.
C Parameters obtained by linear correlation function transformed from the fitted data of the net lamellar peak: d, the
thickness of semicrystalline lamellae; da, the thickness of amorphous lamellae; dc, the thickness of crystalline
lamellae; φc, the volume fraction of crystalline lamellae within semicrystalline lamellae; RX/φ, the ratio of Xc to φc.

11
3.2 Establishment of a new method for evaluating starch semicrystalline lamellae
3.2.1 Decomposition of the synchrotron SAXS pattern
Fig. 1B shows the SAXS patterns of WMS, RMS, GMS and PS. The starches showed a well-
defined SAXS peak at ca. 0.065 Å−1
, corresponding to the semicrystalline lamellae (Cai & Shi, 2013;
Zhang et al., 2014). Also, an additional less-resolved peak at ca. 0.13 Å−1
was seen for WMS and
RMS, which was ascribed to a second order reflection from the semicrystalline lamellae. This
modest reflection has also been found for other starches such as tapioca starch (Blazek & Gilbert,
2010). Nonetheless, this reflection did not emerge for GMS and PS, presumably due to the fact that
the scattering of the lamellar structure masked its second order reflection that was relatively weak.
Hence, two Gaussian plus Lorentz functions (with a power-law function), as shown in Eq. (4),
were used to fit the lamellar peak and its second order reflection.
In this equation, the first term B is the scattering background; the second term is the power-law
function where P is the power-law prefactor and α is the power-law component; the third/fifth and
fourth/sixth terms are the Gaussian (G1(q) or G2(q)) and Lorentz (L1(q) or L2(q)) functions,
respectively, which describing the lamellar peak at around 0.65 Å−1
or the second order reflection
peak; f1 and f2 are the prefactors for the two peaks, respectively. Besides, the Gaussian Gx(q) and
Lorentz Lx(q) functions are detailed in Eq. (5) and (6), respectively.
√
√ (
)

12
Here, Ax is the peak area, Wx (Å−1
) the peak width at half-maximum in reciprocal space, and qx (Å−1
)
the peak center position; and x = 1 and x = 2 correspond to the lamellar peak and the second order
reflection, respectively. Data fitting was performed using the least-squares refinement in the Origin8
software (OriginLab. Inc., USA).
In the following, the starches from the same botanical origin, i.e., WMS, RMS and GMS, were
selected for the method establishment. PS was mainly used in the section 3.5 to verify the validity of
the established method for analyzing starches from different botanic origin origins. The fit curves for
the SAXS data of WMS, RMS and GMS are shown in Fig. 2. The reduced chi square was 133.3
(WMS), 16.0 (RMS), and 29.9 (GMS), respectively, with an adjusted R2 higher than 0.999. This
indicates that the SAXS patterns of these maize starches were well fitted using the proposed Eq. (4).
Fig. 2 SAXS patterns and their fit curves for waxy maize starch (WMS), regular maize starch (RMS), and
Gelose 50 high-amylose maize starch (GMS).
0.05 0.10 0.15 0.200.0
5.0x10³
1.0x10⁴
1.5x10⁴
2.0x10⁴
q (A-1)
WMS
fit
Inte
nsity (
a.u
.)
A
0.05 0.10 0.15 0.200.0
2.0x10³
4.0x10³
6.0x10³
8.0x10³
Inte
nsity (
a.u
.)
q (A-1)
RMS
fit
B
0.05 0.10 0.15 0.200.0
2.0x10³
4.0x10³
6.0x10³
8.0x10³
GMS
fit
Inte
nsity (
a.u
.)
q (A-1)
C

13
As reported previously (Blazek & Gilbert, 2010; Cameron & Donald, 1993a, b), the starch
granule can be seen as a finite stack of semicrystalline lamellae embedded in a medium of non-
lamellar amorphous background (i.e., amorphous growth rings); the lamellar peak closely relates to
the semicrystalline lamellae, and thus the isolated change in amorphous background induces no
variations in the peak intensity. Here, along with the fitting based on Eq. (4), we separated the whole
SAXS pattern for starch into the sub-patterns of a net lamellar peak and the power-law scattering
plus scattering background (PL+B). The net lamellar peak, in fact, corresponded to the fitted
scattering of Gaussian plus Lorentz functions in Eq. (4). The rest PL+B, i.e., power-law scattering
(Pq-α
) plus scattering background (B) in Eq. (4), should be mainly related to the non-lamellar
amorphous background. Thus, we propose that the proportion (PSL) of the semicrystalline lamellae
within the starch granule equates to the ratio of the net lamellar peak area (Apeak) to the total area
(Atotal) of the SAXS pattern.
The profile of net lamellar peak and the PL+B profile resolved from the original SAXS patterns
of the starches are collected in Fig. S2 (see supplementary data). Atotal, Apeak and APL+B (the area
under the PL+B profile) were integrated from the corresponding profiles in Fig. S2 using the Origin
8 software and the results are recorded in Table 1. It is seen that PSL, i.e., the ratio of Apeak to Atotal,
was larger than Xc for RMS and GMS but smaller than Xc for WMS. Actually, the crystallites in the
untreated granule starch are mainly aligned in the crystalline lamellae to construct the semicrystalline
lamellae with the lamellar amorphous starch. The value of PSL should be higher than that of Xc. Thus,
the result of PSL for WMS was not reasonable. This contradiction needs a further clarification.
Fig. S3 (see the supplementary data) shows the comparison between the SAXS patterns and their
PL+B profiles. For RMS and GMS, the PL+B profile almost touched the SAXS pattern at a high q
tail (close to 0.2 Å-1
) without intersection, whereas for WMS, this profile intersected the SAXS
pattern. That is, the above fitting for WMS allocated part of the scattering from the lamellar structure
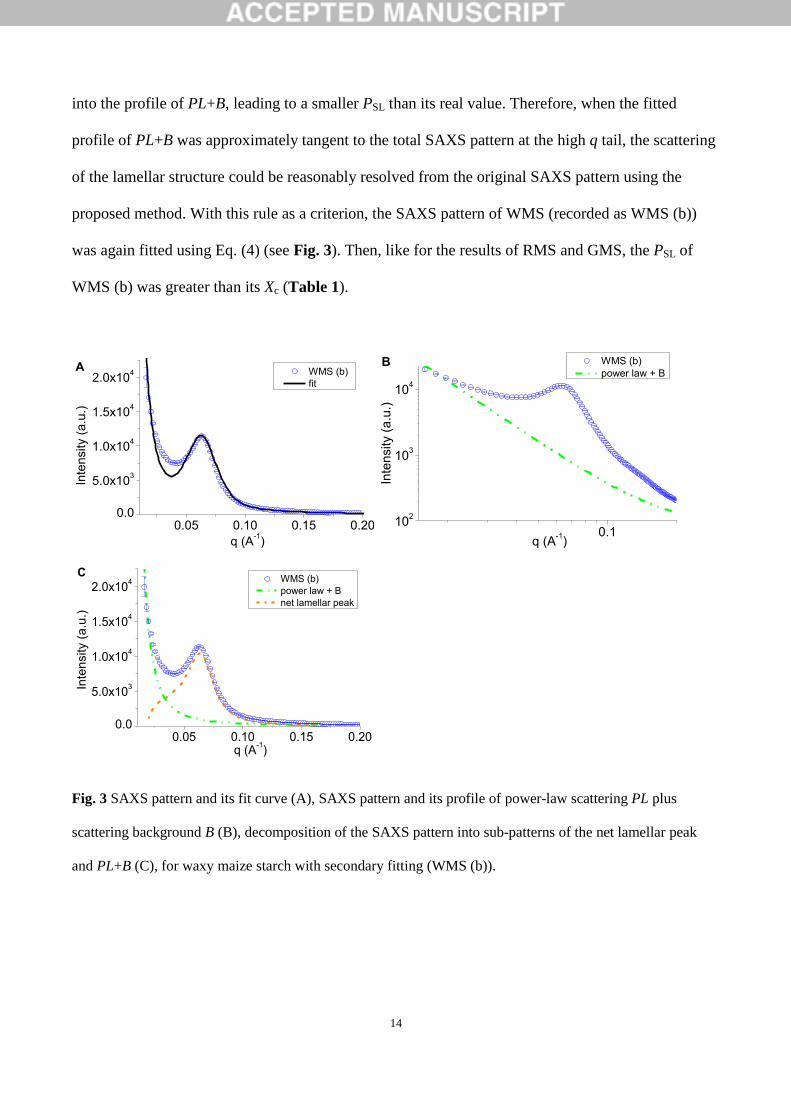
14
into the profile of PL+B, leading to a smaller PSL than its real value. Therefore, when the fitted
profile of PL+B was approximately tangent to the total SAXS pattern at the high q tail, the scattering
of the lamellar structure could be reasonably resolved from the original SAXS pattern using the
proposed method. With this rule as a criterion, the SAXS pattern of WMS (recorded as WMS (b))
was again fitted using Eq. (4) (see Fig. 3). Then, like for the results of RMS and GMS, the PSL of
WMS (b) was greater than its Xc (Table 1).
Fig. 3 SAXS pattern and its fit curve (A), SAXS pattern and its profile of power-law scattering PL plus
scattering background B (B), decomposition of the SAXS pattern into sub-patterns of the net lamellar peak
and PL+B (C), for waxy maize starch with secondary fitting (WMS (b)).
0.05 0.10 0.15 0.200.0
5.0x10³
1.0x10⁴
1.5x10⁴
2.0x10⁴ WMS (b)
fit
Inte
nsity (
a.u
.)
q (A-1)
A
0.110
2
103
104
q (A-1)
Inte
nsity (
a.u
.)
WMS (b)
power law + BB
0.05 0.10 0.15 0.200.0
5.0x10³
1.0x10⁴
1.5x10⁴
2.0x10⁴
q (A-1)
Inte
nsity (
a.u
.)
WMS (b)
power law + B
net lamellar peak
C

15
3.2.2 Improvement of the profile of linear correlation function
As discussed in the introduction, the linear correlation function is fairly straightforward for the
characterization of starch lamellar paramters. However, the non-lamellar amorphous starch exists as
a third-phase fraction in the starch granule, which evidently increases fluctuations of the linear
correlation function profile and thus reduces the accuracy of the resultant parameters of the two-
phase semicrystalline lamellae of starch. Thus, we further attempted to improve the profile of linear
correlation function using the fitted net lamellar peak from the whole SAXS pattern without PL+B
associated with non-lamellar starch.
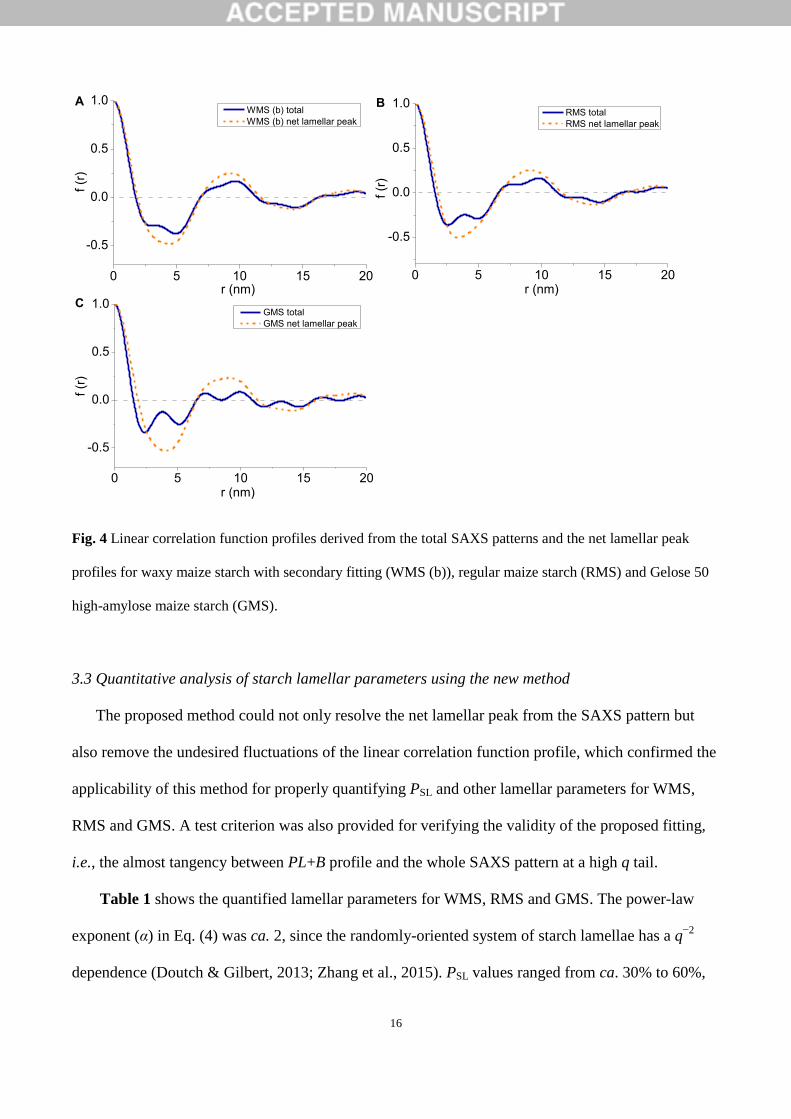
Fig. 4 shows the linear correlation function L(r) profiles derived from the original SAXS patterns
and the fitted patterns of the net lamellar peak. Prominent fluctuations especially at r values of ca. 2
to 5 nm and ca. 7 to 10 nm were seen for the linear correlation function profiles originated from the
total SAXS patterns (see Fig. 4). These fluctuations actually reflected the interference arising from
the non-lamellar third-phase starch, which were undesired for accurately calculating the parameters
of the semicrystalline lamellae (a two-phase structure). In contrast, when the fitted data of the net
lamellar peak were used, the linear correlation function showed perfect profiles (see Fig. 4), which
were very similar to that for lamellar semicrystalline polymers (Goderis, Reynaers, Koch & Mathot,
1999). Therefore, the profile of linear correlation function could be greatly improved by using the net
lamellar scattering as the source data.
16
Fig. 4 Linear correlation function profiles derived from the total SAXS patterns and the net lamellar peak
profiles for waxy maize starch with secondary fitting (WMS (b)), regular maize starch (RMS) and Gelose 50
high-amylose maize starch (GMS).
3.3 Quantitative analysis of starch lamellar parameters using the new method
The proposed method could not only resolve the net lamellar peak from the SAXS pattern but
also remove the undesired fluctuations of the linear correlation function profile, which confirmed the
applicability of this method for properly quantifying PSL and other lamellar parameters for WMS,
RMS and GMS. A test criterion was also provided for verifying the validity of the proposed fitting,
i.e., the almost tangency between PL+B profile and the whole SAXS pattern at a high q tail.
Table 1 shows the quantified lamellar parameters for WMS, RMS and GMS. The power-law
exponent (α) in Eq. (4) was ca. 2, since the randomly-oriented system of starch lamellae has a q−2
dependence (Doutch & Gilbert, 2013; Zhang et al., 2015). PSL values ranged from ca. 30% to 60%,
0 5 10 15 20
-0.5
0.0
0.5
1.0
r (nm)
f (r
)
WMS (b) total
WMS (b) net lamellar peak
A
0 5 10 15 20
-0.5
0.0
0.5
1.0
f (r
)
r (nm)
RMS total
RMS net lamellar peak
B
0 5 10 15 20
-0.5
0.0
0.5
1.0
r (nm)
f (r
)
GMS total
GMS net lamellar peak
C

17
which had a same changing trend as that of Xc for WMS, RMS and GMS. The lamellar thicknesses,
i.e., d, dc and da, were reasonable, but slightly different from previously reported values (Qiao et al.,
2016; Zhang et al., 2015). This difference probably resulted from the removal of the scattering of
non-lamellar amorphous starch, which was previously taken into account and interfered with the
calculation of lamellar parameters using the linear correlation function.
Furthermore, the volume fraction (φc) of the crystalline components within the semicrystalline
lamellae had a value of ca. 71–73%. The value of this parameter was slightly lower than that for a
wheat starch acquired with the paracrystalline model (Cameron & Donald, 1993a). The ratio (RX/φ) of
Xc to φc was comparable to PSL, which was consistent with the fact that the starch crystallites were
predominantly packed in the semicrystalline lamellae. This similarity further confirmed the
applicability of the new method to estimate PSL.
3.4 Validity of the new method for analyzing starch semicrystalline lamellae with thickness
distribution
As shown by above analyses, it was harder to resolve the lamellar scattering from the SAXS
pattern for WMS than for RMS and GMS, using the proposed fitting with smallest reduced chi-
square. Previous findings confirm that the thickness of starch semicrystalline lamellae distributes in a
specific range that is positive to the width of the lamellar peak (Cardoso & Westfahl, 2010; Witt,
Doutch, Gilbert & Gilbert, 2012; Zhang et al., 2015). As seen in Fig. S2A and S2B (supplementary
data) and Fig. 3C, the sub-pattern of the net lamellar peak for RMS and GMS showed a single peak,
whereas that for WMS exhibited an unresolved doublet. Namely, other than the lamellae indicated by
a peak at ca. 0.65 Å−1
, there was a notable proportion of thicker lamellae in WMS, as shown by a
shoulder at q values lower than 0.65 Å−1
. Here, it is reasonable to propose that the distribution of
starch lamellae thickness substantially affected the fitting result for the three maize starches. The vast
distribution of WMS lamellae thickness prevented the proposed fitting with smallest reduced chi-
18
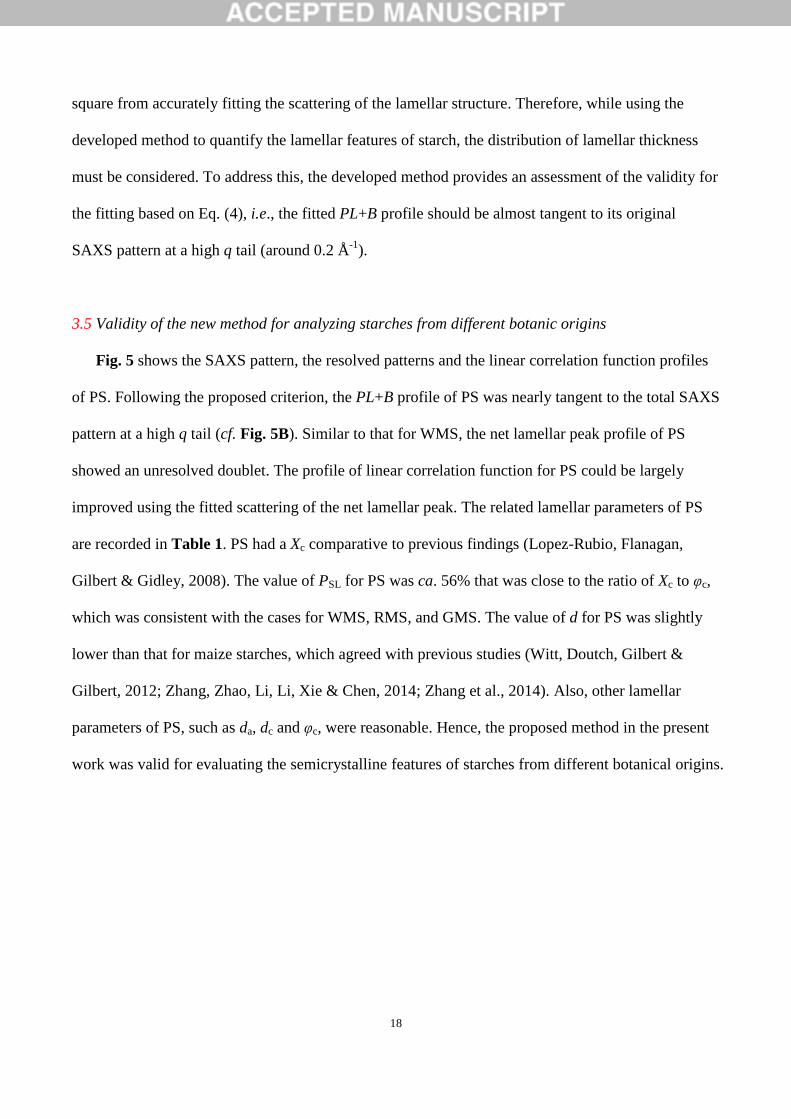
square from accurately fitting the scattering of the lamellar structure. Therefore, while using the
developed method to quantify the lamellar features of starch, the distribution of lamellar thickness
must be considered. To address this, the developed method provides an assessment of the validity for
the fitting based on Eq. (4), i.e., the fitted PL+B profile should be almost tangent to its original
SAXS pattern at a high q tail (around 0.2 Å-1
).
3.5 Validity of the new method for analyzing starches from different botanic origins
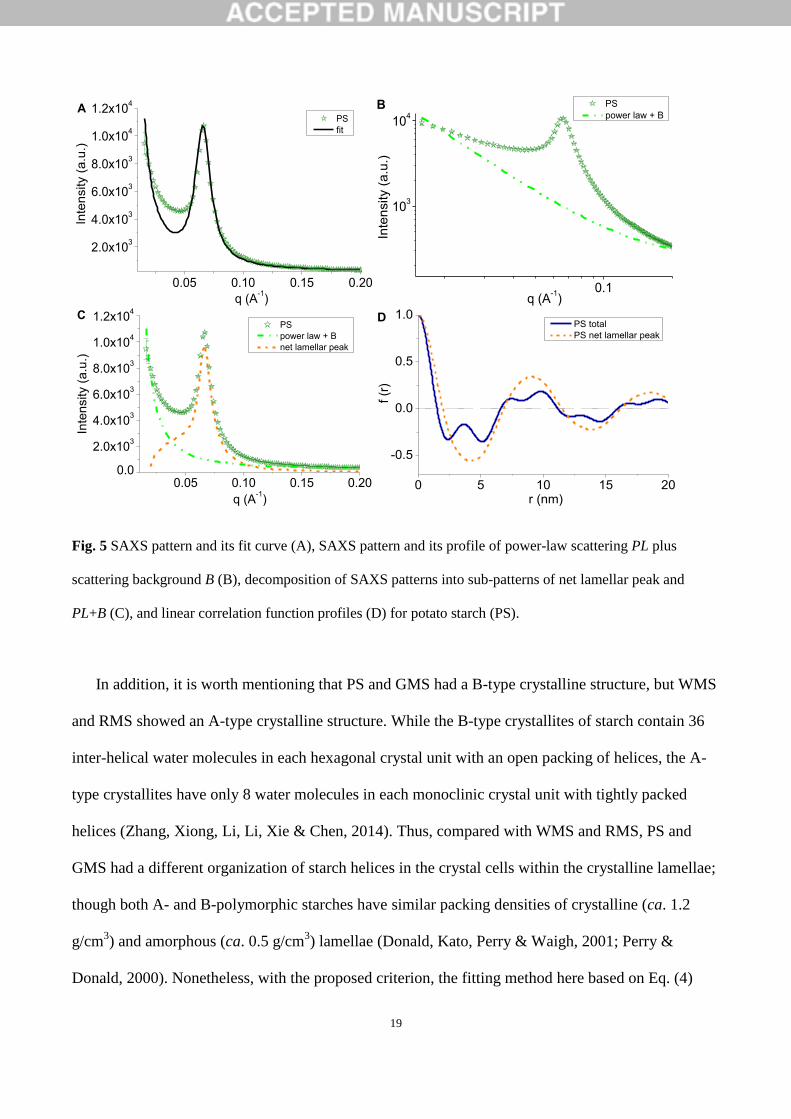
Fig. 5 shows the SAXS pattern, the resolved patterns and the linear correlation function profiles
of PS. Following the proposed criterion, the PL+B profile of PS was nearly tangent to the total SAXS
pattern at a high q tail (cf. Fig. 5B). Similar to that for WMS, the net lamellar peak profile of PS
showed an unresolved doublet. The profile of linear correlation function for PS could be largely
improved using the fitted scattering of the net lamellar peak. The related lamellar parameters of PS
are recorded in Table 1. PS had a Xc comparative to previous findings (Lopez-Rubio, Flanagan,
Gilbert & Gidley, 2008). The value of PSL for PS was ca. 56% that was close to the ratio of Xc to φc,
which was consistent with the cases for WMS, RMS, and GMS. The value of d for PS was slightly
lower than that for maize starches, which agreed with previous studies (Witt, Doutch, Gilbert &
Gilbert, 2012; Zhang, Zhao, Li, Li, Xie & Chen, 2014; Zhang et al., 2014). Also, other lamellar
parameters of PS, such as da, dc and φc, were reasonable. Hence, the proposed method in the present
work was valid for evaluating the semicrystalline features of starches from different botanical origins.
19
Fig. 5 SAXS pattern and its fit curve (A), SAXS pattern and its profile of power-law scattering PL plus
scattering background B (B), decomposition of SAXS patterns into sub-patterns of net lamellar peak and
PL+B (C), and linear correlation function profiles (D) for potato starch (PS).
In addition, it is worth mentioning that PS and GMS had a B-type crystalline structure, but WMS
and RMS showed an A-type crystalline structure. While the B-type crystallites of starch contain 36
inter-helical water molecules in each hexagonal crystal unit with an open packing of helices, the A-
type crystallites have only 8 water molecules in each monoclinic crystal unit with tightly packed
helices (Zhang, Xiong, Li, Li, Xie & Chen, 2014). Thus, compared with WMS and RMS, PS and
GMS had a different organization of starch helices in the crystal cells within the crystalline lamellae;
though both A- and B-polymorphic starches have similar packing densities of crystalline (ca. 1.2
g/cm3) and amorphous (ca. 0.5 g/cm
3) lamellae (Donald, Kato, Perry & Waigh, 2001; Perry &
Donald, 2000). Nonetheless, with the proposed criterion, the fitting method here based on Eq. (4)
0.05 0.10 0.15 0.20
2.0x10³
4.0x10³
6.0x10³
8.0x10³
1.0x10⁴
1.2x10⁴
q (A-1)
Inte
nsity (
a.u
.)
PS
fit
A
0.1
103
104
q (A-1)
Inte
nsity (
a.u
.)
PS
power law + BB
0.05 0.10 0.15 0.200.0
2.0x10³
4.0x10³
6.0x10³
8.0x10³
1.0x10⁴
1.2x10⁴
q (A-1)
Inte
nsity (
a.u
.)
PS
power law + B
net lamellar peak
C
0 5 10 15 20
-0.5
0.0
0.5
1.0
r (nm)
f (r
)
PS total
PS net lamellar peak
D
20
could properly resolve the scattering of lamellae and that of non-lamellar amorphous starch from the
whole SAXS pattern for starches with different crystalline types.
4 Conclusions
This work proposes a fitting method to analyze SAXS data of starch granules to better calculate
the parameters of starch semicrystalline lamellae, including the proportion of semicrystalline
lamellae within the starch granule (PSL), the thicknesses of semicrystalline (d), crystalline (dc) and
amorphous (da) lamellae, and the volume fraction (φc) of crystalline lamellae within the
semicrystalline lamellae. For this purpose, the SAXS pattern was separated into sub-patterns of the
net lamellar peak and the profile of power-law plus scattering background (PL+B) using a power-law
function with two Gaussian plus Lorentz functions. The fitted scattering of the net lamellar peak was
used to largely improve the profile of the linear correlation function. Accordingly, PSL, φc and the
lamellar thicknesses (d, dc and da) were accurately calculated. It is worth noting that compared to the
botanical origin, the distribution of lamellar thickness showed a more apparent effect on the validity
of the proposed method. To ensure the validity of the developed method for resolving the lamellar
scattering from the original SAXS pattern, a test criterion was proposed, i.e., the total scattering
pattern should be mostly tangent to its PL+B profile at high q values. Hence, these results provide a
basis for accurately linking the semicrystalline structure of starch to its functionalities.
Acknowledgements
The authors would like to acknowledge the Fundamental Research Funds for the Central
Universities (2662016QD008), the Hubei Provincial Natural Science Foundation of China
(2016CFB142), the Open Project Program of Provincial Key Laboratory of Green Processing
Technology and Product Safety of Natural Products (No. 201604 and 201602), the National Natural
Science Foundation of China (No. 31401586 and 31501520), and the Hunan Province Science and

21
Technology Key Project (2014FJ1008). This research was partly undertaken on the SAXS/WAXS
beamline at the Australian Synchrotron, Victoria, Australia.
Reference
Blazek, J., & Gilbert, E. P. (2010). Effect of Enzymatic Hydrolysis on Native Starch Granule Structure.
Biomacromolecules, 11(12), 3275-3289.
Buleon, A., Colonna, P., Planchot, V., & Ball, S. (1998). Starch granules: structure and biosynthesis.
International Journal of Biological Macromolecules, 23(2), 85-112.
Cai, L., & Shi, Y. C. (2013). Self-assembly of short linear chains to A- and B-type starch spherulites and their
enzymatic digestibility. Journal of Agricultural and Food Chemistry, 61(45), 10787-10797.
Cameron, R. E., & Donald, A. M. (1993a). A Small-Angle X-Ray-Scattering Study of Starch Gelatinization in
Excess and Limiting Water. Journal of Polymer Science Part B-Polymer Physics, 31(9), 1197-1203.
Cameron, R. E., & Donald, A. M. (1993b). A Small-Angle X-Ray-Scattering Study of the Absorption of
Water into the Starch Granule. Carbohydrate Research, 244(2), 225-236.
Cardoso, M. B., & Westfahl, H. (2010). On the lamellar width distributions of starch. Carbohydrate Polymers,
81(1), 21-28.
Daniels, D. R., & Donald, A. M. (2004). Soft Material Characterization of the Lamellar Properties of Starch:
Smectic Side-Chain Liquid-Crystalline Polymeric Approach. Macromolecules, 37(4), 1312-1318.
Donald, A. M., Kato, K. L., Perry, P. A., & Waigh, T. A. (2001). Scattering studies of the internal structure of
starch granules. Starch‐Stärke, 53(10), 504-512.
Doutch, J., & Gilbert, E. P. (2013). Characterisation of large scale structures in starch granules via small-angle
neutron and X-ray scattering. Carbohydrate Polymers, 91(1), 444-451.
Fuentes-Zaragoza, E., Sánchez-Zapata, E., Sendra, E., Sayas, E., Navarro, C., Fernández-López, J., & Pérez-
Alvarez, J. A. (2011). Resistant starch as prebiotic: A review. Starch-Starke, 63(7), 406-415.

22
Goderis, B., Reynaers, H., Koch, M., & Mathot, V. (1999). Use of SAXS and linear correlation functions for
the determination of the crystallinity and morphology of semi‐crystalline polymers. Application to linear
polyethylene. Journal of Polymer Science Part B: Polymer Physics, 37(14), 1715-1738.
Jiang, Q. Q., Gao, W. Y., Li, X., & Zhang, J. Z. (2011). Characteristics of native and enzymatically
hydrolyzed Zea mays L., Fritillaria ussuriensis Maxim. and Dioscorea opposita Thunb. starches. Food
Hydrocolloids, 25(3), 521-528.
Juansang, J., Puttanlek, C., Rungsardthong, V., Puncha-arnon, S., & Uttapap, D. (2012). Effect of
gelatinisation on slowly digestible starch and resistant starch of heat-moisture treated and chemically modified
canna starches. Food Chemistry, 131(2), 500-507.
Liu, H., Xie, F., Yu, L., Chen, L., & Li, L. (2009). Thermal processing of starch-based polymers. Progress in
Polymer Science, 34(12), 1348-1368.
Liu, W. C., Halley, P. J., & Gilbert, R. G. (2010). Mechanism of Degradation of Starch, a Highly Branched
Polymer, during Extrusion. Macromolecules, 43(6), 2855-2864.
Lopez-Rubio, A., Flanagan, B. M., Gilbert, E. P., & Gidley, M. J. (2008). A novel approach for calculating
starch crystallinity and its correlation with double helix content: a combined XRD and NMR study.
Biopolymers, 89(9), 761-768.
Lopez-Rubio, A., Flanagan, B. M., Shrestha, A. K., Gidley, M. J., & Gilbert, E. P. (2008). Molecular
rearrangement of starch during in vitro digestion: toward a better understanding of enzyme resistant starch
formation in processed starches. Biomacromolecules, 9(7), 1951-1958.
Luengwilai, K., & Beckles, D. M. (2009). Structural investigations and morphology of tomato fruit starch.
Journal of Agricultural and Food Chemistry, 57(1), 282-291.
Perez, S., & Bertoft, E. (2010). The molecular structures of starch components and their contribution to the
architecture of starch granules: A comprehensive review. Starch-Starke, 62(8), 389-420.
Perry, P. A., & Donald, A. M. (2000). SANS study of the distribution of water within starch granules.
International Journal of Biological Macromolecules, 28(1), 31-39.
Pikus, S. (2005). Small-angle x-ray scattering (SAXS) studies of the structure of starch and starch products.
Fibres & Textiles in Eastern Europe, 13(5), 82-86.
23
Pu, H., Chen, L., Li, X., Xie, F., Yu, L., & Li, L. (2011). An oral colon-targeting controlled release system
based on resistant starch acetate: synthetization, characterization, and preparation of film-coating pellets.
Journal of Agricultural and Food Chemistry, 59(10), 5738-5745.
Qiao, D., Yu, L., Liu, H., Zou, W., Xie, F., Simon, G., Petinakis, E., Shen, Z., & Chen, L. (2016). Insights into
the hierarchical structure and digestion rate of alkali-modulated starches with different amylose contents.
Carbohydrate Polymers, 144, 271-281.
Situ, W., Li, X., Liu, J., & Chen, L. (2015). Preparation and Characterization of Glycoprotein-Resistant Starch
Complex As a Coating Material for Oral Bioadhesive Microparticles for Colon-Targeted Polypeptide Delivery.
Journal of Agricultural and Food Chemistry, 63(16), 4138-4147.
Tan, I., Flanagan, B. M., Halley, P. J., Whittaker, A. K., & Gidley, M. J. (2007). A method for estimating the
nature and relative proportions of amorphous, single, and double-helical components in starch granules by C-
13 CP/MAS NMR. Biomacromolecules, 8(3), 885-891.
Witt, T., Doutch, J., Gilbert, E. P., & Gilbert, R. G. (2012). Relations between molecular, crystalline, and
lamellar structures of amylopectin. Biomacromolecules, 13(12), 4273-4282.
Xie, F., Halley, P. J., & Avérous, L. (2012). Rheology to understand and optimize processibility, structures
and properties of starch polymeric materials. Progress in Polymer Science, 37(4), 595-623.
Zhang, B., Chen, L., Li, X., Li, L., & Zhang, H. (2015). Understanding the multi-scale structure and
functional properties of starch modulated by glow-plasma: A structure-functionality relationship. Food
Hydrocolloids, 50, 228-236.
Zhang, B. J., Chen, L., Xie, F. W., Li, X. X., Truss, R. W., Halley, P. J., Shamshina, J. L., Rogers, R. D., &
McNally, T. (2015). Understanding the structural disorganization of starch in water-ionic liquid solutions.
Physical Chemistry Chemical Physics, 17, 13860-13871.
Zhang, B. J., Xiong, S. X., Li, X. X., Li, L., Xie, F. W., & Chen, L. (2014). Effect of oxygen glow plasma on
supramolecular and molecular structures of starch and related mechanism. Food Hydrocolloids, 37, 69-76.
Zhang, B. J., Zhao, Y., Li, X. X., Li, L., Xie, F. W., & Chen, L. (2014). Supramolecular structural changes of
waxy and high-amylose cornstarches heated in abundant water. Food Hydrocolloids, 35, 700-709.
24
Zhang, B. J., Zhao, Y., Li, X. X., Zhang, P. F., Li, L., Xie, F. W., & Chen, L. (2014). Effects of amylose and
phosphate monoester on aggregation structures of heat-moisture treated potato starches. Carbohydrate
Polymers, 103, 228-233.