Embed Size (px)
Citation preview
Electrical Power and Energy Systems 32 (2010) 559–570
Contents lists available at ScienceDirect
Electrical Power and Energy Systems
journal homepage: www.elsevier .com/locate / i jepes
An extensible database architecture for nationwide power quality monitoring
Dilek Küçük a, Tolga _Inan a, Özgül Salor a,*, Turan Demirci a, Yener Akkaya b, Serkan Buhan a,Burak Boyrazoglu a, Özgür Ünsar b, Erinç Altıntas� b, Burhan Haliloglu b, Is�ık Çadırcı a,c, Muammer Ermis� d
a TUBITAK Uzay, Power Electronics Group, TR 06531 Ankara, Turkeyb Turkish Electricity Transmission Co. Inc., TR 06490 Ankara, Turkeyc Hacettepe University, Electrical and Electronics Eng. Dept., TR 06532 Ankara, Turkeyd METU, Electrical and Electronics Eng. Dept., TR 06531 Ankara, Turkey
a r t i c l e i n f o
Article history:Received 3 July 2008Received in revised form 29 September2009Accepted 6 November 2009
Keywords:Electrical power qualityDatabase modelDatabase applications
0142-0615/$ - see front matter � 2009 Elsevier Ltd. Adoi:10.1016/j.ijepes.2009.11.012
* Corresponding author. Tel.: +90 312 2101310.E-mail address: [email protected] (Ö
a b s t r a c t
Electrical power quality (PQ) data is one of the prevalent types of engineering data. Its measurement atrelevant sampling rates leads to large volumes of PQ data to be managed and analyzed. In this paper, anextensible database architecture is presented based on a novel generic data model for PQ data. The pro-posed architecture is operated on the nationwide PQ data of the Turkish Electricity Transmission Systemmeasured in the field by mobile PQ monitoring systems. The architecture is extensible in the sense that itcan be used to store and manage PQ data collected by any means with little or no customization. Thearchitecture has three modules: a PQ database corresponding to the implementation of the generic datamodel, a visual user query interface to enable its users to specify queries to the PQ database and a queryprocessor acting as a bridge between the query interface and the database. The operation of the architec-ture is illustrated on the field PQ data with several query examples through the visual query interface.The execution of the architecture on this data of considerable volume supports its applicability and con-venience for PQ data.
� 2009 Elsevier Ltd. All rights reserved.
1. Introduction
Electrical power quality (PQ) problems in electricity transmis-sion systems yield considerable economical loss and lack of cus-tomer satisfaction. PQ parameters are defined to determine thequality level of electrical power at electricity transmission and dis-tribution systems. Voltage sag, swell, interrupt, unbalance, flickerand current/voltage harmonics can be listed among these parame-ters. In order to detect the PQ problems in the transmission sys-tems, PQ measurements should be performed at high frequenciesso that necessary counter measures could be taken to preventthem. However, these measurements result in large volumes ofPQ data to be analyzed by PQ experts.
Effective management and analysis of the PQ data calls forproper data models as is the case for all other types of data to bestored in databases. For instance in [29], a graph-based data modelfor the common social network applications is proposed. Theauthors claim that the proposed model represents the structuraland domain-specific properties of the data effectively. Similarly,there are several studies that present conceptual data models formultimedia data, some of them with implementations of themodels as well [1] since multimedia data becomes one of the most
ll rights reserved.
. Salor).
prevalent types of data mostly due to the widespread employmentof the Internet and the surveillance systems.
There exists a number of studies that present PQ measurementsystems, including studies that enable real-time PQ monitoring[7,8], those that aim to obtain snapshots of the PQ status of varioustransformer substations [30], studies that focus on the importanceof interoperation of power systems databases [34], and those thatemphasize the data stream characteristics of PQ measurements[27]. Considerable work is particularly devoted to PQ event detec-tion in power systems including [9,26,28]. On the other hand, IEEECommon Format for Transient Data Exchange (COMTRADE) [25],which primarily focuses on the interchange of transient data pro-duced by fault recording devices [10], can be considered as an ini-tial attempt to transmit PQ data. Power Quality Data InterchangeFormat (PQDIF) [23] is a proprietary format for the transmissionof PQ data inspired by COMTRADE alleviating its limitations to dealwith frequency and probability domain information [10]. Recentstudies on the exchange of the PQ data mainly propose PQDIFimplementations extended with Extensible Markup Language(XML) [3,5,6]. Although a hierarchical data model for PQ data ispresented in [5], it mainly supports the exchange of data and doesnot address the actual storage and management issues. Therefore,apart from [5,27], where the latter incidentally presents a datamodel, to the best of our knowledge, there exists no study thatexplicitly proposes a data model for PQ data.

560 D. Küçük et al. / Electrical Power and Energy Systems 32 (2010) 559–570
In 2001, the Turkish Electricity System was vertically disinte-grated into four parts: generation, transmission, distribution, andtrading. Since then, responsibility of maintaining supply reliabilityand power quality has been assigned to Turkish Electricity Trans-mission Co. Inc. (TE_IAS�) which is a governmental company. In thesame year, the Energy Market Regulatory Authority of Turkey pub-lished a regulation [35], the objective of which is to set forth theprocedures and principles applicable to transmission system sup-ply reliability and quantity requirements to be fulfilled for reliableand low-cost operation of the transmission system as well as forthe delivery of high quality, adequate, and low-cost energy to con-sumers. The regulation covers the design principles, the supplyquality conditions, and the operational principles concerning thetransmission system with rules and procedures that TE_IAS� andthe transmission system users should comply with while designingthe generation facility switchyards.
In order to make the supply reliability and quality regulation[35] applicable, a 3-year project has been initiated in March 2006to establish a PQ monitoring centre and to develop customizedPQ monitors [7] to be connected to several points in the TurkishElectricity Transmission System. Since the commissioning of thisarchitecture takes considerable time, a mobile PQ monitoring sys-tem has also been implemented during the first year of the projectto take PQ snapshots of the Turkish Electricity Transmission Sys-tem [30]. The ultimate goal of efficient management and analysisof the output of the mobile PQ monitoring system motivated usto develop a convenient conceptual data model for the PQ data.In this paper, a generic conceptual data model for the PQ data isproposed, based on the data model presented in [27], after a thor-
Table 1Overview of the Turkish Electricity Transmission System.
Transmissionvoltage (kV)
O/H lines in km No. of substations No. of transformers
380a 13,976 58 145220 85 – –
154b 31,030 452 92066 719 15 56
Total 45,810 525 1121
a Highest voltage for related equipment is 420 kV according to IEC 60038 [19].b Highest voltage for related equipment is 170 kV according to [19].
Fig. 1. Turkish Electricity
ough examination of the output of the mobile PQ monitoring sys-tem [30] in order to get at an understanding of the data to bemodeled. The model is implemented as a full-fledged databasearchitecture comprising three modules: a PQ database, a queryprocessor, and a visual query interface. The implemented architec-ture is used to store the field (real) PQ data acquired through themobile PQ monitoring system which provides evidence for itsoperability and ease of applicability.
2. Mobile power quality monitoring system
The mobile PQ monitoring system [30] is implemented to get anunderstanding of the overall PQ status of the Turkish ElectricityTransmission System. A quantitative overview of the Turkish Elec-tricity Transmission System is given in Table 1. Measurementpoints have been determined out of those transformer substations,according to the frequency of faults in the associated power trans-formers and feeders, the power consumption density, and theamount of modern industrial loads present at those locations, bytaking a weighted average of these criteria. PQ measurementpoints selected among the points in Table 1 are indicated by (Q)on the map of the Turkish Electricity Transmission System givenin Fig. 1.
In the transmission system, most of the busbars have more thanone incoming and outgoing feeders. Therefore, the number of themeasurement points can be taken as the number of the feedersfor currents, and as the number of the busbars for voltages. Theclassification of the measurement points is given in Table 2, withrespect to the voltage level and the load type.
This section is concluded with a brief overview of the mobile PQmonitoring system. The operation of the overall system connectedto the relevant measurement points in the transmission system ispresented in Fig. 2. Each mobile-monitoring-system comprises aDAQ card (NI 6036E [16]), a sample/hold card (NI SC-2040), andan online data processing software. The data processing software,developed on NI LabView [17] environment, has the abilities to:
� acquire raw PQ data and detect PQ events (during sag, swell andunbalance events, record the acquired raw data as well),
� process the acquired raw data according to relevant standards[20–22,24] and record the processing outputs.
Transmission System.

Table 2Measurement points (NB: number of busbars, NF: number of feeders).
Voltagelevel (kV)
Load type
Heavy industry Industry + urban Total
NB NF NB NF NB NF
33 65 80 198 268 263 348154 20 33 134 157 154 190380 2 2 41 56 43 58
Total 87 115 373 481 460 596
D. Küçük et al. / Electrical Power and Energy Systems 32 (2010) 559–570 561
The measurements with the mobile PQ monitoring system arecarried out for a period of seven consecutive days with a samplingfrequency of 3200 Hz for each measurement point (yet, themeasurement output data may include some gaps due to someinterruption events during which no data can be acquired). This
Fig. 2. The mobile PQ m
Table 3Output data traffic of mobile PQ monitoring system.
Parameter Precision Update rate (averaging inter
Active power Double Every secondReactive power Double Every secondApparent power Double Every secondPower factor Double Every second33 Voltage harmonics Double Every 3 s33 Current harmonics Double Every 3 sRMS current and voltage Double Every 0.2 sEvent length Integer variableEvent type String variableEvent raw current data Double VariableEvent raw voltage data Double VariableShort-term flicker Double Every 10 minDemand Double Every 15 minFrequency Double Every second
satisfies the 7-day measurement period required by the IEC PQmeasurement standard [21]. Those mobile measurements are notsynchronized over the whole transmission system; however, tocover all load profiles supplied during different times of the year(such as irrigation motors and air conditioners, which operate incertain periods of the year), multiple 7-day measurements havebeen taken at such transformer substations of the transmissionsystem. Therefore, the collected data content can be assumed to re-flect the general behavior of the transmission system. This data-base has also supplied baseline information to determine thelocations of the permanent synchronized monitors, which will la-ter provide the complete status of the network. The measured PQrelated entities are described below and the output data traffic ofthe mobile PQ monitoring system is summarized in Table 3 asgiven in [27]. Interested readers should refer to [30] for an in-depthdescription of the mobile PQ monitoring system.
onitoring system.
val) Three phase Average PQ data bit rate (bps)
Yes 192Yes 192Yes 192Yes 192Yes 2112Yes 2112Yes 1920No 4No 106Yes 614,400Yes 614,400Yes 0.32Yes 0.213No 64
Total (with events) 1,235,790,533Total (without events) 6,990,533

562 D. Küçük et al. / Electrical Power and Energy Systems 32 (2010) 559–570
� Voltage and current RMS: RMS (Root-Mean-Square) values ofvoltages are computed in accordance with [21] every 10 cyclesof the power frequency. Current RMS values are also computedalthough current RMS is not among the PQ parameters listed in[21].
� Frequency: Frequency is the fundamental frequency componentmeasured by dividing the number of integral cycles countedduring the 1 s time clock interval by the cumulative durationof the integer cycles. Zero-crossings are detected and used forthis computation after attenuating harmonics and interharmon-ics in accordance with [21].
� Harmonics: Harmonic distortions of the voltage and current val-ues are computed in accordance with [22].
� Flicker: Short-term flicker is computed every 10 min in accor-dance with [20], whereas long-term flicker values are computedfrom a predefined number of consecutive short-term flicker val-ues. In this system, long-term flicker duration is taken to be 2 h,which means that 12 short-term flicker values are used to com-pute each long-term flicker value.
� Events: Voltage sag, swell, unbalance, and interruption aredetected as PQ events throughout the measurements. Voltagesag indicates an under-voltage situation, voltage swell standsfor an over-voltage situation, unbalance is the measure of howmuch the amplitude of the phases differ from each other. Finally,interruption begins when the voltage is below the voltage inter-ruption threshold. Event check is performed every half-cycle asrecommended in [21].
� Power: Power is not a parameter defined in [21]; however, it ismeasured for the sake of completeness of the electrical parame-ter collection. The power parameter includes real, reactive andapparent power components and it is measured and recordedevery second.
� Demand (load current): This is not one of the PQ parameterslisted in [21] similar to the power parameter. Power demandis characterized by the mean of the 1st harmonic componentof the load current, which is measured every 15 min in themobile PQ monitoring system.
3. Database architecture
3.1. Motivation
The mobile PQ monitoring system presented in the previoussection outputs its measurements as a specific directory structure.The system creates the directory structure for each measurement itperforms at different measurement sites. The measurement filescorresponding to each of the PQ parameters are grouped under
PQ DatabaseQuery
ProcessorJDBC
X
X
Fig. 3. Database archite
common directories (i.e. frequency, harmonics, etc.) and thesedirectories are also grouped under the name of the measurementsite. A proprietary software using LabView’s graphical program-ming environment has been developed to analyze the measure-ment data formatted in this directory structure by reading itfrom the disk. In order to store these measurements for furtheruse, measurement files are also copied to tertiary storage mediasuch as DVDs and cassettes. Although it satisfies short term expec-tations, such a policy to store and analyze the measurements posedseveral difficulties:
� Due to the considerable size of the measurement data, this typeof storage amounted to a large number of media, the manage-ment of which was alone an issue to be considered.
� The data was prone to being lost completely due to the possiblefailures of the aforementioned storage media.
� The analysis could only be performed per measurement pointseparately. An analysis to extract information about the overallstate of the transmission system was not possible.
� Although LabView’s visual graphical environment is a powerfuland easy-to-use tool to implement an analysis software for themeasurement data, its necessitating a proprietary licence makesthe widespread use of the software expensive.
Along with the obvious reasons to utilize a database manage-ment system to store and manage data [31], above difficulties leadto the development of a database architecture for the PQ data. Thearchitecture, presented in Fig. 3, comprises three main modules: aPQ database to store the measurement data, a query processor tohandle and process the user queries, and a visual query interfacethrough which the users can specify queries to the PQ databaseand retrieve the results.
The overall system is implemented as a three-tier architecture,with the PQ database constituting the database layer. The queryprocessor which corresponds to the application layer of the archi-tecture is implemented using Java programming language [11] andinterfaces with the database through the JDBC API [12]. The visualquery interface at the client side is also developed with Java andcommunicates with the query processor using Apache’s Javaimplementation of XML/RPC [14]. These three modules are thor-oughly explained in the upcoming subsections.
3.2. The power quality database
Conceptual data model is an abstract representation of data as aset of semantic items such as entities together with their attributesand relationships between these entities. In database design,
VisualQueryInterface
ML/RPC
XML/RPC
ML/RPC
VisualQuery
Interface
VisualQuery
Interface
cture for PQ data.
D. Küçük et al. / Electrical Power and Energy Systems 32 (2010) 559–570 563
conceptual modeling is a crucial step and is followed by the logicaldatabase design during which the mapping of the conceptual dataitems to actual database objects is carried out. The existence ofsuch models for a particular domain has the potential of their reus-ability by the database designers working in that domain whichwill lead to low development and interoperability costs. As pointedout in Section 1, there are not many studies on the conceptualmodeling of PQ data except for [5,27], where the former one pro-poses a hierarchical model for efficient exchange of the data with-
FlickerPST
Freq
CurrentHarmonics
Demand
FlickerPLT
Measure
Tran
*
1
*
1
*
1
*
1
1
*
*
1
*
1
*
1*
*
1
FlickerPLTProblems
FlickerPSTProblems
CurrentHarmonicProblems
1
1
11 1
Fig. 4. Generic conceptual data m
Table 4Summary of conceptual data model for PQ data.
Class name Description
Power Active/reactive/apparent power and power factormeasurements
RMS Voltage and current root-mean-square measuremenDemand Demand measurementsFrequency Frequency measurementsFlickerPST Short-term flicker measurementsFlickerPLT Long-term flicker measurementsVoltageHarmonics Voltage harmonicsCurrentHarmonics Current harmonicsEvent Information about the events occurred during
measurementsEventStat Summary of event status of measurement sitesFlickerPSTProblem Short-term flicker problem status of measurement
sitesFlickerPLTProblem Long-term flicker problem status of measurement sit
VoltageHarmonicProblem Voltage harmonics problem status of measurementsites
CurrentHarmonicProblem Current harmonics problem status of measurementsites
MeasurementPoint Detailed information about measurement sites
TransferFile Information about the file from which data is read antransferred
Report Information about reports generated by domainexperts
out targeting at storage and retrieval issues involved and the PQdata model presented in the latter study is the preliminary versionof the model proposed in the current study. Hence, to best of theauthors’ knowledge, the current study is significant for its propos-ing the first explicit data model for PQ data.
When the characteristics of the PQ parameters summarized atthe end of Section 2 are considered, each of them turns out to bemade up of smaller components. To illustrate, power data com-prises values for active/reactive/apparent power and power factor,
uency
VoltageHarmonics
Power
RMS
Event
EventStat
mentPoint
sferFile
*
1
*1
*
1
*
1
*
1
1
1 *1
*
1
*
1
*
1
*
VoltageHarmonicProblems
1
1
1
Report1
1
odel for power quality data.
Attributes to note
activePower, activePower, activePower, powerFactor (for A–C phases) andtime
ts rms (for A–C phases) and timedemand (for A–C phases) and timefrequency and timepst (for A–C phases) and timeplt (for A–C phases) and timeTHD, fundamental, harmonic2, . . ., harmonicN, phase, and timeTDD, fundamental, harmonic2, . . ., harmonicN, phase, and timeeventType, eventStartTime, eventEndTime, eventSizeInSamples, and filePath
noOfEvents, noOfSags, noOfSwells, noOfUnbalances, and noOfInterruptionsnoOfTotalSamples, noOfProblematicSamples (for A–C phases), andstandardLimit
es noOfTotalSamples, noOfProblematicSamples (for A–C phases), andstandardLimitnoOfTotalSamples, noOfProblematicSamples (for A–C phases), andstandardLimitnoOfTotalSamples, noOfProblematicSamples (for A–C phases), andstandardLimitmeasurementPointId, measurementPointName, transformerSubstationName,cityName, regionName, voltageLevel, and loadType
d fileName, sizeInBytes, md5, transferredPQType, and transferDate
reportFilePath, reportFileExtension, transformerSubstationName, and cityName
564 D. Küçük et al. / Electrical Power and Energy Systems 32 (2010) 559–570
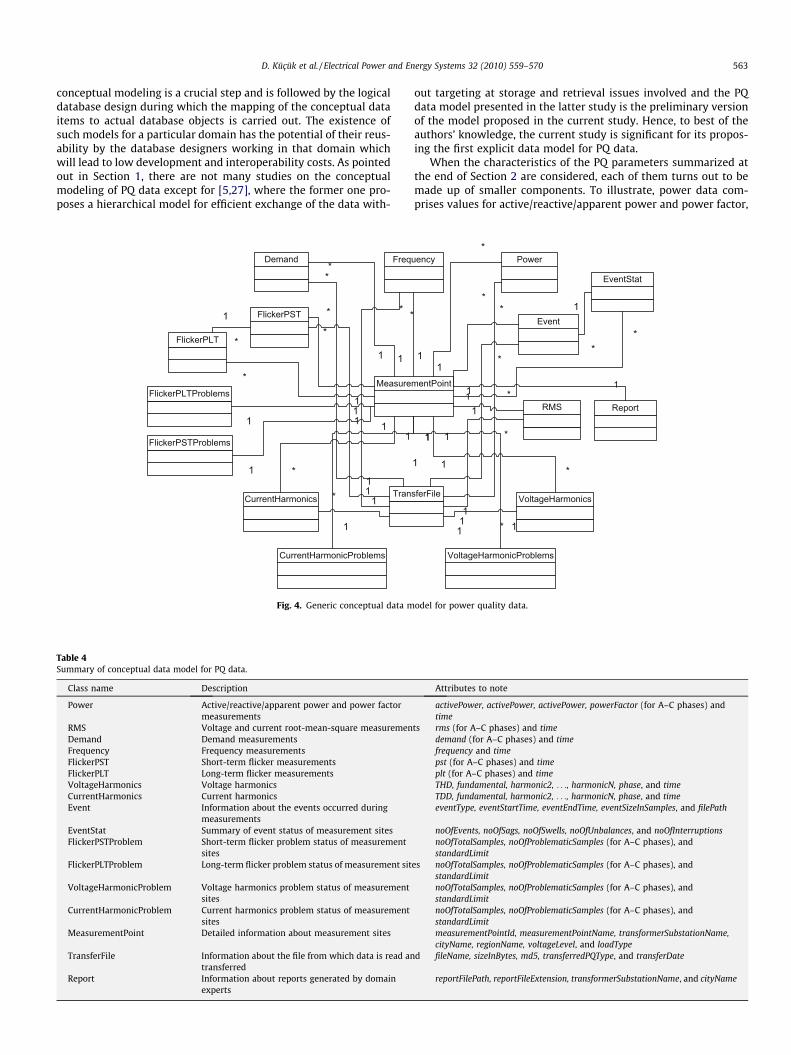
that is, these values are said to be encapsulated in the power data.This composite nature of the data leads us to the conclusion thatPQ data can be modeled by an object-oriented methodology. Withthis motivation, an object oriented approach is taken while model-ing the data and the derived generic conceptual data model is pre-sented in Fig. 4 as a Unified Modeling Language (UML) [2] classdiagram. The descriptions and important attributes of the classes(Power, RMS, etc.) in the conceptual data model are presented in Ta-ble 4.
The following information about the conceptual model is pro-vided to complement Table 4:
� Unless otherwise stated, all PQ data classes have distinct mea-surement attributes for three phases of A–C; since measure-ments are performed on three phases of the power system, inaddition to an attribute to model the actual timestamp of themeasurement data.
� The filePath attribute of the Event class is especially handy if anyraw data is particularly stored during the event occurrence. Theattribute, then, can be used to denote the path of the raw datafile, preferably in compressed binary format on a dedicated fileserver. For the output data of the mobile PQ monitoring systemeventType attribute can take on values from the set {Sag, Swell,Unbalance, Interruption}, yet this list can be expanded with moredetailed event types like Instantaneous/Momentary Sag/Swell, etc.
� The main purpose of the EventStat class is to speed up the sum-mary queries about the events.
� Among a set of flicker and harmonic measurement values, prob-lematic ones are those above a predefined threshold limit. Theselimits (usually referred to as standard limits) usually depend onthe characteristics of the measurement site. These limits or cal-culation guidelines for the limits, depending on the consideredPQ parameter type, are proposed in the relevant regulations,e.g., [35,24].If the measurement values for a flicker or a harmonic type in asite violate the standard limits more often than a certain thresh-old percentage of the whole measurement interval, that site issaid to be problematic with respect to that parameter. Thethreshold percentages are usually proposed, for short-termflicker, long-term flicker and harmonics, in the relevant regula-tions and the standards [21] and are applicable to all measure-ment sites. In the standard [21], threshold percentages of 1%,5% and, 5% are proposed for the short-term flicker, the long-termflicker, and all the harmonic types, respectively.Problem classes (FlickerPSTProblem, FlickerPLTProblem, Voltage-HarmonicProblem, and CurrentHarmonicProblem) model the prob-
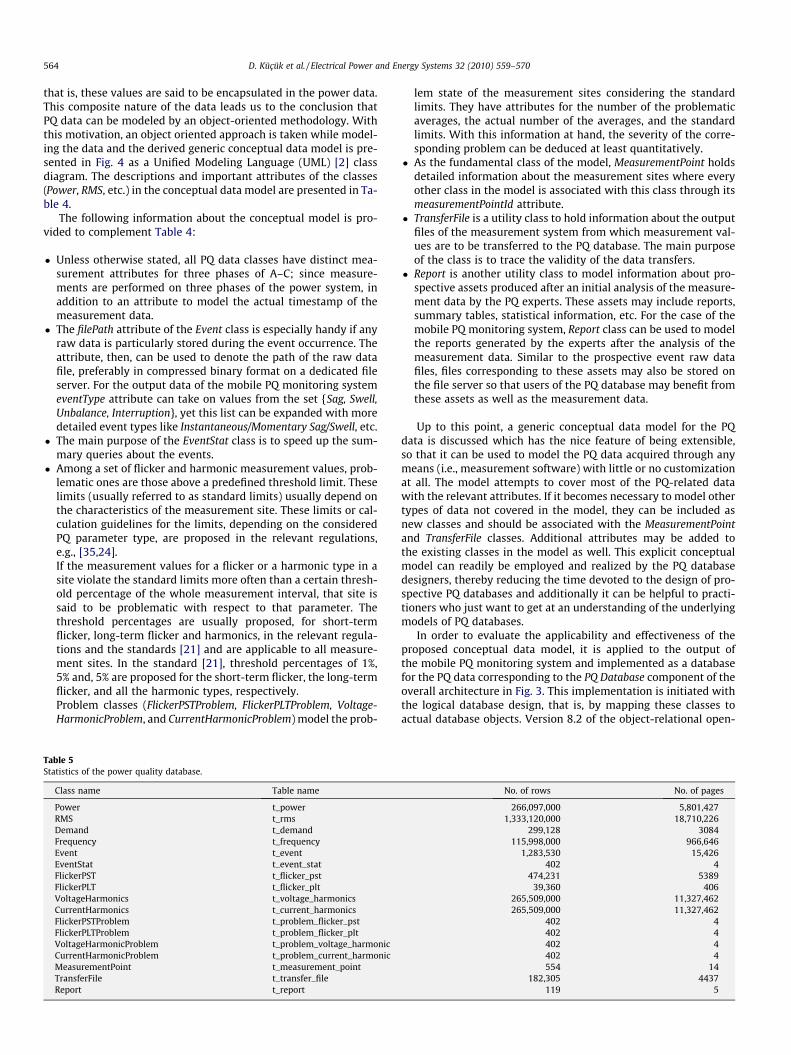
Table 5Statistics of the power quality database.
Class name Table name
Power t_powerRMS t_rmsDemand t_demandFrequency t_frequencyEvent t_eventEventStat t_event_statFlickerPST t_flicker_pstFlickerPLT t_flicker_pltVoltageHarmonics t_voltage_harmonicsCurrentHarmonics t_current_harmonicsFlickerPSTProblem t_problem_flicker_pstFlickerPLTProblem t_problem_flicker_pltVoltageHarmonicProblem t_problem_voltage_harmonicCurrentHarmonicProblem t_problem_current_harmonicMeasurementPoint t_measurement_pointTransferFile t_transfer_fileReport t_report
lem state of the measurement sites considering the standardlimits. They have attributes for the number of the problematicaverages, the actual number of the averages, and the standardlimits. With this information at hand, the severity of the corre-sponding problem can be deduced at least quantitatively.
� As the fundamental class of the model, MeasurementPoint holdsdetailed information about the measurement sites where everyother class in the model is associated with this class through itsmeasurementPointId attribute.
� TransferFile is a utility class to hold information about the outputfiles of the measurement system from which measurement val-ues are to be transferred to the PQ database. The main purposeof the class is to trace the validity of the data transfers.
� Report is another utility class to model information about pro-spective assets produced after an initial analysis of the measure-ment data by the PQ experts. These assets may include reports,summary tables, statistical information, etc. For the case of themobile PQ monitoring system, Report class can be used to modelthe reports generated by the experts after the analysis of themeasurement data. Similar to the prospective event raw datafiles, files corresponding to these assets may also be stored onthe file server so that users of the PQ database may benefit fromthese assets as well as the measurement data.
Up to this point, a generic conceptual data model for the PQdata is discussed which has the nice feature of being extensible,so that it can be used to model the PQ data acquired through anymeans (i.e., measurement software) with little or no customizationat all. The model attempts to cover most of the PQ-related datawith the relevant attributes. If it becomes necessary to model othertypes of data not covered in the model, they can be included asnew classes and should be associated with the MeasurementPointand TransferFile classes. Additional attributes may be added tothe existing classes in the model as well. This explicit conceptualmodel can readily be employed and realized by the PQ databasedesigners, thereby reducing the time devoted to the design of pro-spective PQ databases and additionally it can be helpful to practi-tioners who just want to get at an understanding of the underlyingmodels of PQ databases.
In order to evaluate the applicability and effectiveness of theproposed conceptual data model, it is applied to the output ofthe mobile PQ monitoring system and implemented as a databasefor the PQ data corresponding to the PQ Database component of theoverall architecture in Fig. 3. This implementation is initiated withthe logical database design, that is, by mapping these classes toactual database objects. Version 8.2 of the object-relational open-
No. of rows No. of pages
266,097,000 5,801,4271,333,120,000 18,710,226
299,128 3084115,998,000 966,646
1,283,530 15,426402 4
474,231 538939,360 406
265,509,000 11,327,462265,509,000 11,327,462
402 4402 4402 4402 4554 14
182,305 4437119 5

Table 6The facilities of the visual query interface.
Facility Description
PQ data retrieval View PQ measurements as time-series charts with the abilities to zoom in/out, save, and print these chartsRaw data retrieval View raw data corresponding the time interval during which an event has occurredReport retrieval Download and view reports on PQ data generated by domain expertsSummary retrieval View summary information over all the available data in the database, such as event distribution, flicker problem distribution as tables or bar/
pie charts
D. Küçük et al. / Electrical Power and Energy Systems 32 (2010) 559–570 565
source PostgreSQL [18] is used as the backend database manage-ment system and a PQ database is created comprising tables foreach of the classes in the generic model. The mapping betweenthe classes in the model and the database tables is demonstratedin the first two columns of Table 5. All of the database tables havea common attribute of measurement_point_id which is used to rep-resent associations between the MeasurementPoint class and allother classes. In order to speed up prospective queries on the data-base, clustered B+ tree indexes are created for each table on themeasurement_point_id column.
A local data transfer application is implemented using Java toimport measurement data formatted in the output directory struc-ture of the PQ monitoring system to the PQ database. Before theapplication is used, information about the measurement sites areinserted into the t_measurement_point table. When the applicationis run, it reads the measurement files and inserts the values to thecorresponding database tables. The contents of the tables for theproblem classes are also calculated and these tables are populatedafter the transfer of the actual measurements by the transfer appli-cation. Event raw data files and report files are also transferred tothe database server after they are compressed to save space, there-by utilizing the server as the file server as well.
At the time of writing this paper, PQ measurements of 402 sitesand reports of 84 transformer substations have been transferred tothe PQ database, which amounts to the statistics in the last twocolumns of Table 5 about the database. In Table 5, No. of Rows cor-responds to the estimated row counts and No. of Pages correspondsto the number of the actual database pages where the default pagesize for PostgreSQL is 8 KB.
3.3. The query processor
The query processor is a web-based application that communi-cates with the PQ database and the visual query interface by deliv-ering the user queries specified in the query interface to the PQdatabase and the query results back to the interface after process-ing the results if necessary.
The execution of the query processor is initiated when a userruns a query through the visual query interface. The query inter-face calls the relevant procedure of the query processor employinga form of Remote Procedure Call (RPC), namely, Apache’s Javaimplementation of the XML/RPC. The query processor, upon receiv-ing the query criteria, creates the corresponding Structured QueryLanguage (SQL) [4] expressions, executes the expressions on the PQdatabase through the JDBC API and returns the results back to thequery interface utilizing the XML/RPC. The web application com-prising the query processor is deployed on Apache’s Tomcat webserver [13].
3.4. The visual query interface
The value of a database is often determined by the ease of infor-mation retrieval from the database [31]. A database query interfaceacts as a bridge between the users of the database and the databaseitself by enabling the users to access the data they need. As de-scribed in [33], query interfaces can be classified as a member of
one of the three classes: conceptual, logical, and physical interfaceswhere the degree of information that the users should possessabout the underlying structure of the database system increasesas we proceed in the list. Conceptual interfaces require their usersto know about the conceptual items like the entities and the rela-tionships. Visual Knowledge Query Language (VKQL) proposed in[32] for the Entity-Relationship (ER) models is a sample conceptualinterface. Logical interfaces are based on the database objects liketables and views. SQL is an example logical interface with a well-defined syntax and semantics. Finally, at the physical interfacesthe users should possess information about the physical structureof the database system [33]. In [33], conceptual and logical data-base interfaces are compared based on the accuracy of user queriesand the confidence of users on their queries. The authors concludethat conceptual interfaces are easier to use and lead to more con-fident users of the database based on the comparison criteria.
Following the conclusion derived in [33], the query interface forthe PQ database is designed and implemented with Java as a visualconceptual interface so that the users are freed from the burden oflearning the underlying logical and physical details of the database.However, it should be noted that no formal visual query languagelike VKQL is proposed, instead, a visual query interface (VQI)customized for PQ data is developed with the facilities given inTable 6.
As demonstrated in Table 5, a considerable amount of field PQdata is stored in the database. In the rest of this section, the execu-tion of the overall system is demonstrated with sample queriesspecified through the VQI. The first two queries (Q1, Q2) representthe facilities of PQ data retrieval, and raw data retrieval, respec-tively. The last two queries (Q3 and Q4) demonstrate the summaryretrieval facility of the VQI.
The first sample query (Q1) is meant to access all voltage RMSdata corresponding to a single measurement site. The query is infact a representative of a family of the queries, since each PQ datafor respective panels in the VQI enables a similar query to be per-formed for each other PQ data (power, short and long-term flicker,harmonics, etc.) as well.
In Fig. 5, snapshot of the VQI for Q1 is presented and the figure issupplemented with the specification and the execution strategy forthe query.
Q1: Retrieve three-phase voltage RMS values as 10 min averagesfor the secondary side of 380/154 kV BANK A transformer at AL_IAGATM transformer substation and plot the retrieved values as a time-ser-ies chart.
The execution of Q1 proceeds as follows:
(1) The criteria corresponding to the query are encapsulated asan object and the relevant remote procedure (getRMSDatafor this query) in the Query Processor (QP) module is calledwith this object as the argument.
(2) The QP, upon receiving the criteria object, prepares and exe-cutes the SQL query below to retrieve the required RMS val-ues from the database (319 is the measurement_point_idcorresponding to the queried measurement site).
select va, vb, vc, timefrom t_rms

Fig. 5. Snapshot of the RMS query, Q1.
566 D. Küçük et al. / Electrical Power and Energy Systems 32 (2010) 559–570
where measurement_point_id = 319order by time;
(3) As demonstrated in Table 3, RMS values are measured withan averaging interval of 0.2 s by the mobile PQ monitoringsystem, the output of which is stored in the PQ database.For the query Q1, the chart is needed to be plotted with10-min averages, hence, the QP calculates 10-min averageRMS values from the 0.2-s averages and sends them to theVQI.
(4) The VQI plots a time-series chart from the retrieved RMSaverages as in Fig. 5. The graphical facilities of the interfaceare implemented using the open-source JFreeChart API [15].The users can zoom in/out, save and print the time-serieschart displayed. These facilities are not implemented fromscratch for they were already available in the JFreeChartAPI and the facilities are also applicable to the other charts(like bar/pie charts) utilized in the query interface.
Before we move on to the next sample query, two points in thespecification of Q1 necessitate further clarification:
� Although there is no utility in Fig. 5 to choose the representationscheme for the query result, in the specification of the query, it isstated to be a time-series chart. This mapping from the queryinterface to the specification is due to the default setting for thisfamily of queries that they will be visualized as time-seriescharts.
� In the query interface there exists no component to specify thatthe result of the query should comprise 10-min averages of theRMS values, yet this information is present in the query specifi-cation. The criterion of the averaging interval for the queried PQdata is obtained through a general Settings panel (Fig. 6) avail-
able to all users through which they can specify and set theirpreferred averaging intervals for all PQ data types.
Our second query (Q2), which is illustrated on the VQI in Fig. 7,aims to retrieve all unbalance events that occurred during the PQmeasurements of a particular site. The query is specified belowin the natural language and its execution strategy then follows:
Q2: Retrieve all unbalance events of primary side of 154/34.5 kVTRAFO-B transformer at TATVAN TM transformer substation.
The first of the execution steps of Q2 is the same as that of Q1and is also common to all queries that can be specified throughthe VQI. The remaining steps of Q2 are:
(1) The QP executes the SQL expression below to obtain theinformation corresponding to query criteria and sends theresults to the VQI (319 is the measurement_point_id corre-sponding to queried measurement site and file_path field isfor the path of the raw data file for events on the PQ data-base server).
select event_type, start_date, end_date, file_pathfrom t_eventwhere measurement_point_id = 319order by start_date;(2) Upon receiving the results, the VQI displays them as a tablewhere each row corresponds to a single event. At the end ofeach row, an HTML link is displayed to enable the users tovisualize the raw voltage values saved during the respectiveevent as a time-series chart.
(3) When the user follows the Plot Chart link, the file_path infor-mation is sent to the QP which sends the raw data file incompressed binary format, as it is stored in the database ser-ver, to the VQI.

Fig. 6. Settings panel.
Fig. 7. Snapshot of the unbalance events query, Q2.
D. Küçük et al. / Electrical Power and Energy Systems 32 (2010) 559–570 567
(4) The VQI, after decompressing and reading the raw data file,plots the raw voltage values as a time-series chart as demon-strated in Fig. 7.
The Plot Chart link displays the waveform of the unbalanceevent as shown in Fig. 7. The particular unbalance event showndisplays the unequal amplitudes of the three phases from the timeaxis samples 2950–3250 (unbalance is defined as the unequalamplitudes of the three phases or phase angles between any twophases being not equal to 120�).
The last two sample queries aim to access summary informa-tion over all data in the PQ database. The first of them (Q3) is onevent distribution and the second one (Q4) is on flicker problemdistribution as illustrated in Figs. 8 and 9, respectively. The figures
are accompanied by the specification and the execution steps ofthe queries.
Q3: Retrieve event distribution (as number of sag, swell, interrup-tion, unbalance events) for each voltage level and display the resultsas pie chart(s).
The results of this query may well be displayed as a table or abar chart and these three options are applicable to Q4 as well.The execution steps for Q3 are:
(1) QP executes the SQL query below and sends the results toVQI.
select sum(es.sag_count), sum(es.swell_count),sum(es.unbalance_count),sum(es.interruption_count),
Fig. 8. Snapshot of the event distribution query, Q3.
Fig. 9. Snapshot of the flicker problem distribution query, Q4.
568 D. Küçük et al. / Electrical Power and Energy Systems 32 (2010) 559–570
D. Küçük et al. / Electrical Power and Energy Systems 32 (2010) 559–570 569
mp.voltage_levelfrom t_event_stat as es, t_measurement_point as mp
where es.measurement_point_id = mp.measurement_point_idgroup by mp.voltage_level;
(2) VQI displays the retrieved information as pie charts as dem-onstrated in Fig. 8.
Fig. 8 shows interesting results obtained for the event distribu-tions all over the country for different voltage levels. It is observedthat the most probable event at an extra-high or a medium voltagemeasurement point is the sag, while it is the swell for a high volt-age measurement point in the Turkish Electricity TransmissionSystem.
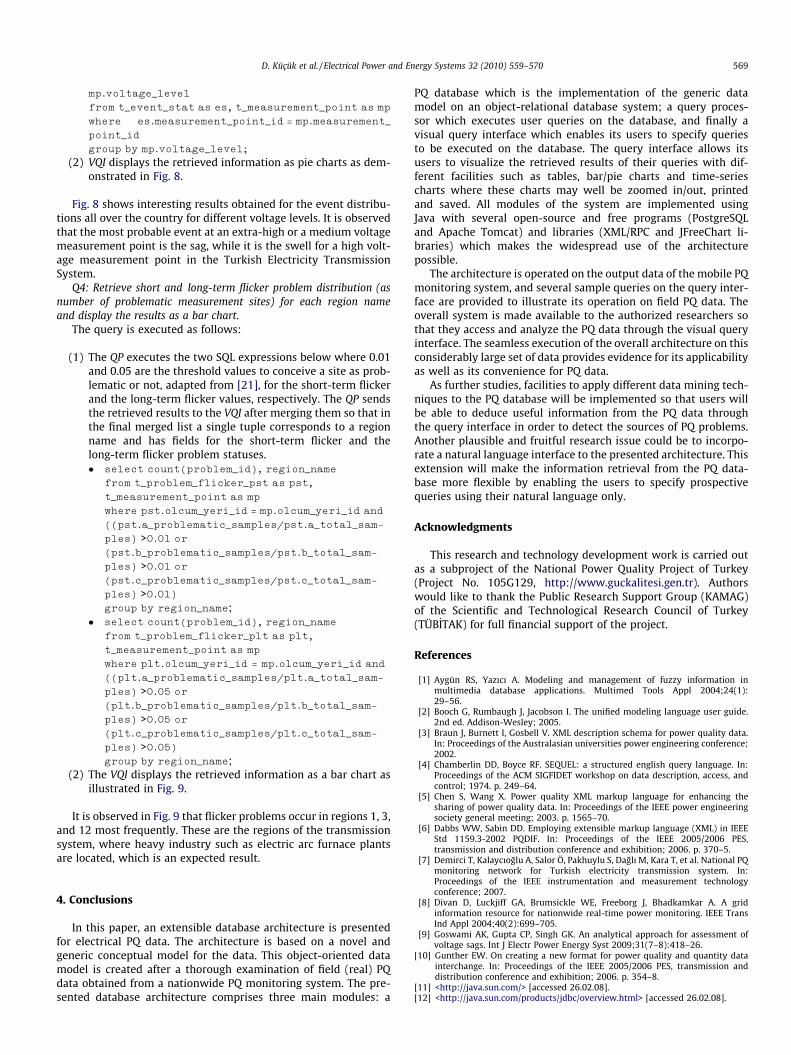
Q4: Retrieve short and long-term flicker problem distribution (asnumber of problematic measurement sites) for each region nameand display the results as a bar chart.
The query is executed as follows:
(1) The QP executes the two SQL expressions below where 0.01and 0.05 are the threshold values to conceive a site as prob-lematic or not, adapted from [21], for the short-term flickerand the long-term flicker values, respectively. The QP sendsthe retrieved results to the VQI after merging them so that inthe final merged list a single tuple corresponds to a regionname and has fields for the short-term flicker and thelong-term flicker problem statuses.
� select count(problem_id), region_namefrom t_problem_flicker_pst as pst,
t_measurement_point as mp
where pst.olcum_yeri_id = mp.olcum_yeri_id and
((pst.a_problematic_samples/pst.a_total_sam-ples) >0.01 or
(pst.b_problematic_samples/pst.b_total_sam-ples) >0.01 or
(pst.c_problematic_samples/pst.c_total_sam-ples) >0.01)group by region_name;
� select count(problem_id), region_namefrom t_problem_flicker_plt as plt,
t_measurement_point as mp
where plt.olcum_yeri_id = mp.olcum_yeri_id and
((plt.a_problematic_samples/plt.a_total_sam-ples) >0.05 or
(plt.b_problematic_samples/plt.b_total_sam-ples) >0.05 or
(plt.c_problematic_samples/plt.c_total_sam-ples) >0.05)group by region_name;
(2) The VQI displays the retrieved information as a bar chart asillustrated in Fig. 9.
It is observed in Fig. 9 that flicker problems occur in regions 1, 3,and 12 most frequently. These are the regions of the transmissionsystem, where heavy industry such as electric arc furnace plantsare located, which is an expected result.
4. Conclusions
In this paper, an extensible database architecture is presentedfor electrical PQ data. The architecture is based on a novel andgeneric conceptual model for the data. This object-oriented datamodel is created after a thorough examination of field (real) PQdata obtained from a nationwide PQ monitoring system. The pre-sented database architecture comprises three main modules: a
PQ database which is the implementation of the generic datamodel on an object-relational database system; a query proces-sor which executes user queries on the database, and finally avisual query interface which enables its users to specify queriesto be executed on the database. The query interface allows itsusers to visualize the retrieved results of their queries with dif-ferent facilities such as tables, bar/pie charts and time-seriescharts where these charts may well be zoomed in/out, printedand saved. All modules of the system are implemented usingJava with several open-source and free programs (PostgreSQLand Apache Tomcat) and libraries (XML/RPC and JFreeChart li-braries) which makes the widespread use of the architecturepossible.
The architecture is operated on the output data of the mobile PQmonitoring system, and several sample queries on the query inter-face are provided to illustrate its operation on field PQ data. Theoverall system is made available to the authorized researchers sothat they access and analyze the PQ data through the visual queryinterface. The seamless execution of the overall architecture on thisconsiderably large set of data provides evidence for its applicabilityas well as its convenience for PQ data.
As further studies, facilities to apply different data mining tech-niques to the PQ database will be implemented so that users willbe able to deduce useful information from the PQ data throughthe query interface in order to detect the sources of PQ problems.Another plausible and fruitful research issue could be to incorpo-rate a natural language interface to the presented architecture. Thisextension will make the information retrieval from the PQ data-base more flexible by enabling the users to specify prospectivequeries using their natural language only.
Acknowledgments
This research and technology development work is carried outas a subproject of the National Power Quality Project of Turkey(Project No. 105G129, http://www.guckalitesi.gen.tr). Authorswould like to thank the Public Research Support Group (KAMAG)of the Scientific and Technological Research Council of Turkey(TÜB_ITAK) for full financial support of the project.
References
[1] Aygün RS, Yazıcı A. Modeling and management of fuzzy information inmultimedia database applications. Multimed Tools Appl 2004;24(1):29–56.
[2] Booch G, Rumbaugh J, Jacobson I. The unified modeling language user guide.2nd ed. Addison-Wesley; 2005.
[3] Braun J, Burnett I, Gosbell V. XML description schema for power quality data.In: Proceedings of the Australasian universities power engineering conference;2002.
[4] Chamberlin DD, Boyce RF. SEQUEL: a structured english query language. In:Proceedings of the ACM SIGFIDET workshop on data description, access, andcontrol; 1974. p. 249–64.
[5] Chen S, Wang X. Power quality XML markup language for enhancing thesharing of power quality data. In: Proceedings of the IEEE power engineeringsociety general meeting; 2003. p. 1565–70.
[6] Dabbs WW, Sabin DD. Employing extensible markup language (XML) in IEEEStd 1159.3-2002 PQDIF. In: Proceedings of the IEEE 2005/2006 PES,transmission and distribution conference and exhibition; 2006. p. 370–5.
[7] Demirci T, Kalaycıoglu A, Salor Ö, Pakhuylu S, Daglı M, Kara T, et al. National PQmonitoring network for Turkish electricity transmission system. In:Proceedings of the IEEE instrumentation and measurement technologyconference; 2007.
[8] Divan D, Luckjiff GA, Brumsickle WE, Freeborg J, Bhadkamkar A. A gridinformation resource for nationwide real-time power monitoring. IEEE TransInd Appl 2004;40(2):699–705.
[9] Goswami AK, Gupta CP, Singh GK. An analytical approach for assessment ofvoltage sags. Int J Electr Power Energy Syst 2009;31(7–8):418–26.
[10] Gunther EW. On creating a new format for power quality and quantity datainterchange. In: Proceedings of the IEEE 2005/2006 PES, transmission anddistribution conference and exhibition; 2006. p. 354–8.
[11] <http://java.sun.com/> [accessed 26.02.08].[12] <http://java.sun.com/products/jdbc/overview.html> [accessed 26.02.08].

570 D. Küçük et al. / Electrical Power and Energy Systems 32 (2010) 559–570
[13] <http://tomcat.apache.org/> [accessed 26.02.08].[14] <http://ws.apache.org/xmlrpc/> [accessed 26.02.08].[15] <http://www.jfree.org/jfreechart/> [accessed 26.02.08].[16] <http://www.ni.com> [accessed 26.02.08].[17] <http://www.ni.com/labview> [accessed 26.02.08].[18] <http://www.postgresql.org/> [accessed 26.02.08].[19] IEC 60038. IEC standard voltages; 2002.[20] IEC 61000-4-15. Testing and measurement techniques – Flickermeter –
functional and design specifications; 2002.[21] IEC 61000-4-30. Electromagnetic compatibility (EMC) – part 4–30: testing and
measurement techniques – power quality measurement methods; 2003.[22] IEC 61000-4-7. Testing and measurement techniques – general guide on
harmonics and interharmonics measurements and instrumentation, for powersupply systems and equipment connected thereto; 2003.
[23] IEEE Std 1159.3-2003. IEEE recommended practice for the transfer of powerquality data, IEEE Std 1159.3-2003; 2003.
[24] IEEE Std-519. Recommended practices and requirements for harmonic controlin electrical power systems; 1992.
[25] IEEE Std C37.111-1999. IEEE standard common format for transientdata exchange (COMTRADE) for power systems, IEEE Std C37.111-1999;1999.
[26] Kaewarsa S, Attakitmongcol K, Kulworawanichpong T. Recognition of powerquality events by using multiwavelet-based neural networks. Int J ElectrPower Energy Syst 2008;30(4):254–60.
[27] Küçük D, _Inan T, Boyrazoglu B, Buhan S, Salor Ö, Çadırcı I, et al. PQStream: adata stream architecture for electrical power quality. In: Proceedings ofinternational workshop on knowledge discovery from ubiquitous data streamsof ECML/PKDD; 2007.
[28] Lobos T, Rezmer J, Janik P, Amarfs H, Alonso M, lvarez C. Application ofwavelets and Prony method for disturbance detection in fixed speed windfarms. Int J Electr Power Energy Syst 2009;31(9):429–36.
[29] Mitra S, Bagchi A, Bandyopadhyay AK. Design of a data model for socialnetwork applications. J Database Manage 2007;18(4):51–79.
[30] Özdemirci E, Akkaya Y, Boyrazoglu B, Buhan S, Terciyanlı A, Ünsar O, et al.Mobile monitoring system to take PQ snapshots of Turkish electricitytransmission system. In: Proceedings of the IEEE instrumentation andmeasurement technology conference; 2007.
[31] Ramakrishnan R, Gehrke J. Database management systems. 3rd ed. McGraw-Hill College; 2003.
[32] Siau KL, Chan HC, Tan KP. Visual knowledge query language. IEICE TransInform Syst 1992;E75-D(5):697–703.
[33] Siau KL, Chan HC, Wei KK. Effects of query complexity and learning on noviceuser query performance with conceptual and logical interfaces. IEEE Trans SystMan Cybernet 2004;34(2):276–81.
[34] Simpson RH. Power system data base management. IEEE Trans Ind Appl2001;37(1):153–7.
[35] Turkish Std. Turkish electricity transmission system supply reliability andquality regulation; 2004.