Embed Size (px)
Citation preview

Journal of Biomechanics 37 (2004) 1241–1249
ARTICLE IN PRESS
*Correspond
E-mail addr1The authors
passed away b
colleague and
scientist.
0021-9290/$ - se
doi:10.1016/j.jb
An expression relating breaking stress and density of trabecular bone
Chamith S. Rajapaksea, Jesper S. Thomsenb,c, Julio S. Espinoza Ortiza,Sunil J. Wimalawansad, Ebbe N. Ebbesenb,e, Lis Mosekildeb,1, Gemunu H. Gunaratnea,f,*
aDepartment of Physics, University of Houston, Houston, TX 77204, USAbDepartment of Cell Biology, Institute of Anatomy, University of Aarhus, (Arhus, Denmark
cDepartment of Connective Tissue Biology, Institute of Anatomy, University of Aarhus, (Arhus, DenmarkdDepartment of Medicine, Robert Wood Johnson Medical School, New Brunswick, NJ 08903, USA
eDepartment of Endocrinology, Odense University Hospital, Odense, DenmarkfThe Institute of Fundamental Studies, Kandy 20000, Sri Lanka
Accepted 2 December 2003
Abstract
Bone mineral density (BMD) is the principal diagnostic tool used in clinical settings to diagnose and monitor osteoporosis.
Experimental studies on ex vivo bone samples from multiple skeletal locations have been used to propose that their breaking stress
bears a power-law relationship to volumetric BMD, with a location-dependent index. We argue that a power-law cannot represent
effects of trabecular removal, which is one of the leading causes of reduction in bone strength. A new expression, proposed on the
basis of theoretical and numerical analysis of a mathematical model, is tested using previously published data on bone samples from
iliac crest and vertebral body. It represents the experimental biomechanical data at least as well as the power-law, and provides
means for extrapolating results from small biopsy samples to an entire bone. In addition, changes caused by trabecular thinning and
anisotropy can be modeled by the expression.
r 2003 Elsevier Ltd. All rights reserved.
Keywords: Osteoporosis; Fracture; Strength of networks; Bone strength
1. Introduction
Osteoporosis is a major socio-economic problem inwestern societies (Kiberstis et al., 2000). Excessive use oftherapeutic agents can have adverse consequences(Weinstein, 2000) and reliable non-invasive diagnostictools to determine the need for intervention cansignificantly aid management of the disease. Thestrength of a bone has been shown to depend onmultiple factors (Blank, 2001; Bolotin and Siev.anen,2001) including the fracture toughness of cortical bone(Norman et al., 1998; Yeni and Norman, 2000) andstructural characteristics of cancellous bone such as thelevels of trabecular removal, thinning, and anisotropy
ing author.
ess: [email protected] (G.H. Gunaratne).
would like to pay tribute to Lis Mosekilde who sadly
efore the study was completed. We have lost a great
a collaborator, and the discipline an outstanding
e front matter r 2003 Elsevier Ltd. All rights reserved.
iomech.2003.12.001
(Silva et al., 1995; Silva and Gibson, 1997a, b; Ciarelliet al., 2000; Gibson and Ashby, 1997; Vajjhala et al.,2000). Since age-related changes in these factors aresubject dependent (Mosekilde et al., 2000), interpreta-tion of results from experimental studies, including thedetermination of dominant causes of strength reduction,becomes extremely challenging. Using mathematicalmodels, where changes in each factor can be studiedindependently, provides one way to address such issues(Silva et al., 1995; Silva and Gibson, 1997a, b; Vajjhalaet al., 2000).Experiments on ex vivo bone samples have indicated
that the breaking stress of a bone smax is related non-linearly to the volumetric bone mineral density (BMD)r; and a power-law relationship
smaxBrb; ð1Þ
has been proposed (Bell et al., 1967; Carter and Hayes,1977; McBroom et al., 1985; McElhaney et al., 1970;Rice et al., 1988). The index b has been shown to belocation dependent; e.g. for trabecular bone from

ARTICLE IN PRESS
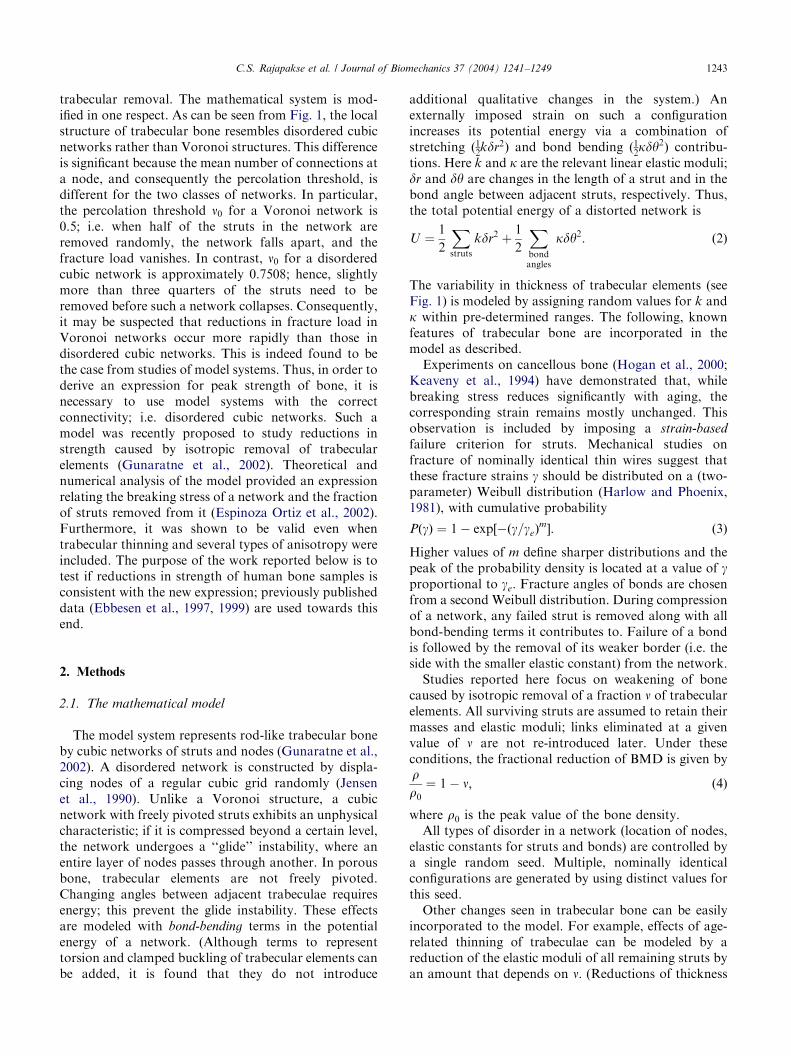
Fig. 1. Images of trabecular bone from the second lumbar vertebra of
a (a) 27 year old man, and a (b) 97 year old man. In small local regions
their structure consists of disordered cubic networks. Aging causes
trabecular perforations and loss of connectivity. Anisotropy in the
levels of resorption and thinning are also evident.
C.S. Rajapakse et al. / Journal of Biomechanics 37 (2004) 1241–12491242
vertebrae and iliac crest its value is approximately 1.7(Ebbesen et al., 1999) and 2.6 (Ebbesen et al., 1997),respectively. In addition, it is known that b depends onthe level of anisotropy of porous bone (Mosekilde et al.,1987).Uniform, isotropic thinning of trabecular elements is
one explanation for the relationship (1). For example,failure of rod- and plate-like cubic structures viabuckling gives b ¼ 2 and 3, respectively (Gibson,1985). If plastic yielding is assumed to be the mode offailure (as is the case for low slenderness ratio) the valueof b for open cell and closed cell structures are 1.5 and 2,respectively (Gibson and Ashby, 1982, 1997; Gibson,1985).As seen from Fig. 1, aging causes other changes in the
structure of trabecular bone. They include (oftenanisotropic) reductions in trabecular number andconnectivity. Furthermore, changes in the mean thick-ness of trabecular elements in axial and off-axialdirections are very different. Such architectural changeslead to significant variations in mechanical properties ofbone (Bell et al., 1967; Mosekilde et al., 1987; Pugh et al.,1973). Thus, in order to determine a relationshipbetween strength and density of bone, it is necessaryto identify the leading cause(s) for loss of bone strength;roles played by the remaining factors also need to betested. Such an analysis is best conducted in modelsystems.A significant step in this direction was taken in a
recent series of papers which introduced the use ofdisordered open cell Voronoi structures to modeltrabecular bone (Silva et al., 1995; Silva and Gibson,1997a, b; Vajjhala et al., 2000; Guo and Kim, 2002;Gibson and Ashby, 1997). These networks are con-structed from a set of points distributed randomly (suchthat no two points are closer than a predetermineddistance). Struts are formed using the Voronoi algo-rithm (Silva et al., 1995). Finally, edges shorter than apredetermined value are removed by combining adjoin-ing vertices. Computations conducted on Voronoistructures have shown that trabecular removal has amore dramatic effect on the strength of a network thaneither trabecular thinning or anisotropy (Silva andGibson, 1997b; Guo and Kim, 2002; Vajjhala et al.,2000). This conclusion, in particular, implies that apower-law relationship cannot represent the ensuing lossof bone strength, as seen from the following argument:With progressive removal of trabecular elements, anetwork separates into multiple, unconnected segmentswhen a fraction n0 of struts are removed. For largeVoronoi networks, n0; referred to as the bond-percolation
threshold, is 0.5 (Stauffer, 1985). Even for finite net-works (such as a trabecular bone specimen) the value ofn0 does not differ appreciably. Since the network isdisconnected at this point, smax ¼ 0 even though theBMD for the trabecular bone is non-zero (Silva and
Gibson, 1997b; Guo and Kim, 2002; Vajjhala et al.,2000). This condition implies a failure of Eq. (1),differences being particularly significant for weak bones.Consequently, it is necessary to determine an alternativeexpression to represent the relationship between thestrength and density of trabecular bone.We have followed this model-based analysis to derive
an expression that relates fracture stress to the level of
ARTICLE IN PRESSC.S. Rajapakse et al. / Journal of Biomechanics 37 (2004) 1241–1249 1243
trabecular removal. The mathematical system is mod-ified in one respect. As can be seen from Fig. 1, the localstructure of trabecular bone resembles disordered cubicnetworks rather than Voronoi structures. This differenceis significant because the mean number of connections ata node, and consequently the percolation threshold, isdifferent for the two classes of networks. In particular,the percolation threshold n0 for a Voronoi network is0.5; i.e. when half of the struts in the network areremoved randomly, the network falls apart, and thefracture load vanishes. In contrast, n0 for a disorderedcubic network is approximately 0.7508; hence, slightlymore than three quarters of the struts need to beremoved before such a network collapses. Consequently,it may be suspected that reductions in fracture load inVoronoi networks occur more rapidly than those indisordered cubic networks. This is indeed found to bethe case from studies of model systems. Thus, in order toderive an expression for peak strength of bone, it isnecessary to use model systems with the correctconnectivity; i.e. disordered cubic networks. Such amodel was recently proposed to study reductions instrength caused by isotropic removal of trabecularelements (Gunaratne et al., 2002). Theoretical andnumerical analysis of the model provided an expressionrelating the breaking stress of a network and the fractionof struts removed from it (Espinoza Ortiz et al., 2002).Furthermore, it was shown to be valid even whentrabecular thinning and several types of anisotropy wereincluded. The purpose of the work reported below is totest if reductions in strength of human bone samples isconsistent with the new expression; previously publisheddata (Ebbesen et al., 1997, 1999) are used towards thisend.
2. Methods
2.1. The mathematical model
The model system represents rod-like trabecular boneby cubic networks of struts and nodes (Gunaratne et al.,2002). A disordered network is constructed by displa-cing nodes of a regular cubic grid randomly (Jensenet al., 1990). Unlike a Voronoi structure, a cubicnetwork with freely pivoted struts exhibits an unphysicalcharacteristic; if it is compressed beyond a certain level,the network undergoes a ‘‘glide’’ instability, where anentire layer of nodes passes through another. In porousbone, trabecular elements are not freely pivoted.Changing angles between adjacent trabeculae requiresenergy; this prevent the glide instability. These effectsare modeled with bond-bending terms in the potentialenergy of a network. (Although terms to representtorsion and clamped buckling of trabecular elements canbe added, it is found that they do not introduce
additional qualitative changes in the system.) Anexternally imposed strain on such a configurationincreases its potential energy via a combination ofstretching ð1
2kdr2Þ and bond bending ð1
2kdy2Þ contribu-
tions. Here k and k are the relevant linear elastic moduli;dr and dy are changes in the length of a strut and in thebond angle between adjacent struts, respectively. Thus,the total potential energy of a distorted network is
U ¼1
2
X
struts
kdr2 þ1
2
X
bondangles
kdy2: ð2Þ
The variability in thickness of trabecular elements (seeFig. 1) is modeled by assigning random values for k andk within pre-determined ranges. The following, knownfeatures of trabecular bone are incorporated in themodel as described.Experiments on cancellous bone (Hogan et al., 2000;
Keaveny et al., 1994) have demonstrated that, whilebreaking stress reduces significantly with aging, thecorresponding strain remains mostly unchanged. Thisobservation is included by imposing a strain-based
failure criterion for struts. Mechanical studies onfracture of nominally identical thin wires suggest thatthese fracture strains g should be distributed on a (two-parameter) Weibull distribution (Harlow and Phoenix,1981), with cumulative probability
PðgÞ ¼ 1� exp½�ðg=geÞm�: ð3Þ
Higher values of m define sharper distributions and thepeak of the probability density is located at a value of gproportional to ge: Fracture angles of bonds are chosenfrom a second Weibull distribution. During compressionof a network, any failed strut is removed along with allbond-bending terms it contributes to. Failure of a bondis followed by the removal of its weaker border (i.e. theside with the smaller elastic constant) from the network.Studies reported here focus on weakening of bone
caused by isotropic removal of a fraction n of trabecularelements. All surviving struts are assumed to retain theirmasses and elastic moduli; links eliminated at a givenvalue of n are not re-introduced later. Under theseconditions, the fractional reduction of BMD is given byrr0
¼ 1� n; ð4Þ
where r0 is the peak value of the bone density.All types of disorder in a network (location of nodes,
elastic constants for struts and bonds) are controlled bya single random seed. Multiple, nominally identicalconfigurations are generated by using distinct values forthis seed.Other changes seen in trabecular bone can be easily
incorporated to the model. For example, effects of age-related thinning of trabeculae can be modeled by areduction of the elastic moduli of all remaining struts byan amount that depends on n: (Reductions of thickness

ARTICLE IN PRESSC.S. Rajapakse et al. / Journal of Biomechanics 37 (2004) 1241–12491244
of a trabeculer element by a factor t will reduce both itsmass and elastic constant by t2: We assume that thebond-bending coefficients decrease by t4:) Anisotropicremoval of trabecular elements can be modeled by acorresponding directional removal of struts. Anisotropicreductions in thickness of trabecular elements (Mose-kilde et al., 1987) is represented by directional reduc-tions in elastic constants. Finally, we have consideredpossible differences in the mean length of trabecularelements in vertical (axial) and horizontal directions.Including these changes do not affect the form of theexpression for the strength of a network, suggesting thattrabecular removal is the dominant cause of reductionsin strength, as has already been noted (Silva andGibson, 1997a, b; Guo and Kim, 2002; Vajjhala et al.,2000).
2.2. Numerical methods
In this paper, we discuss properties of networkssubjected to a uniform external strain e; reached througha sequence of small, adiabatic increments. We considercubic networks containing Lx � Ly � Lz nodes whoselocations are denoted by rijk ¼ ðxijk; yijk; zijkÞ: Here the(integer) indices i; j; and k take values in ½1;Lx�; ½1;Ly�;and ½1;Lz�; respectively, and z denotes the verticaldirection along which the network is compressed. Nodeson vertical sides of the network are limited to movewithin their planes. (This condition represents theexpectation that nodes connected to the cortex do notmove away from it under compression.) The z-compo-nents of nodes on the top surface are decreased by e;while those on the bottom surface are unchanged. Theremaining coordinates are the variables in the modelsystem.The unstrained (i.e. e ¼ 0) network is assumed to have
no potential energy. Equilibrium lengths of each strutand equilibrium angles of each bond are computedfrom this configuration. For ea0; the potential energyof the network is a function of the location of thenodes, equilibrium lengths of struts, and equilibriumbond angles. rijk are computed by minimizing thepotential energy using the conjugate gradient method(Press et al., 1988). The force on each strut is the productof the change in its length from equilibrium and the(known) elastic modulus. The stress sðeÞ required tosustain a given strain e on the network is estimated bythe ratio of the sum of vertical forces on the uppersurface and the cross-sectional area. The breaking stresssmaxðnÞ and the fracture strain emaxðnÞ of a network (afraction n of whose struts are removed) are estimated bythe peak value reached by sðeÞ and the correspondingstrain.It should be noted that, whenever elastic elements are
removed due to failure at any stage, equilibrium is re-calculated prior to increasing e:
2.3. Expression for breaking stress
As trabecular elements are removed from porousbone, there will be rare instances with several con-secutive missing links; such ‘‘long’’ fractures have adramatic effect on the ability of bone to transmit loads.For example, trabeculae immediately above and belowthese fractures are unable to carry large forces.Consequently, as trabeculae are removed, a progres-sively smaller fraction of the remaining bone can be usedto propagate an externally applied load. This ineffi-ciency can be expected to persist even when factors likeanisotropy and trabecular thinning are included.Model networks can be used to illustrate these
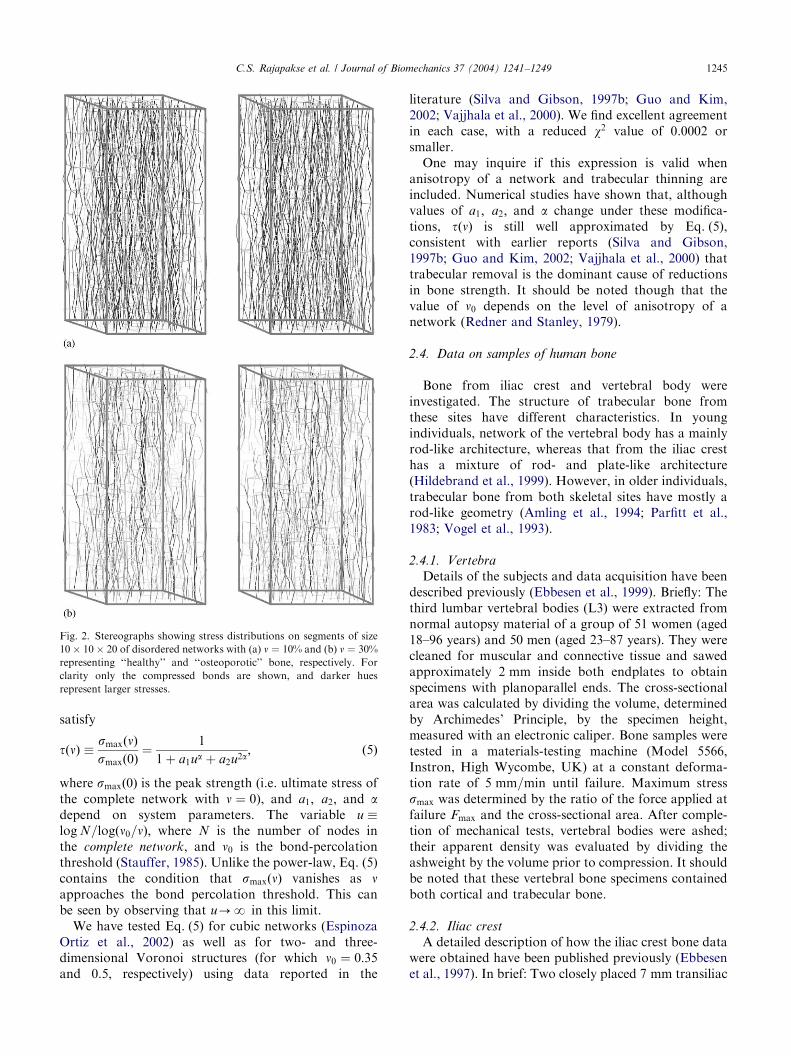
characteristics. We begin with a disordered cubicnetwork of size 20� 20� 30 which is constructed byrandomly displacing nodes of a regular grid of side 10units by up to 1 unit. The stretching and bond-bendingspring constants (k and k) were chosen from uniformdistributions in ½0:5; 1:5� and ½3:0; 7:0�; respectively. Thefracture criteria for struts were defined using a Weibulldistribution with ge ¼ 1:0 and n ¼ 20; while those forbond-angles were defined using a second Weibulldistribution with ge ¼ 1:5 and n ¼ 20: Fig. 2 shows 10�10� 20 segments of two networks formed by removing(a) 10%, and (b) 30% of struts randomly from such anetwork. They are each subjected to a uniform strain ofe ¼ 2:0 in the vertical direction. Fig. 2 shows forces oneach network, darker hues representing struts underhigher stress.A majority of struts in Fig. 2(a) are seen to be active
in transmission of the load. The histogram of axialstresses has a mean 0.091, a standard deviation 0.047,and a peak of 0.208 units. Stress distribution on theweaker network, shown in Fig. 2(b), is qualitativelydifferent; a small fraction of struts carry most of theload, and they lie along a few coherent pathways. Thehistogram of stresses for this case includes a broad tail.The mean, standard deviation and the peak for thedistribution are 0.037, 0.038, and 0.200, respectively.The stress backbone is seen to meander between largefractures (Gunaratne et al., 2002). Since the number ofsuch fractures increases with n; a progressively smallerfraction of struts remaining on the network can be loadcarriers. Consequently, one expects a non-linear rela-tionship between smax and n:In order to derive an expression for smaxðnÞ; a detailed
analysis of the distribution of fracture lengths andweakening of a network due to one such fracture isneeded. Its form has been deduced using a Green’sfunction calculation (Kirkpatric, 1973) on a network ofelectrical elements. Numerical analysis was then used toconfirm that the strength of struts and nodes networksfollow the same form (Espinoza Ortiz et al., 2002). Thebreaking stress of a network (or more precisely, themean value for many such networks) was shown to
ARTICLE IN PRESS
Fig. 2. Stereographs showing stress distributions on segments of size
10� 10� 20 of disordered networks with (a) n ¼ 10% and (b) n ¼ 30%representing ‘‘healthy’’ and ‘‘osteoporotic’’ bone, respectively. For
clarity only the compressed bonds are shown, and darker hues
represent larger stresses.
C.S. Rajapakse et al. / Journal of Biomechanics 37 (2004) 1241–1249 1245
satisfy
tðnÞ smaxðnÞsmaxð0Þ
¼1
1þ a1ua þ a2u2a; ð5Þ
where smaxð0Þ is the peak strength (i.e. ultimate stress ofthe complete network with n ¼ 0), and a1; a2; and adepend on system parameters. The variable u log N=logðn0=nÞ; where N is the number of nodes inthe complete network, and n0 is the bond-percolationthreshold (Stauffer, 1985). Unlike the power-law, Eq. (5)contains the condition that smaxðnÞ vanishes as napproaches the bond percolation threshold. This canbe seen by observing that u-N in this limit.We have tested Eq. (5) for cubic networks (Espinoza
Ortiz et al., 2002) as well as for two- and three-dimensional Voronoi structures (for which n0 ¼ 0:35and 0.5, respectively) using data reported in the
literature (Silva and Gibson, 1997b; Guo and Kim,2002; Vajjhala et al., 2000). We find excellent agreementin each case, with a reduced w2 value of 0.0002 orsmaller.One may inquire if this expression is valid when
anisotropy of a network and trabecular thinning areincluded. Numerical studies have shown that, althoughvalues of a1; a2; and a change under these modifica-tions, tðnÞ is still well approximated by Eq. (5),consistent with earlier reports (Silva and Gibson,1997b; Guo and Kim, 2002; Vajjhala et al., 2000) thattrabecular removal is the dominant cause of reductionsin bone strength. It should be noted though that thevalue of n0 depends on the level of anisotropy of anetwork (Redner and Stanley, 1979).
2.4. Data on samples of human bone
Bone from iliac crest and vertebral body wereinvestigated. The structure of trabecular bone fromthese sites have different characteristics. In youngindividuals, network of the vertebral body has a mainlyrod-like architecture, whereas that from the iliac cresthas a mixture of rod- and plate-like architecture(Hildebrand et al., 1999). However, in older individuals,trabecular bone from both skeletal sites have mostly arod-like geometry (Amling et al., 1994; Parfitt et al.,1983; Vogel et al., 1993).
2.4.1. Vertebra
Details of the subjects and data acquisition have beendescribed previously (Ebbesen et al., 1999). Briefly: Thethird lumbar vertebral bodies (L3) were extracted fromnormal autopsy material of a group of 51 women (aged18–96 years) and 50 men (aged 23–87 years). They werecleaned for muscular and connective tissue and sawedapproximately 2 mm inside both endplates to obtainspecimens with planoparallel ends. The cross-sectionalarea was calculated by dividing the volume, determinedby Archimedes’ Principle, by the specimen height,measured with an electronic caliper. Bone samples weretested in a materials-testing machine (Model 5566,Instron, High Wycombe, UK) at a constant deforma-tion rate of 5 mm=min until failure. Maximum stresssmax was determined by the ratio of the force applied atfailure Fmax and the cross-sectional area. After comple-tion of mechanical tests, vertebral bodies were ashed;their apparent density was evaluated by dividing theashweight by the volume prior to compression. It shouldbe noted that these vertebral bone specimens containedboth cortical and trabecular bone.
2.4.2. Iliac crest
A detailed description of how the iliac crest bone datawere obtained have been published previously (Ebbesenet al., 1997). In brief: Two closely placed 7 mm transiliac
ARTICLE IN PRESS
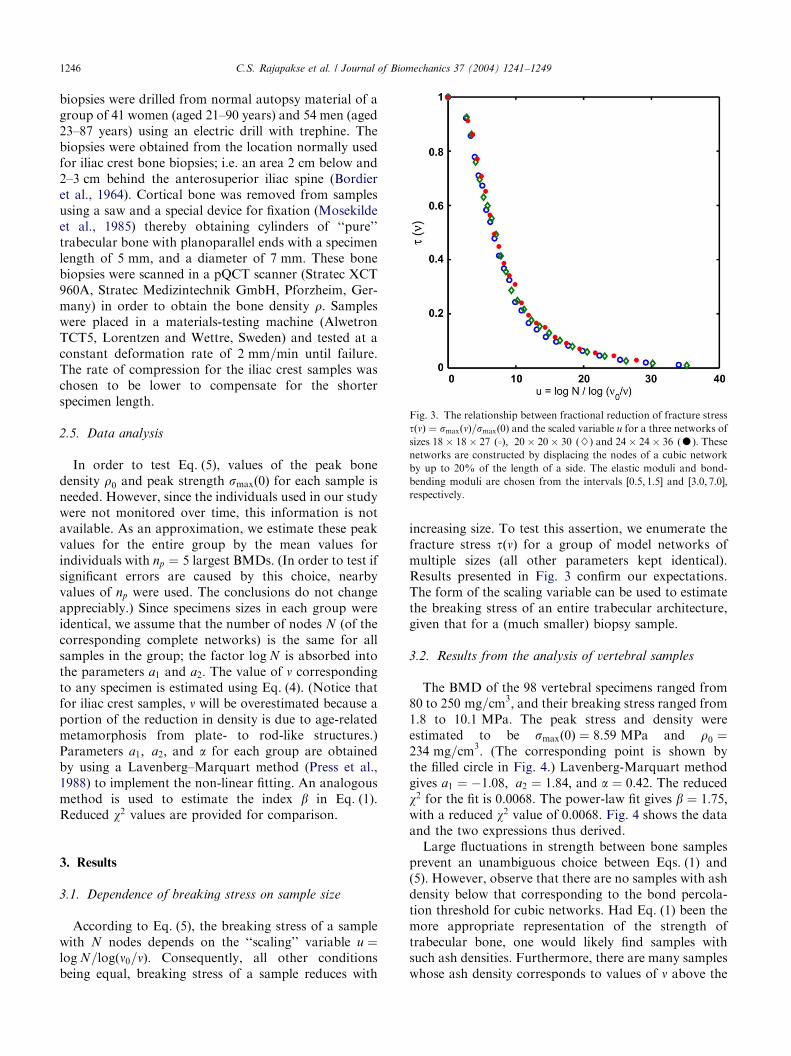
Fig. 3. The relationship between fractional reduction of fracture stress
tðnÞ ¼ smaxðnÞ=smaxð0Þ and the scaled variable u for a three networks of
sizes 18� 18� 27 ð3Þ; 20� 20� 30 ð}Þ and 24� 24� 36 ðKÞ: Thesenetworks are constructed by displacing the nodes of a cubic network
by up to 20% of the length of a side. The elastic moduli and bond-
bending moduli are chosen from the intervals ½0:5; 1:5� and ½3:0; 7:0�;respectively.
C.S. Rajapakse et al. / Journal of Biomechanics 37 (2004) 1241–12491246
biopsies were drilled from normal autopsy material of agroup of 41 women (aged 21–90 years) and 54 men (aged23–87 years) using an electric drill with trephine. Thebiopsies were obtained from the location normally usedfor iliac crest bone biopsies; i.e. an area 2 cm below and2–3 cm behind the anterosuperior iliac spine (Bordieret al., 1964). Cortical bone was removed from samplesusing a saw and a special device for fixation (Mosekildeet al., 1985) thereby obtaining cylinders of ‘‘pure’’trabecular bone with planoparallel ends with a specimenlength of 5 mm; and a diameter of 7 mm: These bonebiopsies were scanned in a pQCT scanner (Stratec XCT960A, Stratec Medizintechnik GmbH, Pforzheim, Ger-many) in order to obtain the bone density r: Sampleswere placed in a materials-testing machine (AlwetronTCT5, Lorentzen and Wettre, Sweden) and tested at aconstant deformation rate of 2 mm=min until failure.The rate of compression for the iliac crest samples waschosen to be lower to compensate for the shorterspecimen length.
2.5. Data analysis
In order to test Eq. (5), values of the peak bonedensity r0 and peak strength smaxð0Þ for each sample isneeded. However, since the individuals used in our studywere not monitored over time, this information is notavailable. As an approximation, we estimate these peakvalues for the entire group by the mean values forindividuals with np ¼ 5 largest BMDs. (In order to test ifsignificant errors are caused by this choice, nearbyvalues of np were used. The conclusions do not changeappreciably.) Since specimens sizes in each group wereidentical, we assume that the number of nodes N (of thecorresponding complete networks) is the same for allsamples in the group; the factor log N is absorbed intothe parameters a1 and a2: The value of n correspondingto any specimen is estimated using Eq. (4). (Notice thatfor iliac crest samples, n will be overestimated because aportion of the reduction in density is due to age-relatedmetamorphosis from plate- to rod-like structures.)Parameters a1; a2; and a for each group are obtainedby using a Lavenberg–Marquart method (Press et al.,1988) to implement the non-linear fitting. An analogousmethod is used to estimate the index b in Eq. (1).Reduced w2 values are provided for comparison.
3. Results
3.1. Dependence of breaking stress on sample size
According to Eq. (5), the breaking stress of a samplewith N nodes depends on the ‘‘scaling’’ variable u ¼log N=logðn0=nÞ: Consequently, all other conditionsbeing equal, breaking stress of a sample reduces with
increasing size. To test this assertion, we enumerate thefracture stress tðnÞ for a group of model networks ofmultiple sizes (all other parameters kept identical).Results presented in Fig. 3 confirm our expectations.The form of the scaling variable can be used to estimatethe breaking stress of an entire trabecular architecture,given that for a (much smaller) biopsy sample.
3.2. Results from the analysis of vertebral samples
The BMD of the 98 vertebral specimens ranged from80 to 250 mg=cm3; and their breaking stress ranged from1.8 to 10:1 MPa: The peak stress and density wereestimated to be smaxð0Þ ¼ 8:59 MPa and r0 ¼234 mg=cm3: (The corresponding point is shown bythe filled circle in Fig. 4.) Lavenberg-Marquart methodgives a1 ¼ �1:08; a2 ¼ 1:84; and a ¼ 0:42: The reducedw2 for the fit is 0.0068. The power-law fit gives b ¼ 1:75;with a reduced w2 value of 0.0068. Fig. 4 shows the dataand the two expressions thus derived.Large fluctuations in strength between bone samples
prevent an unambiguous choice between Eqs. (1) and(5). However, observe that there are no samples with ashdensity below that corresponding to the bond percola-tion threshold for cubic networks. Had Eq. (1) been themore appropriate representation of the strength oftrabecular bone, one would likely find samples withsuch ash densities. Furthermore, there are many sampleswhose ash density corresponds to values of n above the

ARTICLE IN PRESS
Fig. 4. The non-linear fit of the form Eq. (1) shown with a dashed line
and Eq. (5) shown with a solid line for 98 L3 vertebral samples.Fig. 5. The non-linear fit of the form Eq. (1) shown with a dashed line
and Eq. (5) shown with a solid line for 190 iliac crest samples.
C.S. Rajapakse et al. / Journal of Biomechanics 37 (2004) 1241–1249 1247
bond percolation threshold ðn0 ¼ 0:5Þ for Voronoistructures. This observation suggests that disorderedcubic networks are more appropriate to study vertebraltrabecular bone than Voronoi structures.
3.3. Results from the analysis of iliac crest samples
The BMD of the 190 samples of anterior superior iliacspine ranged from 70 to 445 mg=cm3; and their breakingstresses ranged up to 10:0 MPa: The peak values wereestimated to be smaxð0Þ ¼ 421 MPa and r0 ¼9:55 mg=cm3: Lavenberg–Marquart method gives a1 ¼�1:24; a2 ¼ 2:44; and a ¼ 0:49; with a reduced w2 of0.0035. The corresponding analysis using Eq. (1) givesb ¼ 2:65; with a reduced w2 value of 0.0037. Fig. 5 showsthe iliac crest data and expressions (1) and (5).As discussed earlier, the metamorphosis of (iliac crest)
trabecular bone from partially plate- to rod-likegeometry during aging (Amling et al., 1994; Parfittet al., 1983; Vogel et al., 1993) can be expected toprovide an overestimate of the value of n: This is likelythe reason for the presence of bone samples whose ashdensity is below the value which corresponds to thebond percolation threshold.
4. Discussion
Rod-like trabecular bone has a structure reminiscentof disordered cubic networks; however, most architec-tural details are subject and location dependent. In thesearch for diagnostic tools to detect osteoporosis, it is
important to emphasize the fact that a useful measurecannot depend on these patient dependent character-istics of bone; for otherwise, the diagnostic tool will failto provide reliable results for a wide cross section ofindividuals. In other words, properties that would proveuseful as diagnostic tools can only depend on certaingeneric aspects of trabecular bone. This observationprovides a justification for the use of mathematicalmodels.It is important to determine an accurate form for the
relationship between breaking stress and bone densitybecause the latter is one of the simplest and mostroutinely used diagnostics (Faulkner, 2000). The power-law relationships that have been tested in many studies(Bell et al., 1967; Carter and Hayes, 1977; Ebbesen et al.,1997; McBroom et al., 1985; McElhaney et al., 1970;Mosekilde, 1988; Rice et al., 1988) contain one flaw;they cannot represent effects of trabecular removal,which is the dominant cause of reduction in bonestrength (Silva and Gibson, 1997b; Guo and Kim, 2002;Vajjhala et al., 2000). In particular, the fact that anetwork can separate in to multiple segments prior to itsdensity becoming zero is inconsistent with Eq. (1). Inthis paper, we tested the validity of an alternativeexpression for the strength of trabecular bone whoseform was deduced using a mathematical model.Although data from model systems (e.g. disorderedcubic and Voronoi structures) demonstrate that Eq. (1)cannot describe reductions in bone strength, thevariability of breaking stress inherent in multiple bonespecimens prevent an unambiguous choice between

ARTICLE IN PRESSC.S. Rajapakse et al. / Journal of Biomechanics 37 (2004) 1241–12491248
Eqs. (1) and (5). Experiments on extremely weak rod-like bone (where differences between the expressions islargest) can be expected to provide such evidence.Fig. 2 shows that loading of individual trabeculae is
more homogeneous in a well connected network than ina less well connected network. It is also seen that in thelatter case, a relatively few trabeculae, organized alongnearly vertical pathways, carry most of the load. Thisobservation, coupled with the expected resorption ofunloaded trabeculae (Mosekilde, 1990) and compensa-tory hypertropy of highly loaded ones (Henschke andPesch, 1980) may explain the following intriguingmetamorphosis seen in (for example) Fig. 1; With aging,entire vertical columns of cancellous bone disappear,while those that are left behind retain (or even slightlyincrease) their thickness (Mosekilde, 1988; Mosekilde,1989; Thomsen et al., 2002). Note that, although suchpreferential growth of highly stressed regions can beeasily incorporated in our model (Gunaratne et al.,2002), it is not included in the work reported here. Thisomission is not expected to invalidate any of theconclusions.Given two specimens of tabecular bone of different
sizes, the larger one is more likely to contain longfractures. Since the largest fractures determine the loadcarrying capability of a network, the larger specimenscan be expected to experience a higher fractionalreduction of strength. Calculations based on thisassertion were used to propose that fractional reduc-tions in strength of a bone sample will depend only onthe scaling variable u ¼ log N=logðn0=nÞ; supportingevidence for this claim is provided in Fig. 3. Thisobservation provides a method by which the breakingstress of a small (biopsy) sample can be used to deducethat of an entire bone. Note that Eq. (1) cannot be usedfor such a purpose.It has been claimed that the ultimate stress of a bone
smaxðnÞ (in contrast to, say, the BMD) is the measureappropriate to determine the level of osteoporosis(Bolotin and Siev.anen, 2001; Blank, 2001). The follow-ing example suggests that this may require onemodification. Consider vertebral bones from twoindividuals. The first has a slight built and healthybone; the second is heavy but suffers from bone loss. Itcan turn out that the ultimate stress smaxðnÞ for bonefrom the second person is higher; i.e. the measure tojudge the level of osteoporosis is not the ultimate stresssmaxðnÞ; but its fractional reduction from the peak value.We thus infer that the normalized breaking stress t is amore appropriate measure of the need for therapeuticintervention than the ultimate stress itself. This expecta-tion is built in to Eq. (5). Analysis of model systemsshow that this normalization eliminates variations dueto uniform changes in elastic moduli of a network, andreduces fluctuations between nominally identical net-works.
The expression for strength proposed here relates t tothe fraction n of trabecular elements that have beenremoved. Unfortunately, the value of n was not recordedin the data on human bone samples that were used inour analysis. Nor is it possible to access this informationin vivo. In our analysis, we approximated it using thebone density via Eq. (4). This assumption can fail whenthe structure of trabecular bone changes (for example)from plate-like to rod-like geometry during aging. As weindicated, this is possibly the reason why several samplesfrom iliac crest had bone densities below the value whichcorresponds to the bond percolation threshold. Noticealso, that since individuals whose bones were used in ouranalysis were not monitored over time, we did not havethe value of their peak bone density r0: Since it isrequired to estimate n; we approximated r0 by the meanvalue of bone densities of the 5 samples with largestBMD. It can be expected to be a source of additionalerrors.In conclusion: We have proposed a new non-linear
relationship between bone density and strength thatrepresents consequences of trabecular perforations andthe resulting changes in connectivity of the trabeculararchitecture. The expression is shown to model experi-mental biomechanical data from the iliac crest andvertebrae at least as well as a power-law. In addition,changes due to trabecular thinning and anisotropy arealso modeled by the proposed expression.
Acknowledgements
The authors thank Michael Marder and Sid Nagel fortheir suggestions. This work is partially funded bygrants from the National Science Foundation and theOffice of Naval Research (GHG).
References
Amling, M., Grote, H.J., P .osl, M., Hahn, M., Delling, G., 1994.
Polyostotic heterogeneity of the spine in osteoporosis. Quantitative
analysis and three-dimensional morphology. Bone and Mineral 27
(3), 193–208.
Bell, G.H., Dunbar, O., Beck, J.S., Gibb, A., 1967. Variations in
strength of vertebrae with age and their relation to osteoporosis.
Calcified Tissue Research 1 (1), 75–86.
Blank, R.D., 2001. Breaking down bone strength: a perspective of the
future of skeletal genetics. Journal of Bone and Mineral Research
16 (7), 1207–1211.
Bolotin, H.H., Siev.anen, H., 2001. Inaccuracies inherent in dual-
energy X-ray absorptiometry in vivo bone mineral density can
seriously mislead diagnostic/prognostic interpretation of patient-
specific bone fragility. Journal of Bone and Mineral Research 16
(5), 799–805.
Bordier, Ph., Matrajt, H., Miravet, L., Hioco, D., 1964. Mesure
histologique de la masse et de la r!esorption des trav!ees osseuses.
Pathologie-Biologie 12 (23–24), 1238–1243.
ARTICLE IN PRESSC.S. Rajapakse et al. / Journal of Biomechanics 37 (2004) 1241–1249 1249
Carter, D.R., Hayes, W.C., 1977. The compressive behavior of bone as
a two-phase porous structure. Journal of Bone and Joint Surgery:
American Volume 59 (7), 954–962.
Ciarelli, T.E., Fyhrie, D.P., Schaffler, M.B., Goldstein, S.A., 2000.
Variations in three-dimensional cancellous bone architecture of the
proximal femur in female hip fractures and in controls. Journal of
Bone and Mineral Research 15 (1), 32–40.
Ebbesen, E.N., Thomsen, J.S., Mosekilde, Li., 1997. Nondestructive
determination of iliac crest cancellous bone strength by pQCT.
Bone 21 (6), 535–540.
Ebbesen, E.N., Thomsen, J.S., Beck-Nielsen, H., Nepper-Rasmussen,
H.J., Mosekilde, Li., 1999. Lumbar vertebral body compressive
strength evaluated by dual-energy X-ray absorptiometry, quanti-
tative computed tomography, and ashing. Bone 25 (6), 713–724.
Espinoza Ortiz, J.S., Rajapakse, C.S., Gunaratne, G.H., 2002.
Strength reduction in electrical and elastic networks. Physical
Review B 66 (14), 144203.
Faulkner, K.G., 2000. Bone matters: are density increases necessary to
reduce fracture risk? Journal of Bone and Mineral Research 15 (2),
183–187.
Gibson, L.J., 1985. The mechanical behavior of cancellous bone.
Journal of Biomechanics 18 (5), 317–328.
Gibson, L.J., Ashby, M.F., 1982. The mechanics of three-dimensional
cellular materials. Proceedings of the Royal Society of London A
382, 43–59.
Gibson, L.J., Ashby, M.F., 1997. Cellular Solids: Structure and
Properties. Cambridge University Press, Cambridge.
Gunaratne, G.H., Rajapakse, C.S., Bassler, K.E., Mohanty, K.K.,
Wimalawansa, S.J., 2002. A model for bone strength and
osteoporotic fracture. Physical Review Letters 88 (6), 068101.
Guo, X.E., Kim, C.H., 2002. Mechanical consequences of trabecular
bone loss and its treatment: a three-dimensional model simulation.
Bone 30 (2), 404–411.
Harlow, D.G., Phoenix, S.L., 1981. Probability-distributions for the
strength of composite-materials. II: a convergent sequence of tight
bounds. International Journal of Fracture 17 (6), 601–630.
Henschke, F., Pesch, H.-J., 1980. Spongiosastruktur von
lendenwirbelk .orpern und schenkelhals vergleichende analyse des
altersabh.angigen umbaues. Microscopica Acta Supplement 4,
124–128.
Hildebrand, T., Laib, A., M .uller, R., Dequeker, J., R .uegsegger, P.,
1999. Direct three-dimensional morphometric analysis of human
cancellous bone: Microstructural data from spine, femur, iliac
crest, and calcaneus. Journal of Bone and Mineral Research 14 (7),
1167–1174.
Hogan, H.A., Ruhmann, S.P., Sampson, H.W., 2000. The mechanical
properties of cancellous bone in the proximal tibia of ovariecto-
mized rats. Journal of Bone and Mineral Research 15 (2), 284–292.
Jensen, K.S., Mosekilde, Li., Mosekilde, Le., 1990. A model of
vertebral trabecular bone architecture and its mechanical proper-
ties. Bone 11 (6), 417–423.
Keaveny, T.M., Wachtel, E.F., Ford, C.M., Hayes, W.C., 1994.
Differences between the tensile and compressive strengths of bovine
tibial trabecular bone depend on modulus. Journal of Biomecha-
nics 27 (9), 1137–1146.
Kiberstis, P., Smith, O., Norman, C., 2000. Bone health in the balance.
Science 289 (5484), 1497.
Kirkpatric, S., 1973. Percolation and conduction. Reviews of Modern
Physics 45 (4), 574–588.
McBroom, R.J., Hayes, W.C., Edwards, W.T., Goldberg, R.P., White,
A.A. III, 1985. Prediction of vertebral body compressive fracture
using quantitative computed tomography. Journal of Bone and
Joint Surgery: American Volume 67 (8), 1206–1214.
McElhaney, J.H., Fogle, J.L., Melvin, J.W., Haynes, R.R., Roberts,
V.L., Alem, N.M., 1970. Mechanical properties of cranial bone.
Journal of Biomechanics 3 (5), 495–511.
Mosekilde, Li., 1988. Age-related changes in vertebral trabecular
bone Architecture—assessed by a new method. Bone 9 (4),
247–250.
Mosekilde, Li., 1989. Sex differences in age-related loss of vertebral
trabecular bone mass and structure—biomechanical consequences.
Bone 10 (6), 425–432.
Mosekilde, Li., 1990. Consequences of the remodelling process for
vertebral trabecular bone structure: a scanning electron microscopy
study (uncoupling of unloaded structures). Bone and Mineral 10
(1), 13–35.
Mosekilde, Li., Viidik, A., Mosekilde, Le., 1985. Correlation between
the compressive strength of iliac and vertebral trabecular bone in
normal individuals. Bone 6 (5), 291–295.
Mosekilde, Li., Mosekilde, Le., Danielsen, C.C., 1987. Biomechanical
competence of vertebral trabecular bone in relation to ash density
and age in normal individuals. Bone 8 (2), 79–85.
Mosekilde, Li., Ebbesen, E.N., Tornvig, L., Thomsen, J.S., 2000.
Trabecular bone structure and strength—remodeling and
repair. Journal of Musculoskeletal and Neuronal Interactions 1
(1), 25–30.
Norman, T.L., Yeni, Y.N., Brown, C.U., Wang, Z., 1998. Influence of
microdamage on fracture toughness of the human femur and tibia.
Bone 23 (3), 303–306.
Parfitt, A.M., Mathews, C.H.E., Villanueva, A.R., Kleerekoper, M.,
Rao, D.S., 1983. Relationships between surface, volume, and
thickness of iliac trabecular bone in aging and in osteoporosis.
Journal of Clinical Investigation 72 (4), 1396–1409.
Press, W.H., Flannery, B.P., Teukolsky, S.A., Vettering, W.T., 1988.
Numerical Recipes—The Art of Scientific Computing. Cambridge
University Press, Cambridge.
Pugh, J.W., Rose, R.M., Radin, E.L., 1973. Elastic and viscoelastic
properties of trabecular bone: dependence on structure. Journal of
Biomechanics 6 (5), 475–485.
Redner, S., Stanley, H.E., 1979. Anisotropic bond percolation. Journal
of Physics A: Mathematical and General 12 (8), 1267–1283.
Rice, J.C., Cowin, S.C., Bowman, J.A., 1988. On the dependence of the
elasticity and strength of cancellous bone on apparent density.
Journal of Biomechanics 21 (2), 155–168.
Silva, M.J., Gibson, L.J., 1997a. Modeling the mechanical behavior of
vertebral trabecular bone: effects of age-related changes in
microstructure. Bone 21 (2), 191–199.
Silva, M.J., Gibson, L.J., 1997b. The effects of non-periodic
microstructure and defects on the compressive strength of two
dimensional cellular solids. International Journal of Mechanical
Sciences 39 (5), 549–563.
Silva, M.J., Hayes, W.C., Gibson, L.J., 1995. The effects of non-
periodic microstructure on the elastic properties of two-dimen-
sional cellular solids. International Journal of Mechanical Sciences
37 (11), 1161–1177.
Stauffer, D., 1985. Introduction to Percolation Theory. Taylor and
Francis, London.
Thomsen, J.S., Ebbesen, E.N., Mosekilde, Li., 2002. Age-related
differences between thinning of horizontal and vertical trabeculae
in human lumbar bone as assessed by a new computerized method.
Bone 31 (1), 136–142.
Vajjhala, S., Kraynik, A.M., Gibson, L.J., 2000. A cellular solid model
for modulus reduction due to resorption of trabecular bone.
Journal of Biomedical Engineering 122 (5), 511–515.
Vogel, M., Hahn, M., Delling, G., 1993. Relation between 2- and 3-
dimensional architecture of trabecular bone in the human spine.
Bone 14 (3), 199–203.
Weinstein, R.S., 2000. True strength. Journal of Bone and Mineral
Research 15 (4), 621–625.
Yeni, Y.N., Norman, T.L., 2000. Fracture toughness of human
femoral neck: effects of microstructure, composition and age. Bone
26 (5), 499–504.