Embed Size (px)
Citation preview

Louisiana State UniversityLSU Digital Commons
LSU Historical Dissertations and Theses Graduate School
1969
An Exploratory Study on the Role of ProfessionalOccupational Status as an Influence on ProductPerceptions.Morris Edgar MasseyLouisiana State University and Agricultural & Mechanical College
Follow this and additional works at: https://digitalcommons.lsu.edu/gradschool_disstheses
This Dissertation is brought to you for free and open access by the Graduate School at LSU Digital Commons. It has been accepted for inclusion inLSU Historical Dissertations and Theses by an authorized administrator of LSU Digital Commons. For more information, please [email protected].
Recommended CitationMassey, Morris Edgar, "An Exploratory Study on the Role of Professional Occupational Status as an Influence on Product Perceptions."(1969). LSU Historical Dissertations and Theses. 1678.https://digitalcommons.lsu.edu/gradschool_disstheses/1678

This dissertation has been microfilmed exactly as received 70-9078
MASSEY, Morris Edgar, 1939- AN EXPLORATORY STUDY ON THE ROLE OF PROFESSIONAL OCCUPATIONAL STATUS AS AN INFLUENCE ON PRODUCT PERCEPTIONS.
The Louisiana State University and Agricultural and Mechanical College, Ph.D., 1969 Business Administration
University Microfilms, Inc., Ann Arbor, Michigan

AN EXPLORATORY STUDY
ON THE ROLE OF PROFESSIONAL OCCUPATIONAL STATUS
AS AN INFLUENCE ON PRODUCT PERCEPTIONS
A Dissertation
Submitted to the Graduate Faculty of the Louisiana State University and
Agricultural and Mechanical College in partial fulfillment of the requirements for the degree of
Doctor of Philosophy
in
The College of Business Administration
byMorris Edgar Massey
B.B.A., The University of Texas, 1961 M.B.A., The University'of Texas, 1962
August, 1969

ACKNOWLEDGEMENTS
A great many individuals contributed directly and indirectly
to the development of this study. Especially appreciated is the
help of Dr. Bill R. Darden, who provided the initial encouragement
and patiently gave advice and assistance throughout the study. Dr.
Raymond V. Lesikar, chairman of the committee, gave greatly appre
ciated encouragement and expert guidance throughout the doctoral
program, especially during the final phases. Also acknowledged are
the considerations and encouragements of Dr. Gordon Paul, Dr. Francis
Boyer, and Dr. James Reddoch, all valuable members of the committee.
A very special note of appreciation is given to the author's
parents, who provided the unique understanding so necessary for
such an undertaking
To individually acknowledge the many people \dio ultimately aided
in this study is impossible, but to each, and especially to the
faculties and staffs of Louisiana State University and the University
of Colorado, I am sincerely indebted for the assistance and under
standing so generously given.
ii

TABLE OF CONTENTS
Page
ACKNOWLEDGEMENTS....................... ii
LIST OF TA B L E S .................................................... vi
ChapterI. THE NATURE AND SCOPE OF THE S T U D Y .................... 1
Orientation and Need for Analysis of Occupations . . 1Objectives of the S t u d y ............................ 3Statement of H y p o t h e s e s ........................ .. . 4Framework of Methodology............................ 7Limitations in Execution of the S t u d y ............. 9Organization Plan of the Analysis ................11
II. OCCUPATION AND AN INDIVIDUAL'S WAY OF L I F E ............. 14
Occupation as an Effector of Individual Needs . . . 15Social Stratification by Occupation ............... 18Reference Group Impact as Determined by
Occupation............................................24Occupation as a Determinant of R o l e s ..................31Income, Education, and Other Factors Influenced
by O c c u p a t i o n ....................................... 40The Pervasive Influence of Occupation on the
Individual............................................45The Professions: Leaders in Occupational
H i e r a r c h i e s ..........................................45
Definition of Professions .................. 46Distinguishing Characteristics of Professionals . 47Variations in Income Determination ............... 49Relationships with Clients ........................ 50Occupational Distances Between Members of
P r o f e s s i o n s ....................................... 52The Professions as a Test G r o u p ................. 54
III. ANALYSIS OF OCCUPATIONALLY DETERMINED I M A G E S ........... 55
Variations Between Test Groups in OccupationalImage Perception..................................... 55
iii
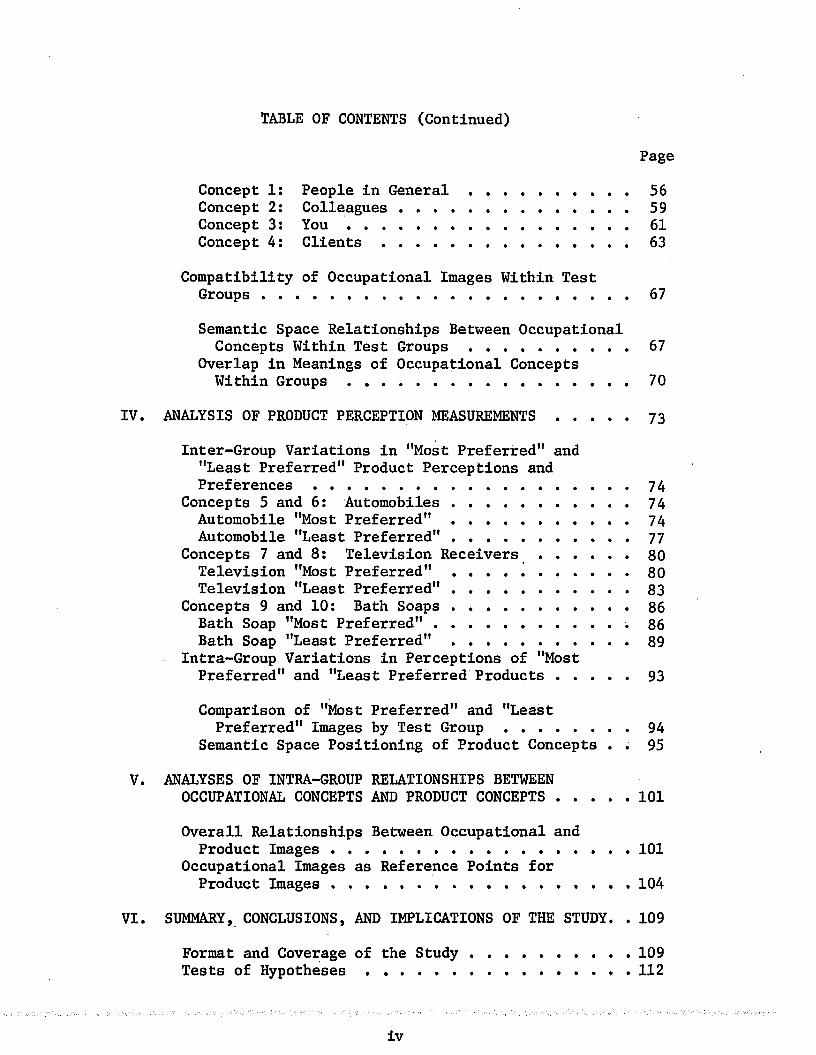
TABLE OF CONTENTS (Continued)
Page
Concept 1: People in G e n e r a l .......................56Concept 2: Colleagues ............................. 59Concept 3: Y o u ...................................... 61Concept 4: C l i e n t s ..................................63
Compatibility of Occupational Images Within TestG r o u p s ................................................ 67
Semantic Space Relationships Between OccupationalConcepts Within Test Groups .................... 67
Overlap in Meanings of Occupational ConceptsWithin Groups ................................... 70
IV. ANALYSIS OF PRODUCT PERCEPTION MEASUREMENTS ......... 73
Inter-Group Variations in "Most Preferred" and "Least Preferred" Product Perceptions andPr e f e r e n c e s ..........................................74
Concepts 5 and 6 : Automobiles........................ 74Automobile "Most Preferred" ...................... 74Automobile "Least Preferred" ...................... 77
Concepts 7 and 8 : Television Receivers ........... 80Television "Most Preferred" ...................... 80Television "Least Preferred" ...................... 83
Concepts 9 and 10: Bath S o a p s ........................ 86Bath Soap "Most Preferred"....................... 86Bath Soap "Least P r e f e r r e d " ........................ 89
Intra-Group Variations in Perceptions of "MostPreferred" and "Least Preferred Products ......... 93
Comparison of "Most Preferred" and "LeastPreferred" Images by Test Group ............... 94
Semantic Space Positioning of Product Concepts . . 95
V. ANALYSES OF INTRA-GROUP RELATIONSHIPS BETWEENOCCUPATIONAL CONCEPTS AND PRODUCT CONCEPTS ......... 101
Overall Relationships Between Occupational andProduct Images ..................................... 101
Occupational Images as Reference Points forProduct Images ....................... . . . . . . . 104
VI. SUMMARY, CONCLUSIONS, AND IMPLICATIONS OF THE STUDY. . 109
Format and Coverage of the S t u d y .....................109Tests of H y p o t h e s e s ..................................112
iv

TABLE OF CONTENTS (Continued)
Page
Hypothesis A .........................................112Hypothesis B .........................................116Hypothesis C .........................................117Hypothesis D .........................................119Hypothesis E .........................................120
Retrospect and P r o j e c t i o n ............................122
BIBLIOGRAPHY......................................................124
APPENDIX A - Methodology........................................128
APPENDIX B - Questionnaire and Related Forms . . . . . . . . . 140
APPENDIX C - Means of Respondent Reactions, Significant Difference Tests of Concepts, Brands of Products "Most Preferred" and "Least P r e f e r r e d " ...................................... 147
V I T A .............................................................. 172
v
LIST OF TABLES
Table Page
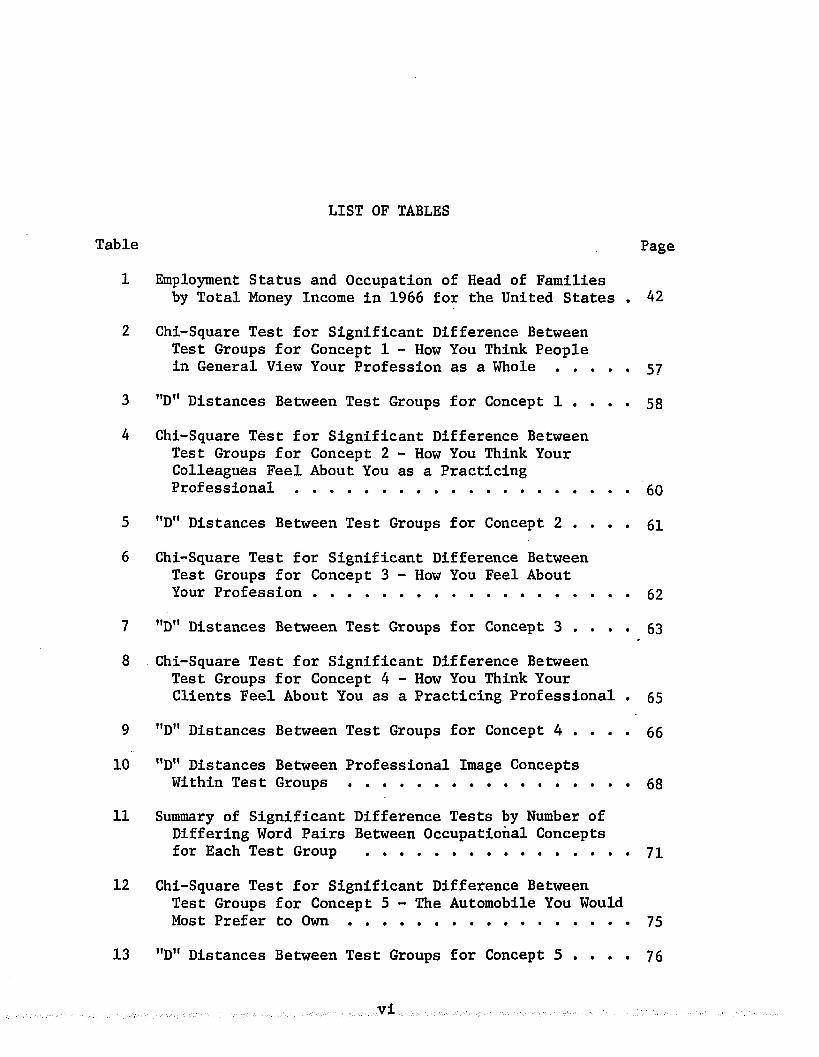
1 Employment Status and Occupation of Head of Familiesby Total Money Income in 1966 for the United States . 42
2 Chi-Square Test for Significant Difference BetweenTest Groups for Concept 1 - How You Think People in General View Your Profession as a W h o l e ........... 57
3 "D" Distances Between Test Groups for Concept 1 . . . . 58
4 Chi-Square Test for Significant Difference BetweenTest Groups for Concept 2 - How You Think YourColleagues Feel About You as a PracticingProfessional ......................................... 60
5 "D" Distances Between Test Groups for Concept 2 . . . . 61
6 Chi-Square Test for Significant Difference BetweenTest Groups for Concept 3 - How You Feel AboutYour Profession......................................... 62
7 "D" Distances Between Test Groups for Concept 3 . . . . 63
8 Chi-Square Test for Significant Difference BetweenTest Groups for Concept 4 - How You Think YourClients Feel About You as a Practicing Professional . 65
9 "D" Distances Between Test Groups for Concept A . . . . 66
10 "D” Distances Between Professional Image ConceptsWithin Test G r o u p s ..................................... 68
11 Summary of Significant Difference Tests by Number ofDiffering Word Pairs Between Occupational Conceptsfor Each Test Group ...................................71
12 Chi-Square Test for Significant Difference BetweenTest Groups for Concept 5 - The Automobile You Would Most Prefer to O w n ..................................... 75
13 "D" Distances Between Test Groups for Concept 5 . . . . 76

LIST OF TABLES (Continued)
Table Page
14 Chi-Square Test for Significant Difference BetweenTest Groups for Concept 6 - The Automobile YouWould Least Prefer to O w n ...............................78
15 "D" Distances Between Test Groups for Concept 6 . . . . 79
16 Chi-Square Test for Significant Difference BetweenTest Groups for Concept 7 - Brand of TelevisionMost P r e f e r r e d .......................................... 82
17 "D" Distances Between Test Groups for Concept 7 . . . . 83
18 Chi-Square Test for Significant Difference BetweenTest Groups for Concept 8 - Brand of TelevisionLeast Preferred.......................................... 84
19 "D" Distances Between Test Groups for Concept 8 . . . . 85
20 Chi-Square Test for Significant Difference BetweenTest Groups for Concept 9 - Brand of Bath SoapMost Preferred ................................... 87
21 "D" Distances Between Test Groups for Concept 9 . . . . 88
22 Chi-Square Test for Significant Difference BetweenTest Groups for Concept 10 - Brand of Bath SoapLeast Preferred................................ 90
23 "D" Distances Between Test Groups for Concept 10 . . . 91
24 Summary of Significant Difference Tests by Number ofDiffering Word Pairs Between Product Concepts forEach Test G r o u p .......................................... 94
25 "D” Distances Between Product Concepts Within TestG r o u p s ...................................................96
26 "D" Distances Between Professionally DeterminedConcepts and Product Concepts for Each Test Group . . 103
27 Rank Ordering by "D" Distance of Product Concepts toProfessionally Determined Concepts .................. 105
28 Mean Responses of Respondents by Concept -Nonprofessionals ...................................... 148
29 Mean Responses of Respondents by Concept -P r o f e s s o r s ............................................. 149
vii

LIST OF TABLES (Continued)
Table Page
30 Mean Responses of Respondents by Concept -Doctors................................................150
31 Mean Responses of Respondents by Concept -Ministers............................................. 151
32 Mean Responses of Respondents by Concept -Accountants............................................. 152
33 Mean Responses of Respondents by Concept -Lawyers................................................153
34 Significant Difference Tests by Word Pairs Between"How People in General View Your Profession" and "How Your Colleagues Feel Al>out You as a Practicing Professional" Cl Against C2 ............. 154
35 Significant Difference Tests by Word Pairs Between"How People in General View Your Profession" and "How You Feel About Your Profession"Cl Against C 3 ...........................................155
36 Significant Difference Tests by Word Pairs Between"How People in General View Your Profession"and "How You Think Your Clients Feel About Youas a Practicing Professional" Cl Against C 4 ...........156
37 Significant Difference Tests by Word Pairs Between"How You Think Your Colleagues Feel About Youas a Practicing Professional" and "How You FeelAbout Your Profession" C2 Against C 3 .................157
38 Significant Difference Tests by Word Pairs Between"How You Think Your Colleagues Feel About You as a Practicing Professional: and "How You Think Your Clients Feel About You as a Practicing Professional" C2 Against C 4 ......................... 158
39 Significant Difference Tests by Word Pairs Between"How You Feel About Your Profession" and "HowYou Think Your Clients Feel About You as aPracticing Professional" C3 Against C4 ............. 159
40 Significant Difference Tests by Word Pairs forNonprofessionals Between "Most Preferred" and"Least Preferred" Product Concepts ................. 160
41 Significant Difference Tests by Word Pairs forProfessors Between "Most Preferred" and "Least Preferred" Product Concepts .......................... 161
viii

LIST OF TABLES (Continued)
Table Page
42 Significant Difference Tests by Word Pairs forDoctors Between "Most Preferred" and "LeastPreferred" Product Concepts.......................... 162
43 Significant Difference Tests by Word Pairs forMinisters Between "Most Preferred" and "Least Preferred" Product Concepts.......................... 163.
44 Significant Difference Tests by Word Pairs forAccountants Between "Most Preferred" and "Least Preferred" Product Concepts.......................... 164
45 Significant Difference Tests by Word Pairs forLawyers Between "Most Preferred" and "LeastPreferred" Product Concepts . ....................... 165
46 Specific Makes of "Automobile Most Preferred to Own"by Test G r o u p s ........................................166
47 Specific Makes of "Automobile Least Preferred to Own"by Test Groups .......... 167
48 Specific Brands of "Television Most Preferred"by Test G r o u p s ........................................168
49 Specific Brands of "Television Least Preferred"by Test G r o u p s ........................................169
50 Specific Brands of "Bath Soap Most Preferred"by Test G r o u p s ........................................170
51 Specific Brands of "Bath Soap Least Preferred"by Test G r o u p s ........................................171
ix
ABSTRACT
Occupation is considered by many social scientists to be a major
behavioral influence on many aspects of an individual’s life. However,
there are no direct relationships established in sociological or
marketing literature pinpointing occupation's direct influence on con-t
sumption behavior, even though the less useful indirect influence is
acknowledged. To explore more direct relationships which might exist
between occupation and consumption, this study focused on seeking
differences in perception among five sub-groups of the occupational
family "professions" in terms of four occupationally-determined per
ceptions and six product perceptions and how these two different types
of perceptions might be related.
The research design measured ten perceptions by the semantic
differential technique through a mail questionnaire sent to a random
sample of Professors, Doctors, Ministers, Accountants, and Lawyers in
Baton Rouge, Louisiana. Data collected from these groups and a control
group of nonprofessionals produced 180 usable returns which were sta
tistically analyzed for significant differences and relationships of
meanings in semantic space.
Systematic analyses of the data revealed several different types
of relationships.
Stratification in terms of attitude variation and stress on

different reference group relationships appeared among the professional
sub-groups. Such variation in sensitivity to reference groups may be
directly related to differing degrees of impact which clients, col
leagues, and the general public have on each group. In considering
reference group influences, the test data showed that specific types
of professions must be designated, not the general class "profession
als."
Each test group perceived four distinctly different occupational
concepts. Perceptions of how clients and colleagues viewed the profes
sional as perceived by the professional were most closely related for
all groups. Perceptions of views by the general public were most
indistinct for all groups. The personal occupational perceptions were
distinct from the three reference group perceptions.
In product perceptions, all groups exhibited high similarity in
perceptions of products "most preferred." However, there were noticeable
significant differences between the groups for products "least prefer
red." These latter negative images appeared to be more distinct than
the positive images, indicating variations in image strengths according
to types of products and within each type according to those liked and
disliked. Within each group, there were highly significant differences
between perceptions of liked and disliked products.
The meanings of the concepts showed clearly defined positioning in
semantic space. In "D" distances, the shortest measures occurred be
tween the cluster of occupational images and product "most preferred"
images. For all groups, the cluster of product "least preferred" images
positioned far away from the other seven images.
xi
Because the occupationally-determined images are closely related
to the positive product images, the former probably act as bench marks
for determining expectations about the latter.
The strongest feelings about products were exhibited in the
negative images, with the intensity of dislike directly proportional
to the amount of commitment of the consumer to the product; i.e., the
strongest negative images emerged for automobiles, followed by tele
vision and bath soap in that order.
Overall, while relationships did exist between occupationally-
determined images and product images, they varied by sub-group and
type of product. Thus, the study concluded that it would be erroneous
for any marketer to use broad occupational families for predicting
consumer behavior, rather the more narrowly defined specific occupation
is necessary.
Given such specific definition and knowledge of images important
to the occupation, then accurate predictions can be made about con
sumer expectations of these groups for different types of products.
xii

CHAPTER I
THE NATURE AND SCOPE OF THE STUDY
Orientation and Need for Analysis of Occupations
In attempting to increase their predictive ability about consumer
behavior, marketers have examined the American public from myriad
angles. Some of the more popular factors studied which seemingly
significantly influence consumers are enumerated by McCarthy and
include: population, geographic location, stage in life cycle, income
(level and distribution), asset or wealth position, education and occu
pation of household head, nationality and race, and working wives.^
Another encyclopedic coverage of relevant consumer influences is given
by Stanton under the categories of population, families (number and
size), age groups, sex, other factors (including education, occupation,2race, national origin, and religion), income, and expenditure patterns.
In addition to the preceeding quantitative analyses, much concern has
been directed toward discovering physiological, psychological, and
1E. Jerome McCarthy, Basic Marketing: A Managerial Approach (3rd
ed.; Homewood, Illinois: Richard D. Irwin, Inc., 1968), pp. 100-128.
^William J. Stanton, Fundamentals of Marketing (2nd ed.; New York:McGraw-Hill Book Company, 1967), pp. 74-98.
1

sociological motivations of consumers. Systematic analyses have been
made of inherent and learned motivations, emotional and rational
thinking patterns, cognition, habits, self-images, group influences
(small groups, social classes, peers, etc), and patronage motivations.
Consequently, many facets of the consumer have been discovered,
but no single factor has emerged and been accepted as the one critical
variable which can provide unique and accurate predictive insights
about consumers. To some extent this situation of dependency upon
knowledge of several variables for understanding single or group con
sumer behavior is likely to continue existing, for each consumer is,
in fact, unique in the type and degree of influences on his consumption
decision-making. Thus, marketing strategists face decision-making
situations aided on the one hand by increasing knowledge and complicated
on the other because the volume and complexity of this knowledge creates
unwieldy sets of information. If a "summary" influence can be isolated
which encompasses several of the already verified critical variables,
then such necessary marketing activities as market segment definition,
product planning, promotional strategy formulation, and channel analysis
might become less complicated.
There appears to be one variable applicable to the significant
3See coverages in Steuart H. Britt, Consumer Behavior and the Behavioral Sciences, (New York: John Wiley and Sons, Inc., 1967),585 pp.; James F. Engle, David T. Kollat, and Roger D. Blackwell, Consumer Behavior (New York: Holt, Rinehart and Winston, Inc., 1968),630 pp.; Harold H. Kassarjian and Thomas S. Robertson, Perspectives in Consumer Behavior (Glenview, Illinois: Scott, Foresman and Company, 1968), 559 pp.; and Chester R. Wasson and David H. McConaughy, Buying Behavior and Marketing Decisions (New York: Appleton - Century- Crofts, 1968), 540 pp.

majority of consumers which has been slighted in importance as a means
for understanding and predicting consumer behavior. The variable is
occupation; and one family of occupations, the professionals, is the
focus of this study. When occupation has been given some attention,
it has been of a generally superficial nature. For example, the two
most widely adopted principles of marketing texts in the United
States each devote only a few sentences to the influence of occupation 4on consumers. This typical scant coverage may belie the significance
of occupation as a broad "summary" influence on consumer behavior.
Objectives of the Study
Although numerous studies and authorities do cite occupation's
role in influencing an individual's thinking and behavior both on and
off the job, an examination of the literature yields a lack of any
study which specifically tries to define occupation's influence on
consumption. Certainly, if the role of occupation is as critical in
determining various types of thinking and behavior as areas of the
literature indicate, specific evidence of relationships relevant to
consumption can provide valuable assistance to marketers seeking a
better understanding of the consumer in order to compete more effectively
in today's complex marketplace. Thus, it is toward this general goal
of providing specific empirical evidence of relationships between
occupation and consumption that this study is directed. More precisely,
the broad objectives are two-fold:
(1) to show that there are significant perceptual differences
4McCarthy, 0£. cit., p. 122. Stanton, 0£. cit., p. 86.

between the sub-groups of an occupation, not just occupations
in general as have been explored in the past, and
(2) to seek occupationally-determined relationships of importance
which are related to perceptions of products and, therefore,
have a relevance to consumption.
Obviously, the relationships in question are extremely complex
and diverse. However, by focusing on (1) a specific type of occupa
tion, (2) limited influences of the occupation, and (3) specific kinds
of products, the study seeks to isolate definite relationships which
are not apparent in previous studies which dealt with more generalized
interactions. Thus, this study explores certain members of a single
occupational family in terms of how selected occupational influences
may be related to their consumption behavior for certain products.
This is a micro level approach which differs from former macro-oriented
studies.
Statement of Hypotheses
Specifically, the study centers on five sub-groups of the occupa
tional family professions, plus a group of nonprofessionals (General
Public) for control. Each group is studied in terms of (1) how they
vary (are fragmentized) in their thinking about themselves vis-a-vis
their own self-conception of their occupation and their conceptions of
how three occupational reference groups perceive them, (2) how they vary
in terms of their perceptions of "most preferred" and "least preferred"
for three different products, and (3) how their perceptions about them
selves as professionals may be related to their perceptions about
products.

The general effort is to attempt to show that each selected pro
fession thinks differently about itself and about how reference groups
feel about it, and that these perceptions are related to perceptions
about products, thus likely influencing respondents' behavior as con
sumers. The following specific hypotheses are formulated to cope
with the complexity of the studied relationships:
A. There are significant differences in perception between each of the studied groups for the following occupationally-determined concepts:
1. How you think people in general (excluding colleagues and clients) view your profession as a whole.
2. How you think your colleagues feel about you as apracticing professional.
3. How you feel about your profession.
4. How you think your clients feel about you as apracticing professional.
B. There are significant differences within each of the studied groups between each of the four concepts in Hypothesis A.
C. There are significant differences in perception between each of the studied groups for the following products:
1. Automobile most preferred to own (not necessarily one owned).
2. Automobile least preferred to own.
3. Brand of television most preferred to own (not necessarilyone owned).
4. Brand of television least preferred to own.
5. Brand of bath soap most preferred to use (not necessarilyone used).
6. Brand of bath soap least preferred to use.
D. There are significant differences within each of the studied groups between "most preferred" and "least preferred" products.
E. The cluster of occupational concepts is more closely related to the cluster of "most preferred" products than it is to the cluster of "least preferred" products.
Hypothesis A is concerned with establishing whether occupational
family sub-groups do differ in their perceptions about how other people
feel about them because of the professional designation and how they
differ themselves in thinking about their respective professions.
Hypothesis B then focuses on anticipated variations present within a
given professional sub-group between the four studied components of
the internalized occupational image. In combination, these hypotheses
can pinpoint unique differences existing both between professional sub
groups and between the nonprofessionals comprising the general public
group.
Variations in perceptions of products by the studied groups is the
next concern. Hypothesis C centers on differences between the groups
in perceiving "most preferred" and "least preferred" items of three
different products. If each sub-group differs in its thinking about
these items, then some common factor unique to each group may offer the
clue to the differences. Hypothesis D, also concentrating on product
perceptions, considers each group internally in terms of variations
between "most preferred" and "least preferred" concepts. Since the
thinking about each of the three products is directed to the extremes
of preference, there should be differences existing unless the product
is perceived neutrally. As before, the combination of the two hypothe
ses can show internal differences between the different studied sub
groups in terms of product perception and show that this variation
exists for at least three different products on both the preferred and

not preferred levels.
Hypothesis E explores the relationships of the occupational per
ceptions and the product perceptions. If the occupational percep
tions are closely related to the "most preferred" product perceptions
and distantly related to the "least preferred", then the perceptual
meanings of these concepts may have common elements of meaning. Since
reactions to the occupational influences (general public, clients,
colleagues, and self) are critical to the professional member if he
wishes to maintain his position within the profession, then the
critical perceptions of these influences may be one of the causal
influences on the "most preferred" perceptions and reflected in con
sumption activities. In effect, the significance of perceptions which
are uniquely occupationally determined may influence perceptions of
products, or influence consumption in some other way. If the relation
ship holds, then marketers can improve their predictive ability about
consumer behavior based upon the differential clues provided by
occupational identification.
Framework of Methodology
Indications of occupation’s broad impact on individuals come from
numerous secondary sources, primarily in marketing and sociology litera
ture. This information forms the foundation for the background of the
study in Chapter II. The remainder of the study is based upon presenta
tion and interpretation of primary data generated specifically to
isolate possible relationships between professional occupational status
and selected product perceptions.
Basically, the research design measured ten different conceptual
meanings held by six different test groups. The concepts were selected
to provide insights into meanings held by the respondents, specifically
four different occupationally-determined perceptions and six different
product perceptions. The occupational meanings were related to (1) the
individual's own perception of his profession and (2) the perceptions of
the individual as he felt other people viewed him in his occupational
role (general public, clients, and colleagues). The product images cov
ered variations in terms of the commitment of the respondent/consumer to
the particular product type. Three different products were selected to
measure three different levels of commitment: automobile (high commit
ment) , television (medium commitment), and bath soap (low commitment).
For each of these three products, two different perceptions were measured
"most preferred" and "least preferred."
The six different test groups represented a breakdown of an occupa
tional family (professions) into five distinct components (Professors,
Doctors, Ministers, Accountants, and Lawyers) plus a control group of
other occupations (any occupation which was not a profession in the
standard classification systems).
Any relationships between the measured concepts both between and
within the test groups emerged in systematic comparisons of the concepts.
Relationships were presented in terms of significant difference tests
between the mean responses of the test groups and through the calcula
tion of "D" statistics to measure the relative positioning of the mean
ings in semantic space.
After establishing the limits of the study in terms of relevant
perceptions and test groups, measurements were made of the ten
meanings as held by the six test groups through the mail questionnaire
administration of semantic differential instruments. The complete
explanation of the mechanics of the study, including the semantic
differential technique, concept selection, pilot testing, questionnaire
design, physical implementation, followup, statistical methodology, and
definitions appears in Appendix A. Examples of all forms used are
found in Appendix B.
Limitations in Execution of the Study
As with any study of this type, there are several significant
limitations. Further, in the particular case of this study, its highly
exploratory nature creates additional problems. In broad terms, these
limitations are of two types, conceptual and methodological.
Conceptually, the definitional approach used in dealing with
occupational influences per se is unique. There are obviously numerous
perceptions which are determined by occupation, so selecting just four
to represent occupation's influence on the individual was to limit,
for purposes of handling variables in this test, the total occupational
impact. However, the particular concepts measured, which are occupa
tionally determined, do cover three parts of occupational perceptions:
a broad reference group (general public), two reference groups closely
associated with occupation (colleagues and clients), and an important
perception of how the individual relates himself to his occupation.
Thus, while other occupationally determined perceptions could have been
measured, the scope of those used insures obtaining a general measure
of such perceptions.
Another conceptual problem arises in the possibly artificial

10
definition of the occupational family "professions." While this desig
nation is an appropriate segment of all the classification schemes
found for occupations in general, there is some question as to whether
all of the "professional" respondents actually would define themselves
as professionals, or even whether the "nonprofessionals" as defined in
the study would possibly include themselves in some "profession." Thus,
the semantic blurring of the word "profession" with "occupation" may
render such designations useless. Further, the some twenty thousand
different occupations in the United States would make an analysis of
the differences between them so complicated, that it would be easier
to use other, more traditional, means for trying to understand consum
ers, thereby defeating the attempt to place great importance on occupa
tion as a key to predicting consumer reactions and characteristics.
Finally, the number of products was limited to three final consumer
goods, thus restricting any conclusions to a very'general nature.
Even though two of the products are shopping goods and one is a conven
ience good, there should be a greater range of products to thoroughly
test variations caused by differing consumer reactions by product types.
In terms of methodological limitations, the use of the semantic
differential creates problems in the data generated. While the format
of the instrument is very standardized and the validity and reliability
of the results have been well researched, the actual administration of
the forms through a mail questionnaire raises some questions. Since
the instrument was not familiar to many respondents, many of them prob
ably "toyed" with the instrument trying to figure it out, even though
the instructions warned against this. Also, the length of the study

(ten concepts to evaluate) probably created some exhaustion in the
respondents. Nevertheless, thirty usable returns were received for
each test group, giving a response rate of slightly below fifty per
cent.
The selection of respondents was drawn entirely within the Baton
Rouge Metropolitan Area, making the results applicable only to this
particular geographic area. However, for the test groups designated
as "professionals," representation of the local universe was good
because the overall total population in each classification was rela
tively small. Still, results would have been improved significantly
for generalizing if other geographic regions had been included for
cross comparisons. However, time and funds available restricted the
study to the given area.
Even with all the above limitations, the study as it is defined
represents a valid exploratory effort within its scope and execution.
Organization Plan of the Analysis
The study aims toward establishing whether professional occupa
tional status acts as an influencial factor in determining product per
ceptions. As a first step, secondary sources in marketing and sociology
are reviewed in Chapter II to determine what other researchers have
established about occupation's general impact on individuals. Although
this background on how occupation affects an individual is broad in
perspective, it does serve to establish that occupation serves as a
key for understanding many aspects of human behavior, including con
sumption. With the justification laid out for using occupation as a
predictive device for many factors which influence consumer behavior in

12
general, the study shifts to analysis of primary data generated to seek
more specific relationships between occupation and consumption.
Such relationships are built in the second phase of this study,
which systematically considers occupationally determined perceptions,
product determined perceptions, and the interrelationships between the
two for the test groups. Chapter III approaches the four occupation
ally determined perceptions in two segments: first, similarities and
differences in perceptions between the test groups for the four con
cepts are distinguished; and second, similarities and differences be
tween the concepts within the groups are considered. From such analyses
determination can be made as to whether occupationally determined per
ceptions can be used to define the test groups as being differently
oriented because of their occupation. After variations in the occupa
tion are covered, the concern moves to the product perceptions of the
test groups.
Product perceptions are explored in Chapter IV, following the
same general pattern used for the occupational perceptions. First,
potential differences between the test groups for six product images
("most preferred" and "least preferred" for three products) are sought,
with the specific brands designated for each product also examined.
These are followed by internal "within" group comparisons between the
"most preferred" and "least preferred" images of each product.
Then, having established what, meanings (perceptions) are held by
the test group respondents, the meanings for all ten (occupational and
products) of the measured perceptions are inter-related in Chapter V
to determine whether any specific relationships exist between the
occupational concepts and the product concepts and how the former
might influence the latter.
The final segment of this study, Chapter VI, uses summaries of
the information from the preceding three major sections to test the
hypotheses advanced earlier and to formulate a final conclusion as to
how occupation, as studied here, influences product perceptions of
the test groups. Other implications of the study results are noted
in this final section, along with some questions for future studies
and other generalizations.
CHAPTER II
OCCUPATION AND AN INDIVIDUAL'S WAY OF LIFE
In Middletown, the Lynds signaled the importance of occupation
by characterizing it as the "most nearly dominant single influence
in a man's life."'*' Certainly, on the basis of actual time spent in
some activity, work and work-related activities consume a major part
of each adult's day. For the majority of consumers, occupation not
only determines how actual time is to be spent, but also becomes the
critical determinant of, among many things, who one associates with,
how much money one makes, where one lives, class membership, social
contacts, what one is looking for and can achieve in terms of satis
factions, and even how one's marriage partner is selected.
Thus, occupation exerts influence on an individual physically,
financially, socially, and psychologically. It is a pervasive influ
ence on a significant number of the factors which have been isolated
as determinants of consumer behavior (needs, status, reference groups,
roles, income, and education). Therefore, occupation seemingly emerges
as a single variable which can provide a whole series of informational
clues relevant in influencing consumer behavior.
^Donald E. Super, The Psychology of Careers (New York: Harperand Brothers, 1957), pp. 17-36.
14

Occupation as an Effector of Individual Needs
One influence of occupation on the individual is related to the
overall problem of need satisfaction. Using A. H. Maslow's scheme
for systematically viewing human needs, the impact of occupation on2an individual's behavior becomes clear.
Maslow developed a system for arranging basic human needs in a3hierarchy of prepotency. The framework includes eight levels of
basic needs:
1. Physiological— innate, biological, related to physical functioning of the body, continuance of life. Food, water, rest, activity, air, etc.
2. Safety— related to need for security, safety from bodily harm, dislike of strange stimuli, preference for organized and moderately routinized world.
3. Belongingness and love— a place in one's own group and affectionate relations with other people.
4. Esteem— self-respect and self-esteem and the respect and esteem of others.
5. Information— curiosity, need to know and have explained, especially when related to lower level needs such as safety.
6. Understanding— seek an explanation of selves and others around self.
7. Beauty— seeking of pleasant perceptual experiences, culturally oriented.
8 . Self-actualization— a full realization of one's potential resources. All that man can be he must be in order to be happy.
2Anne Roe, The Psychology of Occupations (New York: John Wileyand Sons, Inc., 1956), pp. 32-39.
3A. H. Maslow, Motivation and Personality (New York: Harper andBrothers, 1954), 411 pp.

16
According to Roe, "...there is no single situation which is
potentially so capable of giving some satisfaction at all levels of
basic needs as is the occupation."^
The first level of needs, physiological, are satisfied directly
through the occupation which provides money that can be exchanged for
items which allay hunger, thirst, etc. The same holds true for the
second level, safety needs, in purchasing shelter and clothes, sani
tary techniques and medical care to prevent incidence and severity of
disease, and other long range safety requirements (insurance, pension
plans). Several studies indicate that jobs are often chosen on the
basis of security potential rather than immediate compensation."*
Third level belongingness and love needs are also satisfied in
part by the occupation; and again, the occupation provides financial
means for securing products which promote such feelings.
The need for esteem of self and from others relates directly to
occupation provided satisfactions. Having a job in itself provides
esteem in the United States culture. Economic and social status depend
significantly on occupation in the United States culture. Such depend
ency is reflected in ratings of the prestige of occupations and in the
studies of job satisfaction. Levels of freedom and responsibility are
more critical to these evaluations than are the levels of skills or
salaries.
4Roe, op. cit., p . 31.
R. Centers, "Motivational Aspects of Occupational Stratification," Journal of Social Psychology, (1948), pp. 187-217.

17
The remaining levels of needs are not so closely related to
occupations; however, even these levels, especially the last one
(self-actualization) are influenced by one's occupation.
Further evidence of the relationship between motivational phen
omena vis-a-vis a hierarchy of needs and occupational influences on
the needs has been shown by Centers. He worked on the hypothesis
that "...men's satisfactions, desires, aspiration, and goals are
strongly conditioned or determined by their present roles, statuses,
and levels of achievement as these are manifested in their placementg
in diverse occupational strata." On the basis of an occupational
cross section of 1,100 white adult males, part of Centers' conclusions
stated:
Persons in the lower socio-economic levels manifest a safety or security need much more frequently than do people in higher socio-economic positions, we might assume, because these latter have already in considerable numbers satisfied this need, whereas the former have not.With the security need satisfied, other and higher needs take its place, and so we find people in the upper occupational strata manifesting desires for self-expression, esteem, leadership, and interesting experience more often than we find such manifestations among the lower occupational groups.^
Occupations emerge as an important source of need satisfaction
in the United States, for both the values in the occupation per se
gRoe, 0£. cit., pp. 34-35.
^Centers, loc. cit.gCenters as quoted by Roe, op. cit., p. 35.
^Ibid., p. 39.

and the bearing which the occupation has on other aspects of the
individual’s life. It may be that occupations have become so impor
tant in the culture just because so many needs are so well satisfied
by them. Yet, whether the relation is casual or not, and if so,
which is the cause and which is the effect, is of no real concern.
The actual arrangement is probably a feedback system anyway. What
is important is the reality of the relationship's existence and its
value to the individual.^ Further, knowledge of such relationships
can provide salient consumer knowledge to marketers in terms of pre
dicting purchases and understanding the forces behind the purchase
decision.
Social Stratification by Occupation
Marketing men have come to realize that concepts of social strati
fication are important in better understanding consumer behavior.
There are two different, but very closely related, sociological con
cepts involved in an assessment of social stratification— social
status and social class. The technical differences between the two
concepts are delineated by Centers who states:
Stratification is something objective; it derives... primarily from the economic system... The process of earning a living imposes upon people certain functions, statuses, and roles...social and economic groupings and categories of people distinguished on the basis of occupation, power, income, standard of living, education, function, intelligence or other criteria are easily and properly denoted by the terms stratum and strata.
10Ibid., p. 33.
19But these strata, as some have seen, are not necessarily classes. Classes are psycho-social groupings, something that is essentially subjective in character, dependent upon the class consciousness (i.e., a feeling of group membership), and class lines of cleavage may or may not conform to what seem to scientists to be logical lines of cleavage in the objective or stratification sense.H
The distinction between status and class, while relevant to
sociologists, has not been defined precisely by marketing men because
of the realistic overlapping of the two concepts. Thus, for purposes
of explanation of consumer behavior, the concern is with the existence
of social stratification, which involves, in most cases, simultaneous
consideration of the two concepts, thereby merging them into one
system of overlapping strata. This synthesis of concepts is reflected
in marketing literature.
Pierre Martineau considers the interrelatedness of status and
social class in his discussion of The Chicago Tribune studies which
confirmed the existence of a social class system in the Chicago metro- 12politan area. Likewise, Stanton, using the Warner studies and
Martineau's verification of them, considers the impact of a social13class system on consumer behavior. Both treatments lean heavily on
the Warner studies as the explanation of social class determination.
Warner and his associates ultimately developed an "index of Status
Characteristics" for the measurement of social status based on a
Centers, The Psychology of Social Classes (Princeton, New Jersey: Princeton University Press, 1949).
12Pierre Martineau, "Social Classes and Spending Behavior," Journal of Marketing, Vol. 23, (October, 1958) pp. 121-130.
13William Stanton, Fundamentals of Marketing (New York: McGraw-Hill Book Company, 1967), 2nd Edition, pp. 110-114.
combination of ratings of occupations, source of income, house type,
and dwelling area. This objective index proved to have high correla
tion with the Warner group's original, subjective "Evaluative Partici
pation" rating system. This initial system used local "judges" who
took into account such factors as the people with whom the person
being rated usually associated, the part of town he lived in, and
the person's reputation in the community. A further criterion was
the status of the individual rated when compared with another, i.e.,
judgments were made of superiority, equality, and inferiority in
status. Warner concluded that occupation correlated highly (r = .91)
with evaluated participation, so highly that occupation seems accur
ately to place one socially as well as by any more complex combination
of indices.^
Moore agrees after a review of the work in this area and classi
fies the criteria of status as wealth and income, level and type of
living, common interests, and social affiliations. Each of these, he
notes, are combined in a high degree in occupation. Thus, with such
high correlations between occupation and the other criteria, occupa
tion seems logical as the most commonly used index of social status.^
Realistically, if a single criterion is used for placing an indi
vidual in a stratification system, then a comparison of such systems
of ranking does not agree completely. For example, ranked according
to average income, deceptively simple lists result. Top incomes accrue
Super, o£. cit., p. 20.
15W. E. Moore, as quoted by Super, Industrial Relations and the Social Order (New York: Macmillan and Company, 1947), pp. 19-20,pp. 575-576.

21
to large business owners and fee-charging professionals, followed by
engineers, other salaried professionals (ministers and teachers),
minor government officials, major salesmen and so on down to the lowest
levels of manual labor. However, this ranking scheme is inadequate
because some engineers earn more than physicians, some salesmen more
than engineers, etc. Thus, these two indices of status, wealth and
occupation, do not agree completely.
Other criteria of stratification show equally conflicting rankings.
Professors have more education and independence, but less pay than
executives. On the other hand, office workers have more education and
prestige than skilled workers, but less pay. Thus, the conclusion is
that American society is composed of a number of different strata. Such
levels are not all horizontal or parallel to each other. The result is
that most persons belong to several different social strata, play several
different social roles, and whether or not an individual appears as a
high, medium, or low status person depends on the particular system of
stratification (occupational, religious, or cultural; wealth, common
interests, or style of living) being used. Thus, strata are multiple16and confused in reality.
However, even with disagreement between stratification by differ
ent criteria, occupation per se still emerges as a generally good index
of status and class. Super concludes that "in a fluid, industrial
society occupation is the principal determinant of social status. The
work a man does tells more about him that is significant in this culture
16Super, op. cit., pp. 21-23.
2217than any other single item of information."
In this same vein, and of particular relevance to this study,
Hatt and others conclude that from the standpoint of sheer scientific
parsimony, occupation serves as an index of stratification sufficiently18accurate for most practical purposes.
A widely used occupational stratification system which classifies
on a socio-economic basis was developed by Alba Edwards for use by the
Bureau of Census, With a minimum of rearrangement, the categories of
the Edward’s census classification can be divided into six hierarchical
groups, each constituting a "social-economic class."
1. Unskilled workersa. Farm laborersb,c. Laborers, except farm d. Servant classes
2. Semiskilled workers3. Skilled workers and foreman4. Clerks and kindred workers5. Proprietors, managers, and officials
a. Farmers (owners and tenants)b. Wholesale and retail dealersc. Other proprietors, managers, and officials
6 . Professional persons^
Edwards describes these groups in the following terms:
It is evident that each of these groups represents not only a major segment of the Nation's labor force, but also, a large population group with a somewhat distinct standard of life, economically and, to a considerable extent, intellectually and socially. In some measure, also, each group has characteristic interests and convictions as to numerous public, questions— social, economic, and political. Each of
17Ibid., p. 17.
18Paul K. Hatt, "Class and Ethnic Attitudes," American Sociological Review, (Feb., 1948), pp. 36-43.
19Theodore, Caplow, The Sociology of Work (New York: McGraw-HillBook Company, 1954), p. 33.

23
them is thus a really distinct and highly significant social-economic group.^0
Other systems of ranking offer differing hierarchies of status
because of certain assumptions (education, self-employment, personal
service, etc.) made in developing each system. However, Hatt con
cluded that while the full series of occupations does not scale con-21sistently on any of the scales, there are subgroupings which do scale.
Thus, while there may be disagreement as to whether a public official
ranks higher in status than a medical doctor because the occupations
have differing requirements and characteristics, there is general
agreement of ranking within the two distinct and definable subgroups
of only public officials and only medical personnel. In Hatt’s analy
sis there are eight occupational families (political, professional,
business, recreation and aesthetics, agriculture, manual work, military,
and service), each of which includes only jobs and occupations which22can be compared consistently by most people. Thus, between signifi
cantly different occupations there is probably, at best, only very
general agreement as to status rankings, but within occupational famil
ies there are distinct hierarchies of status.
Even though status stratification by occupation is not exact, it
20Alba Edwards, Comparative Occupational Statistics for the United States, 1870-1940, (Washington, D.C.: Government Printing Office,1943), p. 179.
21Paul K. Hatt, as quoted by Caplow, "Occupation and Social Stratifications, American Journal of Sociology, (May, 1950), Vol. 55, pp. 56-57.
22Caplow, op. cit., p. 57.

is still the most commonly used social class indice in contemporary
industrial society. Occupational indices are useful because nearly all
of the relatively full-time functionally significant social roles that
are the criteria of social evaluation are defined as "jobs," that is,23as positions in a single occupational sphere. As each individual
operates within a definable occupational sphere, then his particular
social status may be determined. This status is an important influ
ence on consumption behavior.
Reference Group Impact as Determined by Occupation
A reference group is "any group with which an individual identi
fies himself such that he tends to use the group as a standard for
self-evaluation and as a source of his personal values and goals. The
reference groups of an individual may include both membership groups24and groups to which he aspires to belong." An occupation places
each individual within identifiable reference groups (colleagues, co
workers, teams, staffs, etc.). Each reference group has its own set
of norms or standards of behavior to which individuals must comply
within certain boundaries according to the particular circumstances.
"On the job" behavior is often specifically defined by the participating
members of the occupational group, and "off the job" behavior is like
wise frequently significantly influenced by the occupationally set norms
of behavior. Thus, the influence of an occupation extends beyond the
23Bernard Barber, Social Stratification (New York: Harcourt, Brace,and Company, 1957), p. 171.
24David Krech, Richard S. Crutchfield, and Egerton Ballachey, Individual in Society (New York: McGraw-Hill Book Company, 1962), p.102.

25
"work day" into practically every aspect of existence. Such influence,
however, is not constant with all occupations. Laumann found that
occupational groups do tend to cluster together (and thus act as strong
reference groups), but that it is at the extremes of the occupational
prestige hierarchy that the more distinct, crystallized groupings occur,
with a more fluid type interaction possible within the middle levels of
the hierarchy. Further, occupational prestige appears to be the major
determinant of an individual's subjective social preferences (desires
to associate with) and comparable social status is the main factor in
determining with whom he actually engages in a variety of social rela- 25tionships. These findings suggest that (1) occupations determine an
individual's aspirations in terms of associating with reference groups,
and (2) actually define reference group membership, although in stronger
terms for some occupations than others.
The few thorough studies of occupational milieus which extend to
family and social participation are rich in insights of occupation's
impact on the individual's life. This influence is composed of (1)
customs and folkways which arise out of the nature of the occupation,
or out of the behavior patterns of the occupational group, and (2) out
of the standards of conduct which are enforced because of the real or
anticipated effects which their violation would have on the performance 26of the job. Both types of influence hinge on reference group origin
ated and maintained norms.
25Edward 0. Laumann, Prestige and Association in an Urban Community (New York: The Bobbs-Merrill Company, 1966), pp. 140-143.
26Caplow, o£. cit., p. 124.

26The professions, at the top of the occupational hierarchy, exhibit
strong influences on the group members, with some variation due to the
size of the community. In metropolitan areas there are enough members
of each profession to form a closed community, thus allowing each group
to have its own standards. In smaller communities, the entire profes-27sional population tends to act as the reference group. The impact of
these groups on behavior of their members is delineated by Thomas28Caplow in The Sociology of Work. According to him, norms for profes
sional groups typically include the following elements:
1. Standards of consumption, including appropriate expenditures for housing, house furnishings, clothing, and automobiles; appropriate sports and patterns of recreation, institutional memberships, and civic participation.
2. Rough adherence to the financial folkways, which allow a considerable margin for tax evasion and slow payment of bills, but prohibit fraud and the receipt of earned income from unprofessional activities.
3. Adherence to the family mores which prohibit polygamy, open concubinage, miscegenation, nonsupport, cruelty to children, and neglect.
4. Standards of dress, including the specification of a special costume for certain functions (i.e., the white coat) and of the general costume of respectability in most others.
5. Standards of decorum, including dignified carriage, inconspicuous table manners, a degree of aloofness, and avoid- ^ ance of violent language and of public daytime intoxication.
27t Loc. cit.
Caplow defines four basic occupational groups: factory worker,professionals, shop keepers, and crafts. The following section of the text leans heavily on his analyses of these groups. (Chapter 6, The Sociology of Work.)
29Ibid., p. 125.

27
The degree to which such a system as the above may go in terms
of detailing behavior varies considerably according to the particular
local environment. In some cases the rules become very specific: the
choice of children's school, the selection of neckties, total abstin
ence or obligatory hard drinking, residence in a particular neighbor
hood, or the expression in a specific form of approved political
opinions.
Generally, the professions maintain tight reins over their members
in order to assure the maintenance of esteem for the group within the
total social context. Consequently, the elders of the group tend to
enforce the group norms on younger members more stringently than
enforcement of group norms found in other occupational families.
Like the professions, the craft occupational families exert
influence over the reference group members, but in differing ways.
Standards of consumption are important, but typically are not as
elaborate or detailed. Importance is attached to the possession of
property, but not to its conspicuous display. Home ownership carries
high symbolic value, as does the possession of late model automobiles,
heavy appliances (refrigerators, television sets, automatic washing
machines), real property, and life insurance. Conspicuous consumption—
for food and/or entertainment— is likely to be frowned upon because of
its interference with the orderly accumulation of property.
Similarily, conformity to conventional family mores is strongly
influenced, yet sexual activities and attitudes which do not have a
direct influence upon status generally are excluded from the reference
group's scope of control. Generally, whatever behavior is strongly
28
encouraged by the group— religious participation, union allegiance, or
financial reliability— is carefully designed, in each local setting,
to confirm the middle-class status of the craftsmen.
Generally, the folkways of the crafts tend to minimize variations
in social status, with the standards of individual conduct which define
responsibility being highly personal. The craft organization strives
to guarantee competence and standardized output. Thus, the uncontrolled
area of behavior lies with the personal relationships encountered on
the job. The craftsman is measured in terms of his habits and personal
ity. Disapproved characteristics are those which interfere with the
smooth functioning of the working group. Seemingly, the rules of behav
ior which are applied are extensions of the tacit rules encountered in
the "normal" family. Consequently, the environment of the crafts may
be less disorganizing than almost any other occupational family.
The "factory trade" occupational families exhibit a weakness of
control of extra-vocational behavior which is characteristic of all
mobile occupations. Outside the gates of the workplace, the occupa
tional group is an abstraction which exerts far less influence than
such factors as the family, locality, religious, ethnic and congenial
ity groups in which the worker is involved. All the mechanisms which
influence more highly organized occupational families seem to be pre
sent, but they are modified by the limitation of social rewards. Fac
tory workers must function under more limited credit privileges than
higher economic groups, thus restricting even more a secure economic
status. Thus, consumption is tailored to the possibilities— clothing
rather than housing, the automobile rather than the insurance policy

29
are the effective symbols of achievement.
As with consumption, personal qualities are rather narrowly
defined by the occupational reference group for the semiskilled
worker. "Reliability" is the summation of generally acknowledged
desirable traits. Thus, of relevance to the working situation are
the characteristics of punctuality, regular attendance, immobility,
attention, and abstinence from heavy drinking. The norms for this
group show considerably less complexity and coverage than among other
levels of occupational families.
For the independent entrepreneur (shopkeeper), the control of non-
occupational behavior is conditioned by three factors: the lack of
strong organizations within the occupation; the strong identification
with the role of businessman; and, the fact that personal characteris
tics and style of living affect the business.
The separation of residence and shop, which is relatively recent
and is more complete in the United States than in any other country,
influences the freedom of the shopkeeper in achieving higher status.
His aspirations toward the role of businessman have long impelled him
toward this, but close association with his customers traditionally
acted as a restraint. On one hand, he wanted the appropriate style
of living and participation in business-class associations; on the
other, the concealment of this status was necessary during the working
day— the customers could not be antagonized by displays of high status
attributes. When a retail business reached a point of obvious pros
perity, the owner typically retreated into anonymity, no longer wishing
to be identified with his customers. Assistance in this removal is
30
gained through incorporation, which divorces the behavior of the busi
ness from that of the owner. Overall, independent businessmen have
the potential of achieving the highest degree of freedom from refer
ence group influence of any occupational family, if they can, in fact,
divorce themselves from the business.
In summary, the impact of occupational reference groups varies
considerably according to the particular attributes of the given
occupation. For some, such as the professionals, there is a high
degree of control, either within the particular profession or within
the entire professional community of the area. In the case of other
occupational families (independent entrepreneurs), the reference group
of the occupation per se exerts little specific influence; rather, it
is other social groups (ethnic, religious, aspiration groups etc.)
which have the most impact.
The relative strength of reference group influence as a conditioner
of purchasing behavior has been shown by a study of the Bureau of30Applied Social Research, Columbia University. Buying may be com
pletely individualistic or very socially conditioned by reference
groups. The strength of the reference groups on individuals may con
dition the purchase of a product, the choice of a particular brand, or
both. As has been shown above, the occupational reference group fre
quently functions effectively as a product and/or brand determiner in
30Cited in Francis S. Bourne, "Group Influence in Marketing and Public Relations," Chapter IV of Rensis Likert and Samuel P.,Haynes, Jr., Some Applications of Behavioural Research, UNESCO, Paris, 1957.

31
addition to its Influence on other types of behavior.
Occupation as a Determinant of Roles
Occupational reference groups (clients and colleagues) have long
been considered as a major influence on the roles which an individual
plays, both on and off the job. A role is "the pattern of wants and
goals, beliefs, feelings, attitudes, values, and actions which members
of a community expect should characterize the typical occupant of a
position. Roles describe the behavior expected of people in standard 31situations." Of course, the influence of the "standard situation"
is not the sole determinant factor, for the relation between the way
an individual enacts the role he is cast in by virtue of position
within a group and the personality of the individual is a reciprocal
one. That is, an individual's original personality make-up influences
the role he plays within a group, but the continued performance of
this role eventually affects the basic personality, enforcing certain32traits, extinguishing others.
For example, the physician's "bedside manner" of "personal
interest" strongly tempered with removed objectivity may become such
a part of his personality that it extends to his social relations, thus
removing him from intimate contact except for family and very close
friends. The lawyer's "judicial view" of seeking all sides of a ques
tion may lead to a reluctance for taking stands and a tendency toward
31Krech, 0£. cit., p. 338.
32Ibid., p. 488.
32
lack of quick decision making in his nonlegal activities. A military
man's "authoritarian command" may extend into his non-military family
and social activities. The professor's "classroom aloofness" can
create an overall detached personality with respect to the nonacademic
world. The construction worker's "rough, tough" job demeanor may
become characteristic of his overall social relations. Thus, the
role on the job becomes internalized to the extent that certain
response patterns become built-in to the individual's personality.
"Professional deformation" occurs as an individual adjusts to
the group norms and expectations vis-a-vis his occupational role. Of
course, individuals have some control over the situation because they
tend to select an occupation which seems compatible with their per
ceived requirements and attributes. If the individual makes the
wrong choice, then he tends to be "selected out" of the occupation
by the occupational reference group which will not accept his role
as part of the group's make-up. Thus, "self-selection in" and "other-
selection out" influence the individual's role positions.
In effect, an individual's role within an occupation conforms
basically to an occupational stereotype. Such a stereotype is con
structed over time by both the occupational participants and by the
social milieu within which the occupation functions.
From the social community's point of view, conformity to stereo
typed roles in occupations is related to two principles which, while
not contradictory, tend to work in opposite directions. The first is
that personal freedom and a degree of immunity from moral sanctions
are requirements of high status within any stratification system.

33
Second, occupations which are closely associated with sacred elements,
or especially charged with social responsibility, require participants
to play roles serving as models and examples. Thus, the strictest
control of occupational and nonoccupational role behavior is attached
to those occupations which have important role-setting obligations
for others, are identified with sacred symbols, and have relatively
low status. However, the strictness of control is in part a function
of the size of the community and the diffusion of middle-class patterns
in the United States.
Teaching is one of the best illustrations of this type of role
determination. Not only do many communities closely control the
occupational behavior (classrooms), but they also allow schoolteachers
less freedom than many other adults off the job. They are often for
bidden to smoke, to marry, or to choose their own friends. Examples
of the other extreme may be found in more mobile occupations such as
some branches of engineering, the quasi-professions of sales manage-33ment and advertising, and in a few highly skilled industrial trades.
There are also apparent exceptions— considerable license is
accorded to movie stars, who do have a role-setting function, and to
journalists, whose social responsibility is conspicuous. Yet, studies
have shown that the norms which regulate conduct in Hollywood and
Washington differ considerably from those of less specialized communi-
33Caplow, op. cit., p. 129.
34Ibid., p. 130.

34
Not only are the varying expectations of the given social community
critical in shaping the occupational stereotypes which exist, but other
factors come into play. The sheer age of an occupation helps mold its
stereotype.
Many occupations are universally familiar (cook, carpenter, sailor,
professor), while many others have more recently emerged (computer pro
grammer, psychiatrist, medical technician). The former, with their
long history and familiarity, are generally credited with certain role
expectations (moral and personal characteristics), both internally and
externally. A member of these established occupations can predict
with reasonable accuracy the manner in which he should play his roles
both on and off the job, how he will be accorded social status, what
he should consume, and so on. Further, when the role definition in
cludes personality traits, then the individual typically assumes the
appropriate behavior. Professors may become more absent-minded, re
porters more cynical, chefs more excitable, and policemen more brutal.
Although the job environment itself contains certain "real" elements
which promote such role behavior, the stereotype itself is always an35important conditioning element for behavior.
The rapidly changing occupational complex has made many jobs un
familiar to the majority of the population, thus, creating identifica
tion problems for the holders of both the new positions and the older
parent occupations from which they sprang. Achievements on the job
35Ibid., p. 134.
35
cannot be readily exchanged for social status. There is both lack of
familiarity and confusion with older, stereotyped occupations. Mech
anics are confused with service station "pump jockeys," power-house
engineers with janitors, and accountants with clerks. Further compli
cations arise in occupational stereotyping because of pretentiousness
in occupational titles. On the one hand, certain occupations try to
achieve high status through title changes; while on the other hand,
the established members of the "old-time" occupations fight such dilu
tion of their occupation roles. In such changes, undertakers have
become morticians, bill collectors evolved into credit representatives,
and reporters into journalists, and the title of "engineer" now enhan
ces the role of tree surgeons, shoe salesmen, and snow plow drivers.
The interlopers wage a continuous struggle against the established
occupations, seeking their titles and the accompanying benefits of36status and role position.
For the professions, the problem of stereotyping into certain
roles has been a continuing problem. The problem stems from the vul
nerable position of the professional’s situation. Highly visable,
moderately privileged, partially isolated, and responsible through the
exercise of their jobs for some of the major woes of their fellow men,
professional men are logical targets for popular aggression and misrep
resentation in stereotypes. Some professions, physicians and lawyers
for example, are well aware of their negative stereotypes and use in
tensive propaganda to change the images and expectations.
36Ibid., p. 135.
36
For the craftsman, the stereotype of his occupation has served
to directly protect his interest, particularly where the monopoly of
the building trades is effectively preserved. The stereotypes in
these occupations have a tendency to exaggerate the skill of the
craftsman and present him in the role of one who practices a mystery.
Within the crafts there are distinct differences among the roles
of participants. The brash, reckless character of electricians
differs considerably from the surly cynicism of plumbers or the
stoical gaiety of swing-stage painters. However, there is a single
popular image which the general population has for the entire occupa
tional family, and the social role expectations depend on this nebu
lous image.
In the factory trades there is a great deal of contradiction in
stereotyping and role expectations. On one hand is the Right-Thinking
American Worker; on the other hand is the Militant Member of the
Toiling Masses. In between are many highly differentiated roles which
have only local significance. Thus, this occupational family has per
haps less stereotyping than any other vis-a-vis the occupation. The
reasons for this lack appear to rest with the group's tendency to use
ethnic and other class attributes for categorizing and in the high
mobility of this group.
In distinct contrast, the stereotypes of the retail tradesmen
emerge rather specifically. The specific determinant of these images
vary considerably, but each type of retail tradesman can be stereo
typed. As Caplow states:
Most of the elements which enter into occupational statusgenerally are represented in the formation of these images:

differences in sex, age, skill, wealth; the negative weights attached to personal service and manual labor; the hostility to ethnic groups disproportionately represented in some commercial categories; the highly inflected distinctions which are drawn between hard goods and soft goods, necessities and luxuries, perishables and nonperishables, commodities and services. In the end, the differences created, for example, between the lewd and. half-comic stereotype of the iceman and the arch-respectability of the hardware merchant are sufficient to erase the formal identity which places them in the same category on an occupational scale.^7
Thus, the general stereotypes of occupational families break down
into more specific images and accompanying role expectations within the
occupational categories. An individual's job automatically assigns
certain characteristic behavior expectations to him.
The role played on the job itself is reflected in many of the
"props" which assist the "actors." The style of clothing reflects
expectations for particular types of occupations. In the world of
business there is a compulsion to wear the appropriate "business suit,"
and the more pressure there is on the worker to move upward on the
occupational ladder the better dressed he must be to earn the promo
tion (provided he does not over dress). Across town, college faculty
members contrast sharply in dress to the businessman. Sports coats
and flannels, baggy pants, mismatched coats and trousers, and little
general consideration to appearance are the rule. Unlike the business-38men, their role success is judged by noneconomic criteria. So the
aspiring bank cashier plays his appropriate role, in part, by quickly
learning the correct haberdashery for each stage of his career, just
38
as the young instructor in philosophy knows, to a hair's breadth, the
effect of a given metaphysical philosophy on his chances for promo
tion. They are each playing a role vis-a-vis their job. In the
course of their "on the job" role conditionings, each learns to think
sufficiently like his elders, so that even if they should later choose
to assert a difference on some particular issue, their general orienta
tion to the world which surrounds them will allow them to follow the39prescribed pattern of acceptable behavior.
Off the job, the impact of the occupation forces further role
activities. Location of living, life style, and entertaining are all
effected by the expected role. Whyte has elaborated on the influence
of social entertaining by business executives and the roles which the
wife and family are expected to play for company benefit and personal 40advancement. The salesman must develop contacts for his future
occupational success, the newsman benefits from association with other
newsmen, the college professor welcomes associates who can intellect
ually discourse with him, and the factory worker likes the man who41can talk shop or discuss the latest ball game. Thus, associations
are developed, interests cultivated, and expenditures made in accord
ance with role expectations shaped in major part by the occupation.
On another level of interaction, leadership roles in the community
39Caplow, loc. cit.
40W. H. Whyte, Jr., "The Wives of Management," Fortune,(October, 1951), p. 34.
41Super, o£. cit., p. 34.
are determined in part by occupation which creates expectations about
the individual, provides necessary funds, controls flexibility of
schedule, and fixes status. Executives and professional men occupy
far more leadership positions in their communities than do semi
skilled workers. The manager of the local department store or a
local lawyer is likely to serve as chairman of the local YMCA Building
Drive, while their wives take active parts as members of various
social work boards. The skilled and semiskilled workers are more
likely to find outlets for their free time in various lodges and
athletic societies.^
On another level of role activity, several studies of occupations
as social roles show that the role expectations of an occupation cause
characteristic and sometimes conflicting values and attitudes in mem
bers of certain occupations. Chiropractors often view themselves as43members of an oppressed minority, lawyers as public members and
44pillars of the community, physicians as highly skilled members of
a special group or as participants of a commercial venture and not as45helpers of people, and insurance salesmen are under stress of conflict
*2Ibid., p. 35.
^W . L. Wardell, "The Reduction of Strain in a Marginal Role," American Journal of Sociology, Vol. 61 (1956), pp. 304-307.
^W. L. Wardell, and A. L. Wood, "The Extra-Professional Role of the Lawyer," American Journal of Sociology, Vol. 61 (1956), pp. 304-307.
450. Hall, "The Stages of a Medical Career," American Journal of Sociology, Vol.-53 (1948), pp. 243-253.

40
between the aggressive businessman role, and friendly, sociable roles.
In studying the development of role identification with occupations in
graduate students, Becker and Carper found that occupational personali
ties seem to develop as a result of interest in the problems of work,
pride in skills, investment, internalization of motives, and sponsor
ship by professors. They conclude:
One of the most compeling instances of personal change and development in adult life in our society is to be found in the typical growth of an "occupational personality" in the young adult male who, as he matures, takes over an image of himself as the holder of a particular specialized position in the division of labor.47
Regardless of how the influence is determined, occupation emerges
as a decisive factor in shaping multiple roles which individuals must
conform to both on and off the job. Thus, an individual's occupation
provides general, but reliable, information about several different
kinds of roles which are frequently reflected in consumer behavior.
Income, Education, and Other Factors Influenced by Occupation
Although the relationships are weak in many specific instances,
there are some rather strong correlations between occupation and
income, education, mobility, and certain specific products and services.
Occupation's relationship to income is perhaps most indefinite of any
within this group.
As noted earlier, income does not correlate directly with occupa
tions in terms of a general status ranking which includes all
46L. G. Wispe, "A Sociometric Analysis of Conflicting Role Expectancies," American Journal of Sociology, Vol. 61 (1955), pp. 134-137.
47H. S. Becker, and J. W. Carper, "The Development of Identification With an Occupation", American Journal of Sociology, Vol. 61,(1956), pp. 289-298.

41
occupations. The intra-occupational family rankings of income are
much more likely to scale according to a hierarchy, but even here
certain factors, such as locale, may cause very different incomes
between individuals exactly alike in all other respects. For example,
a podiatrist in a smaller community is less likely to have the same
income as a podiatrist in a large urban area because the former must
do more general work, while the latter can specialize to a much higher
degree. The higher the degree of specialization, the higher the fees,
and the greater possible total income.
Further, the problem of income-occupation correlation is compli
cated by the flux which is presently characteristic of remuneration
scales in general. Labor unions have pushed many blue-collar occupa
tions far ahead of the higher general status white-collar jobs. Never
theless, given knowledge of an individual’s occupation, a general range
of income can be established. The following table shows average
incomes based upon type of occupation of head of household for the
United States population. Again, although there are obviously extremes
in the range for each category, the differences which exist between
occupations in general are significant in evaluating how much an indi
vidual has the ability to spend as a consumer. For each particular
individual, such averages are relatively meaningless, however, because
such factors as family size, location, personal characteristics, etc.
determine his unique expenditure patterns.
Occupation denotes not so much a specific income level for indivi
duals as much as it fairly precisely determines the upper limits
possible given the particular job, while at the same time, defining a
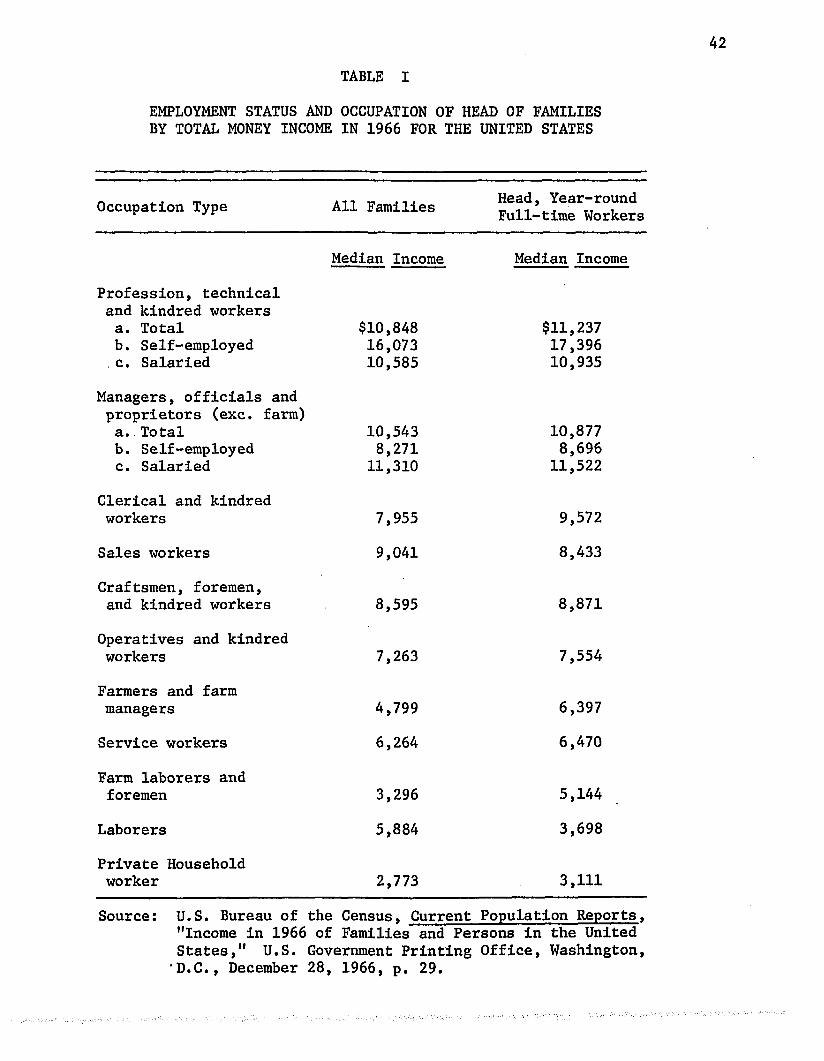
TABLE I
EMPLOYMENT STATUS AND OCCUPATION OF HEAD OF FAMILIES BY TOTAL MONEY INCOME IN 1966 FOR THE UNITED STATES
Occupation Type All Families Head,Full-
Year-round time Workers
Median Income Median Income
Profession, technical and kindred workersa. Totalb. Self-employed . c. Salaried
$10,84816,07310,585
$11,23717,39610,935
Managers, officials and proprietors (exc. farm)a.. Totalb. Self-employedc. Salaried
10,5438,271
11,310
10,8778,696
11,522
Clerical and kindred workers 7,955 9,572
Sales workers 9,041 8,433
Craftsmen, foremen, and kindred workers 8,595 8,871
Operatives and kindred workers 7,263 7,554
Farmers and farm managers 4,799 6,397
Service workers 6,264 6,470
Farm laborers and foremen 3,296 5,144
Laborers 5,884 3,698
Private Household worker 2,773 3,111
Source: U.S. Bureau of the Census, Current Population Reports,"Income In 1966 of Families and Persons in the United States," U.S. Government Printing Office, Washington, D.C., December 28, 1966, p. 29.

43
general range within which the income is likely to fall.
Unlike income's relation to occupation, the interaction between
education and occupation is more precise, particularly for the
extremes of the overall occupational hierarchy. Thus, for the pro
fessions there are very specific educational requirements in terms
of formal schooling and extracurricular requirements. For example,
an accredited medical doctor must pass through a formal education
sequence in accredited institutions and serve an internship under
strict supervision before he is officially admitted into professional
membership. At the other end of the occupational stratum, the manual
laborer is automatically precluded from advancement to higher levels
because he lacks the formal education credentials.
Further, on-the-job interactions provide for continuing education
in very broad terms. High level occupations, such as professions,
place one in association with individuals, on a generally equal level
in formal education terms and who, as a group, tend to be more sophis
ticated in areas such as culture, travel, mores, tastes, etc. Thus,
an individual "learns" as he operates within these sophisticated
circles. Likewise, at the lower ends of the occupational hierarchy,
one is in contact with people who unknowingly use bad grammar, seek
very basic types of entertainment, have lower aspirations, are rela
tively immobile in terms of geographic location, and so on. Indivi
duals on this level perpetuate ignorance through their limited know
ledge.
The educational system itself, as it presently operates, acts as
a determinant of occupational choice. As Caplow states:

44Except for that tiny minority whose occupational choices are crystallized in childhood or early adolescence, choices occur at points where they are built into the educational system. They cannot be evaded. Under the emerging system of occupational determination, complete passivity on the part of the student is itself a choice. If he does not elect the appropriate subjects in his early years of high school, he rejects in effect the occupations for which college training is required. If he omits the natural sciences in favor of the social sciences, he eliminates himself as a candidate for thousands of industrial jobs, and if he ignores both of them, he will never be qualified for the beginning ranks in the government service.^8
Once the occupational choice is made, whether directly or indir
ectly, the individual begins to be influenced in numerous ways by his
occupational goal. His education is both a cause and an effect of
the selected job.
Finally, the requirements of the occupation itself influence
individuals in numerous kinds of specific purchasing decisions.
Holders of high risk jobs, such as explosives truck drivers, window
washers, and construction workers, are more predisposed to purchase
insurance. Businessmen must have an adequate supply of their "uniform,"
the business suit, and need a briefcase as part of their job-related
set of products. Airline pilots require sunglasses. Wives of top
executives, required to do entertaining to compliment their husband's
activities, are a prime market for entertainment supplies, such as
glasses, trays, and decorations. The construction worker must purchase
a lunch basket, overalls, and protective clothing for the seasons.
Thus, for each particular type of job, there are varying but
frequently numerous requirements in terms of clothing, work assists,
48Caplow, 0£. cit., p. 220.
45
and social products which must be purchased. These necessities are
yet another part of the occupation's influence on the individual.
The Pervasive Influence of Occupation on the Individual
The preceding material dealt with the role of occupation in
influencing several significant aspects of an individual's way of
life. Occupation emerges as both a reflector and an effector, thus
providing a key to better understanding an individual based solely
on such limited information as an occupational classification. To
anyone seeking information about an individual in order to predict
his behavior, occupation appears to provide a unique forecasting
potential. Particularly for marketing men does occupation seem
relevant in providing important knowledge about consumers. Specifi
cally, occupation is a major influence on individual needs, social
stratification, reference groups, roles, income, education, and job
necessitated purchases, thus inevitably affecting consumption.
For purposes of this study, a particular occupational family,
the professions, is singled out for analysis. A more detailed look
at this group provides the background for the study objectives.
The Professions: Leaders in Occupational Hierarchies
From a marketing point of view, the occupational family of
"professions" possesses several characteristics which make it one of
the most relevant families to study in order to determine the effect
which an occupation has on an individual's consuming behavior. First,
professions command the highest status ranking of any of the occupa
tional groups, although of course, there is a great deal of horizontal

46
status distance within the family. Second, professional classifica
tion can be rather specific, although even the sociologists do not
have definite agreement as to definition, especially for some of the49emerging professions. Third, "professionalization11 of an individual
involves, for each profession, a rather specific conditioning process
which affects the individual significantly, both during training,
apprenticeship (if present), and practice. Finally, "...professional
ization is becoming an increasingly important determinant of the charac
ter of contemporary communities.""^ In such a role, the professions
can well exert significant influence which will’ ultimately affect
marketing processes, and which in the short run may affect success or
failure, for product types and/or brands.
Thus, the "profession" occupational family offers a definable area
of study which can produce insights into the effect of occupation on
an individual in several aspects, particularly for the purposes of
this study, consumer behavior.
Definition of Professions. The concept of professions, like so
many of the contemporary sociological concepts, is basically a folk
concept. Consequently, it has an emotional context in terms of the
public's reactions. There is a morally desirable connotation involved—
to be a professional is good, to be a nonprofessional is to be some
thing less than adequate. For most individuals, to become a professional
49Bernard Barber, Professioris in America, ed., Kenneth Lynn, (Boston: Houghton Mifflin Company, 1965), p. 17.
"* D. A. Clelland, and W. A. Faunce, "Professionalization and Stratification Patterns in an Industrial Community," The American Journal of Sociology. Vol. 72 (January, 1967), p. 342.

47
involves a lifetime career commitment. Acceptance into a profession
is normally attained only after compliance with rigorous requirements
(specific education and training, certain "rites of passage" which
include examinations, followed by the awarding of degrees, and often,51licenses to practice).
Specific activities, of course, differ significantly among pro
fessions, but generally, "a profession delivers esoteric services—
advice or action or both— in individuals, organizations or government;52to whole classes or groups of people or to the public at large."
Operating as individuals and within their closed groups, "profession
als 'profess.' They profess to know better than others the nature
of certain matters, and to know better than their clients what ails53them or their offices." This attitude is the essence of the profes
sional idea and claim.
Distinguishing Characteristics of Professionals. A more detailed
look at characteristics of professional behavior is given by Bernard
Barber.
Professional behavior may be defined in terms of four essential attributes: a high degree of generalized andsystematic knowledge; primary orientation to the community interest rather than to individual self-interest; a high degree of self-control of behavior through codes of ethics internalized in the process of work socialization; and a
waiter L. Slocum, Occupational Careers (Chicago: Aldine Publishing Company, 1966), p. 119.
52Everett C. Hughes, Professions in America, ed., Kenneth Lynn, (Boston: Houghton Mifflin Company, 1965), p. 1.
53Ibid., p. 2.

48
system of rewards (monetary and honorary) that is primarily a set of symbols of work achievement and thus ends in themselves, not means to some end of individual self-interest.^4
The latter characteristic, the system of rewards, is one of the
important and uniquely distinguishing aspects of professional occupa
tions, in terms of influence on two significant elements important to
consumer behavior: status and income. The actual reward system used
is composed of a combination of prestige and titles with sufficient
money for maintenance of a style of life appropriate for the honor 55bestowed. Unlike many occupations with more objective evaluations
of merit (piece work, time, direct contribution), professions employ
a complex system for evaluation of merit which in turn determines the
rewards granted.
What is evaluated in the professions is a kind of skill, conceived
so broadly as to include the practitioner’s personality, creativeness,
and social contacts. For the free professions, the determination of
merit is, in principle, entirely in the hands of fellow-professionals.
In reality, the judgment of clients and of the general public (for
some such as lawyers and architects) is also taken into account.
Therefore, in order to protect its members, the professional society
is required to evolve special devices for limiting the effect of these56outside judgments. Thus, rules and restrictions have been developed
that limit the participation of architects in the construction
54Barber, op. cit., p . 18.
55Ibid., p. 19.
■^Caplow, op. cit., pp. 110-111.

49
business, oppose popular election of the higher judiciary, restrict
the access of physicians to hospitals, and determine qualifications
of college teachers. Among the formal devices are honorific titles,
membership in institutes, office in controlling professional societies,
the right to specialize, and the right to practice in specific areas.
However, the informal controls are also very important: the functions
of gossip, allocation of partnerships, and the systems of consultation
and referral. ^
Variations in Income Determination. The matter of income deter
mination for the professions is somewhat unique, although it is
becoming more standard with other types of occupations because of the
increasing scope of organizations as opposed to private practice. On
this point, Everett C. Hughes notes:
Law and medicine— the models which other professions try to approximate— in spite of nourishing free practice of the individual, for a number of clients with a minimum of institutional apparatus, are in fact far along the road to practice in complicated organizations which intervene in many ways between them and their clients.58
In terms of actual payment for services rendered, the amount often
varies considerably. Because professionals are assumed to be perfectly
non-interchangeable, with the work of each being a unique, free
creation, then their work cannot accurately be valued in monetary terms
because there is no equal substitute. Thus, the payment required is
often based largely on the clients’ ability to pay, with standards
acting as guidelines. However, in the case of many salaried
*^Loc. Cit.
58Hughes, op. cit., p. 10.
50
professionals, the same assumption leads to the practice of paying
only enough to provide a decent subsistence and is unrelated to the
work, which is performed as a public service. This is especially59true for teachers and ministers. Nevertheless, most professionals
hold their own in terms of income, and for those traditionally
slighted, such as public school teachers, recent demands have brought
the average income up to more competitive levels.
In terms of interaction with their clients, professionals
traditionally have acted in an interested but remote fashion. An
insight into this critical part of a professional's activities is
given in a description of lawyer-client interaction, "The lawyer-
client relation in counseling has about it something of the attitude
of a sympathetic critic to a work of art— immersion and withdrawal:
immersion lest he be pedantic and unfeeling, withdrawal lest he60become bemused and sentimental."
Relationships With Clients. The traditional professional-client
relationship still holds in effect ■, but it is weakening because of
the growth of organizational systems which include the professional
as part of their staff. Historically, professionals dealt with
clients or patients who were assumed to have insufficient knowledge
to evaluate either the need for particular types of treatment or
advice or the adequacy of the service rendered. Consequently, the
clients deferred to the authority of the professional, for example,
59Caplow, loc. cit.
^Hughes, loc. cit.

51
"follow the doctor's orders." The traditional authority structure has
been weakened by the continuing growth of organizations which lessen
the impact of the individual professional through the dilution effect
of group activities. Further, the increasing remoteness of the
practicing professional from the client himself has been accentuated.
Several examples point up this increasing de-personalization of
the professional's relationship with his client. Architects now
typically deal with "legal" clients rather than their "real" clients,
for the large corporation intervenes between the people who actually
will use the structure and the man who designs it. In a sense, the
real clients of the architect are social, all those who must use and
interact with the building. However, the architect must work with
figures furnished by the corporation, not with the people who must
benefit or suffer from the design. Likewise, in medicine, the staff
specialist evaluates but one aspect of the patient, often represented
in impersonal report form, and pools his conclusions with others who
actually never see the individual. In education, the teacher is often
far removed from the classroom situation, having been physically
replaced by video-tape, closed-circuit television, and other mechanical
teaching devices. Thus, while the independent practitioner remains
the most typical of professional men, there are growing numbers of
salaried, remote professionals that alter the historical client
relationships, even among the "purest" professions of lew and
medicine.^
61 Caplow, op. cit., p. 170.

52
True autonomy, the ideal of professional ideology, emphasizes the
idea that the qualified professional is supposed to be an independent
self-directing person. But even in such free settings as the univer
sity, the tenured professor works in conjunction with colleagues.
Colleague relationships are further stressed by the active profes
sional associations which have many of the cohesive features of the
medieval guilds. Such associations have critical importance for the
professions, and Carr-Saunders and Wilson have called attention to
the importance of "group consciousness," saying, "... It is only under
the stimulus of the latter that the practitioners associate together62and become a profession in the full sense of the word." These
important professional reference groups maintain the distinctiveness
of the profession, engage in public relations work to achieve and
maintain status, guide the evolution of the profession, and act as a
general reference point for such factors as standards of conduct, fees,
social interaction, and other behavior activities.
Occupational Distances Between Members of Prof ess ioriis. Even
though the professions constitute a relatively close-knit occupational
family, as with the other groupings of jobs, there are definite occupa
tional distances which exist. Occupational distance is defined as the
degree of sympathetic understanding existing between the members of any 63two occupations. Among the professions, this distance is measured
62As quoted by Slocum, op. cit. p. 129.
63Emory S. Bogardus, "Occupational Distance," Sociology and Social Research, Vol. 13, (1928-1929), p. 73.

53
horizontally, while between the professions and other occupations, the
distance is vertical. Because the professions reside at the top of
occupational hierarchies, the vertical distance is relatively greater
than the horizontal (there is greater group cohesiveness in total).
In essence, the highest sub-groups of occupations (professions) have
the greatest degree of occupational centrism, which diminishes in64strength down the scale of the total occupational hierarchy. The
horizontal distances are also significant, however.
For example, there are significant differences between lawyers
and lawyers who have become judges. Likewise, a practicing doctor is
lower among doctors than a practicing doctor who is also on the staff
of a medical school. The competitive factors which determine horizon
tal distance include variations in the content of training, cultural
make-up, and specific functional activities.^ Nevertheless, there
is a great similarity of professional behavior within the particular
sub-group of the occupational family of professions, and, in fact,
among all the occupations on the professional level.
The multiplex of reasons which places the professions in their
position relative to the other occupations can be summed up as a set
of "cultural differences.11 These differences are manifested in the
especially different preparatory training requirements, in educational
standards, in vocabulary, and in mental vision. In effect,' occupations
can be arranged on a scale of increasing complexity of cultural traits,
64Ibid., p. 79.
65Ibid., p. 77.
the complexity of which is a direct cause of occupational distance.
The more complex the traits, the greater the distance when comparing
two occupations.
The Professions as a Test Group. In summary, for purposes of
exploration of knowledge about the relationship of occupation to
consumer behavior, the professions possess a number of valuable
characteristics: in terms of definition, there is good general
agreement as to which occupations fall within the classification;
numerous studies have probed some of the relationships which exist
among the members of the groups themselves, with their clients, with
their colleagues, and with the general public; and finally, the pro
fessions tend to carry their professional characteristics beyond the
point of the actual activity of the job as such to become "... a
standard of conduct or behavior for unrelated social life."^
This study seeks to further expand knowledge of the specific
relationships between occupation and consumption by focusing on
specific professional groups and their product perceptions.
^ L o c . cit.
^Arthur E. Briggs, "Social Distance Between Lawyers and Doctors, Sociology and Social Research. Vol. 13, (1928-1929), p. 63.

CHAPTER III
ANALYSIS OF OCCUPATIONALLY DETERMINED IMAGES
The occupationally determined images of an individual are created
by his own thoughts with respect to his occupation and by his feelings
about how others view the occupation and how they view him as a
practicing member of that occupation. Four of these images serve as
the basis of analyses to determine whether the test groups, first,
vary between themselves in such images, and second, vary internally
between the images. In each case, the same four images are considered.
The first image is externally oriented to a very nebulous refer
ence group, the general public, and how they are thought to view the
profession as a whole by the practicing members. Next, the images
held by a significant reference group, colleagues, in terms of how
they are thought to view the practicing members, are considered. The
third image is purely self-oriented in determination as it expresses
how one feels about his own occupation. Finally, another significant
reference group is examined in the image of how one’s clients are per
ceived to feel about him as a practicing professional.
Variations Between Test Groups in Occupational Image Perception
In seeking possible differences between the test groups for the
55

56
occupationally determined images, several insights can be gained into
whether significant differences exist between the sub-groups of the
occupational family professions and whether the occupational family
as a whole differs from nonprofessionals. Each of the images is con
sidered independently in terms of relationships in similarity of
meanings between the test groups.
Concept 1. Table 2 presents the results of chi-square tests for
significant differences in perceptions between the test groups for the
concept "How You Think People in General (Excluding Your Clients and
Colleagues) View Your Profession as a Whole." Doctors, Ministers, and
Lawyers all perceive this concept significantly different at the .05
level. Each of these groups thinks that they are uniquely viewed by
the public in comparison to the way the public view is perceived by
all the other respective occupations.
These relationships are borne out in Table 3 data which show "D"
distances in semantic space between the groups for the same concept.
The rank relationship of the groups is shown in parenthesis going down
the columns. An analysis of these rank relationships shows how the
groups cluster with one another, signifying closeness in semantic
space and, therefore, in meaning, or how they tend to disperse, thus
showing differences in meanings in terms of semantic space distances.
Nonprofessionals, Professors, and Accountants are all relatively close
to one another, with the first two being extremely close. Of the other
three groups, Doctors are closest to Nonprofessionals, but are still
significantly different as shown earlier in Table 2. Ministers and
Lawyers are each isolated by themselves with relatively large "D"

57
TABLE 2
CHI-SQUARE TEST FOR SIGNIFICANT DIFFERENCE BETWEEN TEST GROUPSFOR CONCEPT 1 - HOW YOU THINK PEOPLE IN GENERAL
VIEW YOUR PROFESSION AS A WHOLE
Nonprofessionals Professors
N.S. .10 .05 N.S. .10 .05
PP 92.62 PD 147.98 NP 92.62 PD 189.24PA 134.95 PM 179.10 PA 133.79 PM 150.83
PL 195.09 PL 193.48
Doctors Ministers
N.S. .10 .05 N.S. .10 .05
NP 147.98 NP 179.10PP 189.24 PP 150.83PM 253.28 PD 253.28PA 166.69 PA 229.37PL 213.17 PL 228.79
Accountants Lawyers
N.S. .10 .05 N.S. .io .05
NP 134.95 PD 166.69 NP 195.09PP 133.79 PA 229.37 PP 193.48
PL 201.84 PD 213.17PM 228.79PA 201.84
Significance level: .05 = 146.5;; .10 = 140.4Test groups designated on this and following tables by P plus first initial of group, i.e., Professors are PP, Doctors are PD, etc.

58
distances between themselves and all the other groups. Lawyers are
particularly isolated from the other groups with four out of the five
"D" scores being greater than "4".
TABLE 3
"D" DISTANCES BETWEEN FOR CONCEPT I
TEST GROUPS
Test Groups NP PP PD PM PA PL
NP 0.00 1.45(1) 2 .20(1) 2.78(2) 2.45(2) 4.01(2)
PP 1.45(1) 0.00 2.57(2) 2 .21(1) 2.11(1) 3.92(1)
PD 2.20(2) 2.57(4) 0.00 3.51(4) 3.01(4) 4.27(4)
PM 2.78(4) 2.21(3) 3.51(4) 0.00 2.88(3) 4.12(3)
PA 2.45(3) 2.11(2) 3.01(3) 2.88(3) 0.00 4.56(5)
PL 4.01(5) 3.92(5) 4.27(5) 4.12(5) 4.56(5) 0.00
Thus, Nonprofessionals, Professors, and Accountants are closely
and significantly related in their perceptions of how the general pub
lic looks at their profession as a whole. On the other hand, Doctors,
Ministers, and Lawyers perceive the general public as viewing their
occupation as a whole in unique terms. Consequently, only three of
the test groups have distinctly differing perceptions of how this very
general reference group views their profession. If all members of the
occupational family of professions thought that the general public
viewed them as "professionals", then the five test professions would
have differed only from the nonprofessionals. However, this is not

59
the case, with three of the sub-groups apparently feeling that the
general public feels distinctly about their profession, rather than
generally about all professions.
Concept 2. Table 4 considers a second occupationally determined
concept, "How You Think Your Colleagues Feel About You as a Practicing
Professional." Except for Doctors, all perceive this concept without
any significant degree of difference. The Doctors emerge with a div
ergent perception in comparison to all other groups, possibly indica
ting a unique colleague relationship for this particular occupation.
The "D" distances for this concept for the groups, shown in
Table 5, indicate close positioning in semantic space for all the
groups except, as indicated above, the Doctors are relatively isolated
from the others. However, the degree of isolation is not great, with
a "D" of only slightly greater than "2" in each case. Thus, the sig
nificance is probably due to a heavy concentration by the Doctors in
overall meaning, i.e., the "cloud" representing the composite percep
tion of Doctors is very concentrated, showing a high degree of agree
ment. If they were more divergent in their perceptions, the relative
closeness of the "cloud" to the other groups' would create such overlap
that the significant difference of Doctors shown in Table 4 would not
occur.
In terms of rank order of relative distance, Nonprofessionals,
Professors, and Accountants are again very close. Ministers are
extremely close to Professors, although slightly further away from Non
professionals, and Lawyers are close to all except Doctors. Thus,
Doctors definitely stand alone from all the other groups and are, as

TABLE 4
CHI-SQUARE TEST FOR SIGNIFICANT DIFFERENCE BETWEEN TEST GROUP FOR CONCEPT 2 - HOW YOU THINK YOUR COLLEAGUES FEEL ABOUT YOU
AS A PRACTICING PROFESSIONAL
Nonprofessionals Professors
N.S. .10 .05 N.S. .10 .05
PP 96.30 PD 171.18 NP 96.30 PD 153.24PM 120.24 PM 93.87PA 97.07 PA 97.01PL 103.85 PL 100.82
Doctors Ministers
N.S. .10 .05 N.S. .10 .05
NP 171.18 NP 120.24 PD 169.46PP 153.24 PP 93.87PM 169.47 ' PA 125.87PA 167.61 PL 95.17PL 158.52
Accountants Lawyers
N.S. .10 .05 N.S. .10 .05
NP 97.07 PD 167.61 NP 103.85 PD 158.52PP 97.01 PP 100.82PM 125.87 PM 95.17PL 97.95 PA 97.95
Significance level: .05 = 146.5; .10 = .40.4

61
noted, a close-knit occupational group.
TABLE 5
"D" DISTANCES BETWEEN TEST GROUPS FOR CONCEPT 2
Test Groups NP PP PD PM PA PL
NP 0.00 1.23(3) 2.23(4) 1.68(4) 1.13(2) 1.48(4)
PP 1.23(2) 0.00 2.03(1) 1.11(1) 1.09(1) 1.30(1)
PD 2.23(5) 2.03(5) 0.00 2.11(5) 2.19(5) 2.45(5)
PM 1.68(4) 1.11(2) 2.11(2) 0.00 1.34(3) 1.38(2)
PA 1.13(1) 1.09(1) 2.19(3) 1.34(2) 0.00 1.38(2)
PL 1.48(3) 1.30(4) 2.45(5) 1.38(3) 1.38(4) 0.00
Concept 3. The differences between the groups for the third occupa
tionally-related concept, "How You Feel About Your Profession," are
somewhat confused. In Table 6 Nonprofessionals appear to be centrally
located in the cluster of "clouds" representing the groups, i.e.,
there is not any significant difference between Nonprofessionals' per
ceptions and any of the other groups. However, Professors are signif
icantly different from Ministers at the .05 level and from Doctors and
Lawyers at the .10 level. Further, Ministers are significantly differ
ent at the ,05 level from Accountants. A continuing closeness in per
ceptions emerges between Nonprofessionals, Professors, and Accountants,
with Ministers clearly distinctive from the latter two.
In examining Table 7, two things are apparent with respect to

62
TABLE 6
CHI-SQUARE TEST FOR SIGNIFICANT DIFFERENCE BETWEEN TEST GROUPSFOR CONCEPT 3 - HOW YOU FEEL ABOUT YOUR PROFESSION
Nonprofessionals Professors
N.S. .10 .05 N.S, .10 .05
PP 80.84 NP 80.84 PD 142.88 PM 146.45PD 127.64 PA 104.05 PL 145.79PM 119.18 PA 106.46 PL 133.80
Doctors Ministers
N.S. .10 .05 N.S. .10 .05
NP 127.64 PP 142.88 NP 119.18 PP 146.45PM 131.61 PD 131.61 PA 148.22PA 115.09 PL 137.94PL 138.76
Accountants Lawyers
N.S. .10 .05 N.S. .10 .05
NP 106.46 PM 148.22 NP 133.80 PP 145.79PP 104.05 PD 138.76PD 115.09 PM 137.94PL 138.60 PA 138.60
Significance level: .05 - 146.5; .10 - 140.4

Concept 3: first, the "D" distances are not really great between any
of the groups, except for Lawyers, which again isolated themselves
relatively, and second, the non-significance between the groups found
in Table 5 in conjunction with the "D" distance relationships means
that concept meanings are not really concentrated for any of the
groups, especially for Lawyers. In other words, the "clouds" which
represent each group are dispersed and overlap. This indicates mixed
perceptions about feelings toward one’s own profession in general,
with only Ministers clearly distinctive from but two of the other groups.
TABLE 7
"D" DISTANCES BETWEEN TEST GROUPS FOR CONCEPT 3
Test Groups NP PP PD PM PA PL
NP 0.00 1.16(1) 1.85(3) 1.51(1) 1.59(1) 2.96(3)
PP 1.16(1) 0.00 2.14(4) 1.75(3) 1.64(2) 2.78(2)
PD 1.85(4) 2.14(4) 0.00 1.74(2) 1.78(3) 3.02(4)
PM 1.51(2) 1.75(3) 1.74(1) 0.00 2.05(4) 3.10(5)
PA 1.59(3) 1.64(2) 1.78(2) 2.05(4) 0.00 2.46(1)
PL 2.96(5) 2.78(5) 3.02(5) 3.10(5) 2.46(5) 0.00
In rank order of closeness, Nonprofessionals, Professors, and Account
ants again tend to cluster, while Lawyers continue their tendency to
position in semantic space away from all the other groups.
Concept 4 . Relationships between the groups in terms of perceptions
of Concept 4, "How You Think Your Clients feel about You as a Practicing
64
Professional," are treated in Tables 8 and 9. Doctors again emerge
in terms of distinctiveness of perception by being significantly
different from all the other groups at the .05 level, except for
Accountants where there is no significant difference. Likewise,
Ministers and Accountants show variation tendencies with significant
difference at the .10 level. A similar situation to the analysis of
Concept 2 emerges.
From Table 9 the "D" distances are not exceptionally large, thus
indicating the "cloud" representing the Doctors is relatively compact,
signaling close agreement. Further, Nonprofessionals, Professors, and
Accountants tend to cluster closely, with Ministers and Lawyers
occupying the same cluster, although somewhat more removed.
Overall, the pattern of closeness between the groups continues,
with Doctors once more distinguishing themselves in terms of separa
tion from others and closeness intra-professionally. It is interesting
to note that of all the professions, medical doctors are acknowledged
to receive highly consistent training and professionalization. The
other tendency to differ is between Ministers and Accountants, the
former dealing primarily with subjective considerations and the latter
with more pragmatic matters.
In general, the test groups do show variation in perception of the
occupationally determined images, although there is a great deal of
similarity and overlap in the concepts between certain groups. The
most notable standout in distinctiveness of image is Doctors, who
differ from the other groups on three of the four concepts. The most
generally agreed upon concept is C3-You, but only because the images

65
TABLE 8
CHI-SQUARE TEST FOR SIGNIFICANT DIFFERENCE BETWEEN TEST GROUPSFOR CONCEPT 4 - HOW YOU THINK YOUR CLIENTS FEEL ABOUT YOU
AS A PRACTICING PROFESSIONAL
Nonprofessionals Professors
N.S. .10 .05 N.S. .10 .05
PP 111.97 PM 113.46 PA 88.59 PL 93.63
PD 148.25 NP 111.97 DM 102.57 PA 110.96 PL 117.71
PD 194.88
Doctors Ministers
N.S. .10 .05 N.S. .10 .05
PA 129.87 NPPPPMPL
148.25194.88179.61160.64
NP 113.46 PP 102.57 PL 132.24
PA 143.38 PD 179.61
Accountants Lawyers
N.S. .10 .05 N.S. .10 .05
NP 88.59 PP 110.96 PD 129.87 PL 109.16
PM 143.38 NP 93.63 PP 117.71 PM 132.24 PA 109.16
PD 160.64
Significance level: 05 = 146. 5; .10 = 140.4

66
appear to be very dispersed, thereby creating overlap between the
groups. The opposite situation, relatively high disagreement in
perception, applies to Cl, how the general public is thought to view
the profession.
TABLE , 9
"D" DISTANCES BETWEEN TEST GROUPSFOR CONCEPT 4
Test Groups NP PP PD PM PA PL
NP 0.00 1.52(3) 2.22(3) 1.71(4) 1.12(1 ) 1.24(2)
PP 1.52(3) 0.00 2.35(4) 1.54(1) 1.23(3) 1.24(2)
PD 2.22(5) 2.35(5) 0.00 2.06(5) 1.83(5) 2.44(5)
PM 1.71(4) 1.54(4). 2.06(2) 0.00 1.74(4) 1.68(4)
PA 1.12(1) 1.23(1) 1.83(1). 1.74(3) 0.00 1.22(1)
PL 1.24(2) 1.24(2) 2.44(5) 1.68(2) 1 .22(2) 0.00
Overall, the test results for these occupational concepts appear
to verify the internal hierarchy structuring within a given occupa
tional family. As other studies have shown Doctors and Lawyers at the
top of the occupational hierarchies, they emerge in this study, along
with Ministers, as at least being distinctly removed in terms of their
occupationally determined perceptions. Further, Accountants and Pro
fessors, occupying lower positions in occupational ranking schemes to
the above groups, do show up in this study as being closely related to
the Nonprofessional test group in this set of perceptions.
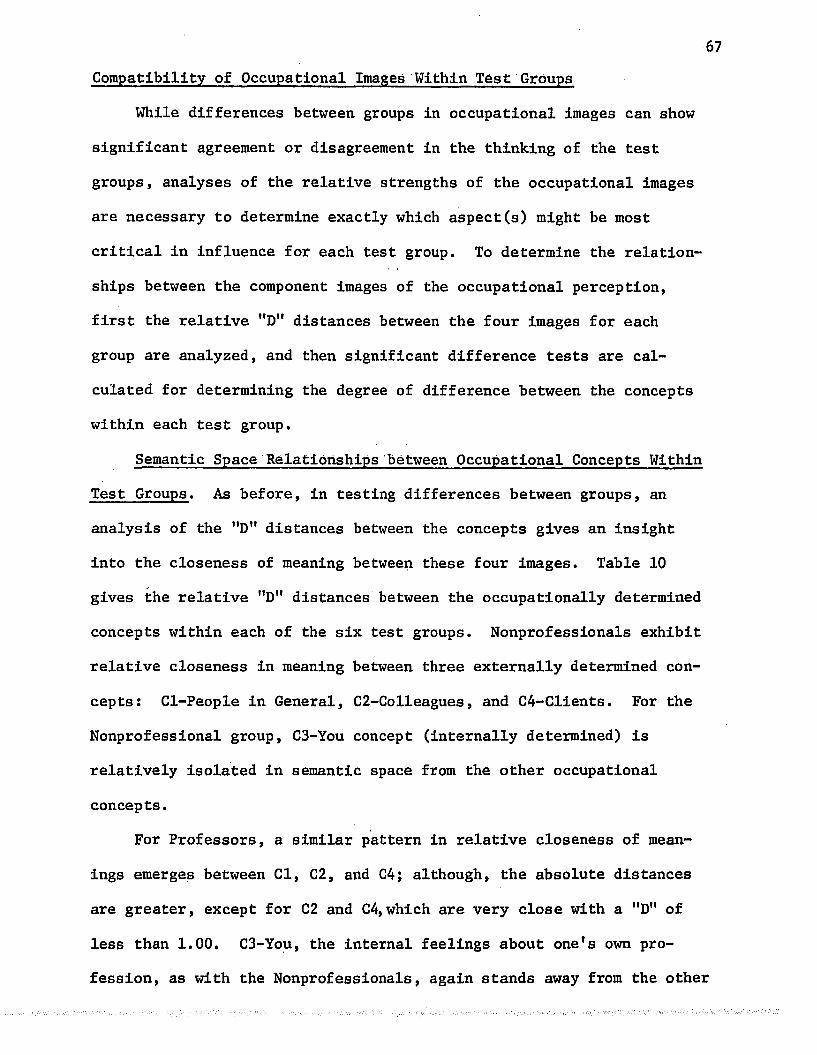
67Compatibility of Occupational Images Within Test Groups
While differences between groups in occupational Images can show
significant agreement or disagreement in the thinking of the test
groups, analyses of the relative strengths of the occupational images
are necessary to determine exactly which aspect(s) might be most
critical in influence for each test group. To determine the relation
ships between the component images of the occupational perception,
first the relative "D" distances between the four images for each
group are analyzed, and then significant difference tests are cal
culated for determining the degree of difference between the concepts
within each test group.
Semantic Space Relationships between Occupational Concepts Within
Test Groups. As before, in testing differences between groups, an
analysis of the "D" distances between the concepts gives an insight
into the closeness of meaning between these four images. Table 10
gives the relative "D" distances between the occupationally determined
concepts within each of the six test groups. Nonprofessionals exhibit
relative closeness in meaning between three externally determined con
cepts: Cl-People in General, C2-Colleagues, and C4-Clients. For the
Nonprofessional group, C3-You concept (internally determined) is
relatively isolated in semantic space from the other occupational
concepts.
For Professors, a similar pattern in relative closeness of mean
ings emerges between Cl, C2, and C4; although, the absolute distances
are greater, except for C2 and C4,which are very close with a "D" of
less than 1.00. C3-You, the internal feelings about one's own pro
fession, as with the Nonprofessionals, again stands away from the other
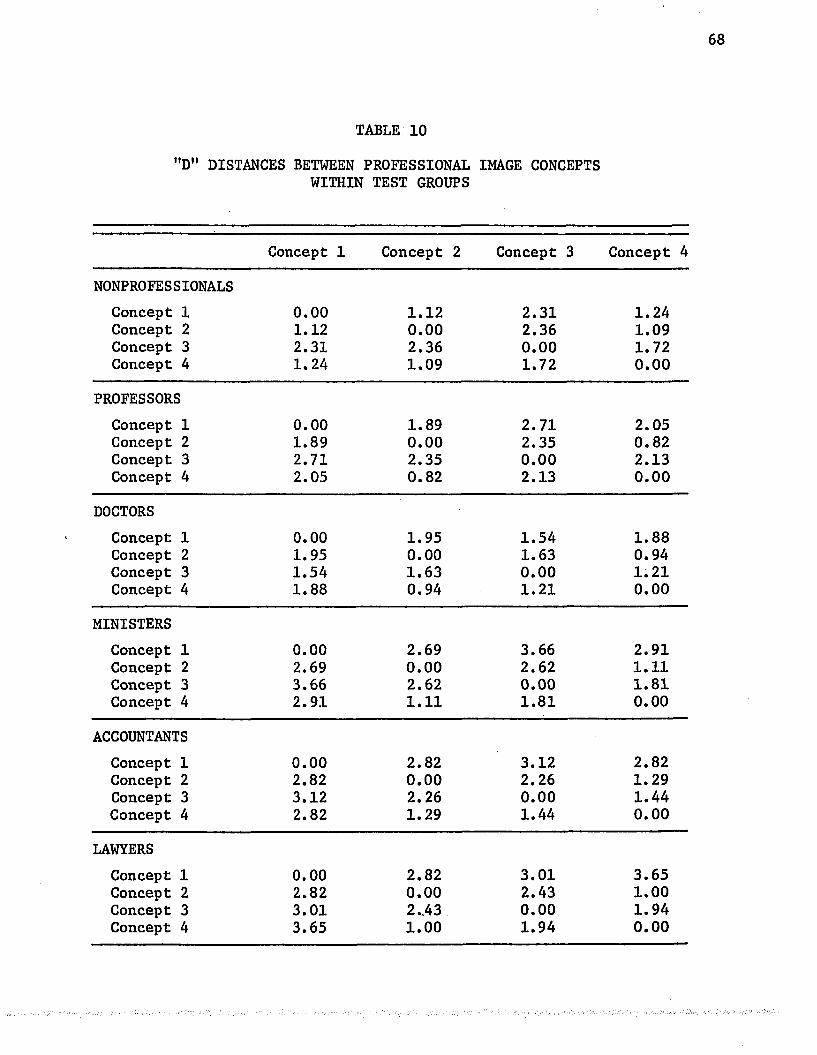
68
TABLE 10
"D" DISTANCES BETWEEN PROFESSIONAL IMAGE CONCEPTS WITHIN TEST GROUPS
Concept 1 Concept 2 Concept 3 Concept 4
NONPROFESSIONALSConcept 1 0.00 1.12 2.31 1.24Concept 2 1.12 0.00 2.36 1.09Concept 3 2.31 2.36 0.00 1.72Concept 4 1.24 1.09 1.72 0.00
PROFESSORSConcept 1 0.00 1.89 2.71 2.05Concept 2 1.89 0.00 2.35 0.82Concept 3 2.71 2.35 0.00 2.13Concept 4 2.05 0.82 2.13 0.00
DOCTORSConcept 1 0.00 1.95 1.54 1.88Concept 2 1.95 0.00 1.63 0.94Concept 3 1.54 1.63 0.00 1.21Concept 4 1.88 0.94 1.21 0.00
MINISTERSConcept 1 0.00 2.69 3 .66 2.91Concept 2 2.69 0.00 2.62 1.11Concept 3 3.66 2.62 0.00 1.81Concept 4 2.91 1.11 1.81 0.00
ACCOUNTANTSConcept 1 0.00 2.82 3.12 2.82Concept 2 2.82 0.00 2.26 1.29Concept 3 3.12 2.26 0.00 1.44Concept 4 2.82 1.29 1.44 0.00
LAWYERSConcept 1 0.00 2.82 3.01 3.65Concept 2 2.82 0.00 2.43 1.00Concept 3 3.01 2..43 0.00 1.94Concept 4 3.65 1.00 1.94 0.00

69three concepts in semantic space.
Doctors exhibit a different pattern of relationships between
professional concepts than the preceding two groups and from the
other test groups. For this group, there is relatively greater
closeness between all the concepts. However, a continuing noticeable
closeness between C2 and C4 can be seen.
This same pattern of relationships is noted in the Ministers,
with C2 and C4 being the closest in semantic space. For this group,
the most divergent meanings exist for Cl-People in General, as all
"D" scores are greater than 2.5 when Cl is compared to the other con
cepts. Also relatively isolated in semantic space is C3, the personal
view internally oriented concept.
The fifth test group, Accountants, resembles the patterning of
Ministers. Cl-People in General is positioned far from the other
concepts, with all MD" scores greater than 2.75; C3-You and C4-Clients
are close relatively (the feeling here may be that clients "understand"
what the professional is doing better than any of the other groups);
C2 and C4 show greatest similarity; and C3-You continues to be some
what isolated from all other concepts, except C4 relatively. As with
Nonprofessionals, Professors, and Ministers, Accountants appear to
have four distinctly different images in general.
The final test group, Lawyers, provides the greatest overall ten
dency for separation in semantic space of the four occupational con
cepts. Cl-People in General is quite far from all the other concepts,
especially C4-Clients. The established pattern of the other groups in
terms of relative closeness of C2 and C4 continues along with the

70
relative closeness (although absolutely somewhat large at "D" equal
1.94) of C3 and C4.
From the overall analysis of Table 10, C3-You, the internally
oriented image seems distinctly separated from the other image-con-
cepts for all test groups. Further, a noticeable relative closeness
exists between C2-Colleagues and C4-Clients, two external reference
groups which obviously must typically be considered by the profes
sionals in their work environment.' Apparently, all the professionals
feel that the general public "thinks" about the profession in a much
different manner than those immediate reference groups of colleagues
and clients, except for the possible exception of Doctors, who showed
the highest degree of compatibility in semantic space between Cl-
General Public and the other concepts. Doctors may feel very secure
as a group in how the general public understands and appreciates them
as professionals.
Overlap in Meanings of Occupational Concepts Within Groups. Eval
uation of "D" distances between the occupational concepts within each
test group does not give a complete picture of how the concepts might
differ in meaning. Consequently, a systematic comparison of these con
cepts for each of the test groups through significant difference tests
of the word pairs used in the evaluation can show that there is some
overlap in meanings.^
For each given word pair, if the z value is less than -2.58 or
greater than +2.58, then the null hypothesis that "the means are equal"
^Appendix C, Tables 34-39.

71
can be rejected with 99 percent certainty. According to Osgood, if
any one of the word pairs of the set used to measure the concept is2different, then the total concepts should be considered different.
Consequently, an analysis of Table 11 shows that each profession
internally has significantly differing occupational images. However,
the extent of the differences varies. That is, for some of the groups,
there is overlap or closeness in certain aspects of the meanings for
each concept. For example, Table 11 shows that Nonprofessional Cl and
C2 concepts have a majority of meaning factors which are similar
TABLE 11
SUMMARY OF SIGNIFICANT DIFFERENCE TESTS BY NUMBER OF DIFFERING WORD PAIRS
BETWEEN OCCUPATIONAL CONCEPTS FOR EACH TEST GROUP
C1/C2Concept to
C1/C3 C1/C4ConceptC2/C3 C2/C4 C3/C4
Nonprofessionals 7 19 11 20 17 14
Professors 6 12 12 13 17 18
Doctors 12 17 15 10 10 9
Ministers 17 18 17 19 14 9
Accountants 16 12 20 20 13 19
Lawyers 20 20 20 10 19 13
(there is no significant difference between certain word pairs for the
2Charles E. Osgood, George J. Suci, and Percy H. Tannenbaum, The Measurement of Meaning (Urbana, Illinois: University of IllinoisPress, 1957), Chapter 3.

72
two concepts.) The only instances where cross comparisons of occupa
tional concepts within each test group do not show 50 percent or
greater similarity in meaning (no significant difference on 10 or more
word pairs) are (1) Nonprofessionals for Cl-People in General, and C2-
Colleagues, (2) Professors for Cl-People in General, and C2-Colleagues,
(3) Ministers for C3-You and C4-Clients, and (4) Doctors for the three
concepts C2-Colleagues, C3-You, and C4-Clients. Such overlapping in
terms of meaning would be expected from the analyses of the "D" dis
tances in Table 10.
Overall, the tendency is to differ within each group in terms of
perceptions of occupationally-determined images. All groups differ
significantly between concepts, even with the above exceptions of noted
similarities. Although C2-Colleagues and C4-Clients differ generally,
in terms of "D" they form a cluster vis-a-vis the other two images,
while Cl-People in General and C3-You are isolated relatively in
semantic space from one another and from the C2-C4 cluster. Thus, the
four professionally-determined images are significantly different from
one another for each of the test groups, although there is some over
lap in meanings.

CHAPTER IV
ANALYSES OF PRODUCT PERCEPTION MEASUREMENTS
The second phase of analyses shifts to comparisons of product
image perceptions as measured in the study. As with the analyses of
occupational images, this section is broken into two areas: first,
possible variations between the test groups are examined; then, var
iations between the images within each test group are sought. Such
analyses determine whether the test groups vary among themselves in
product perception and to what extent, and whether this variation is
related in any way to different types of products, or perhaps to
occupation.
Two opposite views ("most preferred" and "least preferred") of
three different products provide six different product images for each
group in the study. Two of the products, automobile and television,
are shopping goods in the traditional marketing sense, while the third
product, bath soap, is a convenience good, also by the traditional
definition. These three products serve as the bases for comparing
test group reactions in the first section of product perception
analyses.
73
74
Inter-Group Variations in "Most Preferred" and "Least Preferred11 Product Perceptions and Preferences
The sums of reactions of each test group to the six product con
cepts are compared by the three different products. For each of the
three products, the "most preferred" perception is tested for signifi
cant differences between groups, "D" distances between groups, and
actual products noted by the respondents, followed by the same series
of analyses for the "least preferred" concept.
Concepts 5 and 6: Automobiles. As a major shopping good, auto
mobiles possess several characteristics which make them uniquely im
portant to American consumers. First, the high cost and relatively
long use life are important. The automobile is generally a highly
socially visable product, i.e., other people "see" the car and the
owner together and frequently make significant judgments about both,
independently and in an interrelated sense. The "ideal" automobile
(most preferred) should reflect the orientation of an individual in a
positive sense, just as the opposite image should reflect the negative
thinking or judgments. If an individual or a group possesses a strong
orientation, it should be mirrored in some way in the perceptions of
this significant product.
Automobile "Most Preferred". Table 12 examines possible signifi
cant differences in images for "The Automobile Which You Would Most
Prefer to Own (Not Necessarily The One You Do Own)." Patterns of
thinking emerge as close, with no significant differences showing up
between the groups at the .10 level or greater. Apparently, a "pre
ferred automobile" is viewed in very similar terms by all the groups.
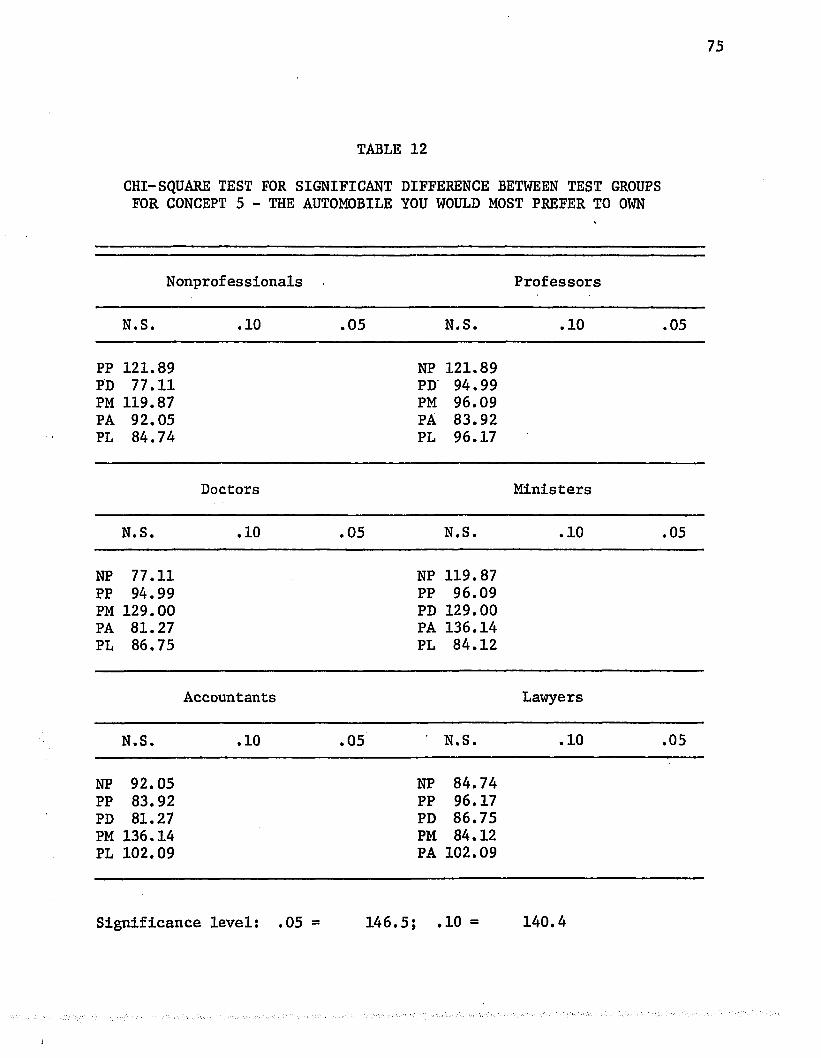
TABLE 12
CHI- SQUARE TEST FOR SIGNIFICANT DIFFERENCE BETWEEN TEST GROUPS FOR CONCEPT 5 - THE AUTOMOBILE YOU WOULD MOST PREFER TO OWN
Nonprofessionals Professors
N.S. .10 .05 N.S. .10 .05
PP 121.89 NP 121.89PD 77.11 PD 94.99PM 119.87 PM 96.09PA 92.05 PA 83.92PL 84.74 PL 96.17
Doctors Ministers
N.S. .10 .05 N.S. .10 .05
NP 77.11 NP 119.87PP 94.99 PP 96.09PM 129.00 PD 129.00PA 81.27 PA 136.14PL 86.75 PL 84.12
Accountants Lawyers
N.S. .10 .05 N.S. .10 .05
NP 92.05 NP 84.74PP 83.92 PP 96.17PD 81.27 PD 86.75PM 136.14 PM 84.12PL 102.09 PA 102.09
Significance level: .05 = 146.5; .10 = 140.4
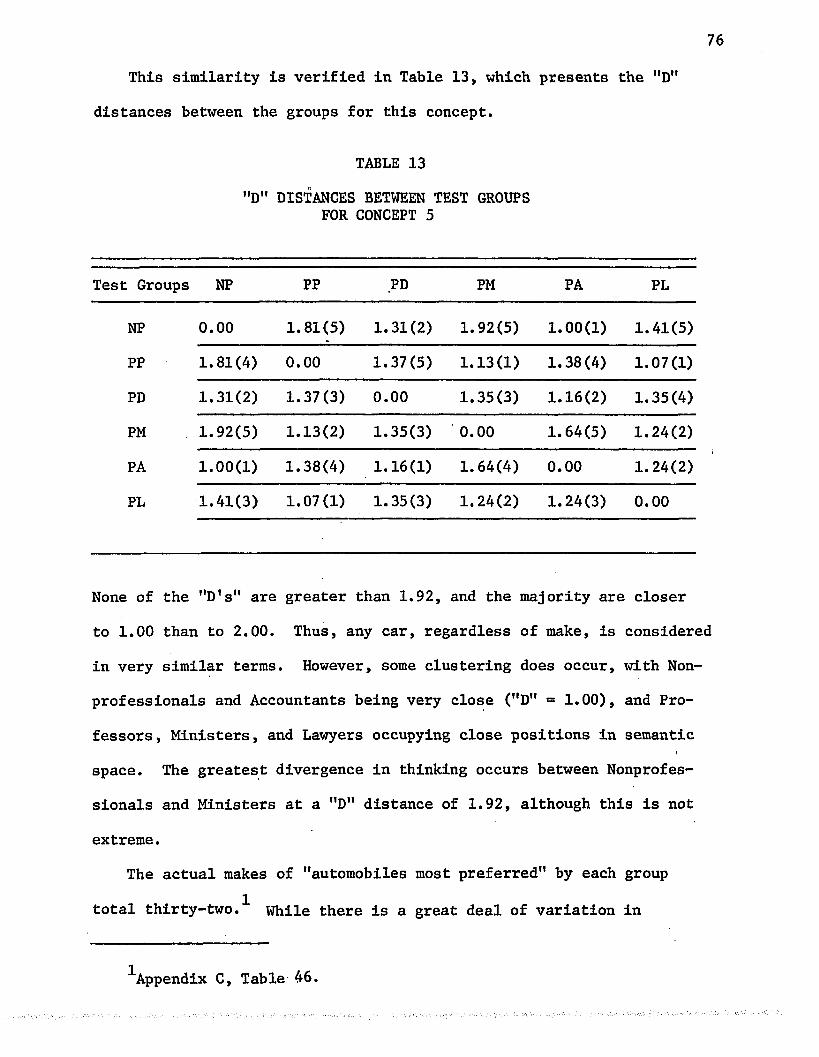
76
This similarity is verified in Table 13, which presents the "D"
distances between the groups for this concept.
TABLE 13
"D" DISTANCES BETWEEN TEST GROUPS FOR CONCEPT 5
Test Groups NP PP PD PM PA PL
NP 0.00 1.81(5) 1.31(2) 1.92(5) 1.00(1) 1.41(5)
PP 1.81(4) 0.00 1.37(5) 1.13(1) 1.38(4) 1.07(1)
PD 1.31(2) 1.37(3) 0.00 1.35(3) 1.16(2) 1.35(4)
PM 1.92(5) 1.13(2) 1.35(3) 0.00 1.64(5) 1.24(2)
PA 1 .00(1) 1.38(4) 1.16(1) 1.64(4) 0.00 1.24(2)
PL 1.41(3) 1.07(1) 1.35(3) 1.24(2) 1.24(3) 0.00
None of the "D's" are greater than 1.92, and the majority are closer
to 1.00 than to 2.00. Thus, any car, regardless of make, is considered
in very similar terms. However, some clustering does occur, with Non
professionals and Accountants being very close ("D" = 1.00), and Pro
fessors , Ministers, and Lawyers occupying close positions in semantic
space. The greatest divergence in thinking occurs between Nonprofes
sionals and Ministers at a "D" distance of 1.92, although this is not
extreme.
The actual makes of "automobiles most preferred" by each group 1total thirty-two. While there is a great deal of variation in
■^Appendix C, Table 46.

77
preference among the mentioned makes, at least two observations seem
relevant: first, Ministers seem to shy away from the typically very
expensive cars and concentrate on the medium priced lines; and second,
General Motors products dominate the preferences mentioned with
Cadillac, Buick, and Oldsmobile well established as the top three
(if all models mentioned in a particular line are combined, the
totals go even higher for the first three, as Riviera, Wildcat, and
Electra combined with Buick would put this make's total the highest
at 33). It is interesting to note that thirty-two different makes of
automobiles can be viewed in such highly similar terms. Orientation
to the positive image is apparently not significantly influenced by
occupation, but rather is related to some widely held ideal of what
a highly desirable automobile should be like.
Automobile "Least Preferred". When differences in thinking
about "The Automobile Which You Would Least Prefer to Own" are examined
in Table 14, a much different picture emerges than for the "most pre
ferred" makes. The variations for this negative product are signifi
cant in several ways. Immediately obvious is Ministers and their
isolation in terms of significant difference at the .05 level from all
the other groups except Professors. Further, Nonprofessionals are
different from Professors and Doctors at the .10 significance level.
It appears that the relative positioning in semantic space is important
for this concept, with all of the composite concepts representing each
group overlapping to some extent, except for Ministers, which only
overlap with Professors.
Additional evidence of variations in thinking about "automobile

78
TABLE 14
CHI-SQUARE TEST FOR SIGNIFICANT DIFFERENCE BETWEEN TEST GROUPS FOR CONCEPT 6 - THE AUTOMOBILE YOU WOULD LEAST PREFER TO OWN
Nonprofessionals Professors
N.S. .10 .05 N.S. .10 .05
PAPL
129.94136.63
PP 143.61 PD 144.45
PM 190.16 PD 96.20 PM 127.13 PA 104.92 PL 122.39
NP 143.61
Doctors Ministers
N.S. •10 .05 N.S. .10 .05
PPPAPL
96.20132.30125.03
NP 144.45 PM 150.48 PP 127.13 NP 190.16 PD 150.48 PA 184.57 PL 157.00
Accountants Lawyers
N.S. .10 .05 N.S. .10 .05
NPPPPDPL
129.94104.92132.3099.40
PM 184.57 NP 136.63 PP 122.39 PD 125.03 PA 99.40
PM 157.00
Significance level: .05 = 146.5; .10 = 140.4

79
least preferred" Is found In Table 15, which presents the "D" distances
between the groups. Ministers and Professors are very close ("D" =
0.95). Relative closeness exists between Nonprofessionals and Account
ants at "D" = 1.95 and between Accountants and all the other groups
except Ministers, and between Lawyers and all the others except Non
professionals. Thus, the importance of the relative positioning in
semantic space arises again. The clouds are apparently very dispersed.
TABLE 15
"D" DISTANCES BETWEEN TEST GROUPS FOR CONCEPT 6
Test Groups . NP PP PD PM PA PL
NP - 0.00 2.88(5) 2.65(5) 3.11(5) 1.95(4) 2.07(5)
PP 2.88(4) 0.00 1.26(1) 0.95(1) 1.92(3) 1.36(2)
PD 2.65(3) 1.26(2) 0.00 1.53(3) 1.53(2) 1.49(3)
PM 3.11(5) 0.95(1) 1.53(2) 0.00 2.29(5) 1.72(4)
PA 1.95(1) 1.92(4) 1.53(2) 2.29(4) 0.00 1.25(1)
PL 2.07(2) 1.36(3) 1.49(4) 1.72(2) 1.25(1) 0.00
Clustering seems to be occurring with Doctors, Accountants, and Lawyers
with the other groups positioned around this cluster. Nonprofessionals
are consistently most distant in terms of "D" for the total group and
probably have the least degree of agreement, thus creating a dispersed
cloud representing the entire group.
In terms of the actual automobile makes "least preferred", there
are fewer designated names (27 as opposed to 32 for "most preferred")

802and a greater tendency to concentrate on particular makes. Rambler
and Volkswagen top the disliked list with 52 and 34 mentions respec-»tively. Interestingly, of the top five "least preferred" automobiles,
three are foreign makes (Volkswagen, Renault, and Fiat). Among the
groups, there does not appear to be any general tendency for dislike
except for the concentration of Nonprofessionals and Accountants
against Ramblers.
From the above evidence, it appears that the groups exhibit greater
variation in thinking about automobile "least preferred" than "most
preferred" in terms of the actual images which exist. There may be
more ways to perceive an automobile negatively than to perceive it
positively.
Concepts 7 and 8: Television Receivers. Although television
receivers are also traditionally classified as shopping goods, they
are not as "strong" in certain characteristics as automobiles. While
the use life of a television set may be longer on the average than the
automobile, at least for the initial purchaser, its price is signifi
cantly lower and it does not have high social visibility, except to
those who actually visit in the consumer's home. However, the various
brands of television receivers do have distinct images, and just as
with automobiles, the consumer may well relate his general orientation
in thinking to the various brands.
Television "Most Preferred". The test groups exhibit feelings sim
ilar to those for automobiles in their reactions to the second shopping
2Appendix C, Table 47.

81
good, television sets. Tables 16 and.17 are concerned with concept
C7 - "The Brand of Television Which You Would Most Prefer To Own (Not
Necessarily the One You Do Own)." The chi-square test for significant
difference between the tested groups for concept C7, seen in Table 16,
show very close agreement with no significant differences existing at
the .10 level or higher. Thus, as with the automobiles, there appears
to be a high degree of similarity in the groups' thinking about "most
preferred" television sets.
The "D" distances between each of the groups with respect to C7
(Table 17) validate the closeness in thinking between the test groups.
The greatest "D" lies between Nonprofessionals and Ministers at 1.88,
while the smallest "D" is 1.05 between Accountants and Lawyers. This
tendency for closeness signals relatively high agreement in terms of
where the meanings for this concept lie in semantic space. There is.
no evidence of any specific clustering, just for all the groups in
total.
With only nine brands mentioned, there is further evidence that3thinking about C7 is very limited. Two brands, Zenith and RCA, domin
ate the preference poll with 79 and 64 votes respectively. Overall,
the preference range is much narrower than for automobiles "most pre
ferred". Thus, preference for television set "most preferred" is
similar in meaning among the test groups and highly concentrated among
a few brands.
3Appendix C, Table 48,

82
TABLE 16
CHI-SQUARE TEST FOR SIGNIFICANT DIFFERENCE BETWEEN TEST GROUPS FOR CONCEPT 7 - BRAND OF TELEVISION MOST PREFERRED
Nonprofessionals Professors
N.S. .10 .05 N.S. .10 .05
PP 121.78 NP 121.78PD 83.13 PD 116.63PM 93.94 PM 105.67PA 93.28 PA 71.27PL 91.31 PL 107.78
Doctors Ministers
N.S. .10 .05 N.S. .10 .05
NP 83.13 NP 93.94PP 116.63 PP 105.67PM 94.43 PD 94.43PA 95.11 PA 100.55PL 106.18 PL 81.80
Accountants Lawyers
N.S. .10 .05 N.S. .10 .05
NP 93.28 NP 91.31PP 71.27 PP 107.78PD 95.11 PD 106.18PM 100.55 PM 81.80PL 89.07 PA 89.07
Significance level: .05 = 146.5; .10 = 140.4
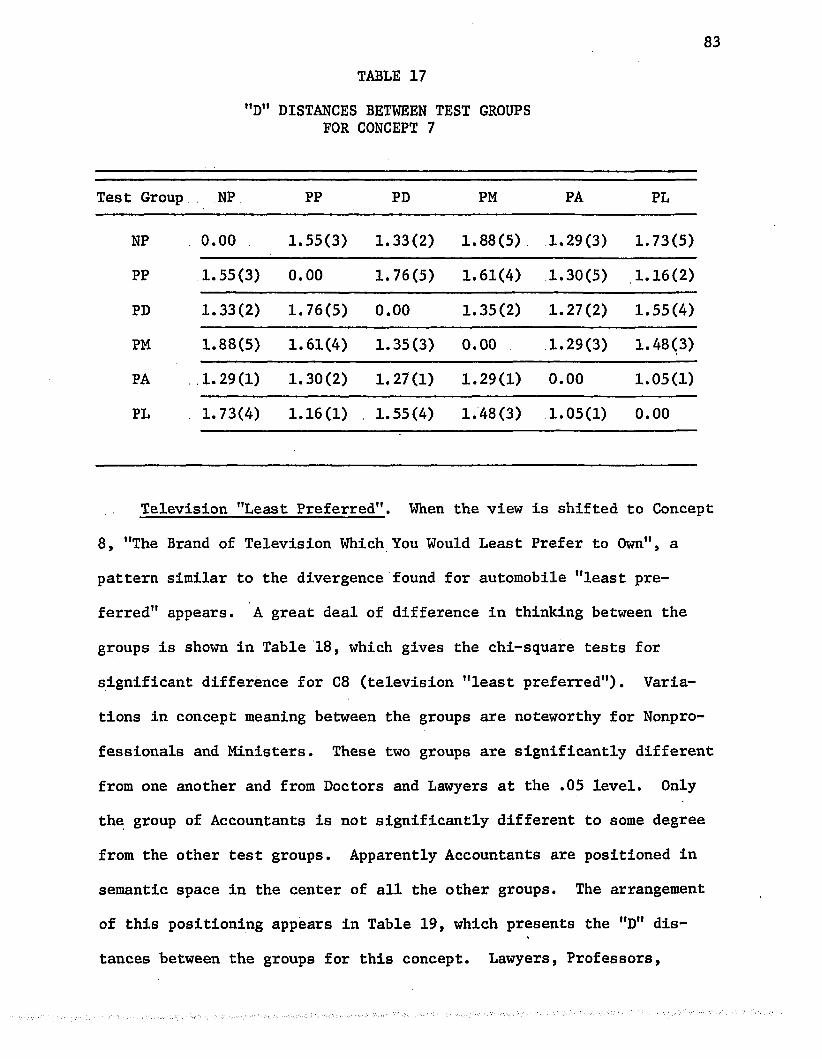
83
TABLE 17
"D" DISTANCES BETWEEN TEST GROUPS FOR CONCEPT 7
Test Group NP PP PD PM PA PL
NP 0.00 1.55(3) 1.33(2) 1.88(5) 1.29(3) 1.73(5)
PP 1.55(3) 0.00 1.76(5) 1.61(4) 1.30(5) 1.16(2)
PD 1.33(2) 1.76(5) 0.00 1.35(2) 1.27(2) 1.55(4)
PM 1.88(5) 1.61(4) 1.35(3) 0.00 1.29(3) 1.48(3)
PA 1.29(1) 1.30(2) 1.27(1) 1.29(1) 0.00 1.05(1)
PL 1.73(4) 1.16(1) 1.55(4) 1.48(3) 1.05(1) 0.00
Television "Least Preferred". When the view is shifted to Concept
8 , "The Brand of Television Which You Would Least Prefer to Own", a
pattern similar to the divergence found for automobile "least pre
ferred" appears. A great deal of difference in thinking between the
groups is shown in Table 18, which gives the chi-square tests for
significant difference for C8 (television "least preferred"). Varia
tions in concept meaning between the groups are noteworthy for Nonpro
fessionals and Ministers. These two groups are significantly different
from one another and from Doctors and Lawyers at the .05 level. Only
the group of Accountants is not significantly different to some degree
from the other test groups. Apparently Accountants are positioned in
semantic space in the center of all the other groups. The arrangement
of this positioning appears in Table 19, which presents the "D" dis
tances between the groups for this concept. Lawyers, Professors,

84
TABLE 18
CHI-SQUARE TEST FOR SIGNIFICANT DIFFERENCE BETWEEN TEST GROUPSFOR CONCEPT 8 - BRAND OF TELEVISION LEAST PREFERRED
Nonprofessionals Professors
N.S. .10 .05 N.S. .10 .05
PA 117.87 PP 141.39 PD 163.10 PM 155.23 PL 169.79
PDPMPAPL
124.48105.3789.53
114.46
NP 141.39
Doctors Ministers
N.S. .10 .05 N.S.. .10 .05
PP 124.48 NP 163.10 PP 105.37 NP 155.23PA 134.32 PM 178.52 PA 124.52 PD 178.52PL 128.97 PL 166.28
Accountants Lawyers
N.S. .10 .05 N.S. .10 .05
NP 117.87 PP 114.46 NP 169.79PP 89.53 PD 128.97 PM 166.28PD 134.32 PA 114.87PM 124.52PL 114.87
Significance level: .05 = 146.5; .10 = 140.4

85
Doctors, and Ministers are located close to one another and to Account
ants, while Nonprofessionals obviously position away on the opposite
side of Accountants, focus of the entire grouping. Nonprofessionals
are apparently very dispersed in meaning, as they do overlap Account
ants since there is not any significant difference between the two
according to the chi-square test, and they are 1.71 "D" in semantic
space from the Accountants.
TABLE 19
"D" DISTANCES BETWEEN ' FOR CONCEPT 8
TEST GROUPS
Test Group NP PP PD PM PA PL
NP 0.00 2.43(5) 2.00(5) 2.37(5) 1.71(5) 1.93(5)
PP 2.43(5) 0.00 1.13(3) 0.94(1) 1.14(3) 0.98(2)
PD 2.00(3) 1.13(3) 0.00 1.36(4) 1.04(2) 0.98(2)
PM 2.37(4) 0.94(1) 1.36(4) 0.00 1.22(4) 1.14(4)
PA 1.71(1) 1.14(4) 1.04(2) 1.22(3) 0.00 0.95(1)
PL 1.93(2) 0.98(2) 0.98(1) 1.14(2) 0.95(1) 0.00
The diversity in meanings for television "least preferred" is
seen further in "Specific Brands of Television Sets Least Preferred to4Own." Twenty-five different brands are mentioned for this negative
product, as opposed to only nine noted for the same product "most
4Appendix C, Table 49,

86
preferred." Unlike the "most preferred" brands, which were highly
concentrated for two brands, the "least preferred" images are scattered
among several brands, with eight makes getting nine or more mentions.
Even General Electric, at the top of the list with 28 mentions, does
not exhibit any notable patterning with respect to a given group,
except possibly for Professors and Ministers at six and eight mentions
respectively.
Overall, images for the "most preferred" television are concen
trated in both meaning and focus on particular brands, while the images
for television "least preferred" are significantly different in several
instances and applied to a wide variety of brands. Thus, as with auto
mobiles, the negative product images are the most sharply distinguished
between the test groups.
Concepts 9 and 10; Bath Soaps. The final product tested, bath
soap, is a convenience product rather than a shopping good like auto
mobiles and television receivers. In terms of significance to the con
sumer, it should be less critical "socially" than either of the others,
as this product is used in a strictly personal context. Further, it
is not expensive, has a high usage rate, and has more basically func
tional reasons for purchase. Overall, bath soap requires very little
commitment by the consumer and would, therefore, not likely reflect very
many deep-seated feelings or orientations.
Bath Soap "Most Preferred". Table 20 presents results of chi-
square tests for significant difference between groups for concept C9,
"The Name of the Bath Soap Which You Most Prefer to Use (Not Necessarily
the One Actually Used)." As with the other products, there is high

TABLE 20
CHI-SQUARE TEST FOR SIGNIFICANT DIFFERENCE BETWEEN TEST GROUPS FOR CONCEPT 9 - BRAND OF BATH SOAP MOST PREFERRED
Nonprofessionals Professors
N.S. .10 .05 N.S. .10 .05
PPPMPAPL
122.28 PD 141.14 Np 77.01 PD
108.08 PM 138.00 PA
PL
122.28122.9280.4757.1876.73
Doctors Ministers
N.S. .10 .05 N.S'. .10 .05
PP 122.92 NP 141.14 NP 77.01PM 131.89 PP 80.47PA 119.79 PD 131.89PL 94.26 PA 87.45
PL 117.03
Accountants Lawyers
N.S. .10 .05 N.S. .10 .05
NP 108.08 NP 138.00PP 57.18 PP 76.73PD 119.79 PD 94.26PM 87.45 PM 117.03PL 86.38 PA 86.38
Significance level: .05 = 146.5; .10 = 140.4

88
agreement among the tested groups for this concept, with only one case
of difference seen between Nonprofessionals and Doctors at the .10
level of significance. Even with this one instance of dis-similarity
in thinking, it appears that there is a high degree of compatibility
in thinking about this product among the test groups.
Table 21 validates the closeness of the groups in thinking through
a presentation of the "D11 distances between the groups for this concept.
TABLE 21
"D" DISTANCES BETWEEN TEST GROUPS FOR CONCEPT 9
Test Group NP PP PD PM PA PL
NP 0.00 1.99(5) 1.40(3) 1.41(4) 1.49(5) 2.25(5)
PP 1.99(4) 0.00 1.41(4) 1.36(3) 0.98(1) 1.08(1)
PD 1.40(1) 1.41(3) 0.00 1.09(1) 1.37(4) 1.45(3)
PM 1.41(2) 1.36(2) 1.09(1) 0.00 1.32(3) 1.65(4)
PA 1.49(3) 0.98(1) 1.37(2) 1.32(2) 0.00 1.24(2)
PL 2.25(5) 1.08(4) 1.45(5) 1.65(5) 1.24(2) 0.00
Only Nonprofessionals and Lawyers are relatively far apart with a 2.25
"D". Professors and Accountants are relatively close together in sem
antic space with a 0.98 "D", while the other distances range between
1.08 and 1.99 "D". Obviously, the "clouds" of meanings are not ex
tremely concentrated, and the groups do apparently overlap on this
concept.

89
As to actual brands of soap specifically mentioned, 24 different
preferences were noted, with over one-third (66) of the respondents
preferring the number one choice, Dial."* While not as narrow a pre
ference range as for television, the range for "soap most preferred"
is narrower than that .for "automobile most preferred."
Bath Soap "Least Preferred". Shifting to concept CIO, "The Name
of the Bath Soap Which You Would Least Prefer to Use", Table 22 shows
that significant differences between the groups for this negative pro
duct concept continue in the same pattern as those exhibited for the
other two negative product concepts, i.e., there are several instances
of significant difference. All groups except Ministers appear to be
in close agreement with Doctors. In fact, Ministers are significantly
different from all other groups at the .10 level or greater, except for
Nonprofessionals. The only other group similar to Nonprofessionals is
Doctors, with each of the others being significantly different at the
.05 level. However, Doctors and Ministers are significantly different
at the .05 level. Thus, Professors, Doctors, Accountants, and Lawyers
are not significantly different from one another, but Nonprofessionals
and Ministers are each significantly different from at least three of
the others.
Table 23 presents the "D" distances between the groups for this
concept. Professors, Doctors, and Lawyers are extremely close and form
a cluster in semantic space. Ministers are also relatively close to
this cluster, but are apparently very compact and do not overlap, since
5Appendix C, Table 50.

90
TABLE 22
CHI-SQUARE TEST FOR SIGNIFICANT DIFFERENCE BETWEEN TEST GROUPS FOR CONCEPT 10 - BRAND OF BATH SOAP LEAST PREFERRED
Nonprofessionals Professors
N.S. .10 .05 N.S. .10 .05
PD 132.41 PP 164.24 PD 105.56 PM 145.54 NP 164.24PM 129.94 PA 173.97 PA 125.37
PL 198.34 PL 124.45
Doctors Ministers
N.S. .10 .05 N.S. .10 .05
NP 132.41 PM 151.71 NP 129.94 PP 145.54 PD 151.71PP 105.56 PA 141.62 PL 182.31PA 140.23PL 100.64
Accountants Lawyers
N.S. .10 .05 N.S. .10 .05
PP 125.36 PM 141.62 NP 173.97 PP 124.45 NP 198.34PD 140.23 PD 100.64 PM 182.31PL 119.91 PA 119.91
Significance level: .05 = 146.5; .10 = 140.4
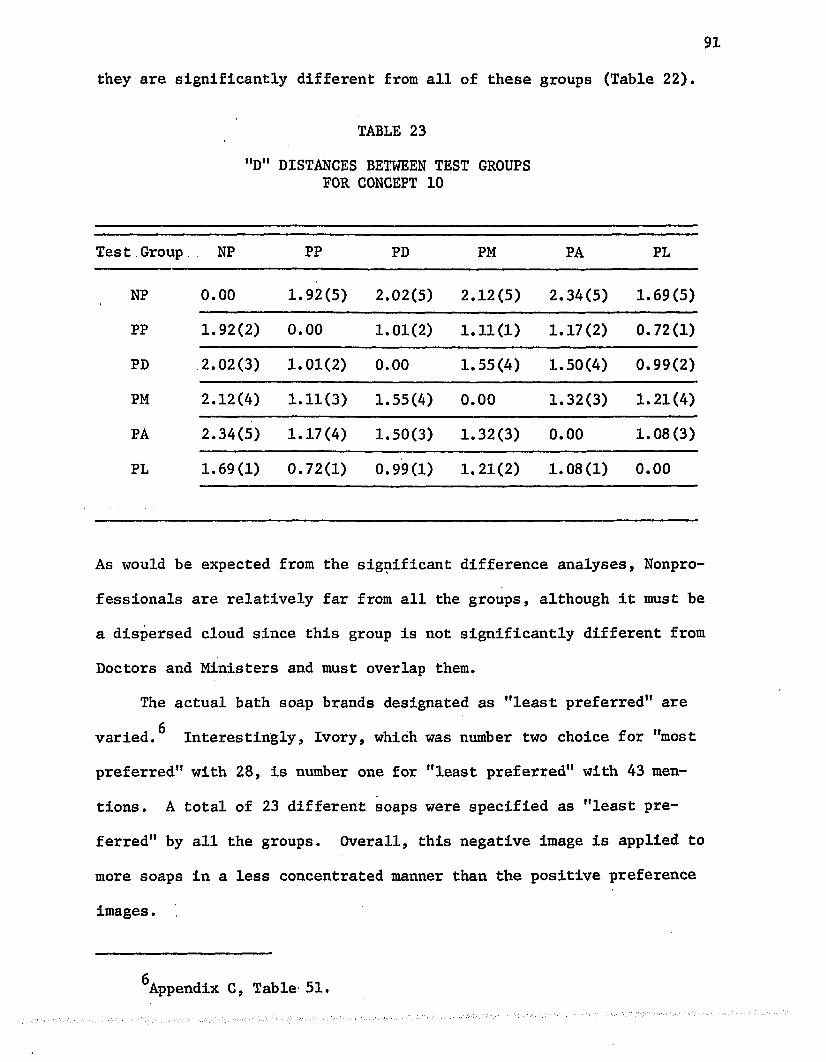
91
they are significantly different from all of these groups (Table 22).
TABLE 23
"D" DISTANCES BETWEEN TEST GROUPS FOR CONCEPT 10
Test Group NP PP PD PM PA PL
NP 0.00 1.92(5) 2.02(5) 2.12(5) 2.34(5) 1.69(5)
PP 1.92(2) 0.00 1.01(2) 1.11(1) 1.17(2) 0.72(1)
PD 2.02(3) 1 .01(2) 0.00 1.55(4) 1.50(4) 0.99(2)
PM 2.12(4) 1.11(3) 1.55(4) 0.00 1.32(3) 1.21(4)
PA 2.34(5) 1.17(4) 1.50(3) 1.32(3) 0.00 1.08 (3)
PL 1.69(1) 0.72(1) 0.99(1) 1.21(2) 1.08(1) 0.00
As would be expected from the significant difference analyses, Nonpro
fessionals are relatively far from all the groups, although it must be
a dispersed cloud since this group is not significantly different from
Doctors and Ministers and must overlap them.
The actual bath soap brands designated as "least preferred" are
varied. Interestingly, Ivory, which was number two choice for "most
preferred" with 28, is number one for "least preferred" with 43 men
tions. A total of 23 different soaps were specified as "least pre
ferred" by all the groups. Overall, this negative image is applied to
more soaps in a less concentrated manner than the positive preference
images.
^Appendix C, Table 51.

92
As with the other two products, the groups responded to the
positive product image in a highly consistent manner and to the nega
tive with a greater degree of disagreement. In terms of the latter
divergence, Nonprofessionals and Ministers differ most from the other
groups.
In reviewing the analyses of product perceptions between groups,
two conclusions stand out: (1) "most preferred" images for each given
test product are perceived similarly by all the groups, with only one
exception between two of the groups for one of the products, and (2)
"least preferred" products are perceived more differently than similar
ly and more specifically.
For the first test product, automobiles, no significant difference
shows between the groups in terms of "most preferred" image, although
the image is applied to 32 different makes. However, the 27 noted
"least preferred" automobiles, of which there is noticeable mention of
foreign makes, has six cases of variation in image at the .10 level or
greater.
Highly similar in results to automobiles is television, the second
test product. Again, there is no significant difference between the
groups in images of television "most preferred", and the mentioned
brands are limited to nine, with a high concentration on the most popu
lar two, Zenith and RCA. But, as with automobiles, television "least
preferred" images are significantly different as they are applied to
25 mentioned brands.
The third test product, bath soap, produces the only case of dif
ference in image of "most preferred" product with a .10 level of signif
icant difference between two of the groups. Of the 24 brands noted for

93
"most preferred", one-third of the respondents select Dial. For the
"least preferred" bath soap, 23 brands are mentioned and, as with the
other two products, there are several cases of significant difference
between groups for this "negative" image.
Overall, the pronounced variations in perception between groups
occur with the negative images, those of products "least preferred".
Respondents in the test groups seemingly know what they dislike more
precisely and emphatically than they know what they like. Apparently,
if occupational orientations are reflected in product perceptions, then
they occur in the negative sense, i.e., certain occupations may sensi
tize their members to be more discriminating and analytical. From
the results of this study, such appears to be the case for Doctors,
Ministers, and Lawyers, at least for certain products.
The results of practically complete agreement by the test groups
on the positive "most preferred" images point to much greater general
izing than might be anticipated if the distinctly diverse backgrounds
of each occupation are considered.
Intra-Group Variations in Perceptions of "Most Preferred" and "Least Preferred" Products
Shifting from differences in product perceptions between groups
to such differences as may exist within groups, this section examines
each test group independently. First, the extent of differences based
on comparisons of respondent reactions to the paired product concepts
is determined. Next, the relationships between the product concepts
in terms of semantic space placement within each test group are devel
oped to show any patterning or overlap in the images which might be
held.

94
Comparison of "Most Preferred" and "Least Preferred1* Images by
Test Group. As with the occupational concepts, statistical compari
sons of the averages of responses for each word pair were used to test
for significant differences between the product concepts.^ For each
group, two images were generated for each of the three products, the
"most preferred" and the "least preferred." Summaries of the signifi
cance test results are found in Table 24. The figures represent the
number of word pairs out of twenty which showed significant difference
by producing a test result figure greater than +2.58 or less than -2.58.
Such figures occur with 99 percent certainty that the responses are
different.
TABLE 24
SUMMARY OF SIGNIFICANT DIFFERENCE TESTS BY NUMBER OF DIFFERING WORD PAIRS
BETWEEN PRODUCT CONCEPTS FOR EACH TEST GROUP
AutomobilesMP/LP
TelevisionMP/LP
Bath Soap MP/LP
Nonprof ess ionals 18 17 19
Professors 17 18 19
Doctors 16 18 19
Ministers 16 17 15
Accountants 15 . 18 17
Lawyers........ 16 17 18
7Appendix C, Tables 40-45.
95
The figures in Table 24 verify that the two opposing product
images are perceived significantly differently for all three products
by all six test groups. These results validate numerous other studies
which have dealt with differing images between brands of the same
product. Certainly, if consumers did not differentiate between the
diametrically opposing images used in this test, then questions could
be raised as to the significance of the products used in the test, or
even more broadly as to whether consumers do differentiate between
brands of the same product. However, the results here leave no doubt
as to the high degree of differentiation by the test groups between
"most preferred" and "least preferred" products.
Semantic Space Positioning of Product Concepts. Verification of
the preceding results appears when Table 25, showing "D" distances
between the product concepts, is examined. "D" distances between the
paired concepts for each product are great (C5 to C6, C7 to C8, C9 to
CIO). The elements of meaning are very opposed between each two con
cepts. Further, clustering of certain concepts is apparent. The
"most preferred" images (C5, C7, and C9) are forming one cluster, while
anoth"er is formed by the "least preferred" images (C6, C8, and CIO).
These latter clusters appear to be "tighter" (the concepts are closer)
than the "most preferred" clusters. This may indicate a more precise
negative perception of "bad" products, which may be applied with little
individual consideration beyond the decision that the product is, in
fact, "bad".
Each test group exhibits the same pattern in differentiating
ability for each of the products, i.e., the greatest differentiation

TABLE 25
"D" DISTANCES BETWEEN PRODUCT CONCEPTS WITHIN TEST GROUPS
Concept 5 Auto MP
Concept 6 Auto LP
Concept 7 TV MP
Concept 8 TV LP
Concept 9 Soap MP
Concept 10 Soap LP
NONPROFESSIONALS
Concept 5 0.00 11.62 2.71 10.16 3.70 9.48Concept 6 11.62 0.00 10.53 2.23 9.28 2.50Concept 7 2.71 10.53 0.00 9.14 2.65 8.54Concept 8 10.16 2.23 9.14 0.00 8.05 1.94Concept 9 3.70 9.28 2.65 8.05 0.00 7.47Concept 10 9.48 2.50 8.54 1.94 7.47 0.00
PROFESSORS
Concept 5 0.00 8.13 2.75 7.09 3.68 7.10Concept 6 8.13 0.00 7.12 1.93 5.30 1.76Concept 7 2.75 7.12 0.00 5.74 2.69 6.23Concept 8 7.09 1.93 5.74 0.00 4.15 1.92Concept 9 3.68 5.30 2.69 4.15 0.00 4.27Concept 10 7.10 1.76 6.23 1.92 4.27 0.00
DOCTORS
Concept 5 0.00 9.58 2.58 8.86 4.13 8.32Concept 6 9.58 0.00 8.44 1.96 6.23 2.13Concept, 7 2.58 8.44 0.00 7.64 2.93 7.45Concept! 8 8.86 1.96 7.64 0.00 5.77 2.39Concept 9 4.13 6.23 2.93 5.77 0.00 5.30Concept 10 8.32 2.13 7.45 2.39 5.30 0.00

TABLE 25 CONTINUED
Concept 5 Auto MP
Concept 6 Auto LP
Concept 7 TV MP
Concept 8 TV L P ___
Concept 9 Soap MP
Concept 10 Soap LP
MINISTERS
Concept 5 0.00 8.22 2.15 7.56 3.32 7.25Concept 6 8.22 0.00 7.62 1.56 6.11 1.66Concept 7 2.15 7.62 0.00 6.75 2.72 6.54Concept 8 7.56 1.56 6.75 0.00 5.36 1.32Concept 9 3.32 6.11 2.72 5.36 0.00 4.94Concept 10 7.25 1.66 6.54 1.32 4.94 0.00
ACCOUNTANTS
Concept 5 0.00 10.47 2.53 8.80 4.24 7.48. Concept 6 10.47 0.00 8.86 2.30 6.93 3.36
Concept 7 2.58 8.86 0.00 7.22 2.71 5.97Concept 8 8.80 2.30 7.22 0.00 5.52 2.01Concept 9 4.24 6.93 2.71 5.52 0.00 4.09Concept 10 7.48 3.36 5.97 2.01 4.09 0.00
LAWYERS
Concept 5 0.00 9.36 2.58 7.74 4.10 7.37Concept 6 9.36 0.00 7.77 2.15 5.85 2.41Concept 7 2.58 7.77 0.00 6.13 2.51 5.95Concept 8 7.74 . 2.15 . 6.13 0.00 4.47 1.85Concept 9 4.10 5.85 2.51 4.47 0.00 4.02Concept 10 7.37 2.41 5.95 1.85 4.02 0.00

98
between the "most preferred" and "least preferred" images in terms
of "D" is for the automobiles, the next greatest distance is for
television, and the least differentiation in terms of "D" between the
images for bath soap. Thus, for all groups, Concept 5, "Most Prefer
red Automobile," and Concept 6, "Least Preferred Automobile," are
separated the largest "D"s found in the matrices. Further, in all
groups, Concept 9, "Most Preferred Bath Soap," and Concept 10, "Least
Preferred Bath Soap," are closest of any pair of images for a given
product. It appears that each group distinguishes between-products
in terms of distinctiveness in differentiating between "most preferred"
and "least preferred." Automobiles are most clearly and distinctly
differentiated by positioning in semantic space, followed by televi
sions and bath soaps, in that order. Thus, each test group is consis
tent in stressing differences between different brands/makes, with the
differences appearing to become less pronounced as the product itself
changes in certain characteristics, i.e., in the case of the test pro
ducts there is a decreasing cost factor; a decline in the social visi
bility of the product; decreasing "commitment" to each of the products
in terms of time required for purchasing, owning, and use; and an
increasing potential for changing brands/makes moving from automobiles
down to bath soaps. These conclusions are further justified in an exam
ination of the individual test group clusters of "most preferred" and
"least preferred" product images.
In each group, Concept 5, "Most Preferred Automobile," and Concept
9, "Most Preferred Bath Soap," are most distant in "D" within the "most
preferred" cluster. Concept 7, "Most Preferred Television," locates
99
somewhat equidistant between C5 and C9 within each group's cluster.
These results appear to verify the variations in differentiating
products in terms of "most preferred" and "least preferred" noted
above.
Examining the "least preferred" cluster, there is a tendency for
these clusters to be relatively "tight" in comparison to the "most
preferred" clusters for each group. As with the preceding analyses,
the automobile and television are closest in semantic space, except
for Professors, indicating differing stress among the products in
terms of distinctly differentiating the images. In overall closeness
of "least preferred" images, Ministers are first, with Nonprofessionals
showing the most dispersed cluster.
From these analyses, it appears that when perceiving negatively
(least preferred) all groups tend to think in terms of "black." That
is, there is closeness in perception of such products with much less
variation than for the positive images (most preferred). For the
latter images, there appears to be no general tendency in perception,
i.e., there is no "white" or good image which is consistent. Disliked
products are viewed in more absolute terms than are liked products
which have more nebulous images.
The following generalizations about intra-group perceptions of the
tested product images are relevant:
(1) All groups exhibit highly significantly different images for
each tested product between "most preferred" and "least pre
ferred" brands/makes.
(2) The "good" images cluster (most preferred) and the "bad"
images (least preferred) cluster, with the clusters farther

100
away from one another than the component parts of each
cluster are distant from one another.
(3) For all groups, the cluster of "least preferred" images is
"tighter" (closer in "D"s than is the cluster of "most
preferred" images.
In conclusion, for all test groups, "most preferred" and "least
preferred" test products are significantly differentiated, with the
latter being more distinctly and consistently viewed. Further, there
is a ranking of the products from automobiles to bath soaps in terms
of decreasing strength of image differentiation. Thus, there is
variation by the respondents in reacting to different "types" of
products (shopping vs. convenience) and distinction in intensity of
image is even present between products of the same type, i.e., the
variation between the two shopping products, automobiles and televi
sion. While these results are of a general verification nature in
terms of other studies and the literature, the findings on the strength
and preciseness of negative images do raise some questions for future
research, as there is presently no information dealing specifically
with this phenomena.

CHAPTER V
ANALYSES OF INTRA-GROUP RELATIONSHIPS BETWEEN OCCUPATIONAL CONCEPTS AND PRODUCT CONCEPTS
This final section of test results examines relationships between
the occupationally-determined* concepts and the product-determined con
cepts. Specifically, "D" distance analyses establish the relation
ships between all ten concepts for each group in terms of concept
positions in semantic space. This is the heart of the study, for if
specific patterning occurs for the meanings, then influence relation
ships between occupational perceptions and product perceptions can be
inferred.
Overall Relationships between Occupational and Product Images
Using the occupational images as reference positions in semantic
space because they must exist (by definition if the individual is
employed he must have feelings about his job), an individual would per
ceive products in terms of various feelings and would establish an
image of the products somewhere in his semantic space vis-a-vis the
occupationally determined images. While the occupational images will
certainly change given time and varying circumstances, they are prob
ably more stable relatively than are product images, which not only
change with time and circumstances, but also vary considerably because
101

102
of the need variations which each consumer experiences. In effect,
the occupation as a reference point is likely to be more stable than
products as reference points in the individual's semantic space.
Consequently, while the occupational Images have been shown to differ,
they are still closely related and occupy close positions relatively
in their cluster in semantic space. The test data deal with how the
occupational cluster might be used by the occupational group in
structuring meanings about products in a very general way.
Table 26 divides the product concepts into two groups, "most
preferred" and "least preferred". Each grouping is presented in
terms of "D" distances to each of the occupationally-determined con
cepts. Examination shows that for all groups the cluster of "most
preferred" product concepts is closer to each of the occupationally-
determined concepts than is the cluster of "least preferred" concepts.
Thus, the positive product concepts cluster is positioned in semantic
space adjacent to and in some cases overlapping the cluster of occupa
tionally-determined concepts. The cluster of negative concepts ("least
preferred" Images) is located relatively far away in terms of "D" from
the clustering of the positive product and occupational concepts. The
relationship of the positive product concepts and the occupationally-
determined concepts is one of closeness in semantic space. Occupa
tionally-determined images are most closely related to images of pro
ducts "most preferred." As a generalization, it appears that if pro
ducts are to be accepted by consumers as "good" or "preferred," then
the consumer must be able to perceive that the product has "meanings"
which are closely related to the meanings he holds for his occupation.

TABLE 26
"D" DISTANCES BETWEEN PROFESSIONALLY DETERMINED CONCEPTS AND PRODUCT CONCEPTS FOR EACH TEST GROUP
NONPROFESSIONALS Most Least
PROFESSORS Most Least
DOCTORS Most Least
MINISTERS Most Least
ACCOUNTANTS Most Least
LAWYERS Most Least
People in GeneralAutomobile 3.74 8.96 3.29 6.05 3.71 8.28 4.43 5.53 5.09 7.64 5.04 6.84Television 3.22 7.85 2.99 5.05 3.06 7.89 3.85 4.85 4.05 6.47 4.72 5.92Bath Soap 2.07 7.07 2.33 5.07 3.34 7.22 2.88 4.63 3.34 5.16 4.26 5.16
ColleaguesAutomobile 3.50 8.92 3.03 6.69 3.16 8.39 3.34 6.42 3.68 7.72 3.32 7.02Television 3.12 7.70 3.06 5.74 2.86 7.91 2.83 5.83 2.72 6.28 4.72 5.81Bath Soap 2.08 6.94 2.60 5.63 3.21 7.39 2.68 5.54 2.31 4.93 4.26 5.10
YouAutomobile 2.86 10.90 2.73 8.37 3.21 9.36 2.65 8.51 3.25 9.41 3.18 8.22Television 2.77 9.65 3.00 7.27 3.03 8.89 2.54 7.77 3.03 7.96 3.54 7.01Bath Soap 2.51 8.93 3.78 7.35 3.95 8.34 3.62 7.55 3.43 6.60 3.60 6.35
ClientsAutomobile 3.50 9.47 2.98 7.04 3.26 9.00 3.08 7.24 3.60 8.74 2.80 7.64Television 3.14 8.24 3.15 6.11 3.00 8.56 2.62 6.56 2.66 7.29 2.53 6.32Bath Soap 1.92 7.52 2.99 5.95 3.57 7.97 3.07 6.23 2.74 5.90 2.47 5.73 103

104
Occupational Images as Reference Points for Product Images
Table 27 uses each test group's four occupational concepts as
points of reference in semantic space and arranges the six product con
cepts in rank order of "D" distance against each of the four. As with
Table 26, examination of Table 27 shows that for all groups the cluster
of "most preferred" product concepts is closest to the occupationally-
determined concepts cluster. The relative closeness of individual com
ponents of the "most preferred" products cluster to one another and to
each of the occupational concepts prevents any clear-cut general con
clusions as to which occupational concept is most closely related to
the positive images. However, some patterning emerges in terms of
which occupational images are used as points of reference by the indi
vidual test groups.
On a general basis, nonprofessionals tend to relate positive
product images most closely to C3 - "How You Feel About Your Profes
sion." The same holds true for Ministers. While there is no apparent
reason for these two groups to use C3 as a bench-mark, it may indicate
a degree of unconcern with others based on either security in one's
occupational position, or lack of concern with how others may per
ceive them in the occupational role, with correspondingly more concern
with one’s own personal satisfaction or viewpoint. If the latter is
true, then further research may prove that at least some occupations
are relatively independent of concern as to what others think of
them.
Lawyers generally relate the positive product images most closely
to C4 - "How You Think Your Clients Feel About You as a Practicing

105
TABLE 27
RANK ORDERING BY "D" DISTANCE OF PRODUCT CONCEPTS TO PROFESSIONALLY DETERMINED CONCEPTS
Cl-General Public. . C2-rColleagues C3-You C4-Clients
NONPROFESSIONALS Soap MP 2.07 Soap MP 2.08 Soap MP 2.51 Soap MP 1.92TV MP 3.22 TV MP 3.12 TV MP 2.77 TV MP 3.14Auto MP 3.74 Auto MP 3.50 Auto MP 2.86 Auto MP 3.50Soap LP 7.07 Soap LP 6.94 Soap LP 8.93 Soap LP 7.52TV LP 7.85 TV LP 7.70 TV LP 9.65 TV LP 8.24Auto LP 8.96 Auto LP 8.92 Auto LP 10.90 Auto LP 9.47
PROFESSORSSoap MP 2.33 Soap MP 2.60 Auto MP 2.73 Auto MP 2.98TV MP 2.99 Auto MP 3.03 TV MP 3.00 Soap MP 2.99Auto MP 3.29 TV MP 3.06 Soap MP 3.78 TV MP 3.15TV LP 5.05 Soap LP 5.63 TV LP 7.27 Soap LP 5.95Soap LP 5.07 TV LP 5.74 Soap LP 7.35 TV LP 6.11Auto LP 6.05 Auto LP 6.69 Auto LP 8.37 Auto LP 7.04
DOCTORS TV MP 3.06 TV MP 2.86 TV MP 3.03 TV MP 3.00Soap MP 3.34 Auto MP 3.16 Auto MP 3.21 Auto MP 3.26Auto MP 3.71 Soap MP 3.21 Soap MP 3.95 Soap MP 3.57Soap LP ,7.22 Soap LP 7.39 Soap LP 8.34 Soap LP 7.97TV LP 7.89 TV LP 7.91 TV LP 8.89 TV LP 8.56Auto LP 8.28 Auto LP 8.39 Auto LP 9.36 Auto LP 9.00
MINISTERSSoap MP 2.88 Soap MP 2.68 TV MP 2.54 TV MP 2.62TV MP 3.85 TV MP 2.83 Auto MP 2.65 Soap MP 3.07Auto MP 4.43 Auto tyP 3.34 Soap MP 3.62 Auto MP 3.08Soap LP 4.63 Soap LP 5.54 Soap LP 7.55 Soap LP 6.23TV LP 4.85 TV LP 5.83 TV LP 7.77 TV LP 6.56Auto LP 5.53 Auto LP 6.42 Auto LP 8.51 Auto LP 7.24
ACCOUNTANTS Soap MP 3.34 Soap MP 2.31 TV MP 3.03 TV MP 2.66TV MP 4.05 TV MP 2.72 Auto MP 3.25 Soap MP 2.74Auto MP 5.09 Auto MP 3.68 Soap MP 3.43 Auto MP 3.60Soap LP 5.16 Soap LP 4.93 Soap LP 6.60 Soap LP 5.90TV LP 6.47 TV LP 6.28 TV LP 7.96 TV LP 7.29Auto LP 7.64 Auto LP 7.72 Auto LP 9.41 Auto LP 8.74
LAWYERSSoap MP 4.26 Auto MP 3.32 Auto MP 3.18 Soap MP 2.47TV MP 4.72 Soap MP 4.26 TV MP 3.54 TV MP 2.53Auto MP 5.04 TV MP 4.72 Soap MP 3.60 Auto MP 2.80Soap LP 5.16 Soap LP 5.10 Soap LP 6.35 Soap LP 5.73TV LP 5.92 TV LP 5.81 TV LP 7.01 TV LP 6.32
, Auto LP 6.84 Auto LP 7.02 Auto LP 8.22 Auto LP 7.64
106
Professional." On the other hand, Doctors and Accountants both show
closeness between C2 - "How You Think Your Colleagues Feel About You
as a Practicing Professional" and their positive product cluster.
Thus, for these three test groups, there is concern for relationships
with significant professional reference groups. While all three
groups by necessity must not alienate their colleagues, due to pro
fessional accreditation and membership, the Lawyers, employed as
independents to a greater extent than the other two groups, may be
rightly more concerned with client relationships and with avoiding
any potential negative reactions by the clients. On the other hand,
the occupational centrism of the Doctors and Accountants may be
stronger, therefore causing them to place greater stress on compati
bility with colleagues.
Professors show no clear-cut distinction in relationships, being
generally equi-distant in "D" from each positive image cluster to all
the occupational concepts. The failure to relate specifically to any
one of the occupational images by the Professors may signal the vary
ing orientation of this test group. Some Professors are highly
student-orientated, and would relate to one concept (clients), others
may tend to structure their product orientations toward compatibility
with their colleagues, and so on. The net result of such diversity
would be the vague, non-specific relationships which emerge in the
study.
"How People in General View the Profession" (Cl) is not used as a
relating concept by any of the groups. Perhaps this reference is too
indistinct in definition for any of the groups to relate to in specific

terms. Thus, clearly defined reference groups would appear to be the
only relevant considerations.
Although five of the test groups show some tendency for relating
their positive product concepts more closely to one or another of the
professional concepts, there are no really distinct patterns or
differences. Such is not the case when the reverse situation is
studied, i.e., position patterning of the negative product concept
cluster away from the occupational concepts.
All test groups have their negative product image cluster posi
tioned farthest from C3 - "How You Feel About Your Profession." Thus,
it appears that products not purchased because of negative perceptions
may be more specifically significant in meaning to the individual and
his perceptions of himself vis-a-vis his occupation than are products
which are purchased. That is, respondents in each group can tell more
distinctly what they dislike in some products than what they like.
Further, all rank orders (except for Professors) position Bath Soap
Least Preferred relatively nearest, followed by Television Least Pre
ferred, and finally Automobile Least Preferred as the most distant in
"D" from all of the professional concepts. This is another indication
of variation in the importance of the products to the groups, as wit
nessed earlier in the analyses. The respondents obviously related to
products in varying degrees of intensity, with the importance of the
product to the consumer being the criteria for the response. The more
important the product, in this case of negative products ("least pre
ferred") , the greater the degree of negative reaction.
In summary, the only distinct relationships between the occupa
tional images and the clusters of product concepts seem to be for the

108
negative product concept cluster in terms of each group's tendency to
use C3 - "You" as a bench-mark for positioning the negative cluster
farthest away. The general positioning relationships in semantic
space of the occupational images and the positive product images,
("most preferred") is too indistinct to determine specific relation
ships. However, if it is assumed that the occupational images are
more stable, via continuous reinforcement over long periods beginning
with the occupational training, then these images may act as some of
the bench-marks against which products are compared to determine
acceptance. If a product is not perceived in terms of meanings which
are compatible, although not necessarily identical to the occupational
images, then it would be positioned away from the occupational set in
semantic space and would be rejected as acceptable by the consumer.
Thus, occupational images may form a meaning set which serves as a
basis for structuring product perception along both positive and
negative reactions.

CHAPTER VI
SUMMARY, CONCLUSIONS, AND IMPLICATIONS OF THE STUDY
The objectives of the research project reported in this study
are to distinguish differences in perception among sub-groups of an
occupational category and to seek relationships between occupation
ally-determined perceptions and product perceptions. In order to
accomplish these objectives, the preceding three chapters have system
atically examined the statistical results generated during the study.
Now the study is reviewed in total, and the results are applied
specifically to the hypotheses which served as the guidelines for the
study's development.
Format and Coverage of the Study
The study is concerned with five specific hypotheses dealing with
occupational perceptions, product perceptions, and their possible re
lationship. The hypotheses are:
A. There are significant differences in perception between each of the studied groups for the following occupationally-determined concepts:
1. How you think people in general (excluding colleagues andclients) view your profession as a whole.
2. How you think your colleagues feel about you as apracticing professional.
109

3. How you feel about your profession.
4. How you think your clients feel about you as a practicingprofessional.
B. There are significant differences within each of the studied groups between each of the four concepts in Hypothesis A.
C. There are significant differences in perception between each of the studied groups for the following products:
1. Automobile most preferred to own (not necessarily one owned).
2. Automobile least preferred to own.
3. Brand of television most preferred to own (not necessarily one owned).
4. Brand of television least preferred to own.
5. Brand of bath soap most preferred to use (not necessarily one used).
6. Brand of bath soap least preferred to use.
D. There are significant differences within each of the studied groups between "most preferred" and "least preferred" products.
E. The cluster of occupational concepts is more closely related to the cluster of "most preferred" products than it is to the cluster of "least preferred" products.
A review of the literature shows that although occupation is con
sidered to be a major contributing behavioral influence in many aspects
of an individual's life, there are ho studies which attempt to pinpoint
occupation's influence on consumption in other than a very broad, gen
eral manner. All such relationships, as reported in the literature by
other researchers, arrive at occupation's influence on consumption in
an indirect manner, i.e., occupation influences social class and status
and these factors influence consumer behavior.
To explore more direct relationships which might exist between
occupation and consumption, this study isolates five sub-groups of the

Ill
occupational family "professions" and studies each group in terms of
four occupationally-determined concepts and six product concepts. A
sixth test group composed of nonprofessionals is included as a control
group.
Respondents were selected from the adult population of Baton
Rouge, Louisiana, to produce thirty useable returns in each of the six
test groups. Each subject evaluated the following ten concepts:
1. How You Think People in General (Excluding Your Clients and Colleagues) View Your Profession as a Whole
2. How You Think Your Colleagues Feel About You as a Practicing Professional
3. How You Feel About Your Profession
4. How You Think Your Clients Feel About You as a Practicing Professional
5. The Automobile Which You Would Most Prefer to Own (Not Necessarily the One You Do Own)
6. The Automobile Which You Would Least Prefer to Own
7. The Brand of Television Which You Would Most Prefer to Own (Not Necessarily the One You Do Own)
8 . The Brand of Television Which You Would Least Prefer to Own
9. The Name of the Bath Soap Which You Most Prefer to Use (Not Necessarily the One Actually Used)
10. The Name of the Bath Soap Which You Least Prefer to Use
The responses of the subjects are measured by the semantic differ
ential, an evaluative instrument developed primarily by Charles Osgood
at the University of Illinois. The twenty-five scale semantic differ
ential used in this study permitted the subjects to indicate readily
the meaning of each given concept.
Statistical analyses of the responses determine inter- and intra-
112
group relationships between the concepts in terms of (1) significant
differences in meaning and (2) relative relationships of the meanings
in terms of "D" measurements in semantic space.
Having examined the background, techniques, and results of the
study, specific application to the hypotheses provides conclusions
and implications.
Tests of Hypotheses
Each hypothesis is examined in terms of the summary of statistical
evidence from the study as to whether it should be accepted or rejected.
Because of the multiple levels of interactions between the test groups
and the concepts examined, acceptance or rejection of the hypotheses
are qualified according to the individual sub-hypothesis.
Hypothesis A . Tests for significant differences between each of
the test groups for the four occupationally determined concepts reveal
variations between some of the groups for some of the concepts, but no
overall difference or non-difference. Therefore, generally the hypoth
esis is void, but each concept merits individual examination.
Of the four concepts in this group, Concept 1 - "How You Think
People in General (excluding Colleagues and Clients) View Your Profes
sion as a Whole" shows the most variation among the test groups. Law
yers are isolated most from the other groups in terms of "D" and are
significantly different from all the others at the .05 level. Likewise,
Doctors and Ministers are significantly different from all other groups
at the .05 level and are distant in semantic space from the others.
However, there is some similarity in perception of the concept between
Nonprofessionals, Professors, and Accountants, as they do not show sig
nificant difference in terms of chi-square, even though their "D"
113
distances are not consistently low. Thus, Doctors, Ministers, and
Lawyers are distinctly different from one another and the others in
perception of how they think the general public views their profes
sion, but the other three test groups are not different in perception
of this concept.
The three groups which differ in perception from the others may
be exhibiting characteristic professional centrism or cohesiveness.
Perhaps as groups they are conditioned to anticipate that the general
public will view their profession in-unique terms. However, the
Accountants, especially since all the respondents in this group were
Certified Public Accountants, should have also exhibited such feel
ings, unless as a group they are only unified in training and are not
instilled with any expectations about how the general public might
perceive their profession. The similarity of the Professors to the
Nonprofessionals might be anticipated, since all areas of the Louisiana
State University academic community are represented, then there is
likely to be great variation in interests, orientations, and expecta
tions, perhaps as great as the diversity in the heterogenous test
group of Nonprofessionals.
For C2 - "How You Think Your Colleagues Feel About You as a
Practicing Professional" all groups are in agreement in perception,
except for Doctors which differ significantly at the .05 level with all
the others.' In agreement with this variation in perception, Doctors
are greater than 2.00 in "D" from all the others, the only "D" scores
of this magnitude between groups for this concept. The tendency to
cluster in semantic space between Nonprofessionals, Professors, and

114
Accountants is also present in "D" analysis of this concept.
These results may indicate the very high internal cohesiveness
characteristic of the medical profession. Although the other profes
sional test groups have membership requirements, associations, codes
of ethics, and standards of conduct, none are as. stringent as for
Doctors. Further, there is generally a more competitive situation
among colleagues existing between the members of the other professions.
Such factors may tend to cause variation in how the colleagues view
one another, leading to a more muddled overall meaning.
The personally determined occupational concept, C3 - "How You Feel
About Your Profession," is viewed in somewhat similar terms between most
of the groups overall. However, significant difference exists between
Ministers and Professors and Accountants at the .05 level and between
Professors and Doctors and Lawyers at the .10 level. Thus, there is
not complete agreement, nor complete disagreement in meaning for C3,
although the former is the more general condition. Once more, Nonpro
fessionals, Professors, and Accountants tend to cluster with close "D".
The continued clustering of these three test groups seems to
indicate a definite variation in the cohesiveness of the groups, per
haps due to diversity in backgrounds of the respondents comprising the
test groups. In effect, the occupation per se for Professors and
Accountants seems not to have any broad conditioning effect on occupa
tional perceptions such as those measured in this study.
The final occupational concept, C4 - "How You Think Your Clients
Feel About You as a Practicing Professional," is distinguished mainly
by Doctors' significant difference at the .05 level from all groups

115except Accountants, and the .10 level difference between Accountants
and Ministers. Thus, Doctors continue to be generally divergent in
perception from other groups. Further, Nonprofessionals, Professors,
and Accountants form a cluster for C4, as with the other concepts.
Overall, there is variation in perception of the occupational
concepts among the groups, although there are also obvious similari
ties in thinking. Especially noticeable is the tendency for Doctors
to be different in their perceptions. Also, a marked tendency for
similarity exists between Nonprofessionals, Professors, and Account
ants, while Ministers and Lawyers tend to be more independent, although
not as much as Doctors. Thus, the only truly distinguishable group in
terms of distinctive perception for three out of four of the tested
occupational concepts is the Doctors.
The preceding results do point out some stratification in terms
of attitude variation and stress on particular reference groups among
the sub-groups of the occupational family professions. Such varying
sensitivity to reference group opinions is probably directly related to
differing degrees of impact by such reference groups on the different
professions, as such impact may be directly related to professional
success. Specifically, the Doctors, Ministers, and Lawyers seem to
view themselves uniquely and expect others to respond to them accord
ingly.
The overlap in perceptions of Professors, Accountants, and Nonpro
fessionals signals the inconclusiveness of using such a broad definition
as "professionals" to specify differences between occupational families
on at least the tested perceptions in this study. Therefore, the

116
occupational family designation is not meaningful, to be certain of
some characteristics the more specific designation must be used, i.e.,
pinpoint Doctors instead of "professionals."
Hypothesis B . The second hypothesis tests for anticipated signi
ficant differences between the occupational concepts within each group.
On the basis of the test results, this hypothesis is validated. How
ever, individual examination of each group shows variation in the
relationships of the concepts within each group and some patterning of
concept relationships common to all groups.
Nonprofessionals perceive C3 distinctly different and separate in
semantic space from the other three occupational concepts (Cl, C2, and
C4) which form a cluster. This same pattern holds for Professors.
However, for Professors another sub-cluster appears between C2 and C4,
Colleagues and Clients. This same sub-cluster is also present for
Doctors, Ministers, and Lawyers. Thus, four of the test groups appear
to perceive that C2-Colleagues and C4-Clients hold closely related,
although significantly different in meaning, views of the individuals
as practicing professionals. It would be anticipated that tiiese two
reference groups might be viewed in a similar fashion because of their
directness and importance in occupational contact with the profession
als. Further, Nonprofessionals may well not distinguish between
clients, colleagues, and the general public because of the lack of
differing impact \rtiich these three groups probably have as opposed to
the distinct importance of two of these groups to most professionals.
In contrast to the sub-clustering of C2 and C4, Cl-General Public
and C3-You images in five test groups are relatively isolated in

117
semantic space from one another and the C2-C4 cluster. However,
Doctors fall to conform to the above patterns, for this group shows
a high degree of agreement in perception of the four concepts vis-a-vis
relatively low "D" distances. Still, Doctors do maintain statistically
significantly different concepts. Thus, as a group, they appear to be
the most precise in their perceptions of the concepts.
In general, it appears that each test group perceives four dis
tinctly different occupational concepts, although C2 and C4 are closely
related in several cases. Further, Cl-General Public is not considered
relevant, at least as much as the other concepts, probably because it
is too vague and has only remote influence. Certainly, on the basis
of importance to the professionals, their clients and colleagues should
be more directly influential than the general public as reference
groups. The test results validate such relationships. Consequently,
these two reference groups would be the logical ones for these consum
ers to relate to if reference group influences are a significant factor
in the purchase of particular products.
Hypothesis C. The third hypothesis anticipates significant differ
ences between the test groups in perceptions of six different product
images ("most preferred" and "least preferred" images of three different
products.) The total hypothesis is only half validated by the test re
sults, i.e., there are numerous cases of significant difference between
the groups for all the "least preferred" products, but there is not any
significant difference between the groups for the "most preferred" con
cepts, except for one case at the .10 level between two groups (Doctors
and Nonprofessionals for bath soap).

118
For automobiles "most preferred" (C5) there is a strong consensus
of meanings with no significant difference among the groups and very
low (close to 1.00) "D"s between the groups. Thus, a high degree of
similarity in meaning is present among the different groups, even
though this image is applied to 32 different makes of automobiles.
But in contrast, the automobile "least preferred" image is signifi
cantly different among several groups as they apply the image to 27
different makes.
Although the above results hold for television in terms of no
significant difference between the groups on "most preferred" and
several cases of significant difference for "least preferred," there
is a much greater concentration in terms of brands mentioned, with
only nine noted for "most preferred" (79 for Zenith and 64 for RCA)
and twenty-five for "least preferred."
Bath soap, the third product, follows the’ same general patterning,
with the already noted exception of one case of significant difference
at the .10 level between two groups for the "most preferred" image.
Among the test groups, only Ministers exhibit consistent variation
from the other groups throughout the comparisons of product images.
Nonprofessionals appear to be most dispersed in terms of concept mean
ings, probably because of the heterogenous nature of the test group.
The results in this section of the analyses point to a heretofore
undiscovered phenomena in perceptions about products: the negative
images ("least preferred" products) appeared more distinct and pro
nounced than the positive image ("most preferred" products) and also
elicited the most divergent reactions in terms of significant
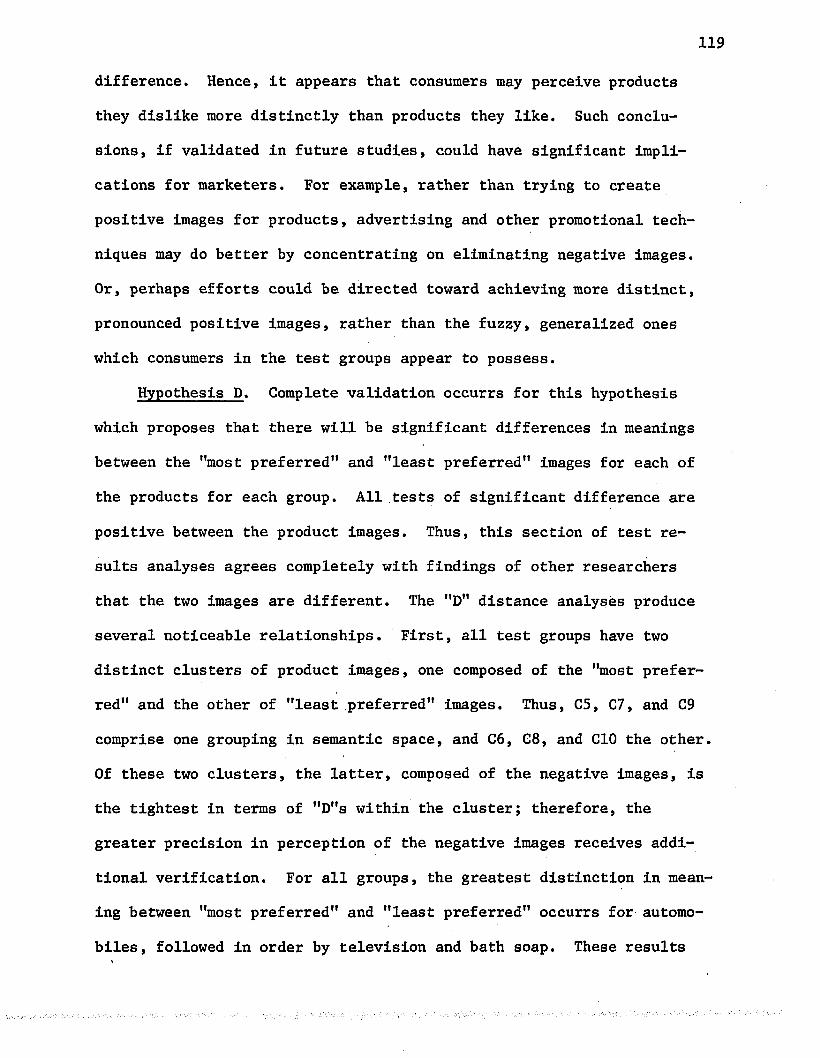
119
difference. Hence, it appears that consumers may perceive products
they dislike more distinctly than products they like. Such conclu
sions, if validated in future studies, could have significant impli
cations for marketers. For example, rather than trying to create
positive images for products, advertising and other promotional tech
niques may do better by concentrating on eliminating negative images.
Or, perhaps efforts could be directed toward achieving more distinct,
pronounced positive images, rather than the fuzzy, generalized ones
which consumers in the test groups appear to possess.
Hypothesis D . Complete validation occurrs for this hypothesis
which proposes that there will be significant differences in meanings
between the "most preferred" and "least preferred" images for each of
the products for each group. All tests of significant difference are
positive between the product images. Thus, this section of test re
sults analyses agrees completely with findings of other researchers
that the two images are different. The "D" distance analyses produce
several noticeable relationships. First, all test groups have two
distinct clusters of product images, one composed of the "most prefer
red" and the other of "least preferred" images. Thus, C5, C7, and C9
comprise one grouping in semantic space, and C6, C8, and CIO the other.
Of these two clusters, the latter, composed of the negative images, is
the tightest in terms of "D"s within the cluster; therefore, the
greater precision in perception of the negative images receives addi
tional verification. For all groups, the greatest distinction in mean
ing between "most preferred" and "least preferred" occurrs for automo
biles, followed in order by television and bath soap. These results

120
appear to point to a varying intensity of involvement by the respon
dents with the products. Such intensity of involvement may be dir
ectly related to degree of commitment by the respondents to the pro
ducts, based upon such factors as price, use rate, social visability,
and relative importance. Certainly, the relationships between posi
tive/negative images and product commitment would seem to merit future
study.
Hypothesis E . The final hypothesis focuses on the heart of this
study in projecting "the cluster of occupational concepts is more
closely related to the cluster of "most preferred" products than it is
to the cluster of "least preferred" products." Validation occurs for
all groups, using "D" relationships as the measuring device. Not only
are the occupationally-determined concepts closest in "D" to the "most
preferred" product concepts, but they are obviously immediately adja
cent and overlapping in meanings in several cases. However, no one
occupational concept emerges as the closest to the product images for
all groups. Nonprofessionals and Ministers relate the "most preferred"
product images generally closest to C3-You, the personal perception
concept, although the Ministers would be expected to be more concerned
with whether the socially visable products they consumed would be in
line with the expectations of their congregations and colleagues.
Doctors and Accountants appear to relate to C2-Colleagues, while Lawyers
relate most directly to C4-Clients. Professors are most uncommitted in
terms of related meanings of the concept clusters, being generally
equally related to all of the four occupational concepts. Cl-General
Public is not used by any of the five professional sub-groups, as this

•121
concept is not close to any of the "most preferred" concepts. Fur
ther, all test groups have perceptual meanings for the "least prefer
red" products located farthest from C3-You. This indicates further
that the negative images may be the strongest in relative terms, with
an individual's own personal perceptions being used as a bench-mark
against which the negative image is positioned. People may purchase
what they like because of others, or at least in line with other's
expectations, but they do not purchase something because they person
ally dislike it.
In terms of which "most preferred" product images are most closely
aligned with the particular occupational images, there is not high
consistent patterning among the groups. That is, there is no rank
ordering of the "D"s between the three products. However, for the
negative "least preferred" images there is extremely high consistency
in rank ordering, except for Professors which reverse the typical order
of the first two images. The rank order by "D" distance for the major
ity is: bath soap closest, television next, and automobiles farthest
away. This result appears to fit the previous observations that the
greater the commitment of the consumer to the product, the more dis
tinct and discerning they tend to be in the meanings for the products
they dislike.
In summary, the validation of Hypothesis E appears to indicate
that relationships do exist between occupationally determined images
and product images. However, the relationships vary by the professional
sub-group and type of product in the case of this study. Therefore, it
would appear to be erroneous for any marketer to categorize consumers
122
according to occupational family, rather the most realistic evaluation
can apparently be made only for the more narrowly defined specific
occupation.
Retrospect and Projection
This study is not extensive enough nor complete enough, either in
terms of respondents, occupations, products, or concepts tested to con
clude without hesitation that the preceding findings are substantial
enough to form a sound basis for seeking new marketing strategies and
techniques. But, the results of this study are substantial enough to
merit future studies which can more extensively probe the relationships
between occupationally determined images and product images. Further,
the appearance of relationships about negative product images should
point to the need for further studies in perceptions which are largely
ignored in structuring promotional plans.
One approach for future studies would be to define and break down
specific occupational characteristics, i.e., accountants are pragmatic,
functional, precise, and try to see if such characteristics appear in
products "most preferred" versus the opposite characteristics in pro
ducts not preferred. This would be a more direct measurement of
whether an orientation which is often a function of the occupation, at
least in part, may become a requirement by the consumer in certain pro
ducts .
In another vein, other positive meanings besides occupational con
cepts should be measured and then cross referenced in semantic space.
The positive area of perceptions may prove to hold numerous concepts,
some which, more easily defined than the occupational concepts, may

123
prove a better, more specific, key to predicting what aspects of
meaning a product should have to make it acceptable.
Some light has been shed on another set of influences on consumer
behavior. From this and future studies along the same lines, marketers
can gain better, more sophisticated knowledge that will enable them-to
better cope with the often mysterious consumer.

BIBLIOGRAPHY
Books
Barber, Bernard, Social Stratification. New York: Harcourt, Braceand Company, 1957, 540 pp.
Brink, Edward L., and William T. Kelley, The Management of Promotion.New Jersey: Prentice Hall, Inc., 1963, 417 pp.
Britt, Steuart H., Consumer Behavior and the Behavioral Sciences.New York: John Wiley and Sons, Inc., 1967, 585 pp.
Caplow, Theodore, The Sociology of Work. New York: McGraw-Hill BookCompany, 1954, 330 pp.
Cartwright, Dorwin, and Alvin Zander, Group Dynamics. New York:Harper and Row, 1960, 826 pp.
Centers, Richard, The Psychology of Social Classes. New Jersey:Princeton University Press, 1949, 244 pp.
Clark, Lincoln H., Consumer Behavior: Research on Consumer Reactions.New York: Harper and Brothers, 1958, 472 pp.
Cox, Keith K., Readings in Market Research. New York: Appleton-Century-Crofts, 1967, 386 pp.
Engel, James F., David T. Kollat, and Roger D. Blackwell, Consumer Behavior. New York: Holt, Rinehart and Winston, Inc., 1968,630 pp.
Fishbein, Martin, and Ivan D. Steiner, Current Studies in SocialPsychology. New York: Holt, Rinehart and Winston, Inc., 1965,532 pp.
Foote, Nelson N., Household Decision-Making. Vol. 4, New York: NewYork University Press, 1961, 349 pp.
Goffman, Erving, The Presentation of Self in Everyday Life. New York: Doubleday and Company, 1959, 255 pp.
Grossack, Martin M., Understanding Consumer Behavior. Boston: TheChristopher Publishing House, 1964, 325 pp.
124

125
Hartley, Eugene L., Eleanor E. MacCoby, and Theodore M. Newcomb, Readings In Social Psychology. New York: Holt, Rinehart andWinston, Inc., 1958, 674 pp.
Hartley, Eugene L., and Theodore M. Newcomb, Readings in Social Psychology. New York: Henry Holt and Company, 1947, 372 pp.
Hubert, Betty Ann Cowan, A Study of Self Concept and Occupational Choice as Measured by Q-Sort. University of Colorado:Unpublished Masters Thesis, 1966, 63 pp.
Kassarjian, Harold H., and Thomas S. Robertson, Perspectives in Consumer Behavior. Glenview, Illinois: Scott, Foresman andCompany, 1968, 559 pp.
Kerlinger, Fred N., Foundations of Behavioral Research. New York:Holt, Rinehart and Winston, Inc., 1964, 709 pp.
Krech, David, Richard S. Crutchfield, and Egerton Ballachey, Individual in Society. New York: McGraw-Hill Book Company, 1962, 564 pp.
Laumann, Edward 0., Prestige and Association in an Urban Community.New York: The Bobbs-Merrill Company, Inc., 1966, 218 pp.
Lundberg, George A., Clarence C. Schrag, and N. Larsen Otto, Sociology. New York: Harper and Brothers, 1958, 785 pp.
Lynn, Kenneth S., The Professions in America. Boston: Houghton MifflinCompany, 1965, 273 pp.
Mas low, A. H., Motivation and Personality. New York: Harper andBrothers, 1954, 411 pp.
McCarthy, E. Jerome, Basic Marketing, A Managerial Approach. Homewood, Illinois: Richard D. Irwin, Inc., 1967, 743 pp.
McNeal, James U., Dimensions of Consumer Behavior. New York: Appleton-Century-Crofts, 1965, 310 pp.
Mills, C. Wright, White Collar. New York: Oxford University Press,1951, 378 pp.
Mills, Donald L., and Howard M. Vollmer, Professionalization. Englewood Cliffs, New Jersey: Prentice Hall, Inc., 1966, 365 pp.
Moore, William E., Industrial Relations and the Social Order. New York: Macmillan and Company, 1946, 660 pp.
Osgood, Charles E., George J. Suci, and Percy Tennenbaum, The Measurement of Meaning. Urbana, Illinois: University of Illinois Press,1.964, 342 pp.

126
Parsons, Talcott, Essays In Sociological Theory. Glencoe, Illinois:The Free Press, 1949, 459 pp.
Roe, Anne, The Psychology of Occupations. New York: John Wiley andSons, 1956, 340 pp.
Rosenberg, Morris, Occupations and Values. Glencoe, Illinois: TheFree Press, 1957, 158 pp.
Shibutani, Tamotsu, Society and Personality. Englewood Cliffs, New Jersey: Prentice-Hall, Inc., 1961, 630 pp.
Shultz, William J., American Marketing. Boston: Wadsworth PublishingCompany, Inc., 1961, 655 pp.
Slocum, Walter L., Occupational Careers. Chicago: Aldine PublishingCompany, 1966, 272 pp.
Super, Donald E., The Psychology of Careers. New York: Harper andBrothers, 1957, 362 pp.
Stanton, William J., Fundamentals of Marketing. New York: McGraw-HillBook Company, 1967, 743 pp.
Wasson, Chester R., and David H. McConaughy, Buying Behavior andMarketing Decisions. New York: Appleton-Century-Crofts, 1968,540 pp.
Young, Kimball, Social Psychology. New York: Appleton-Century-Crofts,Inc., 1956, 632 pp.
Government Publications
United States Bureau of the Census, "Income in 1966 of Families and Persons in the United States," Current Population Reports.Series P-60, No. 53, Washington, D.C.: U. S. Government PrintingOffice, December 28, 1967, 51 pp.
Edwards, Alba, Comparative Occupational Statistics for the UnitedStates, 1870-1940. Washington, D.C.: Government Printing Office,1943, 206 pp.
Periodicals
Becker, H. S., and J. W. Carper, "The Development of Identification with an Occupation," American Journal of Sociology. Vol. 61, 1956, pp. 289-298.

127
Bogardus, Emory S., "Occupational Distance," Sociology and Social Research. Vol. 13, 1928-1929, pp. 73-81.
Briggs, Arthur E., "Social Distance Between Lawyers and Doctors,"Sociology and Social Research. Vol. 12, 1928-1929, pp. 156-163.
Centers, Richard, "Motivational Aspects of Occupational Stratification," Journal of Social Psychology. 1948, pp. 187-217.
Clelland, D. A., and W. A. Faunce, "Professionalization and Stratification Patterns in an Industrial Community," The American Journal of Sociology. Vol. 72, January, 1967, pp. 341-350.
Hall, 0., "The Stages of a Medical Career," American Journal of Sociology. Vol. 53, 1948, pp. 243-253.
Haller, A. 0., and D. M. Lewis, "The Hypothesis of IntersocietalSimilarity in Occupational Prestige Hierarchies," The American Journal of Sociology. Vol. 62, September, 1966, pp. 210-215.
Hatt, Paul K., "Class and Ethnic Attitudes," American Sociological Review. Vol. 13, February, 1948, pp. 36-43.
___________, "Occupation and Social Stratifications," American Journalof Sociology. Vol. 55, May, 1950, pp. 533-543.
Martineau, "Social Classes and Spending Behavior," Journal of Marketing. Vol. 23, October, 1958, pp. 121-130.
Reissman, Leonard, "Life Careers, Power, and the Professions: TheRetired Army General," American Sociological Review. Vol. 21, April, 1956, pp. 215-220.
Tilly, Charles, "Occupational Rank and Grade of Residence in a Metropolis," The American Journal of Sociology. Vol. 67, November, 1961, pp. 323-330.
Wardell, W. L., "The Reduction of Strain in a Marginal Social Role," American Journal of Sociology. Vol. 61, 1956, pp. 16-25.
Wardell, W. L., and A. L. Wood, "The Extra-Professional Role of the Lawyer," American Journal of Sociology. Vol. 61, 1956, pp. 304- 307.
Whyte, William H. Jr., "The Wives of Management," Fortune. Vol. 44, October, 1951, pp. 86-88.
Wilkinson, Forrest, "Social Distance Between Occupations," Sociology and Social Research. Vol. 13, 1928-1929, pp. 234-244.
Wispe, L. G., "A Sociometric Analysis of Conflicting Role Expectancies," American Journal of Sociology. Vol. 61, 1955, pp. 134-137.

APPENDIX A

METHODOLOGY
The methodology of this study was designed to show differences
and relationships in thinking about selected product and occupational
perceptions among five professional groups and a group of nonprofes
sionals. Accordingly, the following methodological framework was
developed.
First, the semantic differential technique was selected to
measure several meanings for occupations and products for each of the
respondents in the test. Next, the test was administered via mail
questionnaire, and the results were collected and tabulated. Finally,
analyses of the results provided material for the study as presented
in the main body of this report.
The Semantic Differential Technique
Variations in thinking about particular items or concepts among
individuals and between groups can be measured by the semantic differ
ential technique, as developed by Charles Osgood and others at the
University of Illinois.'*' Since its inception, this technique has been
widely used by researchers interested in observing, measuring, and2comparing the psychological meanings of "things," usually concepts.
Charles Osgood, George Suci, and Percy Tannenbaum, The Measurement of Meaning (Urbana, Illinois: University of Illinois Press, 1957),331 pp.
2Fred N. Kerlinger, Foundations of Behavioral Research (New York: Holt, Rinehart and Winston, 1964), pp. 564-580.
129
130
Generally, measurement Is made of connotatlve meanings which are
commonly held by individuals in what Osgood calls "semantic space."
This space is abstract, in that it exists in the minds of individuals.
However, because of the shared behavioral, verbal and cultural defini
tions of things among individuals, the meaning of a given thing can
be compared between individuals using dimensions of semantic space
which are common to the individuals.
The measurement of common dimensions becomes a basis for comparing
perceptions (meanings) held by individuals or groups. Based upon
extensive testing and validation, Osgood et. al. have isolated several
dimensions which are used by most people to structure their "meanings."3Evaluative, Potency, and Activity are three important dimensions used.
If each of these dimensions is measured relative to a given concept
for several individuals, then the individuals can be compared in terms
of varying degrees of the dimensions. Measurement of the dimensions is
based on bipolar adjectives, using a rating scale between the adjectives.
Adjective pairs, selected through extensive testing, measure one, some
times two, of the dimensions or factors that Osgood and his colleagues4have found to be commonly used in structuring meanings.
Thus, the semantic differential technique involves (1) selecting
concepts to be measured, (2) selecting bipolar adjectives which can be
used to describe these concepts, (3) measuring individual reactions to
the bipolar adjectives for each of the given concepts, and (4) comparing
3Evaluative is interpreted as "goodness," Potency as "strength,"
and Activity as "motion and action." Other dimensions have also been isolated and catalogued by Osgood.
4Kerlinger, 0£. cit., p. 567.

131
the meanings of the concepts as measured by the dimensions of semantic
space incorporated into the particular test.
To facilitate such comparisons, Osgood and his colleagues have
developed the D statistic, a measurement of total concept closeness
(all dimensions considered simultaneously) in semantic space. Such
measures between several concepts can show relative closeness (similar
ity in meanings) or divergence (differences in meanings).
In general, the semantic differential technique standardizes
measurements of meaning along given dimensions for concepts, and then
allows quantitative comparisons of the subjective meanings of the
concepts.
Concept, Scale, and Test Group Selection
The first step in use of the semantic differential technique is to
select the concepts which will be measured. For this study, ten con
cepts were chosen to provide possible insights into relationships
between occupationally determined thinking and product choices. Four
concepts related to occupation, while six concepts related to products.
While there are numerous concepts relating to occupation which
might be measured, the four selected were chosen on the basis of
analyzing four different perceptions of varying importance to the
individual. Three measure the meanings which the individual holds for
three different reference groups which influence his occupation, and
one is the individual perception personally held by the individual for
his occupation.
The reference groups vary in importance from the very broad
"people in general" to the more specific and directly influential

■13?
"colleagues" and "clients." Each of these groups is perceived by the
individual as viewing his occupation and him in different ways.
Exactly how different the meanings are is of concern in the test
objective. Thus, relationships between occupation and product percep
tion and in relative reference group importance were sought.
Product concepts were selected on the basis of potential varying
degrees of importance to the respondents. Thus, three different pro
ducts were selected that required differing degrees of commitment by
the individual in terms of cost, usage, social visibility, status, etc.
A further consideration was that the products should be commonly used
by all potential respondents of both sexes, all income levels, and all
occupations. Consequently, three common final consumer products meet
ing the above criteria were selected: automobiles, television receivers,
and bath soap. Further, each product was measured in terms of "most
preferred" and "least preferred" to determine whether these two ,opposing
perceptions did in fact differ and to determine any clustering of mean
ings in semantic space of a general nature, i.e., how the "most prefer
red" perceptions were related to one another, to the "least preferred"
images, and to the occupational images. In order to get the actual
brand which respondents were reacting toward, they were asked to fill
in by brand name each of the concepts.
After selecting the concepts to be measured, the next phase involved
determining which bipolar adjectives would be used to measure the con
cepts. Using adjective pairs validated by Osgood, twenty-five pairs were
selected on the basis of appropriateness in describing products."* The
5Osgood et^.al., oj>. cit., pp. 53-61.
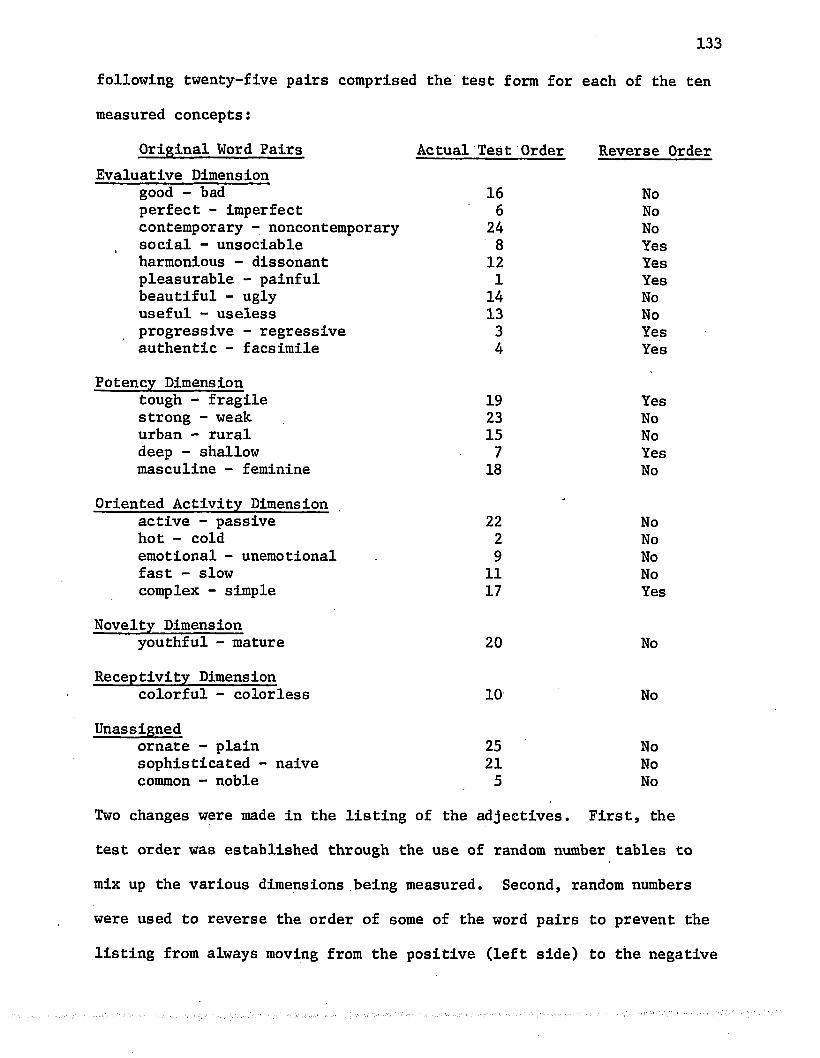
133
following twenty-five pairs comprised the test form for each of the ten
measured concepts:
Original Word Pairs Actual Test Order Reverse OrderEvaluative Dimension
good - bad 16 Noperfect - imperfect 6 Nocontemporary - noncontemporary 24 Nosocial - unsociable 8 Yesharmonious - dissonant 12 Yespleasurable - painful 1 Yesbeautiful - ugly 14 Nouseful - useless 13 Noprogressive - regressive 3 Yesauthentic - facsimile 4 Yes
Potency Dimensiontough - fragile 19 Yesstrong - weak 23 Nourban - rural 15 Nodeep - shallow 7 Yesmasculine - feminine 18 No
Oriented Activity Dimensionactive - passive 22 Nohot - cold 2 Noemotional - unemotional 9 Nofast - slow 11 Nocomplex - simple 17 Yes
Novelty Dimensionyouthful - mature 20 No
Receptivity Dimensioncolorful - colorless 10 No
Unassignedornate - plain 25 Nosophisticated - naive 21 Nocommon - noble 5 No
Two changes were made in the listing of the adjectives. First, the
test order was established through the use of random number tables to
mix up the various dimensions being measured. Second, random numbers
were used to reverse the order of some of the word pairs to prevent the
listing from always moving from the positive (left side) to the negative

134
(right side). These changes in the original listing necessitated con
centration by the respondents on the entire measuring system by pre
cluding them from a general reaction of any type in terms of overall
positiveness or negativeness.
With the concepts and measuring scales selected, the next problem
was selection of test groups. The occupational family of professions
was chosen because of the significant impact which occupation apparently
has on the practicing members. As noted in the background section, the
professional is strongly conditioned in several ways by his training
and the actual performance of his job; consequently, if the occupation
is influential in determining meanings which may be reflected in pro
duct perceptions, then this influence should be strong among these
groups. The actual professions selected for test groups were Doctors,
Lawyers, Ministers, Accountants, and University Professors. The groups
were chosen to cover the hierarchial variations within the occupational
family of professions,.generally moving from the top to the lower
levels of the occupational family. Further, a sixth test group was
established and labeled "nonprofessionals." This group contained any
respondent which did not belong to one of the five professional test
groups.
The Pilot Test
After establishing the scaling device for measuring the ten test
concepts, forms were run off to measure the six product concepts. These
forms, with the proposed instruction sheet, were administered to thirty-
two students in a Marketing 111 class (advertising) at Louisiana State
University. Visual analyses of the results showed that the instructions
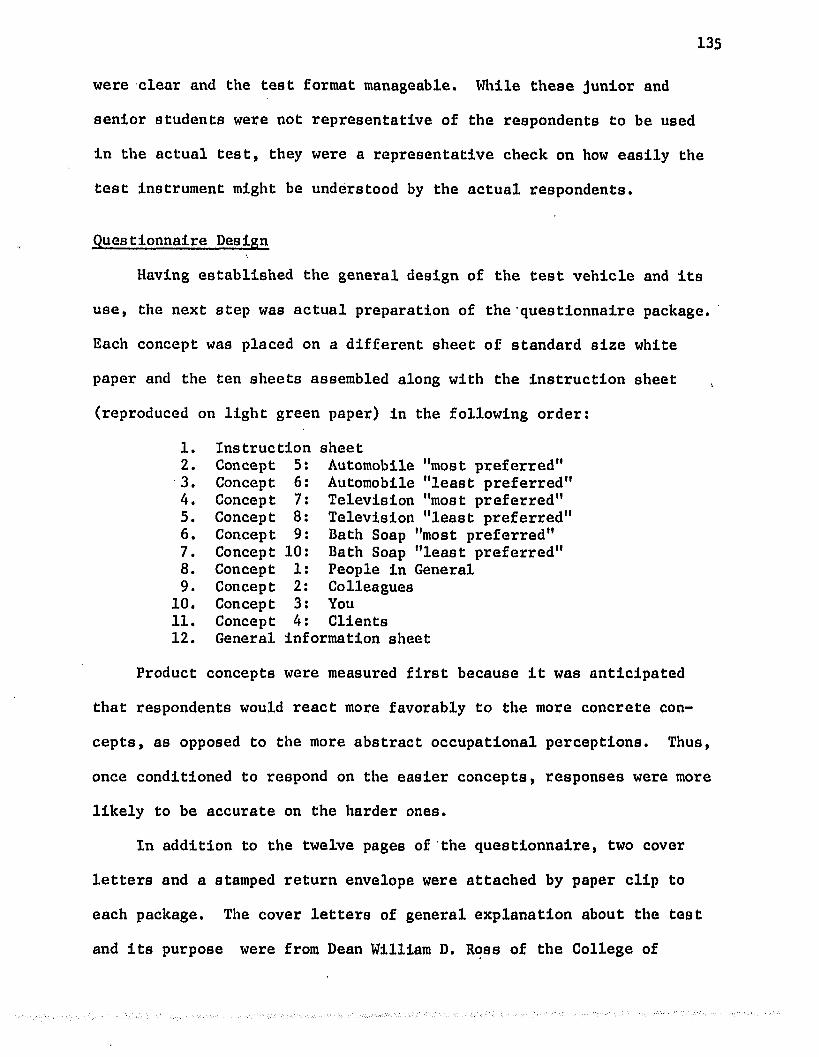
135
were clear and the test format manageable. While these junior and
senior students were not representative of the respondents to be used
in the actual test, they were a representative check on how easily the
test instrument might be understood by the actual respondents.
Questionnaire Design
Having established the general design of the test vehicle and its
use, the next step was actual preparation of the questionnaire package.
Each concept was placed on a different sheet of standard size white
paper and the ten sheets assembled along with the instruction sheet
(reproduced on light green paper) in the following order:
1 . Instruction sheet2. Concept 5 Automobile "most preferred"3. Concept 6 Automobile "least preferred"4. Concept 7 Television "most preferred"5. Concept 8 Television "least preferred"6. Concept 9 Bath Soap "most preferred"7. Concept 10 Bath Soap "least preferred"8. Concept 1 People in General9. Concept 2 Colleagues
10. Concept 3 You11. Concept 4 Clients12. General information sheet
Product concepts were measured first because it was
that respondents would react more favorably to the more concrete con
cepts, as opposed to the more abstract occupational perceptions. Thus,
once conditioned to respond on the easier concepts, responses were more
likely to be accurate on the harder ones.
In addition to the twelve pages of the questionnaire, two cover
letters and a stamped return envelope were attached by paper clip to
each package. The cover letters of general explanation about the test
and its purpose were from Dean William D. Ross of the College of

136
Business Administration and Morris E. Massey, test conductor. The
general information sheet was included to obtain information which
would verify occupational status and provide actual product use in
sights. The entire questionnaire package is found in Appendix B.
Sample Selection and Collection of Data
After completing the design of the questionnaire, the selection
of samples for each of the test groups was made. Potential respondents
were all adult persons in the Baton Rouge, Louisiana, metropolitan
area. For each of the five test groups of professionals, specific
criteria were established to ensure practicing professional status,
and for the nonprofessional group the criterion was set up as "not
employed or qualified to be a member of one of the other test groups."
Selection techniques varied by test group. A sample goal was estab
lished as thirty usable returns for each test group. This sample size
would insure statistical significance for each of the samples as it
represented the test area population, and because this study was a
pilot effort, a sample size of thirty would provide manageable data
volume, which would indicate significance of the measured characteris
tics. All respondents were contacted between July 20, and August 31,
1967.
Nonprofessionals. Sixty questionnaire forms were distributed to
students of the researcher with appropriate instructions for getting the
forms completed by "an adult you know employed in an occupation that is
not one of the other five test groups." Forty-five usable returns were
turned in within two weeks, and the first thirty completed forms returned
were used for nonprofessional test group data.

137
Professors. The complete list of all Louisiana State University
faculty with Assistant Professor rank or greater was obtained. This
alphabetical list was numbered sequentially, and random numbers were
used to select seventy-five total potential respondents. The first
sixty were sent questionnaire forms in the campus mail, with the com
pleted forms to be returned via the same method. A total of thirty-
eight returns followed. Of these, twenty-eight were complete in all
respects. Two, which did not complete the Bath Soap "Least Preferred"
form were given "neutral" ratings on that form and added to the twenty-
eight to make the total test group of thirty.
Doctors. The current 1967 telephone directory yellow pages were
used to select the Doctor test group. The 247 physicians and surgeons
listed were numbered sequentially and random numbers were used to
select seventy names. The first sixty were mailed the complete question
naire package (cover letters, instruction sheet, ten concept measuring
forms, a general information sheet, and a stamped return envelope).
Returns were made by mail to a Post Office box rented for that purpose
in the LSU Substation in the Union Building on campus. A total of
thirty-five returns from Doctors were compiled, of which twenty-seven
were complete. From the remainder, three forms which had left the
Bath Soap "Least Preferred" scales blank were given "neutral" ratings
and added to this fully completed forms to make a total of thirty in
the test group.
Ministers. From a list of "Churches in the Baton Rouge Area", fur
nished by a local religious organization, 143 churches were used as the
total population of Ministers. From these, sixty were selected by ran
dom numbers to receive the complete questionnaire package in the mail.
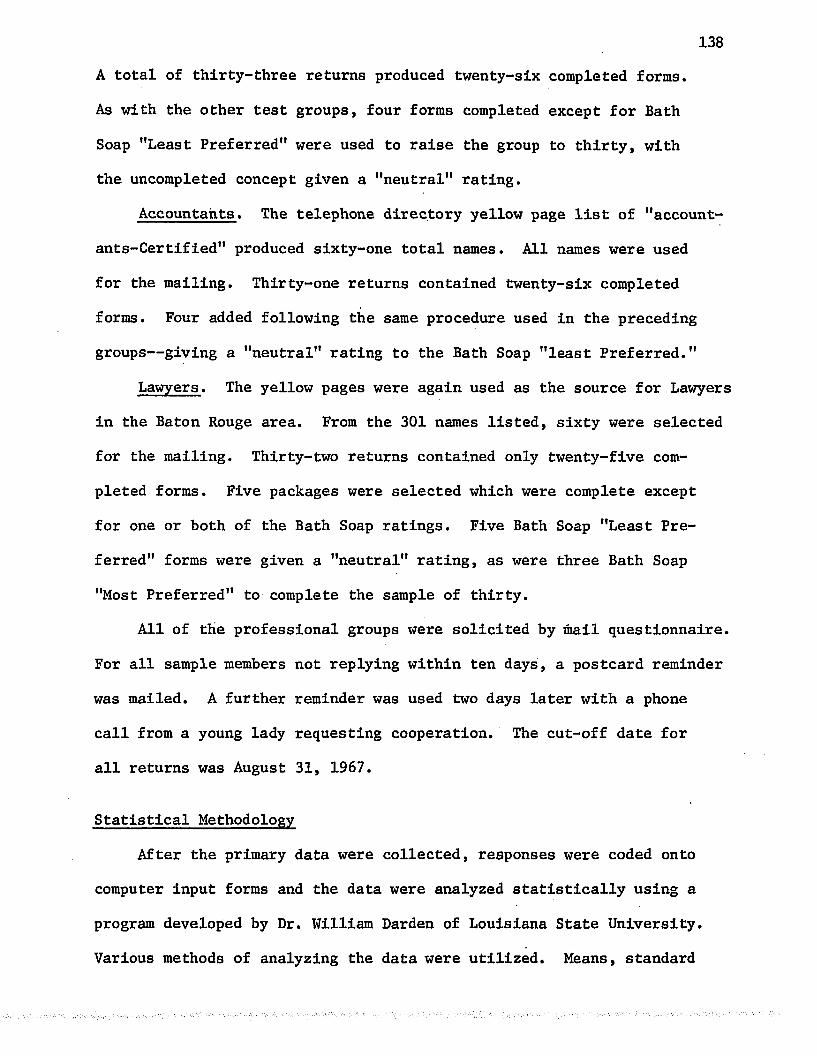
138
A total of thirty-three returns produced twenty-six completed forms.
As with the other test groups, four forms completed except for Bath
Soap "Least Preferred" were used to raise the group to thirty, with
the uncompleted concept given a "neutral" rating.
Accountants. The telephone directory yellow page list of "account-
ants-Certified" produced sixty-one total names. All names were used
for the mailing. Thirty-one returns contained twenty-six completed
forms. Four added following the same procedure used in the preceding
groups— giving a "neutral" rating to the Bath Soap "least Preferred."
Lawyers. The yellow pages were again used as the source for Lawyers
in the Baton Rouge area. From the 301 names listed, sixty were selected
for the mailing. Thirty-two returns contained only twenty-five com
pleted forms. Five packages were selected which were complete except
for one or both of the Bath Soap ratings. Five Bath Soap "Least Pre
ferred" forms were given a "neutral" rating, as were three Bath Soap
"Most Preferred" to complete the sample of thirty.
All of the professional groups were solicited by mail questionnaire.
For all sample members not replying within ten days, a postcard reminder
was mailed. A further reminder was used two days later with a phone
call from a young lady requesting cooperation. The cut-off date for
all returns was August 31, 1967.
Statistical Methodology
After the primary data were collected, responses were coded onto
computer input forms and the data were analyzed statistically using a
program developed by Dr. William Darden of Louisiana State University.
Various methods of analyzing the data were utilized. Means, standard

deviations, and variances were determined for each test group by word
pairs. High variances for word pairs 9, 17, 18, 20, and 25 signaled
poor measuring ability for these pairs, so they were dropped from the
tests. All concepts were compared using a "z" test for group mean
response on each word pair. Systematic comparisons were made between
concepts within groups and between concepts between groups. Chi-square
tests were calculated between groups for each concept. In addition,
the "D" statistic was calculated for each concept to all other concepts
within each group and for each concept between all the test groups.
Secondary Sources
Libraries of Louisiana State University and the University of
Colorado served as sources for the bulk of the secondary materials used
in the study. Other sources included private library materials of the
researcher and colleagues.

APPENDIX B

L o u i s i a n a s t a t e U n i v e r s i t yA N D A G R I C U L T U R A L A N D M E C H A N I C A L C O L L E G E
BATON ROUGE • LOUISIANA • 70803 College of Business Administration
OFFICE OF THE DEAN July 21, 1967
Dear Madam:As a member of a respected profession, you no
doubt recognize the need to expand our knowledge concerning human behavior.
The attached material is a vital part of a study currently being conducted which is designed to make a contribution to our knowledge in one important area of human behavior— influences on our thinking as consumers. To complete this study, Mr. Morris E. Massey, a„ candidate for the Ph.D. degree in this College, must have the cooperation of a selected group of people in several professional areas.
I hope that you will assist him with this study by completing the attaching questionnaire.
mcerely yours
William D. Ross Dean
WDR/mbAttachments

L o u i s i a n a S t a t e U n i v e r s i t yA N D A G R I C U L T U R A L A N D M E C H A N I C A L C O L L E G E
BATON ROUGE • LOUISIANA • 70803College of Business Administration
D E P A R T M E N T O F M A N A G E M E N T A N D M A R K E T I N G July 21, 19^7
Dear Professional:How would you explore the dimensions of meaning in the
human mind?Certainly, as a professional' person, you realize the
difficulties of such a task and the challenge it offers. However, studies are now probing the frontiers of "thinking" and the results are providing valuable insights into behavior patterns.
Such a study is now underway for my doctoral dissertation in marketing at L.S.U. I am concerned with some very selected professional people and how the "meanings" relative to their professions may influence their images of products.This heretofore unexplored area has vital significance in broadening understanding about consumers such as yourself.
You, as a member of an important professional group, have been selected for the valuable contribution which only you can make to my study. Attached, you will find the question forms -- they are easy to fill out, fast (only about 15 minutes) and very important to my study (only a limited number of people are being questioned). Will you take just a few short minutes and help me expand knowledge about professional people as consumers?
Of course, your reply is completely confidential, you will not be identified by name, and the information has no negative implications. Your help is invaluable and. greatly appreciated .-- I'll be glad to send you a summary of findings if you'll just make a note on the general information sheet.
So today, please spend the few minutes, to complete the forms and return them in the enclosed envelope. Only you can help me complete my dissertation and shed new light on consumer behavior.
Sincerely yours,
Morris E. Massey

InstructionsThe purpose of this study is to measure the meanings of certain
things to various selected professional groups by having them judge these things against a series, of descriptive scales.
On eabh page you will find instructions at the top giving the thing you are to judge followed by a set of scales* You are to rate the concept on each of these scales in order.1. If you feel the concept at the top of the page is very related to one ena of the scale, you should place an "X as follows:
PAINFUL : X :_____ :____ :______ :_______ :_____ : PLEASURABLEI orPAINFUL : : : : : : : X : PLEASURABLE
I --- — " — — — ■ — ■ — ----— — — —2. If you feel the concept is closely related to one end or the other (but not extremely) then you should place your "X" as follows:REGRESSIVE :_____ : X : _____:_____: : : - _PROGRESSIVEREGRESSIVE :_____ :_____ :____ : : ; X :_____ : PROGRESSIVE
3. If you/feel the concept is only slightly related to one end or the other, then the "X" should be in one or the other of the 3rd positions (note each column is labeled for your convenience).4. If you consider the concept to be neutral on the scale, or if the scale is completely irrelevant to the concept, then place the“ rrXH in the middle space.
FACSIMILE : : ~ : ____: X ; : : AUTHENTICIMPORTANT
1. Place "X” in the middle of each space.This Not this: X :__-_J___x
2. Please check every scale for every concept.3» Never put more than one check on a single scale— rate
each pair of words only once on each concept.Work fast— do not ponder, yet try to be as accurate as possible, for we need your true impressions.
5* Judge each concept independently— do not try to match or compare what you did before. There is no "right" answers we want only your independent feelings about the "meanings" of each concept rated.

In the blank below please write the name of the automobile which you would MOST PREFER to own (not necessarily the one you do own).
With this automobile in mind, please fill out the evaluation schedule below.Very Closely
PAINFULREGRESSIVEFACSIMILE
COMMONPERFECTSHALLOW
HOTUNSOCIABLEEMOTIONALCOLORFUL
FASTDISSONANT
USEFULBEAUTIFUL
URBANGOOD
SIMPLEMASCULINE
FRAGILEYOUTHFUL
SOPHISTICATEDACTIVESTRONG
CONTEMPORARYORNATE
slightly
Neu- Slight- Closely Very tral ly PLEASURABLE
PROGRESSIVEAUTHENTICNOBLEIMPERFECTDEEPCOLDSOCIABLEUNEMOTIONALCOLORLESSSLOWHARMONIOUSUSELESSUGLYRURALBADCOMPLEXFEMININETOUGHMATURENAIVEPASSIVEWEAK
NONCONTEMPORARYPLAIN
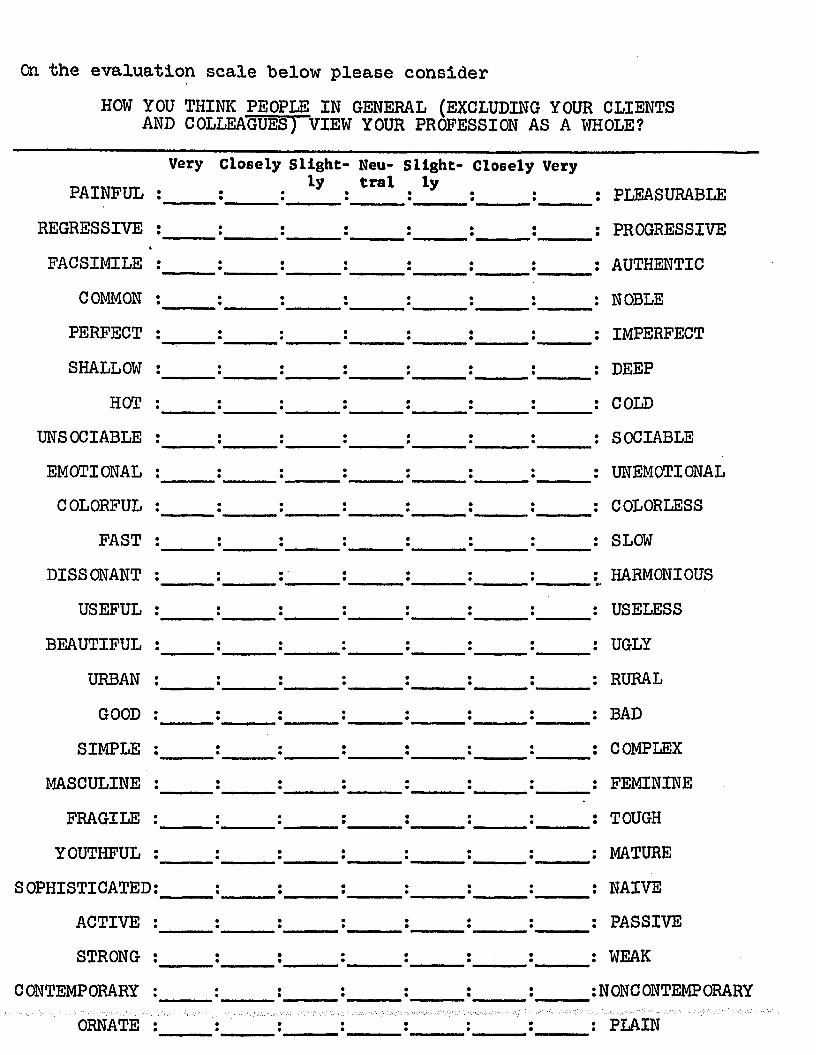
Cn the evaluation scale below please considerHOW YOU THINK PEOPLE IN GENERAL (EXCLUDING YOUR CLIENTS
AND COLLEAGUES) VIEW YOUR PROFESSION AS A WHOLE?
PAINFULREGRESSIVE
»
FACSIMILECOMMONPERFECTSHALLOW
HOTUNSOCIABLEEMOTIONALCOLORFUL
FASTDISSONANT
USEFULBEAUTIFUL
URBANGOOD
SIMPLEMASCULINE
FRAGILEYOUTHFUL
SOPHISTICATEDACTIVESTRONG
CONTEMPORARYORNATE
Very Closely Slight*ly
Neu- Sllght- tral ly
Closely VeryPLEASURABLE PROGRESSIVE AUTHENTIC NOBLE IMPERFECT DEEP COLD SOCIABLE UNEMOTIONAL COLORLESS SLOWHARMONIOUSUSELESSUGLYRURALBADCOMPLEXFEMININETOUGHMATURENAIVEPASSIVEWEAKNONCONTEMPORARYPLAIN
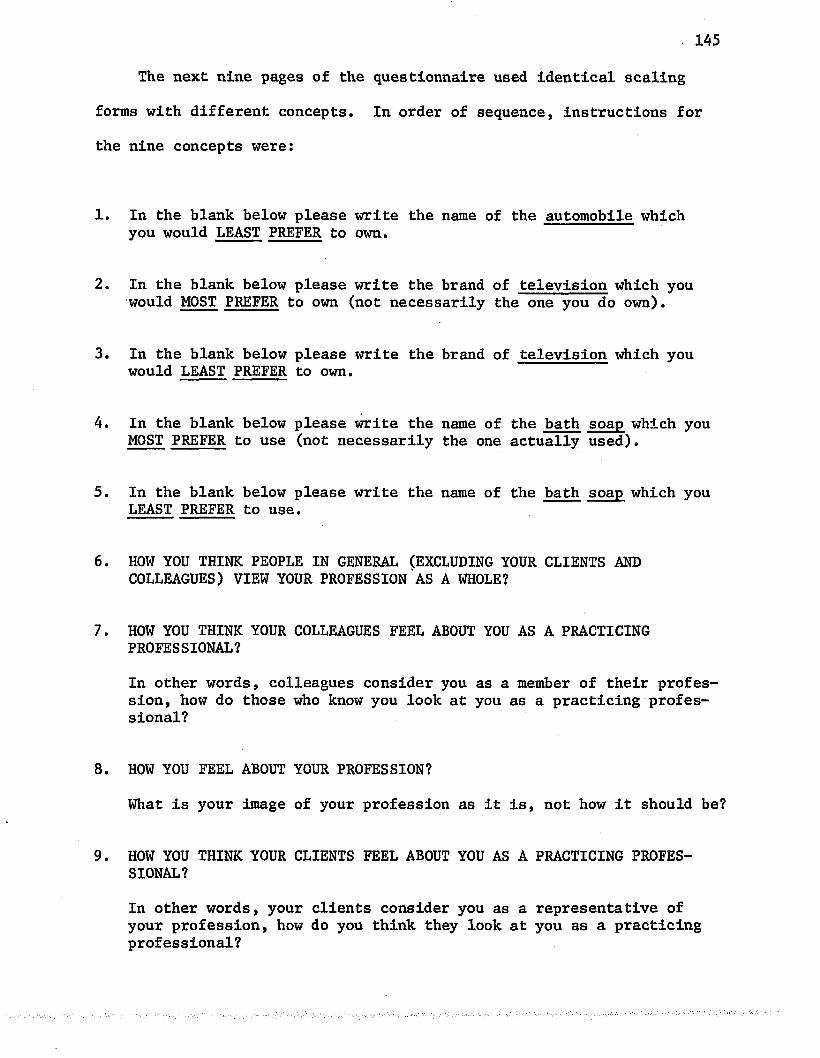
145
The next nine pages of the questionnaire used identical scaling
forms with different concepts. In order of sequence, instructions for
the nine concepts were:
1. In the blank below please write the name of the automobile which you would LEAST PREFER to own.
2. In the blank below please write the brand of television which you would MOST PREFER to own (not necessarily the one you do own).
3. In the blank below please write the brand of television which you would LEAST PREFER to own.
4. In the blank below please write the name of the bath soap which you MOST PREFER to use (not necessarily the one actually used).
5. In the blank below please write the name of the bath soap which you LEAST PREFER to use.
6. HOW YOU THINK PEOPLE IN GENERAL (EXCLUDING YOUR CLIENTS AND COLLEAGUES) VIEW YOUR PROFESSION AS A WHOLE?
7. HOW YOU THINK YOUR COLLEAGUES FEEL ABOUT YOU AS A PRACTICING PROFESSIONAL?
In other words, colleagues consider you as a member of their profession, how do those who know you look at you as a practicing professional?
8. HOW YOU FEEL ABOUT YOUR PROFESSION?
What is your image of your profession as it is, not how it should be?
9. HOW YOU THINK YOUR CLIENTS FEEL ABOUT YOU AS A PRACTICING PROFESSIONAL?
In other words, your clients consider you as a representative of your profession, how do you think they look at you as a practicing professional?

The following general information is needed to complete the study.Age: 25-30 _____ 31-35 _____ 36-40 41-45__ 46-50______
51-55 _____ 56-60 _____ 61-65 over 65Male Female _____ Married Single _______Number of adults living in your house __________Number of children (under 21) living in your house __________EducationDegree held Year granted Institution
Professional certificates
Approximate number of jy ears you have been in your profession Membership in professional societies
Automobile ownership Make Model year
Television set ownership Brand (approx. years old)
Check one Purchased Gift Color Black/White
( )( )
............... ( ) ..... - ... ....... .......... .Which brand of bath soap is usually used in your home? ___________Thank you again for your cooperation and time. You have helped in exploring a number of questions about consumer behavior.

APPENDIX C
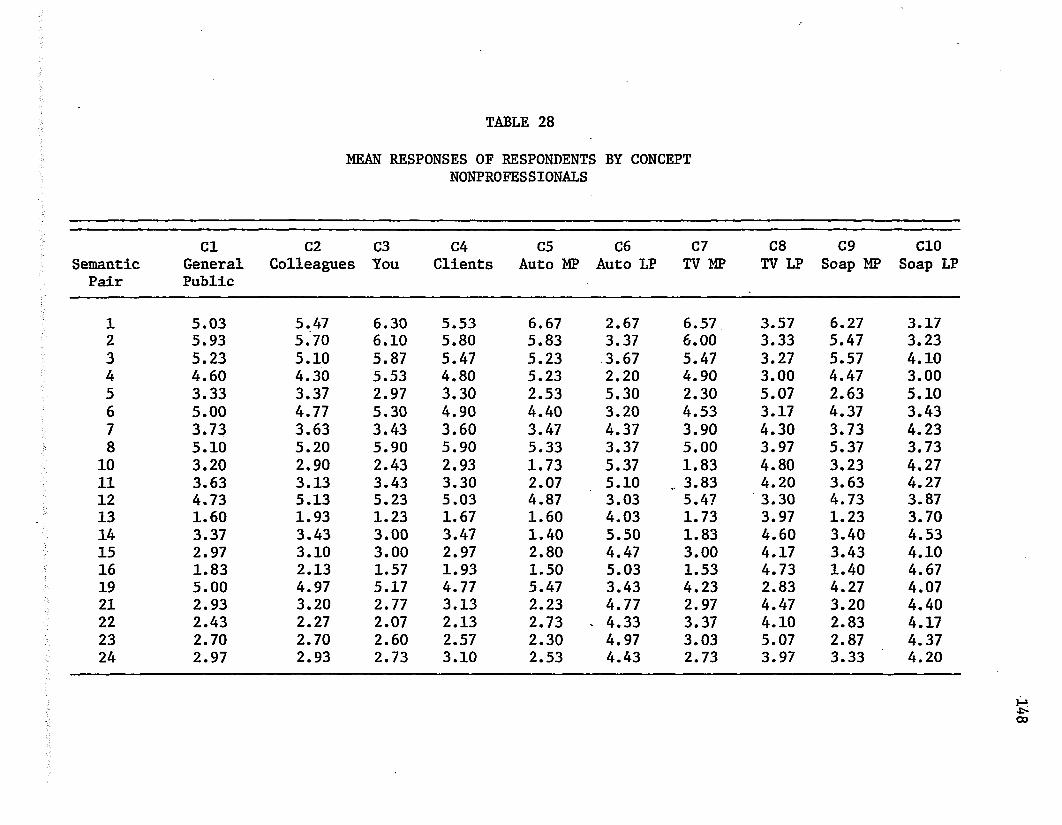
'aii
123456781011121314151619212223
TABLE 28
MEAN RESPONSES OF RESPONDENTS BY CONCEPT NONPROFESSIONALS
Cl C2 C3 C4 C5 C6 C7 C8 C9 CIOGeneral Colleagues You Clients Auto MP Auto LP TV MP TV LP Soap MP Soap LIPublic
5.03 5.47 6.30 5.53 6.67 2.67 6.57 3.57 6.27 3.175.93 5.70 6.10 5.80 5.83 3.37 6.00 3.33 5.47 3.235.23 5.10 5.87 5.47 5.23 3.67 5.47 3.27 5.57 4.104.60 4.30 5.53 4.80 5.23 2.20 4.90 3.00 4.47 3.003.33 3.37 2.97 3.30 2.53 5.30 2.30 5.07 2.63 5.105.00 4.77 5.30 4.90 4.40 3.20 4.53 3.17 4.37 3.433.73 3.63 3.43 3.60 3.47 4.37 3.90 4.30 3.73 4.235.10 5.20 5.90 5.90 5.33 3.37 5.00 3.97 5.37 3.733.20 2.90 2.43 2.93 1.73 5.37 1.83 4.80 3.23 4.273.63 3.13 3.43 3.30 2.07 5.10 . 3.83 4.20 3.63 4.274.73 5.13 5.23 5.03 4.87 3.03 5.47 3.30 4.73 3.871.60 1.93 1.23 1.67 1.60 4.03 1.73 3.97 1.23 3.703.37 3.43 3.00 3.47 1.40 5.50 1.83 4.60 3.40 4.532.97 3.10 3.00 2.97 2.80 4.47 3.00 4.17 3.43 4.101.83 2.13 1.57 1.93 1.50 5.03 1.53 4.73 1.40 4.675.00 4.97 5.17 4.77 5.47 3.43 4.23 2.83 4.27 4.072.93 3.20 2.77 3.13 2.23 4.77 2.97 4.47 3.20 4.402.43 2.27 2.07 2.13 2.73 . 4.33 3.37 4.10 2.83 4.172.70 2.70 2.60 2.57 2.30 4.97 3.03 5.07 2.87 4.372.97 2.93 2.73 3.10 2.53 4.43 2.73 3.97 3.33 4.20
i-*00
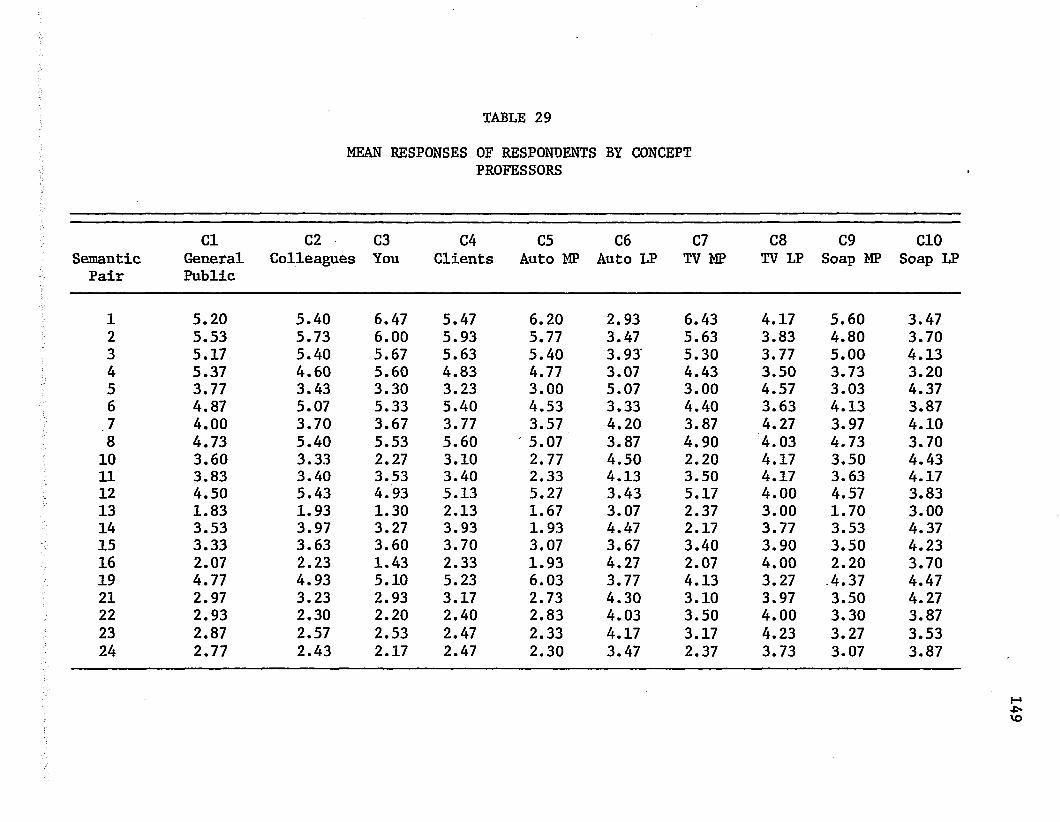
123456781011121314151619212223
TABLE 29
MEAN RESPONSES OF RESPONDENTS BY CONCEPT PROFESSORS
ClGeneralPublic
C2Colleagues
C3You
C4Clients
C5 Auto MP
C6 Auto LP
C7 TV MP
C8 TV LP
C9 Soap ME
5.20 5.40 6.47 5.47 6.20 2.93 6.43 4.17 5.605.53 5.73 6.00 5.93 5.77 3.47 5.63 3.83 4.805.17 5.40 5.67 5.63 5.40 3.93 5.30 3.77 5.005.37 4.60 5.60 4.83 4.77 3.07 4.43 3.50 3.733.77 3.43 3.30 3.23 3.00 5.07 3.00 4.57 3.034.87 5.07 5.33 5.40 4.53 3.33 4.40 3.63 4.134.00 3.70 3.67 3.77 3.57 4.20 3.87 4.27 3.974.73 5.40 5.53 5.60 ' 5.07 3.87 4.90 4.03 4.733.60 3.33 2.27 3.10 2.77 4.50 2.20 4.17 3.503.83 3.40 3.53 3.40 2.33 4.13 3.50 4.17 3.634.50 5.43 4.93 5.13 5.27 3.43 5.17 4.00 4.571.83 1.93 1.30 2.13 1.67 3.07 2.37 3.00 1.703.53 3.97 3.27 3.93 1.93 4.47 2.17 3.77 3.533.33 3.63 3.60 3.70 3.07 3.67 3.40 3.90 3.502.07 2.23 1.43 2.33 1.93 4.27 2.07 4.00 2.204.77 4.93 5.10 5.23 6.03 3.77 4.13 3.27 .4.372.97 3.23 2.93 3.17 2.73 4.30 3.10 3.97 3.502.93 2.30 2.20 2.40 2.83 4.03 3.50 4.00 3.302.87 2.57 2.53 2.47 2.33 4.17 3.17 4.23 3.272.77 2.43 2.17 2.47 2.30 3.47 2.37 3.73 3.07

ail
12345678101112131415161921222324
TABLE 30
MEAN RESPONSES OF RESPONDENTS BY CONCEPT DOCTORS
Cl C2 C3 C4 C5 C6 C7 C8 C9General Colleagues You Clients Auto MP Auto LP TV MP TV LP Soap MP Public
4.63 5.73 5.57 5.70 6.20 3.20 6.07 4.27 5.176.33 6.20 6.47 6.23 5.93 3.50 6.20 3.83 5.476.13 6.00 6.37 6.20 5.57 4.23 6.03 3.57 5.535.80 5.07 5.90 5.53 5.00 2.50 5.00 2.80 4.233.53 3.20 3.30 2.80 2.60 5.03 2.77 5.10 2.805.67 5.30 5.77 5.53 4.53 3.43 4.57 3.70 4.333.83 3.57 3.63 3.70 3.53 4.23 3.87 4.23 3.775.40 5.87 5.90 5.90 5.20 4.20 5.30 4.27 4.972.70 3.07 2.63 2.90 2.17 4.87 1.87 4.33 3.603.57 3.07 ,3.07 3.13 2.03 4.43 3.40 4.07 3.574.90 5.47 5.10 5.67 5.33 3.43 5.27 3.87 4.601.57 1.87 1.20 1.47 1.37 2.77 1.63 3.07 1.403.40 3.60 3.17 3.70 1.67 4.80 2.03 3.93 3.403.20 2.63 2.87 2.73 2.77 3.67 3.20 3.90 3.431.73 1.80 1.33 1.50 1.43 4.20 1.70 4.13 1.604.90 4.77 4.87 4.83 6.07 3.43 4.60 3.10 4.332.13 2.43 1.93 2.27 2.17 4.60 2.67 4.37 3.202.07 1.90 1.77 1.77 2.47 3.63 3.00 4.20 3.102.10 1.90 1.87 1.93 1.97 4.47 2.97 4.47 3.132.53 2.17 2.20 2.13 2.10 3.77 2.37 3.73 2.97

ai:
123456781011121314151619212223
TABLE 31
MEAN RESPONSES OF RESPONDENTS BY CONCEPT MINISTERS
Cl C2 C3 C4 C5 C6 C7 C8 C9General Colleagues You Clients Auto MP Auto LP TV MP TV LP Soap MP Public
4.47 5.13 5.83 5.37 6.07 2.83 6.07 3.60 5.774.37 5.53 5.90 5.57 5.43 3.40 •5.97 3.67 5.035.07 5.73 6.07 5.87 5.63 3.83 5.80 3.83 5.635.70 5.00 5.93 5.40 4.97 3.03 4.97 3.40 4.533.80 4.03 3.50 3.97 2.73 5.27 2.93 4.80 2.735.47 5.30 5.77 5.63 4.50 3.43 4.70 3.97 4.373.63 3.60 3.30 3.27 3.73 4.17 3.50 4.23 3.705.53 5.33 6.20 5.80 5.33 3.97 5.20 4.13 4.773.97 3.20 2.67 3.00 2.63 4.60 2.33 4.03 3.574.17 3.50 3.27 3.33 2.63 4.43 3.57 4.37 3.774.63 5.40 5.27 5.50 5.17 3.93 5.33 3.80 4.802.37 2.27 1.57 2.17 1.43 3.07 2.40 3.27 .1.633.03 3.90 2.43 3.53 2.03 4.23 2.13 3.83 3.433.73 3.30 3.30 3.10 2.43 3.80 3.20 3.80 3.702.10 2.50 1.70 2.20 1.73 3.93 2.07 3.90 1.874.53 5.10 5.07 4.90 5.97 4.07 5.03 3.50 4.473.53 3.20 3.00 2.87 2.87 4.23 2.97 4.03 3.532.70 2.17 1.93 2.23 2.47 3.80 3.13 3.87 2.932.97 2.40 2.07 2.23 2.13 3.97 2.57 4.30 3.133.33 2.57 2.27 2.43 2.07 3.77 2.07 3.47 2.73

ai:
12345678101112131415161921222324
TABLE 32
MEAN RESPONSES OF RESPONDENTS BY CONCEPT ACCOUNTANTS
ClGeneral’ublic
C2Colleagues
C3You
C4Clients
C5 Auto MP
C6 Auto LP
C7 TV MP
C8 TV LP
C9 Soap MP
CIO Soap I
4.33 5.23 6.20 5.60 6.77 2.87 6.23 3.90 5.90 3.875.57 5.77 5.83 6.00 6.13 3.37 6.27 3.57 5.17 3.975.77 5.40 6.13 5.60 5.60 3.53 5.53 3.37 5.03 3.935.27 4.73 5.60 5.10 5.13 2.17 4.70 3.13 4.07 3.372.93 3.53 3.47 3.00 2.47 5.07 2.73 5.00 3.20 4.575.37 4.90 5.60 5.20 4.43 3.27 4.43 3.53 4.10 3.674.03 3.83 3.73 3.83 3.77 4.27 3.90 4.27 3.83 4.004.63 5.20 5.17 5.50 5.30 3.53 4.90 3.83 5.27 4.204.80 3.13 3.07 3.13 2.17 5.10 2.30 4.43 3.47 4.173.83 2.93 3.13 2.93 2.00 4.57 3.80 4.27 3.70 4.074.37 5.20 4.83 5.20 5.27 3.30 5.37 4.00 4.60 3.871.63 2.17 1.37 1.63 1.67 3.07 2.03 3.27 1.67 2.733.90 4.00 3.67 3.90 1.73 4.87 2.30 3.97 3.67 3.903.07 3.13 2.97 3.27 2.90 3.80 3.53 4.17 3.80 4.101.93 2.37 1.77 2.07 1.70 4.27 1.87 4.23 1.87 3.334.47 4.63 4.87 4.83 5.73 2.97 4.73 3.40 4.33 4.232.27 3.17 2.47 2.73 2.47 4.87 2.97 4.00 3.57 4.102.93 2.70 2.07 2.27 2.67 4.17 3.23 4.17 3.33 3.832.90 2.63 2.33 2.50 2.40 5.07 2.83 4.73 3.13 3.833.00 2.83 2.73 2.93 2.60 3.67 2.77 3.60 3.27 4.07
152
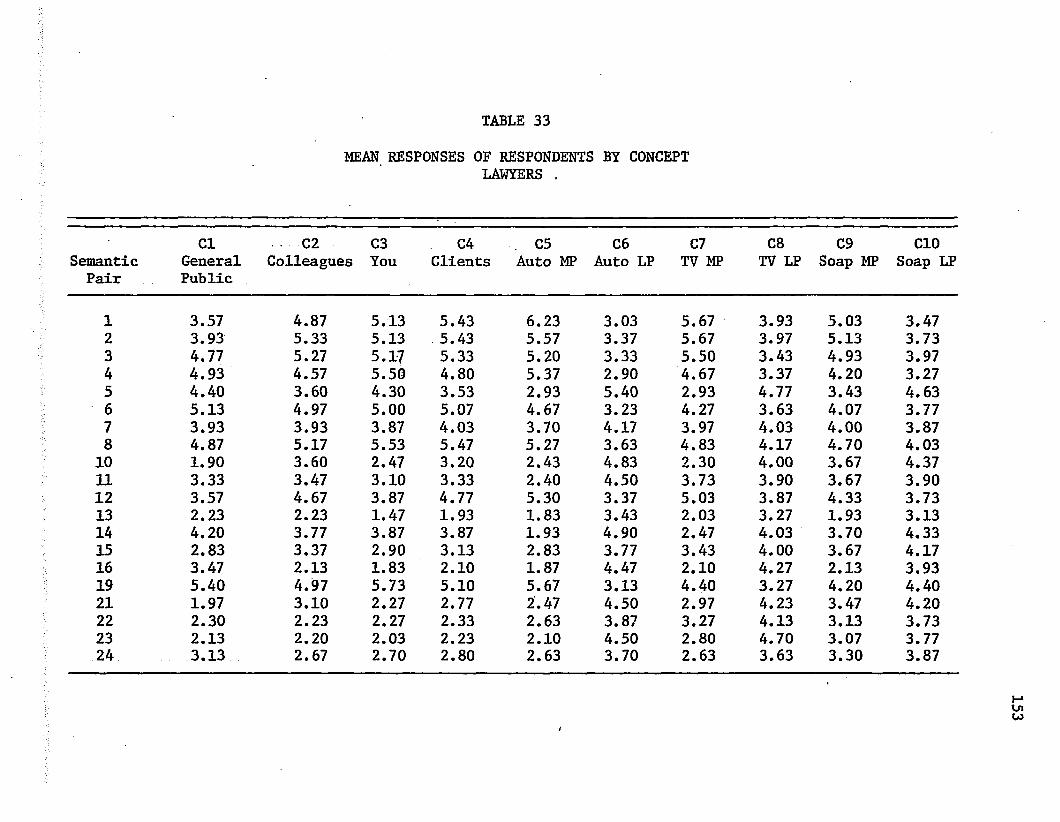
TABLE 33
MEAN RESPONSES OF RESPONDENTS BY CONCEPT LAWYERS .
SemanticPair
ClGeneralPublic
. C2 Colleagues
C3You
C4Clients
C5 Auto MP
C6 Auto LP
C7 TV MP
C8 TV LP
C9 Soap MP
CIO Soap LP
1 3.57 4.87 5.13 5.43 6.23 3.03 5.67 3.93 5.03 3.472 3.93 5.33 5.13 5.43 5.57 3.37 5.67 3.97 5.13 3.733 4.77 5.27 5.17 5.33 5.20 3.33 5.50 3.43 4.93 3.974 4.93 4.57 5.50 4.80 5.37 2.90 4.67 3.37 4.20 3.275 4.40 3.60 4.30 3.53 2.93 5.40 2.93 4.77 3.43 4.636 5.13 4.97 5.00 5.07 4.67 3.23 4.27 3.63 4.07 3.777 3.93 3.93 3.87 4.03 3.70 4.17 3.97 4.03 4.00 3.878 4.87 5.17 5.53 5.47 5.27 3.63 4.83 4.17 4.70 4.03
10 1.90 3.60 2.47 3.20 2.43 4.83 2.30 4.00 3.67 4.3711 3.33 3.47 3.10 3.33 2.40 4.50 3.73 3.90 3.67 3.9012 3.57 4.67 3.87 4.77 5.30 3.37 5.03 3.87 4.33 3.7313 2.23 2.23 1.47 1.93 1.83 3.43 2.03 3.27 1.93 3.1314 4.20 3.77 3.87 3.87 1.93 4.90 2.47 4.03 3.70 4.3315 2.83 3.37 2.90 3.13 2.83 3.77 3.43 4.00 3.67 4.1716 3.47 2.13 1.83 2.10 1.87 4.47 2.10 4.27 2.13 3.9319 5.40 4.97 5.73 5.10 5.67 3.13 4.40 3.27 4.20 4.4021 1.97 3.10 2.27 2.77 2.47 4.50 2.97 4.23 3.47 4.2022 2.30 2.23 2.27 2.33 2.63 3.87 3.27 4.13 3.13 3.7323 2.13 2.20 2.03 2.23 2.10 4.50 2.80 4.70 3.07 3.7724 3.13 2.67 2.70 2.80 2.63 3.70 2.63 3.63 3.30 3.87
153
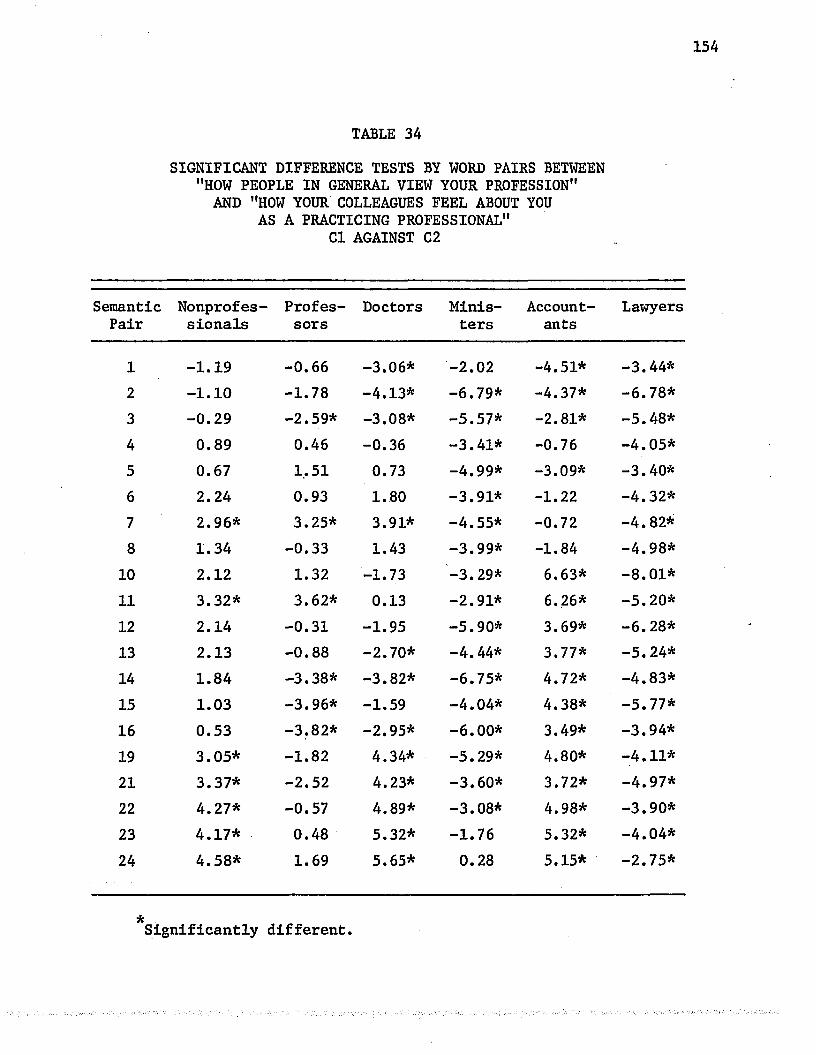
154
TABLE 34
SIGNIFICANT DIFFERENCE TESTS BY WORD PAIRS BETWEEN "HOW PEOPLE IN GENERAL VIEW YOUR PROFESSION"
AND "HOW YOUR COLLEAGUES FEEL ABOUT YOU AS A PRACTICING PROFESSIONAL"
Cl AGAINST C2
SemanticPair
Nonprofes- Profes- Doctors sionals sors
Ministers
Accountants
Lawyers
1 -1.19 -0.66 -3.06* -2.02 -4.51* -3.44*2 -1.10 -1.78 -4.13* -6.79* -4.37* -6.78*3 -0.29 -2.59* -3.08* -5.57* -2.81* -5.48*4 0.89 0.46 -0.36 -3.41* -0.76 -4.05*5 0.67 1.51 0.73 -4.99* -3.09* -3.40*6 2.24 0.93 1.80 -3.91* -1.22 -4.32*7 2.96* 3.25* 3.91* -4.55* -0.72 -4.82*8 1.34 -0.33 1.43 -3.99* -1.84 -4.98*
10 2.12 1.32 -1.73 -3.29* 6.63* -8.01*11 3.32* 3.62* 0.13 -2.91* 6.26* -5.20*12 2.14 -0.31 -1.95 -5.90* 3.69* -6.28*13 2.13 -0.88 -2.70* -4.44* 3.77* -5.24*14 1.84 -3.38* -3.82* -6.75* 4.72* -4.83*15 1.03 -3.96* -1.59 -4.04* 4.38* -5.77*16 0.53 -3.82* -2.95* -6.00* 3.49* -3.94*19 3.05* -1.82 4.34* -5.29* 4.80* -4.11*21 3.37* -2.52 4.23* -3.60* 3.72* -4.97*22 4.27* -0.57 4.89* -3.08* 4.98* -3.90*23 4.17* 0.48 5.32* -1.76 5.32* -4.04*24 4.58* 1.69 5.65* 0.28 5.15* -2.75*
*Significantly different.

155
TABLE 35
SIGNIFICANT DIFFERENCE TESTS BY WORD PAIRS BETWEEN "HOW PEOPLE IN GENERAL VIEW YOUR PROFESSION"
AND "HOW YOU FEEL ABOUT YOUR PROFESSION"Cl AGAINST C3
SemanticPair
Nonprofessionals
Profes- Doctors sors
Ministers
Accountants
Lawyers
1 -3.99* -4.83* -3.39* -3.64* -7.83* -4.59*2 -4.60* -5.80* -4.15* -7.19* -4.74* -6.99*3 -6.14* -6.07k -5.06* -6 .20* -5.95* -5.14*4 -6.32* -5.24* -4.96* -5.38* -5.66* -5.53*5 -4.13* -3.69* -2.77* -4.65* -5.57* -4.88*6 -5.58* -5.31* -3.71* -5.38* -5.30* -4.81*7 -4.67* -4.39* -4.03* -4.63* -4.74* -5.16*8 -6.04* -6.36* -6.31* -6.00* -5.85* -5.82*10 -3.57* -1.80 -4.15* -3.69* -1.68 -5.88*11 -4.52* -2.36 -3.15* -3.47* -0.88 -4.82*12 -5.84* -3.37* -3.21* -5.86* -3.99* -5.50*13 -4.46* -1.89 -2.44 -3.75* -2.10 -4.32*14 -4.23* -1.24 -2.72* -3.55* -1.64 -4.77*15 -5.11* -3.93* -1.28 -3.33* -1.13 -5.09*16 -3.87* 0.37 0.14 -2.70* 0.00 -2.67*19 -5.12* -1.79 3.35* -2.92* -0.85 -5.11*21 -3.67* -1.49 4.65* -1.92 -0.75 -4.41*22 -2.88* 1.35 5.22* 0.27 2.91* -4.31*23 -2.83* 3.28* 5.41* 3.78* 5.18* -3.32*24 -1.87 5.06* 5.62* 5.00* 4.82* -5.71*
*Significantly different.

156
TABLE 36
SIGNIFICANT DIFFERENCE TESTS BY WORD PAIRS BETWEEN "HOW PEOPLE IN GENERAL VIEW YOUR PROFESSION"
AND "HOW YOU THINK YOUR CLIENTS FEEL ABOUT YOU AS A PRACTICING PROFESSIONAL"
Cl AGAINST C4
SemanticPair
Nonprofes- Profes- Doctors sionals sors
Ministers
Accountants
Lawyers
1 -1.29 -1.22 -3.48* -3.11* -6.42* -4.70*2 -1.61 -3.14* -3.92* -5.18* -5.77* -6.88*3 -2.30 -4.69* -3.87* -5.60* -4.33* -5.81*4 -2.83* -1.81 -2.92* -4.31* -3.80* -4.70*5 -2.38 -0.23 -0.11 -4.89* -4.23* -3.72*6 -2.31 -2.42 0.35 -5.03* -3.67* -4.68*7 -3.16* -1.85 1.26 -4.22* -3.74* -5.33*8 -4.16* -4.80* -1.04 -5.17* -4.43* -5.65*
10 -3.28* -1.42 -3.30* -3.56* 4.14* -6.82*11 -2.65* -0.28 -1.98 -3.33* 5.96* -5.18*12 -3.85* -2.14 -5.22* -5.75* 2.97* -6.30*13 -5.03* -3.91* -3.06* ' -4.56* 4.72* -5.03*14 -5.21* -5.66* -5.55* -5.66* 5.11* -5.04*15 -4.33* -4.97* -2.92* -3.97* 3.45* -5.48*16 -4.88* -5.15* -2.72* -5.32* 3.53* -4.10*19 -2.60* -4.80* 3.64* -4.00* 4.01* -4.70*21 -1.76 -4.84* 4.46* -1.74 3.67* -6.17*22 -0.30 -3.07* 5.27* -0.57 5.91* -4.94*23 0.47 -2.84* 5.05* 1.86 5.70* -5.06*24 -0.37 -2.66* 5.57* 4.24* 4.93* -4.32*
Significantly different.

157
TABLE 37
SIGNIFICANT DIFFERENCE TESTS BY WORD PAIRS BETWEEN "HOW YOU THINK YOUR COLLEAGUES FEEL ABOUT YOU
AS A PRACTICING PROFESSIONAL" AND "HOW YOU FEEL ABOUT YOUR PROFESSION"
C2 AGAINST C3
SemanticPair
Nonprofes- Profes- Doctors sionals sors
Ministers
Account- Lawyers ants
1 -4.81* -4.98* 0.60 -2.86* -4.57* -0.762 -4.41* -4.92* -0.77 -3.36* -3.11* -0.233 -6.12* -5.52* -3.78* -4.71* -6.85* 0.134 -6.35* -6.81* -5.74* -6.12* -7.18* -3.13*5 -4.27* -4.49* -4.02* -3.67* -4.87* -5.07*6 -6.00* -5.56* -5.02* -4.61* -5.17* -3.79*7 -4.84* -5.09* -5.15* -3.89* -5.18* -4.62*8 -5.67* -5.26* -4.78* -6.24* -4.33* -5.33*
10 -4.28* -2.75* -3.17* -3.23* -4.87* -0.6311 -5.10* -4.44* -3.48* -3.12* -5.26* 0.4612 -5.11* -2.60* -2.24 -3.50* -4.61* 3.05*13 -4.13* -1.40 -0.34 -1.24 -3.87* 6.86*14 -4.19* 1.86 2.11 4.44* -4.33* 4.39*15 -4.56* 2.36 0.59 3.71* -4.47* 6.09*16 -3.27* 6.30* 3.76* 6.65* -3.14* 5.41*19 -5.12* -0.26 -3.57* 2.96* -5.29* 0.8821 -4.10* 1.50 -0.39 3.83* -4.06* -1.0622 -4.37* 2.31 0.23 4.97* -3.79* -1.8523 -4.22* 2.38 0.51 5.41* -3.89* -0.9724 -4.24* 3.43* 0.33 4.71* -4.50* -1.70
*Significantly different.

158
TABLE 38
SIGNIFICANT DIFFERENCE TESTS BY WORD PAIRS BETWEEN "HOW YOU THINK YOUR COLLEAGUES FEEL ABOUT YOU
AS A PRACTICING PROFESSIONAL" AND "HOW YOU THINK YOUR CLIENTS FEEL ABOUT YOU AS A PRACTICING PROFESSIONAL"
C2 AGAINST C4
SemanticPair
Nonprofessionals
Profes- Doctors sors
Ministers
Accountants
Lawyers
1 -0.40 -0.28 -0.16 -0.80 -2.26 -2.66*2 -0.99 -1.46 0.00 -1.03 -4.24* -3.46*3 -2.49 -4.01* -1.36 -2.81* -4.66* -2.464 -4.07* -5.27* -3.08* -4.46* -4.51* -4.66*5 -3.68* -2.16* -1.07 03.09* -2.11 -3.22*6 -4.71* -4.58* -3.53* -4.25* -5.36* -3.55*7 -4.02* -4.44* -3.90* -2.57 -4.71* -4.97*8 -4.75* -4.21* -3.32* -4.66* -3.05* -3.96*
10 -4.88* -3.27* -2.72* -2.98* -3.87* -3.39*11 -5.45* -3.60* -3.62* -2.62* -4.07* -3.56*12 -4.81* -2.59* -3.75* -2.93* -4.15* -4.28*13 -4.54* -4.86* -1.30 -2.61* -1.82 -3.39*14 -5.31* -4.42* -2.89* -1.60 -2.77* -5.52*15 -4.59* -4.13* -3.63* -0.91 -3.07* -3.61*16 -4.34* -4.49* -1.49 0.67 -1.24 -3.58*19 -4.39* -4.71* -2.73* 2.63* -5.39* -4.18*21 -4.63* -3.61* -0.82 4.39* -2.93* -3.52*22 -4.54* -4.72* 0.00 4.19* -1.68 -4.87*23 -4.19* -3.79* -0.21 5.59* -1.64 -4.34*24 -5.02* -4.28* 0.00 4.92* -2.34 -4.99*
*Signifleantly dlf ferent.

159
TABLE 39
SIGNIFICANT DIFFERENCE TESTS BY WORD PAIRS BETWEEN "HOW YOU FEEL ABOUT YOUR PROFESSION" AND
"HOW YOU THINK YOUR CLIENTS FEEL ABOUT YOU AS A PRACTICING PROFESSIONAL"
C3 AGAINST C4
SemanticPair
Nonprofes- Profes- Doctors sionals sors
Ministers
Accountants
Lawyers
1 3.10* 4.55* -0.68 1.42 3.39* -0.912 3.93* 4.21* 0.74 2.50 1.44 -1.923 4.63* 4.37* 2.07 4.26* 4.68* -2.114 6.41* 5.88* 3.35* 5.14* 5.43* -0.215 3.81* 4.71* 4.49* 2.61* 4.85* 2.326 5.66* 4.59* 4.45* 3.44* 5.49* 1.697 4.77* 4.69* 4.72* 3.43* 5.02* 2.59*8 4.69* 4.48* 4.17* 5.43* 3.35* -2.09
10 2.03 1.35 2.69* 1.61 4.30* -4.39*11 2.72* 3.21* 2.24 1.78 5.29* -3.80*12 3.52* 1.35 0.00 0.72 4.30* -5.37*13 2.68* -2.69* -2.11 -1.57 4.19* -6.05*14 0.97 -6.19* -4.20* -5.74* 4.38* -5.10*15 0.97 -4.25* -3.25* -3.72* 3.89* -5.59*16 -0.71 -7.40* -5.07* -6.34* 3.55* -5.35*19 3.73* -4.79* 1.12 -1.34 4.39* -3.23*21 2.45 -4.96* -0.20 0.37 4.27* -3.87*22 2.88* -4.84* -0.17 -1.14 4.39* -4.12*23 2.85* -4.06* -0.58 -2.42 4.01* -4.48*24 1.83 -5.43* -0.28 -1.75 3.91* -4.52*
&Significantly different.
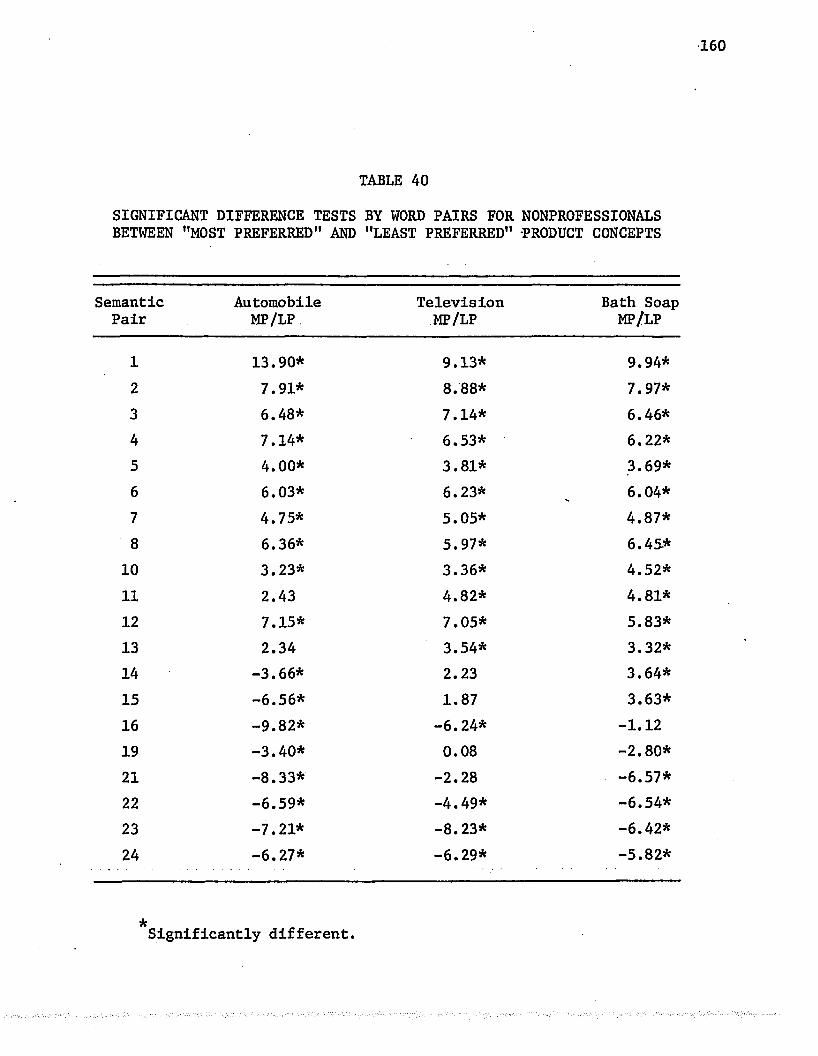
160
TABLE 40
SIGNIFICANT DIFFERENCE TESTS BY WORD PAIRS FOR NONPROFESSIONALSBETWEEN "MOST PREFERRED" AND "LEAST PREFERRED" PRODUCT CONCEPTS
SemanticPair
AutomobileMP/LP
TelevisionMP/LP
Bath Soap MP/LP
1 13.90* 9.13* 9.94*2 7.91* 8.88* 7.97*3 6.48* 7.14* 6.46*4 7.14* 6.53* 6.22*5 4.00* 3.81* 3.69*6 6.03* 6.23* 6.04*7 4.75* 5.05* 4.87*8 6.36* 5.97* 6.45.*
10 3.23* 3.36* 4.52*11 2.43 4.82* 4.81*12 7.15* 7.05* 5.83*13 2.34 3.54* 3.32*14 -3.66* 2.23 3.64*15 -6.56* 1.87 3.63*16 -9.82* -6.24* -1.1219 -3.40* 0.08 -2.80*21 -8.33* -2.28 -6.57*22 -6.59* -4.49* -6.54*23 -7.21* -8.23* -6.42*24 -6.27* -6.29* -5.82*
*Significantly different.

161
TABLE 41
SIGNIFICANT DIFFERENCE TESTS BY WORD PAIRS FOR PROFESSORSBETWEEN "MOST PREFERRED" AND "LEAST PREFERRED" PRODUCT CONCEPTS
SemanticPair
AutomobileMP/LP
TelevisionMP/LP
Bath Soap MP/LP
1 10.28* 7.30* 8.16*2 8.37* 8.00* 6.50*3 6.49* 6.91* 6.08*4 6.32* 6.05* 5.69*5 4.04* 3.95* 3.72*6 6.18* 5.96* 5.56*7 4.87* 4.95* 5.07*8 6 .10* 6.11* 6.29*
10 4.02* 3.36* 3.93*11 3.64* 4.17* 4.24*12 6.98* 6.71* 6.01*13 3.99* 4.19* 3.20*14 2.42* 2.84* 2.92*15 3.39* 3.67* 1.5316 -0.77 -1.05 -2.73*19 7.05* 3.64* -3.84*21 2.59* 2.12 -5.36*22 1.41 1.08 -5.89*23 -2.45 -3.34* -5.28*24 -6.69* -6.73* -5.76*
itSignificantly different.

162
TABLE 42
SIGNIFICANT DIFFERENCE TESTS BY WORD PAIRS FOR DOCTORSBETWEEN "MOST PREFERRED" AND "LEAST PREFERRED" PRODUCT CONCEPTS
SemanticPair
AutomobileMP/LP
TelevisionMP/LP
Bath Soap MP/LP
1 8.36* 5.63* 6.51*2 > 7.98* 8.82* 7.95*3 6.34* 7.64* 6.62*4 6.99* 6.84* 6.25*5 3.87* 3.90* 3.69*6 6.08* 5.98* 5.64*7 4.79* 5.08* 4.86*8 5.90* 6.06* 6.17*
10 3.16* 3.62* 4.63*11 2.09 4.55* 5.34*12 7.61* 6.64* 5.84*13 3.12* 3.99* 3.83*14 -1.42 3.09* 3.63*15 -3.26* 3.73* 3.79*16 -9.00* -0.18 0.8219 -0.44 4.94* -2.67*21 -1.59 0.71 -5.89*22 -5.29* -2.55* -5.68*23 -8.35* -5.98* -4.85*24 -6.87* -6.79* -5.86*
'ftSignificantly different.
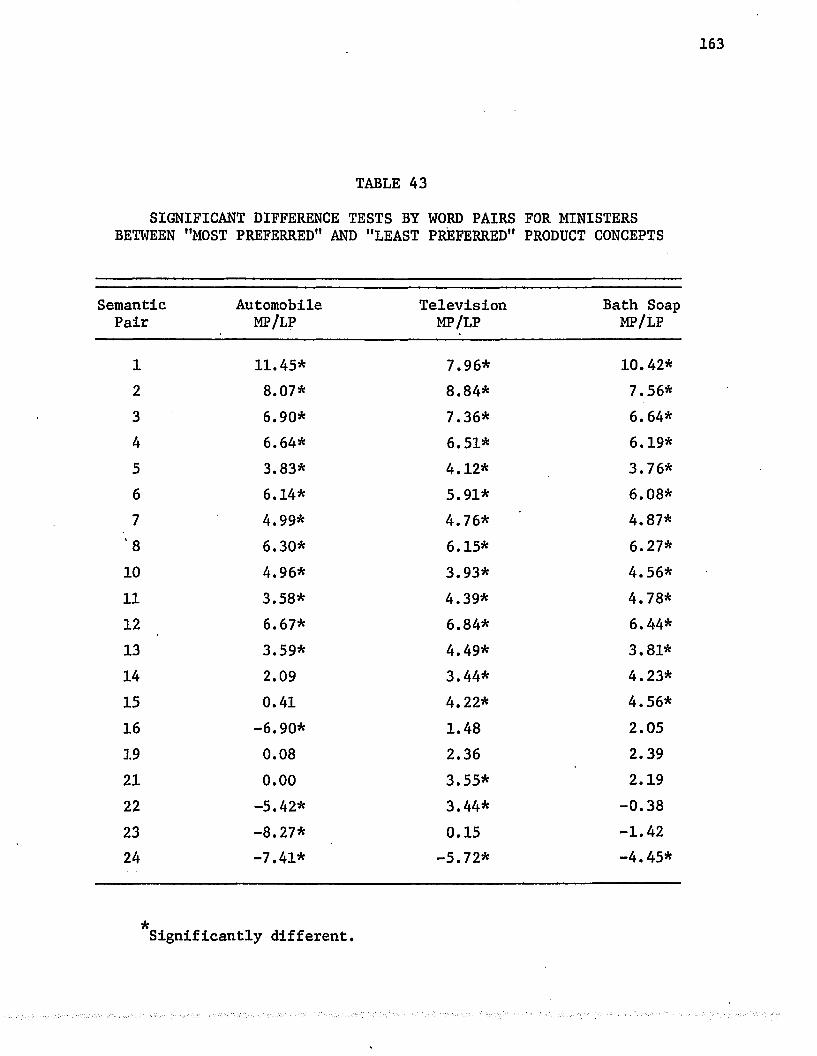
163
TABLE 43
SIGNIFICANT DIFFERENCE TESTS BY WORD PAIRS FOR MINISTERSBETWEEN "MOST PREFERRED" AND "LEAST PREFERRED" PRODUCT CONCEPTS
SemanticPair
AutomobileMP/LP
TelevisionMP/LP
Bath Soap MP/LP
1 11.45* 7.96* 10.42*2 8.07* 8.84* 7.56*3 6.90* 7.36* 6.64*4 6.64* 6.51* 6.19*5 3.83* 4.12* 3.76*6 6.14* 5.91* 6.08*7 4.99* 4.76* 4.87*' 8 6.30* 6.15* 6.27*10 4.96* 3.93* 4.56*11 3.58* 4.39* 4.78*12 6.67* 6.84* 6.44*13 3.59* 4.49* 3.81*14 2.09 3.44* 4.23*15 0.41 4.22* 4.56*16 -6.90* 1.48 2.0519 0.08 2.36 2.3921 0.00 3.55* 2.1922 -5.42* 3.44* -0.3823 -8.27* 0.15 -1.4224 -7.41* -5.72* -4.45*
*Significantly different.

164
TABLE 44
SIGNIFICANT DIFFERENCE TESTS BY WORD PAIRS FOR ACCOUNTANTSBETWEEN "MOST PREFERRED" AND "LEAST PREFERRED" PRODUCT CONCEPTS
SemanticPair
AutomobileMP/LP
TelevisionMP/LP
Bath Soap MP/LP
1 15.01* 7.96* 7.02*2 8.27* 9.84* 7.47*3 6.71* 7.12* 6.37*4 7.09* 6.45* 5.87*5 4.14* 3.93* 3.75*6 5.98* 5.98* 5.81*7 5.07* 5.08* 5.11*8 6.24* 6.09* 6.44*
10 3.78* 3.74* 4.34*11 3.42* 4.86* 4.77*12 7.04* 6.67* 6.05*13 4.10* 4.25* 3.97*M 2.22 3.53* 4.71*15 2.57 4.15* 4.56*16 -2.39 1.04 2.3419 7.66* 6.91* -0.2521 2.08 2.98* -1.6122 0.47 1.68 -3.42*23 -7.14* -4.51* -4.33*24 -6.75* -5.60* -6.32*
Significantly different.

165
TABLE 45
SIGNIFICANT DIFFERENCE TESTS BY WORD PAIRS FOR LAWYERSBETWEEN "MOST PREFERRED" AND "LEAST PREFERRED" PRODUCT CONCEPTS
SemanticPair
AutomobileMP/LP
TelevisionMP/LP
Bath Soap MP/LP
1 10.37* 6.03* 4.68*2 8.09* .8.73* 7.08*3 6.62* 7.88* 6.36*4 6.96* 6.55* 6.29*5 3.94* 3.85* 3.90*6 6.22* 5.96* 5.70*7 4.98* 5.30* 5.22*8 6.35* 5.92* 6.07*
10 3.94* 3.74* 4.19*11 3.67* 5.04* 4.87*12 6.92* 6.56* 5.95*13 4.02* 4.01* 3.60*14 2.30 3.19* 3.89*15 2.69* 3.92* 3.29*16 -2.10 -0.27 0.3119 5.03* 6.40* -2.4321 2.26 1.81 -5.02*22 1.14 0.00 -4.53*23 -4.57* -6.16* -5.06*24 -6.01* -6.67* -5.59*
Significantly different.

166
TABLE 46
SPECIFIC MAKES OF "AUTOMOBILE MOST PREFERRED TO OWN"BY TEST GROUPS
Non-Profes Profes Doc Minis■ Account Law
Make sionals sors tors ters ants yers Total
Cadillac 6 5 8 —m 4 6 29Buick 3 4 4 3 4 3 21Oldsmobile 3 4 2 « 3 6 - 18Chrysler 2 1 - 5 2 2 12Pontiac 1 1 1 7 1 - 11Riviera 2 - 3 - 2 3 10Chevrolet 2 3 1 2 1 - 9Lincoln 1 3 1 1 1 2 9Mercedes - 3 3 1 1 1 9Dodge 2 - - 2 1 1 6Jaguar 2 - - - 2 1 5Rolls Royce - - 2 - 1 2 5Mercury - 1 2 - - - . 3Plymouth 1 - - 2 - — 3Thunderbird 1 - 1 - - 1 3Corvette - 1 - 1 - - 2Ferrari 1 - - - - 1 2Ford - - 1 1 - - 2Rambler - - - 2 - - ■ 2AlphaRomero - - 1 - - — 1
AustinHealey 1 - - - - - 1
Electra - - - - - 1 1Firebird - - - - 1 - 1GTO - - - - 1 -
Javelin - 1 - - - - 1MG - - - 1 - - 1Mustang - - - - - 1 1Polara - 1 - - - — 1Porsche - 1 - - - - 1Toronado 1 - - - - - 1Volkswagen - 1 - - - - 1Wildcat 1 1
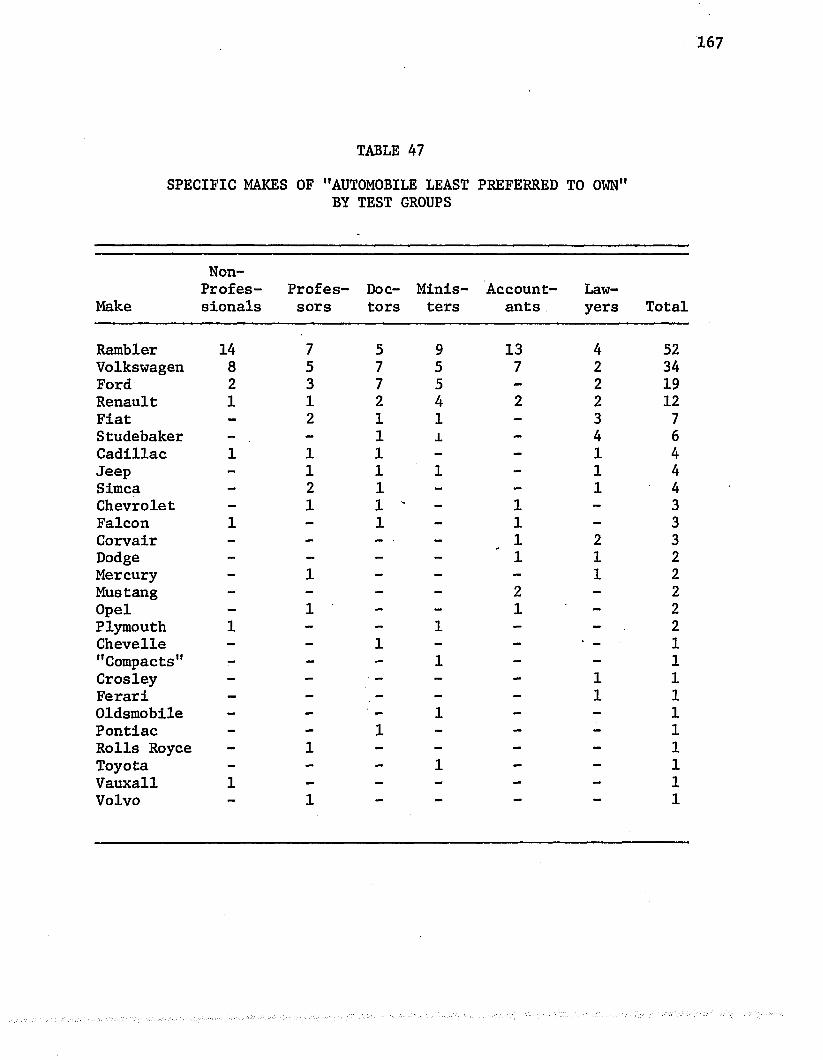
167
TABLE 47
SPECIFIC MAKES OF "AUTOMOBILE LEAST PREFERRED TO OWN"BY TEST GROUPS
Non-Profes Profes Doc Minis Account Law
Make sionals sors tors ters ants yers Total
Rambler 14 7 5 9 13 4 52Volkswagen 8 5 7 5 7 2 34Ford 2 3 7 5 - 2 19Renault 1 1 2 4 2 2 12Fiat — 2 1 1 - 3 7Studebaker - - 1 ± - 4 6Cadillac 1 1 1 - - 1 4Jeep - 1 1 1 - 1 4Simca - 2 1 - - 1 4Chevrolet - 1 1 ' - 1 - 3Falcon 1 - 1 - 1 - 3Corvair - - - ■ - 1 2 3Dodge - - - - 1 1 2Mercury - 1 - - - 1 2Mustang - - - - 2 - 2Opel - 1 - - 1 - 2Plymouth 1 - - 1 - - 2Chevelle - - 1 - - • - 1"Compacts" - - - 1 - - 1Crosley - - - - - 1 1Ferari - - - - 1 1Oldsmobile - - 1 - - 1Pontiac - - 1 - - - 1Rolls Royce - 1 - - - - 1Toyota - - - 1 - - 1Vauxall 1 - - - - - 1Volvo - 1 - - - - 1

168
TABLE 48
SPECIFIC "BRANDS OF TELEVISION MOST PREFERRED" BY TEST GROUPS
Brands.
Non-professionals
Professors
' Doctors
Ministers
Accountants
Lawyers Total
Zenith 16 11 14 10 13 15 79
RCA 11 12 12 13 8 11 64
Magnavox 2 5 1 2 2 1 13
Motorola 2 - 2 1 2 - 7
Admiral - - - 1 1 1 3
Silvertone - - - 1 1 - 2
Philco 1 - - 1 - - 2
Heathkit - - - - 1 - 1
Sylvania - 1 - - - - 1

169
TABLE 49
SPECIFIC BRANDS OF "TELEVISION LEAST PREFERRED"BY TEST GROUPS
Brands
Non-professionals
Professors
Doctors
Ministers
Accountants
Lawyers Total
GeneralElectric 3 6 4 8 3 4 28
Admiral 3 3 2 2 4 2 16Silvertone 1 5 1 4 3 2 16Airline 2 2 2 1 3 3 13Motorola 2 - 2 3 2 3 12Philco 3 3 1 2 3 - 12Muntz 1 2 5 - - 3 11Zenith 2 1 1 3 1 1 9Truetone 2 1 2 1 - 1 7Sony 1 2 1 - 1 2 7RCA 2 - 1 - - . 3 6Emerson 2 1 - 1 2 - 6CurtisMathis - — 1 - 2 1 4
Westinghouse 2 - 1 - 1 - 4Magnavox - - 1 - 2 1 4Western Auto - 3 - - - - 3B & W - - 1 - 2 - 3CBS - - - 1 - - 1Columbia - - - 1 - - 1"Japanese" - - 1 - - - 1Olympia 1 - - - - - 1Panasonic 1 - - - - - 1Signature - - - - 1 - 1StrombergCarlson 1 - - - - - 1
Sylvania - - - 1 - - 1Symphonic 1 - - - - - 1

170
TABLE 50
SPECIFIC BRANDS OF "BATH SOAP MOST PREFERRED" BY TEST GROUPS
Brands
Nonprofessionals
Professors
Doctors
Ministers
Accountants
Lawyers Total
Dial 9 7 13 9 15 13 66Ivory 3 5 7 5 3 5 28Safeguard 5 2 2 3 2 2 16Lifebouy 4 3 - 5 2 1 15Palmolive 2 1 2 2 2 - 9Zest 1 1 - • 1 2 2 7Camay 1 1 2 - 1 - 5Dove 1 1 1 1 - 1 5CashmereBouquet - - — 2 1 3
Lux - - 1 - 1 1 3Yardley 1 1 - 1 - - 3Phase III - 1 - - - 1 2Sweetheart - 2 - - - - 2Balsam - - - 1 - - 1"Basic" - - - 1 - - 1Castile - - - 1 - - 1Homemade 1 - - - - - 1fJean Nate 1 - - - - - 1Lifeguard - - - - 1 - 1Neutrogena 1 - - - - 1Old Spice - 1 - - - - 1Phisoderm - 1 - - - - 1Phisohex - - - - - 1 1Saleo — — — — — 1 1
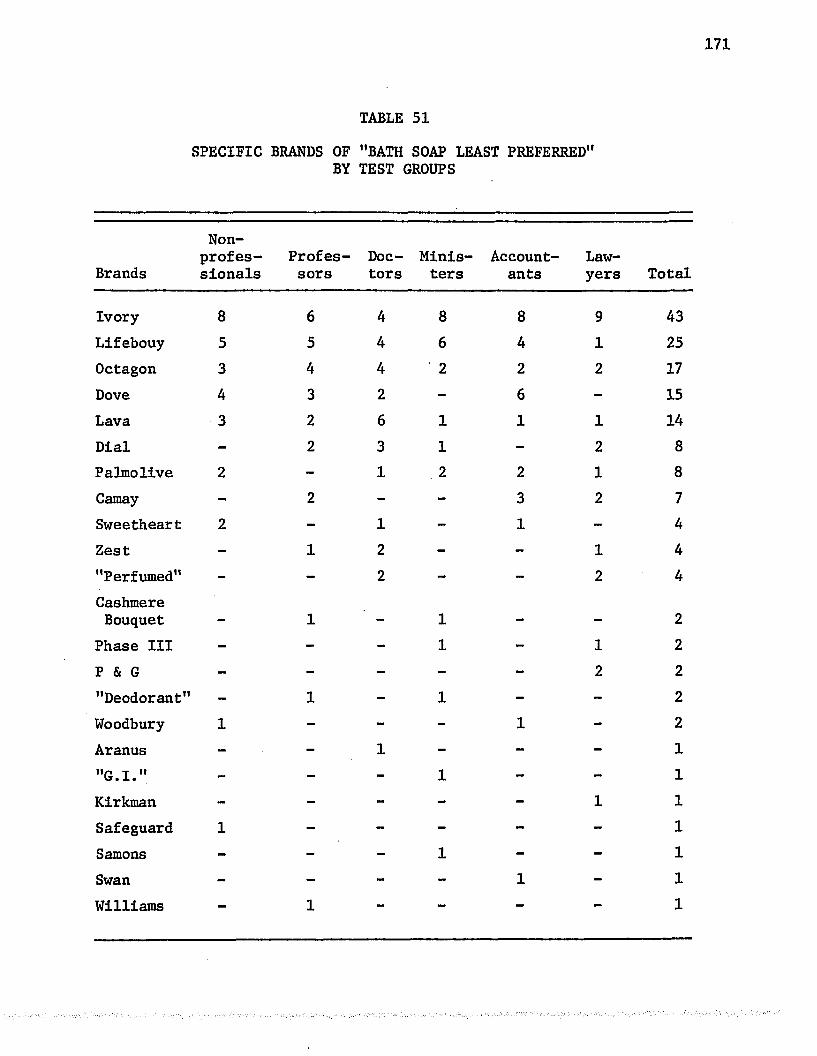
171
TABLE 51
SPECIFIC BRANDS OF "BATH SOAP LEAST PREFERRED"BY TEST GROUPS
Non-profes Profes Doc Minis Account Law
Brands sionals sors tors ters ants yers Total
Ivory 8 6 4 8 8 9 43Lifebouy 5 5 4 6 4 1 25Octagon 3 4 4 2 2 2 17Dove 4 3 2 - 6 - 15Lava 3 2 6 1 1 1 14Dial - 2 3 1 - 2 8Palmolive 2 - 1 2 2 1 8Camay - 2 - - 3 2 7Sweetheart 2 - 1 - 1 - 4Zest - 1 2 - - 1 4"Perfumed" - - 2 - - 2 4CashmereBouquet - 1 - 1 - - 2
Phase III - - - 1 - 1 2P & G - - - - - 2 2"Deodorant" - 1 - 1 - - 2Woodbury 1 - - - 1 - 2Aranus - - 1 - - - 1"G.I." - - - 1 - - 1Kirkman - - - - - 1 1Safeguard 1 - - - - - 1Samons - - - 1 - - 1Swan - - - - 1 - 1Williams — 1 — — — — 1
VITA
Morris Edgar Massey was born in Waco, Texas, on July 13, 1939,
the son of Rose Jewell Massey and Roy Elvin Massey. After graduating
from Waco High School, Waco, Texas, in June 1957, he entered The
University of Texas in Austin, Texas. He received the degree of
Bachelor of Business Administration with a major in advertising from
The University of Texas in June of 1961. He immediately entered the
Graduate School of The University of Texas and began work on the
degree of Master in Business Administration with a major in marketing.
The MBA was received in August of 1962. In September of 1962, he
entered the Graduate School of Louisiana State University at Baton
Rouge, Louisiana. After completing partial requirements for the
Doctor of Philosophy degree in Business Administration, he went to
the University of Colorado, Boulder, Colorado, as an Assistant
Professor of Marketing.
172

EXAMINATION AND THESIS REPORT
Candidate: Morris Edgar Massey
Major Field: Marketing (Business Administration)
Title of Thesis: An Exploratory Study on the Role of ProfessionalOccupational Status as an Influence on Product Perceptions
Appro'
Major Professor and Chairman
Dean of the Graduate School
EXAMINING COMMITTEE:
(X’a uAjui(P' 4 « /S
— QjJui—
JLjL60. <S£Jl _
Date of Examination:
Anril 21. 1969