Embed Size (px)
Citation preview

Digital Commons @ George Fox University
Doctor of Business Administration (DBA)
1-1-2013
An Exploratory Study of the Role of Values inMicroeconomic Decision-Making and theImplications for Organizations and LeadersHolly A. BellGeorge Fox University
This research is a product of the Doctor of Business Administration (DBA) program at George Fox University.Find out more about the program.
This Dissertation is brought to you for free and open access by Digital Commons @ George Fox University. It has been accepted for inclusion in Doctorof Business Administration (DBA) by an authorized administrator of Digital Commons @ George Fox University.
Recommended CitationBell, Holly A., "An Exploratory Study of the Role of Values in Microeconomic Decision-Making and the Implications for Organizationsand Leaders" (2013). Doctor of Business Administration (DBA). Paper 1.http://digitalcommons.georgefox.edu/dba/1

An Exploratory Study of the Role of Values in Microeconomic Decision-Making and the
Implications for Organizations and Leaders
Holly A. Bell
P.O. Box 2889
Palmer, AK 99645
Submitted to the School of Business
George Fox University
In partial fulfillment of the requirements
for the degree of
Doctor of Business Administration
Dr. Paul Shelton, Ph.D., Committee Chair
Dr. Ryan Halley, Ph.D., Committee Member
Dr. Dan Mertens, Ph.D., Committee Member


VALUES IN MICROECONOMIC DECISION-MAKING ii
TABLE OF CONTENTS
ABSTRACT ............................................................................................................................................................. VI
ACKNOWLEDGMENTS .................................................................................................................................. VII
CHAPTER 1 ............................................................................................................................................................. 1
INTRODUCTION ................................................................................................................................................... 1 RESEARCH QUESTIONS ........................................................................................................................................................... 1 HYPOTHESES ............................................................................................................................................................................ 2 CONSTRUCTS AND DEFINITIONS ........................................................................................................................................... 2 DELIMITATIONS ....................................................................................................................................................................... 5 SIGNIFICANCE OF THE STUDY ................................................................................................................................................ 6
CHAPTER 2
LITERATURE REVIEW...................................................................................................................................... 7
STATEMENTS OF FACT IN THE CLASSICAL LANGUAGE OF SCIENCE: .................................. 8
THE RATIONAL ACTOR ................................................................................................................................... 8 HISTORY OF THE FACT/VALUE DICHOTOMY...................................................................................................................... 9
APPLICATION PROBLEMS OF MECHANICAL-MATHEMATICAL ECONOMIC
MODELS ................................................................................................................................................................. 10
THE NEW SCIENCE .......................................................................................................................................... 13 LANGUAGE BEYOND “FACT” ................................................................................................................................................ 13 THE NEW ECONOMICS? ........................................................................................................................................................ 14
ORIGINS OF A POTENTIAL NEW ECONOMICS................................................................................... 16
A MODEL OF DECISION-MAKING BEYOND THE RATIONAL ACTOR ..................................... 19 EINSTEIN AND THE ETHER .................................................................................................................................................. 20 EINSTEIN MEETS ECONOMICS ............................................................................................................................................. 21
CLASSIFICATIONS OF STATEMENTS, THOUGHTS, AND INFORMATION ............................. 26 FACTS INFLUENCED BY VALUES .......................................................................................................................................... 27 VALUES INFLUENCED BY FACTS .......................................................................................................................................... 27 DISTINCTIVE INTEGRATION ................................................................................................................................................. 28 FULL INTEGRATION ............................................................................................................................................................... 28
ROLE OF RELATIONSHIPS, COOPERATION, AND THE INVISIBLE HAND ............................ 28 Figure 2.1. Bell’s ‘New Science’ Value-Inclusive Model of Economic Decision-Making ................................................. 29
FINAL THOUGHTS ON THE ‘NEW SCIENCE’ MODEL........................................................................................................ 30
ALTERNATIVE MODELS AND THEORIES OF VALUE-INCLUSIVE ECONOMIC
DECISION-MAKING .......................................................................................................................................... 31 SURAMANIAM’S FACT/VALUE DISTINCTION .................................................................................................................... 31
Figure 2.2. Subramaniam’s (1963) Diagram of a Model of a Perfect Rational Decision ..................................................... 32 THE MORAL/NON-MORAL NORMATIVE JUDGMENT DISTINCTION ............................................................................. 33 THE NORMATIVE-AFFECTIVE APPROACH......................................................................................................................... 35
Table 2.1 Adapted from William K. Frankena’s Kinds of Normative Judgments from Ethics (1973) .................................................. 36
KINDS OF NORMATIVE JUDGMENTS ................................................................................................................................... 36 Ethical or moral judgments proper: .............................................................................................................................. 36 Nonmoral normative judgments: ..................................................................................................................................... 36

VALUES IN MICROECONOMIC DECISION-MAKING iii
Judgments of moral obligation (deontic judgments): ................................................................................................................................ 36 Judgments of moral value (aretaic judgments): ........................................................................................................................................... 36 Judgments of nonmoral value: ............................................................................................................................................................................. 36 Judgments of nonmoral obligation: ................................................................................................................................................................... 36
BEHAVIORAL ECONOMICS/FINANCE ................................................................................................................................. 39 NEUROECONOMICS ................................................................................................................................................................ 41 NATURALISTIC DECISION-MAKING .................................................................................................................................... 41 OTHER ‘NONRATIONAL’ THEORIES AND MODELS ........................................................................................................... 42 FINAL THOUGHTS ON VALUE INCLUSIVE ECONOMIC DECISION-MAKING MODELS .................................................. 43
VALUE-INCLUSIVE MICROECONOMIC DECISION-MAKING ...................................................... 44
INDIVIDUAL VALUE DEVELOPMENT ..................................................................................................... 44 KOHLBERG AND VALUE DEVELOPMENT ............................................................................................................................ 45 THE NEO-KOHLBERGIAN PERSPECTIVE ............................................................................................................................ 47 SOCIAL LEARNING THEORY ................................................................................................................................................. 50 FINAL THOUGHTS ON INDIVIDUAL VALUE DEVELOPMENT............................................................................................ 53
Figure 2.3. Bell’s ‘New Science’ Value-Inclusive Model of Economic Decision-Making With
Neo-Kohlbergian & Social Learning Values Development ................................................................................. 55
VALUE-INCLUSIVE MICROECONOMIC DECISION-MAKING IN ORGANIZATIONS ......... 55
CHAPTER 3 ........................................................................................................................................................... 59
METHODS ............................................................................................................................................................. 59 SAMPLE ................................................................................................................................................................................... 59 INSTRUMENTATION .............................................................................................................................................................. 61 EXPERIMENTAL DESIGN AND PROCEDURES. .................................................................................................................... 63 PILOT TEST............................................................................................................................................................................. 64 DATA ANALYSIS ..................................................................................................................................................................... 65
Table 3.1 DIT-2 Measured Scores ................................................................................................................................................................................... 65
CHAPTER 4 ........................................................................................................................................................... 68
RESULTS ................................................................................................................................................................ 68
GROUP DESCRIPTIONS - UAA MAT-SU COLLEGE ............................................................................ 70 GROUP 1 .................................................................................................................................................................................. 70 GROUP 2 .................................................................................................................................................................................. 70 GROUP 3 .................................................................................................................................................................................. 71
GROUP DESCRIPTIONS - COLORADO STATE UNIVERSITY ......................................................... 72 GROUP 4 .................................................................................................................................................................................. 72 GROUP 5 .................................................................................................................................................................................. 73 DEMOGRAPHIC SUMMARY ................................................................................................................................................... 75
Table 4.1 Demographic Summary ....................................................................................................................................................... 75
LENGTH OF TIME IN COHORT .............................................................................................................................................. 76 Table 4.2 Length of Time in Cohort .................................................................................................................................................... 76
DIT2 MEASURED SCORES DATA ................................................................................................................ 77 MSC SCORES .......................................................................................................................................................................... 78
Table 4.3 MSC Postconventional Schema Score Descriptive Statistics................................................................................................................... 78 Figure 4.1. MSC PScore Posttest Figure 4.2. MSC PScore Pretest ................................................................................................ 79

VALUES IN MICROECONOMIC DECISION-MAKING iv
Table 4.4 MSC N2 Index Score Descriptive Statistics .................................................................................................................................................... 80 Figure 4.3. MSC N2Score Pretest Figure 4.4. MSC N2Score Posttest ......................................................................................... 80 Table 4.5 MSC Utilizer Score Descriptive Statistics ....................................................................................................................................................... 81 Figure 4.5. MSC Utilizer Pretest Figure 4.6. MSC Utilizer Posttest .............................................................................................. 82
CSU SCORES ........................................................................................................................................................................... 82 Table 4.6 CSU Postconventional Schema Score Descriptive Statistics ................................................................................................................... 82 Figure 4.7. CSU PScore Pretest Figure 4.8. CSU PScore Posttest ................................................................................................ 82 Table 4.7 CSU N2 Index Score Descriptive Statistics .................................................................................................................................................... 84 Figure 4.9. CSU N2Score Pretest Figure 4.10. CSU N2Score Posttest ....................................................................................... 84 Table 4.8 CSU Utilizer Score Descriptive Statistics ....................................................................................................................................................... 85 Figure 4.11. CSU Utilizer Pretest Figure 4.12. CSU Utilizer Posttest ......................................................................................... 86
ALL DATA SCORES ................................................................................................................................................................. 86 Table 4.9 All Data Postconventional Schema Score Descriptive Statistics ........................................................................................................... 87 Figure 4.13. All Data PScore Pretest Figure 4.14. All Data PScore Posttest ............................................................................. 87 Table 4.10 All Data N2 Index Score Descriptive Statistics ............................................................................................................................................. 88 Figure 4.15. All Data N2Score Pretest Figure 4.16. All Data N2Score Posttest ....................................................................... 88 Table 4.11 All Data Utilizer Score Descriptive Statistics ................................................................................................................................................ 89 Figure 4.17. All Data Utilizer Pretest Figure 4.18. All Data Utilizer Posttest ............................................................................ 90
NUMBER OF VALUES SHARED SCORES .............................................................................................................................. 90 Table 4.12 Shared 10+ Postconventional Schema Score Descriptive Statistics ..................................................................................................... 91 Table 4.13 Shared 5 Postconventional Schema Score Descriptive Statistics ........................................................................................................... 91 Figure 4.19. 10+ PScore Pretest Figure 4.20. 10+ PScore Posttest ............................................................................................... 92 Figure 4.21. 5 PScore Pretest Figure 4.22. 5 PScore Posttest .......................................................................................................... 92 Table 4.14 Shared 10+ N2 Index Score Descriptive Statistics ...................................................................................................................................... 93 Table 4.15 Shared 5 N2 Index Score Descriptive Statistics ............................................................................................................................................ 93 Figure 4.23. 10+ NScore Pretest Figure 4.24. 10+ NScore Posttest ............................................................................................. 94 Figure 4.25. 5 NScore Pretest Figure 4.26. 5 NScore Posttest ........................................................................................................ 94 Table 4.16 Shared 10+ Utilizer Score Descriptive Statistics ......................................................................................................................................... 95 Table 4.17 Shared 10+ Utilizer Score Descriptive Statistics ......................................................................................................................................... 95 Figure 4.27. 10+ Utilizer Pretest Figure 4.28. 10+ Utilizer Posttest ............................................................................................. 96 Figure 4.29. 5 Utilizer Pretest Figure 4.30. 5 Utilizer Posttest........................................................................................................ 96
RESULTS SUMMARY .............................................................................................................................................................. 98 Table 4.18 Results Summary .................................................................................................................................................................... 98
CHAPTER 5 ........................................................................................................................................................... 99
DISCUSSION ......................................................................................................................................................... 99 POSTCONVENTIONAL AND N2 SCORES .............................................................................................................................. 99 NORM COMPARISONS POSTCONVENTIONAL AND N2 SCORES ................................................................................... 100 NON-NORMED FACTORS FOR POSTCONVENTIONAL AND N2 SCORES ...................................................................... 102 UTILIZER SCORES ............................................................................................................................................................... 106 RESEARCH CONCLUSIONS ................................................................................................................................................. 108 LIMITATIONS ....................................................................................................................................................................... 110 IMPLICATIONS FOR ORGANIZATIONS AND LEADERS .................................................................................................... 112

VALUES IN MICROECONOMIC DECISION-MAKING v
IMPLICATIONS FOR ACADEMICIANS ................................................................................................................................ 115 RECOMMENDATIONS FOR FUTURE RESEARCH .............................................................................................................. 116 CONCLUSION........................................................................................................................................................................ 117 REFERENCES ....................................................................................................................................................................... 121
APPENDIX A
DEFINING ISSUES TEST-2 AND DEMOGRAPHIC QUESTIONS
PRE-TEST ........................................................................................................................................................... 137
APPENDIX B
DEFINING ISSUES TEST-2
POST-TEST ......................................................................................................................................................... 151
APPENDIX C
VALUES/ANTI-VALUES PROMPTS ......................................................................................................... 160
APPENDIX D
VALUES EXPRESSED .................................................................................................................................... 161
APPENDIX E Shared Values Set: Group 1 ........................................................................................................................................... 163 Shared Values Set: Group 2 ........................................................................................................................................... 164 Shared Values Set: Group 3 ........................................................................................................................................... 165 Shared Values Set: Group 4 ........................................................................................................................................... 166 Shared Values Set: Group 5 ........................................................................................................................................... 167
APPENDIX F
N2 SCORE DESCRIPTIVE STATISTICS AND T-TEST RESULTS BY GROUP ......................... 168
APPENDIX G
STAGE 23 AND 4P DESCRIPTIVE STATISTICS AND T-TESTS ..................................................... 173
APPENDIX H
GEORGE FOX UNIVERSITY HUMAN SUBJECTS COMMITTEE APPROVAL ....................... 188

VALUES IN MICROECONOMIC DECISION-MAKING vi
Abstract
This research is designed to test the role reflecting on and sharing values plays in our
individual decision-making schemas in a group. The research is based on evidence from
the literature that values play a role in economic decision-making, can be formed and
utilized either consciously or unconsciously, and impact microeconomic decision-making
and ethics in organizations. The study found that when decision considerations were
reframed in a values context the decision-making process became more quasi-rational,
but the decisions participants made were as good or better than they were before values
were introduced. In some cases decision-makers became less interested in personal
considerations after decisions were framed in a values context. This is an important
finding because traditional models of economic decision-making assume the decision-
making process is always rational and decision-makers are always self-interested. There
may also be some relationship between utilizing values and improved ethical decision-
making for women within small groups with relatively strong relationships in a
community.
Keywords: economic decision-making, schemas, values, values in decision-
making, organizational behavior.

VALUES IN MICROECONOMIC DECISION-MAKING vii
Acknowledgments
The hard work of a dissertation is often traversed alone in a darkened room lit
only by a computer screen while everyone else is asleep. This does not mean I was not
supported and I would like to acknowledge those who have been by my side during this
journey.
First, I would like to acknowledge Drs. Paul Shelton, Ryan Halley, and Dan
Mertens who served as my dissertation committee. Your comments and critiques were
helpful, encouraging, challenging, and intellectually stimulating. I never felt your
intention was to make me fail, but only to help make me a better researcher. I also want
to thank Dr. Paul Shelton for allowing me to use class time with his students to conduct
experiments at Colorado State University.
I want to thank my husband, Eldon, who put up with eating a lot of oatmeal for
dinner over the past several years and didn’t complain once. We also had to give up many
of the activities we enjoy doing together and I promise, we will learn to have fun again.
I also want to acknowledge my colleagues at the Mat-Su College of the
University of Alaska Anchorage for their support and encouragement. You were very
understanding when I declined to take on a project or sit on a committee and many of you
generously offered your class time so I could run the experiments used in this
dissertation.
I would also like to thank Ian, Shad, Belle, and Estle, my GFU cohort, who have
kept me going throughout the program and the dissertation process. Our regular Skype
calls have been a great place to compare notes, get help and, at times, vent. You are the
only people who will ever really understand.

VALUES IN MICROECONOMIC DECISION-MAKING 1
An Exploratory Study of the Role of Values in Microeconomic Decision-Making and the
Implications for Organizations and Leaders
Chapter 1
Introduction
Much of the traditional economic decision-making models that are still in use
today are based on the assumptions of rational choice and self-interest. These
assumptions create a fact/value dichotomy. However, there is evidence that while
assumptions of rationality and self-interest are normative constructs, the way we actually
make decisions incorporates both facts and values (Bell, 2011b; Binmore, 2007; Nelson,
2003; Putnam, 2002). The purpose of this exploratory research is to test the role
reflecting on and sharing values plays in our individual decision-making schemas in
groups. Specifically, can introducing values into decision considerations disrupt existing
unconscious schemas? Implications for microeconomic decision-making in organizations
will also be considered.
Research Questions
The framework of this exploratory study was based on the following research
questions:
What role do values play in microeconomic and other decision-making?
How does the reflection on and sharing of personal values associated with
decisions impact future decisions?

VALUES IN MICROECONOMIC DECISION-MAKING 2
How does sharing personal values with others impact their decision-making
schemas?
Hypotheses
This study used an instrument designed to measure unconscious schemas in
ethical decision-making using a pre- and posttest design. The instrument, the DIT2, has
proven very reliable and has been used in over 400 published studies (see “Instrument”
section of this paper). Extensive use of the DIT2 has found that pre- and posttest results
without any intervention have proven to be the same with no statistically significant
movements in scores (Rest, Narvaez, Thoma, & Bebeau, 2000). Based on that data we
can assume that if the planned intervention in this experiment has had no impact on
decision-making, the statistically significant differences in the mean values of any
measured data pre- and posttest will be 0. Given this information the hypotheses are as
follows:
H0: D = 0
H1: D ≠ 0
Where D is the difference between mean DIT2 scores.
Constructs and Definitions
The discussion of value-inclusive economic decision-making introduces
constructs that not everyone might be familiar with. For purposes of this study the
following definitions were utilized:
Decision considerations. A decision consideration is a matter weighed or taken
into account when forming a decision.

VALUES IN MICROECONOMIC DECISION-MAKING 3
Opportunity set. The opportunity set in decision-making is defined by Sen
(1994) as “the anticipated set of alternative outcomes…which the person reckons she can
have through different choices of her strategy” (p. 385). One example would be a
manager who wishes to solve a problem in which an employee has excessive absences
(the strategy is to solve the absence problem). The opportunity set is the set of alternative
actions the manager believes he or she can take to solve the problem. The opportunity set
can be influenced by factors other than rational choice like ethics and epistemology
(within the values ether) causing “menu-dependency”.
Menu dependence. When the opportunity set is influenced by ethics, social
behavior, epistemology, or other non-rational choice influences that narrows the
opportunity set. A good example of menu-dependent behavior is choosing not to take the
last apple in a bowl (Sen, 1994).
Decision set. The decision set is the actual outcome chosen from the opportunity
set. In the example above it would be the action the manager actually takes (or intends to
take) to solve the problem. This could be a single decision by a single person, but is most
often used to describe the aggregate of decisions made by a number of individuals facing
a similar problem or situation. The decision and its impacts may influence future
opportunity sets and decisions (Bell, 2011b; Sen, 1994).
Personal Values. These are a type of value to which an individual is committed
and which influences his or her behavior (Kaushal & Janjhua, 2011; Theodorson &
Achilles, 1969).

VALUES IN MICROECONOMIC DECISION-MAKING 4
Schemas. The group of values/ethics/morals an individual unconsciously
possesses in long-term memory that structure and guide an individual’s thinking and
decision-making.
Values. Several short definitions of values exist including:
“Values can refer to the desired or to the desirable, and the two are not
equivalent…values determine our subjective definition of rationality”
(Hofstede, 2001, pp. 1-6).
Prescriptive statements of what ought to be (Putnam, 2002).
However, for this study we used Hall, Guo, and Davis (2002) more comprehensive
definition. They define values as:
…cognitive scripts or cognitive maps or as value schemata (determinants
of action)…[values] define the primary perspective that an individual uses
to make sense of a new problem scenario and to generate solutions. These
values generate perspectives that fundamentally restrict the way the
individuals ‘see’ the world, interpret information, and make decisions…
there are six types of personal values (perspectives) that individuals
exhibit…theoretical, social, political, religious, aesthetic, and economic.
(pp. 2-3)
Values can also be used as a form of persuasion in “situations of practical
reasoning”, which is consistent with the assertions of this paper. Bench-Capon
(2003) describe the role of values in these cases is to “persuade rather than to
prove, demonstrate or refute” (p. 429). He further states that:
VALUES IN MICROECONOMIC DECISION-MAKING 5
…persuasion in such cases relies on a recognition that the strength of an
argument depends on the social values that it advances, and that whether
the attack of one argument on another succeeds depends on the
comparative strength of the values advanced by the arguments concerned.
(p. 429)
It is also important to note that the terms values, morals, and ethics are
often used interchangeably to express the same construct. For purposes of this
paper they are considered the same.
Values ether. It is the unseen medium that binds together all the value factors that
lead us to a decision.
Values reflection. Refers to internally contemplating the values associated with
decision considerations.
Values sharing. Refers to sharing the values you have assigned to decision
considerations with others.
Delimitations
While the types of factors beyond rational self-interest that individuals consider
are numerous, this study will be delimited to values. Specifically, whether reflection on
and sharing of values related to decision-making criteria impacts the way in which
individuals make ethical decisions in a group.
As the types of economic decisions individuals make are numerous the scope of
the study will be delimited to microeconomic applications for individual value-inclusive
decisions in groups.

VALUES IN MICROECONOMIC DECISION-MAKING 6
Significance of the Study
Much has been written about the mechanical-mathematical models of economic
decision-making based on assumptions of rational self-interest and utility maximization
for both individuals and organizations, yet little attention has been given to the empirical
study of the role of values in individual decision-making in groups and how this might
impact microeconomic decision-making in organizations. Specifically, whether reflecting
on and sharing values associated with decision considerations changes the unconscious
schemas individuals’ develop that influence their decision-making. If these schemas can
be disrupted, it provides support for the influence of group, societal, environmental, and
organizational values in microeconomic decision-making creating implications for
organizations and managers.
This research is timely as academicians and practitioners are looking for ways to
incorporate (and explain) behavioral and other factors in decision-making that go beyond
rational choice (Pressman, 2005; Putnam, 2002; Sen, 1994, 2004, 2005; Thaler &
Sunstein, 2009; ). Some less prominent, yet equally antithetical theories seek ways to
create more organic models and incorporate complex systems and ‘new science’ to
explain observations of human decision-making behavior (Bozicnik & Matjaz, 2009;
Mikhalevskii, 1971; Wheatley, 2006).

VALUES IN MICROECONOMIC DECISION-MAKING 7
Chapter 2
Literature Review
This literature review begins by developing a theory of value-inclusive economic
decision-making that will be used as the basis for this research. Alternative models and
theories of value-inclusive economic decision-making from the literature will also be
reviewed. The literature review concludes with a more specific discussion of value-
inclusive microeconomic decision-making including individual value development and
the importance of value-inclusive microeconomic decision-making in organizations.
Toward Value-Inclusive Economic Decision-Making1
Much of contemporary economic thought seeks to remove all value judgments
from the discussion of economic decision-making in favor of the rational choice
tautology. Considerations of the “softer” social science aspects of economic thought have
been replaced with mechanical-mathematical models in an effort to move the discipline
closer to the hard sciences (Binmore, 2007; Nelson, 2003; Putnam, 2002). In order to
allow empirical testing of the established mathematical models, the assumption of
rational actors is required. To address the issues of complexity associated with economic
decision-making that makes absolute rationality problematic, many economists consider
the rationality assumption to be bounded rationality; limited by time, available
information, and cognitive ability.
1 Note: This portion of the paper was originally published open source in 2011 in the European Journal of
Social Sciences, 21(4), 638-649. The publisher has granted permission for use of the manuscript by the
author for educational and non-profit purposes. It has been modified for this paper, but remains
significantly as originally published.

VALUES IN MICROECONOMIC DECISION-MAKING 8
The purpose of this section is to explore whether there is a more holistic and
organic approach to economic theory that allows for the coexistence of facts and values
within economics while simultaneously moving closer to the hard sciences, specifically
the natural and physical sciences.
Statements of Fact in the Classical Language of Science:
The Rational Actor
As discussed previously, the utilization of scientific mathematical models requires
the assumption of rational actors in economic decision-making. This assumption has
become problematic for many scholars (Angner & Loewenstein, 2007; Putnam, 2002;
Tideman, 2005; Yuengert, 2000). Do individuals always behave rationally? Does one
person define rationality the same as another? If a decision is rational for one person is
the same decision also rational for another? Most people can look at anecdotal evidence
in our own lives that indicates people do not always act in a rational manner. Many
factors such as stress, emotions, experience, and moral or ethical values can all impact
“rational” decision-making.
The language of science does not allow for the consideration of these
psychological or value factors in the analysis of economic decision-making. Value
statements are viewed as subjective, while “fact” statements are considered objective and
appropriate for scientific analysis. In science “matters of fact” are considered statements
that describe what “is” while “relations of ideas” (values) are prescriptive statements of
what “ought” to be (Putnam, 2002). Putnam describes the split of values and facts in the
“scientific” study of economics as going beyond a distinction to a jointly exhaustive and

VALUES IN MICROECONOMIC DECISION-MAKING 9
mutually exclusive dichotomy that does not allow facts and values to coexist within the
analysis.
History of the Fact/Value Dichotomy
Aristotle first proposed a distinction between facts and values, which he described
as positive (what is) and normative (what one should do) inquiry. However, until the
early twentieth century positive and normative inquiry within the sciences, while
distinctive, coexisted in a hierarchical relationship. Ethics/prudence was “by nature above
all other disciplines”. This normative inquiry made use of the subordinate inquiries “in
pursuit of the highest human ends, and was in turn the justification and motivating force
behind the inquiries of the various subordinate sciences” (Yuengert, 2000, p. 1).
The fact/value dichotomy of the early twentieth century created problems
regarding how “facts” should be defined within the language of science. Putnam (2002)
provides a comprehensive discussion of these issues summarized in the following
paragraphs. The logical positivism that emerged at the beginning of the twentieth century
believed that judgments fell into one of three classifications:
1) “Synthetic” judgments were those that were empirically verifiable or falsifiable.
2) “Analytic” judgments were true [or false] on the basis of logical rules alone.
3) “Cognitively Meaningless” judgments included ethical, metaphysical, and
aesthetic judgments. These value judgments were not considered within the field
of science.
Distinguishing between synthetic and analytic judgments was problematic in part
because there was a difference of opinion about whether the truths of mathematics were
analytic or synthetic. Kant believed mathematics is both synthetic and a priori while the

VALUES IN MICROECONOMIC DECISION-MAKING 10
logical positivists believed the principles of mathematics are analytical. When the
assumption (as discussed by Putnam, 2002) that the principles of mathematics are
synthetic is removed, there becomes a wide range of ordinary distinctions (both analytic
and purely descriptive) available.
Another problem raised by the logical positivists was that in order for the
synthetic/analytic distinction to be true, it must work when applied to every statement of
theoretical physics. For example, we must ask if the Principle of the Conservation of
Energy is analytic or synthetic in order to fully “rationalize” physics. This proved to be
problematic, as atoms could not be “observed” before microscopes; and physics moved
into the areas of relativity theory and quantum mechanics. Yet many scientists believed
that a scientific statement of fact must be “conclusively verifiable by confrontation and
direct experience” (Putnam, 2002, p. 22). The language of science continued to insist,
“the predicates admitted into the ‘factual’ part of the language of science had to be
‘observational terms’ or reducible (by specified and limited means) to observation terms”
(Putnam, 2002, p.23). The “reductionistic unholistic view” (Bozicnik & Matjaz, 2009) of
science made discussions about bacteria, electrons, charges, or the gravitational field
irrational.
Application Problems of Mechanical-Mathematical Economic Models
As the previous discussion of Putnam’s work emphasizes, the language of the
hard sciences seeks rational outcomes based on statements of fact that are empirically
measurable. This requires the dichotomy of facts and values. However, defining “facts” is
problematic even in the hard sciences.

VALUES IN MICROECONOMIC DECISION-MAKING 11
In an effort to allow “scientific” mathematical analysis of economics, the
assumption must be made that the actors involved act in a rational, self-interested manner
with factual judgments separated from value judgments in economic decision-making.
The implication of the assumption of rationality is that actors will seek to maximize
utility through their economic decision-making. This also assumes that they have all
information required to make the optimal decision, have not learned from previous
experiences, and are not influenced by other people; rationality is assumed to be inherent
(Putnam, 2002).
Researchers in strategic behavior have found problems with these assumptions
when using game theory to study rational behavior in small groups where individual
actors can impact the well-being of others. The results found that multiple equilibria were
possible and that a “very high order” of rationality was needed to determine an
individual’s optimal strategy. The studies also found that learning and natural selection
can have an impact on optimal behavior in practice (Schmalensee, 1991). Other
experiments found that while individual “reasoners” behave intelligently, they do behave
differently than the theory of pure economic rationality would expect (“Philosophy of
Economics,” 1998)
To address the issue of the inability of individual actors to consistently act in a
rational manner, the subject of economics was divided into micro-and macroeconomics to
accommodate (and inspired by) Keynes and his General Theory (Groenewegen, 2003).
Keynes believed that economic behavior should be measured at the aggregate level and
not the “atomic” or micro level of neoclassical theory (Togati, 2001). Using the rational,
mechanical, mathematical, and fact driven structure of the hard sciences made discussion

VALUES IN MICROECONOMIC DECISION-MAKING 12
of economics at the “atomic” level as difficult as it did for physics. However, Keynes’
approach was consistent with the increasingly narrow specialization within the hard
sciences (Bozicnik & Matjaz, 2009).
The mechanical aspects of the classical language of science are also problematic
when applied to the study of economics. The mechanical, fact driven model of classical
science creates a relatively closed system of exploration. As a result, economic models
utilizing this system end up closed within the confines of science. An extensive list of
assumptions, described by Mikhalevskii (1971), are required to fit within the confines of
a closed, mechanical system. Among them are the assumptions of “a consistent, stable,
and …constant system of values” and conformity to the utility maximization criterion as
the only constant and final goal. Mikhalevskii also finds “the narrowness of the
statistical and dynamic definition of individual and social motivation” to be problematic
(pp. 7-8). Mechanical models fail to consider relationships and their impact on the overall
economic system. He states there is no:
…mechanism for explaining internal conflicts in the process of development
(except competition) on the basis of the influence of the environment and the
internal structure of the very system through direct relations and feedback and
compounding relations based upon them… (p. 8)
There is also no mechanism to measure the impact of individuals on the system when
utilizing a Keynesian macroeconomic approach (Bozicnik & Matjaz, 2009).

VALUES IN MICROECONOMIC DECISION-MAKING 13
The New Science
Language Beyond “Fact”
As previously discussed, the classical language of science, using restrictive
statements of fact, made discussion about bacteria, electrons, charges, or the gravitational
field irrational. This became increasingly problematic as “new science” emerged in
biology, evolution, chaos theory, relativity theory, and quantum physics. Suddenly
science was forced to look at the world in a different way. The world began to appear less
mechanical and orderly, and more creative, dynamic, and engaged in continuous change
while maintaining order. (Wheatley, 2006)
Ganley (1995) discusses the revolutionary fervor of theoretical physics at the
beginning of the twentieth century. Areas of expanded theoretical interest for scientists
included quantum physics, the special and general theories of relativity, a theory of the
inner workings of the atom, Heisenberg’s uncertainty principle, quantum mechanics, and
the early stages of research in quantum electrodynamics. Research in the “new science”
created changes in methodology for scientists. The world around them was no longer
viewed as strictly mechanical and outside our influence. Ganley quotes Albert Einstein
regarding the new physics: “physical concepts are free creations of the human mind, and
are not, however, it may seem, uniquely determined by the external world” (p. 397).
Establishment of the new language of physics also required a new way of thinking
about the world. Scientists were forced to look beyond “facts” to possibilities,
probabilities and not just predictions. They came to realize that the natural world did not

VALUES IN MICROECONOMIC DECISION-MAKING 14
always behave the same way twice, yet maintained orderliness (Wheatley, 2006). As
Fritjof Capra (1983) stated:
In their struggle to grasp this new reality, scientists became painfully aware
that their basic concepts, their language, and their whole way of thinking were
inadequate to describe atomic phenomena. Their problem was not only
intellectual but involved an intense emotional and existential experience… (p.
76)
One example included experiments that determined electrons behave in an inconsistent
manner. Sometimes they behave like particles (matter) and at other times they behave
like waves (energy) (Bozicnik & Matjaz, 2009).
Bozicnik & Matjaz (2009) describes the evolution of scientific thought moving
from determinism, to interdependence, to dialectical dynamics that recognize the “unity
in diversity of everything around us” (p.347).
The New Economics?
While changes in language and methodology were being made in the scientific
community to change the way natural phenomena were discussed, predicted, and
described, the economic discipline was slow to respond. Noted historian and philosopher
of economic thought, Philip Mirowski, believed that neoclassical economics was based
on mid-nineteenth century physics that clung to outdated mathematical techniques that
did not seek to make economics like science, but “a mathematically rigorous discipline”
(Ganley, 1995, p.398). Science had evolved, with scientists like Einstein allowing for
nonobservable factors (Togati, 2001). However, the study of economics has not evolved
in the same manner primarily in the name of mathematical rigor.

VALUES IN MICROECONOMIC DECISION-MAKING 15
Economists agree that mathematics is still important to “provide a social-scientific
basis for understanding, explaining, and, perhaps, predicting economic phenomena”
(Routledge, 1998, para 10). However, when economists ask a question such as: “Are
inflation and unemployment related?” they may be able to use mathematical models to
answer yes or no, but economists need to go beyond mathematics to explain the often-
unobservable causes. On this topic the Routledge Encyclopedia of Philosophy of Sciences
states:
…the approach to economic theorizing that stipulates that the discipline is
purely formal will not aid in shedding light on these real, though
unobservable, economic mechanisms. On this line of thought, the persistent
mathematization of economics ought to be construed as a means to an end
rather than the end itself. The formal or mathematical machinery of economics
is intellectually valuable only insofar as it contributes to a better
understanding of real, empirically given economic processes, causes, and
systems. (para. 10)
The “new economics” should look beyond the assumptions of economic actors
being rational, self-interested, and autonomous maximizers required to fit the science of
economics into the “Newtonian idea of a clockwork world” (Nelson, 2003, p. 5). Looking
beyond requires economists to include unobservable factors such as values, ethics,
expectations, motivations, culture, and the impact of relationships and cooperation on
economic decision-making.

VALUES IN MICROECONOMIC DECISION-MAKING 16
Origins of a Potential New Economics
This paper has discussed how the origins of the neoclassical school of economic
research was found in mid-nineteenth century physics (Ganley, 1995) as economists
sought to utilize the same mathematical methodology. The early twentieth century
brought a division of micro- and macroeconomics to accommodate Keynes by removing
the problems associated with the rational explanation of both science and economics at
the “atomic” level (Groenewegen, 2003). While the methodology of science was
evolving as new fields of inquiry emerged, the field of economics did not respond in a
similar manner. Some scholars might argue that Keynes was using Einstein’s approach to
the theory of relativity when he developed his General Theory of Employment, Interest,
and Money, (Togati, 2001) others, including this author, see applications to Einstein’s
theory of relativity that are quite different. If the origins of the new economics didn’t
reside with Keynes, where did (or will) they come from? The answer to this question
requires revisiting the origins of the science of economics.
The first attempt to establish an analytical form of economic science was made by
François Quesnay and a group of French statesmen and philosophers in the mid-
eighteenth century. The foundation of their policy was obedience to Nature (Marshall,
1890/1920). However, as Marshall goes on to explain, these early economists lost their
way when they attempted to incorporate the scientific methods of the physical sciences:
…there was much in the tone and temper of their treatment of political and
social questions which was prophetic of a later age. They fell however into a
confusion of thought which was common even among scientific men of their

VALUES IN MICROECONOMIC DECISION-MAKING 17
time, but which has been banished after a long struggle from the physical
sciences. They confused the ethical principle of conformity to Nature, which
is expressed in the imperative mood, and prescribes certain laws of action,
with those causal laws which science discovers by interrogating Nature, and
which are expressed in the indicative mood. (Marshall, 1890/1920; Appendix
B.7)
Statements of fact rather than signals of direction continue to dominate economic
thought in the twenty-first century. Another important point to note regarding the
structure of the emerging economic science as described by both Quesnay and Adam
Smith is that the micro- and macroeconomic elements were blended and merged, treating
the subject as a whole without artificial distinctions. The intellectual climate also allowed
for positive and normative economics to exist simultaneously. Smith, and later Marshall,
blended their discussion of economics with a mix of facts and theories (Bozicnik &
Matjaz, 2009; Groenewegen, 2003).
After Quesnay, Marshall credits Adam Smith as having the next great step in
advance within the discipline of economics. The very title of Smith’s major work, An
Inquiry Into the Nature and Causes of the Wealth of Nations, implies economic systems
are natural phenomena. It also calls for the exploration of causation, not simply factual
description. He also recognizes the unobservable by noting that while man may attempt
to control these natural economic systems, they continue to be “led by an invisible hand
to promote an end which was not part of his intention” (Smith, 1776/1904; para. IV.2.9).
Smith (1776/1904) was also concerned with the “evolutionary factors in
explaining economic development,” which included discussion about the nature of

VALUES IN MICROECONOMIC DECISION-MAKING 18
society and government, and the role of culture and the arts. Smith saw economic systems
as dynamic and constantly changing (Bozicnik & Matjaz, 2009; Groenewegen, 2003). He
also recognized the role of “moral” and “natural” sentiments of economic actors in
decision-making (Smith, 1759/1790).
Sen (2004) discusses a deeper analysis of Adam Smith’s work that demonstrates
that Smith did not believe self-interest was the only motivator of people. He states: “…he
discussed extensively the prevalence and the important social role of such values as
sympathy, generosity, public-spiritedness and other affiliative concerns” (p.9). In another
work Sen (1994) discusses that the pioneers of utility theory (including John Stuart Mill,
William Stanley Jevons, Francis Y. Edgeworth, and Alfred Marshall) explicitly accepted
a variety of motivations for economic decision-making.
Based on this discussion it is fair to conclude that early economic theorists
believed that the discussion of economics belonged within the context of our natural and
holistic world, which includes multiple motivations for economic decision-making. The
science of economics lost this framework of discussion when it moved toward the
increasingly factual language of the physical sciences. The language and methodology of
the sciences changed at the beginning of the twentieth-century, while the field of
economics remained trapped within the mid-nineteenth century model. However,
returning to the origins of economic science reveals greater parity with the “new science”
than current mechanical-mathematical models. Based on this evidence, is it possible to
build a theoretical framework for the discussion of economic decision-making that is
consistent with both classical economic thought and the new science?

VALUES IN MICROECONOMIC DECISION-MAKING 19
A Model of Decision-Making Beyond the Rational Actor
While the discussion of economic models within the context of classical
economic thought and the new science has broad applications, the limited space of this
paper requires the scope of this discussion to be limited to economic decision-making.
While the discussion thus far has focused on a potential “new economics,” it is probably
necessary to further define and identify what that encompasses. To be consistent with
contemporary scientific thought, this paper will use Bozicnik and Matjaz (2009)
description of a holistic, interdependence-based system that recognizes the “unity in
diversity of everything around us.” This “new science” view of economic systems allows
for:
1) Inclusion of the unobservable.
2) Recognition of complex systems.
3) The ability of the individual “atomic” actor to influence the system and
determine “reality” with their interventions.
4) The ability of the system to influence the actor.
5) Multiple equilibria and inconsistent behavior.
6) Recognition of the role of relationships and cooperation in economic behavior.
7) Inclusion of values/ethics/morality.
8) Inclusion of information and learning in decision-making.
This view is also consistent with classical economic thought in that it looks at
economic systems holistically with no division between micro and macro elements, or
positive and normative statements. Fact and theory are allowed to coexist. It allows for
the inclusion of “sentiments” (values, ethics, and morals), the unobservable (i.e. the

VALUES IN MICROECONOMIC DECISION-MAKING 20
invisible hand), the exploration of causation across a broad spectrum of possibilities, and
allows for “evolution” of economic systems with changing cause and effect that can
include multiple goals and objectives over time.
Einstein and the Ether
The major inspiration for the value-inclusive economic decision-making model
discussed later in this paper was an address delivered on May 5th
, 1920, in the University
of Leyden by Albert Einstein entitled Ether and the Theory of Relativity. This insight into
Einstein’s views of the “new science” has strong parallels with a potential theoretical
model for economic decision-making.
In his address, Einstein rejects Newton’s notion of dualism in nature, both in
general and as it relates to the theory of gravity. Specifically, that there can be “reciprocal
action only through contact, and not through immediate action at a distance” (Einstein,
1920, p. 1). To solve this problem, and to unify the view of the nature of forces, Einstein
supports the existence of an “ether.” The ether is an inert medium that fills up universal
space and conveys forces by elastic deformation of the medium. This explains how
movement is possible with both direct contact (mechanical and seen) and distant contact
(non-mechanical and unseen). This is much like a boat being able to be moved through
the water either by pushing it (direct contact) or by the ripples created by the wake of
another boat (distant contact).
The ether allows both seen mechanical forces like densities, velocities, and
stresses to coexist with the unseen electric and magnetic forces, and abandons the
dualism that existed. He also states: “the ether of the general theory of relativity is a

VALUES IN MICROECONOMIC DECISION-MAKING 21
medium which is itself devoid of all mechanical and kinematical qualities, but helps to
determine mechanical (and electromagnetic) events” (Einstein, 1920, p. 4). Einstein also
describes ether as being indistinguishable from ponderable matter, which, at least in part,
subsists in the ether. Within the theory of relativity the state of the ether is “at every place
determined by connections with the matter and the state of the ether in neighbouring
places…” (p. 5). In other words, the state of the ether is determined by its relationships
with the matter and its state relative to the states around it.
While the ether was necessary for Einstein’s General Theory of Relativity, he is
said to have rejected it later when he developed his Special Theory of Relativity.
Hawking (2001) states that Einstein believed that the notion of an ether was “redundant,”
as proposed in a 1905 article. Yet in the 1920 address discussed here he does not reject
the notion of an ether, simply a change in his conception of it. Einstein states: “More
careful reflection teaches us, however, that the special theory of relativity does not
compel us to deny ether” (p. 3). Einstein believed we could continue to assume the
existence of an ether, but we must not ascribe to it a definite state of motion, removing all
mechanical characteristics as discussed earlier in this section. He does believe, however,
that the ether can still be characterized as a medium.
Einstein Meets Economics
The problem with dualism in nature faced by Einstein parallels with the dualism
problem associated with the fact/value dichotomy of current economic thought. The
assumption of the dichotomy is that economic statements can be made through fact alone
and not through the influence of values. According to Hume, we cannot determine an
“ought” from an “is” (Putnam, 2002). However, to be consistent with the new science,

VALUES IN MICROECONOMIC DECISION-MAKING 22
the fact/value dichotomy should be removed because “evaluation and description are
interwoven and interdependent” (Pressman, 2005; p. 485)
The values ether. To unify this view of economics the existence of a “values
ether” as a medium through which statements, thought, and information move is
proposed. Einstein (1920) describes the ether as both conditioning the behavior of inert
masses, and being conditioned by them. In the economic decision-making process (which
moves through the “values ether”), the ether not only conditions our decisions, but is also
conditioned by our decisions. Also consistent with Einstein’s theory, economic decisions
are partially conditioned by decisions outside the territory under consideration (see
Einstein, 1920, p. 4). While the decisions themselves do not reside within the values
ether, the statements, thoughts, information, and previous decisions necessary to make
new decisions move through the medium of the values ether and help determine
economic decisions.
The ongoing conditioning of the ether and the statements, thoughts, information,
and previous decisions moving through it causes learning to take place and economic
decisions to change over time. It also causes individuals, businesses, and societies to react
differently to different economic stimuli even when they have the same information,
especially over time. Mikhalevskii (1971) sees the future of economic analysis being
based on continuous learning: “…the entire mechanism of economic decisions must be
based on a heurorhythmic procedure” (p.20).
Relationships and cooperation. Pressman (2005) discusses the role of Pareto
Optimality in modern economic thought that goes hand in hand with the assumptions of
individual self-interest and rationality. For an outcome to be Pareto Optimal, no one can

VALUES IN MICROECONOMIC DECISION-MAKING 23
be made better off without sacrificing the well-being of at least one person. As a result,
the situation cannot “unambiguously be improved upon, since one person’s gain will be
another person’s loss” (p. 487). Yet, neoclassical economics, measured at the macro
level, does not allow us to compare individual gains and losses (Pressman, 2005).
Are relationships, cooperation, and rationality able to coexist? Pressman states:
“…rationality has a social dimension to it; what is rational in a situation depends not just
on what I do or choose, but also on how others react to me and to my choices” (p.490).
This concept of relationships is consistent with Einstein’s statement that “…the state of
the ether is at every place determined by connections with the matter and the state of the
ether in neighbouring places…” (1920, p. 5).
An understanding of relationships in economic decision-making helps place
individual decisions in context. For example, is an individual more likely to make an
unethical economic decision such as cheating on their income taxes if their superior at
work has encouraged them to do so? Sen (1994) discusses how social norms can have an
impact on decision-making. He uses the examples of not eating the last apple, or
automatically grabbing the largest slice of cake. Also, the decisions of individuals living
in societies with collectivist norms will be very different from those living in societies
with individualist norms.
Another motivation for decision-making explored by Sen (1994) includes the
consideration of the consequences of individual actions on others. Will someone else be
harmed or will someone be disappointed in the decision-maker due to the decision? Is
the decision-maker trying to imitate the behavior of others? What are the decision-makers
incentives within the different groups they identify with (Sen, 2004)? These relationship

VALUES IN MICROECONOMIC DECISION-MAKING 24
considerations exist within the values ether and shape economic decisions. At the same
time, economic decisions shape relationships.
The game theory classic, the Prisoner’s Dilemma, demonstrates that the optimal
solution can sometimes be gained through cooperation. While the game does not
eliminate the possibility that individuals are self-interested, as the cooperative solution
also optimizes each individual’s benefit. It does, however, demonstrate that the
consideration of others should (and does) exist in individual economic decision-making.
The previous discussion regarding relationships also implies that there are occasions
when actors might not act in their own best interest in order to protect the interests of
others. Once again, this does not necessarily mean that individuals are not self-interested
(as an individual might gain more utility from helping someone else than from satisfying
their own immediate need), it simply means there are considerations in economic
decision-making that involve other people. Regional and international trade networks are
examples of cooperation that have economic benefits at a macroeconomic level as they
can increase resistance to recessionary shocks (He & Deem, 2010).
Sen (1994) suggests that due to social dependence, each member of a group
considers not only their independent self-interest, but also treats the joint strategy as one
of their options. In some cases this might even lead to individuals within the group being
less well off then others when cohesive actions are more desired. In his example he cites
gender-unequal societies in which women themselves might give a higher priority to the
interests and well being of the joint family unit while perpetuating their own inequality
and lower status.

VALUES IN MICROECONOMIC DECISION-MAKING 25
Pressman (2005) concludes that the fact/value dichotomy and notion of self-
interested rationality trivializes values because relationships and cooperation with other
people creates a “social surplus.” By including other elements of behavior to the
observation of microeconomic behavior something much greater than a simple
aggregation of Pareto Optimality of microeconomic level data occurs. Mikhalevskii
(1971) states:
Even in the area of the purely economic system of values, goals, and norms,
not only is the law of superadditivity justified, but each given goal at the
macroeconomic level is qualitatively different from the corresponding
microeconomic values. (p. 19)
Sen (1994) concludes that including “other-regarding concerns in the formulation of
rational choice” will provide “better description and greater explanatory and predictive
power” (p.389).
Relativity. Another implication of Einstein’s statement regarding the state of the
ether being “at every place determined by connections with the matter and that state of
the ether in neighbouring places…” (1920, p. 5) is the concept (and theory) of relativity.
This relativity takes two forms in economic decision-making: 1) Decisions (including
values) relative to the values of others; and 2) The observed meaning of decisions
(including values) by others. While some might argue that the values ether represents
values (or moral) relativism, this author argues that it is simply a descriptive relativism
that recognizes that people disagree about the right or wrong course of action to be taken
under similar circumstances when presented with the same facts. Values, experience and

VALUES IN MICROECONOMIC DECISION-MAKING 26
learning, perceptions of justice, relationships, and joint cooperation all play a part in this
relativity.
Ganley (1995) remarks that Veblen also recognized the concept that “conceptual
meaning was that of the observer” (p. 403). Often an individual’s decision will be shaped
based on how they believe another person will perceive their decision. For example, a job
applicant may decide not to call a perspective new employer more than once because,
while eager to have the job, they don’t want the potential employer to think they are too
assertive or “pushy”.
Actors may also compare their values to those of others when making decisions.
When we observe a co-worker demonstrating generosity with a substantial donation to
the office charity campaign, we might wish to appear equally (or even more) generous
when we make our donation. As statements, thoughts, and information move through the
values ether, decisions are formed creating new statements, thoughts, and information
that are all relative to one another.
Classifications of Statements, Thoughts, and Information
The mid-nineteenth century language of science that continues to dominate
economics requires consideration of “matters of fact” exclusively. However, the “new
science” recognizes the need to discuss possibilities and probabilities in a world that is
creative, dynamic, and engaged in continuous change while maintaining order. Revisiting
the pioneers of the science of economics, including Quesnay, Smith, and Marshall, finds
their approaches to be more holistic and consistent with the new science. They saw the
positive and normative (fact/value) as interdependent, micro and macro-level economics

VALUES IN MICROECONOMIC DECISION-MAKING 27
coexisting, and economic systems as evolving and changing over time. They went
beyond statements of fact to explore signals of direction. Like the physical sciences in
which all physical laws continue to be obeyed, new economic systems need to be
complex systems that are “self-organized structures that absorb and dissipate energy”
while at the same time obeying some “simple behavioural rules in time and space”
(Foster, 2005, p. 1).
Based on the assumptions of the pioneers of the science of economics, it is
possible to classify the statements, thoughts, and information formed at the atomic or
macro level that move through the ether into four broad categories: 1) Facts influenced by
values; 2) Values influenced by facts; 3) Distinctive integration; 4) Full integration.
Facts Influenced by Values
An economist gives a statement of fact: “The unemployment rate is 9.6%.” This
statement is influenced by values because society has decided what facts are important to
measure and report. Schmalensee (1991) states: “Economic research, like research in any
scientific discipline, is driven in large part by an agenda that reflects the profession’s
shared sense of what problems are tractable and interesting at the time” (p. 115). The
statements of fact move through the values ether.
Values Influenced by Facts
Society identifies a problem: “The unemployment rate is too high.” This value
statement is influenced by facts because experience has shown that high unemployment
has negative consequences on both individuals and societies. The value statements move
through the values ether.

VALUES IN MICROECONOMIC DECISION-MAKING 28
Distinctive Integration
These types of statements, thoughts, and information use both fact and value
statements, but distinguish between the two. Value statement: “The unemployment rate
should be reduced to 3.5% for full-employment to be obtained.” Fact statement: “In the
past we have tried the following solutions with the following results.” These combined,
yet distinctive fact and value statements move through the ether.
Full Integration
This category is where most decisions and actions occur. Legislators use the art of
economics to prescribe solutions to lower the unemployment rate based on an integration
of facts and values: “To lower unemployment we will increase government spending.”
The policies move through the ether and stimulate more facts based on values, values
based on facts, and distinctive integration of the two leading to more decisions using full
integration.
Figure 1 on the following page represents a potential ‘New Science’ Value-
Inclusive Model of Economic Decision-Making that positions the four classifications of
statements, thoughts, and information within the values ether. The arrows indicate that
they move through the values ether both influencing and being influenced by each other
and the collective values ether.
Role of Relationships, Cooperation, and the Invisible Hand
Throughout time the four types of statements move through the values ether,
conditioning decisions and being conditioned by them. Over time, the values in the ether
evolve and some are lost. Within the ether resides the gravitational pull of relationships

VALUES IN MICROECONOMIC DECISION-MAKING 29
and cooperation that serves as the force that keeps us interconnected and dependent in our
decision-making while shaping the values ether and being shaped by it. On the edge of
this “Economic Universe” is the invisible hand that pushes and shapes the ever-
expanding universe while containing it within a framework of self-organization. The
model is both descriptive and predictive of a menu of outcomes.
Figure 2.1. Bell’s ‘New Science’ Value-Inclusive Model of Economic Decision-Making
The incorporation of facts and values (including their distinction and integration) as well
as relationships, cooperation, and the invisible hand results in what Sen (1994) describes
as “menu-dependent” outcomes that go beyond rational self-interest (utility).
The payoff function in a menu-dependent system does not only include the actual
outcomes that emerge, but also the set of alternative outcomes (“the opportunity set” or
Values Ether
Full Integration
Facts Influenced By Values
Distinctive Integration
Values Influenced by Facts
Relationships & Cooperation
The Invisible Hand
The Invisible Hand
The Invisible Hand
The Invisible Hand
Values Ether

VALUES IN MICROECONOMIC DECISION-MAKING 30
“the menu”) that the individual determines they can choose by executing different
strategies. This menu of outcomes (or signals of direction) includes considerations of
how others will behave thereby creating multiple strategies. The actions of others [and
presumably value and cooperation considerations] may reduce the opportunity or menu
set over time moving the individual to a decision (Sen, 1994, p. 385). The invisible hand
can also play a part by changing overall environmental factors that can impact decision-
making (See Figure 1, above).
Final Thoughts On The ‘New Science’ Model
The mid-nineteenth century language of “facts” within the scientific
discipline moved the science of economics to a mechanical-mathematical method of
economic analysis based on the assumption of individual rational actors in
economic decision-making. The classical scientific language of “facts” and
rationality required the removal of the consideration of values, relationships, and
cooperation in decision-making. Consideration of the “unseen” was believed to be
irrational. A forced separation of positive from normative statements was also
required resulting in an assumption that what “ought” to be could not be derived
from what “is.” As the assumption of rational actors became problematic, Keynes’
theories led to the separation of micro and macroeconomics with measurement of
economic behavior focused at the aggregate level. This approach minimized the
impact of individual actors, while maintaining the assumption of rationality within
the system.
The early twentieth-century brought changes in the language of science as
scientists began exploring areas that no longer fit nicely within the confines of the
VALUES IN MICROECONOMIC DECISION-MAKING 31
fact based, classical language of science. The science of economics, however, has
been slow to move toward a more dynamic approach to decision-making. The
model proposed in this paper attempts to return the description of economic
decision-making to a holistic approach incorporating facts and values, the positive
and normative, relationships and cooperation, and the micro and macro level
consistent with the pioneers of economic thought. At the same time the proposed
model attempts to incorporate the language and concepts associated with the
complex systems approach of the “new science.”
While the model is descriptive in nature, it has the predicative potential to
establish a menu of alternative outcomes (the opportunity set) based on a perceived set of
strategies (or signals of direction). The strategies (and the corresponding alternative
outcomes) will become increasingly limited over time based on the actions of others. The
proposed model is applicable to both micro and macro level decisions and incorporates
the dynamic nature of decision-making influenced by facts, values, relationships,
cooperation, and learning as well as their relativity to one another2.
Alternative Models and Theories of Value-Inclusive Economic Decision-Making
Suramaniam’s Fact/Value Distinction
While few models exist that attempt to integrate facts and values in a universal
decision-making model, Subramaniam (1963) does provide on alternative. In an effort to
avoid the fact/value dichotomy, his model includes values but does incorporate a
fact/value distinction. His purpose for establishing a distinction is to retain the concept of
2 Note: This is the end of the previously published work.

VALUES IN MICROECONOMIC DECISION-MAKING 32
rationality. In fact, he suggests incorporating values makes his model an example of a
“perfect rational decision” (p. 236).
In Subramaniam’s (1963) model (See Figure 2.2, following page) individuals
begin by recalling all primary values that are relevant to the situation. The next step is to
gather all relevant facts.
Figure 2.2. Subramaniam’s (1963) Diagram of a Model of a Perfect Rational Decision
Primary Value—X Primary Value—Y Primary Value—Z
+ + +
Relevant Facts Relevant Facts Relevant Facts
Derived Value Derived Value Derived Value
Grade 1 = End Grade 1 = End Grade 1 = End
+ + +
Relevant Facts Relevant Facts Relevant Facts
Derived Value Derived Value Derived Value
Grade 2 Grade 2 Grade 2
= means in re: = means in re: = means in re:
Derivative Value Derivative Value Derivative Value
Grade 1 and End Grade 1 and End Grade 1 and End
in re: Derivative in re: Derivative in re: Derivative
Value Grade 3 Value Grade 3 Value Grade 3
+ + +
Relevant Facts Relevant Facts Relevant Facts
ALTERNATIVES Derivative Value Derivative Value Derivative Value
Grade 3 = means in re: Grade 3 = means in re: Grade 3 = means in re:
Derivative Value Derivative Value Derivative Value
Grade 2 and Grade 2 and Grade 2 and
End in re: End in re: End in re:
Derivative Value Derivative Value Derivative Value
Grade 4 Grade 4 Grade 4
Moment of Choice ---------------------------------------------------------------------------------------------
--
+ +
Future Relevant Facts Relevant Facts Eliminated as
irrelevant
Derivative Value Derivative Value
Grade 4 = Grade 4 =
Consequences Consequences

VALUES IN MICROECONOMIC DECISION-MAKING 33
This process of alternating between gathering relevant values and relevant facts continues
until the moment of choice. The consequence of the choice moves into the future and
informs relevant facts and values in the next decision, unless the choice is determined
irrelevant for future decisions. While this model is a viable alternative, the constant
distinction of facts and values has not held up over time.
As an example we have seen how marketing, in its evolution to the relationship
era, has started to incorporate facts, values, and emotions into consumer decision-making.
(Bell, 2011a; Kotler, Kartajaya, & Setiawan, 2010; Peter & Olson, 2010). We’ve learned
that multiple decision-making factors can exist either sequentially (distinctive) or
simultaneously (integrated) (Bell, 2011a; Carrera & Oceja, 2007; Taylor, 2009).
Microeconomic consumer decisions are not made based on the distinction of facts and
values resulting in rational choices made by rational actors, but on the integration of
multiple cues sometimes resulting in less than rational behavior in the classic sense.
While distinction can exist at times it is integration that leads to decisions (Bell, 2011a;
Ramanathan & Shiv, 2001).
The Moral/Non-Moral Normative Judgment Distinction
Huei-Chun Su (2010) explores the dichotomous distinction of positive and
normative economics as discussed by David Colander (2001), John Stuart Mill (1963),
and British economist (and father of John Maynard Keynes) John Neville Keynes (1917).
There is a place for a positive/normative distinction as described by Colander, however,
if the analysis of economic issues resulting in applied policies is to be complete, the art of
economics integrating the positive and normative approaches must be included.
Su (2010) compares Mill’s proposed distinction between science and art, Keynes’

VALUES IN MICROECONOMIC DECISION-MAKING 34
insistence on the use of a distinct positive science in economic decision making,
Friedman’s (1966) concerns that objectivity through positive economics alone is difficult
as economics studies the “interrelations of human beings” (Friedman, 1966, p. 4), and
Colander’s three-fold approach that suggests that “when conducting applied policy
analysis, factors which are ruled out in positive economic analysis have to be added back
in. These include non-economic factors and the operational details of institutions” (Su,
2010, p. 2). In comparing the approaches she is looking for common ground and a way to
bridge the gaps. One troubling area she seeks to resolve is Colander’s assertion that
normative judgments are value judgments, which doesn’t allow for the removal of
subjectivity insisted on by the other scholars. Even Friedman (1966), who has concerns
about objectivity, only sought to revise positive economics to eliminate “fundamental
differences in basic values, differences about which men can ultimately fight” (p. 5).
To attempt to solve this problem Su (2010) proposes the integration of the
positive and normative, but with a distinction between moral normative judgments and
non-moral normative judgments with the former occurring rarely. While she puts this
forth as her proposal to solve the conflicts between the philosophies, the original concept
of a moral/non-moral distinction in normative judgment comes from Frankena (1973).
She borrows from Frankena (1963) when she defines moral values as “not about actions
or kinds of action, but about persons, motives, intentions, traits of character, and the like,
and we say of them that they are morally good, bad, virtuous, vicious…and so on”
(Frankena, 1963, p. 8; Su, 2010, p. 24). She describes non-moral judgments as
“predominantly determined by judgments based on the knowledge of facts and scientific
theories, not moral values or rules” (Su, 2010, p. 24). Table 2.1 on the following page

VALUES IN MICROECONOMIC DECISION-MAKING 35
from Frankena (1973) provides examples of the distinction he has prescribed. While Su
(2010) and Frankena’s (1973) normative judgment distinction has merit, the theory still
seeks to minimize the impact of values on the analysis and decision-making process.
The Normative-Affective Approach
Amitai Etzioni (1988) proposes not only an integration of normative-affective
factors (emotions and values) into neoclassical economic models, but that often logical-
empirical factors (the basis of rational decision-making) are not used at all in economic
decision-making. One problem the author notes with observing and modeling the
prominence of emotions and values in decision-making is that once the decisions are
made “Normative-affective (N/A) factors are subject to logical-empirical (L/E) research
by observers, but those actors who make them draw on value-commitments and
emotional involvements, not information or reason” (p. 126). As a result the distinct
combination of N/A and L/E is not adequately measured or known.

Table 2.1
Adapted from William K. Frankena’s Kinds of Normative Judgments from Ethics (1973)
Kinds of Normative Judgments Ethical or moral judgments proper: Nonmoral normative judgments:
Judgments of moral obligation
(deontic judgments):
Judgments of moral value
(aretaic judgments):
Judgments of nonmoral value: Judgments of nonmoral
obligation:
Particular, e.g.
(assuming
terms are used
in their moral
senses),
a. I ought not to
escape from
prison now.
b. You should
become a
missionary.
c. What he did
was wrong.
General, e.g.,
a. We ought to
keep our
agreements.
b. Love is the
fulfillment of
the moral law.
c. All men have
a right to
freedom.
Particular, e.g.,
a. My
grandfather was
a good man.
b. Xavier was a
saint.
c. He is
responsible for
what he did.
d. You deserve
to be punished.
e. Her character
is admirable.
f. His motive
was good.
General, e.g.,
a. Benevolence is a
virtue.
b. Jealousy is an
ignoble motive.
c. The man who can
forgive such
carelessness is a saint.
d. The good man does
not cheat or steal.
Particular, e.g.,
a. That is a good
car.
b. Miniver
Cheevy did not
have a very good
life.
General, e.g.,
a. Pleasure is good in
itself.
b. Democracy is the
best form of
government.
Particular, e.g.,
a. You ought
to buy a new
suit.
b. You just
have to go to
that concert.
General, e.g.,
a. In building
a bookcase
one should use
nails, not
Scotch tape.
b. The right
thing to do on
fourth down
with thirteen
yards to go is
to punt.

VALUES IN MICROECONOMIC DECISION-MAKING 37
While economists might be concerned this approach leads to ‘irrationality’ Etzioni and
others warn not to confuse ‘irrationality’ with ‘nonrationality’. As Gigerenzer (2001)
states, “The term ‘nonrational’ denotes a heterogeneous class of theories of decision-
making designed to overcome problems with traditional ‘rational’ theories” (p. 3304).
Yet, the decisions that are made remain completely rational for the individual decision-
maker based on their decision criteria regardless of whether they are the traditional utility
maximizing, cost/benefit factors or emotional/value factors. Etzioni argues the
normative-affective approach is nonrational, while demonstrating rational characteristics
at the same time simply through a different process of decision-making.
The author believes N/A factors serve as the baseline for decision-making and
should therefore be the primary level of analysis with L/E factors added in later. Etzioni
(1988) asserts:
…normative-affective factors shape to a significant extent decision-
making, to the extent it takes place, the information gathered, the ways it
is processed, the inferences that are drawn, the opinions that are being
considered, and those that are finally chosen. (p. 127)
The purpose of Etzioni’s model is to stay closer to the neoclassical model
of economic decision-making than models of moral decision-making proposed by
others (see Latane & Darley, 1970; Schwartz, 1970; Simmons, Klein & Simmons,
1977). All of these theories assume that other emotional and value factors
influence decision making, but Etzioni’s approach shares characteristics of
Aristotle’s concept of hierarchy (Yuengert, 2000) with the N/A coming before the
L/E. This differs from Bell (2011b) who allows the N/A and L/E to be present at

VALUES IN MICROECONOMIC DECISION-MAKING 38
the same time or hierarchically.
In Etzioni’s (1988) model the N/A factors influence decision-making by
excluding options that never make it to L/E analysis (i.e. we don’t consider
murdering our competition) or often excluding L/E considerations completely (i.e.
we don’t go beyond N/A when deciding to donate a kidney to a family member).
N/A factors also “load” facts with “interpretation, and inferences drawn with
nonlogical and nonempirical ‘weights’…that ranks options in ways that differ
from their L/E standing” (p.132). Anyone who has been “in love” has probably
observed this in his or her own decision-making.
Intrusion is another factor that often gives N/A factors prominence over
L/E factors in Etzioni’s model. He states that “…L/E considerations require
completing a sequence that involves collecting facts, interpreting their meanings,
and drawing inferences leading one to favor one option over others” [emphasis in
the original] (1988, p. 132). However, N/A factors can interrupt the L/E
considerations causing individuals to skip steps, under analyze information, or
inadequately complete them. Completing the sequence of L/E considerations
requires a great deal of discipline, self-awareness, and a high level of attention
and concentration. Similar to Simon’s (1991) concept of bounded rationality, the
limitations of our cognitive processes cause us to take shortcuts or get tunnel
vision leading to N/A factors taking over. This is consistent with the bounded
rationality problems discussed by other scholars concerned with the behavioral
aspects of decision-making (see Kahneman, 2003; Kahneman & Tversky, 1982;
Posavac, Kardes, & Brakus, 2010; Thaler & Sunstein, 2009). Etzioni (1988)
VALUES IN MICROECONOMIC DECISION-MAKING 39
argues this occurs because “L/E thinking is conducted ‘vertically’, in sequences,
[and] N/A ‘considerations’ [use] ‘lateral thinking’” (p.133).
In short, Etzioni (1988) does not believe rationality is short-circuited in
this N/A hierarchical model; it simply helps in the decision-making process. To
put it in the language of Sen (1994) and Bell (2011b) N/A factors help establish a
menu of choices by excluding options. These choices are then analyzed using L/E
factors and a decision is made. Sometimes there can be negative consequences
(i.e. tunnel vision or ineffective shortcuts), but overall serves as a positive method
of meeting the multiple ‘nonrational’ needs of individual decision makers.
Specifically the author views Pieters and Van Raaij’s (1987) four functions of
affect as having positive impacts on decision-making. They include the
interpretation and organization of information, the mobilization and allocation of
resources, sensation seeking (when bored) and avoiding (when stressed), and by
providing a means of communicating feelings and preferences.
Behavioral Economics/Finance
The field of behavioral economics/finance is one area of decision-making that
deserves consideration in the discussion of ‘nonrational’ economic decision-making
models. This field deals with issues like biases (actor/observer, status quo, confirmation,
not invented here, availability, and short-term), and individuals’ propensity to engage in
herding behavior, use heuristics or rules of thumb, be overconfident, and a tendency to be
loss averse (Thaler & Sunstein, 2009). The authors suggest these biases can sometimes be
overcome by choice architecture or “nudges” that move people toward the decision that is
in their (rational) best interest. For example, to get people to save for retirement,

VALUES IN MICROECONOMIC DECISION-MAKING 40
employers can set up defined contribution plans so that individuals must opt-out rather
than opt-in to the plan as status quo biases lead people to keep the default option. Thaler
(1988) has also explored the behavioral aspects of cooperation (as has Sen, 1977; 1994)
in economic decision-making.
Becker (1968) has also done some interesting work in behavioral economics. He
treated crime and punishment as a constrained optimization problem to minimize the
social costs of crime. He found the optimal solution was to minimize monitoring or
surveillance and maximize fines. How punishment structures are designed impacts
decisions about the allocation of time between crime and legitimate employment. In other
words, creating behavioral structures in which “crime does not pay” seems to have the
greatest social benefit. This includes higher fines or greater punishment for crimes with
lower elasticities.
While Simon’s (1991) bounded rationality has previously been mentioned,
Kahneman and Tversky’s (1979) prospect theory uses cognitive psychology to explain
why rational decision-making (specifically expected utility theory) is not representative
of how individuals make decisions under risk. Like Etzioni (1988), prospect theory is
hierarchical in nature with people first editing and then evaluating based on utility.
During the editing process individuals use a variety of means to “rank” the prospective
decisions leaving them with a smaller set from which to choose. Unlike Etzioni, prospect
theory does not necessarily insist emotions and values drive the editing process, although
they may be a part of it. The theory also asserts that individuals are more likely to assign
utility value based on loss aversion and relative gains. In other words, they try to
minimize losses rather than maximize gains. Their decisions are also considered subject

VALUES IN MICROECONOMIC DECISION-MAKING 41
to intransitivity as they are based on the relative preferences between pairs of options.
This is different from the expected utility theory of rational decision-making models in
which absolute wealth (or gain maximization) is the most important factor and it is
assumed that all information is analyzed to reach the rational decision. Dan Ariely (2008)
provides evidence in his book Predictably Irrational that supports many of the behavioral
aspects discussed here. These include an individual’s propensity to regard their
environment and decisions in terms of their relation to others, asymmetric dominance
effects, anchoring, ignoring opportunity costs, and the role of social norms, emotions,
expectations, and self-control in decision-making.
Neuroeconomics
The emerging field of neuroeconomics is attempting to determine all the different
ways the brain drives decision-making. Neuroeconomics is combining behavioral
economics with neuroscience, cognitive and social psychology, and other experimental
methods to understand more about how individuals make economic decisions and how
they inform the other decisions in our lives. The field seeks to determine what variables
the brain computes to make economic decisions, how the underlying neurobiology helps
and constrains decision-making, and how it improves the understanding of behavior and
well-being in economic, political, clinical, legal, and business contexts among others
(Dayan, 2008; Fehr & Rangel, 2011).
Naturalistic Decision-Making
Another emerging field of decision-making is Naturalistic Decision-Making
(NDM). NDM attempts to determine how people use their expertise and other factors in

VALUES IN MICROECONOMIC DECISION-MAKING 42
actual decision-making as opposed to in a laboratory environment. It is primarily
concerned with proficient decision makers with relevant experience or knowledge in the
area in which they are making decisions. The need for “expertise” and observations in
actual decision-making situations makes this method of inquiry unique. However, while
the method is broad in its approach to factors leading to decisions, the need for expertise
makes it a more narrowly focused inquiry as individuals often make decisions in areas in
which they are not experts. In these cases the decision-making process might be quite
different (Lipshitz et al., 2001).
The method is relevant to this discussion because the characteristics of decision-
making explored go beyond traditional rational methods. One characteristic is
considering the cognitive processes of proficient decision makers. NDM also considers
how well experts match decision actions with situations. For example, experts often
quickly screen out most options by comparing them against a standard for the situation
rather than compared to one another. This includes an analysis of an option’s
compatibility with a decision-makers values, rather than just its relative merits (Beach,
1990; Lipshitz et al., 2001). Unlike some other approaches, NDM also believes “that
‘ought’ cannot be divorced from ‘is’: prescriptions which are optimal in some formal
sense but which cannot be implemented are worthless” (Lipshitz, Klein, Orasanu, &
Salas, 2001, p.335). In other words, practical application is necessary to justify decision-
making theory.
Other ‘Nonrational’ Theories and Models
The purpose of this portion of the literature review was to discuss the nonrational
theories that attempt to overcome some of problems associated with assumptions of
VALUES IN MICROECONOMIC DECISION-MAKING 43
rationality in economic (macro and micro) decision-making models. As the scope of this
research does not allow for an in-depth discussion of all scholarly thought on nonrational
theories, some of the theories/models that most closely align with existing classical,
neoclassical, and contemporary economic thought have been highlighted. The goal is to
add layers of analysis on top of rational decision-making models and consider options
that will enhance existing theory.
A second goal is to provide evidence of scholarly thought on the role of decision
factors like values, emotions, learning, concern for others, culture, and the impact of
individuals in economic decision-making. With that in mind, there are other decision-
making theories that have not been discussed in detail here, but may be drawn from in
later analysis. Aspects of many of these theories can be seen in several of the models and
theories already discussed.
Final Thoughts On Value Inclusive Economic Decision-Making Models
While Bell’s (2011b) model draws heavily from the classical economic literature
and even physics, the fields of ethics, psychology, behavioral economics/finance,
neuroeconomics, and naturalistic decision-making all offer insights into the ‘nonrational’
models of economic decision-making. We see recurring themes of relativity, complex
systems, concern for others, bounded rationality, behavioral factors, natural or organic
models, and a lack of dichotomy between the positive/normative and fact/value (although
distinction remains applicable at times).
Assuming a role for values in economic decision-making, the following section
explores two questions:

VALUES IN MICROECONOMIC DECISION-MAKING 44
1) How are individual values that go into our microeconomic decision-making
formed?
2) In what ways do we apply those values in microeconomic organizational
decisions?
Value-Inclusive Microeconomic Decision-Making
If we are going to understand the role of values in microeconomic decision-
making, it will be necessary to explore how values are developed and how they might be
relevant in the business environment. In this section some notable theories associated
with the development of individual values will be discussed. In addition, studies that
indicate how personal values impact organizational decision-making at the
microeconomic level will be considered in the final portion of the literature review.
Individual Value Development
To be inclusive of values in economic decision-making, it will be necessary to
define individual values and how they are formed. Rokeach (1968) defines values, “as
abstract ideals, positive or negative, not tied to any specific object or situation,
representing a person’s beliefs about modes of conduct…” (p. 124). He believes these
values guide individual actions. Personal values are those values that an individual is
committed to and that influence behavior and guide the actions of the individual (Kaushal
& Janjhua, 2011; Theordoron & Achilles, 1969). Consistent with Bell’s (2011b),
Etzioni’s (1988), Huei-Chun Su’s (2010), and Subramaniam’s (1963), and models
described above, Shalom H. Schwartz (1992) views values as criteria in decision-making

VALUES IN MICROECONOMIC DECISION-MAKING 45
(to both select and justify actions) and not just descriptions inherent in individuals.
People use values to “select and justify actions and to evaluate people (including the self)
and events” (Schwartz, 1992, p.1). He has also demonstrated that values can be impacted
by social structure like education, age, gender and occupation as well as unique life
experiences. Personal values influence individual’s ideologies, attitudes, and actions
across cultures.
Kohlberg and Value Development
Lawrence Kohlberg has conducted extensive research on whether the moral
values of individuals have the ability to develop over time. Based on his research, he
developed what he describes as “a culturally universal invariant sequence of stages of
moral development” (Kohlberg, 1973, p. 630). His model consists of six stages within
three levels of development
The following is adapted from Kohlberg’s (1973) description of the model:
I. Preconventional level
At this level an individual is concerned with cultural rules, good and bad, right or
wrong. Individuals associate these rules and labels in terms of consequences like
punishment, reward, or exchange of favor.
Stage 1 is a punishment-and-obedience orientation. Individuals are not concerned with
their own meaning of value, but obey to avoid unpleasant consequences.
Stage 2 is the instrumental-relativist orientation. In this stage individuals take actions
that satisfy their own needs while occasionally satisfying the needs of others.
Reciprocity is simply a way to ensure you can continue to get what you want. The
concept of fairness comes into play, but only in a very pragmatic way. For example, a

VALUES IN MICROECONOMIC DECISION-MAKING 46
child might want to make sure his sister is not getting a bigger piece of cake than he is.
II. Conventional Level
At this level individuals become concerned with maintaining the expectations of their
family, group, or nation. These expectations are considered valuable on their own and
are considered by choice rather than out of concern for consequences. Individuals
desire to maintain, support, and justify the order of the group. The do not desire to
simply conform, but wish to identify with the group.
Stage 3 is referred to as the interpersonal concordance or “good boy—nice girl”
orientation. Individuals become aware that good behavior is what pleases others and is
approved by them. Individuals will try to conform to their perceived stereotypes of the
group. You earn approval by being nice and behavior is often judged by intention.
Stage 4 is the “law and order” stage. Maintaining the social order through authority and
fixed rules is important. The correct way to maintain social order in this stage is
through doing one’s duty and showing respect for authority for its own sake.
III. Postconventional, autonomous, or principled level
At this level individuals have formed their own moral values and principles. These
values and principles are not a part of the individual’s identification with the group, but
stand on their own validity.
Stage 5 is the social-contract legalistic orientation. This orientation generally comes
with utilitarian overtones. Right actions are framed within the context of individual
rights and standards that have been critically examined and agreed upon by the society
as a whole. The relativism of personal values and opinions is recognized and
procedures for reaching consensus are established. The American government and

VALUES IN MICROECONOMIC DECISION-MAKING 47
constitution are based on this form of morality as rational considerations of social
utility are applied that not only emphasize the legal point of view, but also the
possibility of changing the law. This is different from Stage 4 where the rules are fixed.
Stage 6 is the universal-ethical-principle orientation. At this stage universal principles
of justice, the reciprocity and equality of human rights, and respect for the dignity of
people as individuals become guiding, self-chosen principles. The rules that guide the
individual are abstract and ethical, and not absolute.
Kohlberg (1973) argues that not only does our morality develop over time, but our
logic does as well. He describes this as a transformational process that makes us better
decision-makers over time. The theory shares the hierarchical characteristics of the
models of decision-making described earlier (Rest, 1973). His final stage is closely
aligned with the theory of justice as described by John Rawls (1971). Kohlberg’s model
seeks to use an interdisciplinary approach that fuses the theories of moral philosophy set
forth by Rawls and Jean Piaget (Rest et al., 2000). It combines the inherent morality and
justice seeking of Rawls (1971) with the genetic epistemology approach of Piaget that
assumes the development of moral judgment with age (Piaget, 1932/1997).
The Neo-Kohlbergian Perspective
While some scholars agree with Kohlberg’s approach, there were many who do
not. As a result, a Neo-Kohlbergian perspective emerged. Bebeau, Narvaez, Rest, &
Thoma (1999) believed Kohlberg’s theory had merit, but required some modifications.
They believed several of Kohlberg’s core ideas required revisiting; specifically his
emphasis on cognition, individuals self-constructing categories of morality (like justice,

VALUES IN MICROECONOMIC DECISION-MAKING 48
duty, rights and social order), that one set of moral concepts was more developed and
“better” than others, and the “macromoral” focus on the formal structures of society in
the form of laws, roles, institutions, and general practices.
The authors first propose a distinction between and recognition of macromorality
(as described above) and micromorality that deals with personal interactions, how we
treat people, and “generally acting in a decent, responsible, empathic way in one’s daily
dealings with others” (Bebeau, et al., 1999, p. 2). They further describe the distinction
between macromorality and micromorality as follows:
In micromoral issues, what is praiseworthy is characterized in terms of
unswerving loyalty, dedication, and partisan caring to special others…in
macormorality, the praiseworthy response is characterized in terms of
impartiality and acting on principle, instead of partisanship, favoritism, or
tribalism. Both macro- and micromorality concern ways of constructing
and enriching the web of relationship’s—one through the structures of
society, and the other through personal face-to-face relationships. (p. 3)
While Bebeau, et al. (1999) see room for both micro- and macromorality to
coexist, they believe both Kohlberg and the Neo-Kohlbergian approach are better at
measuring the macromoral. This is consistent with J. N. Keynes (1917) and J. M. Keynes
(1936) need to isolate macro factors from micro factors for ease of analysis in economic
decision-making. This is a limitation of both approaches because it requires a high level
of abstract thinking that doesn’t apply well to individual decisions. Most individuals
don’t engage in abstract, philosophical thought prior to making a decision. Factors like
personal and immediate group values, relationships, emotions, behavioral, and other

VALUES IN MICROECONOMIC DECISION-MAKING 49
‘non-rational’ factors as described in the economic decision-making models in this paper
demonstrate the more unconscious and automatic processes individuals utilize.
Naturalistic decision-making research supports Bebeau’s assertions as it has finds the
complexity of the decision-making process under uncertainty causes us to match
responses to cues from the situation or environment that often rely on informal reasoning.
Neo-Kohlbergians also recognize the potential for conflict between the micro- and
macromoral considerations and therefore justify the macromoral limitation as preferable
because the ultimate goal should be for the betterment of society through impartiality,
fairness, and justice. As a result the Neo-Kohlbergian approach carries forward the
Rawlian characteristics of the original theory. Bell’s (2011b) approach to economic
decision-making attempts to combine the micro and macro into one model that
incorporates both. In her model the values ether both shapes and is shaped by both micro-
and macro-level values with the superadditivity of micro-level values influencing and
being influenced by the macro-level.
The Neo-Kohlbergian perspective also argues against a stair-step approach to
moral development as proposed by Kohlberg (1971) and Piaget (1932/1997). Instead they
argue for gradual shifting toward the use of higher forms of thinking that are not tied in to
age or hard stages of development. They also reject the notion that advanced moral
thinking is the exclusive result of individual cognitions uninfluenced by other people and
society. However, it does retain the assumption of rationality (Narvaez, 2005). Bell’s
(2011b) model is consistent with this approach as it attempts to incorporate factors like
relationships and cooperation as presented by Sen (1994; 2004) as well as society, but
does remove the assumption of rationality in its classic definition of purely self-interested

VALUES IN MICROECONOMIC DECISION-MAKING 50
utility maximization based on cost/benefit analysis. Instead rationality includes multiple
interests including commitment that make multiple decisions equally rational, but for
different reasons for different people (Bell, 2011b; Sen, 2005).
To replace stage theory, Bebeau, et al. (1999) use schema theory to determine
moral development. They use the Defining Issues Test (DIT) to activate and assess moral
judgment. The purpose is to determine which schemas an individual brings to a task
when making a decision. While they do not fit neatly into “stages” they do determine
what set of schemas an individual is using in decision-making. This set of schemas has
proven effective in determining the level of moral thinking an individual is using
(Narvaez, 2005; Rest et al., 2000). These schemas already exist in the individual’s head
or long term memory and are presumed to structure and guide people’s moral thinking
(Rest, Narvaez, Bebeau, & Thoma, 1999). This shift from stage theory to schema theory
is the most significant contribution of the Neo-Kohlbergian school and attempts to bridge
the gap between cognitive science and moral psychology. It also seeks to move the theory
beyond the exclusive moral judgment approach of Kohlberg and incorporate moral
sensitivity, moral motivation, and moral action (Narvaez, 2005).
Social Learning Theory
The concept of social learning theory could easily have been included in the
decision-making models and theories portion of this paper as well as this section on how
individual values are formed. I have chosen to put it here as Bandura (Bandura, 1977;
Wood & Bandura, 1989) first considers how values are formed and then how they are
utilized. Applications of the theory will be described in more detail in the following
section. Social learning theory was developed by Albert Bandura (see Bandura, 1977) in

VALUES IN MICROECONOMIC DECISION-MAKING 51
response to what he saw as shortcomings in Miller and Dollard’s (1941) concepts of
modeling in Social Learning and Imitation. Bandura (2007) summarizes Miller and
Dollard’s concept of modeling as follows: “A model provides a social cue, the observer
performs a matching response, and its reinforcement strengthens the tendency to behave
imitatively” (p. 55). His concern was that in real life we don’t simply mimic specific acts
or wholly incorporate the personality patterns of another person (the model). Instead, he
saw observational learning as selectively and conditionally manifesting characteristics of
the model. He saw the process of social modeling as having a cognitive component and
not simply mirroring others (Bandura, 2007). He also rejected the traditional assumptions
of behaviorists, which emphasize environmental determinism and minimize the
contributions of cognitive processes, especially cognitive mediators (Kytle, 1978). In
terms of values development, this makes it possible to cognitively reject the values of
your parents and selectively adopt the values you observe (and like) in others.
Bandura rejects the notion of human behavior being explained in terms of one-
sided determinism. He believes individuals learn within a social context, this includes
their values and beliefs about themselves and others (Bandura, 1977; Wood & Bandura,
1989). Rather than one-sided determinism, he proposes a triadic reciprocal determinist
approach for how we learn values and behaviors and achieve behavioral changes. In his
model of social learning theory, behavior, personal factors including cognition, and the
external environment “operate as interacting determinants that influence each other
bidirectionally…Because of the bidirectionality of influence, people are both product and
producers of their environments (Wood & Bandura, 1989, p. 362). This concept is similar
to Bell’s (2011b) model of the values ether in which current and past decisions, learning,
VALUES IN MICROECONOMIC DECISION-MAKING 52
relationships, and cooperation all influence each other bidirectionally, both influencing
and being influenced by one another. Like Bell, change and context become part of the
determinants of the description and explanation of how values are formed within
Bandura’s social learning theory (Lerner, 1990).
Social learning theory is based on the premise that information is conveyed by
models through direct observation called observational learning. In order for
observational learning to occur, four processes must be present:
1) Attentional processes—Attention determines what people selectively observe and
what information they extract from the modeled activity.
2) Cognititive representational processes—This is the process of actively retaining
information by transforming the observation into rules and conceptions.
3) Behavioral production process—In this process the rules and conceptions
previously determined are translated into courses of action.
4) Motivational processes—There are three primary types of motivators:
a. Direct—The action will produce valued outcomes.
b. Vicarious—People can be motivated by the successes of others who are
similar to themselves.
c. Self-produced—People generate self-evaluations that regulate which
observationally learned actions they will choose. Values and values
formation can be a significant influence in this area (Wood & Bandura,
1989).

VALUES IN MICROECONOMIC DECISION-MAKING 53
The social contexts and observational learning processes described by Bandera
can certainly influence individual value development. Individuals can also influence the
value of others through value modeling.
Final Thoughts on Individual Value Development
The three perspectives discussed here describing how individual values are
formed have several differences. Kohlberg’s approach is based on inherent morality and
the genetic epistemology of moral development that incorporates a significant role for
individual cognition. The Neo-Kohlbergian perspective seeks to add incorporate moral
sensitivity, moral motivation, and moral action to Kohlberg’s approach. The Neo-
Kohlbergian school also recognizes that micro-moral factors are present and may conflict
with macro-moral factors, yet continues to evaluate the issue from a macro perspective
for ease of analysis as the good of society is viewed as the primary interest. The stair-step
approach to development, not recognizing the potential impact of micro-moral issues, and
one set of moral concepts being better than another are rejected and the roles of
individual cognition and self-constructing of morality are minimized in favor of a
“schema” approach in Neo-Kolberianism. While not specifically analyzed, the influences
of other people and society are recognized (Bebeau et al., 1999; Narvaez, 2005; Rest et
al., 2000).
Bandura’s (1977; Wood & Bandura, 1989) social learning theory sees a much
more active role for social context, learning, change, and observation resulting in a
cognitive process of selectively and conditionally adopting values within the value
development process. Bandura’s approach is similar to Schwartz (1970; 1992) who

VALUES IN MICROECONOMIC DECISION-MAKING 54
incorporates social structures like education, age, gender and occupation as well as
unique life experiences into the process of value development. These approaches are
much more holistic in their approach.
Bell’s (2011b) model more closely aligns with the approaches to value inclusive
decision-making and the formation of values suggested by Bandura (1977) and Schwartz
(1970; 1992). Bell’s model is based on the bidirectional influence of individuals and
society including concern for factors like relationships, cooperation, experience,
information, learning, complexity, and multiple equilibria. There is also a place for the
Neo-Kohlbergian (Bebeau et al., 1999, Narvaez, 2005; Rest et al, 2000) concept of
schemas in Bell’s model, but she would argue that there are both micro and macro
influences on those schemas, which may evolve over time. Overlaying the Neo-
Kohlbergian and social learning approaches of value development with Bell’s (2011b)
model would result in the following revised model in Figure 2.3on the following page.
Even with their differences, there are some core similarities between the theories
of moral development. The first similarity is that morality and values do have a role in
decision-making and they do evolve over time. A second similarity is the involvement of
others either in our concern for others in our decision-making or the influences of others.
Even Kohlberg’s approach that is based strongly on an internal cognitive approach to
development does include the influence of others. For example, even in the Level 1,
Stage 1 punishment-and-obedience orientation, someone else is determining what is right,
what is wrong, and when an individual should be punished or rewarded.

VALUES IN MICROECONOMIC DECISION-MAKING 55
Figure 2.3. Bell’s ‘New Science’ Value-Inclusive Model of Economic Decision-Making
With Neo-Kohlbergian & Social Learning Values Development
Value-Inclusive Microeconomic Decision-Making in Organizations
If values are included in economic decision-making and individual values are
formed in a variety of ways, why should businesses and other organizations be concerned
with values? The most obvious reason is that individuals in organizations make
microeconomic decisions that can impact the entire organization. The values of
individuals in organizations can determine the values of organizations including the
ethical practices that make or break them. The ethics scandals that rocked companies like
Enron, Tyco, and WorldCom all involved the personal values of individuals within these
companies (McLean & Elkind, 2004). Behavior in an organization is a manifestation of
Values Schema Ether
Full Integration
Facts Influenced By Values
Distinctive Integration
Values Influenced by Facts
Relationships, Cooperation & Social Learning
The External Environment
The External Environment
The External Environment
The External Environment
Values Schema Ether

VALUES IN MICROECONOMIC DECISION-MAKING 56
attitudes and values. If behaviors and their actions are manifestations of values, then
values are both inferred from behavior and may predict behavior in organizations
(Churchman, 1961; Connor & Becker, 1975; England, 1967).
Studies have indicated that individuals may bring the personal values they use
routinely, to their decisions at work. Personal values that closely match organizational
values result in greater organizational commitment and are linked to variables like
absenteeism, turnover, job satisfaction, organizational citizenship, and job performance
(Finegan, 2000). In addition to organizational commitment, worker satisfaction is greater
when their values are congruent with those of their immediate supervisor (Jiang, Lin, &
Lin, 2010; Meglino, Ravlin, & Adkins, 1989) . Values can also impact vocational choice
and the likelihood of rising to a leadership position (Finegan, 2000; Keltner, Langner, &
Allison, 2006; Palmer, 2000). Individual value characteristics like conscientiousness,
agreeableness, neuroticism, Machiavellianism, moral reasoning, and locus of control
along with moderating influences like the need for power and moral utilization all
influence ethical leadership (Brown & Trevino, 2006). Values are the “prime drivers of
personal, social, and professional choices” (Suar & Khuntia, 2010, p. 443).
Cultural and work contexts can also impact values and their use in business
decisions (Gamble & Gibson, 1999; Suar & Khuntia, 2010). Gamble and Gibson (1999)
found that the personal/cultural value of collectivism based on personal relationships
manifests itself at work with Chinese financial controllers. When making business
decisions, they did not attempt to meet objective performance criteria, but instead used
‘relationships’ and ‘organization’ considerations in decision-making. Cooperating with
peers and supporting supervisors had significant weight in decision-making. Work values
VALUES IN MICROECONOMIC DECISION-MAKING 57
emerge from personal values because work values emerge from the projection of personal
values into the domain of work (Kaushal & Janjhua, 2011; Ros, Schwartz, & Surkis,
1999).
As important as value congruence is to organizational commitment and individual
performance, personal values also determine ethical practices at work. As Suar &
Khuntia (2010) state:
Irrespective of the type of organizations and age of managers, personal
values more potently and consistently decreased unethical practices and
increased work behavior compared to value congruence. Hiring managers
emphasizing personal values can demote unethical practices and promote
work behavior. (p. 443)
If we assume that Bandura (1977) is correct and individuals continue to develop
contextual values based on observational learning, organizational leaders are pivotal in
ensuring the ethical practices in business decision-making of subordinates. Leaders who
articulate their values and model ethical behavior can reduce unethical behavior and
interpersonal conflicts (Mayer, Aquino, Greenbaum, & Kuenzi, 2012), make ethical
behaviors by subordinates a habit (Almeida, 2011), positively impact the personal values
of employees (Weiss, 1978), create more value for customers through market orientation
(Lam, Kraus, & Ahearne, 2010), and demonstrate justice and care during a corporate
crisis (Simola, 2003). They help form the complex mental models that all members of the
organization use in the decision-making process (Courtney, 2001; Goel, Johnson,
Junglas, & Ives, 2010) and influence the meanings individuals give to experiences in the
sensemaking process in organizations (Weick, 1995; Weick, Sutcliffe, & Obstfeld, 2005).
VALUES IN MICROECONOMIC DECISION-MAKING 58
Of course this is a double edged sword and leaders like John Gutfreund at
Salomon Brothers and Ken Lay and Jeff Skilling at Enron who express negative values
and model unethical behavior will most likely lead observers to either leave the company
or adopt the unethical practices embedded in the culture (Sims & Brinkmann, 2002;
McLean & Elkind, 2004). As a result, organizations have a vested interest in
understanding the role of values in organizational decision-making and how those values
and the resulting behaviors are formed.

VALUES IN MICROECONOMIC DECISION-MAKING 59
Chapter 3
Methods
The purpose of this study was to identify the relationships between the personal
values that individuals in a group assign to decision considerations and the future
decisions of those individual group members. The role reflecting on and sharing values
plays in our development of decision-making schemas, and whether these factors can
interrupt existing, unconscious decision-making schemas will be explored. A quasi-
experimental pretest/posttest design with 5 groups was utilized. A quasi-experimental
design that includes multiple groups was selected to minimize certain internal validity
threats to single group models including history, maturation, selection, mortality, and
experimenter biases. The design of the experiment also helped minimize some of these
threats. For example, the history, maturation, and mortality threats were minimized
because the pretest, treatment, and posttest all occurred during the same class period over
approximately 1 1/2 hours.
Sample
Participants were selected using convenience sampling from 5 undergraduate
business classes with 3 at the Mat-Su College of the University of Alaska Anchorage
(MSC) and 2 at Colorado State University (CSU). The MSC groups were between 13 and
22 students and the 2 CSU groups ranged from 35 to 45 students. While convenience
sampling was utilized to choose the classes to participate, the students had randomly self-
selected to enroll in the programs and courses with no influence from the researcher.

VALUES IN MICROECONOMIC DECISION-MAKING 60
These two campuses provide very different environments and student populations.
CSU is a large research university with approximately 23,000 students in Fort Collins,
CO (U.S. News & World Report, 2013). While not an “urban” campus the population of
the city is approximately 147,000 and the city website describes Fort Collins as “rapidly
urbanizing”. CSU is also a “selective” college (75.9% accepted) with specific and
rigorous admission requirements that must be met by all students.
MSC is a small satellite “teaching” campus of the University of Alaska
Anchorage with a 2012/2013 academic year student population of approximately 1,900.
The campus is located on the border of the towns of Palmer and Wasilla, Alaska that
have a combined population of approximately 14,214. MSC draws students from the
greater Mat-Su Borough with a population of approximately 92,000 in an area the size of
the state of West Virginia. The campus offers Associate Degrees and coursework leading
to Bachelor’s degrees at the University of Alaska Anchorage. MSC is an “open
enrollment” campus meaning there are no admission requirements other than taking the
university placement tests for math and English. Of those students enrolled in the
College, approximately 25% do not have college level math or English skills and are
required to take developmental classes.
One reason for choosing classes is that Bell’s (2011b) model and other scholars
including Bandura (1977) and Sen (1994) suggest relationships may play a role in the
formation of values. Students in the same class have had an opportunity to form
relationships and ideas about one another that would be lost if the class members had
been separated and randomly assigned to groups. While this is only one type of
relationship, it serves as a control for this study and does not necessarily limit

VALUES IN MICROECONOMIC DECISION-MAKING 61
generalizability. Members of a class have a variety of levels of “closeness” with other
individuals in the class as we all do with the individuals we encounter on a daily basis.
This study is not designed to test level of relationship, only to choose groups in which
some relationship exists. Classes have the added benefit of being similar to work groups
in the business environment, which is the intended application of this study.
All subjects were adults and no members of vulnerable populations were utilized.
Instrumentation
Participants were given the Defining Issues Test-2 (DIT2) as the pretest and
posttest. This test was originally developed by James R. Rest (1979) and later updated
and revised in the second version used here. Scored results are based on Kohlberg’s
(1973) Stages of Moral Development, but it is designed to test the unconscious schemas
consistent with the Neo-Kohlbergian perspective. The instrument has been used in over
400 published articles (Center for the Study of Ethical Development, 2012) many times
with university students (Cesur, S. & Topcu, M. S., 2010; Lies, J. M., Bock, T.,
Brandenberger, J., & Trozzolo, T. A., 2012; Pagano & DeBono, 2011; Woodward, Davis,
& Hodis, 2007) including at least one study specifically using business students (Lan,
Gowing, McMahon, Rieger & King, 2008). The DIT has proven to be very reliable with
Cronbach’s alpha ranging from the upper 0.70s to the low 0.80s over 25 years of data.
Test-retest results without interventions have proven to be about the same (Rest et al.,
2000). An example of the pre-test and post-test instrument are in Appendices A and B of
this document.
Participants were also given a list of values and anti-values to serve as prompts.
The value prompts were adapted from Schwartz’s (1992) list of universal values and
VALUES IN MICROECONOMIC DECISION-MAKING 62
motivational types of values. Schwartz’s values list was modified to include opposite
pairs or value/anti-value pairs (See Appendix C). For example, one of Schwartz values
was honesty; the value prompts for this study includes the matched pair of
honesty/dishonesty. The reason for this modification is that when participants are asked
to select a personal value they believe applies to a particular decision consideration, the
decision consideration might indicate a lack of the value of honesty. For example, if one
of the decision considerations participants are asked to assign a value to is: “To prevent
going to jail, I would lie,” this may indicate a lack of the honesty value. In this case the
value I might associate with this decision consideration is the anti-value of dishonesty.
Anti-values were developed from antonyms in The Merriam-Webster’s Collegiate
Thesaurus (2nd
ed.).
Demographic information was collected including age, gender, time in business
cohort, years of full-time/part-time work experience outside the university, and number
of years in a leadership position in full-time/part-time work.
Students were also asked about their perceived use of values and ethical decision-
making skills to determine their self-expectations. These questions were important
because expectations of self and others have been considered as possible motivations for
decision-making. While, this study explores whether the reflection on and sharing of
values impacts an individual’s decision-making, it is also important to capture self-
expectations about how individuals make decisions for future analysis. The two questions
that were asked included:
1. Do you consider your personal values when making work decisions?
Yes/No

VALUES IN MICROECONOMIC DECISION-MAKING 63
2. Do you consider yourself an ethical decision maker? Yes/No
Experimental Design and Procedures.
Design. As previously discussed this quasi-experimental study will use a
pretest/posttest design with multiple groups. While participants will not be randomly
assigned to groups students have randomly self-selected to be in the class and were not
placed in groups by the researcher. The experiment also requires students to be part of a
group or community within which they may have developed relationships. Using the
standard classic notation system the quasi-experimental design is as follows:
Test Groups: O----------X----------O
Pretest. During the pretest, participants will be given the Defining Issues Test-2.
The researcher will give instructions and offer to answer any questions.
Treatment. The researcher will distribute the list of value/anti-value prompts and
give participants an opportunity to read the list and ask any clarifying questions. If
students ask questions about what a particular value means, the researcher will provide a
definition. All definitions of values will come directly from Schwartz’s (1992) definitions
included in his list on pages 61-62 of his study. Anti-value definitions will come from
Merriam-Webster’s Collegiate Dictionary, 11th
ed. (2008).
A list of the decision considerations participants were asked to rate in scenario 1
was distributed (See Appendix D). Participants were asked to assign the value they
believe most adequately reflected the personal value of an individual who would consider
that issue to be assigned “great” or “much” importance in the decision for that scenario.
Participant’s answers were collected and the researcher projected a word
document on the screen with each of the decision considerations from scenario 1. With

VALUES IN MICROECONOMIC DECISION-MAKING 64
the group, the researcher randomly selected 5 to 13 response sheets from students and
added the values the participants assigned to each of the decision considerations, creating
a values set for each issue. No discussion was allowed, but participants were given a few
minutes to review the information.
Posttest. The participants will retake all parts of the Defining Issues Test-2.
Pilot Test
The process and instruments were piloted tested with 30 undergraduate students
in an Introduction to Business class at the University of Alaska Anchorage, Mat-Su
Campus. Students found the DIT2 easy to understand, but somewhat time consuming.
The students also found the Value Prompts understandable and relevant to the decision
considerations. They had no additional suggestions for how instructions or the
instruments could be improved.
The original method called for all students’ responses to the values expressed on
Scenario 1 to be shared with the group. I found it to be very time consuming during the
pilot and noticed students starting to lose interest after awhile. As a result, I decided to
pull a random sample of 10 to share. The pilot took approximately 1½ hours, but I
believed I could reduce the time by 15 minutes with this modification. The time reduction
proved to be true for all but 1 of the participating groups.
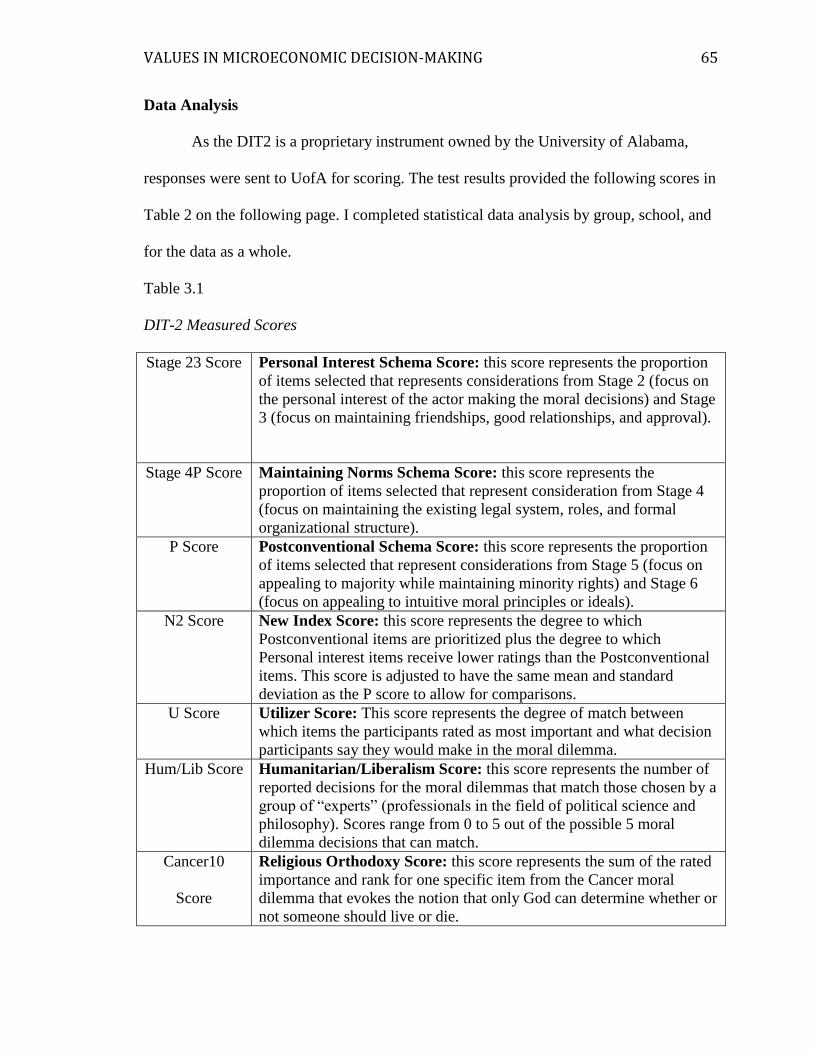
VALUES IN MICROECONOMIC DECISION-MAKING 65
Data Analysis
As the DIT2 is a proprietary instrument owned by the University of Alabama,
responses were sent to UofA for scoring. The test results provided the following scores in
Table 2 on the following page. I completed statistical data analysis by group, school, and
for the data as a whole.
Table 3.1
DIT-2 Measured Scores
Stage 23 Score Personal Interest Schema Score: this score represents the proportion
of items selected that represents considerations from Stage 2 (focus on
the personal interest of the actor making the moral decisions) and Stage
3 (focus on maintaining friendships, good relationships, and approval).
Stage 4P Score Maintaining Norms Schema Score: this score represents the
proportion of items selected that represent consideration from Stage 4
(focus on maintaining the existing legal system, roles, and formal
organizational structure).
P Score Postconventional Schema Score: this score represents the proportion
of items selected that represent considerations from Stage 5 (focus on
appealing to majority while maintaining minority rights) and Stage 6
(focus on appealing to intuitive moral principles or ideals).
N2 Score New Index Score: this score represents the degree to which
Postconventional items are prioritized plus the degree to which
Personal interest items receive lower ratings than the Postconventional
items. This score is adjusted to have the same mean and standard
deviation as the P score to allow for comparisons.
U Score Utilizer Score: This score represents the degree of match between
which items the participants rated as most important and what decision
participants say they would make in the moral dilemma.
Hum/Lib Score Humanitarian/Liberalism Score: this score represents the number of
reported decisions for the moral dilemmas that match those chosen by a
group of “experts” (professionals in the field of political science and
philosophy). Scores range from 0 to 5 out of the possible 5 moral
dilemma decisions that can match.
Cancer10
Score
Religious Orthodoxy Score: this score represents the sum of the rated
importance and rank for one specific item from the Cancer moral
dilemma that evokes the notion that only God can determine whether or
not someone should live or die.

VALUES IN MICROECONOMIC DECISION-MAKING 66
A Score Antisocial Score: this score represents the degree to which items are
selected that represents considerations that reflect an anti-establishment
attitude. These considerations presuppose Stage 4, but fault the
establishment for being inconsistent with their purpose.
M Score Meaningless Score: this score represents the degree to which the
survey results are meaningless. The higher the score the more
meaningless the individual survey results. Note. Adapted from “Defining Issues Test-2: Spring 2009,” by Texas Tech University, 2009,
Retrieved from www.depts.ttu.edu/provost/qep/docs/DIT_Spring2009.pdf
The total respondents and number of valid responses were recorded. M scores
were checked and the scorer removed participants with high M scores from the study. M
scores measure the meaningless items and are a test for response validity. Bebeau and
Thoma (2003) describe these items as:
…items that contain unusual, pretentious words or complex syntax, but the
items aren’t meaningful to the dilemma. “M” items are ‘high sounding’
but deliberately designed to be meaningless. If a subject endorses too
many of these items (greater than 10), we assume that the subject is
responding to style of wording and syntax rather than to meaning, and
therefore we invalidate the protocol. (p. 7)
To determine if a change has occurred in the level of ethical decision-making
utilizing the DIT2, the relevant scores to consider are the P Score and the N2 Score. I also
included analysis of the Utilizer score as it has relevance to this study. While not
relevant to the study, I did analyze the results from Stage 23 and Stage 4P to look for any
anomalies or inconsistencies with the instrument norms. I found the pre- and post test
scores to be nearly identical with no statistically significant changes or unusual scores.
Descriptive statistics including mean, median, mode, skewness, and standard deviation
were calculated for both the pre- and posttest data. A t-Test (95% C.L.), and Pearson

VALUES IN MICROECONOMIC DECISION-MAKING 67
correlation were calculated and reported here for matched pairs of the Postconventional,
N2, and Utilizer scores.

VALUES IN MICROECONOMIC DECISION-MAKING 68
Chapter 4
Results
The primary purpose of this research is to explore the role reflecting on and
sharing values plays in our individual decision-making schemas in groups. Specifically to
answer the question: Can introducing values into decision considerations disrupt existing
unconscious schemas? To accomplish this goal, the Defining Issues Test 2 (DIT2) was
used. It measures the unconscious values schemas individuals use in their decision-
making that determine their level of ethical decision-making. It is important to note that
participants were not told the instrument measured ethical decision-making. They were
simply told the instrument measured how they make decisions. The brief activity in
which they were asked to determine the values associated with the decision
considerations in Scenario 1 was the first time a values frame was introduced in the
decision-making process.
There were a total of 135 participants in the experiments with 107 (79.26%)
complete matched pretest/posttest sets after scoring. Participants were removed from the
study if they did not have completed pre- or posttests, including incomplete demographic
information required by the scorer, or if they had “meaningless” scores higher than 10. A
significant portion of the participants removed from the study came from Group 4. The
group originally had 45 participants, but had 21 (47%) of participants removed due to one
of the reasons discussed above. Group 4 was unique in that the class period was only 50
minutes in length, whereas other groups used 1 1/4 to 1 1/2 hours to complete the
experiment. For many participants, 50 minutes was not enough time to complete the
experiment adequately as they had other classes to attend across a very large land grant

VALUES IN MICROECONOMIC DECISION-MAKING 69
university. However, some students did stay after the 50-minute class period to complete
their posttest. Incomplete or meaningless posttests were the primary reason for rejecting
participant responses in this case. This was not a reflection of the method, but the time
limitation available for participants.
All participants described themselves as ethical decision-makers, and only 3
participants reported they did not use their personal values when making work decisions.
No one was allowed to participate more than once even if they were in more than one of
the classes utilized. The experiment was conducted 5 times and information about the
groups is described below.
For those reporting demographic information for all participants the age range
was from 18 to 50 with a mean age of 24.5, median of 22, and a mode of 21. Sixty-five
(62%) participants were female and 40 (38%) were male. Seventy-four (71%) students
are “traditional” college age students (18 – 24) and 31 (30%) are “nontraditional” college
age students (25+). Of the scored participants reporting, 34 report a management major,
16 accounting majors, 13 dual majors in management and marketing, 8 hospitality
management majors, 4 computer science majors, 3 nursing majors, 3 logistics and supply
chain management majors, 3 marketing majors, 3 organization and innovation majors, 2
mechanical engineering majors, 2 dual majors in management and accounting, 2
computer information systems majors, and 1 major each in human resources, computer
information and office systems, human services, dental hygiene, business and music,
accounting and global logistics management, management and finance, management and
entrepreneurship, management and human resources, management and interior design,
and management and equine science.

VALUES IN MICROECONOMIC DECISION-MAKING 70
Group Descriptions - UAA Mat-Su College
Group 1
This group was a MSC lower division Microeconomics class and consisted of 13
participants resulting in 11 (85%) complete scored matched pretest/posttest pairs.
Computer problems during the completion of either a pre- or posttest resulted in
incomplete results in both cases. All scored participants are female, 2 are non-U.S.
citizens and 3 are non-native English speakers. Ages of the group range from 19 to 45
with a mean age of 27.36, median of 27, and a mode of 19. Five students (45%) are
“traditional” college age students (18-24) and 6 (55%) are “nontraditional” college age
students (25+). Of the scored participants reporting, 7 are accounting majors, 3 business
administration majors, and one mechanical engineering major.
The distribution of students reporting length of time as part of the cohort is on Table 4.1
on page 74
Due to the small class size, rather than taking a random sample of the values
students assigned to each of the decision considerations in Scenario 1, all student
responses were shared. The shared value set for each of the Scenario 1 decision
considerations for all groups is in Appendix E. Duplicate responses were removed from
the set.
Group 2
This group was a MSC lower division second semester Principles of Financial
Accounting class and consisted of 20 participants resulting in 20 (100%) complete scored
matched pretest/posttest pairs. Five scored participants are male and 15 are female, all are

VALUES IN MICROECONOMIC DECISION-MAKING 71
U.S. citizens and native English speakers. Ages of the group range from 18 to 48 with a
mean age of 29.3, median of 27, and a mode of 26. Five students (25%) are “traditional”
college age students (18-24) and 15 (75%) are “nontraditional” college age students
(25+). Of the scored participants reporting, 9 are accounting majors, 8 are business
administration/management majors, 1 human resources major, 1 computer information
and office systems/office administration major, 1 nursing major, and 1 double major in
accounting and global logistics management. The distribution of students reporting length
of time as part of the cohort is on Table 4.1 on page 74.
For this class a random sample of 10 student responses to the values students
assigned to each of the decision considerations in Scenario 1 were shared. Duplicate
responses were removed from the set.
Group 3
This group was a MSC lower division Supervision class and consisted of 19
participants resulting in 17 (89%) complete scored matched pretest/posttest pairs. Eleven
scored participants are male and 6 are female, all are U.S. citizens and 1 is a non-native
English speaker. For those reporting (16), ages of the group range from 19 to 50 with a
mean age of 25.93, median of 23.5, and a mode of 22. Eight students (50%) are
“traditional” college age students (18-24) and 8 (50%) are “nontraditional” college age
students (25+). Of the scored participants reporting, 4 are computer science majors, 3
logistics and supply chain management majors, 2 business management majors, 2 nursing
majors, 2 undecided, 1 human service major, 1 dental hygiene major, and 1 dual business
and music major. The distribution of students reporting length of time as part of the
cohort is on Table 4.1 on page 74.

VALUES IN MICROECONOMIC DECISION-MAKING 72
For this class a random sample of 5 student responses to the values students
assigned to each of the decision considerations in Scenario 1 were shared. Due to the time
constraints experienced with Groups 4 and 5 at CSU, a sample of 5 student responses was
chosen for those groups. I decided to choose only 5 from this group as well for
consistency with the CSU groups. Doing so still provided a variety of responses (see
Appendix E). Duplicate responses were removed from the set.
Group Descriptions - Colorado State University
Group 4
This group was a CSU upper division Human Resources class and consisted of 45
participants resulting in 24 (53%) complete scored matched pretest/posttest pairs. Of
those scored participants reporting (22), 10 are male and 12 are female, 1 is not a U.S.
citizens and 1 is a non-native English speaker. For those reporting (16), ages of the group
range from 20 to 36 with a mean age of 22.09, median of 21, and a mode of 21. Twenty
students (91%) are “traditional” college age students (18-24) and 2 (9%) are
“nontraditional” college age students (25+). Of the scored participants reporting, 16
report a business administration major (7 management, 2 computer information systems,
3 marketing, 3 organization and innovation management) and 8 are hospitality
management majors. The distribution of students reporting length of time as part of the
cohort is on Table 4.1 on page 74.
For this class a random sample of 5 student responses to the values students
assigned to each of the decision considerations in Scenario 1 were shared. Due to the time
constraints experienced with Groups 4 and 5 at CSU, a sample of 5 student responses to

VALUES IN MICROECONOMIC DECISION-MAKING 73
the values students assigned to each of the decision considerations in Scenario 1 were
shared (see Appendix E). Duplicate responses were removed from the set.
Group 5
This group was a CSU upper division Organizational Behavior and Leadership class and
consisted of 36 participants resulting in 35 (97%) complete scored matched
pretest/posttest pairs. Of those scored participants reporting (22), 14 are male and 21 are
female, 1 is not a U.S. citizens and 1 is a non-native English speaker. For those reporting
(16), ages of the group range from 20 to 24 with a mean age of 21.74, median of 22, and
a mode of 22. Thirty-five students (100%) are “traditional” college age students (18-24)
and none are “nontraditional” college age students (25+). Of the scored participants
reporting, 14 report a management major, 13 are management and marketing majors, 3
management and finance majors, 1 management and entrepreneurship major, 1
management and HR major, 2 management and accounting majors, 1 management and
interior design major, 1 management and equine science major, and 1 mechanical
engineering major. The distribution of students reporting length of time as part of the
cohort is on Table 4.1 on page 74.
For this class a random sample of 5 student responses to the values students
assigned to each of the decision considerations in Scenario 1 were shared. Due to the time
constraints experienced with Groups 4 and 5 at CSU, a sample of 5 student responses to
the values students assigned to each of the decision considerations in Scenario 1 were
shared (see Appendix E). Duplicate responses were removed from the set.

VALUES IN MICROECONOMIC DECISION-MAKING 74
Demographic Summary
Table 4.1 on the next page provides a summary of demographic information by
group.

VALUES IN MICROECONOMIC DECISION-MAKING 75
Table 4.1
Demographic Summary
Age Traditional/Non-
Traditional Student
Gender
Group Scored
Participants
Range Mean Median Mode Trad. Nontrad. Female Male
1 11 19-45 27.36 27 19 5(45%) 6(55%) 11 0
2
20 18-48 29.3 27 26 5(25%) 15(75%) 15 5
3
17 19-50 25.93 23.5 22 8(50%) 8(50%) 6 11
4
24 20-36 22.09 21 21 20(91%) 2(9%) 12 10
5
35 20-24 21.74 22 22 35(100%) 0(0%) 21 14

VALUES IN MICROECONOMIC DECISION-MAKING 76
Length of Time in Cohort
Table 4.2 below shows the time students reported being part of their cohort of
students. An explanation of how cohorts are defined in this context follows the table.
Table 4.2
Length of Time in Cohort
Group Years Frequency
1 <1 1
1 3
2 4
3 1
4 1
>4 1
2 <1 7
1 5
2 4
3 4
4 0
>4 0
3 <1 4
1 6
2 4
3 2
4 1
>4 0
4 <1 0
1 2
2 5
3 10
4 0
>4 0
5 <1 3
1 0
2 5
3 5
4 9
>4 2
While these students were not in traditional cohorts (i.e. moving through all their
classes together), they were part of lower or upper division groups. At MSC students are

VALUES IN MICROECONOMIC DECISION-MAKING 77
Freshman and Sophomores taking the same business classes and there is often only 1
section to choose from. CSU students were Juniors and Seniors and are taking many of
their upper division classes together. Most students also live on campus and so have
social relationships outside of class time with their classmates.
DIT2 Measured Scores Data
Again, the primary purpose of this research is to explore the role reflecting on and
sharing values plays in our individual decision-making schemas in groups. Specifically,
whether introducing values into decision considerations can disrupt existing unconscious
schemas. To accomplish this goal, the DIT2 was utilized to measure schema scores as
they relate to the level of ethical decision-making development. For purposes of this
research the following DIT-2 scores were analyzed:
1) Postconventional Schema Score (P Score). This score measures how much of
the decision-making process falls into the Stages 5 and 6 categories of Kohlberg’s
value development scale. As the description states, this is the Postconventional
stage of value development. An increase in score indicates an improvement
Postconventional ethical decision-making.
2) New Index Score (N2 Score). The N2 score is designed to measure: a) “The
degree to which Postconventional items are prioritized”, and b) “The degree to
which Personal interest items (lower stage items) receive lower ratings than the
ratings given to Postconventional items (higher stage items)” (Bebeau & Thoma,
2003, p. 19). It provides an overall level of value development, not just a schema
score. An increase in score indicates an improvement in Postconventional ethical

VALUES IN MICROECONOMIC DECISION-MAKING 78
decision-making and movement away from lower stage (Personal interest) ethical
decision-making.
3) Utilizer Score (U Score). This score “represents the degree of match between
items endorsed as most important and the action choice on that story” (Bebeau
and Thoma, 2003, p. 21). In other words, how well the participant selected a
menu of decision considerations that were directly related to their decision.
As the number of participants in all but one of the groups was less than 30, I have
decided to discuss the results by school and for all participants. I have looked at the
statistics at the group level and did not find any significant data that was inconsistent with
the school and all participant levels. For reference the N2 Score Descriptive statistics and
t-Test results by group are attached in Appendix F. While not relevant to the results being
reported in this study, the lower stage scores (Stage 23 and 4P Scores) were analyzed by
group, school, and all data to look for any abnormalities that might indicate students were
performing at a level lower than what would be consistent with their age group. No
abnormalities or significant pretest/posttest changes were observed. For reference,
descriptive and t-Test data for the Stage 23 and 4P Score is available in Appendix G.
MSC Scores
Postconventional schema score. Descriptive data for MSC is listed below.
Table 4.3
MSC Postconventional Schema Score Descriptive Statistics
Pscore Pre MSC Pscore Post MSC
Mean 30.25 Mean 32.33333333
Standard Error 1.854288684 Standard Error 1.775855935
Median 30 Median 34

VALUES IN MICROECONOMIC DECISION-MAKING 79
Mode 38 Mode 36
Standard
Deviation 12.84688885
Standard
Deviation 12.30349083
Sample Variance 165.0425532 Sample Variance 151.3758865
Kurtosis 0.265591982 Kurtosis 0.109293307
Skewness 0.370817737 Skewness 0.180855038
Range 62 Range 58
Minimum 4 Minimum 6
Maximum 66 Maximum 64
Sum 1452 Sum 1552
Count 48 Count 48
A test for skewness indicates the data is approximately normally distributed (see
Figures 4.1 and 4.2 below).
Figure 4.1. MSC PScore Prettest Figure 4.2. MSC PScore Posttest
The data is highly positively correlated with a Pearson Correlation of 0.75. A two-
tailed correlated t-test found a critical t of 2.01 and an observed t Stat of -1.64 suggesting
the 2.08-point increase in the mean values is not statistically significant. A two-tailed p-
value of 0.11 supports a failure to reject the null hypothesis for the MSC
Postconventional Schema Score.
N2 Index score. Descriptive data for MSC is listed on the next page.
0 20 40 0 20 40

VALUES IN MICROECONOMIC DECISION-MAKING 80
Table 4.4
MSC N2 Index Score Descriptive Statistics
N2 Score Pre MSC N2 Score Post MSC
Mean 27.94360339 Mean 32.26344346
Standard Error 1.820240205 Standard Error 2.080446036
Median 28.33984424 Median 34.93098236
Mode #N/A Mode #N/A
Standard Deviation 12.61099407 Standard Deviation 14.41375295
Sample Variance 159.0371714 Sample Variance 207.756274
Kurtosis -0.973468014 Kurtosis -0.898486707
Skewness -0.189759437 Skewness 0.120923696
Range 50.39917637 Range 57.82962879
Minimum 1.662813234 Minimum 6.446759816
Maximum 52.06198961 Maximum 64.2763886
Sum 1341.292962 Sum 1548.645286
Count 48 Count 48
A test for skewness indicates the data is approximately normally distributed (see
Figures 4.3 and 4.4 below).
Figure 4.3. MSC N2Score Pretest Figure 4.4. MSC N2Score Posttest
The data is highly positively correlated with a Pearson Correlation of 0.77. A two-
tailed correlated t-test found a critical t of 2.01 and an observed t Stat of -3.22 suggesting
the 4.32-point increase in the mean values is statistically significant. A two-tailed p-value
of 0.002 supports a rejection of the null hypothesis for the MSC New Index Score.
0 10 20 30 40 50 -10 10 30 50

VALUES IN MICROECONOMIC DECISION-MAKING 81
Consistent with Cohen’s (1992) use of Pearson’s Correlation as a test of effect size, these
results indicate a large effect size.
Utilizer score. For the utilizer score n was reduced from 48 to 47. This is
because the data used to calculate the score is different from the other scores, and one
participant had incomplete data in this category. Descriptive data for MSC is listed
below.
Table 4.5
MSC Utilizer Score Descriptive Statistics
Utilizer Pre MSC Utilizer Post MSC
Mean 0.204736493 Mean 0.159430344
Standard Error 0.019693299 Standard Error 0.02151818
Median 0.207656004 Median 0.162821185
Mode #N/A Mode 0
Standard
Deviation 0.135010456
Standard
Deviation 0.147521212
Sample Variance 0.018227823 Sample Variance 0.021762508
Kurtosis 0.723993139 Kurtosis 0.122321601
Skewness 0.144556954 Skewness 0.125507068
Range 0.542737284 Range 0.688368165
Minimum 0.080230729 Minimum 0.174471993
Maximum 0.462506555 Maximum 0.513896172
Sum 9.622615184 Sum 7.493226151
Count 47 Count 47
A test for skewness indicates the data is approximately normally distributed (see
Figures 4.5 and 4.6 on the next page).
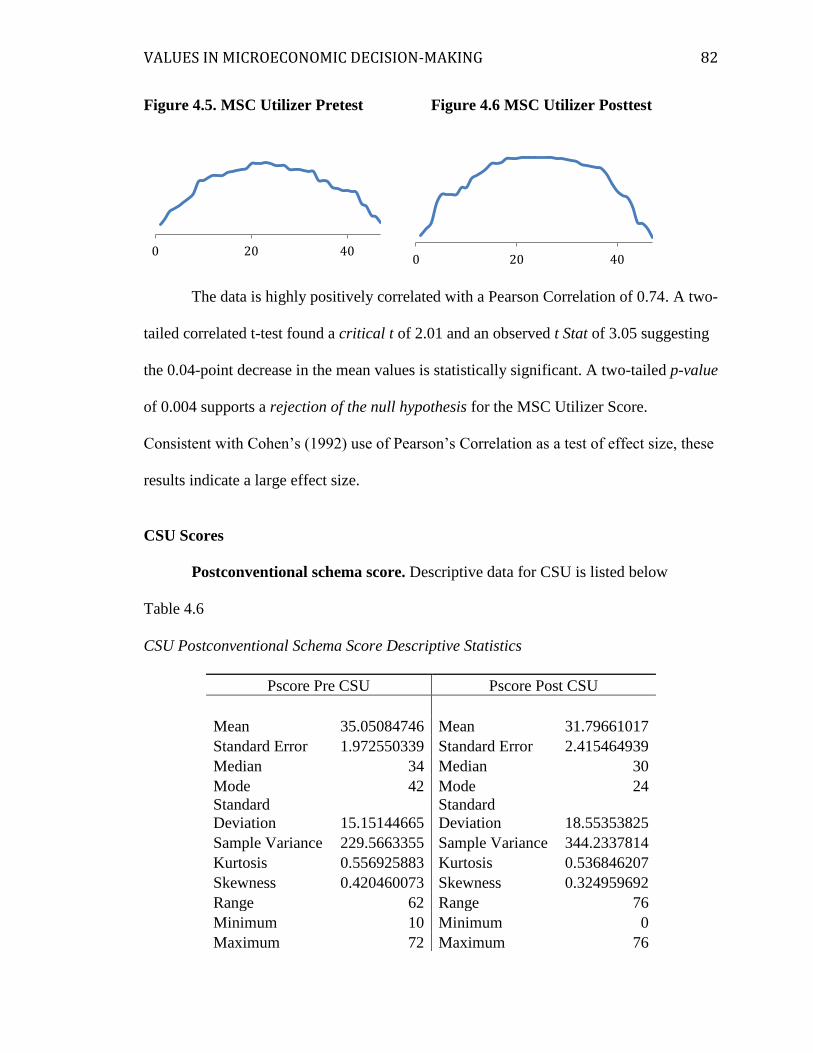
VALUES IN MICROECONOMIC DECISION-MAKING 82
Figure 4.5. MSC Utilizer Pretest Figure 4.6 MSC Utilizer Posttest
The data is highly positively correlated with a Pearson Correlation of 0.74. A two-
tailed correlated t-test found a critical t of 2.01 and an observed t Stat of 3.05 suggesting
the 0.04-point decrease in the mean values is statistically significant. A two-tailed p-value
of 0.004 supports a rejection of the null hypothesis for the MSC Utilizer Score.
Consistent with Cohen’s (1992) use of Pearson’s Correlation as a test of effect size, these
results indicate a large effect size.
CSU Scores
Postconventional schema score. Descriptive data for CSU is listed below
Table 4.6
CSU Postconventional Schema Score Descriptive Statistics
0 20 400 20 40
Pscore Pre CSU Pscore Post CSU
Mean 35.05084746 Mean 31.79661017
Standard Error 1.972550339 Standard Error 2.415464939
Median 34 Median 30
Mode 42 Mode 24
Standard
Deviation 15.15144665
Standard
Deviation 18.55353825
Sample Variance 229.5663355 Sample Variance 344.2337814
Kurtosis 0.556925883 Kurtosis 0.536846207
Skewness 0.420460073 Skewness 0.324959692
Range 62 Range 76
Minimum 10 Minimum 0
Maximum 72 Maximum 76

VALUES IN MICROECONOMIC DECISION-MAKING 83
A test for skewness indicates the data is approximately normally distributed (see
Figures 4.7 and 4.8 below).
Figure 4.7. CSU PScore Pretest Figure 4.8 CSU PScore Posttest
The data is highly positively correlated with a Pearson Correlation of 0.73. A two-
tailed correlated t-test found a critical t of 2.00 and an observed t Stat of 1.95 suggesting
the 3.25-point decrease in the mean values is not statistically significant and supports a
failure to reject the null hypothesis for the CSU Postconventional Schema Score.
However, two-tailed p-value of 0.06 indicates a rejection of the null hypothesis for α =
.10. Consistent with Cohen’s (1992) use of Pearson’s Correlation as a test of effect size,
these results indicate a large effect size.
N2 Index score. Descriptive data for CSU is listed on the following page.
0 20 400 20 40
Sum 2068 Sum 1876
Count 59 Count 59

VALUES IN MICROECONOMIC DECISION-MAKING 84
Table 4.7
CSU N2 Index Score Descriptive Statistics
N2 Score Pre CSU N2 Score Post CSU
Mean 32.99772139 Mean 31.47021292
Standard Error 1.881112029 Standard Error 2.263203332
Median 33.72876867 Median 33.5596598
Mode #N/A Mode #N/A
Standard Deviation 14.44909566 Standard Deviation 17.38399465
Sample Variance 208.7763654 Sample Variance 302.20327
Kurtosis -0.461154555 Kurtosis -0.570050312
Skewness 0.220634071 Skewness 0.367551738
Range 61.14372514 Range 71.79608888
Minimum 5.300049497 Minimum 1.186909712
Maximum 66.44377464 Maximum 72.98299859
Sum 1946.865562 Sum 1856.742562
Count 59 Count 59
A test for skewness indicates the data is approximately normally distributed (see
Figures 4.9 and 4.10 below).
Figure 4.9. CSU N2Score Pretest Figure 4.10. CSU N2Score Posttest
The data is highly positively correlated with a Pearson Correlation of 0.75. A two-
tailed correlated t-test found a critical t of 2.00 and an observed t Stat of 1.02 suggesting
the 1.53-point increase in the mean values is not statistically significant. A two-tailed p-
value of 0.31 supports a failure to reject the null hypothesis for the CSU New Index
Score.
0 20 40 600 20 40 60
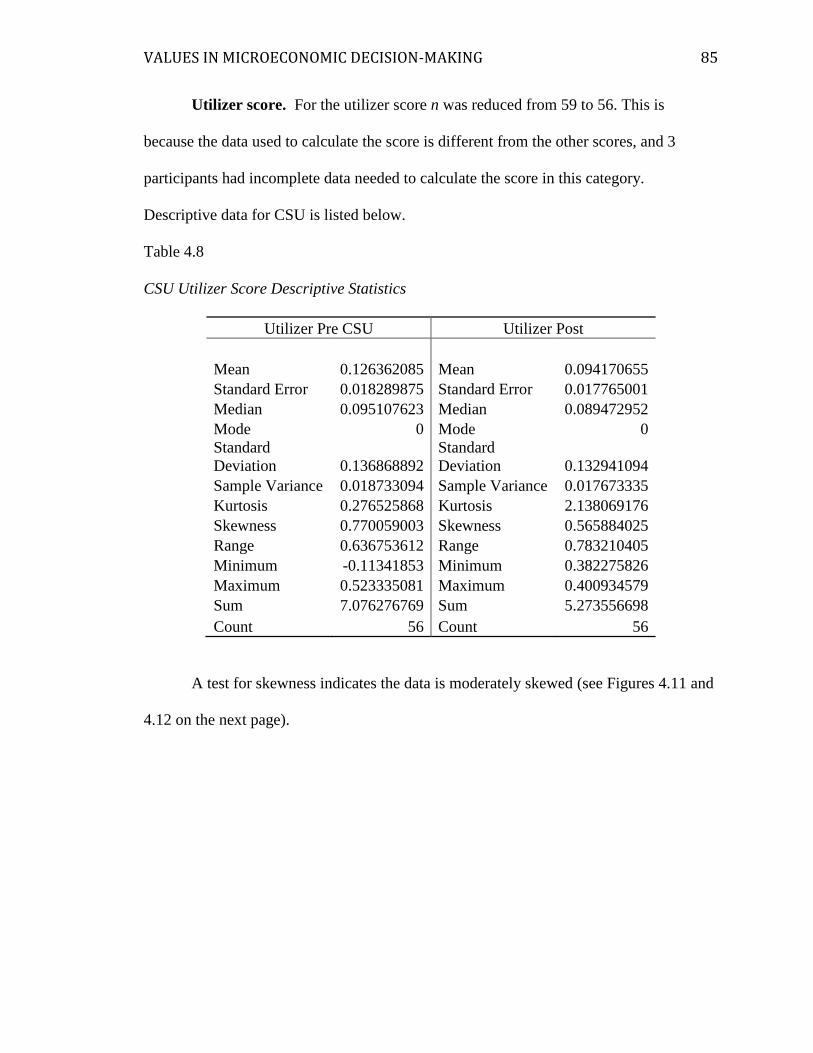
VALUES IN MICROECONOMIC DECISION-MAKING 85
Utilizer score. For the utilizer score n was reduced from 59 to 56. This is
because the data used to calculate the score is different from the other scores, and 3
participants had incomplete data needed to calculate the score in this category.
Descriptive data for CSU is listed below.
Table 4.8
CSU Utilizer Score Descriptive Statistics
Utilizer Pre CSU Utilizer Post
Mean 0.126362085 Mean 0.094170655
Standard Error 0.018289875 Standard Error 0.017765001
Median 0.095107623 Median 0.089472952
Mode 0 Mode 0
Standard
Deviation 0.136868892
Standard
Deviation 0.132941094
Sample Variance 0.018733094 Sample Variance 0.017673335
Kurtosis 0.276525868 Kurtosis 2.138069176
Skewness 0.770059003 Skewness 0.565884025
Range 0.636753612 Range 0.783210405
Minimum -0.11341853 Minimum 0.382275826
Maximum 0.523335081 Maximum 0.400934579
Sum 7.076276769 Sum 5.273556698
Count 56 Count 56
A test for skewness indicates the data is moderately skewed (see Figures 4.11 and
4.12 on the next page).

VALUES IN MICROECONOMIC DECISION-MAKING 86
Figure 4.11. CSU Utilizer Pretest Figure 4.12. CSU Utilizer Posttest
The data has low to moderate positive correlation with a Pearson Correlation of
0.33. A two-tailed correlated t-test found a critical t of 2.00 and an observed t Stat of 1.54
suggesting the 0.03-point decrease in the mean values is not statistically significant. A
two-tailed p-value of 0.13 supports a failure to reject the null hypothesis for the CSU
Utilizer Score.
All Data Scores
All scores were analyzed at the “all data” level for all groups and all schools. In
the areas were there were not inconsistencies across schools (Personal Interest and
Maintaining Norms Scores), none were found at the all data level. As some of the school
level statistics for the Postconventional Schema, New Index, and Utilizer Scores suggests
a rejection of the null hypothesis, the results at the all data level for those scores are
presented here for comparison.
Postconventional schema score. Descriptive data for all data (n=107) is listed
on the following page.
0 20 40 0 20 40

VALUES IN MICROECONOMIC DECISION-MAKING 87
Table 4.9
All Data Postconventional Schema Score Descriptive Statistics
Pscore Pre All Data Pscore Post
Mean 32.89719626 Mean 32.03738318
Standard Error 1.382622239 Standard Error 1.545405488
Median 30 Median 32
Mode 42 Mode 36
Standard
Deviation 14.30195565
Standard
Deviation 15.98579867
Sample Variance 204.5459355 Sample Variance 255.5457591
Kurtosis 0.195573274 Kurtosis 0.164725703
Skewness 0.464953808 Skewness 0.29031359
Range 68 Range 76
Minimum 4 Minimum 0
Maximum 72 Maximum 76
Sum 3520 Sum 3428
Count 107 Count 107
A test for skewness indicates the data is approximately normally distributed (see
Figures 4.13 and 4.14 below).
Figure 4.13. All Data PScore Pretest Figure 4.14. All Data PScore Posttest
The data is highly positively correlated with a Pearson Correlation of 0.72. A two-
tailed correlated t-test found a critical t of 1.98 and an observed t Stat of 0.78 suggesting
the 0.87-point increase in the mean values is not statistically significant. A two-tailed p-
value of 0.44 supports a failure to reject the null hypothesis for all data in the
Maintaining Norms Schema Score
0 50 100 0 50 100

VALUES IN MICROECONOMIC DECISION-MAKING 88
N2 Index score. Descriptive data for CSU is listed below.
Table 4.10
All Data N2 Index Score Descriptive Statistics
N2 Score Pre All Data N2 Score Post All Data
Mean 30.7304535 Mean 31.82605466
Standard Error 1.336513636 Standard Error 1.551700796
Median 31.29248276 Median 34.19921192
Mode #N/A Mode #N/A
Standard
Deviation 13.82500455 Standard Deviation 16.05091784
Sample Variance 191.1307508 Sample Variance 257.6319636
Kurtosis 0.424322622 Kurtosis 0.621739994
Skewness 0.144334339 Skewness 0.275747926
Range 64.78096141 Range 71.79608888
Minimum 1.662813234 Minimum 1.186909712
Maximum 66.44377464 Maximum 72.98299859
Sum 3288.158524 Sum 3405.387849
Count 107 Count 107
A test for skewness indicates the data is approximately normally distributed (see
Figures 4.15 and 4.16 below).
Figure 4.15. All Data N2Score Pretest Figure 4.16. All Data N2Score Posttest
The data is highly positively correlated with a Pearson Correlation of 0.74. A two-
tailed correlated t-test found a critical t of 1.98 and an observed t Stat of -1.03 suggesting
0 50 100 0 50 100

VALUES IN MICROECONOMIC DECISION-MAKING 89
the 1.10-point increase in the mean values is not statistically significant. A two-tailed p-
value of 0.30 supports a failure to reject the null hypothesis for all data in the New Index
Score.
Utilizer score. Descriptive data for all data (n = 103) is listed below.
Table 4.11
All Data Utilizer Score Descriptive Statistics
Utilizer Pre All Data Utilizer Post
Mean 0.162125165 Mean 0.123949348
Standard Error 0.013885951 Standard Error 0.014077159
Median 0.134242265 Median 0.114840063
Mode 0 Mode 0
Standard
Deviation 0.140927008
Standard
Deviation 0.142867561
Sample Variance 0.019860421 Sample Variance 0.02041114
Kurtosis 0.649444608 Kurtosis 1.132244456
Skewness 0.309941174 Skewness 0.111179382
Range 0.636753612 Range 0.896171998
Minimum -0.11341853 Minimum 0.382275826
Maximum 0.523335081 Maximum 0.513896172
Sum 16.69889195 Sum 12.76678285
Count 103 Count 103
A test for skewness indicates the data is approximately normally distributed (see Figures
4.17 and 4.18 on the next page).
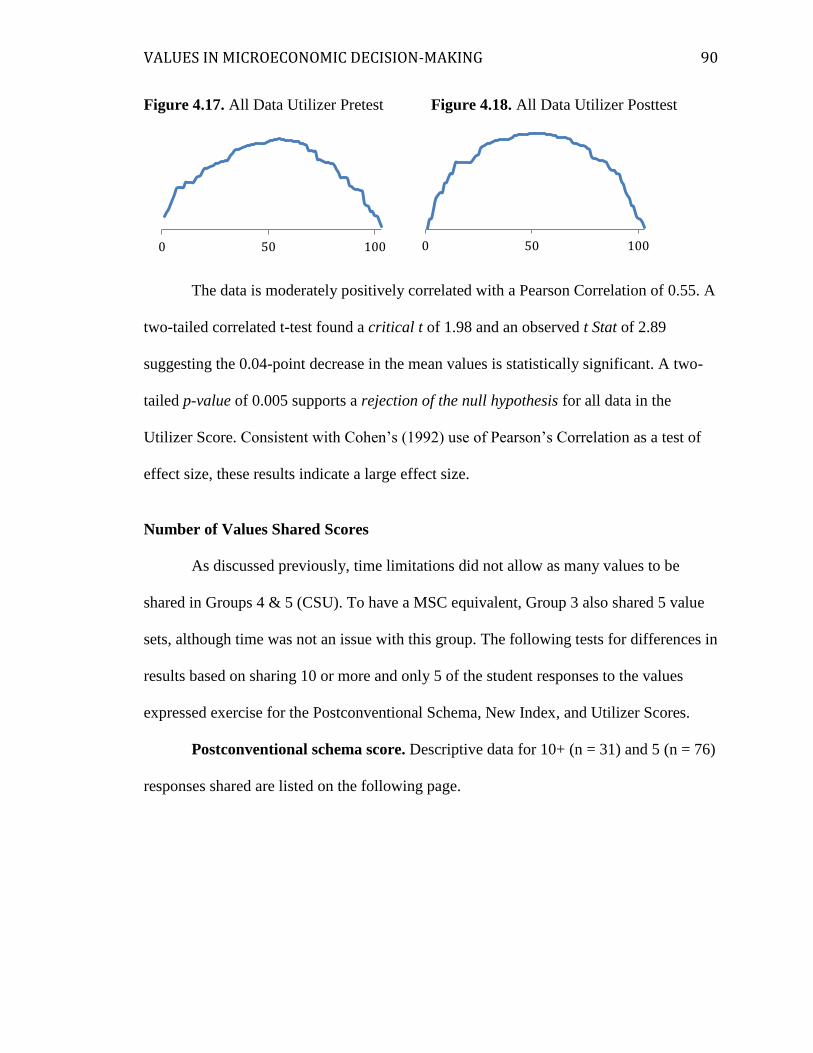
VALUES IN MICROECONOMIC DECISION-MAKING 90
Figure 4.17. All Data Utilizer Pretest Figure 4.18. All Data Utilizer Posttest
The data is moderately positively correlated with a Pearson Correlation of 0.55. A
two-tailed correlated t-test found a critical t of 1.98 and an observed t Stat of 2.89
suggesting the 0.04-point decrease in the mean values is statistically significant. A two-
tailed p-value of 0.005 supports a rejection of the null hypothesis for all data in the
Utilizer Score. Consistent with Cohen’s (1992) use of Pearson’s Correlation as a test of
effect size, these results indicate a large effect size.
Number of Values Shared Scores
As discussed previously, time limitations did not allow as many values to be
shared in Groups 4 & 5 (CSU). To have a MSC equivalent, Group 3 also shared 5 value
sets, although time was not an issue with this group. The following tests for differences in
results based on sharing 10 or more and only 5 of the student responses to the values
expressed exercise for the Postconventional Schema, New Index, and Utilizer Scores.
Postconventional schema score. Descriptive data for 10+ (n = 31) and 5 (n = 76)
responses shared are listed on the following page.
0 50 100 0 50 100
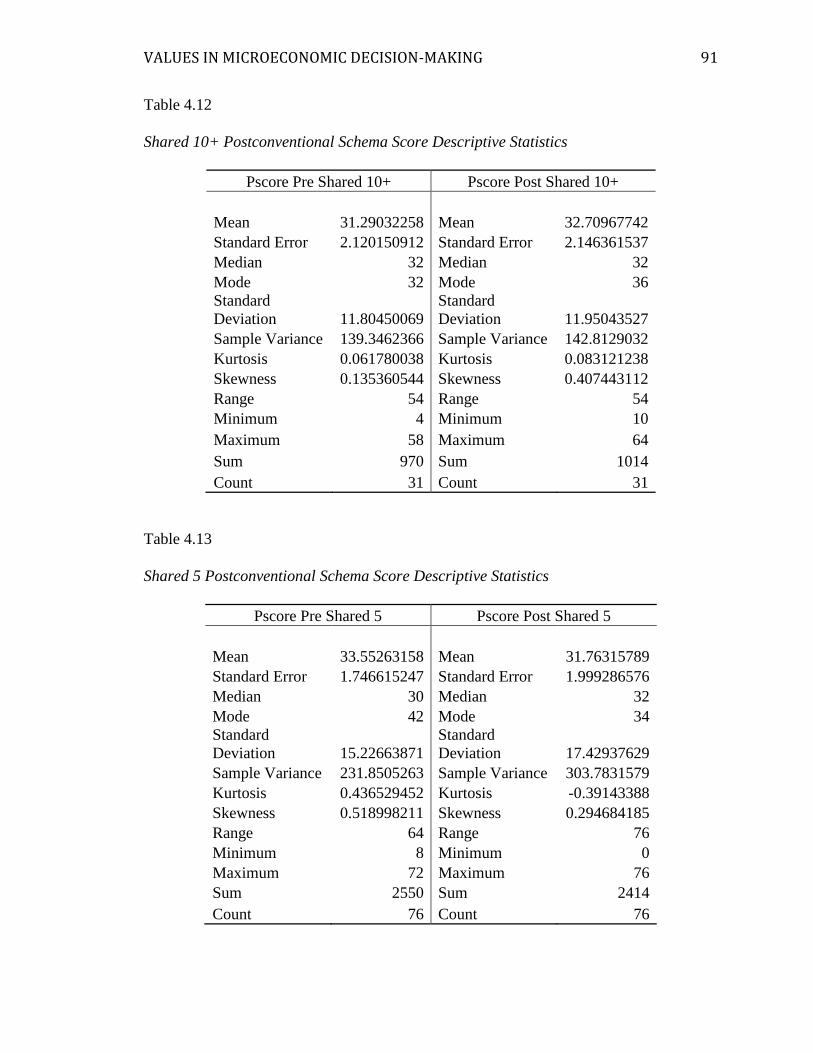
VALUES IN MICROECONOMIC DECISION-MAKING 91
Table 4.12
Shared 10+ Postconventional Schema Score Descriptive Statistics
Pscore Pre Shared 10+ Pscore Post Shared 10+
Mean 31.29032258 Mean 32.70967742
Standard Error 2.120150912 Standard Error 2.146361537
Median 32 Median 32
Mode 32 Mode 36
Standard
Deviation 11.80450069
Standard
Deviation 11.95043527
Sample Variance 139.3462366 Sample Variance 142.8129032
Kurtosis 0.061780038 Kurtosis 0.083121238
Skewness 0.135360544 Skewness 0.407443112
Range 54 Range 54
Minimum 4 Minimum 10
Maximum 58 Maximum 64
Sum 970 Sum 1014
Count 31 Count 31
Table 4.13
Shared 5 Postconventional Schema Score Descriptive Statistics
Pscore Pre Shared 5 Pscore Post Shared 5
Mean 33.55263158 Mean 31.76315789
Standard Error 1.746615247 Standard Error 1.999286576
Median 30 Median 32
Mode 42 Mode 34
Standard
Deviation 15.22663871
Standard
Deviation 17.42937629
Sample Variance 231.8505263 Sample Variance 303.7831579
Kurtosis 0.436529452 Kurtosis -0.39143388
Skewness 0.518998211 Skewness 0.294684185
Range 64 Range 76
Minimum 8 Minimum 0
Maximum 72 Maximum 76
Sum 2550 Sum 2414
Count 76 Count 76

VALUES IN MICROECONOMIC DECISION-MAKING 92
A test for skewness indicates the data is approximately normally distributed (see
Figures 4.19 through 4.22 below).
Figure 4.19. 10+ PScore Pretest Figure 4.20. 10+ PScore Posttest
Figure 4.21. 5 PScore Pretest Figure 4.22. 5 PScore Posttest
The data is highly positively correlated with a Pearson Correlation of 0.84 for the
10+ group and 0.70 for the 5 group. A two-tailed correlated t-Test found a critical t of
2.04 for the 10+ group and an observed t Stat of -1.17 suggesting the 1.42-point increase
in the mean values is not statistically significant. A two-tailed p-value of 0.25 supports a
failure to reject the null hypothesis for the 10+ Maintaining Norms Schema Score.
A two-tailed correlated t-Test found a critical t of 1.99 for the 5 group and an
observed t Stat of 1.22 suggesting the 1.79-point decrease in the mean values is not
statistically significant. A two-tailed p-value of 0.23 supports a failure to reject the null
hypothesis for the 5 Maintaining Norms Schema Score.
0 10 20 30 0 10 20 30
0 20 40 60 0 20 40 60

VALUES IN MICROECONOMIC DECISION-MAKING 93
N2 Index score. Descriptive data for 10+ (n = 31) and 5 (n = 76) responses
shared are listed below.
Table 4.14
Shared 10+ N2 Index Score Descriptive Statistics
N2Score Pre Shared 10+ N2Score Post Shared 10+
Mean 28.38912904 Mean 31.72975939
Standard Error 2.390570583 Standard Error 2.761188988
Median 29.91984919 Median 35.73612658
Mode #N/A Mode #N/A
Standard
Deviation 13.3101337
Standard
Deviation 15.37364965
Sample Variance 177.1596591 Sample Variance 236.3491035
Kurtosis 0.840937711 Kurtosis -1.33088735
Skewness 0.339877518 Skewness 0.017614304
Range 50.39917637 Range 51.9509142
Minimum 1.662813234 Minimum 6.446759816
Maximum 52.06198961 Maximum 58.39767402
Sum 880.0630002 Sum 983.6225411
Count 31 Count 31
Table 4.15
Shared 5 N2 Index Score Descriptive Statistics
N2Score Pre Shared 5 N2Score Post Shared 5
Mean 31.68546742 Mean 31.86533299
Standard Error 1.606227905 Standard Error 1.883357879
Median 31.40542903 Median 33.62197303
Mode #N/A Mode #N/A
Standard
Deviation 14.00277024
Standard
Deviation 16.41873334
Sample Variance 196.0775744 Sample Variance 269.5748044
Kurtosis -0.44118115 Kurtosis 0.414103569
Skewness 0.287741742 Skewness 0.371488948
Range 61.14372514 Range 71.79608888
Minimum 5.300049497 Minimum 1.186909712
Maximum 66.44377464 Maximum 72.98299859

VALUES IN MICROECONOMIC DECISION-MAKING 94
Sum 2408.095524 Sum 2421.765308
Count 76 Count 76
A test for skewness indicates the data is approximately normally distributed (see
Figures 4.23 through 4.26 below).
Figure 4.23. 10+ NScore Pretest Figure 4.24. 10+ NScore Posttest
Figure 4.25. 5 NScore Pretest Figure 4.26. 5 NScore Posttest
The data is highly positively correlated with a Pearson Correlation of 0.88 for the
10+ group and 0.70 for the 5 group. A two-tailed correlated t-Test found a critical t of
2.04 for the 10+ group and an observed t Stat of -2.58 suggesting the 3.34-point increase
in the mean values is statistically significant. A two-tailed p-value of 0.02 supports a
rejection of the null hypothesis for the 10+ N2 Index Score. Consistent with Cohen’s
(1992) use of Pearson’s Correlation as a test of effect size, these results indicate a large
effect size.
A two-tailed correlated t-Test found a critical t of 1.99 for the 5 group and an
observed t Stat of -0.13 suggesting the 0.18-point increase in the mean values is not
0 10 20 300 10 20 30
0 20 40 60 0 20 40 60

VALUES IN MICROECONOMIC DECISION-MAKING 95
statistically significant. A two-tailed p-value of 0.90 supports a failure to reject the null
hypothesis for the 5 N2 Index Score.
Utilizer score. Descriptive data for 10+ (n = 30) and 5 (n = 76) responses shared
are listed on the following page.
Table 4.16
Shared 10+ Utilizer Score Descriptive Statistics
Utilizer Pre Shared 10+ Utilizer Post Shared 10+
Mean 0.221827634 Mean 0.172362043
Standard Error 0.022022013 Standard Error 0.02351598
Median 0.221399887 Median 0.163756566
Mode #N/A Mode 0
Standard
Deviation 0.120619535
Standard
Deviation 0.128802326
Sample Variance 0.014549072 Sample Variance 0.016590039
Kurtosis 0.776757779 Kurtosis 0.809677578
Skewness 0.157485846 Skewness -0.27983185
Range 0.450668549 Range 0.595552223
Minimum 0.011838006 Minimum 0.174471993
Maximum 0.462506555 Maximum 0.421080231
Sum 6.654829024 Sum 5.170861277
Count 30 Count 30
Table 4.17
Shared 10+ Utilizer Score Descriptive Statistics
Utilizer Pre Shared 5 Utilizer Post Shared 5
Mean 0.137589903 Mean 0.10405372
Standard Error 0.016626458 Standard Error 0.016902529
Median 0.106492478 Median 0.100943891
Mode 0 Mode 0
Standard
Deviation 0.142056517
Standard
Deviation 0.144415269
Sample Variance 0.020180054 Sample Variance 0.02085577
Kurtosis 0.397561041 Kurtosis 1.554738183

VALUES IN MICROECONOMIC DECISION-MAKING 96
Skewness 0.524816754 Skewness 0.003220993
Range 0.636753612 Range 0.896171998
Minimum -0.11341853 Minimum 0.382275826
Maximum 0.523335081 Maximum 0.513896172
Sum 10.04406293 Sum 7.595921572
Count 73 Count 73
A test for skewness indicates the data is approximately normally distributed (see
Figures 4.27 through 4.30 below).
Figure 4.27. 10+ Utilizer Pretest Figure 4.28. 10+ Utilizer Posttest
Figure 4.29. 5 Utilizer Pretest Figure 4.30. 5 Utilizer Posttest
The 10+ data is highly positively correlated with a Pearson Correlation of 0.67,
but the 5 group is only moderately correlated at 0.48. A two-tailed correlated t-Test found
a critical t of 2.05 for the 10+ group and an observed t Stat of 2.70 suggesting the 0.05-
point decrease in the mean values is statistically significant. A two-tailed p-value of 0.01
supports a rejection of the null hypothesis for the 10+ Utilizer Score.
A two-tailed correlated t-Test found a critical t of 1.99 for the 5 group and an observed t
Stat of 1.96 suggesting the 0.04-point decrease in the mean values is just barely not
0 10 20 30 0 10 20 30
0 20 40 60 0 20 40 60

VALUES IN MICROECONOMIC DECISION-MAKING 97
statistically significant. A two-tailed p-value of 0.05 supports a rejection of the null
hypothesis for the 5 N2 Index Score.
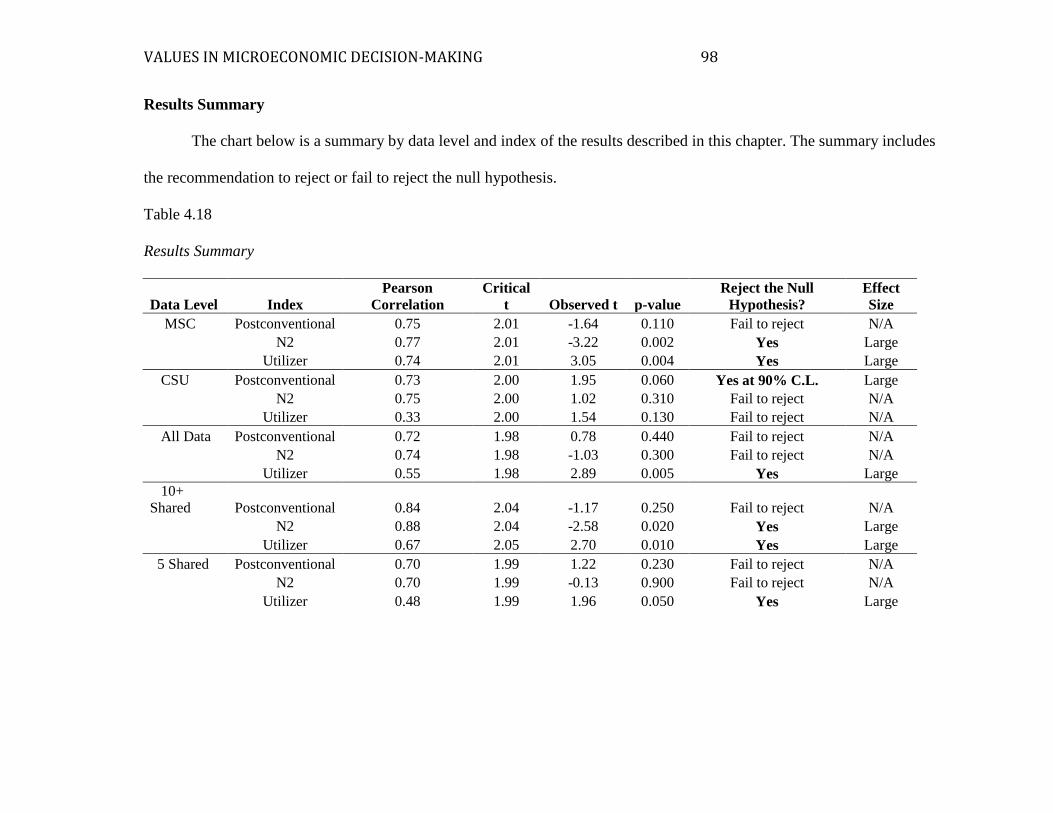
VALUES IN MICROECONOMIC DECISION-MAKING 98
Results Summary
The chart below is a summary by data level and index of the results described in this chapter. The summary includes
the recommendation to reject or fail to reject the null hypothesis.
Table 4.18
Results Summary
Data Level Index
Pearson
Correlation
Critical
t Observed t p-value
Reject the Null
Hypothesis?
Effect
Size
MSC Postconventional 0.75 2.01 -1.64 0.110 Fail to reject N/A
N2 0.77 2.01 -3.22 0.002 Yes Large
Utilizer 0.74 2.01 3.05 0.004 Yes Large
CSU Postconventional 0.73 2.00 1.95 0.060 Yes at 90% C.L. Large
N2 0.75 2.00 1.02 0.310 Fail to reject N/A
Utilizer 0.33 2.00 1.54 0.130 Fail to reject N/A
All Data Postconventional 0.72 1.98 0.78 0.440 Fail to reject N/A
N2 0.74 1.98 -1.03 0.300 Fail to reject N/A
Utilizer 0.55 1.98 2.89 0.005 Yes Large
10+
Shared Postconventional 0.84 2.04 -1.17 0.250 Fail to reject N/A
N2 0.88 2.04 -2.58 0.020 Yes Large
Utilizer 0.67 2.05 2.70 0.010 Yes Large
5 Shared Postconventional 0.70 1.99 1.22 0.230 Fail to reject N/A
N2 0.70 1.99 -0.13 0.900 Fail to reject N/A
Utilizer 0.48 1.99 1.96 0.050 Yes Large

VALUES IN MICROECONOMIC DECISION-MAKING 99
Chapter 5
Discussion
According to Rest et al. (2000), over 25 years of data—with approximately 13,
386 responses with 10, 870 included in the analysis—have found test-retest results
without interventions to be unchanged for all groups. Researchers have also found that
DIT scores “show significant gains due to moral educational programs of more than 3
weeks” and during the college years in liberal arts programs (Bebeau & Thoma, 2003).
This study is unique in that the intervention is very short, does not attempt to “teach”
participants about values or ethical decision-making, and is largely personal in its impact
as there is no discussion, only sharing. This supports the exploratory nature of the
research. The intervention does reframe decision-making in value terms and brings the
assignment of values to decision considerations to the conscious level for individuals and
the group. Yet this minor intervention did cause some statistically significant changes in
scores.
Postconventional and N2 Scores
When the results are analyzed for all participants together, there is little change in
the Postconventional and N2 Scores, however there are some interesting and significant
results when we look at the schools individually. MSC students improved their N2 Scores
by a statistically significant 4.32 points. This indicates they shifted their use of lower
stage items to Postconventional items and became better ethical decision-makers. They
also increased their Postconventional scores by 2.08 points. Tests for statistical
significance were not quite enough to support statistical significance at a 90% confidence

VALUES IN MICROECONOMIC DECISION-MAKING 100
level (p-value 0.11) for the Postconventional scores, but it does contribute to the upward
trend of MSC scores reflected in the N2 score.
CSU students, by contrast, saw a decrease of 3.25 points in their Postconventional
scores indicating the amount of their decision-making in Stages 5 and 6 may have
decreased as these results are only statistically significant at a 90% confidence level. The
student’s N2 scores decreased by 1.53 points, which was not a statistically significant
change. At a 95% confidence level the results indicate that the CSU groups scores were
relatively unchanged.
Norm Comparisons Postconventional and N2 Scores
Assuming the CSU scores were unchanged or only had a very small change, what
might have contributed to no change or a small change in ethical decision-making at CSU
while there were significant improvements at MSC? The DIT norms suggest several
factors that correlate with scores that might give us some clues.
Cognitive development. DIT scores are often positively correlated with cognitive
development including IQ, general intelligence, achievement, and GPA. While GPA data
on all participants was not available, we can make some inferences about the cognitive
development of our groups. CSU is a selective school and according to the Colorado
State University Profile (2013), students admitted to the university are in the 74th
percentile of their graduating class, have an average high school GPA of 3.59, an ACT
composite score of 24.7, and/or a SAT combined score of 1142. MSC is an open
enrollment school and does not have any gates for class rank, high school GPA, or ACT
or SAT scores. We can infer from their open enrollment status that MSC will have a
much broader range of student ability than CSU. MSC students are required to take a

VALUES IN MICROECONOMIC DECISION-MAKING 101
math and English placement test and with only 75% of students entering the school with
college level math and/or reading skills, we can also assume the level of cognitive
development of MSC students entering the school is lower than CSU.
Because of this difference, norms indicate that CSU students would have higher
scores on the DIT than MSC students. On the pretest, this was true with a CSU
Postconventional score of 35.05 compared to MSC’s at 30.25 and N2 Scores of 33.00
(CSU) and 27.94 (MSC). However, cognitive development fails to explain the posttest
results as MSC’s posttest scores for both the Postconventional and N2 Scores were above
CSU’s and overall closer in value with CSU than the pretest scores were.
Education. A second factor that is often correlated with DIT scores is level of
education. Related to college students the norms indicate junior and senior level students
will outperform freshman and sophomore level students. Again, this factor fails to
explain the posttest scores as the CSU students were juniors and seniors in upper division
classes and should have outperformed the MSC students who were largely freshman and
sophomores in lower division classes.
Gender. Gender is another factor that often predicts performance on
Postconventional scores. Norms indicate female participants generally score higher than
males. In this study 67% of MSC participants were female and 58% at CSU. Based on
these ratios we might expect the MSC group to consistently outscore the CSU group, but
that was not the case. However, the N2 Score results for MSC may have been impacted
by the high percentage of women in the group. When looked at alone, female participants
increased their mean score by a statistically significant 5.18 points (t-critical 2.04,
observed t -3.26, p-value .003) compared to the male participants who increased their
VALUES IN MICROECONOMIC DECISION-MAKING 102
score by a statistically insignificant 2.61 points. Similar gender differences were not
observed at CSU.
It is possible that traditionally higher scores by women could indicate more
sensitivity to values and ethics in decision-making then men and/or that women are more
likely to adjust individual decision-making in a group when values are shared. Several
studies support the possibility of either of these factors influencing ethics scores. A study
on business students by Stedham et al. (2007) found that women have a stronger “intent”
to behave in an ethical manner so by reframing the decision-making process in values
terms, the study may have engaged the ethical decision-making perspective to a higher
degree for women than it did for the male participants as females appear to be more
sensitive to subtle ethical context than males are. Studies have also indicated that women
“focus their [ethical] analysis on personal, relationship-oriented aspects of an action”
(Stedham et al., 2007, p. 171) and are less likely to prefer competitive success and more
likely to promote harmonious work relationships and engage in social learning (Ameen,
Guffey, & McMillan, 1996). While men are more likely to focus on clear-cut objective
criteria in ethical decision-making, women are more likely to consider ‘relative’
considerations (Stedham et al., 2007). Female students are also more likely to engage in
impression management than males so by reframing decision-making in a values/ethics
framework, female students may be more likely to answer in a way that will give the
impression of being ethical (Becker & Ulstad, 2007). The fact that there were not similar
results for N2 or P Scores at CSU might indicate that gender was one, but not the only
factor that caused women at MSC to improve their scores more dramatically than men.
Non-Normed Factors for Postconventional and N2 Scores
VALUES IN MICROECONOMIC DECISION-MAKING 103
Reviewing the norms associated with the DIT-2 did not sufficiently explain our
results. As this research is utilizing an intervention that appears to be significantly
different than the pre- and posttest experiments in the past, it is possible that the norms do
not apply as strongly to this research. The following are some other factors to consider
that might help explain the results.
Group cognitive “sameness” and number of values shared. One issue that
needs to be considered is to what degree the participants in the groups were similar
before the experiment and how that may have impacted results. As discussed in the
“Cognitive Development” section, there are reasons to believe the individual’s in the
CSU group were more alike than the individual’s in the MSC group. The CSU students
all went through a competitive admission process that was looking for similar
characteristics, intellectual capacity, etc. The MSC students were part of an open
enrollment campus and provide a much more diverse, although more geographically
isolated group.
As we assume decision-making is a cognitive process, it is possible that the
cognitive “sameness” of the individuals in the CSU classes impacted their ability to be
influenced by the sharing of values, because there values were less diverse to begin with
as they shared a similar cognitive decision-making process. To test for “sameness” I
looked at the three groups that only shared 5 sets of values and compared the average
number of distinct values shared per decision consideration. The groups included both
CSU groups (Groups 4 & 5) and one MSC group (Group 3). I found that the MSC group
averaged 4.4 values per decision consideration and CSU Group 4 averaged 4.2 and Group

VALUES IN MICROECONOMIC DECISION-MAKING 104
5 averaged 3.5. This does provides some evidence that the CSU groups, especially Group
5 had more similar values systems prior to the experiment than MSC students did.
Another factor is that students in the CSU classes only shared 5 random sets of
values, whereas 2 of 3 MSC classes shared 13 and 10. When the data was analyzed using
the number of sets of values shared, the “10+” group (n = 31) had a statistically
significant increase in the N2 Score, whereas the “5” group (n = 76) had no significant
changes. This data supports a possibility that the number and diversity of the values
shared might also make a difference in future decision-making; however, additional
research needs to be done to verify these potential correlations.
Relationships. Another factor the results lead us to consider is the potential role
of relationships. Much of the literature reviewed on the values ether (Bell, 2011b),
behavioral economics/finance (Ariely, 2008; Sen 1977; 1994; Thaler 1988; Thaler &
Sunstein, 2009) value development (Schwartz, 1992; Kohlberg, 1973; Babeau, et al,
1999), social learning theory (Bandura, 1977), and sensemaking in organizations (Weick,
1995; Weick et al., 2005) suggest relationships have an impact on values in decision-
making. It is possible to infer from the distinct differences in the groups that there may be
some different levels of relationships between the CSU and MSC students. According to
the Colorado State University Profile (2013), students at CSU come from every state in
the country with 80% being Colorado residents. The campus and community are large
both in geographic and population terms and students are primarily of traditional college
age (24 and under). By contrast, MSC students are primarily local with 96% of the
student population coming from Alaska and 44% graduating from high schools in one the
MSC local area communities. The campus and the student population are small as is the

VALUES IN MICROECONOMIC DECISION-MAKING 105
number of full-time faculty (29). Only 57% of MSC students are of traditional age and
43% are non-traditional (University of Alaska Planning and Institutional Research, 2011).
The differences between the two campuses make it likely that MSC students may
have stronger and longer relationships with each other and faculty and staff than CSU
students do. These relationships may extend beyond the campus and into the local
community. Many of the MSC students have known each other even before attending the
university and the small campus size allows them to get to know a greater percentage of
the other students, faculty and staff. Smaller class sizes also allow students to form
relationships and get to know the perspectives of other students through class discussions.
The size of the individual groups might also be a factor in this research as it relates to
relationship building. The MSC students are not only more likely to come from the same
small community, but are also generally older so they may have known each other for a
longer period of time. For students reporting their length of time with their cohort, the
majority of MSC students (78.7%) report being part of their cohort for 2 years or less,
whereas the majority of CSU students (63%) report a 3 or more year relationship with
their cohort. If relationships were a factor, it does not appear that the shorter length of
time in the MSC cohort impacted their relationships in a negative way indicating that
perhaps other factors strengthen relationships of university students.
The issue of relationships also ties back to the discussion of gender. As the
majority of participants at MSC were female—and were the group primarily responsible
for the N2 Score increase—we need to consider the combination of gender and
relationships as a possible explanation for the differences in scores between MSC and
CSU students. In a previous section I discussed how women might be more sensitive to
VALUES IN MICROECONOMIC DECISION-MAKING 106
values and ethics in decision-making and have stronger intent to behave ethically. They
are also more likely to analyze their decision-making relative to others, engage in social
learning, and be concerned with harmonious relationships. By reframing the discussion of
decision-making in a value context and by and reflecting on and sharing values, it is
possible that females in small groups within which they have strong relationships might
have been more likely to move toward more shared ethical decision-making than women
who are in groups that do not have strong relationships or are in some way moderated by
an equal male presence.
Utilizer Scores
Another data point that is significant to this study is the utilizer score (U Score).
The U Score measures the degree of match between the action participants said they
would take in each of the scenarios and the decision considerations they rated as most
important. The test assumes certain decision considerations, when important to the
decision-maker, will lead to a specific action. For every data level with the exception of
the CSU group alone, the U Scores dropped by a statistically significant amount posttest.
One possible reason for this decrease might be a limitation of the test itself. This
score is essentially designed to test the ability of participants to rationally analyze
available factors and match them to decision-making. The test assumes rationality and
access to all information, as the scope of available information is provided in the scenario
and given decision considerations. It does not assume that participants are brining other
factors—like values—to the decision-making process. Students taking a posttest after a
course in ethics might be likely to see an increase in the U Score because it is this rational
process of ethical decision-making that those courses attempt to teach. However, by

VALUES IN MICROECONOMIC DECISION-MAKING 107
reframing the decision-making process in a values perspective, the experiment may have
brought the value portion of the decision-making process to the forefront impacting the
rational decision-making process. Students may have selected answers and decision
considerations that were consistent with their values and these may have conflicted with
what is consistent with rational decision-making. While outside the scope of this paper,
qualitative analysis of the value sets and decision sets might provide some insights into
the level of “values fit” versus “rational fit” of the participant’s responses. It is also
important to note that the scores dropped the most for the “10+” shared value sets
indicating that perhaps the more values perspectives shared, the more prominent values
become as a decision consideration. This might also explain the lack of significant
change at CSU. Kahneman (2011) would refer to this as values “priming”. The more you
are primed to think of values the more you will use values factors rather than “rational”
factors in matching decisions to decision considerations.
It is also possible that by framing the decision-making process in value terms that
the opportunity set—the set of alternative actions an individual can take to solve a
problem—changed for the individuals. Sen (1994) believes that when the opportunity set
is influenced by ethics, social behavior, epistemology, or other non-rational choice
influences these factors narrow the opportunity set. He refers to this process as menu
dependency; meaning when non-rational factors are added to the decision the menu of
choices becomes smaller than the opportunity set. There may have been some decision
considerations that while they were consistent with the action the individual believed he
or she would take, may not have been consistent with their values. Or, they may have
selected an action based on their values that was inconsistent with the rational decision-

VALUES IN MICROECONOMIC DECISION-MAKING 108
making process they went through when selecting important decision considerations. It is
also important to note, that while their decision-making process became more quasi-
rational, no group made decisions that were significantly less ethical than they did when
they were using a more rational process. The MSC group actually significantly improved
their scores bringing them up to approximately the same level at CSU students.
Research Conclusions
Asking participants to reflect on and share the values they associate with decision
considerations produced some significant results. MSC students demonstrated a
statistically significant increase in their ethical decision-making ability, while all groups
changed the way they used information to make ethical decisions.
Much of the literature reviewed suggests that relationships are an important factor
when values are formed and utilized in decision-making. This research provides some
support for that assertion at least within the context of women within small groups with
relatively strong relationships in a community. Sharing a greater portion of the groups
values might also impact improved ethical decision-making, however, more research is
needed to determine if this factor also relates to gender, group size, and relationships.
Group “sameness” may be a factor in maintaining a similar level of ethical
decision-making even after a values context is introduced. This is because groups that are
already very much the same, at least in terms of cognitive development and deciding to
attend the same school, may already have similar values structures that will reinforce one
another rather than challenge values. More cognitive and value diversity might cause
others to be influenced by shared values in a group as demonstrated by the significant

VALUES IN MICROECONOMIC DECISION-MAKING 109
improvements in ethical decision-making at MSC. This is important, because the MSC
group may be more closely representative of the general population than the CSU group.
The increase in ethical decision-making by the MSC group suggests some
interesting correlations between group size, group diversity, gender, and relationships in
decision-making. However, the most significant result of this research is the Utilizer
Score results. One goal of this research was to determine what the role of values is in
decision-making. The models of economic decision-making assume a dichotomy between
facts and values in decision-making with individuals always making decisions using
rational factors. The Utilizer Score results indicate that values do play a role in how we
make decisions. By framing decision-making in a values context and priming for values,
values considerations were brought to the forefront and the decision-makers became
more quasi-rational in their approach. Yet, in no way did it make participants worse
decision-makers—at least in the ethical context measured here. In fact, some individuals
and groups became significantly better ethical decision-makers even using an instrument
that relies on rational decision-making as the assumption. The utilization of values in
decision-making might make us more quasi-rational in our approach, but does not
necessarily make us worse decision-makers. In other words, a quasi-rational approach to
the decision-making process does not lead us to make less rational decisions. In this case,
values changed what individuals believed were important issues to consider in the
decision-making process, but did not lead them to less ethical decisions. Introducing
conscious values to the process can interrupt unconscious values schemas. As this
research is exploratory in nature, additional research will need to be done to further
isolate all the potential factors discussed here to determine their impact on economic

VALUES IN MICROECONOMIC DECISION-MAKING 110
decision-making. The purpose of this research is to provide potential signals of direction
and hypotheses for future research.
It should be noted that values were not utilized alone, but along with the facts
given in the scenario. These results do not tell us what would happen if we asked
participants to use values alone in their decision-making. However, the combined use of
facts and values in decision-making is consistent with and supports the values inclusive
models of decision-making discussed in the literature (Bell, 2011b; Etzioni, 1988; Huei-
Chun, 2010; Subramaniam, 1963; Sen, 1994; 2004).
Limitations
One of the greatest threats to multiple group tests is the selection threat or
selection bias as this was a convenience sample, specifically the primary internal validity
issue, which is the degree to which the groups are comparable before the study. This
issue has been addressed in the results section and having groups from one university that
may have been more comparable before the study than the groups at the second
university proved to be an asset to the study. The short duration of the experiment did
minimize history, maturation, and mortality threats.
Using validated and identical instruments administered by the same researcher
across groups minimized one instrumentation threat. However, the instrument itself was
both a limitation and an asset, as it was not designed for the type of intervention utilized
here.
As with any research, Type I (false positive) and Type II (false negative) errors
were a threat. The researched attempted to minimize these threats by repeating the
experiment 5 times. As this research is exploratory, repeating the experiment in the future

VALUES IN MICROECONOMIC DECISION-MAKING 111
to gather additional data would help further minimize these threats and provide validity
for the results discussed here.
One potential limitation to any study is that it may not be representative of the
general population. Using business students that are too similar might lead to concerns
about generalizability; however, there were a diverse group of majors in the classes. In
addition to business administration majors including human resources, entrepreneurship,
finance, economics, hospitality management, accounting, and marketing majors there
were computer science, mechanical engineering, nursing, logistics and supply chain
management, human services, music, dental hygiene, computer networking technology,
interior design and equine science majors represented in the classes. By including an
“open enrollment” campus in the experiments this does help with generalizability, as
these students are quite diverse. As a result, these findings should be generalizable to a
broader population. This study was done in classrooms on university campuses, which
leaves the potential for noise and other distractions that could impact participants.
Another limitation is that the study asked participants to describe a single value
that represented the personal values of a decision-maker who believed a particular
decision consideration was important. It does not include multiple values that might be
the optimal description. The study is also limited to the role of values in ethical decision-
making, whereas values may have a role in other aspects of decision-making.
The time required to complete the experiment also proved to be a limitation.
While I had several campuses willing to participate, individual professors and department
heads were often unwilling to give up an entire class for the experiment. This
significantly reduced my participant options. While this was a convenience sample, it

VALUES IN MICROECONOMIC DECISION-MAKING 112
might have been preferable to have larger class sizes to more accurately analyze data for
statistical significance at the group level. However, the variety of class sizes did add
diversity and the ability to consider whether the size of the group might have impacted
group or school results.
Subject confidentiality is a potential ethical issue that was addressed by assigning
anonymous participant numbers to each participant. All results were stored in a secured
file cabinet and computer to ensure confidentiality and integrity of the data. In addition,
the study and use of student participants was reviewed and approved by the George Fox
University Human Subjects Committee. A copy of the approval is available in Appendix
H.
Implications for Organizations and Leaders
The literature reviewed for this study suggests, and nearly all the participants in
these experiments have stated, that they consider their personal values when making
work decisions (Brown & Trevino, 2006; Finegan, 2000; Gamble & Gibson, 1999; Jiang,
Lin, & Lin, 2010; Keltner, Langner, & Allison, 2006; Meglino, Ravlin, & Adkins, 1989;
Palmer, 2000; ; Suar & Khuntia, 2010; ). Bringing values to the conscious level can
interrupt unconscious values schemas providing support for the influence of group,
societal, environmental, and organizational values in microeconomic decision-making
creating implications for organizations and leaders. There is also evidence to suggest that
by adding a values framework to decision-making, employees may make better decisions
or, if they already share similar values, they will maintain their current level of decision-
making at least from an ethical perspective.

VALUES IN MICROECONOMIC DECISION-MAKING 113
As this experiment was limited to ethical decision-making and values, what can
organizations and leaders learn from this research? As individual’s report bringing their
personal values to work, how can leaders in organizations encourage ethical decision-
making in groups?
One important application for leaders to learn from this research is that hiring
cognitively diverse employees can help eliminate “groupthink” by challenging the ideas
and perceptions of others from a values context. Often pre-employment tests are designed
to measure the rational or “process” thinking of individuals with hiring preferences being
given to those individuals who perform highly on these tests. In our research groups, SAT
scores were a major factor in creating the CSU group indicating relative cognitive
sameness, but also indications of groupthink as adding a values framework did not
challenge their decision-making because their decision-making processes may have
already been similar. This study indicates diverse, even quasi-rational approaches to
decision-making can result in more rational and ethical decision-making. Leaders should
look for individuals with diverse values, perceptions, and decision-making processes in
order to improve organizational decision-making and minimize groupthink.
The results of this research are consistent with sensemaking literature that
suggests placing stimuli into some kind of framework allows employees to better
comprehend problems and solutions so they may take appropriate actions. In this case we
framed and “primed” the stimuli within a values framework that helped some groups
improve their ethical decision-making. Organizations can do the same by developing
values statements and then challenging employees to consider company and personal
values in their decision-making. Ancona (2012) states that sensemaking “involves

VALUES IN MICROECONOMIC DECISION-MAKING 114
coming up with plausible understandings and meanings; testing them with others and via,
action; and then refining our understandings or abandoning them in favor of new ones
that better explain a shifting reality” (p. 5). Organizational leaders might encourage
employees to consider and share values associated with decisions to help them either
make better ethical decisions or gain a greater level of commitment to ethical decisions
when they are made. This form of “sensegiving” that focuses on finding opportunities to
describe ethical decision-making in a way that appeals to the values of employees, can
help organizations reach strategic ethics goals (Bartunek, Krim, Necochea, &
Humphries,1999). When personal values and organizational values are brought closer
together there is greater organizational commitment that leads to less absenteeism and
turnover and improved job satisfaction, organizational citizenship, and job performance
(Finegan, 2000).
By framing decision-making in a values context, leaders in organizations may
also be able to promote congruency with the values of the organization helping front-line
employees understand how their personal values and actions can support the mission of
the organization. Sensemaking theory supports this strategy as interacting with others in a
values framework allows mental models to be tested and modified (Ancona, 2012) as we
saw in the experiment’s ability to interrupt both unconscious values schemas and
decision-making processes.
As discussed in the literature review, leaders who articulate their values and
model ethical behavior can reduce unethical behavior and interpersonal conflicts (Mayer
et al., 2012), make ethical behaviors by subordinates a habit (Almeida, 2011), and
positively impact the personal values of employees (Weiss, 1978). Having employees

VALUES IN MICROECONOMIC DECISION-MAKING 115
working from a common “map”—in this case using values as a guide—it is easier to
coordinate consistent ethical actions across departments (Ancona, 2012).
Implications for Academicians
The study of economic decision-making has focused on removing value
judgments from the discussion of economic decision-making in favor of the rational
choice tautology. The emphasis on rational, mechanical-mathematical models was
designed to remove the “softer” social science aspects of economic thought in order to
bring the discipline closer to the hard sciences (Binmore, 2007; Nelson, 2003; Punam,
2002). Yet economic decision-making is much more complex and, as this research has
demonstrated, may be influenced by both internal and external “non-rational” factors that
disrupt the assumption of the rational actor at least in the decision-making process. If
values are included in economic decision-making, academicians will need to find ways to
build layers on top of rational mechanical-mathematical models to capture these
influences. By attempting to remove values from the decision-making process we are
essentially disconnecting individuals from their decisions, yet individual actors can
influence those around them.
The most significant implication for academicians is the need to differentiate
between the rationality of the decision-making process and rational decisions. The study
indicates the decision-making process can be less rational than traditional economic
models require, yet lead to equally or better rational decisions. Traditional rational
models require consideration of marginal cost/marginal benefit “facts” exclusively,
however, assigning personal values to the decision considerations in this study caused the
decision-making process to appear less rational, but often improved the rationality of
VALUES IN MICROECONOMIC DECISION-MAKING 116
decisions. This appears to be especially true when a cognitively diverse group exists, as
we would expect in the general population. In diverse populations consciously adding
and recognizing values considerations in the economic decision-making process may lead
to better consensus as this research found reflecting on and sharing values moved the
groups toward more equally rational decisions in the ethical context tested here. The
literature reviewed here suggests this value inclusive process may be more consistent
with how most individuals actually make decisions in groups.
Recommendations for Future Research
This exploratory research provides evidence that gender, group size, and
relationships may impact how individuals use values in their decision-making in groups
when those values are shared. There is also evidence to support that even if the decision-
making process becomes more quasi-rational as a result of adding values to decision
considerations, this process still results in the same or better decisions. This study was
limited to an instrument that tests values schemas in ethical decision-making. Additional
research could be done using other instruments to determine if the same factors impact
other decisions. Experiments using the DIT2 that look specifically at group diversity,
gender, group size, and relationships would also be useful in validating the results of this
study as well as how the factors interact. For example, the research suggests females in
small groups with close relationships might be influenced by the values of a group more
so than when only one of the factors exists. The next step is to measure the interactions of
these factors to determine their weights and influence. Also, while the study indicates an
ability to disrupt values schemas in the very short-run, additional research needs to be
done to determine whether there is a longer-term impact to the values schema disruption.

VALUES IN MICROECONOMIC DECISION-MAKING 117
A qualitative approach that looks for changes in decision sets based on the values
of individuals and the values set shared with the group would also provide additional
insights into how shared values impact future decisions. Do participants move toward
decision considerations that others assigned positive values to? Were they likely to give
less weight to a decision consideration that most felt demonstrated the lack of a positive
value?
As this was a quasi-experimental laboratory design, additional field studies using
a Natualistic Decision Making model (Lipshitz et al., 2001) to determine how individuals
respond to reframing decision-making in a values framework in organizational settings as
there is a risk that recognition priming could have led participants to match decision
considerations with values, but not the action participants would actually take.
Conclusion
The broad purpose of this research was to explore the role of values in economic
decision-making as presented by Bell’s (2011b) model of values inclusive economic
decision-making. To accomplish this a more narrow purpose was established to explore
the role reflecting on and sharing values plays in our individual decision-making schemas
in groups. Specifically to answer the question: Can introducing values consciously into
decision considerations disrupt existing unconscious values schemas?
To accomplish this goal a quasi-experimental pretest/posttest design was
developed using the Defining Issues 2 Test (DIT2). The DIT2 measures the unconscious
values schemas individuals use in their decision-making that determine their level of
ethical decision-making. Participants were not told the instrument measured ethical
decision-making, only that it was designed to measure how they make decisions.

VALUES IN MICROECONOMIC DECISION-MAKING 118
Participants were given the DIT2 as a pretest and then asked to assign the values
they associated with each of the decision considerations in the first scenario. Depending
on the group, either all or random samples of 5 or 10 of the values assigned were
anonymously shared with the group. It is important to note that they were not discussed,
only shared and that this brief activity was the first time a values frame was introduced to
the decision-making process. Participants were then given the DIT2 as a posttest. The
entire process took between 1 ¼ and 1 ½ hours. Prior to running the experiments, the
instrument and process were piloted with a class at MSC.
The study found several significant results. First, reframing decision-making in a
values context made the decision process more quasi-rational for participants as a whole,
yet led to consistent or improved decisions in the ethical context tested here. Decisions
remained consistent in the CSU group where the group may have had more “sameness”
going into the experiment. This suggests that sharing values reinforced, rather than
challenged existing values schemas.
The MSC group both significantly improved Postconventional ethical decision-
making and moved away from lower level (personal interest) decision considerations.
This is significant because rational, mechanical-mathematical economic models are based
on an assumption of “self-interest”, while the study demonstrated the consideration of
values in addition to facts moved individual and group decision-making farther away
from pure self-interest in this instance This is consistent with both Bell’s (2011) and
Sen’s (1994; 2004) ideas of more holistic factors beyond self-interest in economic
decision considerations. There is evidence to suggest group diversity, gender, group size,
and relationships may have impacted the use of values and were factors in the

VALUES IN MICROECONOMIC DECISION-MAKING 119
improvements at MSC as well, but additional research is need to add validity to these
results. The results also reflect a short-term interruption of values schemas and additional
research is needed to determine any long-term impacts. However, Bell’s model suggests
schemas are constantly changing so any measure at a point in time may yield different
results based on the influences at the time.
These results have implications for academicians. It suggests a need to add layers
on top of rational, mechanical-mathematical models to include values in descriptive and
predictive economic models. For Bell’s (2011b) theory of value-inclusive economic
decision-making it has meant adding additional factors including the external
environment, values schemas, and social learning to provide a more complete picture of
how values are developed, utilized in decision-making, and influenced/modified. It also
means distinguishing between the rationality of the decision-making process and rational
decisions as the results indicate a more quasi-rational process can still lead to more
rational decisions.
For businesses and managers, the study provides insight into how employees
might use personal values to make sense of information and situations and make
decisions at work. Bringing values to the conscious level can interrupt unconscious
values schemas providing support for the influence of group, societal, environmental, and
organizational values in microeconomic decision-making creating implications for
organizations and leaders. By framing decision-making in a values context, leaders in
organizations may also be able to promote congruency with the values of the organization
helping front-line employees understand how their personal values and actions can
support the mission of the organization. Sensemaking theory supports this strategy as

VALUES IN MICROECONOMIC DECISION-MAKING 120
interacting with others in a values framework allows mental models to be tested and
modified (Ancona, 2012) as we saw in the experiment’s ability to interrupt both
unconscious values schemas and decision-making processes.
VALUES IN MICROECONOMIC DECISION-MAKING 121
References
Almeida, F. (2011). Vicarious learning and institutional economics. Journal of Economic
Issues, XLV(4), 839-855. doi: 10.2753/JEI0021-3624450405
Ameen, E. C., Guffey, D. M., & McMillian, J. J. (1996). Gender differences in
determining the ethical sensitivity of future accounting professionals. Journal of
Business Ethics, 15(5), 591-597.
Ancona, D. (2012). Sensemaking: Framing and acting in the unknown. In S. Snook, N.
Nohria, & R. Khurana (Eds.), The handbook for teaching leadership: Knowing,
doing, and being (pp. 3-19). Thousand Oaks, CA: Sage Publications.
Angner, E., & Loewenstein, G. (2007). Behavioral economics. Social Science Research
Network Working Paper. Retrieved from
http://papers.ssrn.com/sol3/papers.cfm?abstract_id=957148
Ariely, D. (2008). Predictably Irrational. New York: HarperCollins.
Bandura, A. (1977). Social Learning Theory. Englewood Cliffs, NJ; Prentice-Hall.
Bandura, A. (2007). Albert Bandura. In A History of Psychology in Autobiography, Vol.
IX. (pp. 43-75). G. Lindzey, & W. M. Runyan (Eds.). Washington, D. C.:
American Psychological Association.
Bartunek, J. M., Krim, R. M., Necochea, R., & Humphries, M. (1999). Sensemaking,
sensegiving, and leadership in strategic organizational development. Advances in
Qualitative Organizational Research, 2, 37-71.
Beach, L. R. (1990). Image Theory: Decision Making in Personal and Organizational
Contexts. London: Wiley.

VALUES IN MICROECONOMIC DECISION-MAKING 122
Bebeau, M. J., Narvaez, D., Rest, J., & Thoma, S. J. (1999). Postconventional Moral
Thinking: A Neo-Kohlbergian Approach. Mahwah, NJ: Lawrence Erlbaum
Associates. Retrieved from
http://www.questia.com/library/book/postconventional-moral-thinking-a-neo-
kohlbergian-approach-by-muriel-j-bebeau-darcia-narvaez-james-rest-stephen-j-
thoma.jsp
Bebeau, M. J., & Thoma, S. J. (2003). Guide for DIT-2.
Becker, D. A., & Ulstad, I. (2007) Gender differences in student ethics: Are females
really more ethical? Plagiary: Cross-Disciplinary Studies in Plagiarism,
Fabrication, and Falsification, 71-91. Retrieved from
http://quod.lib.umich.edu/cgi/p/pod/dod-idx/gender-differences-in-student-ethics-
are-females-really-more.pdf?c=plag;idno=5240451.0002.009
Becker, G. S. (1968). Crime and punishment: An economic approach. Journal of
Political Economy, 76(2), 169-217.
Bell, H. A. (2011a). A Contemporary Framework for Emotions in Consumer Decision-
Making: Moving Beyond Traditional Models. Journal of Business and Social
Sciences, 2(17), 12-16.
Bell, H. A. (2011b). Toward a value inclusive model of economic decision-making: A
new science model. European Journal of Social Sciences, 21(4), 638-649.
Becker, D. A., & Ulstad, I. (2007). Gender differences in student ethics: Are females
really more ethical? Plagiary, 2007, 77-91.

VALUES IN MICROECONOMIC DECISION-MAKING 123
Bench-Capon, T. J. M. (2003). Persuasion in practical argument using value-based
argumentation frameworks. Journal of Logic and Computation, 13(3), 429-448.
doi: 10.1093/logcom/13.3.429
Binmore, K. (2007). Lionel Robbins: Ogre or prophet? London School of Economics and
Political Science Conference, London, UK.
Bozicnik, S., & Matjaz, M. (2009). From division to integration of natural and social
sciences by the “universal dialectical systems theory”. Cybernetics and Systems:
An International Journal, 40, 377-362.
Brown, M. E., & Treviño, L. K. (2006). Ethical leadership: A review and future
directions. The Leadership Quarterly, 17, 595-616.
Capra, F. (1983). The new physics. In The turning point: Science, society, and the rising
culture. New York: Bantam.
Carrera, P., & Oceja, L. (2007). Drawing mixed emotions: Sequential or simultaneous
experiences? Cognition and Emotion, (21)2, 422-441.
Center for the Study of Ethical Development. (2012) Instruments, Service, and Materials.
Retrieved from www.centerforthestudyofethicaldevelopment.net/Instruments,
Services, and Materials.htm
Cesur, S., & Topcu, M. S. (2010. A reliability and validity study of the defining issues
test: The relationship of age, education, gender, and parental education with moral
development. Educational Sciences: Theory & Practice, 10(3), 1657-1696.
Churchman, C. W. (1961). Prediction and Optimal Decision: Philosophical Issues of a
Science of Values. Englewood Cliffs, N. J.: Prentice-Hall.
VALUES IN MICROECONOMIC DECISION-MAKING 124
Cohen, J. (1992). Quantitative methods in psychology: A power primer. Psychological
Bulletin, 112(1), 155-159.
Colander, D. (1992). The lost art of economics. The Journal of Economic Perspectives,
6(3), 191-198.
Colander, D. (2001). The Lost Art of Economics: Essays on Economics and the
Economics Profession. Cheltenham, UK: Edward Elgar Publishing.
Colorado State University Profile. (2013). Retrieved from
http://www.ir.colostate.edu/pdf/profile/profile_12.pdf
Connor, P. E., & Becker, B. W. (1975). Values and organization: Suggestions for
research. The Academy of Management Journal, 18(3), 550-561.
Courtney, J. F. (2001). Decision making and knowledge management in inquiring
organizations: Toward a new decision-making paradigm for DSS. Decision Support
Systems, 31, 17-38.
Dayan, P. (2008). The role of value systems in decision making. In C. Engel, & W.
Singer (Eds.). Better Than Conscious? Decision Making, the Human Mind, and
Implications For Institutions. Cambridge, MA: MIT Press.
Einstein, A. (May, 1920). Ether and the theory of reality. Address delivered in the
University of Leyden, Netherlands. Retrieved from http://www.tu-
harburg.de/rzt/rzt/it/Ether.html
England, G. W. (1967). Personal value systems of American managers. The Academy of
Management Journal, 10(1), 53-68.
Etzioni, A. (1988). Normative-affective factors: Toward a new decision-making model.
Journal of Economic Psychology, 9, 125-150.

VALUES IN MICROECONOMIC DECISION-MAKING 125
Fehr, E., & Rangel, A. (2011). Neuroeconomic foundations of economic choice—recent
advances. Journal of Economic Perspectives, 25(4), 3-30.
Finegan, J. E. (2000). The impact of person and organizational values on organizational
commitment. Journal of Organizational Psychology, 73, 149-169.
Foster, J. (2005). From simplistic to complex systems in economics. Cambridge Journal
of Economics, 29(6), 873-892.
Frankena, W. K. (1963). Ethics. U.S.A.: Prentice-Hall, Inc.
Frankena, W. K. (1973). Ethics, (2nd
ed.). Retrieved from
http://www.ditext.com/frankena/ethics.html
Friedman, M. (1966?) The methodology of positive economics. In Essays In Positive
Economics. (pp. 3-16, 30-43) Chicago: University of Chicago Press. Retrieved from
https://docs.google.com/viewer?a=v&q=cache:VrNxEIVkgQIJ:www.ppge.ufrgs.br/
GIACOMO/arquivos/eco02036/friedman-
1966.pdf+&hl=en&gl=us&pid=bl&srcid=ADGEEShbM1bR4GA_l9lDlfqxV432Gnj
vsD-7PCZd_o3AQ97so6iPOJUbvrF4sw-vKBnRVFVAY686FbauO-
3m3pLKBNygfs4aF3Gojh7mPko_pnlyGz4TQnZQefA6YmpBgKDDvpOz1Twq&si
g=AHIEtbSQ9eXn_6xu6IhVWcGtZUaFdj3skQ
Gamble, P. R., Gibson, D. A. (1999). Executive values and decision making: The
relationship of culture and information flows. Journal of Management Studies,
36(2), 217-240.
Ganley, W. T. (1995). Institutional economics and neoclassicism in the early twentieth
century: The role of physics. Journal of Economic Issues (Association for
Evolutionary Economics), 29(2), 397.

VALUES IN MICROECONOMIC DECISION-MAKING 126
George Fox University. Adult Degree Program: Cohort Model. Retrieved from
http://www.georgefox.edu/education/become-a-teacher/bachelors-
degree/elementary/degree-completion/index.html
Gigerenzer, G. (2001). Decision making: Nonrational theories. In International
Encyclopedia of the Social and Behavioral Sciences, 5, 3304-3309.
Goel, L., Johnson, N., Junglas, I., & Ives, B. (2010). Situated learning: Conceptualization
and Measurement. Decision Sciences Journal of Innovative Education, 8(1), 215-
240.
Groenewegen, P. (2003). Chapter 17: Adam Smith and Alfred Marshall. In Classic and
moderns in economics volume II: Essays on nineteenth-and twentieth-century
economics thought (pp. 15-28). London: Routledge.
Hall, D., Guo, Y., & Davis, R. A. (2002). Developing a value-based decision-making
model for inquiring organizations. Proceedings of the 36th
Hawaii International
Conference on System Sciences. Hilton Waikoloa Village, Island of Hawaii: The
Computer Society.
Hawking, S. (2001). The universe in a nutshell. New York: Bantam Books.
He, J., & Deem, M. W. (2010). Structure and response in the world trade network.
Unpublished manuscript.
Hofstede, G. (2001). Culture’s consequences: Comparing values,behaviors, iInstitutions,
and organizations across nations. Thousand Oaks, California: Sage
Publications.

VALUES IN MICROECONOMIC DECISION-MAKING 127
Jiang, D. Y., Lin, Y. C., & Lin, L. C. (2010). Business moral values of supervisors and
subordinates and their effect on employee effectiveness. Journal of Business
Ethics, 100, 239-252. doi: 10.1007/s10551-010-0678-8
Kaushal, S. L., & Janjhua, Y. (2011). An empirical study on relationship between
personal values and performance values. Himachal Pradesh University Journal,
July, 1-8.
Kahneman, D. (2003). A perspective on judgment and choice: Mapping bounded
rationality. American Psychologist, 58(9), 697-720. doi: 10.1037/0003-
066X.58.9.697
Kahneman, D. (2011). Thinking, Fast and Slow. New York: Farrar, Straus, and Giroux.
Kahneman, D., & Tversky, A. (1979). Prospect theory: An analysis of decision under
risk, Econometrica, XLVII, 263-291. Retrieved from
http://www.princeton.edu/~kahneman/docs/Publications/prospect_theory.pdf
Kahneman, D., & Tversky, A. (1982). The psychology of preferences. Scientific
Amierican, 246, 160-173.
Keltner, D., Langner, C. A., & Allison, J. L. (2006). Power and moral leadership. In D. L.
Rohde (Ed.), Moral leadership: The theory and practice of power, judgment, and
policy (pp. 177-194). San Francisco: Jossey-Bass.
Keynes, J. M. (1936). The General Theory of Employment Interest and Money. New
York: Harcourt, Brace and Company.
Keynes, J. N. (1917). The Scope and Method of Political Economy. London: Macmillan.
Retrieved from http://archive.org/details/scopemethodofpol00keynuoft

VALUES IN MICROECONOMIC DECISION-MAKING 128
Kohlberg, L. (1973). The claim to moral adequacy of a highest stage of moral judgment.
The Journal of Philosophy, 70(18), 630-646.
Kotler, P., Kartajaya, H., & Setiawan, I. (2010). Marketing 3.0: From products to
customers to the human spirit. Hoboken, New Jersey: John Wiley & Sons.
Kytle, J. (1978). Book review: Social Learning Theory by Albert Bandura.
Comtemporary Sociology, 7(1), pp. 84-85.
Lam, S. K., Kraus, F., & Ahearne, M. (2010). The diffusion of market orientation
throughout the organization: A social learning theory perspective. Journal of
Marketing, 74, 61-79.
Lan, G., Gowing, M., McMahon, S., Rieger, F., King, N. (2008). A study of the
relationship between personal values and moral reasoning of undergraduate
business students. Journal of Business Ethics, 78, 121-139.
Latane, B., & Darley, J. M. (1970). The Unresponsive Bystander: Why Doesn’t He Help?
New York: Appleton Century Crofts.
Lerner, R. M. (1990). Weaving development into the fabric of personality and social
psychology: On the significance of Bandura’s ‘social foundations of thought and
action’. Psychological Inquiry, 1(1), pp. 92-96.
Lies, J. M., Bock, T., Brandenberger, J., Trozzolo, T. A. (2012). The effects of off-
campus service learning on the moral reasoning of college students. Journal of
Moral Education, 41(2), 189-199.
Lipshitz, R., Klein, G., Orasanu, J., & Salas, E. (2001). Focus article: Taking stock of
naturalistic decision making. Journal of Behavioral Decision Making, 14, 331-
352. doi: 10.1002/bdm.381.

VALUES IN MICROECONOMIC DECISION-MAKING 129
Marshall, A. (1920). Principles of economics (8th ed.). London: Macmillian and
Company, Ltd. Retrieved from
http://www.econlib.org/library/Marshall/marP57.html (Original work published
1890)
Mayer, D. M., Aquino, K., Greenbaum, R. L., Kuenzi, M. (2012). Who displays ethical
leadership, and why does it matter? An examination of antecedents and
consequences of ethical leadership. Academy of Management Journal, 55(1), 151-
171.
Meglino, B. M., Ravlin, E. C., Adkins, C. L. (1989). A work values approach to
corporate culture: A field test of the value congruence process and its relationship
to individual outcomes. Journal of Applied Psychology, 74(3), 424-432.
Merriam-Webster (Ed.). (2008). Merriam-Webster’s Collegiate Dictionary (11th
ed.).
[online version]. Retrieved from http://www.merriam-webster.com
Merriam-Webster (Ed.) (2010). The Merriam-Webster’s Collegiate Thesaurus (2nd
ed.)
[online version]. Retrieved from http://www.merriam-webster.com
McLean, B., & Elkind, P. (2004). The Smartest Guys in the Room: The Amazing Rise and
Scandalous Fall of Enron. New York: Portfolio.
Mikhalevskii, B. N. (1971). Mechanical-organic economic models and models of an open
multistage dynamic system. Ekonomika I Matematicheskie, 1, 3-32.
Mill, J. S. (1963). The Collected Works of John Stuart Mill, in 33 vols. J. M. Robson,
(Ed.). Toronto: University of Toronto Press. Retrieved from
http://oll.libertyfund.org/index.php?option=com_staticxt&staticfile=show.php%3
Ftitle=165&Itemid=28
VALUES IN MICROECONOMIC DECISION-MAKING 130
Miller, N. E., & Dollard, J. (1941). Social learning and imitation. New Haven, CT: Yale
University Press.
Narvaez, D. (2005). The Neo-Kohlbergian Tradition and Beyond: Schemas, Expertise
and Character. In C. Pope-Edwards & G. Carlo (Eds.), Nebraska Symposium on
Motivation, Vol. 51: Moral Motivation Through the Lifespan. Lincoln, NE:
University of Nebraska Press.
Nelson, J. A. (2003). Clocks, creation, and clarity: Insights on ethics and economics from
a feminist perspective. (Global Development and Environment Institute
Working Paper No. 03- 11). Medford, Massachusetts: Tufts University.
Pagano, V., & DeBono, K. G. (2011). The effects of mood on moral judgment: The role
of self-monitoring. Journal of Applied Social Psychology, 41(12), 2928-2942.
Palmer, P. J. (2000). Let Your Life Speak: Listening for the Voice of Vocation. San
Francisco, CA: Jossey-Bass.
Peter, J.P., & Olson, J.C. (2010). Consumer behavior & marketing strategy, (9th
ed.) New
York: McGraw-Hill Irwin.
Philosophy of Economics. (1998). In Routledge encyclopedia of the philosophy of
science. New York: Routledge.
Piaget, J. (1932/1997). The Moral Judgment of the Child. Glencoe, IL: The Free Press.
Retrieved from
http://archive.org/stream/moraljudgmentoft005613mbp#page/n5/mode/2up
Pieters, R. G. M., & von Raaij, W. F. (1987). The role of affect in economic behavior. In:
W. F. von Raaaij, G. M. van Veldhoven, & K. E. Warneryd (Eds.). Handbook of
economic psychology. Amsterdam: North-Holland

VALUES IN MICROECONOMIC DECISION-MAKING 131
Posavac, S. S., Kardes, F. R., Brakus, J. J. (2010). Focus induced tunnel vision in
managerial judgment and decision making: The peril and the antidote.
Organizational Behavior and Human Decision Processes, 113, 102-111.
Pressman, S. (2005). The two dogmas of neoclassical economics. Science and Society,
68, 483-493.
Putnam, H. (2002). The collapse of the fact/value dichotomy and other essays.
Cambridge, Massachesetts: Harvard University Press.
Ramanathan, S. & Shiv, B. (2001). Getting to the heart of the consumer: The role of
emotions and cognition (or the lack thereof) in consumer decision making.
Advances in Consumer Research, (28), 49-50.
Rawls, J. (1971). A Theory of Justice. Cambridge, MA: Harvard University Press.
Retrieved from
http://books.google.com/books?id=vcVEPc30ut0C&printsec=frontcover&source
=gbs_ge_summary_r&cad=0#v=onepage&q&f=false
Rest, J. R. (1973). The hierarchical nature of moral judgment: A study of patterns of
comprehension and preference of moral stages. Journal of Personality, 41(1), 86-
109.
Rest, J. R. (1979). Development in Judging Moral Issues. Minneapolis, MN: University
of Minnesota Press.
Rest, J., Narvaez, D., Bebeau, M., & Thoma, S. (1999). A neo-Kohlbergian approach:
The DIT and schema theory. Educational Psychology Review, 11(4), 291-324.

VALUES IN MICROECONOMIC DECISION-MAKING 132
Rest, J. R., Narvaez, D., Thoma, S. J., Bebeau, M. J. (2000). A neo-Kohlbergian
approach to morality research. Journal of Moral Education, 29(4), 381-395. doi:
10.1080/03057240020015001
Rokeach, M. (1968) Beliefs, Attitudes, and Values. San Francisco: Jossey-Bass.
Ros, M., Schwartz, S. H., & Surkiss, S. (1999). Basic individual values, work values, and
the meaning of work. Applied Psychology: An International Review, 48(1), 49-
71.
Samuelson, P. A. (1965). Professor samuelson on theory and realism: Reply. American
Economic Review, 55(5), 1164. Retrieved from
http://search.ebscohost.com.proxy.consortiumlibrary.org/login.aspx?direct=true&db
=buh&AN=4503506&site=ehost-live
Schmalensee, R. (1991). Continuity and change in the economics industry. Economic
Journal, 101(404), 115-121.
Schwartz, S. H. (1970). Elicitation of moral obligation and self-sacrificing behavior: An
experimental study of volunteering to be a bone marrow donor. Journal of
Personality and Social Psychology, 15, 283-293.
Schwartz, S. H. (1992). Universals in the content and structure of values: Theory and
empirical tests in 20 countries. In M. Zanna (Ed.), Advances in experimental social
psychology (Vol. 25) (pp. 1–65). New York: Academic Press.
Sen, A. K. (1977). Rational fools: A critique of the behavioral foundations of economic
theory. Journal of Philosophy and Public Affairs, 6(4), 317-344.
Sen, A. (1994). The formulation of rational choice. Motivation and Monitoring, 84(2),
385-390.
VALUES IN MICROECONOMIC DECISION-MAKING 133
Sen, A. (2004). Social identity. Revue De Philosophie Economique, (9), 7-27.
Sen, A. (2005). Why exactly is commitment important for rationality? Economics and
Philosophy, 21, 5-13. doi: 10.1017/S0266267104000355
Simmons, R. G., Klein, S. D., & Simmons, R. L. (1977). Gift of life: The social and
psychological impact of organ transplantation. New York: Wiley. Retrieved from
http://books.google.com/books?id=eWVC8QpZFpoC&printsec=frontcover&source
=gbs_ge_summary_r&cad=0#v=onepage&q&f=false
Simola, S. (2003). Ethics of justice and care in corporate crisis management. Journal of
Business Ethics, 46, 351-361.
Simon, H. (1991). Bounded rationality and organizational learning. Organization
Science, 2(1), 125-134.
Sims, R. R., & Brinkman, J. (2002). Leaders as moral role models: The case of John
Gutfreund at Salomon Brothers. Journal of Business Ethics, 35, 327-339.
Smith, A. (1790). The theory of moral sentiments (6th ed.). London: A. Millar. Retrieved
from http://www.econlib.org/library/Smith/smMS.html (Original work published
1759)
Smith, A. (1904). In Cannan E. (Ed.), An inquiry into the nature and causes of the wealth
of nations (5th ed.). London: Methuen & Co., Ltd. Retrieved from
http://www.econlib.org/library/Smith/smWN.html# (Original work published 1776)
Stedham, Y., Yamamura, J. H., & Beekun, R. I. (2007). Gender differences in business
ethics: Justice and relativist perspectives. Business Ethics: A European Review,
16(2), 163-174.

VALUES IN MICROECONOMIC DECISION-MAKING 134
Su, H. (2010, May). Seeking the lost art for modern economics: Some historical
reflections on the distinction between positive and normative economics. Paper
presented at the 2010 UK History of Economic Thought Conference, London.
Suar, D., & Khuntia, R. (2010). Influence of personal values and value congruence on
unethical practices and work behavior. Journal of Business Ethics, 97, 443-460. doi:
10.1007/s10551-010-0517-y
Subramaniam, V. (1963). Fact and value in decision making. Public Administration
Review, 23(4), 232-237.
Taylor, S.A. (2009). Reconciling satisfaction, emotions, attitudes, and ambivalence
within consumer models of judgment and decision making: A cautionary tale.
Journal of Consumer Satisfaction, Dissatisfaction & Complaining Behavior, (21),
41-65.
Thaler, R. H. (1988). Anomalies: The ultimatum game. Journal of Economic
Perspectives, 2(4), 195-206.
Thaler, R. H., & Sunstein, C. R. (2009). Nudge: Improving Decisions About Health,
Wealth, and Happiness. New York: Penguin Books.
Texas Tech University. Defining Issues Test-2: Spring 2009. Retrieved from
www.depts.ttu.edu/provost/qep/docs/DIT_Spring2009.pdf
Theodorson, G.A., and Achilles G. T., (1969) A Modern Dictionary of Sociology, New
York: Thomas Y. Crowell Company, 456‐ 457.
Tideman, S. G. (2005). Towards a new paradigm for business and economics. Mind Over
Matter (Jan), n.p.
Togati, T. D. (2001). Keynes as the Einstein of economic theory. History of Political
VALUES IN MICROECONOMIC DECISION-MAKING 135
Economy, 33(1), 117-138.
University of Alaska Planning and Institutional Research. (2011). UA in Review.
Fairbanks, AK: University of Alaska Statewide.
U. S. Best colleges: Colorado State University (2013). U. S. News and World Report.
Retrieved from http://colleges.usnews.rankingsandreviews.com/best-
colleges/colorado-state-university-1350
Weick, K. E. (1995). Sensemaking in Organizations. Thousand Oaks, CA: Sage.
Retrieved from http://books.google.com/books?id=nz1RT-
xskeoC&printsec=frontcover&source=gbs_ge_summary_r&cad=0#v=onepage&q
&f=false
Weick, K. E., Sutcliffe, K. M., & Obstfeld, D. (2005). Organizing and the Process of
Sensemaking. Organization Science, 16(4), 409-421. doi:10.1287/orsc.1050.0133
Weiss, H. M. (1978). Social learning of work values in organizations. Journal of Applied
Psychology, 63(6), 711-718.
Wheatley, M. J. (2006). Leadership and the New Science: Discovering order in a chaotic
world. San Francisco, CA: Berrett-Koehler Publishers, Inc.
Wood, R., & Bandura, A. (1989). Social cognitive theory of organizational management.
The Academy of Management Review, 14(3), pp. 361-384.
Woodward, B. Davis, D. C., & Hodis, F. A. (2007). The relationship between ethical
decision making and ethical reasoning in information technology students.
Journal of Information Systems Education, 18(2), 193-202.
Yuengert, A. M. (2000). The positive-normative distinction before the fact-value
distinction. Association of Christian Economists Working Paper. Retrieved from

VALUES IN MICROECONOMIC DECISION-MAKING 136
http://www.gordon.edu/ace/ACEwpsList.html

VALUES IN MICROECONOMIC DECISION-MAKING 137
Appendix A
Defining Issues Test-2 and Demographic Questions
Pre-Test

VALUES IN MICROECONOMIC DECISION-MAKING 138
VALUES IN MICROECONOMIC DECISION-MAKING 139

VALUES IN MICROECONOMIC DECISION-MAKING 140

VALUES IN MICROECONOMIC DECISION-MAKING 141

VALUES IN MICROECONOMIC DECISION-MAKING 142

VALUES IN MICROECONOMIC DECISION-MAKING 143

VALUES IN MICROECONOMIC DECISION-MAKING 144

VALUES IN MICROECONOMIC DECISION-MAKING 145

VALUES IN MICROECONOMIC DECISION-MAKING 146

VALUES IN MICROECONOMIC DECISION-MAKING 147

VALUES IN MICROECONOMIC DECISION-MAKING 148

VALUES IN MICROECONOMIC DECISION-MAKING 149

VALUES IN MICROECONOMIC DECISION-MAKING 150

VALUES IN MICROECONOMIC DECISION-MAKING 151
Appendix B
Defining Issues Test-2
Post-Test

VALUES IN MICROECONOMIC DECISION-MAKING 152

VALUES IN MICROECONOMIC DECISION-MAKING 153

VALUES IN MICROECONOMIC DECISION-MAKING 154

VALUES IN MICROECONOMIC DECISION-MAKING 155

VALUES IN MICROECONOMIC DECISION-MAKING 156

VALUES IN MICROECONOMIC DECISION-MAKING 157

VALUES IN MICROECONOMIC DECISION-MAKING 158
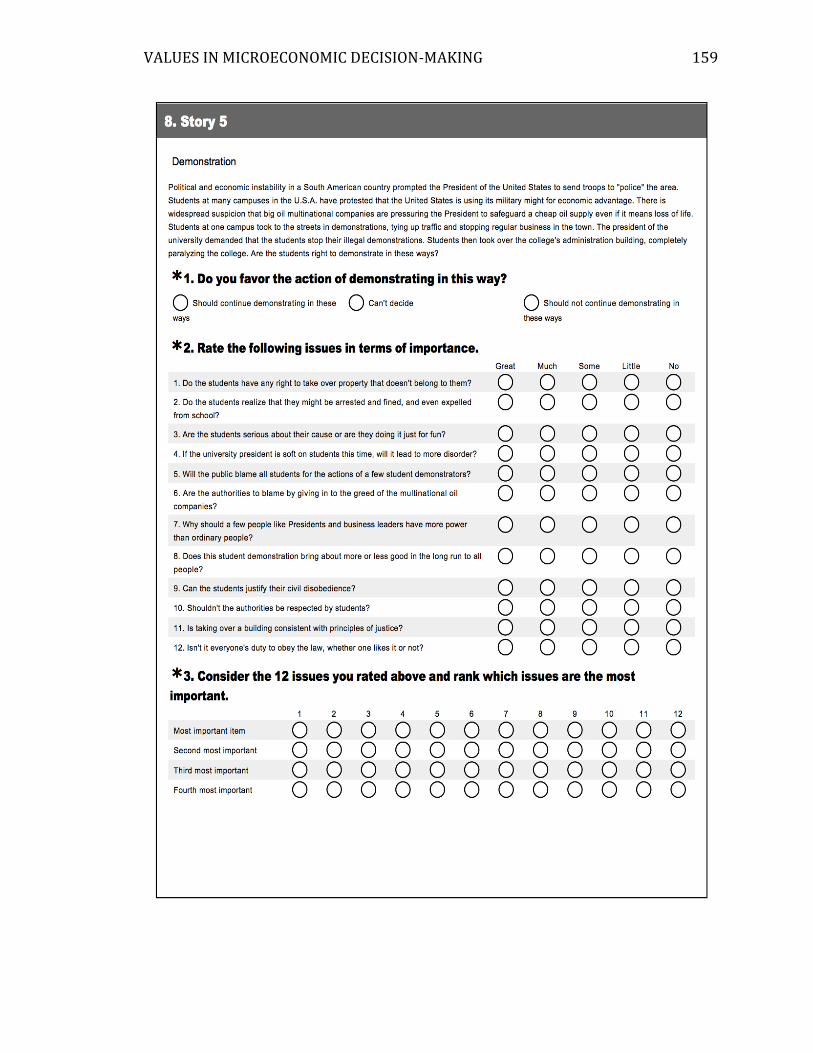
VALUES IN MICROECONOMIC DECISION-MAKING 159
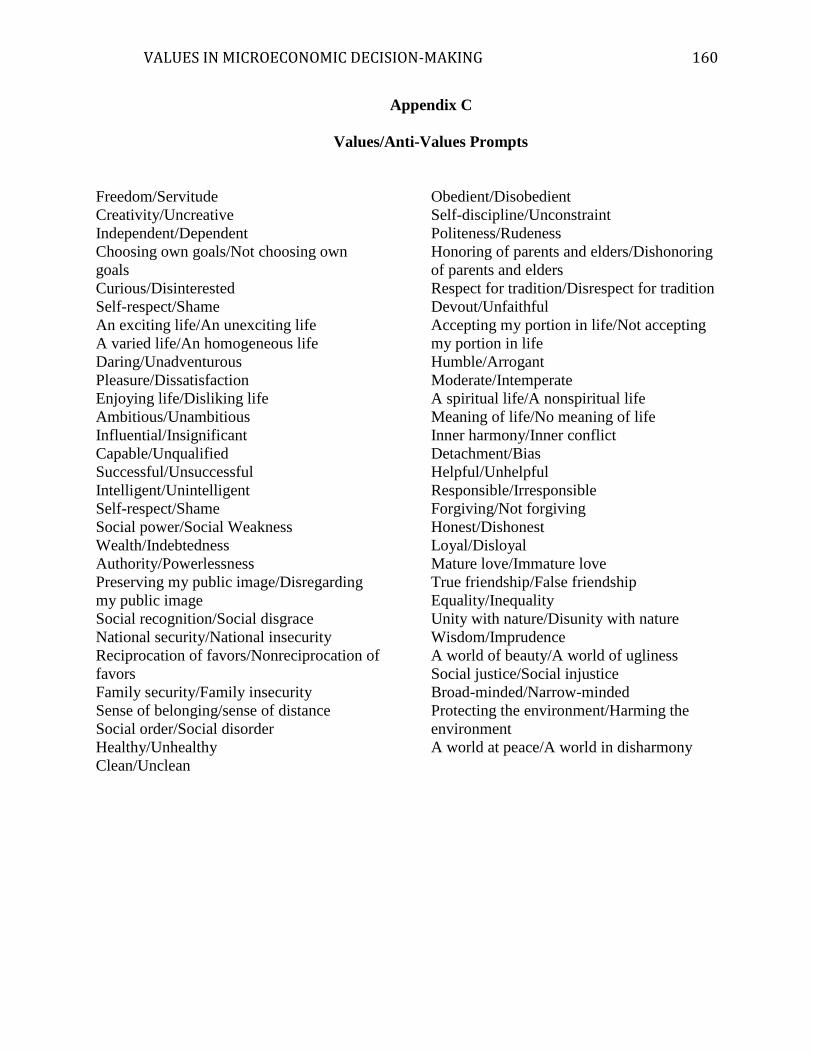
VALUES IN MICROECONOMIC DECISION-MAKING 160
Appendix C
Values/Anti-Values Prompts
Freedom/Servitude
Creativity/Uncreative
Independent/Dependent
Choosing own goals/Not choosing own
goals
Curious/Disinterested
Self-respect/Shame
An exciting life/An unexciting life
A varied life/An homogeneous life
Daring/Unadventurous
Pleasure/Dissatisfaction
Enjoying life/Disliking life
Ambitious/Unambitious
Influential/Insignificant
Capable/Unqualified
Successful/Unsuccessful
Intelligent/Unintelligent
Self-respect/Shame
Social power/Social Weakness
Wealth/Indebtedness
Authority/Powerlessness
Preserving my public image/Disregarding
my public image
Social recognition/Social disgrace
National security/National insecurity
Reciprocation of favors/Nonreciprocation of
favors
Family security/Family insecurity
Sense of belonging/sense of distance
Social order/Social disorder
Healthy/Unhealthy
Clean/Unclean
Obedient/Disobedient
Self-discipline/Unconstraint
Politeness/Rudeness
Honoring of parents and elders/Dishonoring
of parents and elders
Respect for tradition/Disrespect for tradition
Devout/Unfaithful
Accepting my portion in life/Not accepting
my portion in life
Humble/Arrogant
Moderate/Intemperate
A spiritual life/A nonspiritual life
Meaning of life/No meaning of life
Inner harmony/Inner conflict
Detachment/Bias
Helpful/Unhelpful
Responsible/Irresponsible
Forgiving/Not forgiving
Honest/Dishonest
Loyal/Disloyal
Mature love/Immature love
True friendship/False friendship
Equality/Inequality
Unity with nature/Disunity with nature
Wisdom/Imprudence
A world of beauty/A world of ugliness
Social justice/Social injustice
Broad-minded/Narrow-minded
Protecting the environment/Harming the
environment
A world at peace/A world in disharmony

VALUES IN MICROECONOMIC DECISION-MAKING 161
Appendix D
Values Expressed
Participant number_________________
Example
Imagine you are about to vote for a candidate for the Presidency of
the United States. Before you vote, you are asked to rate the
importance of five issues you could consider in deciding who to vote for.
Decision Consideration Value Expressed
Financially are you personally better off now than you _______________
were four years ago?
Does one candidate have a superior moral character? _______________
Which candidate stands the tallest? _______________
Which candidate would make the best world leader? _______________
Which candidate has the best ideas for our country’s internal
Problems, like crime and health care. _______________

VALUES IN MICROECONOMIC DECISION-MAKING 162
Story 1-Famine
The small village in northern India has experienced shortages of food before, but this year’s
famine is worse than ever. Some families are even trying to feed themselves by making soup
from tree bark. Mustaq Singh’s family is near starvation. He has heard that a rich man in his
village has supplies of food stored away and is hording food while its price goes higher so that he
can sell the food later at a huge profit. Mustaq is desperate and thinks about stealing some food
from the rich man’s warehouse. The small amout of food that he needs for his family probably
wouldn’t even be missed.
Decision Consideration Value Expressed
Is Mustaq Singh courageous enough to risk getting caught for
stealing? _______________
Isn’t it only natural for a loving father to care so much for his family
that he would steal? _______________
Shouldn’t the community’s laws be upheld? _______________
Does Mustaq Singh know a good recipe for preparing soup from
tree bark? _______________
Does the rich man have any legal right to store food when other
people are starving? _______________
Is the motive of Mustaq Singh to steal for himself or to steal for
his family? _______________
What values are going to be the basis for social cooperation? _______________
Is the epitome of eating reconcilable with the culpability of
stealing? _______________
Does the rich man deserve to be robbed for being so greedy? _______________
Isn’t private property an institution to enable the rich to exploit
the poor? _______________
Would stealing bring about more total good for everybody concerned
or wouldn’t it? _______________
Are laws getting in the way of the most basic claim of any member
of society? _______________

VALUES IN MICROECONOMIC DECISION-MAKING 163
Appendix E
Shared Values Set: Group 1 Decision Consideration Value Expressed
Is Mustaq Singh courageous
enough to risk getting
caught for stealing?
Responsible, daring, dishonest, capable, disobedient, daring,
disliking life, loyalty, disregarding public image, self-respect,
courage
Isn’t it only natural for a
loving father to care so
much for his family that he
would steal?
Responsible, health, social disorder, family security, family
insecurity, family loyalty, devout
Shouldn’t the community’s
laws be upheld?
Unhealthy, authority, disobedience, protecting the environment,
social justice, social order, not accepting portion in life, servitude
Does Mustaq Singh know a
good recipe for preparing
soup from tree bark?
Capable, helpful, creativity, unhealthy, world of ugliness, health,
insignificant, healthy
Does the rich man have any
legal right to store food
when other people are
starving?
Inner conflict, equality, wealth, social injustice, detachment, disunity
with nature, social justice, bias
Is the motive of Mustaq
Singh to steal for himself or
to steal forhis family?
Family security, forgiving, shame, irresponsible, responsible,
reciprocation of favors, immature love, mature love, social justice
What values are going to be
the basis for social
cooperation?
Forgiving, world at peace, self-respect, social justice, responsible,
authority, accepting my portion in life, wealth, social injustice
Is the epitome of eating
reconcilable with the
culpability of stealing?
Self respect, shame, social justice, social order, health, pleasure,
arrogant, inner conflict, disloyal, dishonest, shame, narrow mind
Does the rich man deserve
to be robbed for being so
greedy?
Rudeness, social justice, social injustice, wealth, social order,
dishonesty, moderate, accepting portion in life, social power
Isn’t private property an
institution to enable the rich
to exploitthe poor?
Unhelpful, not accepting one’s portion in live, social order, shame,
wealth narrow minded, social justice, irresponsible, inequality,
social weakness, security, equality, social injustice
Would stealing bring about
more total good for
everybody concerned or
wouldn’t it?
Responsible, social injustice, authority, a world in disharmony,
social weakness, independent, equality, unhelpful, sense of distance,
inequality, helpful, social order
Are laws getting in the way
of the most basic claim of
any memberof society?
Freedom, powerlessness, social power, social justice, social
injustice, unhelpful, meaning of life, broad minded, honest, social
disorder

VALUES IN MICROECONOMIC DECISION-MAKING 164
Shared Values Set: Group 2 Decision Consideration Value Expressed
Is Mustaq Singh courageous
enough to risk getting caught
for stealing?
Ambitious, family security, powerlessness, social recognition,
daring, arrogant, excepting my portion in live, loyal
Isn’t it only natural for a
loving father to care so
much for his family that he
would steal?
Family security, responsible, devout, healthy
Shouldn’t the community’s
laws be upheld?
Social justice, social order, obedient, social weakness, inequality
Does Mustaq Singh know a
good recipe for preparing
soup from
tree bark?
Not choosing own goals, creativity, excepting portion in life,
insignificant, helpful, capable
Does the rich man have any
legal right to store food
when other
people are starving?
Helpful, authority, wealth, social power, unhelpful, social justice,
equality
Is the motive of Mustaq
Singh to steal for himself or
to steal for his family?
Family security, meaning of life, self respect, responsible, inner
conflict, detachment
What values are going to be
the basis for social
cooperation?
Social order, social justice, authority, wealth, a world at peace,
influential, social injustice, equality
Is the epitome of eating
reconcilable with the
culpability of stealing?
Honest, wisdom, narrow minded, forgiving, unhealthy, reciprocation
of favors, not accepting portion in life, social justice, a world of
ugliness, responsible
Does the rich man deserve to
be robbed for being so
greedy?
Arrogance, social justice, politeness, dishonest, social injustice,
social power, a world of ugliness, inequality
Isn’t private property an
institution to enable the rich
to exploit the poor?
Social injustice, wealth, bias, humble, equality, inequality, freedom
Would stealing bring about
more total good for
everybody concerned
or wouldn’t it?
Social order, a world at peace, inequality, respect for tradition, a
world in disharmony, unhelpful, helpful
Are laws getting in the way
of the most basic claim of
any member of society?
Social justice, dissatisfaction, equality, family security, obedience,
social disorder, protect the environment, social order, choosing own
goals
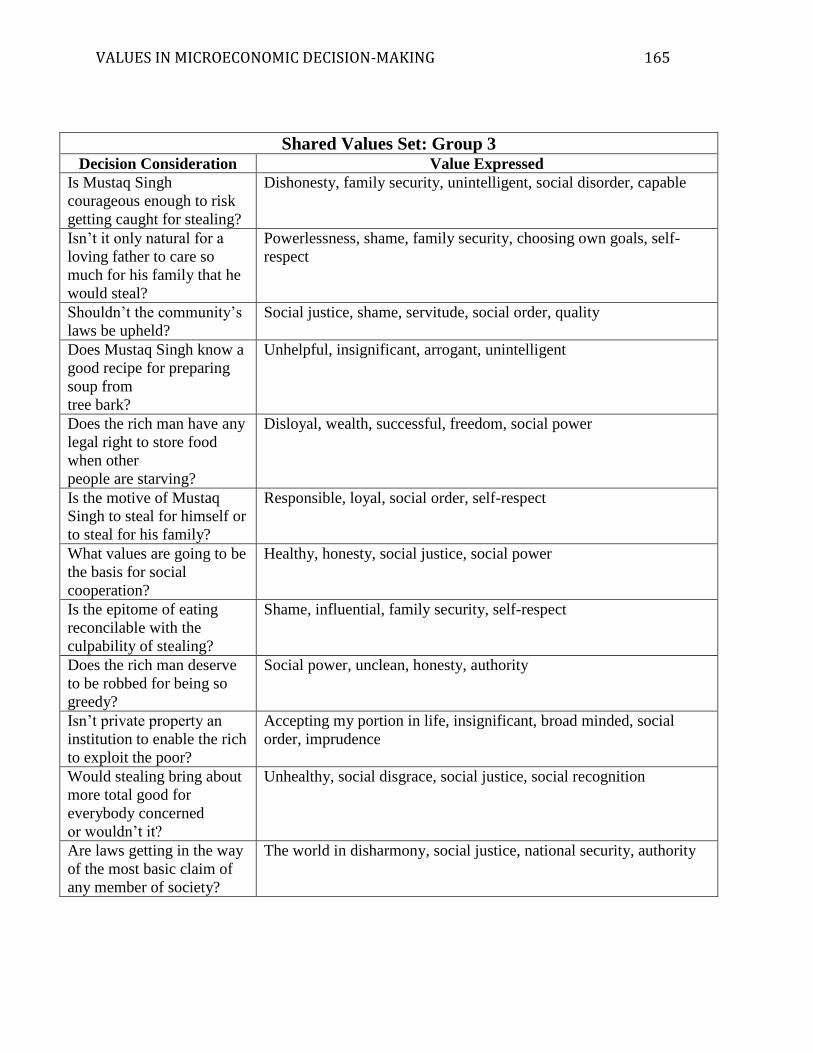
VALUES IN MICROECONOMIC DECISION-MAKING 165
Shared Values Set: Group 3 Decision Consideration Value Expressed
Is Mustaq Singh
courageous enough to risk
getting caught for stealing?
Dishonesty, family security, unintelligent, social disorder, capable
Isn’t it only natural for a
loving father to care so
much for his family that he
would steal?
Powerlessness, shame, family security, choosing own goals, self-
respect
Shouldn’t the community’s
laws be upheld?
Social justice, shame, servitude, social order, quality
Does Mustaq Singh know a
good recipe for preparing
soup from
tree bark?
Unhelpful, insignificant, arrogant, unintelligent
Does the rich man have any
legal right to store food
when other
people are starving?
Disloyal, wealth, successful, freedom, social power
Is the motive of Mustaq
Singh to steal for himself or
to steal for his family?
Responsible, loyal, social order, self-respect
What values are going to be
the basis for social
cooperation?
Healthy, honesty, social justice, social power
Is the epitome of eating
reconcilable with the
culpability of stealing?
Shame, influential, family security, self-respect
Does the rich man deserve
to be robbed for being so
greedy?
Social power, unclean, honesty, authority
Isn’t private property an
institution to enable the rich
to exploit the poor?
Accepting my portion in life, insignificant, broad minded, social
order, imprudence
Would stealing bring about
more total good for
everybody concerned
or wouldn’t it?
Unhealthy, social disgrace, social justice, social recognition
Are laws getting in the way
of the most basic claim of
any member of society?
The world in disharmony, social justice, national security, authority

VALUES IN MICROECONOMIC DECISION-MAKING 166
Shared Values Set: Group 4 Decision Consideration Value Expressed
Is Mustaq Singh
courageous enough to risk
getting caught for stealing?
Meaning of life, daring, capable, family security, health
Isn’t it only natural for a
loving father to care so
much for his family that he
would steal?
Inner harmony, family security, authority, daring
Shouldn’t the community’s
laws be upheld?
Social justice, social injustice, authority, obedient, social order
Does Mustaq Singh know a
good recipe for preparing
soup from
tree bark?
Creativity, unhealthy, healthy, harming the environment
Does the rich man have any
legal right to store food
when other
people are starving?
Social power, powerless, social disgrace, authority, social order
Is the motive of Mustaq
Singh to steal for himself or
to steal for his family?
Humble, sense of belonging, family security, unfaithful
What values are going to be
the basis for social
cooperation?
Equality, influential, powerlessness, social recognition
Is the epitome of eating
reconcilable with the
culpability of stealing?
Detachment, accepting portion in life, equality, social disgrace
Does the rich man deserve
to be robbed for being so
greedy?
Arrogant, indebtedness, wealth
Isn’t private property an
institution to enable the rich
to exploit the poor?
Disorder, inequality, uninitelligent
Would stealing bring about
more total good for
everybody concerned
or wouldn’t it?
Social order, equality, a world of beauty, disobedient
Are laws getting in the way
of the most basic claim of
any member of society?
World of ugliness, obedient, enjoying life, freedom, insignificant

VALUES IN MICROECONOMIC DECISION-MAKING 167
Shared Values Set: Group 5 Decision Consideration Value Expressed
Is Mustaq Singh
courageous enough to risk
getting caught for stealing?
Family security, meaning of life, responsible
Isn’t it only natural for a
loving father to care so
much for his family that he
would steal?
Family security, responsible
Shouldn’t the community’s
laws be upheld?
Social power, equality, social order, authority, freedom
Does Mustaq Singh know a
good recipe for preparing
soup from tree bark?
Intelligent, creativity, independence
Does the rich man have any
legal right to store food
when other
people are starving?
Intelligent, social justice, social injustice, social order, shame
Is the motive of Mustaq
Singh to steal for himself or
to steal for his family?
Family security, humble
What values are going to be
the basis for social
cooperation?
Social order, helpful, equality, social recognition
Is the epitome of eating
reconcilable with the
culpability of stealing?
Accepting portion in life, inner conflict, inner harmony, social
injustice
Does the rich man deserve
to be robbed for being so
greedy?
Wealth, bias, social disorder, not accepting my portion in life
Isn’t private property an
institution to enable the rich
to exploit the poor?
Social order, capability, social injustice, inner conflict
Would stealing bring about
more total good for
everybody concerned
or wouldn’t it?
Social disorder, honest, world of beauty
Are laws getting in the way
of the most basic claim of
any member of society?
Authority, inequality, freedom
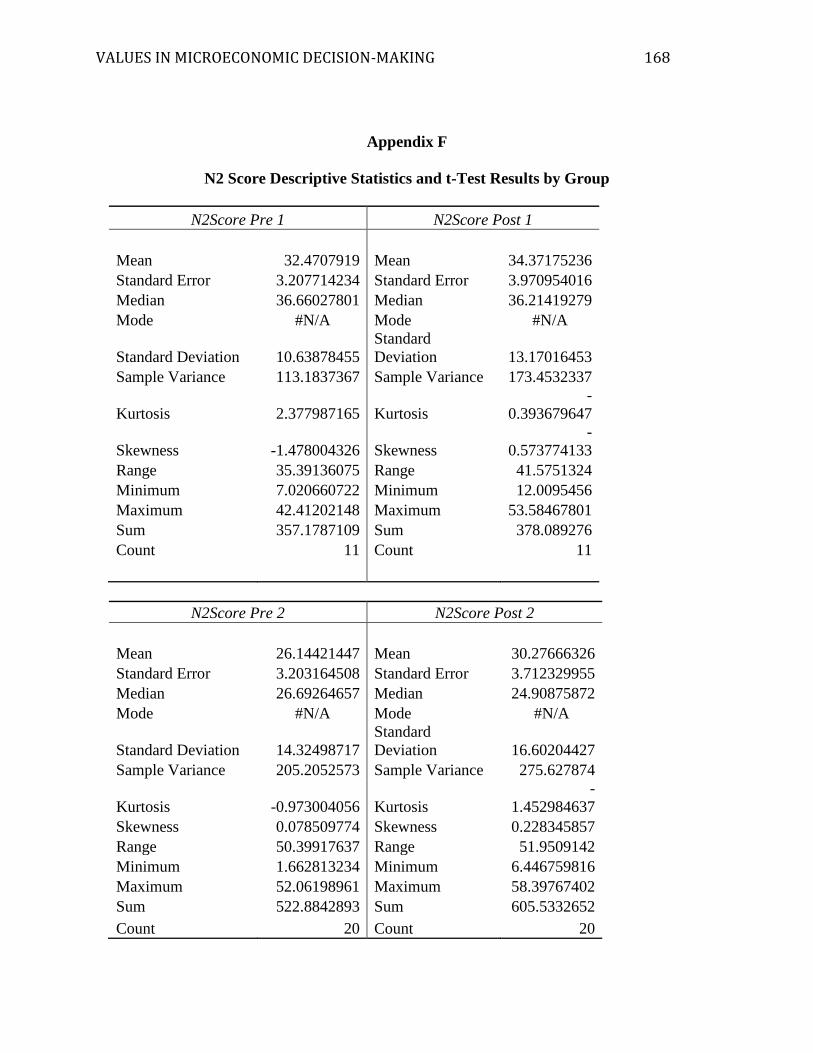
VALUES IN MICROECONOMIC DECISION-MAKING 168
Appendix F
N2 Score Descriptive Statistics and t-Test Results by Group
N2Score Pre 1 N2Score Post 1
Mean 32.4707919 Mean 34.37175236
Standard Error 3.207714234 Standard Error 3.970954016
Median 36.66027801 Median 36.21419279
Mode #N/A Mode #N/A
Standard Deviation 10.63878455
Standard
Deviation 13.17016453
Sample Variance 113.1837367 Sample Variance 173.4532337
Kurtosis 2.377987165 Kurtosis
-
0.393679647
Skewness -1.478004326 Skewness
-
0.573774133
Range 35.39136075 Range 41.5751324
Minimum 7.020660722 Minimum 12.0095456
Maximum 42.41202148 Maximum 53.58467801
Sum 357.1787109 Sum 378.089276
Count 11 Count 11
N2Score Pre 2 N2Score Post 2
Mean 26.14421447 Mean 30.27666326
Standard Error 3.203164508 Standard Error 3.712329955
Median 26.69264657 Median 24.90875872
Mode #N/A Mode #N/A
Standard Deviation 14.32498717
Standard
Deviation 16.60204427
Sample Variance 205.2052573 Sample Variance 275.627874
Kurtosis -0.973004056 Kurtosis
-
1.452984637
Skewness 0.078509774 Skewness 0.228345857
Range 50.39917637 Range 51.9509142
Minimum 1.662813234 Minimum 6.446759816
Maximum 52.06198961 Maximum 58.39767402
Sum 522.8842893 Sum 605.5332652
Count 20 Count 20

VALUES IN MICROECONOMIC DECISION-MAKING 169
N2Score Pre 3 N2Score Post 3
Mean 27.13117425 Mean 33.23663206
Standard Error 2.806625106 Standard Error 3.120815882
Median 27.79754756 Median 33.68428625
Mode #N/A Mode #N/A
Standard Deviation 11.57201176
Standard
Deviation 12.86745352
Sample Variance 133.9114562 Sample Variance 165.5713601
Kurtosis -1.356869269 Kurtosis 0.530728906
Skewness 0.158825174 Skewness 0.721912097
Range 32.5451282 Range 49.19446038
Minimum 11.69458314 Minimum 15.08192823
Maximum 44.23971134 Maximum 64.2763886
Sum 461.2299622 Sum 565.0227451
Count 17 Count 17
N2Score Pre 4 N2Score Post 4
Mean 28.30691515 Mean 21.52186151
Standard Error 2.270615948 Standard Error 2.530324336
Median 30.27532653 Median 19.99945096
Mode #N/A Mode #N/A
Standard Deviation 11.12370095 Standard Deviation 12.39600701
Sample Variance 123.7367227 Sample Variance 153.6609899
Kurtosis -0.488615462 Kurtosis
-
0.872555273
Skewness -0.108285866 Skewness 0.174020636
Range 45.05154414 Range 44.10436412
Minimum 5.300049497 Minimum 1.186909712
Maximum 50.35159364 Maximum 45.29127383
Sum 679.3659637 Sum 516.5246762
Count 24 Count 24
N2 Score Pre 5 N2 Score Post 5
Mean 36.21427423 Mean 38.29193961
Standard Error 2.652552161 Standard Error 2.897340967
Median 36.88693907 Median 38.21388959

VALUES IN MICROECONOMIC DECISION-MAKING 170
Mode #N/A Mode #N/A
Standard Deviation 15.69271021
Standard
Deviation 17.14090032
Sample Variance 246.2611538 Sample Variance 293.8104638
Kurtosis -0.752802801 Kurtosis
-
0.851866224
Skewness 0.008098017 Skewness 0.09147799
Range 61.03082413 Range 63.07693037
Minimum 5.412950513 Minimum 9.906068215
Maximum 66.44377464 Maximum 72.98299859
Sum 1267.499598 Sum 1340.217886
Count 35 Count 35

VALUES IN MICROECONOMIC DECISION-MAKING 171
t-Test: Paired Two Sample for
Means N2 Score Group 1
Variable 1 Variable 2
Mean 32.4707919 34.37175236
Variance 113.1837367 173.4532337
Observations 11 11
Pearson Correlation 0.805707725
Hypothesized Mean Difference 0
df 10
t Stat -0.808209657
P(T<=t) one-tail 0.218886928
t Critical one-tail 1.812461123
P(T<=t) two-tail 0.437773855
t Critical two-tail 2.228138852
t-Test: Paired Two Sample for Means
N2 Score Group 2
Variable 1 Variable 2
Mean 26.14421447 30.27666326
Variance 205.2052573 275.627874
Observations 20 20
Pearson Correlation 0.90962854
Hypothesized Mean
Difference 0
df 19
t Stat
-
2.662772899
P(T<=t) one-tail 0.007686697
t Critical one-tail 1.729132812
P(T<=t) two-tail 0.015373394
t Critical two-tail 2.093024054
t-Test: Paired Two Sample for Means
N2 Score Group 3
Variable 1 Variable 2
Mean 27.13117425 33.23663206
Variance 133.9114562 165.5713601
Observations 17 17
Pearson Correlation 0.500398825
Hypothesized Mean
Difference 0
df 16

VALUES IN MICROECONOMIC DECISION-MAKING 172
t Stat
-
2.052247254
P(T<=t) one-tail 0.028440102
t Critical one-tail 1.745883676
P(T<=t) two-tail 0.056880204
t Critical two-tail 2.119905299
t-Test: Paired Two Sample for Means
N2 Score Group 4
Variable 1 Variable 2
Mean 28.30691515 21.52186151
Variance 123.7367227 153.6609899
Observations 24 24
Pearson Correlation 0.325354866
Hypothesized Mean
Difference 0
df 23
t Stat 2.426383951
P(T<=t) one-tail 0.011748508
t Critical one-tail 1.713871528
P(T<=t) two-tail 0.023497015
t Critical two-tail 2.06865761
t-Test: Paired Two Sample for Means
N2 Score Group 5
Variable 1 Variable 2
Mean 36.21427423 38.29193961
Variance 246.2611538 293.8104638
Observations 35 35
Pearson Correlation 0.881595369
Hypothesized Mean
Difference 0
df 34
t Stat -1.5153403
P(T<=t) one-tail 0.069464435
t Critical one-tail 1.690924255
P(T<=t) two-tail 0.13892887
t Critical two-tail 2.032244509

VALUES IN MICROECONOMIC DECISION-MAKING 173
Appendix G
Stage 23 and 4P Descriptive Statistics and t-Tests
Stage 23 Descriptive By Group
Stage 23 Pre Group 1 Stage 23 Post Group 1
Mean 28.36363636 Mean 24.36363636 Standard Error 2.49826386 Standard Error 3.878314365 Median 30 Median 20 Mode 32 Mode 20 Standard Deviation 8.285803851
Standard Deviation 12.86291357
Sample Variance 68.65454545 Sample Variance 165.4545455 Kurtosis 1.059282758 Kurtosis 1.686852635 Skewness 0.502441968 Skewness 1.253477284 Range 30 Range 44 Minimum 16 Minimum 10 Maximum 46 Maximum 54 Sum 312 Sum 268
Count 11 Count 11
Stage 23 Pre Group 2 Stage 23 Post Group 2
Mean 27.6 Mean 27.6 Standard Error 3.164274258 Standard Error 3.45984484 Median 23 Median 25
Mode 12 Mode 32 Standard Deviation 14.15106468
Standard Deviation 15.47289651
Sample Variance 200.2526316 Sample Variance 239.4105263
Kurtosis -
0.129339419 Kurtosis -
0.436354486 Skewness 0.825606231 Skewness 0.576714106
Range 48 Range 54 Minimum 12 Minimum 8 Maximum 60 Maximum 62 Sum 552 Sum 552
Count 20 Count 20

VALUES IN MICROECONOMIC DECISION-MAKING 174
Stage 23 Pre Group 3 Stage 23 Post Group 3
Mean 30.25 Mean 26.58823529 Standard Error 3.341032774 Standard Error 3.359642426 Median 31 Median 30 Mode 28 Mode 10 Standard Deviation 13.3641311
Standard Deviation 13.85216059
Sample Variance 178.6 Sample Variance 191.8823529
Kurtosis -
1.190000107 Kurtosis -
1.116419022
Skewness -
0.314918089 Skewness -
0.115266434 Range 40 Range 44 Minimum 10 Minimum 4 Maximum 50 Maximum 48 Sum 484 Sum 452
Count 16 Count 17
Stage 23 Pre Group 4 Stage 23 Post Group 4
Mean 33.08333333 Mean 35.5 Standard Error 1.937349028 Standard Error 2.470844484 Median 34 Median 39
Mode 34 Mode 38 Standard Deviation 9.491033144
Standard Deviation 12.10461644
Sample Variance 90.07971014 Sample Variance 146.5217391
Kurtosis -
0.128868487 Kurtosis -0.68507537
Skewness -
0.390785004 Skewness -
0.588717017 Range 36 Range 42 Minimum 14 Minimum 12 Maximum 50 Maximum 54
Sum 794 Sum 852
Count 24 Count 24
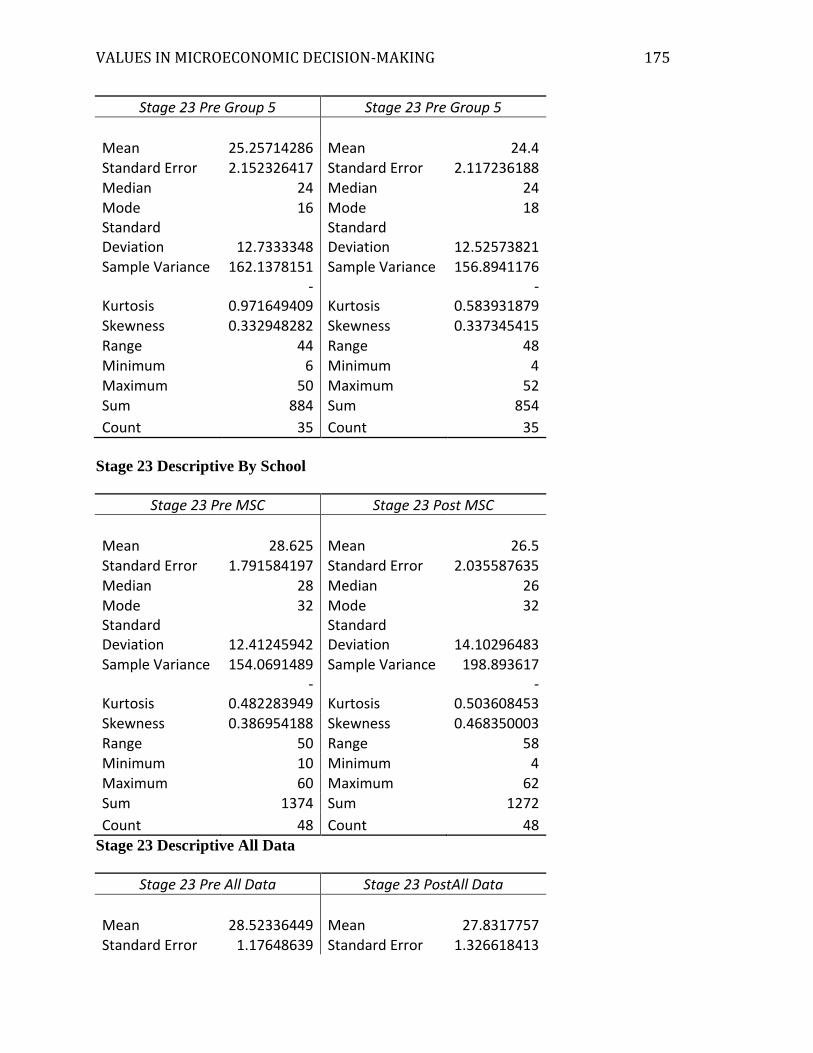
VALUES IN MICROECONOMIC DECISION-MAKING 175
Stage 23 Pre Group 5 Stage 23 Pre Group 5
Mean 25.25714286 Mean 24.4 Standard Error 2.152326417 Standard Error 2.117236188 Median 24 Median 24 Mode 16 Mode 18 Standard Deviation 12.7333348
Standard Deviation 12.52573821
Sample Variance 162.1378151 Sample Variance 156.8941176
Kurtosis -
0.971649409 Kurtosis -
0.583931879 Skewness 0.332948282 Skewness 0.337345415
Range 44 Range 48 Minimum 6 Minimum 4 Maximum 50 Maximum 52 Sum 884 Sum 854
Count 35 Count 35
Stage 23 Descriptive By School
Stage 23 Pre MSC Stage 23 Post MSC
Mean 28.625 Mean 26.5 Standard Error 1.791584197 Standard Error 2.035587635
Median 28 Median 26 Mode 32 Mode 32 Standard Deviation 12.41245942
Standard Deviation 14.10296483
Sample Variance 154.0691489 Sample Variance 198.893617
Kurtosis -
0.482283949 Kurtosis -
0.503608453 Skewness 0.386954188 Skewness 0.468350003 Range 50 Range 58 Minimum 10 Minimum 4 Maximum 60 Maximum 62
Sum 1374 Sum 1272
Count 48 Count 48
Stage 23 Descriptive All Data
Stage 23 Pre All Data Stage 23 PostAll Data
Mean 28.52336449 Mean 27.8317757 Standard Error 1.17648639 Standard Error 1.326618413

VALUES IN MICROECONOMIC DECISION-MAKING 176
Median 28 Median 26
Mode 32 Mode 8 Standard Deviation 12.16966984
Standard Deviation 13.72264757
Sample Variance 148.100864 Sample Variance 188.3110563
Kurtosis -0.7652174 Kurtosis -
0.883736879 Skewness 0.138215681 Skewness 0.19703414 Range 54 Range 58 Minimum 6 Minimum 4 Maximum 60 Maximum 62 Sum 3052 Sum 2978
Count 107 Count 107
Stage 23 t-Test By Group
t-Test: Paired Two Sample for Means
Stage 23 Group 1
Variable 1 Variable 2
Mean 28.36363636 24.36363636 Variance 68.65454545 165.4545455 Observations 11 11 Pearson Correlation 0.831815499 Hypothesized Mean Difference 0 df 10 t Stat 1.760281668 P(T<=t) one-tail 0.05442699 t Critical one-tail 1.812461123 P(T<=t) two-tail 0.10885398
t Critical two-tail 2.228138852
t-Test: Paired Two Sample for Means
Stage 23 Group 2
Variable 1 Variable 2
Mean 27.6 27.6 Variance 200.2526316 239.4105263 Observations 20 20

VALUES IN MICROECONOMIC DECISION-MAKING 177
Pearson Correlation 0.845343725 Hypothesized Mean Difference 0 df 19 t Stat 4.76546E-17 P(T<=t) one-tail 0.5 t Critical one-tail 1.729132812 P(T<=t) two-tail 1
t Critical two-tail 2.093024054
t-Test: Paired Two Sample for Means
Stage 23 Group 3
Variable 1 Variable 2
Mean 30 26.58823529 Variance 168.5 191.8823529 Observations 17 17 Pearson Correlation 0.695172434 Hypothesized Mean Difference 0 df 16 t Stat 1.338917165 P(T<=t) one-tail 0.099655534 t Critical one-tail 1.745883676 P(T<=t) two-tail 0.199311069
t Critical two-tail 2.119905299
t-Test: Paired Two Sample for Means
Stage 23 Group 4
Variable 1 Variable 2
Mean 33.08333333 35.5 Variance 90.07971014 146.5217391 Observations 24 24 Pearson Correlation 0.321303408 Hypothesized Mean Difference 0
df 23
t Stat -
0.927957396 P(T<=t) one-tail 0.181533137 t Critical one-tail 1.713871528 P(T<=t) two-tail 0.363066274
t Critical two-tail 2.06865761

VALUES IN MICROECONOMIC DECISION-MAKING 178
t-Test: Paired Two Sample for Means
Stage 23 Group 5
Variable 1 Variable 2
Mean 25.25714286 24.4 Variance 162.1378151 156.8941176 Observations 35 35 Pearson Correlation 0.841334993 Hypothesized Mean Difference 0 df 34 t Stat 0.712482319
P(T<=t) one-tail 0.240513679 t Critical one-tail 1.690924255 P(T<=t) two-tail 0.481027358
t Critical two-tail 2.032244509
Stage 23 t-Test By School
t-Test: Paired Two Sample for Means
Stage 23 MSC
Variable 1 Variable 2
Mean 28.625 26.5 Variance 154.0691489 198.893617
Observations 48 48 Pearson Correlation 0.776545246 Hypothesized Mean Difference 0 df 47 t Stat 1.634913438 P(T<=t) one-tail 0.054374096 t Critical one-tail 1.677926722 P(T<=t) two-tail 0.108748192
t Critical two-tail 2.011740514
t-Test: Paired Two Sample for Means
Stage 23 CSU
Variable 1 Variable 2
Mean 28.44067797 28.91525424 Variance 145.8024547 180.3202805

VALUES IN MICROECONOMIC DECISION-MAKING 179
Observations 59 59
Pearson Correlation 0.706922165 Hypothesized Mean Difference 0 df 58
t Stat -
0.370363041 P(T<=t) one-tail 0.35623057 t Critical one-tail 1.671552762 P(T<=t) two-tail 0.712461139
t Critical two-tail 2.001717484
Stage 23 t-Test All Data
t-Test: Paired Two Sample for Means
Stage 23 All Data
Variable 1 Variable 2
Mean 28.52336449 27.8317757 Variance 148.100864 188.3110563 Observations 107 107 Pearson Correlation 0.735815926 Hypothesized Mean Difference 0 df 106
t Stat 0.751376624 P(T<=t) one-tail 0.227045501 t Critical one-tail 1.659356034 P(T<=t) two-tail 0.454091002
t Critical two-tail 1.982597262
4P Descriptive By Group
4P Pre Group 1 4P Post Group 1
Mean 34.72727273 Mean 35.63636364 Standard Error 3.294874557 Standard Error 4.559251787 Median 32 Median 32

VALUES IN MICROECONOMIC DECISION-MAKING 180
Mode 32 Mode 32 Standard Deviation 10.92786264
Standard Deviation 15.1213275
Sample Variance 119.4181818 Sample Variance 228.6545455 Kurtosis 0.230159095 Kurtosis -0.9986119 Skewness 0.99486071 Skewness 0.155499382 Range 34 Range 46 Minimum 22 Minimum 14 Maximum 56 Maximum 60 Sum 382 Sum 392
Count 11 Count 11
4P Pre Group 2 4P Post Group 2
Mean 32.9 Mean 34.4 Standard Error 3.200246701 Standard Error 2.693461869 Median 36 Median 37 Mode 40 Mode 40 Standard Deviation 14.31193834
Standard Deviation 12.04552767
Sample Variance 204.8315789 Sample Variance 145.0947368
Kurtosis -
0.129645373 Kurtosis -
0.751960456
Skewness -
0.447850824 Skewness -
0.373060661 Range 52 Range 40 Minimum 4 Minimum 12 Maximum 56 Maximum 52 Sum 658 Sum 688
Count 20 Count 20
4P Pre Group 3 4P Post Group 3
Mean 36.11764706 Mean 36 Standard Error 4.106918797 Standard Error 3.910769444 Median 38 Median 32 Mode 42 Mode 40 Standard 16.93326 Standard 16.1245155

VALUES IN MICROECONOMIC DECISION-MAKING 181
Deviation Deviation
Sample Variance 286.7352941 Sample Variance 260 Kurtosis 0.047674091 Kurtosis 0.953722739 Skewness 0.46247221 Skewness 1.098900043 Range 64 Range 60 Minimum 10 Minimum 16 Maximum 74 Maximum 76 Sum 614 Sum 612
Count 17 Count 17
4P Pre Group 4 4P Post Group 4
Mean 32.16666667 Mean 35.25 Standard Error 2.68359662 Standard Error 2.553237502 Median 32 Median 38 Mode 32 Mode 38 Standard Deviation 13.14688479
Standard Deviation 12.50825814
Sample Variance 172.8405797 Sample Variance 156.4565217
Kurtosis -
0.290422452 Kurtosis -
0.376249665 Skewness 0.049015264 Skewness 0.087705898 Range 52 Range 48 Minimum 4 Minimum 14
Maximum 56 Maximum 62 Sum 772 Sum 846
Count 24 Count 24
4P Pre Group 5 4P Pre Group 5
Mean 30.45714286 Mean 30.05714286 Standard Error 2.257515127 Standard Error 2.502416599 Median 30 Median 28 Mode 18 Mode 20 Standard 13.3556396 Standard 14.80449625

VALUES IN MICROECONOMIC DECISION-MAKING 182
Deviation Deviation
Sample Variance 178.3731092 Sample Variance 219.1731092
Kurtosis -
0.723399491 Kurtosis -
0.028662321 Skewness 0.554350578 Skewness 0.546164043 Range 50 Range 64 Minimum 12 Minimum 2 Maximum 62 Maximum 66 Sum 1066 Sum 1052
Count 35 Count 35
4P Descriptive By School
4P Pre MSC 4P Post MSC
Mean 34.45833333 Mean 35.25 Standard Error 2.081018217 Standard Error 2.022589626 Median 34 Median 34 Mode 32 Mode 40 Standard Deviation 14.41771713
Standard Deviation 14.01291198
Sample Variance 207.8705674 Sample Variance 196.3617021 Kurtosis 0.246005245 Kurtosis 0.188115249 Skewness 0.188766611 Skewness 0.510466575
Range 70 Range 64 Minimum 4 Minimum 12 Maximum 74 Maximum 76 Sum 1654 Sum 1692
Count 48 Count 48
4P Pre 4 CSU 4P Post 4 CSU
Mean 31.15254237 Mean 32.16949153 Standard Error 1.716426902 Standard Error 1.827952412 Median 30 Median 34 Mode 18 Mode 38 Standard 13.1841252 Standard 14.04076889

VALUES IN MICROECONOMIC DECISION-MAKING 183
Deviation Deviation
Sample Variance 173.8211572 Sample Variance 197.1431911
Kurtosis -0.68131744 Kurtosis -
0.330805324 Skewness 0.343731487 Skewness 0.301949685 Range 58 Range 64 Minimum 4 Minimum 2 Maximum 62 Maximum 66 Sum 1838 Sum 1898
Count 59 Count 59
4P Descriptive All Data
4P Pre All Data 4P Post All Data
Mean 32.63551402 Mean 33.55140187 Standard Error 1.33258026 Standard Error 1.357933749 Median 32 Median 34 Mode 22 Mode 38 Standard Deviation 13.7843174
Standard Deviation 14.04657592
Sample Variance 190.0074061 Sample Variance 197.3062952
Kurtosis -
0.229249449 Kurtosis -
0.106262599 Skewness 0.287380517 Skewness 0.380887114 Range 70 Range 74 Minimum 4 Minimum 2 Maximum 74 Maximum 76 Sum 3492 Sum 3590
Count 107 Count 107
4P t-Test By Group
t-Test: Paired Two Sample for Means
4P Group 1
Variable 1 Variable 2
Mean 34.72727273 35.63636364 Variance 119.4181818 228.6545455

VALUES IN MICROECONOMIC DECISION-MAKING 184
Observations 11 11
Pearson Correlation 0.778794224 Hypothesized Mean Difference 0 df 10
t Stat -
0.316607924 P(T<=t) one-tail 0.379025732 t Critical one-tail 1.812461123 P(T<=t) two-tail 0.758051465
t Critical two-tail 2.228138852
t-Test: Paired Two Sample for Means
4P Group 2
Variable 1 Variable 2
Mean 32.9 34.4 Variance 204.8315789 145.0947368 Observations 20 20 Pearson Correlation 0.844084322 Hypothesized Mean Difference 0 df 19
t Stat -
0.874113875
P(T<=t) one-tail 0.196485577 t Critical one-tail 1.729132812 P(T<=t) two-tail 0.392971154
t Critical two-tail 2.093024054
t-Test: Paired Two Sample for Means
4P Group 3
Variable 1 Variable
2
Mean 36.11764706 36 Variance 286.7352941 260 Observations 17 17

VALUES IN MICROECONOMIC DECISION-MAKING 185
Pearson Correlation 0.783766186 Hypothesized Mean Difference 0 df 16 t Stat 0.044515947 P(T<=t) one-tail 0.482521995 t Critical one-tail 1.745883676 P(T<=t) two-tail 0.96504399
t Critical two-tail 2.119905299
t-Test: Paired Two Sample for Means
4P Group 4
Variable 1 Variable 2
Mean 32.16666667 35.25 Variance 172.8405797 156.4565217 Observations 24 24 Pearson Correlation 0.643800689 Hypothesized Mean Difference 0 df 23
t Stat -
1.393156989 P(T<=t) one-tail 0.088446019 t Critical one-tail 1.713871528
P(T<=t) two-tail 0.176892038
t Critical two-tail 2.06865761
t-Test: Paired Two Sample for Means
4P Group 5
Variable 1 Variable 2
Mean 30.45714286 30.05714286 Variance 178.3731092 219.1731092 Observations 35 35 Pearson Correlation 0.791224536 Hypothesized Mean Difference 0 df 34 t Stat 0.257192263

VALUES IN MICROECONOMIC DECISION-MAKING 186
P(T<=t) one-tail 0.399290258
t Critical one-tail 1.690924255 P(T<=t) two-tail 0.798580517
t Critical two-tail 2.032244509
4P t-Test By School
t-Test: Paired Two Sample for Means
4P MSC
Variable 1 Variable 2
Mean 34.45833333 35.25 Variance 207.8705674 196.3617021
Observations 48 48
Pearson Correlation 0.792419025 Hypothesized Mean Difference 0 df 47
t Stat -
0.598298536 P(T<=t) one-tail 0.276256622 t Critical one-tail 1.677926722 P(T<=t) two-tail 0.552513245
t Critical two-tail 2.011740514
t-Test: Paired Two Sample for Means
4P CSU
Variable 1 Variable 2
Mean 31.15254237 32.16949153
Variance 173.8211572 197.1431911 Observations 59 59 Pearson Correlation 0.733976524 Hypothesized Mean Difference 0 df 58 t Stat -

VALUES IN MICROECONOMIC DECISION-MAKING 187
0.784182628
P(T<=t) one-tail 0.218061989 t Critical one-tail 1.671552762 P(T<=t) two-tail 0.436123978
t Critical two-tail 2.001717484
4P t-Test All Data
t-Test: Paired Two Sample for Means
4P All Data
Variable 1 Variable 2
Mean 32.63551402 33.55140187
Variance 190.0074061 197.3062952
Observations 107 107 Pearson Correlation 0.76371659 Hypothesized Mean Difference 0 df 106
t Stat -
0.990060057 P(T<=t) one-tail 0.162199702 t Critical one-tail 1.659356034 P(T<=t) two-tail 0.324399403
t Critical two-tail 1.982597262

VALUES IN MICROECONOMIC DECISION-MAKING 188
Appendix H
George Fox University Human Subjects Committee Approval
From: BeckyJensen<[email protected]> Subject: HSRC Approval
Date: April 2, 2013 4:31:36 PM AKDT
To: "HollyBell(me.com)"<[email protected]>
Cc: Paul Shelton <[email protected]>
Hi Holly,
I have good news for you! I just received word that your HSRC has been approved! The form couldn't be sent today because of computer problems, but someone from that committee gave me a call to let me know it had been approved and you could move on with your research.
I apologize for the length of time you've had to wait, but at least now it's done. I will send you the form with the approval signatures as soon as I receive it.
--
Becky Jensen
Administrative Assistant
GFU School of Business
503-554-2821