Embed Size (px)
Citation preview

Artificial Intelligence forEngineering Design, Analysisand Manufacturing
cambridge.org/aie
Research Article
Cite this article: Song H, Evans J, Fu K (2020).An exploration-based approach tocomputationally supported design-by-analogyusing D3. Artificial Intelligence for EngineeringDesign, Analysis and Manufacturing 1–14.https://doi.org/10.1017/S0890060420000220
Received: 23 July 2019Revised: 30 April 2020Accepted: 2 May 2020
Key words:Computational design support; data mining;data visualization; design-by-analogy; patents
Author for correspondence:Katherine Fu, E-mail: [email protected]
© The Author(s), 2020. Published byCambridge University Press
An exploration-based approach tocomputationally supported design-by-analogyusing D3
Hyeonik Song, Jacob Evans and Katherine Fu
Georgia Institute of Technology, G.W. Woodruff School of Mechanical Engineering, 801 Ferst Drive, MRDC 4508,Atlanta, GA 30332-0405, USA
Abstract
Computational support for design-by-analogy (DbA) is a growing field, as it aids the processfor designers looking to draw inspiration from external sources by harnessing the power ofdata mining and data visualization. This study presents a unique exploration-based approachfor the analogical retrieval process using a computational tool called VISION (VisualInteraction tool for Seeking Inspiration based On Nonnegative Matrix Factorization).Leveraging the U.S. patent database as a source of inspiration, VISION enables designers tovisualize a patent repository and explore for analogical inspiration in a user-driven manner.To achieve this, we perform hierarchical Nonnegative Matrix Factorization to generate a clus-tered structure of patent data and employ D3.js to visualize the patent structure in a node-linknetwork, in which user interaction capabilities are enabled for data exploration. In this study,we also analyze the effect of data size (ranging from 100 to 3000 patents) on two performanceaspects of VISION – the clustering quality of topic modeling results and the frame rate of inter-active data visualization. The findings show that the tool exhibits more randomized and incon-sistent topic modeling results when the database size is too small. But, increasing the databasesize lowers the frame rate to the point that it could diminish designers’ ability to retrieve andrecall information. The scope of the work here is to present the creation of the DbA visualizationtool called VISION and to evaluate its data scale limitations in order to provide a basis for devel-oping a visual interaction tool for the analogical retrieval process during DbA.
Introduction
How do designers find inspiration? Ullman (2003) argued that the best way to discover a gooddesign is to generate many ideas and to learn from previous designs, in saying “to steal ideasfrom one person is plagiarism, to be influenced by many is good design”. Researchers havelooked at masters of many disciplines to decipher what specific traits differentiate themfrom amateurs or even less-skilled professionals (deGroot, 1978; Akin, 1990). Famous musiccomposers Mozart and Tchaikovsky describe creativity as coming randomly and unexpectedly,but experience and preparation are necessary to recognize the ideas as worth pursuing.Brilliant composers are defined by their previous knowledge and expertise, which allowsthem to recognize a creative idea and transform it into something beautiful (Akin, 1990).Similar to composers, chess grandmasters were found to recognize winning positions byremembering previous games and their results, rather than robotically evaluating all possiblemoves (deGroot, 1978). In the space of athletics, Ericsson et al. (2005) found that a return of atennis ball by elite athletes is subject to “skilled anticipation of events by identification of earlypredictive cues” rather than an improved reaction time. Just like composers, chess masters, andelite athletes, designers can utilize experiences with analogous design, or analogies with fieldsthat are different from that of the design problem (Gentner, 1988; Vosniadou and Ortony,1989). When experience does not provide sufficient inspiration, external inspiration (fromthe patent database, nature, or elsewhere) can be employed to serve a similar purpose. Thisapproach is known as design-by-analogy (DbA).
DbA is a tool for innovation that has gained much attention in engineering design research,not only because it has led to many breakthrough innovations [i.e., cockle burr-inspired fabricfastener, gecko-inspired non-chemical adhesive (Lee et al., 2007), and lotus leaf-inspired self-cleaning outdoor surface paint (Abbott and Ellison, 2008)] but also because designers use ana-logical reasoning to explain design concepts and at times predict potential problems(Christensen and Schunn, 2007). The process involves retrieving information or knowledgefrom one’s memory or from an external repository of existing design solutions (source), map-ping that information to one’s engineering design problem (target), and finally evaluating howwell the underlying relations match between the source and the target. The retrieval of analog-ical information, particularly from external sources, has been significantly studied using
Downloaded from https://www.cambridge.org/core. 13 Jul 2020 at 22:25:05, subject to the Cambridge Core terms of use.
computational support to facilitate DbA in practice. However,nearly all DbA tools to date have focused on a query-basedapproach for retrieving analogies, in which a user inputs a searchterm or query function and is returned a set of algorithmicallydetermined stimuli.
In this work, the analogical retrieval process is approachedfrom a more designer-controlled position, allowing designers toexplore a space of analogies that potentially holds useful and unex-pected inspiration, rather than be constrained by what is retrievedby a query-based algorithm. In contrast to keyword-basedsearches where patents containing those keywords are returned,the proposed approach enables designers to retrieve a collectionof patents that are related to topics of interest and explore aspace of potential inspiration, the way one would explore thebooks surrounding a particular call number on a shelf at thelibrary to find potential resources. With this research, we presenta computational tool called VISION [Visual Interaction tool forSeeking Inspiration based On Nonnegative Matrix Factorization(NMF)] that enables designers to visually explore a patent reposi-tory for analogical inspiration in a user-driven manner. Leveragingthe U.S. patent database as a source of inspiration, the computa-tional tool uses hierarchical NMF (Du et al., 2017) for topic mod-eling of patent data and D3.js (Bostock et al., 2011) for interactivedata visualization. D3.js is a JavaScript library used for turning arbi-trary data into an interactive data visualization. The technicalapproaches used for the creation of VISION are detailed in thispaper. In regard to the analogical retrieval process, we also charac-terize the effect of increasing data size (ranging from 100 to 3000patents) on two performance aspects of VISION – the clusteringquality of topic modeling results and the frame rate of interactivedata visualization – and discuss their implications on the waydesigners retrieve analogies using the visual interaction tool.
Background
In looking at professional designers, Fricke (1996) found threetraits that directly lead to positive design results: good spatial ima-gination, solid engineering knowledge, and the ability to recognizeand rank sub-problems. These three traits allow skilled designersto isolate good ideas from a series of options. Cross (2004) foundthat expert designers are solution-focused and narrow-minded,meaning that they follow a few key parallel ideas to completion(Razzouk and Shute, 2012). Expert designers also create moredetailed representations of the problem since they know exactlywhat information they need to evaluate potential solutions(Bjorklund, 2013). Novice designers, in contrast, are more likelyto attempt trial-and-error techniques (Ahmed et al., 2003)because they lack the experience necessary to cognitively evaluateideas prior to testing. How can a novice designer take advantageof nonexistent past experience? One way is to use analogies.
DbA studies
The use of analogies has been an active research area in the fieldsof cognitive science and engineering design. Researchers havecontributed to this area by understanding how the introductionof analogies affects the ideation process and outcomes (Dahland Moreau, 2002; Christensen and Schunn, 2005; Goldschmidtand Smolkov, 2006), with some studies specifically examininghow the representation and modality of information (Linseyet al., 2008) and analogies of different levels of applicability(Tseng et al., 2008) affect resultant generated design solutions.
A potential negative effect of introducing analogies and examplesis also examined in the exploration of design fixation (Janssonand Smith, 1991; Smith and Blankenship, 1991; Purcell andGero, 1996; Chrysikou and Weisberg, 2005), which occurs whena designer stubbornly clings to a single design when betterideas are available. Jansson and Smith (1991) showed that intro-ducing examples can lead designers to generate solutions thatmimic the examples, to the point of violating the design problemobjectives. Studies also focused on ways to mitigate the effect ofdesign fixation. The likelihood of fixation can be reduced bydesigners drawing inspiration, while they have an open goal, ora task that has yet to be completed (Tseng et al., 2008), or ifthey draw multiple ideas from multiple sources (Ullman, 2003).Fixation can also be reduced if the analogies are worded in avague and functional manner, as opposed to a precise and surface-level manner (Linsey et al., 2008; Atilola et al., 2016). This studyaims to develop a DbA tool that provides inspirational analogicalinformation to designers in a useful format, with the goal of indu-cing positive effects of analogies on ideation process and outcomes.
The analogies can be further explored with the concept ofnear-field and far-field analogies. Near-field analogies are gener-ally found in the same or similar domain and share a significantnumber of surface features with the target domain. Far-field ana-logies, on the other hand, tend to share few or no surface-levelsimilarities and usually come from completely different domains;these are often identified by concepts that look nothing alike butshare functional similarities (Fu et al., 2013b). For example,Gentner and Markman (1997) describe the concept of functionalsimilarities using Johannes Kepler’s analogy of the farther planetsorbiting the sun slower than nearer planets being analogous tolight shining brighter on nearby objects and dimmer on faraway objects. Light has zero physical similarity to planets inorbit, but the concept of the force acting over a distance anddecreasing as the square of the distance remains. Some researcherspoint to far-field analogies as being more useful for creativedesign (Gentner and Markman, 1997; Chan et al., 2011; Chiuand Shu, 2012; Goncalves et al., 2013). Other studies demonstratedthat far and near sources have equivalent effects (Malaga, 2000;Enkel and Gassmann, 2010) Similarly, Tseng et al. (2008) demon-strated that both far and near sources resulted in ideas of similarlevels of novelty. Fu et al. (2013b) showed that there is such athing as too far and the far-field analogies can result in lower nov-elty and quality of ideas than near-field analogies.
The analogies have also been explored with the concept ofsurface-similarity and functional-similarity. Fu et al. (2013a)explored the analogical relationships among patents using thefunctional content (verbs-only text) and surface content(nouns-only text) of patent documents. Their findings showthat the transfer of knowledge based on functional similaritiescan be extracted from the functional content of patent data andeven from its surface content as well, yielding insights into differ-ent interrelatedness of patents. As an extension of the work, wecreated hierarchical repositories of patents that are processed tocontain only component content (What specific componentshave been integrated in the system?), behavior content (Whatare the attributes of the system that describe how it behaves?),and material content (What materials does the system use or con-sume?) and evaluated their effect on the design process (Song andFu, 2019). These findings demonstrate that unique design insightscan arise from different representations of a patent dataset. Forinstance, patents are interrelated by their functional similaritiesin the component-based repository and by their descriptive
2 Hyeonik Song et al.
Downloaded from https://www.cambridge.org/core. 13 Jul 2020 at 22:25:05, subject to the Cambridge Core terms of use.

quality in the behavior-based repository. The patents in thematerial-based repository, however, exhibited weak interrelation-ships due to the limited material content in patent documents.The authors’ prior work of extracting different analogical relation-ships from patents provide a foundation for the DbA tool pre-sented in the current work.
Patent data as a source of inspiration
The U.S. patent database has been considered an ideal source forretrieving analogies during DbA (Kang et al., 2007). The U.S.patent database is a valuable source of innovation; it is largeand growing, and all successful patents must, by definition, benovel, non-obvious, and industrially applicable (WorldIntellectual Property Indicators, 2017). The U.S. Patent Officehad over 2.8 million patents in force (still legally enforced) in2016, plus all the millions of patents that have expired(Gentner, 1988; World Intellectual Property Indicators, 2017).The database grows continuously in a plethora of fields and pro-mises designers substantial opportunities to explore for inspira-tion in multiple domains. The patent database uses CooperativePatent Classification (CPC), which is a standard patent classifica-tion system, to categorize the patents into specific domains forefficient patent retrieval processes (Montecchi et al., 2013).There are over 250,000 CPC categories with which every patentpublication is assigned at least one classification term, indicatingits field of application and details of the design content. Also,patents are structurally well formed with distinct partitions andsections (abstract, description, and claims) that contain theembedded design information. The characteristics of the patentdatabase not only make it an ideal source of innovation butalso an efficient means for retrieving analogies.
Computational supports for DbA
In attempts to access the wealth of knowledge contained withinthe patent database, researchers have developed computationaltools to aid designers in retrieving patents for DbA. For instance,Murphy et al. developed a vector space model-based searchengine to create a function-based vector representation of patents.The system allows users to retrieve patent results that are relevantto the functional description of a given design problem (Murphy,2011). Fu et al. (2013a) employed latent semantic analysis andhierarchical Bayesian inference to structure the U.S. patent data-base for analogical retrieval purposes. Song and Luo (2017)used citations within patents and the listed inventors of patentsas a source of analogous relationships. Koch et al. (2011) createdPatViz, which allows for patent exploration using a visual analyticsystem to assist users in the iterative refinement of query searchresults of complex patent data and to enable user-generatedgraph views. The difference between PatViz and VISION pre-sented in this work is that PatViz uses the visual analytic systemto assist users in refining the patent search results, while VISIONuses an interactive data visualization technique to supportdesigners in the visual exploration of analogies in structuredpatent repositories.
Several researchers also focused on bio-inspired design or bio-mimicry, which is a particular kind of DbA, that uses nature as asource of inspiration to solve engineering design problems.SEABIRD is a tool for searching biological stimuli within largenatural-language biological databases (Vandevenne et al., 2016).Chakrabarti et al. (2005) developed a computational tool called
IDEA-INSPIRE, which uses inspiration from biological and arti-ficial systems to enable a systematic biomimetic search. The soft-ware is founded on the SAPPhiRE model, which represents thecausality between biological and artificial systems (Venkataramanand Chakrabarti, 2009; Keshwani and Chakrabarti, 2017). DANE(Design-by-Analogy to Nature Engine) provides a database con-taining Structure–Behavior–Function models of biological andengineering systems, in which users can search for design casesor author a new system in the library (Goel et al., 2012).AskNature is an open-source database for browsing biologicalinspiration that is categorized by their functional taxonomy(Deldin and Schuknecht, 2014). Alternative biomimetic tools aresummarized below:
• BioTRIZ identifies functional analogies using a biological TRIZcontradiction matrix (Vincent and Mann, 2002).
• In the Bioengineering space, BioPatentMiner creates a semanticweb of biologically related patents using biomedical dictionaries(Mukherjea et al., 2005).
• Engineering-to-Biology Thesaurus provides a translation ofengineering to biology at a functional level (Nagel et al., 2010).
• Cheong and Shu (2014) presented a causal-relation retrievalmethod in the bioengineering space.
• DRACULA is an analogy-finding algorithm and repositorybased on biomimicry (Lucero et al., 2016).
Many of the DbA and biomimetic tools reviewed here use aquery-based search, which requires a designer to input a queryfunction or a keyword to retrieve a set of stimuli that are deter-mined by the query algorithm. The query-based tools are usefulfor retrieving relevant analogies in an efficient manner.However, if little guidance is provided on how to input an appro-priate query, the algorithm may rule out analogies that are poten-tially useful for solving design problems. In a case of theWordTree DbA method (Linsey et al., 2012), which systematicallyuses the knowledge of designers and information in theWordNet1 database, it is important to derive the key problemdescriptors (query input) from functions and customer needs ofdesign problems to leverage the existing databases to identifypotential sources of analogies. Designers with limited experienceare more likely to attempt trial-and-error techniques to determineappropriate input queries (Ahmed et al., 2003). On the otherhand, methods that enable exploratory search enable designersto retrieve patents from a more user-controlled position, allowingthem to explore for other relevant yet unexpected sources of ana-logies, that are not initially determined by query inputs. We con-jecture that this type of interaction is more intuitive for designersand more thorough for the analogical retrieval process. With anexplorable patent repository and data visualization that enablesseveral user interaction capabilities, VISION enables designersto search for analogical inspiration in a user-tailored manner.VISION could help both novice and expert designers to retrievea collection of patents based on a topic of interest. Also, itcould assist inexperienced designers to explore other unexpectedspaces of potential inspiration that are determined by its topicmodeling method. These benefits are being evaluated scientificallyin a forthcoming controlled human subjects study. The followingsections describe computational approaches for the creation ofVISION.
1Please see https://wordnet.princeton.edu/
Artificial Intelligence for Engineering Design, Analysis and Manufacturing 3
Downloaded from https://www.cambridge.org/core. 13 Jul 2020 at 22:25:05, subject to the Cambridge Core terms of use.

Computational approaches
VISION (based on Nonnegative Matrix Factorization) is a visualinteraction tool for exploring analogical inspirations in the patentdatabase. The tool employs hierarchical NMF (Du et al., 2017) forthe topic modeling of patent data and D3.js (Bostock et al., 2011)for interactive data visualization.
Nonnegative matrix factorizationNMF is a topic modeling method by which data are analyzed(Paatero and Tapper, 1994; Kim and Park, 2008, 2011). It takesan original matrix and splits it into two separate matrices basedon localized features within the original. In mathematical terms,A ∈ Rm×n is the original nonnegative data matrix. W∈ Rm×k
and H∈ Rk×n are two daughter matrices such that k < n. TheNMF algorithm shown in Figure 1 solves the optimization prob-lem minW,H ‖A−WH‖2F , given Wij≥ 0 and Hij≥ 0 for each i andj (Pauca et al., 2004).
As the name implies, none of these features can be negative,forcing the algorithm to isolate features that can be addedtogether to remake the original image (Lee and Seung, 1999).NMF has been most notably used in facial recognition (Lee andSeung, 1999) and text mining (Pauca et al., 2004; Choo et al.,2013). NMF is particularly applicable to text mining becausewords can only appear in a document a positive number oftimes, which is the primary restraint of NMF. NMF is fasterthan other popular data analysis tools, such as latent semanticindexing and spectral clustering methods (Xu et al., 2003), andNMF provides more consistent results than latentdirichlet allocation (Cichocki and Phan, 2009; Choo et al., 2013;Greene et al., 2014). All of the literature up to this point consistsof a “flat” analysis. In other words, the NMF approach splits theoriginal matrix into two matrices with k topics. Either the user orsome algorithm has to define k, which can be inconsistent and/orrequire surplus processing. One solution is to pick an arbitraryvalue for k and run the program multiple times.
Kuang and Park proposed a solution to this problem. Insteadof performing extra analyses to determine the number of topics inthe original matrix, they created a hierarchy of NMF clusters, inwhich each cluster included k = 2 topics. This not only increasesthe speed of the calculation but also provides intermediate hierar-chical clusters to further sort the data (Kuang and Park, 2013; Limet al., 2018). This hierarchical NMF approach is employed here,with VISION.
Data visualizationThe data visualization tool used in this work called D3.js offerspowerful interactive capabilities. The following section gives abrief overview of the programming methods and tools thatmake up D3.js. First, it is a web-based platform, so we startwith the web itself.
The webThe World Wide Web (web) consists of pages and interactionsthat allow the user to view countless webpages. Each of thesepages consists of a Hypertext Markup Language (HTML) scriptthat provides an outline for the page. The user’s browser retrievesthe HTML file from the server and interprets the HTML informa-tion as an outline for what the page should look like (Murray,2017).
Hypertext Markup LanguageHTML “is the World Wide Web’s core markup language” (W3,2017). It controls the physical outline of the document, but canalso bring in other files to affect the user experience. This hierar-chy and ability to link to other files is known as the DocumentObject Model (DOM) (Philippe Le Hégaret et al., 2000; MozillaDeveloper, 2019).
Document Object ModelThe DOM allows improved readability and efficiency of theHTML code by allowing key aspects to be saved in separate filesthat are linked from the HTML hierarchy. Two key file formatsthat often accompany an HTML file are Cascading Style Sheets(CSS) and JavaScript (Duckett, 2010). These three formats(HTML, CSS, and JavaScript) make up the content, presentation,and behavior, respectively, of a document (Hyslop, 2010).
Cascading Style SheetsCSS provides the visual presentation of an HTML document suchas colors, sizes, and coordinates of texts, lines, and shapes(Murray, 2017).
JavaScriptJavaScript provides the functionality for an HTML document.While JavaScript and the DOM are closely related, and somewill mistakenly refer to them synonymously, they follow differentstandards and are distinct entities (Reid, 2013). WithoutJavaScript, the DOM would load once and display a static pageforever. JavaScript gives the user the ability to manipulate theDOM in real time (Murray, 2017). For a non-programmer,JavaScript by itself can be quite overwhelming. D3.js is one of aplethora of libraries designed to make data visualization inJavaScript easier for nonprofessional web developers.
Data-Driven Documents (D3.js)Written by Mike Bostock, Vadim Ogievetsky, and Jeff Heer in2011, D3.js is a JavaScript library designed to improve flexibilityand expressiveness in data visualization (Bostock et al., 2011).D3.js builds simple shapes (rectangles, lines, and circles) usingsimple commands, and the user puts those shapes together intothe format they want based on the data. The size, location,color, and other attributes of the shapes created with D3.js canbe mapped to the applicable data, as the user sees fit. This is sig-nificantly different from other visualization tools, which oftenprovide a number of pre-designed visualizations that the usercan choose from, with little to no customization available(Bostock and Heer, 2009).
Methods
Vision
There are three steps in the making of VISION. First, patent dataare clustered via hierarchical NMF. Second, a patent network is
Fig. 1. Decomposition of A into W and H matrices.
4 Hyeonik Song et al.
Downloaded from https://www.cambridge.org/core. 13 Jul 2020 at 22:25:05, subject to the Cambridge Core terms of use.

visually presented based on the clustering result. Third, user inter-action capabilities are enabled for data exploration. The secondand third steps are performed with D3.js, which uses HTML,CSS, and JavaScript code to turn the clustering data into an inter-active patent structure.
Topic modelingTopic modeling is implemented similar to Divide-and-ConquerNMF (DC-NMF) (Du et al., 2017). In the authors’ prior work,the topic modeling method was successfully implemented to clus-ter patent data by their semantic topics (Song and Fu, 2019). Ithas an advantage that it can efficiently process a large volumeof data and it does not rely on the selection of an appropriatetopic number k, which is considered a computational challengewhen applying flat NMF on a given corpus. The technique canbe illustrated by a binary hierarchy structure (see Fig. 2).
First, rank-2 NMF (NMF with k = 2) is performed on A divid-ing its columns into two submatrices A1 and A2. The rule is thatthe jth column of A gets assigned to A1 if H[1, j] >H[2, j] or viceversa. Note that this is equivalent to clustering documents intotwo groups by their semantic similarities. In the following steps,the same rank-2 NMF is performed on A1 and A2, and the itera-tion is continued until all output submatrices contain less than orequal to 10 documents (patents). This criterion differs from Duet al.’s scoring methods that select a cluster node to split whengrowing the hierarchy structure (Du et al., 2017); it could resultin overly clustered documents if an unnecessary iteration is per-formed on well-clustered documents or partially clustered docu-ments if the iteration is terminated too early. Yet, test runs haveshown that the current criterion produces clustering results inwhich a set of analogous patents (e.g. bow patents that are intention-ally chosen and included) are clustered together under a relevanttopic (label containing “archery”, “bow”, “bowstring”, and “draw”).
The iterative operation of the topic modeling has two impor-tant implications. First, similar patents belong to a leaf clusterat the end of all iterations. Second, the topic of the similar patentswithin the cluster is well represented by the topic of the leaf clus-ter. To understand the semantically meaningful topic of the clus-tered patents at the leaf level, individual leaf clusters are labeledwith five words, similar to the procedure followed by Fu et al.(2013a). Specifically, when the rank-2 NMF iterations are per-formed, five words are chosen that have the highest probabilistic
distribution in W[*, i] and those words are used to describe theith topic or cluster label. In this work, the top five words aredeemed the label terms (e.g. “w1”, “w2”, “w3”, “w4”, and “w5”),and a combination of those words are deemed the cluster label(e.g. “w1, w2, w3, w4, and w5”).
Prior to the topic modeling, the input word-document matrixof patent data is pre-processed to improve the clustering quality.The pre-processing includes the following steps:
• Parse abstract, claim, and description sections of patent docu-ments to capture words that characterize the patents’ designfeatures.
• Remove “stop words” and any words common to 90% or moreof the patents to emphasize the design contents of individualpatents. The 90% cutoff was chosen through experimentation.The common words determined in this work are “view”,“form”, “portion”, “general”, “apparatus”, “tool”, “method”,“example”, “device”, “time”, “number”, “posit”, and “body”.
• Perform an inverse entropy weighting to assign higher weightsto less common words and vice versa.
Data visualizationTo visualize a patent network, D3.js is used, which is a JavaScriptlibrary that is useful for generating an interactive data visualization(Bostock et al., 2011). Its flexible design framework enables a widerange of functionalities and styles in web browsers. In addition, itscapability of executing a dynamic animation enables smooth dataexploration. VISION represents the patent network in a node-linkdiagram, in which the displayed nodes are patents and label terms.The visualization of the network includes the following steps:
1. For individual patents, identify their cluster labels at the leaflevel.
2. Draw and connect patent nodes to their label term nodes.Since a patent’s label consists of five terms, every patentnode connects to five label term nodes. In the visualization,the label term nodes are displayed as a “blue cross”, whilepatent nodes are displayed as “circle” and color coded bytheir CPC sections.
The node-link diagram was visualized using D3.js’s force lay-out. The force layout uses a physics-based simulator to position
Fig. 2. Illustration of rank-2 NMF iterations.
Artificial Intelligence for Engineering Design, Analysis and Manufacturing 5
Downloaded from https://www.cambridge.org/core. 13 Jul 2020 at 22:25:05, subject to the Cambridge Core terms of use.

node and link elements in a visualization space (e.g. planets in thesolar system). The node element has a “gravitational force” thatmakes nodes repel one another but attract to a center of gravity.The link element connects the nodes together, positioning thenode elements at a fixed distance, thus preventing the expulsionof the nodes. When all patent nodes are connected to their corre-sponding five label term nodes under these circumstances, thesimulator generates a patent network in which patents are clus-tered by their label terms; the location and mobility of the patentnodes are restrained by their links, while the proximity of thepatent nodes is determined by the number of label terms thatthe patents share in common. Such a clustering method is usefulin that the label terms are also part of the visualized structure thata designer can interact with.
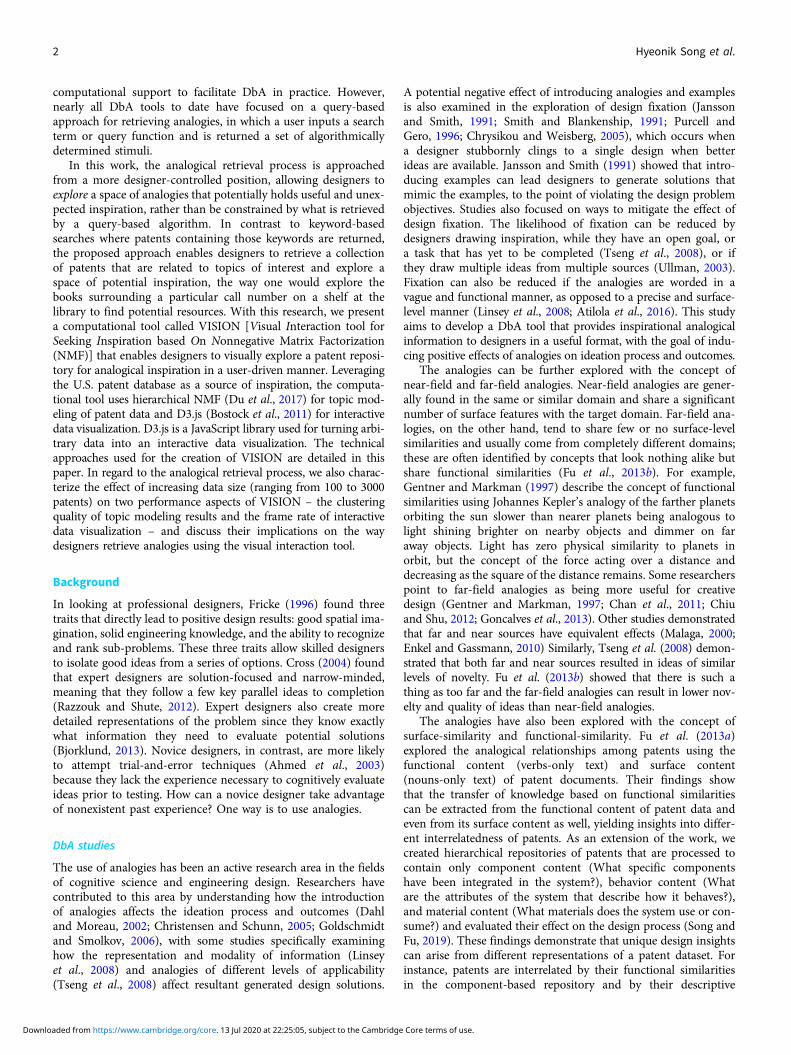
Supported user interactionsEven though the data visualization provides a meaningful repre-sentation of the patent network, it is nontrivial to support a setof user interactions for practical data exploration. The supporteduser interactions are as follows: (a) switching lenses, (b) filteringpatents by label terms and CPC sections, (c) searching nodes bykeywords, (d) highlighting adjacent nodes, and (e) accessingonline patent documents. We describe each of the supporteduser interactions below (see Figs. 3, 4):
(a) Switching lenses: A designer may have different lensesthrough which she seeks inspirations. The various lensesmay include engineering principles (What engineering prin-ciple does the system rely in order to work?), components(What specific components have been integrated to the sys-tem?), and behaviors (What are the attributes of the systemthat describe how it behaves?). These lenses are used to influ-ence the way the patent data are structured, allowing thedesigner to re-represent the patent network. The multiplerepresentations facilitate the patent retrieval process, as thedesigner explores the patent database along the proposed ana-logical properties. Various design insights can arise from the
unique representations of the design repository (Song and Fu,2019). This procedure is achieved by processing the word-document matrix of patent data. For instance, an engineeringprinciple-based patent network is created by clustering patentdata that are processed to contain only engineering terms[extracted from a glossary of engineering (Hanifan, 2014)].For more detail about how different structural representationsof patent data were created, see Song and Fu (2019).
(b) Filtering patents by label terms and CPC sections: The largedataset size and several edge crossings (geometric intersec-tions of two or more edges) of the network can impose achallenge to a designer navigating around the spatial data.If the designer attempts to understand the semantic connec-tions between patents in the large (unfiltered) structure, itwould require extensive recalling and processing of informa-tion. Thus, the designer is able to filter patents by their labelterms and CPC sections. The designer can use a top-down(starting with a full network then removing patents) orbottom-up (starting with an empty network then addingpatents) method to scale down the patent structure.
(c) Locating a specific node in the structure: A designer can locatea specific node (patent or label term) in the structure using akeyword in an autocompleting search box. While the tool ismeant to facilitate exploration, query-based searching isenabled for added convenience.
(d) Highlighting adjacent nodes: A designer can select a node(patent or label term) to highlight its adjacent nodes. Forexample, the designer can select a patent to view its labelterms. Or, the designer can select a label term to view itslinked patents.
(e) Accessing online patent documents: A designer can select apatent node to access the online patent document to reviewthe technology for design inspiration.
The user interaction capabilities of VISION assist designers insearching for and retrieving patents in a user-driven manner. Ademonstration of the tool’s usage is presented here. The designer
Fig. 3. Supported user interactions in VISION – (a) switching lenses, (b) filtering patents by label terms and/or CPC sections, and (c) searching nodes by keywords.
6 Hyeonik Song et al.
Downloaded from https://www.cambridge.org/core. 13 Jul 2020 at 22:25:05, subject to the Cambridge Core terms of use.
first chooses a lens (engineering principle, component, or behav-ior) that influences the structure of the patent network allowingher to focus on analogies characterized by the lens. The designerswitches between the provided lenses to explore more effectiverepresentation of the patent data or opt out any lens to view afull text-based patent network. After selecting a lens, the designernavigates through the network using drag and zoom to view thestructure from different viewpoints and tooltips to view titles ofnodes that are hovered over. The basic user interface elementsare supported by VISION for added convenience. Next, thedesigner can perform a keyword search to locate a specific labelterm node in the network. The keyword can be a single word(engineering principle, component, behavior, or action verb)derived from a design problem’s customer needs and functionalrequirements (Linsey et al., 2012). After locating the node, thedesigner can click on the label term node to view its linkedpatents. From there, the designer can select a patent node to high-light its other associated label terms uncovering more keywordsrelevant to the design problem. Alternatively, the designer cantry a new keyword search to explore different regions on thepatent network. Also, the designer can select (shift click) thepatent node to view the full patent text and images (if available)online. If the designer finds it challenging to search patents inthe full unfiltered structure, she may apply filters on label termsand CPC sections to view only patents that are relevant to thedesign problem.
Results of the performance test
Scaling up the patent dataset size is deemed useful, as it offersmore opportunities for discovering inspiration. However, thisraises the question of whether there exists any tradeoff – when,if ever, does the dataset become too big? To address this question,patent repositories of different sizes are generated, and two per-formance aspects of VISION are examined – clustering qualityand frame rate.
Full patent data
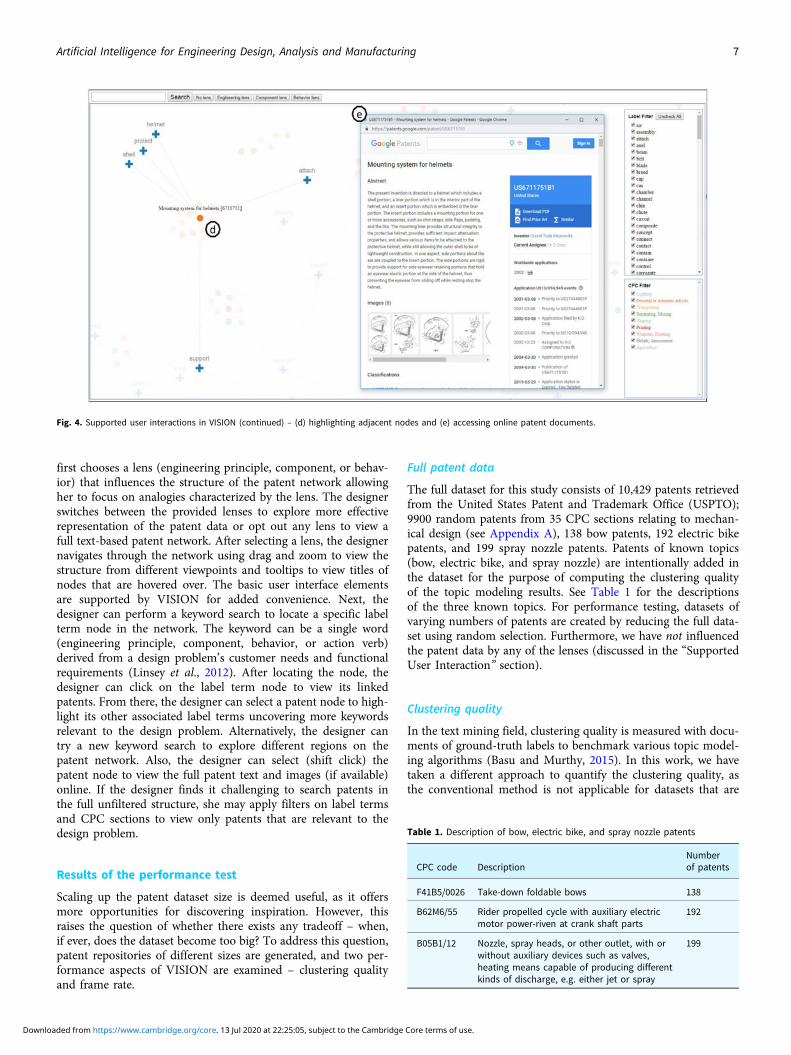
The full dataset for this study consists of 10,429 patents retrievedfrom the United States Patent and Trademark Office (USPTO);9900 random patents from 35 CPC sections relating to mechan-ical design (see Appendix A), 138 bow patents, 192 electric bikepatents, and 199 spray nozzle patents. Patents of known topics(bow, electric bike, and spray nozzle) are intentionally added inthe dataset for the purpose of computing the clustering qualityof the topic modeling results. See Table 1 for the descriptionsof the three known topics. For performance testing, datasets ofvarying numbers of patents are created by reducing the full data-set using random selection. Furthermore, we have not influencedthe patent data by any of the lenses (discussed in the “SupportedUser Interaction” section).
Clustering quality
In the text mining field, clustering quality is measured with docu-ments of ground-truth labels to benchmark various topic model-ing algorithms (Basu and Murthy, 2015). In this work, we havetaken a different approach to quantify the clustering quality, asthe conventional method is not applicable for datasets that are
Fig. 4. Supported user interactions in VISION (continued) – (d) highlighting adjacent nodes and (e) accessing online patent documents.
Table 1. Description of bow, electric bike, and spray nozzle patents
CPC code DescriptionNumberof patents
F41B5/0026 Take-down foldable bows 138
B62M6/55 Rider propelled cycle with auxiliary electricmotor power-riven at crank shaft parts
192
B05B1/12 Nozzle, spray heads, or other outlet, with orwithout auxiliary devices such as valves,heating means capable of producing differentkinds of discharge, e.g. either jet or spray
199
Artificial Intelligence for Engineering Design, Analysis and Manufacturing 7
Downloaded from https://www.cambridge.org/core. 13 Jul 2020 at 22:25:05, subject to the Cambridge Core terms of use.

randomly generated. First, topic modeling was performed onpatent data that contain a number of known patents (e.g. bowpatents). Then, the percentage of the known patents that are prop-erly labeled was computed, for example, patents whose clusterlabels contain three or more terms that characterize its knowntopic. For example, a bow patent is properly labeled if its clusterlabel contains “archery”, “bow”, and “limb”. Table 2 shows the fulllist of words (compiled from test runs of the topic modeling) that
characterize each topic. The measured percentage value is used torepresent the clustering quality, in which 1 means that all analogouspatents (that are intentionally added) in the dataset are labeled withtheir predefined characterizing terms (in Table 2) and 0 means thatnone of the analogous patents are labeled properly.
From the full dataset, patents were randomly selected to createsmaller datasets of different sizes (100, 200, 300, 500, 800, 1000,1500, 2000, and 3000 patents) containing different proportions(2%, 3%, and 4%) or fixed numbers (20, 30, and 40) of eitherbow, electric bike, or spray nozzle known patents. This resultedin 162 combinations of patent data. For each combination, thetopic modeling was run on 10 unique patent datasets to computethe mean of the nondeterministic clustering results. The cluster-ing quality of datasets containing the topics of unique character-istics and varying proportions was examined to determinewhether the results are consistent for different cases.
Figure 5 shows the clustering quality for datasets that contain aproportional number (e.g. 2%, 3%, and 4%) of known patents. Theclustering quality is relatively low for smaller datasets (<500patents) but improves with increasing data size. It remains
Table 2. List of words to characterize bow, electric bike, and spray nozzlepatents
Topic Characterizing terms
Bow Archery, bow, bowstring, draw, elongate, extend, handle,limb, pivot
Electricbike
Axle, battery, bicycle, electric, gear, motor, power, rotate,shaft, sprocket, transmission, wheel
Spraynozzle
Dispense, flow, fluid, inject, liquid, nozzle, passage,pressure, sleeve, spray, stream, temperature, valve, water
Fig. 5. Clustering quality of datasets containing a pro-portional number of bow patents (top), electric bikepatents (middle), and spray nozzle patents (bottom).
8 Hyeonik Song et al.
Downloaded from https://www.cambridge.org/core. 13 Jul 2020 at 22:25:05, subject to the Cambridge Core terms of use.

constant at 0.6–0.7 for larger datasets (>500 patents). The trend ispresent in all datasets except for those that contain higher propor-tions (3% and 4%) of electric bike patents. On the contrary,Figure 6 shows the decreasing clustering quality for datasetsthat contain a fixed number of known patents. Again, datasetsthat contain electric bike patents exhibit different results, inwhich the clustering quality is consistent with varying data size.
Frame rate
For an interactive visualization tool, a smooth animation isimportant as a designer navigates around the spatial data. Thequality of the animation was characterized by measuring theframe rate of the interactive visualization tool. Frame rate orframe per second (fps) measures the number of unique framesthat a video game, film, or displayed screen captures in a unit sec-ond. Generally, a video game is played at 60 fps and a movie filmis displayed at 24 fps (Sarkar, 2014).
The frame rate was measured using Google Chrome’sDevTools, which allows developers to run a built-in performanceanalysis to diagnose, debug, and improve web pages. The perfor-mance analysis was run using the “start profiling and reload page”function, which automatically records the performance of the web
page, as the page reloads. Although this does not record the framerate during the actual user interaction, this function was used forconsistent data collection throughout the multiple runs. In thisexperiment, the mean frame rate values are reported, which is atotal number of frames divided by a duration of recorded time.
From the full dataset, datasets of different sizes (10, 50, 100,200, 300, 500, 800, 1000, 1500, 2000, and 3000 patents) were ran-domly selected, and the frame rates were measured with compu-ters of varying performance specs; Computer 1 (i7-6700 Intelprocessor; CPU @ 3.4 GHz 3.41 GHz; 32 GB RAM), Computer2 (i7-4790 Intel processor; CPU @ 3.6 GHz 3.6 GHz; 16 GBRAM), and Computer 3 (i5-6300U Intel processor; CPU @2.4 GHz 2.5 GHz; 8 GB RAM).
Figure 7 shows that the frame rate decreases exponentially withincreasing data size. The decline was larger for lower performancecomputers. The frame rate drops below 24 fps at approximately250 patents for the highest performance computer and dropsbelow 24 fps at 200 patents for the lower performance computers.
Discussion
In the performance test, the effects of dataset size on differentaspects of VISION are examined. First, the clustering quality is
Fig. 6. Clustering quality of datasets containing a fixednumber of bow patents (top), electric bike patents(middle), and spray nozzle patents (bottom).
Artificial Intelligence for Engineering Design, Analysis and Manufacturing 9
Downloaded from https://www.cambridge.org/core. 13 Jul 2020 at 22:25:05, subject to the Cambridge Core terms of use.

measured to examine the value of information provided by thetopic modeling. Second, the frame rate is measured to examinethe fluency of communicating information of the visualizationtool. In this section, the results of the analysis and their implica-tions on the usability of VISION are discussed.
Clustering quality
Figures 5 and 6 exhibit opposing clustering results for the samedataset size. To reiterate, the former shows increasing clusteringquality for datasets containing a proportional number of similarpatents, and the latter shows decreasing clustering quality fordatasets containing a fixed number of similar patents. The findingimplies that the clustering quality depends on not only the datasetsize but also its composition. Considering that the user is morelikely to explore a dataset containing probabilistically distributedtopics, we argue that Figure 5 depicts more practical clusteringresults. In Figure 5, the clustering quality improves logarithmicallywith increasing dataset size. The dataset needs to be big enoughfor the topic modeling to recognize similar patents. However,when the dataset becomes too big containing more randompatents, the positive effect is canceled out; Figure 6 shows thatthe clustering quality diminishes, as the portion of randompatents in the dataset increases. Also, it is important to notethat the size of the standard error bars diminishes with increasingdataset size. This implies that the consistency of the clusteringresult improves, as the dataset size increases.
Frame rate
The exponential decrease of the frame rate implies that the “jerki-ness” (lack of smoothness) of the visualization is inevitable withlarge-scale patent datasets (see Fig. 7). The interruption candiminish the user’s ability to navigate around the patent structure,which involves an iterative reconstruction of the informationspace (Bederson and Boltman, 1998). In theory, a designer canimprove the frame rate by scaling down the network using theproposed filtering method. However, we have not observed anotable improvement in the frame rate for the reduced patentstructure in the follow-up experiments. Perhaps, a further compu-tational improvement is needed to address the deficiency in thevisualization tool. Note that the analysis does not evaluate the rec-ommended frame rate for a visual interaction purpose. In futurestudies, it would be interesting to examine how the tool’s frame
rate affects the user’s ability to explore spatial data for not justretrieving information but also gaining inspiration.
Summary
These results taken all together suggest that there are tradeoffs andusability issues if the dataset size is too large or too small. Whenthe dataset size is too small, there are theoretically fewer opportu-nities for discovering useful inspirations from various disparatefields of patent data (near and far domains). Also, it is likelythat the tool will exhibit more randomized and inconsistent clus-tering results. On contrary, if the dataset size is too large, thetool’s low frame rate can affect the designer’s ability to understandand recall information. Moreover, the vast information is difficultto understand without support for user interaction or automatedtools. Our findings suggest that increasing the dataset size is notalways beneficial for data exploration in DbA practice. It requiresimproved computational methods and environments that cansupport the fluent communication between the designer and thecomputational design repository. Research efforts to address themining of large-scale data include Glier et al.’s work, whichexplored automated text classification to filter text passages thatare more relevant to the design problem at hand (Glier et al.,2014) and Keshwani and Chakrabarti’s work to automaticallyclassify natural-language descriptions of analogies into theSAPPhiRE model (Keshwani and Chakrabarti, 2017).
It is important to note that the results in this work are depen-dent upon the patent data, the computational environment inwhich the analysis was conducted, and VISION, the visual inter-action tool used in this study. Nevertheless, this study’s contribu-tion is that it challenges the notion that unbridled scaling up ofthe size of the design repository can only be beneficial for disco-vering more inspirations. In future studies, we hope to extend thecurrent work to develop computational methods for evaluatingthe performance of visual interaction tools and ultimately developimproved visual interactive DbA tools for designers.
Conclusion and future work
In this work, we present VISION, an interactive visualization toolwith which designers can explore for inspiration using patentdata. To achieve this, a patent structure is visualized with theresult of hierarchical NMF-based topic modeling, and supportfor user interactions is implemented to assist data exploration.
Fig. 7. Frame rate measured with computers of differ-ent performance specifications.
10 Hyeonik Song et al.
Downloaded from https://www.cambridge.org/core. 13 Jul 2020 at 22:25:05, subject to the Cambridge Core terms of use.

Next, a performance analysis is presented in which the perfor-mance of VISION is evaluated with patent datasets of varioussizes. The study suggests that scaling up of the size of the designrepository is not always beneficial for exploring for inspiration inpatent data. The computational approach for building theexploration-based DbA tool and the evaluation of the tool inregard to its performance for different data sizes provide a valu-able basis to develop an automated visual interaction tool for sup-porting innovative idea generation.
In future work, VISION will be tested in human subjects stud-ies to ascertain its value in the design process, including its impacton design output quality and novelty during early stage ideation(Shah et al., 2003). The study will focus on understanding howdesigners search for analogies in the exploratory repository andevaluate what factors determine the retrieval of source analogyand mapping between the source analogy and an engineeringdesign problem. VISION will be assessed in comparison withthe state-of-the-art patent search engine to determine how theinteractive data visualization affects designers’ search strategies.
Acknowledgements. This work is supported by the National ScienceFoundation, under grant CMMI 1663204. The United States Governmentretains, and by accepting the article for publication, the publisher acknowl-edges that the United States Government retains, a non-exclusive, paid-up,irrevocable, worldwide license to publish or reproduce the published form ofthis work, or allow others to do so, for United States Government purposes.
References
Abbott A and Ellison M (2008) Biologically inspired textiles. BiologicallyInspired Textiles, 1–219. doi:10.1533/9781845695088.
Ahmed S, Wallace K and Blessing L (2003) Understanding the differencesbetween how novice and experienced designers approach design tasks.Research in Engineering Design 14, 1–11. doi:10.1007/s00163-002-0023-z.
Akin Ö (1990) Necessary conditions for design expertise and creativity. DesignStudies 11, 107–113. doi:10.1016/0142-694X(90)90025-8.
Atilola O, Tomko M and Linsey JS (2016) The effects of representation onidea generation and design fixation: a study comparing sketches and func-tion trees. Design Studies 42, 110–136. doi:10.1016/j.destud.2015.10.005.
Basu T and Murthy CA (2015) A similarity assessment technique for effectivegrouping of documents. Information Sciences 311, 149–162. doi:10.1016/j.ins.2015.03.038.
Bederson B and Boltman A (1998) Does Animation Help Users Build MentalMaps of Spatial Information? College Park, MD: Human-ComputerInteraction Laboratory, Institute for Advanced Computer Studies.
Bjorklund TA (2013) Initial mental representations of design problems: differ-ences between experts and novices. Design Studies 34, 135–160.doi:10.1016/j.destud.2012.08.005.
Bostock M and Heer J (2009) Provis: a graphical toolkit for visualization.IEEE Transactions on Visualization and Computer Graphics 15, 1121–1128. doi: 10.1109/TVCG.2009.174
Bostock M, Ogievetsky V and Heer J (2011) D(3): data-driven documents.IEEE Transactions on Visualization and Computer Graphics 17, 2301–2309. doi:10.1109/TVCG.2011.185.
Chakrabarti A, Sarkar P, Leelavathamma B and Nataraju BS (2005) A func-tional representation for aiding biomimetic and artifical inspiration of newideas. Artificial Intelligence for Engineering Design, Analysis andManufacturing 19, 113–132. doi:10.1017/S0890060405050109.
Chan J, Fu K, Schunn C, Cagan J, Wood K and Kotovsky K (2011) On thebenefits and pitfalls of analogies for innovative design: ideation perfor-mance based on analogical distance, commonness, and modality of exam-ples. Journal of Mechanical Design 133, 081004. doi:10.1115/1.4004396.
Cheong H and Shu LH (2014) Retrieving causally related functions fromnatural-language text for biomimetic design. Journal of MechanicalDesign 136, 081008. doi:10.1115/1.4027494.
Chiu I and Shu LH (2012) Investigating effects of oppositely related semanticstimuli on design concept creativity. Journal of Engineering Design 23, 271–296. doi:10.1080/09544828.2011.603298.
Choo J, Lee C, Reddy CK and Park H (2013) UTOPIAN: user-driven topicmodeling based on interactive nonnegative matrix factorization. IEEETransactions on Visualization and Computer Graphics 19, 1992–2001.doi:10.1109/TVCG.2013.212.
Christensen BT and Schunn CD (2005) Spontaneous access and analogicalincubation effects. Creativity Research Journal 17, 207–220. doi:10.1207/s15326934crj1702&3_7.
Christensen BT and Schunn CD (2007) The relationship of analogicaldistance to analogical function and preinventive structure: the case ofengineering design. Memory & Cognition 35, 29–38. doi:10.3758/Bf03195939.
Chrysikou EG and Weisberg RW (2005) Following the wrong footsteps: fixa-tion effects of pictorial examples in a design problem-solving task. Journalof Experimental Psychology: Learning Memory and Cognition 31, 1134–1148. doi:10.1037/0278-7393.31.5.1134.
Cichocki A and Phan AH (2009) Fast local algorithms for large scale nonne-gative matrix and tensor factorizations. IEICE Transactions onFundamentals of Electronics Communications and Computer SciencesE92a, 708–721. doi:10.1587/transfun.E92.A.708.
Cross N (2004) Expertise in design: an overview. Design Studies 25, 427–441.doi:10.1016/j.destud.2004.06.002.
Dahl DW and Moreau P (2002) The influence and value of analogical think-ing during new product ideation. Journal of Marketing Research 39, 47–60.doi:10.1509/jmkr.39.1.47.18930.
deGroot A (1978) Thought and Choice in Chess, 2nd edn. The Hague, TheNetherlands: Mouton Publishers.
Deldin J and Schuknecht M (2014) The AskNature database: enabling solu-tions in biomimetic design. Biologically Inspired Design, 17–27.doi:10.1007/978-1-4471-5248-4_2.
Du RD, Kuang D, Drake B and Park H (2017) DC-NMF: nonnegative matrixfactorization based on divide-and-conquer for fast clustering and topicmodeling. Journal of Global Optimization 68, 777–798. doi:10.1007/s10898-017-0515-z.
Duckett J (2010) Beginning HTML, XHTML, CSS, and JavaScript. Hoboken,NJ: Wiley.
Enkel E and Gassmann O (2010) Creative imitation: exploring the case ofcross-industry innovation. R&D Management 40, 256–270. doi:10.1111/j.1467-9310.2010.00591.x.
Ericsson KA, Nandagopal K and Roring R (2005) Giftedness viewed fromthe expert-performance perspective. Journal for the Education of theGifted 28, 287. doi:10.4219/jeg-2005-335.
Fricke G (1996) Successful individual approaches in engineering design.Research in Engineering Design – Theory Applications and ConcurrentEngineering 8, 151–165. doi:10.1007/Bf01608350.
Fu K, Cagan J, Kotovsky K and Wood K (2013a) Discovering structure indesign databases through functional and surface based mapping. Journalof Mechanical Design 135, 031006. doi:10.1115/1.4023484.
Fu K, Chan J, Cagan J, Kotovsky K, Schunn C and Wood K (2013b) Themeaning of “near” and “far”: the impact of structuring design databasesand the effect of distance of analogy on design output. Journal ofMechanical Design 135, 021007. doi:10.1115/1.4023158.
Gentner D (1988) Structure-Mapping: A Theoretical Framework for Analogy.Cognitive Sciecne 7, 155–170. https://doi.org/10.1016/S0364-0213(83)80009-3
Gentner D and Markman AB (1997) Structure mapping in analogy and simi-larity. American Psychologist 52, 45–56. doi:10.1037/0003-066x.52.1.45.
Glier MW, McAdams DA and Linsey JS (2014) Exploring automated textclassification to improve keyword corpus search results for bioinspireddesign. Journal of Mechanical Design 136, 111103. doi:10.1115/1.4028167.
Goel AK, Vattam S, Wiltgen B and Helms M (2012) Cognitive, collaborative,conceptual and creative – four characteristics of the next generation ofknowledge-based CAD systems: a study in biologically inspired design.Computer-Aided Design 44, 879–900. doi:10.1016/j.cad.2011.03.010.
Goldschmidt G and Smolkov M (2006) Variances in the impact of visualstimuli on design problem solving performance. Design Studies 27, 549–569. doi:10.1016/j.destud.2006.01.002.
Artificial Intelligence for Engineering Design, Analysis and Manufacturing 11
Downloaded from https://www.cambridge.org/core. 13 Jul 2020 at 22:25:05, subject to the Cambridge Core terms of use.

Goncalves M, Cardoso C and Badke-Schaub P (2013) Inspiration peak:exploring the semantic distance between design problem and textualinspirational stimuli. International Journal of Design Creativity andInnovation 1, 215–232. doi:10.1080/21650349.2013.799309.
Greene D, O’Callaghan D and Cunningham P (2014) How Many Topics?Stability Analysis for Topic Models, Vol. 8724. Berlin, Heidelberg: Springer.
Hanifan R (ed.) (2014) Concise Dictionary of Engineering: A Guide to the Languageof Engineering. Cham, Switzerland: Springer International Publishing.
Hyslop B 2010) HTML Basics. In Wimpsett K (ed.), The HTML Pocket Guide.Berkeley, CA: Peachpit Press.
Jansson DG and Smith SM (1991) Design fixation. Design Studies 12, 3–11.doi:10.1016/0142-694X(91)90003-F.
Kang IS, Na SH, Kim J and Lee JH (2007) Cluster-based patent retrieval.Information Processing & Management 43, 1173–1182. doi:10.1016/j.ipm.2006.11.006.
Keshwani S and Chakrabarti A (2017) Towards automatic classification ofdescription of analogies into SAPPhIRE constructs. Research into Designfor Communities 2, 643–655. doi:10.1007/978-981-10-3521-0_55.
Kim J and Park H (2008) Toward faster nonnegative matrix factorization: anew algorithm and comparisons. ICDM 2008: Proceedings of Eighth IEEEInternational Conference on Data Mining, pp. 353–362. doi:10.1109/Icdm.2008.149.
Kim J and Park H (2011) Fast nonnegative matrix factorization: anactive-set-like method and comparisons. SIAM Journal on ScientificComputing 33, 3261–3281. doi:10.1137/110821172.
Koch S, Bosch H, Giereth M and Ertl T (2011) Iterative integration of visualinsights during scalable patent search and analysis. IEEE Transactions onVisualization and Computer Graphics 17, 557–569. doi:10.1109/Tvcg.2010.85.
Kuang D and Park H (2013) Fast rank-2 nonnegative matrix factorization forhierarchical document clustering. Paper Presented at the Proceedings ofthe 19th ACM SIGKDD International Conference on Knowledge Discoveryand Data Mining, Chicago, IL, USA. pp. 739–747, https://doi.org/10.1145/2487575.2487606
Lee DD and Seung HS (1999) Learning the parts of objects by non-negativematrix factorization. Nature 401, 788–791. doi:10.1038/44565.
Lee H, Lee BP andMessersmith PB (2007) A reversible wet/dry adhesive inspiredby mussels and geckos. Nature 448, 338–341. doi:10.1038/nature05968.
Lim W, Du R and Park H (2018) CoDiNMF: co-clustering of directed graphsvia NMF. Proceedings of the Thirty-Second {AAAI} Conference on ArtificialIntelligence, (AAAI-18), the 30th innovative Applications of ArtificialIntelligence (IAAI-18), and the 8th {AAAI} Symposium on EducationalAdvances in Artificial Intelligence (EAAI-18), New Orleans, Louisiana,USA, February 2-7, 2018,pp. 3611-3618
Linsey JS, Wood KL and Markman AB (2008) Modality and representation inanalogy. Ai Edam-Artificial Intelligence for Engineering Design Analysis andManufacturing 22, 85–100. doi:10.1017/S0890060408000061.
Linsey JS, Markman AB and Wood KL (2012) Design by analogy: a study ofthe WordTree method for problem re-representation. Journal of MechanicalDesign 134, 041009. doi:10.1115/1.4006145.
Lucero B, Turner CJ and Linsey J (2016) Design repository & analogy com-putation via unit language analysis (DRACULA) repository development.International Design Engineering Technical Conferences and Computersand Information in Engineering Conference, 2015, Vol. 1a.
Malaga RA (2000) The effect of stimulus modes and associative distance inindividual creativity support systems. Decision Support Systems 29, 125–141. doi:10.1016/S0167-9236(00)00067-1.
Montecchi T, Russo D and Liu Y (2013) Searching in Cooperative PatentClassification: comparison between keyword and concept-based search.Advanced Engineering Informatics 27, 335–345. doi:10.1016/j.aei.2013.02.002.
Mozilla Developer (2019) Introduction to the DOM. Retrieved from https://developer.mozilla.org/enUS/docs/Web/API/Document_Object_Model/Introduction
Mukherjea S, Bamba B and Kankar P (2005) Information retrieval andknowledge discovery utilizing a biomedical patent semantic Web. IEEETransactions on Knowledge and Data Engineering 17, 1099–1110.doi:10.1109/Tkde.2005.130.
Murphy J (2011) Patent-Based Analogy Search Tool for Innovative ConceptGeneration (PhD). The University of Texas at Austin, Austin, TX.
Murray S (2017) Interactive Data Visualization for the Web: An Introductionto Designing with D3, 2nd edn. Beijing; Boston: O’Reilly.
Nagel JKS, Stone RB and McAdams DA (2010) An engineering-to-biologythesaurus for engineering design. Proceedings of the ASME InternationalDesign Engineering Technical Conferences and Computers andInformation in Engineering Conference, December 2010, Vol. 5, pp. 117–128.
Paatero P and Tapper U (1994) Positive matrix factorization – a nonnegativefactor model with optimal utilization of error-estimates of data values.Environmetrics 5, 111–126. doi:10.1002/env.3170050203.
Pauca VP, Shahnaz F, Berry MW and Plemmons RJ (2004) Text miningusing non-negative matrix factorizations. Proceedings of the Fourth SIAMInternational Conference on Data Mining, pp. 452–456.
Philippe Le Hégaret WC, Wood L, SoftQuad Software Inc., WG Chair andJonathan Robie (2000). What is the document object model? Retrievedfrom https://www.w3.org/TR/DOM-Level-2-Core/introduction.html
Purcell AT and Gero J (1996) Design and other types of fixation. DesignStudies 17, 363–383. doi:10.1016/S0142-694X(96)00023-3.
Razzouk R and Shute V (2012) What is design thinking and why is it impor-tant?. Review of Educational Research 82, 330–348. doi:10.3102/0034654312464201.
Reid J (2013) JavaScript Programmer’s Reference. Berkeley, CA: Apress.Imprint: Apress.
Sarkar S (2014) Why frame rate and resolution matter: a graphics primer.Retrieved from https://www.polygon.com/2014/6/5/5761780/frame-rate-resolution-graphics-primer-ps4-xbox-one
Shah JJ, Vargas-Hernandez N and Smith SM (2003) Metrics for measuringideation effectiveness. Design Studies 24, 111–134. doi:10.1016/S0142-694X(02)00034-0.
Smith SM and Blankenship SE (1991) Incubation and the persistence of fixa-tion in problem-solving. American Journal of Psychology 104, 61–87.doi:10.2307/1422851.
Song H and Fu K (2019) Design-by-analogy: exploring for analogical inspira-tion with behavior, material, and component-based structural representa-tion of patent databases. Journal of Computing and Information Sciencein Engineering 19, 021014. doi:10.1115/1.4043364.
Song B and Luo J (2017) Mining patent precedents for data-driven design: thecase of spherical rolling robots. Journal of Mechanical Design 139, 111420.doi:10.1115/1.4037613.
Tseng I, Moss J, Cagan J and Kotovsky K (2008) The role of timing and ana-logical similarity in the stimulation of idean generation in design. DesignStudies 29, 203–221.
Ullman D (2003) The Mechanical Design Process, 3rd edn. Boston, MA:McGraw-Hill.
Vandevenne D, Verhaegen PA, Dewulf S and Duflou JR (2016) SEABIRD:scalable search for systematic biologically inspired design. AiEdam-Artificial Intelligence for Engineering Design Analysis andManufacturing 30, 78–95. doi:10.1017/S0890060415000177.
Venkataraman S and Chakrabarti A (2009) SAPPhIRE: an approach to anal-ysis and synthesis, Proceedings of ICED 09, the 17th InternationalConference on Engineering Design, vol.2, pp. 417-428
Vincent JFV and Mann DL (2002) Systematic technology transfer from biol-ogy to engineering. Philosophical Transactions of the Royal Society ofLondon Series A – Mathematical Physical and Engineering Sciences 360,159–173. doi:10.1098/rsta.2001.0923.
Vosniadou S and Ortony A (1989) Similarity and Analogical Reasoning.Cambridge, New York: Cambridge University Press.
W3 (2017) HTML 5.2. Retrieved from https://www.w3.org/TR/2017/REC-html52-20171214/
World Intellectual Property Indicators (2017) Geneva, Switzerland: WorldIntellectual Property Organization, https://www.wipo.int/edocs/pubdocs/en/wipo_pub_941_2017.pdf
Xu W, Liu X and Gong Y (2003) Document clustering based on non-negativematrix factorization. Proceedings of the 26th Annual International ACMSIGIR Conference on Research and Development in Information Retrieval,Toronto, Canada, pp. 267–273, https://doi.org/10.1145/860435.860485
12 Hyeonik Song et al.
Downloaded from https://www.cambridge.org/core. 13 Jul 2020 at 22:25:05, subject to the Cambridge Core terms of use.
APPENDIX A: List of CPC sections
Section Subsection Description Categories
Section A:Human necessities
1 Agriculture; forestry; animal husbandry; hunting; trapping; fishing Agriculture
41 Wearing apparel Personal or domestic articles
42 Headwear
43 Footwear
44 Haberdashery; jewelry
45 Hand or travelling articles
46 Brushware
47 Tables; desks; office furniture; cabinets; drawers; general details offurniture
61 Medical or veterinary science; hygiene Health; amusement
62 Life-saving; fire-fighting
63 Sports; games; amusements
Section B:Performing operation;transporting
2 Crushing, pulverizing, or disintegrating; preparatory treatment of grainfor milling
Separating; mixing
3 Separation of solid materials using liquids or using pneumatic tables orjigs; magnetic or electrostatic separation of solid materials from solidmaterials from solid materials or fluids; separation by high-voltageelectric fields
6 Generating or transmitting mechanical vibrations in general
7 Separating solids from solids; sorting
8 Cleaning
21 Mechanical metal-working without essentially removing material;punching metal
Shaping
22 Casting; powder metallurgy
23 Machine tools; metal-working not otherwise provided for
24 Grinding; polishing
25 Hand tools; portable power-driven tools; manipulators
26 Hand cutting tools; cutting; severing
27 Working or preserving wood or similar material; nailing or staplingmachines in general
28 Working cement, clay, or stone
29 Working of plastics; working of substances in a plastic state, in general
41 Printing; lining machines; typewriters; stamps Printing
60 Vehicles in general Transporting
61 Railways
62 Land vehicles for traveling otherwise than on rails
63 Ships or other waterborne vessels; related equipment
64 Aircraft; aviation; cosmonautics
66 Hoisting; lifting; hauling
67 Opening, closing (or cleaning) bottles, jars, or similar containers; liquidhandling
Section F: Mechanicalengineering; lighting;heating; weapons; blasting
21 Lighting Lighting; heating
42 Ammunition; blasting Weapons; blasting
Artificial Intelligence for Engineering Design, Analysis and Manufacturing 13
Downloaded from https://www.cambridge.org/core. 13 Jul 2020 at 22:25:05, subject to the Cambridge Core terms of use.

Hyeonik Song is a graduate research assistant at the Georgia Institute ofTechnology pursuing a PhD in Mechanical Engineering. He received hisMS (May 2018) and BS (May 2016) in Mechanical Engineering fromGeorgia Tech. His research focuses on studying computational supportsfor design-by-analogy practice to facilitate more effective and innovativeconcept development in engineering design process.
Jacob Evans is an undergraduate researcher at the Georgia Institute ofTechnology, pursuing a BS in Mechanical Engineering. His research interestsinclude design, computation, and artificial intelligence.
Katherine Fu is an Assistant Professor of Mechanical Engineering at theGeorgia Institute of Technology. Prior to this appointment, she was aPostdoctoral Fellow at the Massachusetts Institute of Technology and theSingapore University of Technology and Design. In 2012, she completedher PhD in Mechanical Engineering at Carnegie Mellon University. Shereceived her MS in Mechanical Engineering from Carnegie Mellon in 2009and her BS in Mechanical Engineering from Brown University in 2007.Her work focuses on studying engineering design through cognitive studiesand extending those findings to the development of methods and tools tofacilitate more effective, inspired design and innovation.
14 Hyeonik Song et al.
Downloaded from https://www.cambridge.org/core. 13 Jul 2020 at 22:25:05, subject to the Cambridge Core terms of use.