Embed Size (px)
Citation preview

Review of Economics & Finance
Submitted on 24/Jan./2011
Article ID: 1923-7529-2011-02-69-14 Beatriz Larraz
~ 69 ~
An Expert System for Online Residential Properties Valuation8
Beatriz Larraz
Faculty of Law and Social Sciences, University of Castilla-La Mancha
Cobertizo San Pedro Martir, s/n, 45071 Toledo, SPAIN
Tel: +34-636-277-824 E-mail: [email protected]
Abstract: Recent legislation in Spain states the revision of the mortgaged residential property value.
This fact has become important since 2008 due to the fall in the average housing prices in Spain.
Traditionally, residential properties valuation procedure is based on the comparison to the nearest
property prices being necessary to consult human experts. This article presents an expert system,
which allows not only punctual but also big portfolios residential properties valuations in the financial
market framework using spatial statistical methods (kriging). The final report provides online an
immediate updated market price estimation of each residential property sited on Spanish territory.
JEL Classifications: G21, R31, R32, C01, C61, C13
Keywords: Expert system, House prices, Hedonic method, Kriging, Banking, Portfolios valuation
1. Introduction
In today‟s volatile real estate market, a precise valuation of housing is of great importance for
owners, investors, assessors, financial institutions, banks, credit agencies and insurance companies. In
the financial market, it is essential for lenders to have a valuation of the real property in order to
determine whether to provide and how to price a mortgage (Ming-Shann et al. 2009). In addition, in
the real estate market, valuations are necessary to perform any market analysis and pricing.
Banco de España, the national central bank and supervisor of the Spanish banking system,
recently amended its legislation on credit institutions (BOE, 2008), in compliance with European
Union (EU) directives (EC, 2006a; EC, 2006b). The aim of these directives are “the introduction of
rules concerning the taking up and pursuit of the business of credit institutions, and their prudential
supervision” and “the establishment of the capital adequacy requirements applying to investment firms
and credit institutions, the rules for their calculation and the rules for their prudential supervision”,
respectively. This new approach supports legislation that guarantees the entities‟ solvency and
stability, and attempts to make the legal requirements more sensitive to actual risks. In real estate
valuation, the Official State Gazette (BOE, 2008, p. 26518) states that the initial real property
valuation must be conducted by an approved valuation company (BOE, 2003). Then, the mortgaged
property value has to be revised each year if it is a commercial property or every three years in the
case of residential properties. This revision can be carried out through statistical methods, except in
the singular properties case. In addition, when the market conditions indicate that general market
prices are changing, the credit risk reduction is affected, and additional valuations of the properties in
the affected loans should be conducted.
Cacdac and Warnock (2008) state that there should be mechanisms for determining the market
value of a property; however, the valuation of residential properties has traditionally been based only
on a comparison with houses recently sold or listed for sale and on knowledge of neighborhood trends. 8 The author wishes to thank Oscar D. and Susana C. for being interested in real estate research. This
research was partially supported by the MICINN project CSO2009-11246.

ISSNs: 1923-7529; 1923-8401 © 2011 Academic Research Centre of Canada
~ 70 ~
Though Belsky et al. (1998) stated more than ten years ago that “spatial research is critical in building
next-generation mortgage finance business applications”, the reality is that real estate and financial
markets have not incorporated it on their research. In Spain, following national guidelines for
producing estimates of the current market value of a property (BOE, 2003), a property assessor needs
to physically visit the property; however, in the last few years, some online valuation systems have
been developed. The traditional comparison method is not statistically advanced and may be biased,
because of the comparison procedure with its own valuations.
Nevertheless, in the last two decades, several studies in the statistical and real estate literature
have recommended improvements to the real estate valuation procedures. Each study has improved
upon the estimation capacity of earlier ones, either increasing the number of housing characteristics
considered or developing new valuation methods. In this sense, most of the articles were based upon
hedonic models, which began with Rosen (1974). Malpezzi (2002) made a selective revision of the
hedonic models applied to real estate valuation, and Goodman and Thibodeau (2003) developed an
interesting application in Dallas County (USA). Similarly, Stevenson (2004) applied hedonic pricing
models in Boston (USA) and Núñez et al. (2007) in Cordoba (Spain). Ellen and Voicu (2006) and
Ellen et al. (2007) use hedonic regression models in New York (USA) that explain the sale price of a
property.
Approximately twenty years ago, artificial intelligence was designed to replicate the human
brain‟s learning process. Neural networks have been applied to real estate valuation processes. Notable
studies include Worzala et al. (1995) in Colorado (USA), Limsombunchai et al. (2004) in New
Zealand, García Rubio (2004) in Albacete (Spain), Caridad et al. (2008) in Córdoba (Spain) and
Peterson and Flanagan (2009) in Wake County, North Carolina (USA). Additionally, spatial
econometric approaches have been used to estimate housing prices; e.g., Brasington and Hite (2005)
developed spatial hedonic regressions in six North American cities and Anselin and Lozano-Gracia
(2008) applies similar methods to Southern California (USA). The analytic network process has also
been applied, though infrequently, to property valuation, and this approach combines quantitative and
qualitative attributes (Aznar et al., 2009). Brint (2009) predicted a house‟s selling price through
inflating its previous selling prices using the information provided by repeat sales. Finally, in a
geostatistics framework, kriging methods have been applied to punctual real estate price estimation, as
first used by Chica-Olmo (1995, 2007) in Granada (Spain) and also used more recently, e.g., Montero
and Larraz (2006, 2009) in Toledo (Spain).
An automated system that allows real-time (for not only punctual, but also large portfolios)
valuations in the financial market framework needs to be developed, and the statistical techniques also
need to be updated. There has been decrease in the average housing prices, as published quarterly in
Spain (an annual decrease of 7.8% last year as reported by the Housing Ministry in the third quarter of
2009— Housing Ministry, 2009), and also a worrying decrease of confidence in the housing market.
Therefore, a new, statistically sound model for estimating housing prices that more completely
presents with absolute transparency would help fill an important information gap and improve the
efficiency of the real estate market.
The aim of this paper is to provide software that will solve this valuation problem in an automated
manner, where previously one or more human experts would need to be consulted. This expert system,
the „Residential Properties Valuation Report‟ (RPVR) provides (i) an immediate, online and complete
description of the residential property that is being evaluated in Spain (including the information
provided by the land registry about the charges); (ii) real-time and updated market price estimation
calculated using the most advanced statistical methods currently available; (iii) a statistical estimation
procedure (the most accurate one given the available data, usually obtained using kriging); and (iv) the
change in the neighbourhood average quarterly prices in the last years as well as the environmental
conditions.
In particular, data describing the real estate properties have been obtained from the Virtual Office

Review of Economics & Finance
~ 71 ~
of Cadastre, which provides a description of the property (surfaces, location, use, shape, boundaries,
cartographic representation, type and quality of constructions), legal information (identification of
holders or owners) and economic information (cadastral values of buildings, valuation criteria). This
system also considers other useful information (e.g., property condition or quality) that improve the
property valuation.
RPVR provides information on the neighbourhood in terms of communications, noise
contamination, green zones, crime, street cleanliness, and local resources (hospitals, schools,
commercial properties, filling stations). These variables were obtained from the last census conducted
by the National Statistics Institute (INE, 2009).
Lastly, but most importantly, RPVR provides a market price valuation using spatial estimation
methods (kriging when possible) to analyze data from home sales advertisements. Data will be
obtained quarterly. To provide punctual estimation, this study used the most convenient database and
the best estimation method (Section 2). Section 3 describes the estimation procedure. Section 4
presents the estimation results obtained in this project. Finally, Section 5 presents the conclusions and
areas for future research.
2. Selecting the sample data set and estimation method
This section analyses the options available to construct a sample data set that could be used in
RPVR in Spain, where data on transaction prices are not available. The variables examined include
housing prices, geographical location and characteristics of residential properties that were sold or
listed for sale in the previous three months. It also describes the advantages and disadvantages of the
estimation methods that could be used to valuate residential properties.
Spanish General Notaries Council and Land Registry (transaction data): Land registry and
regional notaries councils in Spain have prices and deeds (describing all the physical characteristics)
of the properties that have been sold. However, these databases are not suitable because estimations
may be biased downwards, where portions of the transactions may have been undeclared in order to
avoid paying taxes. Moreover, these are private data and are not available.
Real estate agencies (transaction data): These agencies have the real transaction prices of all the
properties that have been sold by an agency. However, this database includes neither geographical
locations nor data from properties that have been sold „person to person‟. Moreover, due to the large
number of real estate agencies in Spain (more than 180,000 in 2006, see ABC, 2007) it is impossible
to obtain this information for the whole country in an automated way.
Real estate advertisements (intended sales prices): Housing prices provided by these sources are
not the actual selling prices, but they best capture the „market price‟ as defined by official authorities
in Spain (see Housing Ministry, 2009). Real estate websites have become open references on housing
price evolution in Spain as an alternative to the statistics generated by valuation companies (including
banks and financial entities), consultants, or even Spanish and regional governments. In fact, the
Housing Ministry did not detect the decrease in housing prices until January 2009 (data from Q4 2008
corresponded to a -3.2% annual variation rate, Housing Ministry, 2009) when the first decrease in the
last fifteen years was official. As stated in the introduction, this study chose this data source due to the
great difficulty of obtaining real information from the market and because it is possible to
automatically obtain a large and complete quarterly data set. Consequently, final estimations will
reflect the market prices.
Nevertheless, it is important to stress the great variability among housing prices even when
considering neighbouring properties with similar characteristics, which underscores the complexity of
this project and the non-existence of a single housing price.

ISSNs: 1923-7529; 1923-8401 © 2011 Academic Research Centre of Canada
~ 72 ~
According to Montero and Larraz (2010), housing prices not only depend on specific housing
characteristics but also on the spatial location of a house in relation to its environment. From this point
of view, in order to provide statistically sound, punctual estimations, it is necessary to use statistical
tools that take into account the importance of space. It is essential to consider the geographical
coordinates of sample locations and the location of the focal property.
Nevertheless, the real estate literature still describes methods that do not consider space, e.g., the
most commonly used complete hedonic models or artificial neural networks. In the first case, even
suggesting a hedonic model that is as complete as possible in considering the relevant characteristics,
including local neighbourhood ones, we get a housing price explained by the independent variables
(Goodman, 1978). However, this method only considers the general averaged characteristics of the
census track of the property and does not take into account geographical location or distance to sample
locations. Consequently, the price would be the same for every similar residential property in the same
census track (see Caridad et al. 2008) and does not allow for accurate punctual valuations. The second
method, the neural network, is a non-linear, statistical data-modelling tool, and it is an abstract
simulation of the biological neural networks formed by interconnected nodes. This replicates the
human learning process, where the structure is based on external or internal information flowing
through the network during the learning phase. The basic neural network model consists of an input
layer (housing characteristics), one or more hidden layers, and an output layer, which corresponds to
the housing price estimation. After the training phase, the neural network „identifies‟ certain
characteristics with a certain price. Though this method can include the geographical locations as
another property feature (García Rubio, 2004), in general, most of the real estate applications do not
take space into account (Limsombunchai et al., 2004). Finally, a comparative model based on the
analytic network process (Aznar et al. 2009) is suitable where scant information is available or when
qualitative variables are involved in the model. However, it is not suitable for the valuation of large
portfolios.
As an alternative, spatial statistics and spatial econometrics consider the data‟s geographical
references as the most important feature of the property due to the great amount of valid information it
contains. As Tobler (1979) states, “Everything is related to everything else, but closer things more so”.
Spatial econometrics differs from traditional econometrics in two respects: (i) it considers the spatial
dependence among sample variables; and (ii) it attends to the spatial heterogeneity in the model
parameters, which change across space. Geographical locations are added to the model through a
weighting matrix (see Anselin, 1998). Spatial statistics or geostatistics incorporate the structure of
spatial dependence among variables into classic statistics. Tobler‟s statement forced traditional
statisticians to consider the spatial dependence of georeferenced variables. In earth sciences, variable
values tend to be more similar as the distance between locations decreases; this is also true for
economic variables, especially real estate prices, unemployment rate, Gross Domestic Product per
capita, and educational level.
In geostatistics, kriging methods represent best use of the structure of the spatial dependence that
arises in residential property prices in order to predict the value at a non-observed location. This is
kriging's main advantage compared to other interpolation methods (e.g., inverse distance weighting in
Johnston et al., 2001 or Li and Revesz, 2002; splines in Goodman and O‟Rourke, 1997; polynomial
regression in Buchanan, 1995, Zienkiewikz and Taylor, 2000 or Li and Revesz, 2004; n-D Delaunay
tessellation in Watson, 1981, among others). Kriging is a minimum mean squared error statistical
procedure for spatial prediction that assigns a differential weight to observations that are spatially
closer to the dependent variable's location, and kriging provides the best unbiased lineal punctual
estimate. With ordinary kriging, the weights sum to one and are derived from the estimated variogram.
(See Wackernagel, 2003, chapter 11, for statistical details on kriging.) Kriging estimates are more
accurate than those obtained from any other lineal estimator and the most accurate in the Gaussian
case.

Review of Economics & Finance
~ 73 ~
3. Estimation procedure
The estimation of market prices in RPVR consists of five phases: (i) collecting sample data from
real estate sales; (ii) standardizing and mapping the postal addresses from these data; (iii) converting
the sale prices data set into prices of properties with the same characteristics; (iv) using interpolation
methods that depend on the sample size of each municipality; and finally, (v) using cross-validation to
evaluate the forecasting accuracy of the models (see Figure 1). The expert system was programmed
using the R language (R Development Core Team, 2008), while data were managed using an SQL
Server (see Figure 2). All phases were implemented using batch processing.
Figure 1. Valuation procedure
RPVR maps the postal addresses of the database using an expert system previously implemented.
Once every residential property possesses the geographical coordinates (latitude and longitude) of the
number and street where it is located, then the coordinates are transformed into Universal Transverse
Mercator coordinates (UTM). Then, we calculated the distance between each pair of sample locations
as well as the distance between sample locations and the property we were valuating. We fixed the
UTM Zone when the boundaries of the municipality were in multiple zones (i.e., 29N or 30N) in order
to calculate the distances.

ISSNs: 1923-7529; 1923-8401 © 2011 Academic Research Centre of Canada
~ 74 ~
Figure 2. Residential Properties Valuation Report procedure.
Table 1. Characteristics of the residential properties data set
Variable Description Data Source
Price Total price of the announced property (€) Websites
Floor surface Constructed surface without common zones (m
2)
Virtual Office of Cadastre
Price per square meter Price/Floor surface (€/m2)
Geographical coordinates
Latitude-longitude and UTM coordinates Own elaboration(*)
Age of the structure Property age (intervals) Virtual Office of Cadastre
Floor (**)
Floor on which the residential property is located
Virtual Office of Cadastre
Type Big apartment, penthouse, apartment, loft, duplex apartment, house.
Websites
Bedrooms Number of rooms excluding kitchens, bathrooms and living rooms
Websites
Bathrooms Number of bathrooms and toilettes included in the property
Websites
Condition A property can be in a good condition or needs renovation
Websites
Quality We considered three categories: normal, good, and luxury
Websites
Heating Yes/No Websites Basement Yes/No Websites Swimming pool Yes/No Websites Garden or common areas
Yes/No Websites
Garage Yes/No Websites Elevator
(**) Yes/No Websites
Notes: (*) Own elaboration from street and number; (**) Not considered for single-family houses.
Review of Economics & Finance
~ 75 ~
The mapped data set consists of 434,618 residential properties (Table 1) from June 2008. Of these
properties, 80.18% were apartments and 19.82% were single-family houses. The estimation procedure
grouped properties according to habitability and architectural differences, which implies a range of
prices even in neighboring locations.
In order to debug the data, we identified inaccuracies and outliers in the surface and price
variables. Inaccuracies were attributed to errors in the adv.. We excluded apartments that were smaller
than 20 m2 or bigger than 850 m
2 and houses that were smaller than 20 m
2 or bigger than 5,000 m
2.
We considered properties that were reported to be less than 100 €/m2 or more than 15,000 €/m
2 to be
inaccuracies. When detecting outliers, we replaced 2.5% of the sample at the high and low ends with
the most extreme remaining values. After debugging and geo-referencing, the final data set consisted
of 165,872 advertisements.
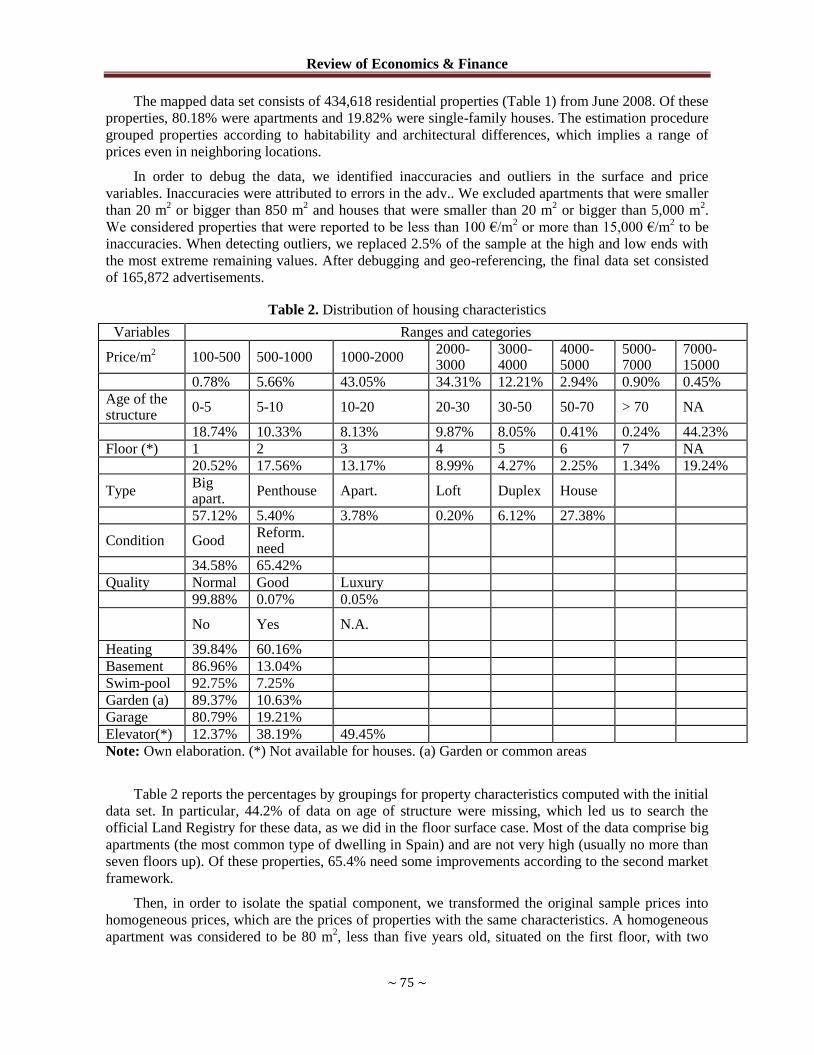
Table 2. Distribution of housing characteristics
Variables Ranges and categories
Price/m2 100-500 500-1000 1000-2000
2000- 3000
3000- 4000
4000- 5000
5000- 7000
7000- 15000
0.78% 5.66% 43.05% 34.31% 12.21% 2.94% 0.90% 0.45%
Age of the structure
0-5 5-10 10-20 20-30 30-50 50-70 > 70 NA
18.74% 10.33% 8.13% 9.87% 8.05% 0.41% 0.24% 44.23%
Floor (*) 1 2 3 4 5 6 7 NA
20.52% 17.56% 13.17% 8.99% 4.27% 2.25% 1.34% 19.24%
Type Big apart.
Penthouse Apart. Loft Duplex House
57.12% 5.40% 3.78% 0.20% 6.12% 27.38%
Condition Good Reform. need
34.58% 65.42%
Quality Normal Good Luxury
99.88% 0.07% 0.05%
No Yes N.A.
Heating 39.84% 60.16%
Basement 86.96% 13.04%
Swim-pool 92.75% 7.25%
Garden (a) 89.37% 10.63%
Garage 80.79% 19.21%
Elevator(*) 12.37% 38.19% 49.45%
Note: Own elaboration. (*) Not available for houses. (a) Garden or common areas
Table 2 reports the percentages by groupings for property characteristics computed with the initial
data set. In particular, 44.2% of data on age of structure were missing, which led us to search the
official Land Registry for these data, as we did in the floor surface case. Most of the data comprise big
apartments (the most common type of dwelling in Spain) and are not very high (usually no more than
seven floors up). Of these properties, 65.4% need some improvements according to the second market
framework.
Then, in order to isolate the spatial component, we transformed the original sample prices into
homogeneous prices, which are the prices of properties with the same characteristics. A homogeneous
apartment was considered to be 80 m2, less than five years old, situated on the first floor, with two

ISSNs: 1923-7529; 1923-8401 © 2011 Academic Research Centre of Canada
~ 76 ~
bedrooms (in addition to the kitchen, bathroom and living room), one bathroom, in need of renovation,
normal quality, without heating, a basement, a swimming pool, a garden, a garage or elevator. A
homogeneous house was 100 m2, less than five years old, with three bedrooms (in addition to the
kitchen, bathroom and living room), two bathrooms, in need of renovation, normal quality, without
heating, a basement, or a swimming pool.
Hedonic price theory assumes that a residential property can be decomposed into separate
components that determine the price. The number or presence of attributes associated with the
commodities defines a set of implicit or “hedonic” prices (Rosen, 1974). These hedonic prices are the
contribution to the total value of the specific property features. They are estimated by employing
multiple regression techniques. In particular, following Shonkwiler et al (1986) and Limsonbunchai et
al (2004), among others, this study employed the semi-log model, which assumes a constant
percentage of partial effects because price is a very sensitive and volatile component. We created one
hedonic model for each municipality where more than 400 advertisements were available. In the
remaining municipalities, we considered the neighbouring properties for sale through a cluster
procedure joining homogeneous municipalities. To estimate the contribution of each feature, 434,618
data were considered, even those that were not geo-referenced.
Once the data set contains homogeneous prices, we estimated the prices of residential properties
that were located in Spanish territory for 8,108 municipalities. The estimation procedures used for
each municipality depended on the number of properties available: where the number of mapped
properties exceeded 100 (including the largest cities, Madrid, Barcelona, Valencia or Seville), kriging
estimations were computed (following Montero and Larraz, 2008); where only 11 to 99 mapped
properties were available, interpolations were conducted with the inverse distance weighting method
(IDW, see Li and Revesz, 2002), which is a weighting mechanism that assigns more influence to the
data points near the location where the value is being estimated. In rural areas where fewer than ten
mapped properties were for sale, the averages for values from non-mapped properties were included.
In municipalities with less than 10 data (mapped or non-mapped), we aggregated neighbouring
properties. Table 3 reports the characteristics of the estimation procedure. Finally, the homogenisation
procedure was undone to obtain final estimations using the inverse coefficients resulting from the
hedonic model.
Table 3. Criteria and characteristics of the estimation procedure.
Municipalities Sample size Percentage
Apt. Houses Apt. Houses Apt. Houses
Kriging >100 mapped data 115 7 88,872 1,541 66.80% 4.69%
IDW 11 to 99 mapped data 656 511 37,710 22,291 28.34% 67.89%
Municipality average
>10 data (mapped and non-mapped)
710 1,032 4,909 6,135 3.69% 18.68%
Zone average <10 data (mapped and non-mapped)
6,627 6,558 1,550 2,864 1.16% 8.72%
Total 8,108 8,108 133,041 32,831 100% 100%
Note: Own elaboration. Apt.: Apartments
4. Results This section reports the main results of the project phases. In order to illustrate the results of the
homogenisation procedure, statistically significant coefficients from the hedonic model for the city of
Madrid are depicted in Table 4. To avoid multi-collinearity, each toilet was considered a bathroom.
Weighted least squares was utilised. The signs of the coefficients of the model are in the directions
hypothesised (i.e., less than or greater than one after exponential). Variables were removed when the

Review of Economics & Finance
~ 77 ~
signs of their coefficients were not in the direction predicted. In particular, the age of the building had
a coefficient greater than one, which does not fit well with general opinion (the age made the building
undesirable); older and more expensive buildings are, in general, located in the city centre while new
and cheaper buildings are in outlying areas. The coefficients from the model for properties in Madrid
indicate that the higher the property, the cheaper the price per square meter. Penthouses and small
apartments were priced higher than big apartments, lofts and duplexes. People preferred the fifth or
sixth floor and, of course, luxury apartments were more costly than normal apartments, and having an
elevator also increased the price.
Table 4. Parameter estimates from the hedonic model for Madrid.
Variable Estimate t-value P(>׀t׀) Explanation
Intercept 3,932.38 1,924.4 <2e-16
NumM2H 0.9990 -14.6 <2e-16 Decrease in 0.1% for each m
2 above 80 m
2
CodType P1 1.0533 10.0 <2e-16 Increase in 5.3% if penthouse
CodType P2 1.0550 8.8 <2e-16 Increase in 5.5% if small apartment
CodType P3 0.8450 -11.6 <2e-16 Decrease in 15.5% if loft
CodType P4 0.9374 -7.7 <2e-16 Decrease in 6.2% if duplex
NumRooms 01PP
1.1457 33.3 <2e-16 Increase in 14.5% if it has one room
NumRooms 03PP
0.8976 -34.2 <2e-16 Decrease in 10.2% if it has three rooms
NumBathrooms 02PP
1.1131 29.6 <2e-16 Increase in 11.3% if it has two bathrooms
CodFloor 2 1.0171 3.3 0.0008 Increase in 1.7% if it is in the second floor
CodFloor 5 1.0469 6.7 1.68e-11 Increase in 4.5% if it is in the fifth floor
CodFloor 6 1.0735 8.7 <2e-16 Increase in 7.3% if it is in the sixth floor
CodFloor 12 0.9093 -7.3 2.69e-13 Decrease in 9.0% if it is in the twelfth floor
CodQuality 2 1.0500 2.5 0.0097 Increase in 5.0% if it is good quality
CodQuality 3 1.0944 3.8 0.0001 Increase in 9.4% if it is luxury
Elevator 1 0.8883 -27.8 <2e-16 Decrease in 11.1% if it does not have an elevator
Elevator 2 1.0817 15.7 <2e-16 Increase in 8.1% if it has an elevator
R2
0.2
F-statistic 368.9 on 29
<2.2e-16
Note: Own elaboration. Being left out category for surface (80 m2), age (<5 years old), floor (first),
bedrooms (2), bathrooms (1), condition (renovations needed), quality (normal), heating (no), basement (no), swimming-pool (no), garden (no), garage (no), elevator (no information).
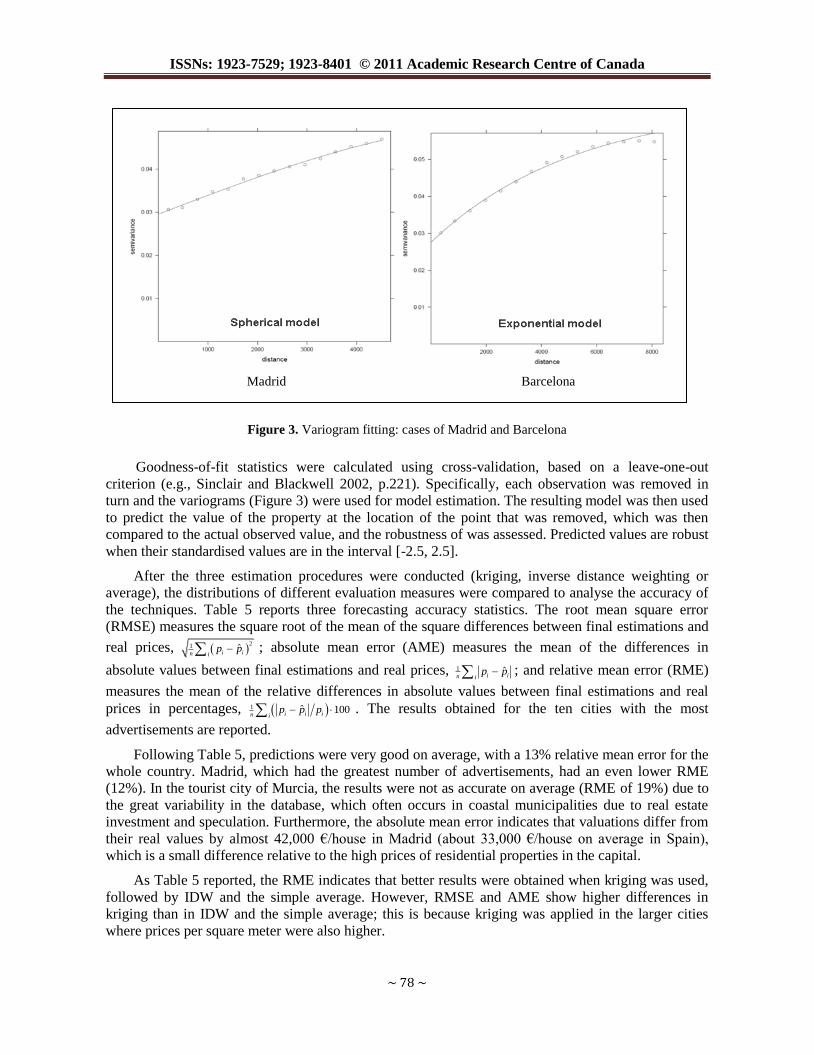
In the municipalities where kriging was used, the variogram was first computed to estimate the
structure of spatial dependence. The developed software chooses the best theoretical variogram model
by minimizing the sum of squares error. It determines the most suitable stationary variogram model
and the most suitable neighbourhood used to calculate it, as well. Figure 3 shows the experimental and
fitted variograms for the cities of Madrid and Barcelona. The high variability of housing prices is
apparent at small distances. The clear structure of the spatial dependence is easily modelled in both
cases (where it follows an exponential model in Madrid and a spherical model in Barcelona).
ISSNs: 1923-7529; 1923-8401 © 2011 Academic Research Centre of Canada
~ 78 ~
Figure 3. Variogram fitting: cases of Madrid and Barcelona
Goodness-of-fit statistics were calculated using cross-validation, based on a leave-one-out
criterion (e.g., Sinclair and Blackwell 2002, p.221). Specifically, each observation was removed in
turn and the variograms (Figure 3) were used for model estimation. The resulting model was then used
to predict the value of the property at the location of the point that was removed, which was then
compared to the actual observed value, and the robustness of was assessed. Predicted values are robust
when their standardised values are in the interval [-2.5, 2.5].
After the three estimation procedures were conducted (kriging, inverse distance weighting or
average), the distributions of different evaluation measures were compared to analyse the accuracy of
the techniques. Table 5 reports three forecasting accuracy statistics. The root mean square error
(RMSE) measures the square root of the mean of the square differences between final estimations and
real prices, 21 ˆ
i in ip p ; absolute mean error (AME) measures the mean of the differences in
absolute values between final estimations and real prices, 1 ˆi in i
p p ; and relative mean error (RME)
measures the mean of the relative differences in absolute values between final estimations and real
prices in percentages, 1 ˆ 100i i in ip p p . The results obtained for the ten cities with the most
advertisements are reported.
Following Table 5, predictions were very good on average, with a 13% relative mean error for the
whole country. Madrid, which had the greatest number of advertisements, had an even lower RME
(12%). In the tourist city of Murcia, the results were not as accurate on average (RME of 19%) due to
the great variability in the database, which often occurs in coastal municipalities due to real estate
investment and speculation. Furthermore, the absolute mean error indicates that valuations differ from
their real values by almost 42,000 €/house in Madrid (about 33,000 €/house on average in Spain),
which is a small difference relative to the high prices of residential properties in the capital.
As Table 5 reported, the RME indicates that better results were obtained when kriging was used,
followed by IDW and the simple average. However, RMSE and AME show higher differences in
kriging than in IDW and the simple average; this is because kriging was applied in the larger cities
where prices per square meter were also higher.
Madrid Barcelona

Review of Economics & Finance
~ 79 ~
Table 5. Forecast evaluation results for the cities with the most home sales:
average accuracy statistics, depending on the estimation method used
Municipality RMSE (a)
AME (a)
RME Number of
advertisements
Madrid 58,193.54 40,895.12 12.11% 19,247
Barcelona 69,435.41 49,076.91 13.10% 4,819
Valencia 65,508.89 46,171.84 16.25% 2,934
Sevilla 70,439.90 48,365.82 15.88% 2,068
Málaga 47,406.33 33,139.20 13.59% 2,052
Alicante 55,241.88 37,207.11 16.68% 2,028
Zaragoza 56,027.41 39,276.86 13.85% 1,938
Palma de Mallorca
56,561.09 37,441.14 13.94% 1,306
Terrasa 41,488.51 31,539.80 11.51% 1,235
Murcia 65,850.96 44,982.73 19.03% 981
Total Spain 48,497.26 33,058.65 13.16% 165,872
Kriging 43,131.13 33,245.12 12.74% 90,413
IDW 34,861.97 27,409.88 13.78% 60,001
Average
31,591. 21 24,159.87 14.20% 15,458
Note: Own elaboration. RMSE: root mean square error; AME: absolute mean error; RME: relative mean error. (a) Measured in €/house, on average.
To assess the estimation power of the expert system, the distribution of the relative mean error
was examined. Table 6 reports the percentage and number of advertisements whose relative mean
error lies in the cited intervals (in percentages) as well as the mean error and the number of
advertisements used in the procedure. The results obtained for the four cities with the most data are
reported in Table 6.
Table 6. Distribution of the relative mean errors for the cities with the most advertisements
Madrid Barcelona Valencia Sevilla
% Nº % Nº % Nº % Nº
0-5 25.17 4,844 23.55 1,135 17.92 526 19.20 397
0-10 48.09 9,256 44.74 2,156 35.84 1,052 38.20 790
0-20 80.69 15,530 76.76 3,699 67.22 1,973 68.52 1,417
>20 19.31 3,717 23.24 1,120 32.74 961 31.48 651
No. Advert.
19,247 4,819 2,934 2,068
Mean error 12.11 13.10 16.25 15.88
Note: Own elaboration. RME: relative mean error measured as the percentage of the total real price
Table 6 shows that around 20% of the valuated residential properties have less than 5% error
valuations, data that increases to 25% in Madrid and to 24% in Barcelona. These percentages increase
to almost 50% and 45% of the valuation where the error lies between 0 to 10% in these two cities.
Finally, eight of ten residential properties sited in Madrid are evaluated by the expert system with less
than a 20% of relative mean error, data that changes to 75% in Barcelona and almost 60% in Valencia
and Seville.
ISSNs: 1923-7529; 1923-8401 © 2011 Academic Research Centre of Canada
~ 80 ~
5. Summary
The valuation of real estate properties is important in the real estate and financial markets. This
project developed an expert system to valuate residential properties without consultation from human
experts. In a financial framework, an expert system to estimate housing prices is essential for
appraising collateral properties, securing mortgage loans and valuing real estate portfolios. This
research was motivated by the 2008 Spanish central bank directive, which required financial entities to
evaluate their real estate portfolios in order to guarantee their solvency and stability, in an environment
of decreasing housing prices. This study was also motivated by advances in statistical estimation
techniques that could be applied to this valuation problem.
Linking these ideas, this study presents an expert system called the „Residential Properties
Valuation Report‟. The RPVR can be used to evaluate each of the residential properties in Spain, with
a complete knowledge of the property characteristics and environment, the neighbourhood property
values and distances to the focal property. The RPVR produces maps of housing locations including
attributes on the official quarterly housing prices according to the respective municipality. To valuate
these properties, this study applied the most suitable techniques from geostatistics, kriging methods,
which takes into account the spatial dependence among housing prices. In the program, several steps
are completed to automate the fitting of the variogram. Estimation has been a difficult task due to the
great variability of housing prices (which is captured by variogram models) as well as the great
amount of information that is required. Nevertheless, the results demonstrate the accuracy of the
estimated valuations.
This project fills an important information gap in the real estate and financial markets with
respect to the automatic, immediate and online valuation of the residential properties in a country.
Future research should valuate commercial property prices. Moreover, this project has exclusively
considered information in a punctual, temporal manner (although the information is updated each
quarter every year). Temporal patterns in housing prices have been ignored, even though temporal
factors could affect the final estimates (the same property could have a different price in different
years, even when holding age constant; this time effect will be considered when sufficient information
is available.
References
[1] ABC (2007). Barcelona casi empata con Madrid en número de agencias inmobiliarias. ABC
periodico electronico S.L.U., 9 April 2007. [Online] Available: http://www.abc.es/hemeroteca/
historico-09-04-2007/abc/Catalunya/barcelona-casi-empata-con-madrid-en-numero-de-agencias-
inmobiliarias_1632427900792.html (November 18, 2009).
[2] Anselin, L. and Lozano-Gracia, N. (2008). Errors in variables and spatial effects in hedonic house
price models of ambient air quality. Empirical Economics. 34: 5-34.
[3] Anselin, L. (1998) Spatial econometrics: methods and models.. Dordrecht: Kluwer.
[4] Aznar, J., Ferrís-Oñate, J. and Guijarro, F. (2009). An ANP framenwork for property pricing
combining quantitative and qualitative attributes. Journal of the Operational Research Society:
doi:10.1057/jors.2009.31.
[5] Belsky, E., Can, A. and I. Megbolugbe (1998). A primer on Geographic Information systems in
mortgage finance. Journal of Housing Research. 9,1: 5-31.
[6] BOE (2003). ORDEN ECO/805/2003, de 27 de marzo, sobre normas de valoración de bienes
inmuebles y de determinados derechos para ciertas finalidades financieras. Boletín Oficial del
Estado 85: 13678-13707.
[7] BOE (2008). CIRCULAR 3/2008, de 22 de mayo, del Banco de España, a entidades de crédito,

Review of Economics & Finance
~ 81 ~
sobre determinación y control de los recursos propios mínimos. Boletín Oficial del Estado 140:
26465-26647.
[8] Brasington, D.M. and Hite, D. (2005). Demand for environmental quality: a spatial hedonic
analysis. Regional Science and Urban Economics. 35: 57-82.
[9] Brint, A. (2009). Predicting a house‟s selling price through inflating its previous selling price.
Journal of Operational Research Society. 60: 339-347.
[10] Buchanan, G.R. (1995). Finite element analysis. New York: McGraw-Hill.
[11] Cacdac Warnock, V. and Warcnock, F.E.(2008). Markets and housing finance. Journal of
Housing Economics. 17: 239-251.
[12] Caridad, J.M., Núñez, J. and Ceular, N. (2008). Metodología de precios hedónicos vs. Redes
Neuronales Artificiales como alternativas a la valoración de inmuebles. Un caso real. Revista
CT/Catastro. 62: 27-42.
[13] Chica-Olmo, J. (1995). Spatial Estimation of Housing Pricesand Locational Rents. Urban Studies,
32: 1331-1344.
[14] Chica-Olmo, J. (2007). Prediction of Housing Location Price by a Multivariate Spatial Method:
Cokriging. Journal of Real Estate Research. 29: 91-114.
[15] EC (2006a). DIRECTIVE 2006/48/EC of the European Parliament and of the Council of 14 June
2006 relating to the taking up and pursuit of the business of credit institutions (recast). Official
Journal of the European Union (30.06.2006) L177, 1-200. (Strasbourg).
[16] EC (2006b). DIRECTIVE 2006/49/EC of the European Parliament and of the Council of 14 June
2006 on the capital adequacy of investment firms and credit institutions (recast). Official Journal
of the European Union (30.06.2006), L177, 201-255. (Strasbourg).
[17] Ellen, I.G. and Voicu, I. (2006). Nonprofit housing and neighborhood spillovers. Journal of
Policy Analysis and Management. 25, 1: 31-52.
[18] Ellen, I.G., Schwartz, A.E., Voicu, I. and Schill, M.H. (2007). Does federally subsidized rental
housing depress neighborhood property values? Journal of Policy Analysis and Management. 26,
2: 257-280.
[19] García Rubio, N. (2004). Desarrollo y aplicación de redes neuronales artificiales al mercado
inmobiliario: aplicación a la ciudad de Albacete. Tesis Doctoral. Albacete: Universidad de
Castilla-La Mancha.
[20] Goodman, A.C. (1978). Hedonic Prices, Price Indices and Housing Markets. Journal of Housing
Reseach. 3: 25-42.
[21] Goodman, A.C. and Thibodeau, G.T.(2003). Housing market segmentation and hedonic
prediction accuracy. Journal of Housing Economics. 12: 181-201.
[22] Goodman, J.E. and O‟Rourke, J. (1997). Handbook of discrete and computational geometry. New
York: CRC Press.
[23] Housing Ministry,(2009). Housing Prices Statistics. General Pricing Index. Available from
http://www.mviv.es/, accessed 30 October, 2009.
[24] INE (2009). 2001 Population and Housing Census. Available from http://www.ine.es, accessed 5
November, 2009.
[25] Johnston, K., Ver Hoef, J.M., Krivoruchko, K. and Lucas, N. (2001). Using ArcGIS geostatistical
analyst. Redlands: ESRI Press.
[26] Li, L. and Revesz, P. (2002). A Comparison of Two Spatio-Temporal Interpolation Methods.
Lectures Notes in Computational Science. 2478: 145-160.
[27] Li, L. and Revesz, P. (2004). Interpolation methods for spatio-temporal geographic data.

ISSNs: 1923-7529; 1923-8401 © 2011 Academic Research Centre of Canada
~ 82 ~
Computers, Environment and Urban Systems. 28, 3: 201-227.
[28] Limsonbunchai, V., Gan, C. and Lee, M. (2004). House price prediction: hedonic price model vs.
artificial neural network. American Journal of Applied Sciences. 1, 3:193-201.
[29] Malpezzi, S. (2002). Hedonic Pricing Models: A Selective and Applied Review. Housing
Economics: Essays in Honor of Duncan Maclennan. Edyted by Kenneth Gibb and Anthony
O‟Sullivan.
[30] Ming-Shann, T., Szu-Lang, L. and Shu-Ling, C.(2009). Analyzing yield, duration nad
convexityof motgage loans under prepayment and default risks. Journal of Housing Economics.
18: 92-103.
[31] Montero, J.M. and Larraz, B. (2006). Estimación espacial del precio de la vivienda mediante
métodos de krigeado. Revista Estadística Española, 48, 162: 62-108.
[32] Montero, J.M., and Larraz, B. (2008). Introducción a la Geoestadística Lineal. A Coruña:
Editorial Netbiblo.
[33] Montero, J.M., Larraz, B. and Paez, A. (2009). Estimating Commercial Property Prices: An
Application of Cokriging with Housing Prices as Anciliary Information. Journal of Geographical
Systems. 11: 407-425.
[34] Montero, J.M. and Larraz, B. (2010). Estimating housing prices: A proposal with spatially
correlated data. International Advances in Economic Research, 16: 39-51.
[35] Núñez, J., Ceular, N. and Millán, G.. (2007). Aproximación a la valoración inmobiliaria
mediante la metodología de precios hedónicos (MPH). Conocimiento, innovación y
emprendedores: camino al futuro, coord. por Juan Carlos Ayala Calvo.
[36] Peterson, S. and Flanagan, A.B. (2009). Neural network hedonic pricing models in mass real
estate appraisal. Journal of Real Estate Research. 31,2: 147-164.
[37] R Development Core Team. (2008). R: A language and environment for statistical computing. R
Foundation for Statistical Computing. Vienna, Austria. ISBN 3-900051-07-0, URL http://www.R-
project.org
[38] Rosen, S. (1974). Hedonic Prices and Implicit Markets. Product Differenciation in Pure
Competition. Journal of Political Economy. 82: 34-55.
[39] Sinclair, A.J. and Blackwell, G.H. (2002). Applied Mineral Inventory Estimation.. Cambridge:
Cambridge University Press.
[40] Shonkwiler, J.S. and Reynolds, J.E. (1986). A note on the use of hedonic price models in the
analysis of land prices at the urban fringe. Land Economics. Vol.62, no.1.
[41] Stevenson, S. (2004). New empirical evidence on heteroscedasticity in hedonic housing models.
Journal of Housing Economics. 13, 2: 136-153.
[42] Tobler, W. (1979). Cellular geography. In Gale S, Olsson G (Eds), Philosophy in Geography.
Reidel: Dordrecht. 379-386.
[43] Wackernagel, H. (2003). Multivariate Geostatistics: An introduction with applications. 3rd ed.
Berlin: Springer-Verlag.
[44] Watson, D.F. (1981). Computing the n-dimensional delaunay tesselation with applications to
Voronoi Polytopes. The Computer Journal. 24, 2: 167-172.
[45] Worzala, E., Lenk, M. and Silva, A. (1995). An exploration of neural Networks and its
application to real estate valuation. Journal of Real Estate Research. 10, 2: 185-202.
[46] Zienkiewicz, O.C. and Taylor, R.L. (2000). Finite element method. In: The basis 1. London:
Butterworth Heinemann.