Embed Size (px)
Citation preview

Western University Western University
Scholarship@Western Scholarship@Western
Electronic Thesis and Dissertation Repository
8-21-2019 10:00 AM
An Experimental Study on the Impact of Pressure Drop in the An Experimental Study on the Impact of Pressure Drop in the
Ranque-Hilsch Vortex Tube Ranque-Hilsch Vortex Tube
Mark Parker The University of Western Ontario
Supervisor
Straatman, Anthony G
The University of Western Ontario
Graduate Program in Mechanical and Materials Engineering
A thesis submitted in partial fulfillment of the requirements for the degree in Master of
Engineering Science
© Mark Parker 2019
Follow this and additional works at: https://ir.lib.uwo.ca/etd
Part of the Other Mechanical Engineering Commons
Recommended Citation Recommended Citation Parker, Mark, "An Experimental Study on the Impact of Pressure Drop in the Ranque-Hilsch Vortex Tube" (2019). Electronic Thesis and Dissertation Repository. 6411. https://ir.lib.uwo.ca/etd/6411
This Dissertation/Thesis is brought to you for free and open access by Scholarship@Western. It has been accepted for inclusion in Electronic Thesis and Dissertation Repository by an authorized administrator of Scholarship@Western. For more information, please contact [email protected].

ii
Abstract
A vortex tube converts a single stream of compressed gas into two outlet streams; one heated,
and the other cooled. This phenomenon, referred to as energy separation, is not fully
understood, thereby requires further experimentation and analysis. CFD can provide insight,
however, such simulations require a complete set of information of the geometric, operational,
and performance parameters of particular vortex tube experiments.
An experiment is developed to provide complete information for CFD simulations. The vortex
tube under consideration is established by considering reported data from past studies and
selecting parameters that yield significant energy separation. An experimental apparatus is
developed that can precisely measure the flow properties at the inlet and outlets. In addition to
providing operational and performance data for future CFD studies, the experiments conducted
showed the magnitude of the energy separation is (at least partially) dependent on the pressure
ratio between the inlet and the cold outlet.
Keywords
Vortex tube, Ranque-Hilsch vortex tube, experimental, CFD validation, CFD boundary
conditions, Pressure ratio

iii
Summary for Lay Audience
A vortex tube is a simple device that separates a compressed gas into two flows, one heated
and the other cooled compared to the original temperature (referred to as energy separation).
The vortex tube has no moving parts and does not use electrical input or chemical reactions to
accomplish this energy separation. The process that causes this energy separation between the
two outflows is not fully understood, beyond requiring the inlet to be a compressed gas and the
flow is rotational. The flow inside a vortex tube is very complex and cannot be accurately
measured through experiments, leaving experiments to measure only the flow before entering
the vortex tube and after leaving it. The internal flow can be simulated numerically on a
computer but requires precise information on the geometry of the vortex tube, and the
temperature, pressure and mass flow rate at the inlet and both outlets.
The research conducted in this thesis focuses on; designing a vortex tube that will produce
significant energy separation, accurately measuring the inlet and outlet flows, and reporting all
information for computer simulation. By designing a vortex tube, it allows for specifying the
complete geometry. The mass flow rate is measured before the inlet of the vortex tube, and
after both outlets. Sensor blocks containing pressure and temperature sensors are also
incorporated into the experimental setup, in between the mass flow measurement and the
inlet/outlets. Thus, the geometry of the vortex tube is completely defined, and the temperature,
pressure and mass flow rate are known at the inlet and both outlets.
The data collected from the experiments showed that the energy separation is influenced by
the pressure ratio between the inlet and the cold outlet. Previously it was thought that increased
inlet pressure resulted in an increased energy separation. However, this research shows that it
is the increase in the pressure ratio that increased the energy separation. The increased inlet
pressure also happens to increase the pressure ratio, similarly to a decreased cold outlet
pressure.

iv
Co-Authorship Statement
The thesis is written by Mark Parker and reviewed by the supervising professor Dr. Anthony
Straatman.

v
Acknowledgments
I would like to thank my supervisor, Dr. Anthony Straatman, for the opportunities he has
provided me and for his support in this research.

vi
Table of Contents
Abstract ............................................................................................................................... ii
Summary for Lay Audience ............................................................................................... iii
Co-Authorship Statement................................................................................................... iv
Acknowledgments............................................................................................................... v
Table of Contents ............................................................................................................... vi
List of Tables ................................................................................................................... viii
List of Figures .................................................................................................................... ix
List of Appendices ............................................................................................................ xii
Chapter 1 ............................................................................................................................. 1
1 Introduction .................................................................................................................... 1
1.1 Literature Review.................................................................................................... 3
1.1.1 Thermodynamic Analysis ........................................................................... 4
1.1.2 Experimental Investigation ......................................................................... 6
1.1.3 Numerical Investigations .......................................................................... 14
1.1.4 Consolidation of data ................................................................................ 21
1.2 Thesis Objectives .................................................................................................. 26
1.3 Thesis Outline ....................................................................................................... 26
Chapter 2 ........................................................................................................................... 28
2 Experiment Overview .................................................................................................. 28
2.1 System Setup ......................................................................................................... 28
2.2 Design Overview .................................................................................................. 33
2.3 Experimental Procedure ........................................................................................ 41
2.4 Rotameter Calibration ........................................................................................... 41
2.5 Uncertainty Analysis ............................................................................................. 44
vii
2.6 Repeatability Study ............................................................................................... 47
2.7 Summary ............................................................................................................... 48
Chapter 3 ........................................................................................................................... 50
3 Experimental Results ................................................................................................... 50
3.1 Results of the Three sets of Experiments .............................................................. 51
3.1.1 Constant Cold Outlet Pressure .................................................................. 51
3.1.2 Constant Pressure Drop............................................................................. 53
3.1.3 Constant Pressure Ratio ............................................................................ 55
3.2 Pressure Ratio ....................................................................................................... 57
3.3 Boundary Conditions for CFD Simulations .......................................................... 61
3.4 Summary ............................................................................................................... 65
Chapter 4 ........................................................................................................................... 67
4 Concluding Remarks .................................................................................................... 67
4.1 Research contributions .......................................................................................... 67
4.2 Future work ........................................................................................................... 68
References ......................................................................................................................... 70
Appendices ........................................................................................................................ 74

viii
List of Tables
Table 2.1 Vortex Tube Rendering Part List ............................................................................ 33
Table 2.2 Measuring equipment used in the present experimental setup ............................... 45
Table 3.1 Summary of experimental test cases. ...................................................................... 51
Table 3.2 Boundary Information for Case 1 ........................................................................... 62
Table 3.3 Boundary Information for Case 4 ........................................................................... 62
Table 3.4 Boundary Information for Low Inlet Pressure ........................................................ 63
Table 3.5 Plenum Information for Case 1 ............................................................................... 63
Table 3.6 Plenum Information for Case 4 ............................................................................... 64
Table 3.7 Plenum Information for Low Inlet Pressure ........................................................... 64

ix
List of Figures
Figure 1.1 Main Components of a Vortex Tube ....................................................................... 2
Figure 1.2 Schematic of the Flow Through a Vortex Tube ...................................................... 2
Figure 1.3 The consolidated data showing the effect of the aspect ratio on the temperature drop
for various inlet pressures and cold mass fractions. ............................................................... 22
Figure 1.4 The consolidated data showing the effect of the ratio between the orifice diameter
and main tube diameter on the temperature drop for various inlet pressures and cold mass
fractions................................................................................................................................... 23
Figure 1.5 The consolidated data showing the effect of the number of injection nozzles in the
vortex generator on the temperature drop for various inlet pressures and cold mass fractions.
................................................................................................................................................. 24
Figure 1.6 The consolidated data showing the effect of the ratio between the plug diameter and
main tube diameter on the temperature drop for various inlet pressures and cold mass fractions.
................................................................................................................................................. 25
Figure 1.7 The consolidated data showing the effect of the angle of the plug tip on the
temperature drop for various inlet pressures and cold mass fractions. ................................... 25
Figure 2.1 Experiment Setup Schematic ................................................................................. 29
Figure 2.2 The laminar mass flow meter used to measure the inlet mass flow rate of the present
vortex tube. ............................................................................................................................. 30
Figure 2.3 A sensor block used to measure the temperature and pressure of the flow entering
and exiting the present vortex tube. ........................................................................................ 30
Figure 2.4 A rotameter with needle valve used to measure and control the volumetric flow rate
at the exits of the present vortex tube. .................................................................................... 32
Figure 2.5 The experimental setup used for testing the present vortex tube. ......................... 32

x
Figure 2.6 Designed Vortex Tube Rendering ......................................................................... 34
Figure 2.7 The main tube of the present vortex tube showing the threaded end and the collar
where the inlet plenum is attached. ......................................................................................... 35
Figure 2.8 The vortex generator used in the present vortex tube showing the inlet nozzles and
cold outlet orifice. ................................................................................................................... 36
Figure 2.9 The truncated plug used at the hot outlet in the present vortex tube. .................... 37
Figure 2.10 The plug’s position in relation to the Main Tube showing the 1 [mm] separation in
the axial direction. ................................................................................................................... 37
Figure 2.11 The inlet plenum of the present vortex tube showing the offset injection through
hole. ......................................................................................................................................... 38
Figure 2.12 The cold outlet plenum of the vortex tube ........................................................... 39
Figure 2.13 The hot outlet plenum used in the present vortex tube showing the through holes
for the pressure and temperature sensors. ............................................................................... 39
Figure 2.14 A sectioned view of the inlet sensor block with hose fitting and inlet pipe showing
the continuous cross section to reduce flow disturbances. ..................................................... 40
Figure 2.15 The data used to calibrate the rotameters along with the developed calibration
function for an inlet pressure of 0.62 [MPa]; Cold Outlet Calibration (a), Hot Outlet Calibration
(b) ............................................................................................................................................ 43
Figure 2.16 Calibration Verification of Rotameters for Inlet pressure of 0.62 [MPa] showing
the calibrated flow rates out of both outlets, the total calibrated outlet flow rate and the
measured inlet flow rate. ......................................................................................................... 44
Figure 2.17 The temperature drop at various cold mass fractions for the three runs of inlet
pressure of 0.62[MPa] and cold outlet Pressure of 0.31[MPa] showing the repeatability of the
experimental system................................................................................................................ 47

xi
Figure 3.1 Temperature drop at various cold mass fractions for the constant cold outlet pressure
experiment set. (Case 1: inlet pressure 0.62 [MPa], pressure drop 0.31 [MPa], pressure ratio
2.00, inlet mass flow rate 9.89[g/s]. Case 2: inlet pressure 0.49 [MPa], pressure drop 0.18
[MPa], pressure ratio 1.59, inlet mass flow rate 7.05[g/s]. Case 3: inlet pressure 0.76 [MPa],
pressure drop 0.45 [MPa], pressure ratio 2.45, inlet mass flow rate 12.66[g/s].) ................... 52
Figure 3.2 Temperature drop at various cold mass fractions for the constant pressure drop
experiment set. (Case 1: inlet pressure 0.62 [MPa], pressure drop 0.31 [MPa], pressure ratio
2.00, inlet mass flow rate 9.89[g/s]. Case 4: inlet pressure 0.49 [MPa], pressure ratio 2.82, inlet
mass flow rate 8.39[g/s]. Case 5: inlet pressure 0.76 [MPa], pressure ratio 1.69, inlet mass flow
rate 11.31[g/s].) ....................................................................................................................... 54
Figure 3.3 Temperature drop at various cold mass fractions for the constant pressure ratio
experiment set. (Case 1: inlet pressure 0.62 [MPa], pressure drop 0.31 [MPa], inlet mass flow
rate 9.89[g/s]. Case 6: inlet pressure 0.49 [MPa], pressure drop 0.24 [MPa], inlet mass flow
rate 7.72[g/s]. Case 7: inlet pressure 0.76 [MPa], pressure drop 0.38 [MPa], inlet mass flow
rate 12.15[g/s].) ....................................................................................................................... 56
Figure 3.4 The effect of the pressure ratio between the inlet and the cold outlet on the
temperature drop at various cold mass fractions for the highest inlet pressure tested. ........... 58
Figure 3.5 Comparison between experimental results and theoretical calculations (using Liew
et al.’s [11] model) of the outlet total temperature ratio at various cold mass fractions. ....... 59
Figure 3.6 The effect of the pressure ratio between the inlet and the cold outlet on the
temperature drop at various cold mass fractions for the low and high inlet pressure
experimental results obtained from Ahlborn et al. [33]. ......................................................... 60
Figure 3.7 The polytropic index value for all seven cases tested on the present vortex tube. 61

xii
List of Appendices
Appendix A: Drawings ........................................................................................................... 74
Appendix B: Additional Experimental Data ........................................................................... 90

1
Chapter 1
1 Introduction
The vortex tube is a mechanically simple device used to separate a compressed flow into
two streams, where one stream is heated, and the other stream is cooled. This phenomenon
occurs without the use of mechanical or electrical input and in the absence of chemical
reactions. The four primary parts that comprise the vortex tube (shown in Fig. 1.1) are: the
vortex generator, the tube that contains the vortex (main tube), the plug, and the orifice
(which is not itself a part, but rather an important feature built into the vortex generator).
The vortex generator is used to tangentially introduce compressed gas into the tube through
the use of one or more nozzles (see inset in Fig. 1.1). The gas is directed nearly tangentially
along the inside wall of the tube, creating the vortex that can take up most of the inside of
the tube (shown in Fig 1.2). The purpose of the plug located at the opposite end of the tube
is to direct the hot gas that collects along the tube wall to escape, while preventing the gas
that collects near the core of the tube from escaping. The gas that escapes past the plug is
a higher temperature compared to the temperature of the gas being injected into the vortex
generator. The gas that collects near the core of the main tube is redirected back towards
the vortex generator, while still maintaining a very high rotational velocity. This gas exits
the tube through the cold orifice, commonly incorporated into the vortex generator device.
The gas escaping through this orifice is at a lower temperature compared to the temperature
of the gas injected into the vortex generator.

2
Figure 1.1 Main Components of a Vortex Tube
Figure 1.2 Schematic of the Flow Through a Vortex Tube
Ranque [1] first discovered the energy-separation phenomena that occurs in what was
henceforth called a “vortex tube” in 1939. Hilsch [2] performed the first meaningful
parametric study on the device in 1947. Since its discovery, the so-called Ranque-Hilsch
vortex tube has been studied extensively, with the focus being on either understanding the
mechanism that drives the temperature separation phenomenon, or on optimizing the
design parameters to achieve a prescribed energy separation. In 1960 Deissler & Perlmutter
[3] took an analytical approach to determine the driving mechanism of the energy
separation present in the vortex tube and came up with a shear work theory. The theory is

3
that the fluid in the core region of the vortex tube (cold stream) does shear work on the
outer region (hot stream) as it expands. This transfer of shear work results in the central
region having a net loss of shear work yielding a reduction in temperature, and the outer
region having a net gain in shear work yielding an increase in temperature. In 1971
Linderstrom-Lang’s [4] hypothesized that the energy separation was the result of heat and
kinetic energy being transported by turbulence. Linderstrom-Lang found that heat
diffusion was significant in the central region, while the kinetic energy diffusion was
significant in the outer region. Linderstrom-Lang also noticed that not taking into account
the change of density (that is present in compressible flows) did not result in significant
order-of-magnitude errors. In 1982 Kurosaka [5] demonstrated that the energy separation
in a vortex tube is primarily the result of acoustic streaming; however, viscous stresses are
also partially responsible.
Industry has found many applications for a vortex tube, even though the temperature
separation phenomenon is still not fully understood. The vortex tube can easily replace the
use of liquid coolant used during milling and turning operations, as it only requires
compressed air, which is a utility most factories and machine shops have readily available.
The vortex tube is also commonly used for keeping electrical cabinets cool. Additionally,
welders and people in similar working conditions can use a vortex tube to produce cold air
that will circulate through a vest/jacket, keeping the worker cool in hot environments. The
vortex tube is even being considered for use in brain surgery. With such diverse
applications and the simplicity of the device, commercial vortex tubes remain popular in
modern industry and further understanding of their function is increasingly important.
1.1 Literature Review
The literature regarding the research of the energy separation phenomenon that occurs in a
vortex tube is vast. In fact, nearly 4,900 articles appear in the literature since the discovery
of the energy separation device in 1933. The literature review reported does not attempt to
report on all prior studies, but rather gives a more modern framework of the most
significant articles sorted into those focused on performing first and second law
thermodynamic analysis on the vortex tube, and those focused on experimental studies
aimed at improving the performance of the vortex tube by altering the geometric and

4
operating parameters. The progression of using CFD for simulating the complex internal
flow of a vortex tube will then be examined. The data consolidated from the experimental
and numerical studies will then be reviewed for determining suitable geometric parameters
and operating conditions for the vortex tube to be studied in the present research.
1.1.1 Thermodynamic Analysis
The vortex tube is able to produce two streams, one being heated and the other being
cooled, simultaneously, without any moving parts, electrical input or chemical reactions.
There were thoughts that a device like this “appears to defy the second law of
thermodynamics by simulating a Maxwell demon” [6, p. 88]. However, Silverman [6]
presents a second law of thermodynamics analysis on a vortex tube to show that there is
no violation. Silverman concluded that the temperature separation is the result of rotational
expansion with the work input being the initial compression of the air used at the inlet of
the vortex tube. Furthermore, the analysis showed that the vortex tube had a positive
change in the net entropy.
Simões-Moreira et al. [7] performed thermodynamic analysis of a vortex tube, with a focus
on finding the operational limits, and a coefficient of performance that was applicable to
both heating and cooling applications of the device. The first limit was found by treating
the system as an adiabatic throttling device, while the second limit was obtained by
examining the second law of thermodynamics. Simões-Moreira et al. also found that the
COP for a vortex tube was identical regardless if it was being used for cooling or heating.
They finally concluded that the vortex tube has the potential to be significantly improved
in regards to the COP, as the vortex tube’s COP was approximately 5% of the isentropic
COP.
Saidi & Allaf Yazbi [8] proposed that a conventional energy examination of a vortex tube
is insufficient for optimizing the energy separation phenomenon and performed an exergy
analysis in addition to a first and second law of thermodynamic analysis. Their exergy
analysis accounts for losses from the pressure drop, separation and heat transfer, yielding
an irreversibility term. Experimental verification was conducted for the exergy analysis;
resulting in Saidi & Allaf Yazbi discovering that the exergy destruction decreases with an

5
increase in inlet pressure, tube length, and nozzle area. These three parameters also
increased the temperature separation. Thus, by minimizing the exergy destruction, the
energy separation phenomenon improves.
Kargaran et al. [9] focused on the entropy generation of a vortex tube that used natural gas
as a working fluid. The entropy generation was integrated over the range of cold mass
fractions for various geometries of the vortex tube. These integrated values could then be
compared to determine an optimal value for geometric parameters of the vortex tube.
Kargaran et al. concluded that the optimal value for the aspect ratio was 20, and the optimal
diameter of the cold outlet orifice was half of the main tube diameter.
Lewins & Bejan [10] performed a thermodynamic analysis to optimize a vortex tube being
treated as a heat exchanger. The analysis showed that the vortex tube would be optimal
when half of the inlet mass is heated, and the other half is cooled; yielding a cold mass
fraction of 0.5. Lewins & Bejan [10] also determined bounds on the temperature separation
using the second law of thermodynamics. The bound on the temperature separation was
dependent on the working fluid and pressure ratio of the vortex tube.
Liew et al. [11] analyzed the thermodynamics that takes place in a vortex tube taking in to
account the internal flow. By including the swirl Mach number of the flow, as well as the
radius of the vortex tube and vortex chamber, Liew et al. were able to relate inlet/outlet
pressures to the temperature ratio of the outlets. A model was created of this relationship
and validated using experiments on a vortex tube (which showed good agreement).
Polihronov & Straatman [12] examined the thermodynamics of a compressed flow through
a rotating duct to predict the temperature separation and to advance the understanding of
the physics involved. The system consisted of a rotating duct with an outlet at the center of
rotation and an inlet tank of compressed gas at the largest duct radius. The gas cools as it
expands and moves towards the center of rotation. The rotating duct results in a spiral flow
pattern, i.e. a particle has both radial and tangential velocity components (to a stationary
reference frame). This is a similar flow pattern for a particle in the vortex tube that exits
through the orifice. When coupled with the fact that both devices experience similar
temperature separation and radial pressure trends, the rotating duct can be considered a

6
discrete element of the vortex tube. Polihronov & Straatman concluded that the cooling
effect seen at the center of a rotating compressed flow is the result of 3 parts; adiabatic
expansion, the fluids’ internal/rotational energy to be transferred to the system’s rotational
energy (conserving angular momentum), and compressibility (as it pertains to the fluids
ability to transfer its internal energy).
1.1.2 Experimental Investigation
Hilsch [2] performed the first parametric study on a custom vortex tube and determined
that temperature separation was dependent on four sets of variables. The first set relates to
the fluid properties of the compressed gas at the inlet (temperature, pressure, and mass flow
rate). The second set is the pressure at the outlets of the vortex tube. The third set of
variables are the design parameters (diameter of the main tube, orifice and nozzle). The
last set is the ratio of mass flow leaving the two outlets (cold mass fraction). Hilsch
reported both the temperature drop on the cold outlet and the temperature rise on the hot
outlet and used these values for evaluating the performance of the different vortex tube
configurations evaluated.
Since Hilsch’ parametric study, countless studies have been performed with an emphasis
on Hilsch’ third set of variables: design/geometric parameters. A majority of the parametric
studies reviewed tested the various geometric parameters with multiple inlet pressures (first
set of variables), and across the range of cold mass fractions (fourth set of variables).
Articles that were primarily focused on examination of geometric parameters are first
reviewed. Additional experimental studies were reviewed that focused on the external heat
loss/gain to the vortex tube, as well as articles that tested more abstract theories.
1.1.2.1 Geometric Parameters
Dincer et al. [13] performed an extensive parametric study of vortex tubes looking at the
effect that the aspect ratio and the number of inlet nozzles had on the temperature
separation process. A maximum temperature separation (temperature change between the
hot and cold outlets) of 56 [K] was achieved using the highest aspect ratio and 4 nozzles.
Dincer et al. also recommended that the inlet pressure should be set to the maximum of
what the experimental setup was capable of for best performance. Dincer et al. [14]

7
continued the experimental investigation by looking at the effect that various geometric
variables of the plug had on temperature separation across an extensive range of inlet
pressures. The design variables tested were: the position of the plug, the diameter of the
plug, and the angle of the plug tip. Dincer et al. additionally, tested the effect that the
number of inlet nozzles had on the temperature separation phenomenon. The conclusion of
this second parametric study was the plug with the smallest diameter and the sharpest tip,
utilizing 4 inlet nozzles resulted in the most significant temperature separation. It was also
noted that the effect of increasing the inlet pressure on the temperature separation plateaued
at 380[kPa].
Saidi & Valipour [15] also studied the effect of the orifice diameter, in addition to the
number of inlet nozzles and the aspect ratio of the tube in an attempt to increase the
temperature drop. Saidi & Valipour however, only reported the results of the various
design parameters at a single inlet pressure and mass flow split. Their experiments showed
that 3 inlet nozzles out-performed 4 nozzles in regards to both the temperature drop and
energy separation efficiency. Saidi & Valipour also suggested that there was an optimal
aspect ratio of the vortex tube, in addition to the energy separation process being affected
by the specific heat ratio of the working fluid.
Im & Yu [16] examined numerous parameters of a vortex tube through experimentation to
provide optimal design values. The parameters tested were the nozzle area with a constant
number of nozzles, the aspect ratio of the vortex tube, the diameter of the cold orifice,
shape and size of the hot exit plug, internal surface roughness, and effect of using a sleeve
(an additional part to the vortex tube that is inserted into the main tube at the cold outlet
end; resulting in a tapered diameter starting from the main tube inner diameter to the orifice
diameter). The experimental setup measured the temperature at the inlet, both outlets, and
at various positions along the vortex tube. The temperature measurement of the internal
flow was capable of moving in the radial direction allowing for the radial temperature
distribution to be measured. The pressure was also measured at the inlet in addition to the
flow rate; the flow rate out of the cold outlet was also measured. When looking at the nozzle
area, the most significant temperature drop at the cold outlet was achieved with a larger
area, while the most significant temperature rise at the hot outlet occurred with a smaller

8
area. However, neither the largest or the smallest area resulted in the highest temperature
drop/rise, suggesting that there is an optimal nozzle area that is dependent on the
application of the vortex tube.
Celik et al. [17] tested the effect of aspect ratio and different vortex generators of a
commercially available tube while reporting the actual temperature of the cold and hot
outlets. The vortex generators tested had both the nozzle area and orifice diameter change,
such that the vortex generator with the smallest orifice also had the smallest nozzle area,
and the vortex generator with the largest orifice also had the largest nozzle area. The
experiments showed that the vortex generator with the largest orifice diameter/nozzle area
resulted in the most significant temperature separation. Celik et al. concluded that the
optimal aspect ratio was dependent on both geometric properties as well as operational
conditions.
Nimbalkar & Muller [18] studied how the diameter of the orifice affected the energy
separation of a commercially available vortex tube. Four different orifice diameters were
tested for a single inlet pressure. From their experiments, it was suggested that the
secondary flow was dependent on the orifice diameter, and the secondary circulation
hinders the performance. It was also concluded that the effect of the orifice diameter was
of little importance on the performance for higher cold mass fractions.
Promvonge & Eiamsa-ard [19] further studied the effect that the number of inlet nozzles
and the cold orifice diameter had on the temperature drop; in addition to also examining
the effect of insulating the vortex tube during operation. Promvonge & Eiamsa-ard also
determined that the increased number of inlet nozzles and a smaller cold orifice diameter
provided improved performance. It was also noted that the smaller cold orifice diameter
provided larger backpressure, while a larger diameter resulted in an increased tangential
velocity in the cold tube. Lastly, Promvonge & Eiamsa-ard concluded that the insulation
provided an increase in the energy separation, as the amount of energy lost to the
surroundings was reduced.
Kirmaci et al. [20] experimented with both the working fluid and the number of inlet
nozzles of a vortex tube. The experiments were carried out on a range of inlet pressures;

9
however, the cold mass fraction was held at 0.5. The results of the experiments showed
that the higher inlet pressures resulted in colder air leaving the orifice. When looking at the
hot outlet flow, the highest temperature was not always at the highest pressure and changed
with the number of nozzles used to inject the air into the vortex tube. Lastly, Kirmaci et
al.’s results showed that increasing the number of nozzles decreased the performance of
the vortex tube while using oxygen instead of air improved the performance.
Xue & Arjomandi [21] examined how the nozzle angle (relative to tangential inlet flow) of
the vortex generator affects the flow split and the temperature separation. By changing the
nozzle angle of the vortex generator, the axial component of the flow was altered resulting
in changes in the mass flow split; thus, an increased angle would result in an increased cold
mass fraction. It was also found that for the lower tested inlet pressures, a smaller angle on
the vortex generator resulted in an increased temperature change. However, it was unclear
if the change in the temperature separation was the result of the angle of the vortex
generator or the result of the change in the mass flow split.
Aydin & Baki [22] examined the temperature drop of the cold outlet, and the temperature
rise at the hot outlet with varying aspect ratios, inlet nozzle diameters, and plug tip angles.
By changing the diameter of the inlet nozzles, the amount of mass flow was changed while
maintaining the desired inlet pressure. From the experiments, it was concluded that the
inlet pressure and the cold mass fraction had significant roles in the energy separation
process. It was also found that a smaller plug tip angle outperformed larger angles, as well
as the optimal diameter of the orifice being a third of the main tube's diameter.
Aydin et al. [23] designed and tested a new vortex generator referred to as a helical vortex
generator. The vortex generator is a bar with a channel that has a single revolution for the
entire length. Different lengths of the helical vortex generator were tested, and the
temperature drop and rise were both examined. Additionally, Aydin et al. also tested the
helical vortex tube with different aspect ratios of the vortex tube. Again, the focus was on
the temperature drop and the temperature rise at the respective outlets. The experiments
showed that the shorter helical generator was preferable to longer ones. The shorter helical

10
path results in a smaller axial velocity. Aydin et al. also found that the larger aspect ratio
of the vortex tube outperformed the smaller aspect ratios.
Markal et al. [24] continued experiments using the helical vortex generator designed by
Aydin et al. [23], with a focus on the plug tip angle. The experiments were carried out in a
similar fashion, using the temperature drop and rise for evaluating the performance of the
different plug tip angles. Markal et al. concluded that although smaller plug tip angles were
preferable, this was only noticeable when the aspect ratio is small as well. Thus, the plug
tip angle can be considered negligible for larger vortex tube aspect ratios.
Avci [25] examined the effect that aspect ratio of the inlet nozzles and number of nozzles
had on the temperature separation of a vortex tube. A helical nozzle design was used in the
experiments, with a single nozzle being used when testing the effect of the aspect ratio, and
a constant nozzle area when testing the effect of multiple nozzles. The experimental results
showed for the tested range of inlet pressures that a nozzle with a reduced height in the
radial direction and an increased length in the axial direction (resulting in a lower aspect
ratio) produced a more significant temperature separation compared to nozzles with a
larger aspect ratio. The effect that the nozzle aspect ratio had on the performance of the
vortex tube was contributed to the larger aspect ratios producing considerable mixing
between the hot and cold streams. The experiments also showed that a single nozzle was
capable of producing a larger temperature separation compared to 2 and 3 nozzles. Avci
concluded that this might be due to the reduced pressure loss across the vortex generator
and the reduced turbulence when a single nozzle is used.
Eiamsa-ard [26] proposed and tested a new vortex generator referred to as a snail entry.
The channel for the inlet air rotated around the main tube with a decreasing cross-sectional
area. The channel ends as it completes the rotation. 1 to 4 ports (nozzles) in the channel
allows the air to enter the main tube with the high tangential velocity. A more conventional
vortex generator was also tested, and the results were used as the baseline to compare the
new vortex generator. The results showed that the temperature drop at the cold outlet
increased using the snail vortex generator (of any number of nozzles). The rationale
proposed for this was that there was a reduced pressure drop across the nozzles, allowing

11
for a stronger vortex. Eiamsa-ard also concluded that a smaller orifice results in increased
backpressure, whereas a larger orifice results in additional mixing of the two streams.
Wu et al. [27] designed a vortex generator such that the gradient of the Mach number was
similar for each nozzle. Additionally, the authors modified the plenum around the vortex
generator to a snail configuration. Lastly, a diffuser was also designed to remove any radial
velocity from the air exiting the hot end of the vortex tube. Both the new vortex generator
and the diffuser resulted in an improved temperature drop on the cold outlet.
Devade & Pise [28] further studied the effect of the aspect ratio, orifice diameter, and plug
tip angle. In addition to examining the cold outlet temperature drop, Devade & Pise also
examined the Mach number at the inlet by varying the inlet pressure and the cold mass
fraction. Devade & Pise found that a supersonic flow at the inlet results in an increased
temperature drop, but overall decreases the COP for all aspect ratios tested.
1.1.2.2 External Heat Transfer
Kumar et al. [29] tested the vortex tube's ability to cool as well as dehumidify the inlet air
when the vortex tube was insulated and non-insulated. The experimental setup measured
the temperature, pressure, relative humidity, and volumetric flow rate at the inlet and the
cold outlet; while only the temperature at the hot outlet was measured. The effect of
insulating the vortex tube on the temperature drop at the cold exit was minimal; however,
the temperature rise at the hot outlet was affected. Not only did the insulation allow for an
increase in the maximum temperature rise, but it also pushed the maximum temperature
rise to a lower cold mass fraction. Without insulation, the max temperature rise occurs at
the highest cold mass fraction; however, with insulation, the max occurred around a cold
mass fraction of 0.7. A similar trend was seen when examining the relative humidity.
Although the magnitude of the maximum relative humidity was not affected, the cold mass
fraction that resulted in the maximum relative humidity was again reduced by insulating
the vortex tube.
Ramakrishna et al. [30] examined the effect that the thermal conductivity of the vortex tube
had on the energy separation process. The vortex tube was tested using different materials

12
(including copper, PVC, and mild steel) for the main tube's construction. Ramakrishna et
al.'s theory was that a vortex tube with a high thermal conductivity would result in
increased energy separation; furthermore, this would suggest that the energy separation is
the result of work transfer. However, the results from the experiment did not show
improved energy separation for the vortex tubes with higher thermal conductivity. The
material with the lowest thermal conductivity resulted in the most significant energy
separation, while the vortex tube with high thermal conductivity, produced the least amount
of energy separation.
Eiamsa-ard et al. [31] examined the effect that cooling the exterior of the vortex tube had
on the cooling efficiency of the vortex tube. To cool the vortex tube, a water jacket was
used to create a counter flow heat exchanger with the vortex tube being at the core. The
cold water entered the water jacket at the hot outlet end and exited by the vortex generator.
By passing cold water over the vortex tube, the amount of energy removed from the system
would be increased. Eiamsa-ard et al. concluded that the experiments resulted in lower
cold outlet temperatures and in turn, an increase in the cooling efficiency of the vortex
tube.
1.1.2.3 Additional Experimental Studies
Balmer [32] tested a commercially available vortex tube using water as the working fluid
in order to determine if the temperature separation phenomenon was the result of the
compressibility of gases. The experiments showed temperature separation between the two
outlets; however, both outlets were at a higher temperature compared to the inlet
temperature. Thus, the cooling effect of the vortex tube was not present, and the
compressibility effect of gases is required to achieve the energy separation that occurs in a
vortex tube.
Ahlborn et al. [33] performed an experiment to see if the energy separation phenomenon
was still present in a vortex tube with low-pressure conditions. Instead of providing
compressed air to the inlet, the inlet was open to the atmospheric conditions; while a
vacuum pump was connected to both outlets. This configuration was able to produce a
temperature drop between the inlet and the cold outlet; however, the temperature rise of
13
the hot outlet was minor. Ahlborn et al. attribute this to moisture in the atmospheric air that
was drawn in at the inlet. Ahlborn et al. then tested their vortex tube in the conventional
manner, with a high-pressure inlet and outlets open to the atmosphere. These additional
experimental runs allowed for direct comparison to the low-pressure experiment, to
provide perspective on the temperature drop achieved by the low-pressure conditions. The
comparison showed that the low-pressure conditions produced similar values as the 20 [psi]
(140 [kPa]) gauge pressure inlet run; however, improved energy separation was present
with higher inlet pressures.
Attalla et al. [34] performed experimental studies on the vortex tube, however instead of
examining a geometric parameter of the vortex tube, the effect of using two vortex tubes
in two different configurations was tested. The first configuration had the tubes connected
in a serial configuration, such that the cold outlet of the first vortex tube was used as the
input to the second tube. The hot outlets were connected to each outer, thus resulting in
both hot outlets being the same pressure. The second set up was using the vortex tubes in
parallel; the inlet was equally split and injected into the inlets of the two vortex tubes, while
the cold outlets were connected to each other, as well as the hot outlets. The results from
the experiments showed that the serial configuration significantly increased the
temperature drop compared to a single vortex tube, while the parallel configuration only
slightly increased the temperature drop. However, when looking at the temperature rise at
the hot outlet, the parallel configuration resulted in the significant improvement, while the
serial configuration only provided a slight improvement, when compared to a single vortex
tube.
Subudhi & Sen [35] reviewed available experimental data, with the intent of determining
the key variables that affect the energy separation process of the vortex tube, as well as
finding a correlation between these variables and the performance of a vortex tube. A total
of 26 articles were reviewed, and the key variables were; diameter of the tube, the length
of the tube, the inlet diameter, the orifice diameter, the inlet pressure, and the cold mass
fraction. Using these variables, an equation was formulated to find the optimal efficiency,
COP, and temperature drop. While the reviewed experimental data was used to fit an
equation to the data creating the correlation, Subudhi & Sen concluded that the correlation

14
found could be used for preliminary design, but additional experiments would be needed
to improve the model.
Gao et al. [36] focused on the flow inside of the vortex tube; measuring the velocity,
pressure and temperature distribution. They used a custom vortex tube that allowed them
to insert a pitot tube at different lengths from the entrance of the vortex tube. The pitot tube
was able to translate and rotate at each testing position, thus allowing for measurements to
be taken at different radial positions. Gao et al. concluded that turbulent mixing occurs near
the vortex generator, as well as improved performance may be achieved with enhanced
secondary circulation inside of the vortex tube.
1.1.3 Numerical Investigations
Xue et al. [37] reviewed the various explanations for the energy separation phenomenon
that occurs in a vortex tube based on prior theoretical and computational work. The
explanations examined included pressure gradient, acoustic streaming, viscosity and
turbulence, secondary circulation, and static temperature gradient. Xue et al. concluded
that the secondary flow and the angular momentum of the flow are potentially the
mechanisms that result in the energy separation; however, a further understanding of the
flow inside of the vortex tube was required.
Analyzing the internal flow of a vortex tube through experimentation has been attempted,
however, the complexity of the compressible, high-speed rotating flow has made its
measurement difficult and has resulted in missing information for sorting out the
mechanism for energy separation. CFD simulations have the capability to replicate the
complex swirling flow found in a vortex tube and thus have the potential to aid in
determining the mechanism that drives the energy separation phenomenon. However, the
use of numerical methods to resolve the complex swirling flow has not been without its
own challenges. As such, articles pertaining to general setup, boundary conditions and
turbulence model selection are reviewed here. This is followed by reviewing the articles
that focused on providing a detailed analysis of the internal flow, followed up with
additional CFD simulations that focus on additional design features of a vortex tube.
15
1.1.3.1 Turbulence Model Validation
Skye et al. [38] carefully examined the geometry of a commercially available vortex tube
to accurately produce a 2D modal for CFD simulations. The simulation utilized the
axisymmetric swirl flow model available in FLUENT and used the k-ε model for
incorporating turbulence. The boundary conditions applied to the simulation were obtained
from experiments performed on the commercial vortex tube. The inlet condition was
specified as a mass flow inlet, while the outlets were treated as pressure outlets. The
temperature at the outlets and the inlet pressure from the experiment were then compared
to their respective values calculated in the simulation. The results of this comparison
showed that the calculated inlet pressure was significantly lower than the inlet pressure
found in the experiment. Skye et al. stated that a lower predicted inlet pressure was
expected. However, the difference was substantial, and the inlet area of the model was
reduced to correct the pressure. With this change, the results obtained from the CFD
simulation were comparable to the experimental results, with the simulation consistently
underpredicting the energy separation.
Thakare & Parekh [39] performed CFD simulations to determine how the different
turbulence models (k-ε, k-omega, Reynolds Stress Model, and Spalart Allmaras) and
working fluids (air, CO2, N2, O2) affected the energy separation process that takes place
in a vortex tube. The simulation used a 2D axisymmetric model, that was shown to have a
grid-independent result with 57,000 cells. Thakare & Parekh used Skye et al.’s [38]
experimental results to both apply boundary conditions and validate their CFD model.
Thus, a mass flow boundary condition was used on the inlet, and pressure outlet conditions
were applied to both outlets. All turbulence models tested resulted in energy separation
occurring; however, the magnitude of the energy separation was not consistent between the
models. The Reynolds Stress Model yields significant underprediction in temperatures
when compared to the experimental results of Skye et al. [38]; whereas the Spalart
Allmaras turbulence model only slightly overpredicted the outlet temperature. Both k-
omega and k-ε models resulted in predicted temperatures close to the experimental results,
with Thakare & Parekh concluding that their model more accurately predicted the outlet
temperatures than Skye et al.’s [38] results. When examining the effect of the working
16
fluid, Thakare & Parekh found that N2 produced the most significant energy separation,
with O2 and air producing energy separation slightly less than N2, and CO2 produced a
significantly lower energy separation. Thakare & Parekh attributed this trend to the
differences in the gases’ thermal diffusivity and thermal conductivity; where gases with
lower thermal diffusivity and thermal conductivity yields lower temperature separation,
compare to gases with higher values of thermal diffusivity/conductivity.
Thakare & Parekh [40] using a commercially available vortex tube, performed both
experiments and CFD simulations comparing the two results for various inlet pressures.
The experimental setup measured the temperature and pressure at the inlet and both outlets;
additionally, the volumetric flow rate was measured at the inlet and the cold outlet. A 2D
axisymmetric approach was used in the CFD simulation, with a k-ε model for turbulence.
The boundary conditions used in the CFD simulation were pressure based. The comparison
between the experimental results and simulation results had a good agreement.
Liu & Liu [41] modelled a commercial vortex tube for a 3D CFD simulation. The model
had a mass flow inlet boundary condition, and pressure outlet boundary conditions for the
hot and cold outlets. The boundary conditions were set using values obtained from
experiments performed on the commercial vortex tube that was modelled. These
experiments were also used to verify the simulations. The experimental set up included
back-pressure tanks, that allowed for setting the pressure at each outlet, allowing for the
simulation to be a close representation of the physical setup. Liu & Liu ran the CFD
simulation testing several turbulence models. The comparison between the experimental
results and the results obtained from the various turbulence models showed that both
Realizable k-ε and RSM had a good agreement. Both of these models also were able to
produce detailed results of the complex internal flow present in a vortex tube. Lastly, Liu
& Liu concluded that the diameter of the cold orifice affected the interaction between the
angular momentum and the kinetic energy transfer. As a result, the diameter of the cold
orifice has an optimal value that produces a maximum energy separation.
Alekhin et al. [42] developed a 3D model for CFD simulations to test the accuracy of
different turbulence models on a double circuit vortex tube (a double circuit vortex tube

17
utilizes a secondary inlet in the axial direction located at the hot outlet). The absolute
pressure and temperature were specified at the primary inlet, while the secondary inlet had
a mass flow rate defined. The hot outlet boundary condition was also a mass flow rate and
was set to be equivalent to the mass flow rate through the primary inlet. The cold outlet
was set to atmospheric pressure. The evaluation of the turbulence models showed that LES
results in the highest accuracy, however, was significantly more computational demanding.
The least accurate models were the k-ε and k-ε RNG models. The last two models (SAS-
SST and RSM-LRR) were shown to be a compromise between accuracy and computational
requirements/time, thus providing less accurate results than the LES model while being
significantly less computationally demanding.
1.1.3.2 Details of Internal Flow
Aljuwayhel et al. [43] examined the internal flow of a vortex tube using a 2D asymmetrical
CFD simulation. The stagnation temperature and pressure were specified at the inlet. The
cold and hot outlets used pressure outlet conditions, where the cold outlet was set to
atmospheric pressure, and the hot outlet pressure was varied to alter the cold mass fraction.
The CFD simulation was conducted using both k-ε and RNG k-ε. To validate the CFD
simulation, experiments were also conducted, and it was determined that the k-ε showed
good agreement with the experimental results. The internal flow results obtained from the
simulation showed three flow regions, the first was the flow that left the hot outlet, the
second was the flow that left the cold outlet, and the third was the flow that recirculated
within the vortex tube. Aljuwayhel et al. proposed that it was these three flows that allow
the energy separation phenomenon to occur. Aljuwayhel et al. further suggest that viscous
shear is present between these flows resulting in work transfer. Aljuwayhel et al. also used
their model to perform a parametric study of the length and diameter of the vortex tube.
The parametric study showed that energy separation would be maximized for an optimal
length, while a vortex tube with a longer or shorter length will experience a decrease in the
energy separation. Energy separation will also decrease if the diameter of the vortex tube
is increased as this increased diameter results in decreased angular velocity.
Behera et al. [44] modelled a 60o segment of a vortex tube, to be used in a CFD simulation.
A 2D simulation using an axisymmetric approach assumes a continuous ribbon for an inlet

18
which does not accurately represent a finite number of nozzles. By modelling a 3D segment
of the vortex tube, the geometry of the nozzles can be preserved while reducing the number
of cells. The boundary conditions applied to the inlet and outlets were all pressure based,
using values from experimental data found in the literature. The cyclic boundary conditions
were applied to the internal faces of the modelled segment. The results obtained from the
simulation show for a particle exiting at the hot outlet, it starts with a significant swirl and
minimal axial components to its velocity. As this particle moves to the hot exit, both
velocity components are reduced; resulting in a significant decrease in the swirl component
and only a minor decrease in the axial component of the velocity. When examining a
particle that exits through the cold outlet, a similar trend is seen in the swirl and axial
components of the velocity until the particle reaches the point that it turns around. At this
point, the axial velocity is zero; however, a small swirl velocity component remains. The
particle's axial velocity then accelerates towards the cold outlet; the swirl velocity also
increased slightly in magnitude as it approached the cold outlet. Behera et al. concluded
that these trends in the swirl and axial velocities are the results of a free vortex regime
located near the inlet, and for the majority of the vortex tube a forced vortex regime is
present. When looking at the temperature of the particles, the particle leaving the hot outlet
experiences warming as it travels the length of the vortex tube with the bulk of the warming
being done near the inlet. The particle that exits through the cold outlet initially warms
while travelling towards the hot outlet, and starts cooling once it turns back towards the
cold outlet. Similar to the heating of the hot outlet particle, the bulk of the heating and the
cooling of the cold outlet particle is seen near the inlet.
Kim [45] examined the internal flow of a vortex tube using both a numerical and an
experimental approach. The focus was on visualizing the flow. Dye was injected into the
vortex tube near the tube wall for each experiment. The geometry of the tube was constant,
with only the inlet pressure and cold mass fractions being varied. A change in the stagnation
position was noticed, such that an increase in the cold mass fraction or the inlet pressure
moved the stagnation point towards the vortex generator. The numerical simulations also
showed a similar trend with the stagnation position when using particle tracing.

19
1.1.3.3 Design Exploration
Rafiee & Sadeghiazad [46] focused on the plug shape for their experimental investigation
of the vortex tube. The four plug shapes tested were flat, spherical, cone, and truncated
cone. In addition to performing an experimental analysis of the vortex tube, they also
numerically simulated the vortex tube in Fluent, using their experimental results to validate
the model. To account for the compressible rotational flow through the vortex tube, they
used an RSM turbulence model with a 3D geometry of the vortex tube. The boundary
conditions used were pressure inlet with specified stagnation temperature, with the two
outlets being treated as pressure-far-field, while the walls of the vortex tube were
considered to be adiabatic with no slip. The experimental results showed that a truncated
cone produces the highest temperature drop compared to the other plug shapes. The
numerical simulation echoed this and also showed that the truncated cone resulted in an
increased axial and tangential velocity.
Rafiee & Sadeghiazad [47] used experiments to examine the effect of the length of the
truncated cone, and the number of nozzles had on temperature drop/rise of the vortex tube
outlets. They then performed a 3D simulation of their vortex tube using a k-ε turbulence
model. The experiment measured the inlet temperature and pressure, while both outlets had
the temperature, pressure, and volumetric flow measured. As a result of these
measurements, the CFD simulation used an inlet pressure boundary condition on the inlet,
and the outlets used a pressure-far-field condition. The experimental results showed that
an optimal length for the truncated cone exists and that by going longer or shorter results
in decreased performance. The experimental results also showed that the maximum
temperature drop (which occurs at low cold mass fraction) of a vortex tube could be
increased by increasing the number of nozzles; however, at higher cold mass fractions
fewer nozzles resulted in an increased temperature drop.
Kandil & Abdelghany [48] examined the vortex tube using numerical simulations in
addition to experimental results. There was a focus on the temperature drop and rise while
examining the effect of the aspect ratio and the diameter of the cold orifice. The
experimental results showed that the smaller cold orifice diameter resulted in an increased
temperature drop; however, a larger orifice diameter resulted in an increased temperature

20
rise. The numerical simulation was used to examine the effect of adding fins to the exterior
of the vortex tube, thus increasing the energy exchange between the vortex tube and the
surroundings. It was determined that the fins would improve the temperature drop;
however, Kandil & Abdelghany stated that further research would be required on the
design of the actual fins.
Dhillon & Bandyopadhyay [49] used numerical simulations to evaluate the effect a flared
tube had on the temperature separation. The model used on the simulation was 3D;
however, it was only of a segment of the vortex tube, relying on the axisymmetrical
properties of the flow. A standard k-ε model was used along with the Redlinch-Kwong real
gas equation of state. The simulation was verified using experimental results found in the
literature. Dhillon & Bandyopadhyay results showed that a straight wall tube was capable
of achieving lower cold outlet temperatures and high hot outlet temperatures, however, the
difference between the flared and straight tube was minimal.
Bovand et al. [50] used a CFD model to examine how curving the vortex tube would affect
the performance. A straight vortex tube was first modelled to be used for comparison to
the curved vortex tube model and to validate the model. The inlet pressure and temperature
were specified at the inlet. The cold outlet was set to atmospheric pressure, and the hot
outlet pressure was varied to alter the cold mass fraction. The turbulence model used was
RNG k-ε. The cold outlet temperature was used to evaluate grid independence, and the
model was deemed grid independent with 5 × 10⁵ hexahedral cells. Bovand et al. then
validated a straight vortex tube simulation using experimental data found in the literature
and was concluded that the simulation had good agreement with the experimental results.
With the straight vortex tube validated, Bovand et al. proceeded with curving the vortex
tube and found that curving resulted in a reduction in the performance of the vortex tube.
This reduction in the performance was the result of mixing hot and cold streams inside of
the vortex tube. By curving the vortex tube, additional vortices are created within the vortex
tube, which mixes the two flows.
Dutta et al. [51] performed a CFD simulation of a vortex tube that had air at a cryogenic
temperature supplied to the inlet and compared to simulation results with a room

21
temperature inlet. The simulation used the 2D axisymmetric approach, where the outlet
boundary conditions were pressure-based, and the inlet condition had the total pressure and
total temperature defined. The selected cryogenic temperature at the inlet was set slightly
above the saturation temperature at the specified pressure; this was done to prevent the air
from condensing inside of the vortex tube. The results of the simulation showed a reduced
temperature separation and swirl velocity for the cryogenic inlet temperature. The
reduction in the temperature separation was attributed to reduced exergy at the inlet;
whereas the reduction in the swirl velocity was the result of increased density at the
cryogenic temperature.
1.1.4 Consolidation of data
The literature review shows that not only are there numerous design and operation
parameters that affect the performance of a RHVT, but there are also several ways to
quantify the performance. Furthermore, it was shown that there were discrepancies as to
what values are required to achieve improved performance. As such, the data from 30
papers ([2], [13] – [24], [26], [28], [29], [31], [37], [40], [41], [45], [46], [48], [52]–[58])
(resulting in 4990 data points) was consolidated with all available information for each
point being stored. This consolidation of data results in some data points containing
information on specific design, operation, and performance parameters while having a lack
of information on other parameters. For example, a data point might contain design
information pertaining to the main tube, vortex generator, and orifice, but will not have any
information on the plug.
It was determined that there are 5 key geometric parameters; the ratio between the main
tube’s length to its diameter (aspect ratio), the ratio between the orifice diameter and the
internal diameter of the main tube (orifice diameter ratio), the number of injection nozzles
(number of nozzles), the ratio between the diameter of the plug to that of the internal
diameter of the main tube (plug diameter ratio), and the tip angle of the plug (plug tip
angle).
To accurately compare the data gathered from the reviewed literature, the temperature drop
between the inlet and the cold exit was used to evaluate the performance of the data point.
22
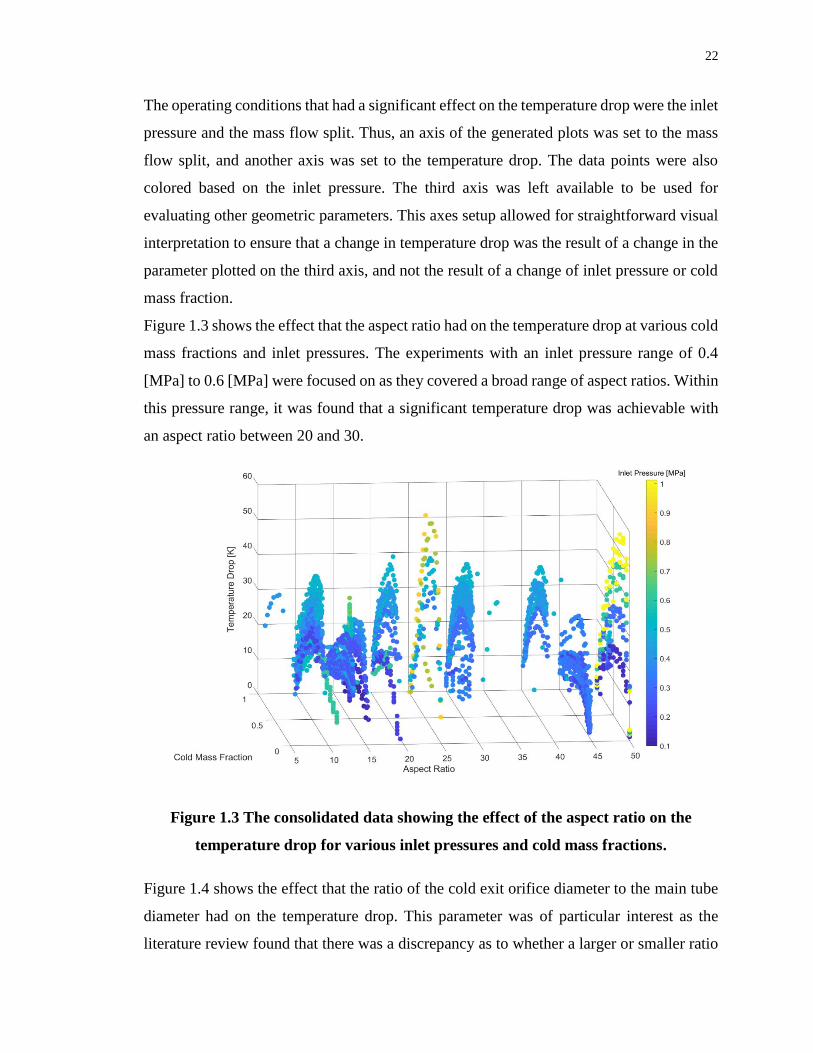
The operating conditions that had a significant effect on the temperature drop were the inlet
pressure and the mass flow split. Thus, an axis of the generated plots was set to the mass
flow split, and another axis was set to the temperature drop. The data points were also
colored based on the inlet pressure. The third axis was left available to be used for
evaluating other geometric parameters. This axes setup allowed for straightforward visual
interpretation to ensure that a change in temperature drop was the result of a change in the
parameter plotted on the third axis, and not the result of a change of inlet pressure or cold
mass fraction.
Figure 1.3 shows the effect that the aspect ratio had on the temperature drop at various cold
mass fractions and inlet pressures. The experiments with an inlet pressure range of 0.4
[MPa] to 0.6 [MPa] were focused on as they covered a broad range of aspect ratios. Within
this pressure range, it was found that a significant temperature drop was achievable with
an aspect ratio between 20 and 30.
Figure 1.3 The consolidated data showing the effect of the aspect ratio on the
temperature drop for various inlet pressures and cold mass fractions.
Figure 1.4 shows the effect that the ratio of the cold exit orifice diameter to the main tube
diameter had on the temperature drop. This parameter was of particular interest as the
literature review found that there was a discrepancy as to whether a larger or smaller ratio

23
resulted in higher performance. When comparing to similar inlet pressures, Fig. 1.4 showed
that ratios between 0.3 and 0.4 resulted in the most significant temperature drop.
Figure 1.4 The consolidated data showing the effect of the ratio between the orifice
diameter and main tube diameter on the temperature drop for various inlet
pressures and cold mass fractions.
Next, the number of injection nozzles was examined, as shown in Fig. 1.5. This plot is
misleading, as even when accounting for the inlet pressure the plot indicates that a single
injection nozzle produces the most significant temperature drop. However, when changing
the colour mapping parameter, it is shown that other parameters were significantly different
from that of the rest of the data shown in Fig. 1.5. Thus, looking at the data for a pressure
range of 0.2 [MPa] to 0.5[MPa] (which have comparable values for other geometric
parameters), it was determined that an increase in the number of nozzles serves to in
increase the temperature drop. However, this effect starts to diminish when increasing
beyond 4 nozzles.

24
Figure 1.5 The consolidated data showing the effect of the number of injection
nozzles in the vortex generator on the temperature drop for various inlet pressures
and cold mass fractions.
Figure 1.6 and 1.7 pertain to the plug size and shape, respectively. Most design
configurations of a RHVT have a plug diameter ratio of 0.5 or 1.0 with a few configurations
using a ratio less than 0.5. From Fig. 1.6, it was determined that a plug diameter ratio of
approximately 0.3 showed slightly increased temperature separation compared to ratios of
0.5 and 1.0. However, a plug diameter ratio of 0.1 had the lowest temperature drop, even
when comparing to similar inlet pressures. When reviewing the angle of the plug tip (shown
in Fig. 1.7), it was determined that a flat plug (angle of 0 degrees) resulted in the smallest
temperature drop. Furthermore, it was found that a 30-degree tip angle produced a slightly
higher drop in temperature compared to plug tips with a 60-degree angle. Thus, a smaller
plug diameter ratio with a sharp angle would produce the most significant temperature
drop.

25
Figure 1.6 The consolidated data showing the effect of the ratio between the plug
diameter and main tube diameter on the temperature drop for various inlet
pressures and cold mass fractions.
Figure 1.7 The consolidated data showing the effect of the angle of the plug tip on
the temperature drop for various inlet pressures and cold mass fractions.

26
1.2 Thesis Objectives
The literature review and the consolidated data shows that while there is a large amount of
information reported in the literature, it is extremely rare to have all of the information
required for a complementary CFD study, and even in these rare cases, the range of
operational parameters covers only a narrow range of operation. This missing information
falls into two categories; the first category being geometric parameters, and the second
category being operational parameters. By not including all geometric parameters, an
accurate model for numerical simulation cannot be produced/reproduced; while missing
operational parameters result in not being able to develop accurate boundary conditions for
complementary study.
The motivation for the work described in this thesis is twofold. First, we wanted to develop
an experimental facility that could be used to make measurements required to provide a
complete set of boundary conditions for complementary CFD work (not reported in this
thesis). The second was to be able to further explore the operating parameters of a RHVT
to test the effect(s) that pressure ratios had on flow and energy separation. Therefore, the
primary objective of the research conducted for this thesis was to fully report all geometric,
operational, and performance parameters used/found through experimentation. This would
include detailed drawings of the vortex tube and accurate measurements of the air at the
inlet and outlets. The secondary objective of this thesis was to evaluate the importance of
Hilsch’s [2] second set of variables; in particular, the pressure at the cold outlet.
1.3 Thesis Outline
Chapter 1 of this thesis was a review of the literature on vortex tubes. Three approaches to
analyze the performance of a vortex tube (thermodynamics, experimental, and numerical)
were reviewed. Additionally, experimental and numerical data from the literature were
consolidated to determine optimal geometric parameters of a vortex tube.
Chapter 2 is an overview of the experiment used in this research of a vortex tube. This
chapter focuses on the design of the vortex tube used in this research. How the system was

27
set up and run to measure the critical flow properties at the inlet and the outlets were
addressed in this chapter
Chapter 3 reveals the results of the experiments conducted for this research. The
importance of the pressure at the cold outlet is discussed and how the data from the
experiments performed can be used to set boundary conditions and validate a CFD
simulation.
Chapter 4 concludes this thesis and suggest potential future research to be conducted.

28
Chapter 2
2 Experiment Overview
This chapter focuses on an overview of the present experiments, starting with the system
setup. The system setup explains the path the air goes through from being compressed to
exhausting the two streams to the atmosphere after being heated/cooled. The location of
the various sensors and points of control are also disclosed. The design of the vortex tube
used in the experiments will be reviewed, focusing on the geometric parameters that the
consolidated data showed to be of high importance to the energy separation process. The
procedure to perform an experimental case and how the points of control were to be used
are discussed in the third section of this chapter, followed by an outline of how the flow
meters were calibrated to a higher accuracy using a high-accuracy mass flow meter.
Additionally, the outcome and verification of the calibration are also reviewed. Lastly, the
experimental setup is characterized in terms of its ability to produce reliable and consistent
results. The ability of the experimental setup to produce accurate results was evaluated by
performing an uncertainty analysis on the values obtained from the sensors and on values
calculated using the sensor readings. Whereas the ability of the experimental setup to
produce consistent results was evaluated through a repeatability study. Both the uncertainty
analysis and the repeatability study were reviewed in this chapter.
2.1 System Setup
The schematic shown in Fig. 2.1 illustrates the current experimental setup. Air was
compressed by the compressor (1) and stored in a large receiver tank (2) at 1.10[MPa];
allowing for the experimental system to run for several hours at the desired inlet pressures
without a significant change in the inlet air temperature. A ball valve (3) was used to
regulate the flow of air into the system. The pressure regulator (4) was used to set the
desired pressure at the vortex tube inlet. Built onto the pressure regulator were filters to
remove particles from the air prior to entering the laminar mass flow meter. The laminar
mass flow meter (5) is an Omega FMA-2622A, which is capable of measuring the pressure,
temperature, volumetric flow rate, as well as the standard volumetric flow rate. This

29
standard volumetric flow rate allowed for quick conversion to a mass flow rate; i.e. the
total mass that passes through the vortex tube.
Figure 2.1 Experiment Setup Schematic
The laminar mass flow meter shown in Fig. 2.2, was located a short distance upstream of
the vortex tube and the air passes through a flexible hose resulting in a slight pressure drop
by the point the air reaches the vortex tube. Because the condition of the air entering the
vortex tube is of critical importance, the pressure was remeasured (using a pressure sensor
(7)) closer to the inlet of the vortex tube, at a sensor block (6) (shown in Fig. 2.3). In
addition to the pressure being measured at the sensor block, the temperature of the air was
also measured using a temperature probe (8). This inlet sensor block was located 85 [mm]
away from the inlet plenum, as clearance of other components was a concern.
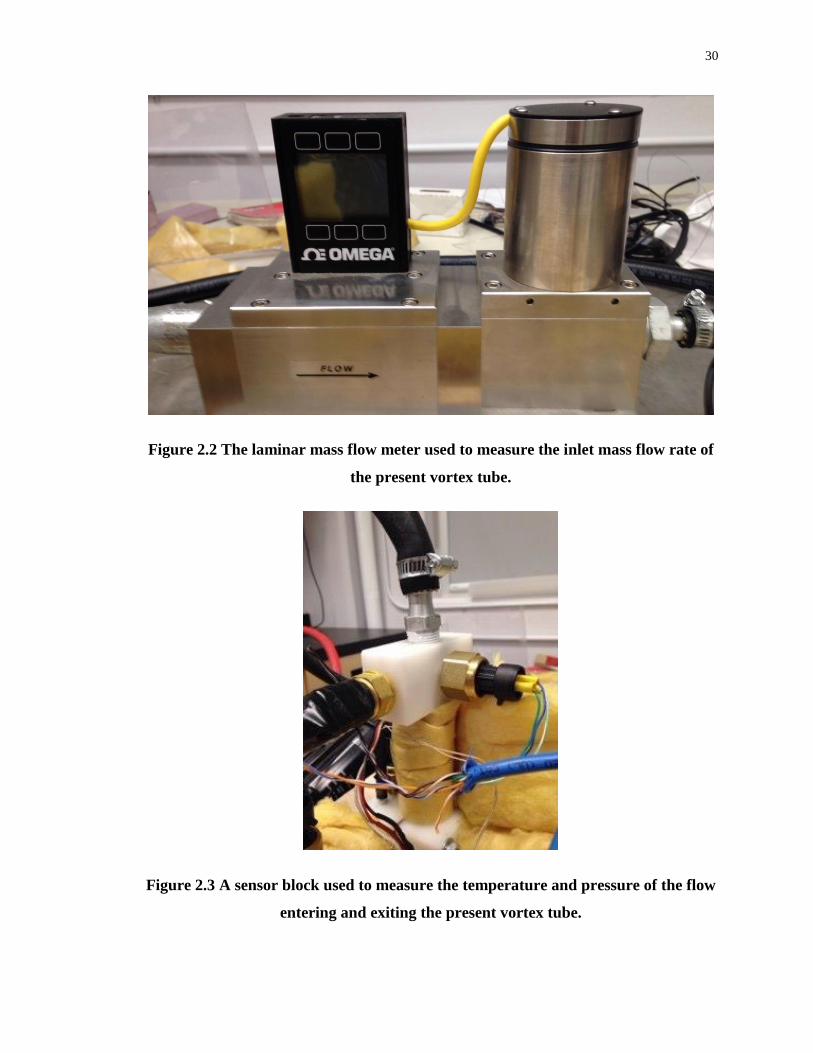
30
Figure 2.2 The laminar mass flow meter used to measure the inlet mass flow rate of
the present vortex tube.
Figure 2.3 A sensor block used to measure the temperature and pressure of the flow
entering and exiting the present vortex tube.

31
The air then enters the inlet plenum (11) and the vortex generator (14). The air flows
through the 4 channels of the vortex generator; resulting in it being tangentially injected
into the main body of the vortex tube (15). The air passes through the main tube body with
a significant tangential velocity towards the hot exit end where it encounters the plug (16).
The plug allows the peripheral air to escape while the air located towards the axis of the
swirling flow is turned around and makes its way back towards the vortex generator (14).
At the center of the vortex generator is an orifice that allows this axial air to exit. The air
that exits at the plug has been heated, while the air exiting through the orifice has been
cooled.
Both outlet flows were isolated from each other until being released to the atmosphere. At
both ends of the tube, the air enters a plenum (12 and 13), that collects and mixes the
individual outlet flows. Mixing the flow out of an outlet results in a more uniform
temperature that is less dependent on the radial location of a temperature probe. Built into
each of the plenums were a pressure sensor (7) and a temperature sensor (9). After the
outlet airflow exits the plenum, the air was passed through another sensor block (6), where
the temperature and the pressure were remeasured using the pressure sensor (7) and the
temperature probe (8). Immediately after the sensor block was a rotameter (10) (Omega
FL-2065) with a built-in needle valve (shown in Fig. 2.4). The rotameters measured the
standard volumetric flow rate, which was converted to a mass flow rate. The air was then
released to the atmosphere.

32
Figure 2.4 A rotameter with needle valve used to measure and control the
volumetric flow rate at the exits of the present vortex tube.
The experiment setup shown in Fig. 2.5, is from the laminar mass flow meter onward. The
figure shows that the main tube of the vortex tube and the metal tubes used to transport the
air after the inlet sensor block are wrapped in a glass fibre insulation. The insulation was
added to prevent any heat loss or gain from the atmosphere. For the same reason, the sensor
blocks and the plenums were made from a low thermal conductivity material (Delrin).
Figure 2.5 The experimental setup used for testing the present vortex tube.

33
2.2 Design Overview
A rendering of the vortex tube developed in this research is shown in Fig. 2.6. The figure
shows the vortex tube assembled as well as an exploded view allowing for the internal parts
to be shown. Table 2.1 provides a list of parts shown in the rendered exploded view. In
regard to the path the air takes, the rendering shows the path from the hose fitting (1) to the
sensor blocks located on each outlet (14).
Table 2.1 Vortex Tube Rendering Part List
Item # Part Name Quantity
1 Hose Fitting 1
2 Inlet Sensor Block 1
3 Inlet Pipe 1
4 Inlet Plenum 1
5 Vortex Generator 1
6 Main Tube 1
7 Threaded Insert (5/8"-18 to 7/8"-9) 2
8 Plug 1
9 Hot Plenum 1
10 Plug Reinforcement 1
11 Pressure Transducer 5
12 Thermocouple 3
13 Outlet Pipe 2
14 Outlet Sensor Block 2
15 Cold Plenum 1
16 RTD 2
17 RTD Cap 2

34
Figure 2.6 Designed Vortex Tube Rendering
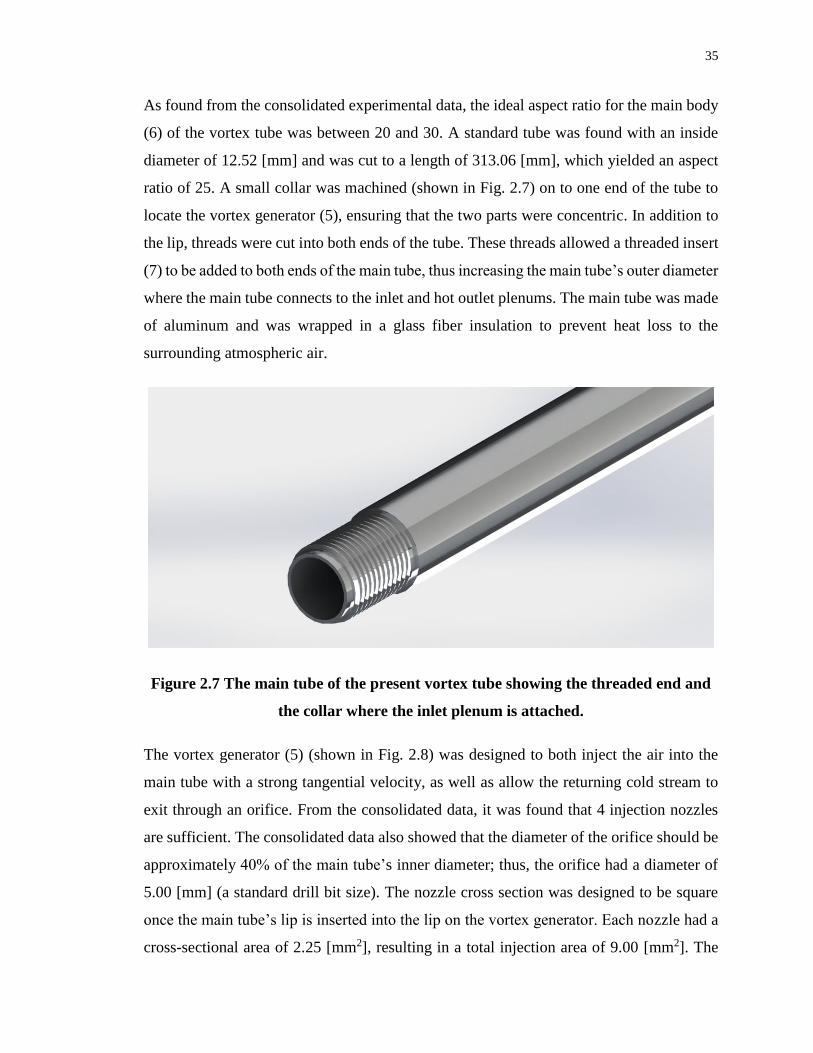
35
As found from the consolidated experimental data, the ideal aspect ratio for the main body
(6) of the vortex tube was between 20 and 30. A standard tube was found with an inside
diameter of 12.52 [mm] and was cut to a length of 313.06 [mm], which yielded an aspect
ratio of 25. A small collar was machined (shown in Fig. 2.7) on to one end of the tube to
locate the vortex generator (5), ensuring that the two parts were concentric. In addition to
the lip, threads were cut into both ends of the tube. These threads allowed a threaded insert
(7) to be added to both ends of the main tube, thus increasing the main tube’s outer diameter
where the main tube connects to the inlet and hot outlet plenums. The main tube was made
of aluminum and was wrapped in a glass fiber insulation to prevent heat loss to the
surrounding atmospheric air.
Figure 2.7 The main tube of the present vortex tube showing the threaded end and
the collar where the inlet plenum is attached.
The vortex generator (5) (shown in Fig. 2.8) was designed to both inject the air into the
main tube with a strong tangential velocity, as well as allow the returning cold stream to
exit through an orifice. From the consolidated data, it was found that 4 injection nozzles
are sufficient. The consolidated data also showed that the diameter of the orifice should be
approximately 40% of the main tube’s inner diameter; thus, the orifice had a diameter of
5.00 [mm] (a standard drill bit size). The nozzle cross section was designed to be square
once the main tube’s lip is inserted into the lip on the vortex generator. Each nozzle had a
cross-sectional area of 2.25 [mm2], resulting in a total injection area of 9.00 [mm2]. The

36
length of the nozzles was limited by the size of the threaded inserts (7) on the main tube
(6). The threaded insert acted as the side wall of the inlet plenum (4), containing the air in
the plenum before it passes through the nozzles. Additionally, the vortex generator had to
fit inside the inlet plenum with sufficient clearance to allow the air to flow around the
vortex generator, thus limiting the outer diameter of the vortex generator and consequently
the length of the nozzles.
Figure 2.8 The vortex generator used in the present vortex tube showing the inlet
nozzles and cold outlet orifice.
The plug (8) (shown in Fig. 2.9) was designed with a truncated cone shape, and to be
housed inside of the hot outlet plenum (9). The diameter of the cone at the point of
truncation was the same diameter as the orifice. The largest diameter of the cone was
designed to be slightly larger than the inner diameter of the main tube (14.81 [mm]), to
allow the plug to be used to control the mass flow split, or to close the hot end off, forcing
all the air to exit through the orifice. The included angle of the cone was 60°. The plug also
had a threaded extension, that threaded into the plug reinforcement (10). These threads
allowed for the movement of the plug in the axial direction of the main tube (6), thus
increasing/decreasing the fraction of air exiting the hot outlet. However, the plug remained
stationary with the plug being located 1 [mm] in the axial direction from the main tube
(shown in Fig. 2.10); this was done to insure that the geometry of the vortex tube was not
altered and would not require modification to meshes used in CFD simulations.

37
Figure 2.9 The truncated plug used at the hot outlet in the present vortex tube.
Figure 2.10 The plug’s position in relation to the Main Tube showing the 1 [mm]
separation in the axial direction.
The inlet plenum (4) (shown in Fig. 2.11) was made from a Delrin block that had a
counterbore with a diameter of 19.45 [mm] and a depth of 25.00 [mm], that forms the actual
plenum. The insert (7) on the main tube (6) dictated the diameter of the counterbore which
was threaded to a depth of 15.88 [mm] to be turned into the insert. Concentric to the plenum
was a through-hole that allowed the vortex generator (5) to pass through, enabling the cold
stream to exit the vortex generator outside of the inlet plenum. An O-ring was placed

38
between the vortex generator and the inlet plenum, to seal the through-hole. Air is injected
into the inlet plenum through a second through-hole on the top of the block that intersected
the plenum; this through-hole was offset from the axis of the pocket by 4.75 [mm]. The
offset resulted in the air entering the inlet plenum with some tangential velocity (in the
same direction the vortex generator imposes) before flowing through the nozzles in the
vortex generator. The diameter of this through-hole was dictated by the inner diameter of
the barbed hose fitting (1) (9.92 [mm]) used to connect the hose from the laminar mass
flow meter to the inlet sensor block (2).
Figure 2.11 The inlet plenum of the present vortex tube showing the offset injection
through hole.
The cold outlet plenum (15) (shown in Fig. 2.12) was made from a similar Delrin block
with a bored-out plenum region. This plenum has a larger diameter (35.00 [mm]), and a
depth of 25.00 [mm]. The block was sealed against the inlet plenum (4) using a rubber
gasket. The plenum collected the air exiting the vortex generator (5) and allowed it to exit
via a through-hole on the side of the block. The diameter of this through-hole was set to
the same diameter as the orifice in the vortex generator (5) (5.00 [mm]). By setting these
diameters to the same size, the air would leave the plenum at a similar velocity as it enters.
Similar to the injection hole in the inlet plenum, the exit hole was located off center of the
plenum. Lastly, two through-holes intersecting the plenum were added, one for the
temperature sensor (16) and the other for the pressure sensor (11).

39
Figure 2.12 The cold outlet plenum of the vortex tube
The hot outlet plenum (9) (shown in Fig. 2.13) had a similar purpose as the cold outlet
plenum (15), but was machined to mate properly with the insert (7) on the main tube (6).
It also had a through-hole located concentric to the counter-bored plenum, which was then
threaded for the plug reinforcement (10). There was an exit through-hole located central to
the plenum, with a diameter of 5.00 [mm]; the same as the exit through-hole in the cold
outlet plenum. Additionally, the same two holes for the temperature sensor (16) and the
pressure sensor (11) were added.
Figure 2.13 The hot outlet plenum used in the present vortex tube showing the
through holes for the pressure and temperature sensors.

40
The last components of the assembly are the sensor blocks (2 and 14) used before the inlet
plenum (4) and aft of the two outlet plenums (9 and 15). The blocks were designed to have
temperature probes (12) and pressure sensors (11). These two sensors were located on
perpendicular faces and aligned so that they would measure the flow conditions at the same
location. The diameter of the through-hole used to channel the air flowing through the
sensor block was 9.92 [mm] and 5.00 [mm] for the inlet sensor block (2) and outlet sensor
blocks (14), respectively. The inlet sensor block allowed for the hose fitting (1) to thread
into the top, and a pipe (3) to be threaded into the bottom. The pipe would then be threaded
into the inlet plenum. For the outlet sensor blocks, the inlet was threaded for a smaller pipe
(13), that allowed for connection to the outlet plenums, and the exit of the sensor block was
threaded for the rotameters. For all three sensor blocks, great care was taken in ensuring
that there was minimal change in diameter between the sensor block and the through-holes
in the plenums, as shown in Fig. 2.14.
Figure 2.14 A sectioned view of the inlet sensor block with hose fitting and inlet pipe
showing the continuous cross section to reduce flow disturbances.
A complete set of drawings for the vortex tube used in the experiment including the sensor
blocks and connecting pipes are included in Appendix A. These drawings were added to
allow for both experimentation and numerical evaluation on the vortex tube developed in
this research.

41
2.3 Experimental Procedure
The experimental setup had three points of control to modify the flow through the vortex
tube. The first point of control was the pressure regulator, which was used to set the inlet
pressure to the vortex tube. The other two points of control were the needle valves built
into the rotameters, which controlled the pressure at their respective outlet. There was also
the potential for a fourth control point, being the position of the plug located at the hot
outlet. The mass flow split could be controlled using this plug, by increasing or decreasing
the outlet area. Changing the outlet area would result in changing the geometry of the
vortex tube for each data point. Thus, the plug was left in a stationary position, and the
mass flow split was altered by adjustment to the relative outlet pressures.
The experiment was started by opening the ball valve and setting the inlet pressure using
the pressure regulator. Although the pressure regulator had a pressure gauge, the inlet
pressure was set using the sensor reading from the pressure sensor located in the inlet
sensor block. The pressure at the cold outlet sensor block was then set to the desired
pressure by opening or closing the needle valve located in the rotameter immediately
downstream. Lastly, the needle valve built into the rotameter on the hot outlet was adjusted.
However, instead of monitoring the pressure at the hot outlet sensor block, the needle valve
was set to achieve a desired standard volumetric flow through the rotameter. By carefully
adjusting the position of both needle valves, both the cold outlet pressure and the actual
volumetric flow through the hot outlet would be set to their respective desired values.
2.4 Rotameter Calibration
The laminar mass flow meter was capable of measuring the standard volumetric flow rate
with an error of 1%, while the rotameters at the outlets measured the actual volumetric flow
rate with an error of 3%. To reduce the error associated with the rotameter, both rotameters
were individually calibrated using the laminar mass flow meter. The result of the
calibration was that a reading from the rotameters’ scale was converted to a standard
volumetric flow rate.

42
To calibrate the rotameters at the various temperatures and pressures entering the
rotameter, the experimental setup was used with minor changes. The main change was that
the laminar mass flow meter was removed from upstream of the vortex tube, allowing the
air to go from the pressure regulator directly to the inlet sensor block. The laminar mass
flow meter was then reconnected downstream of a rotameter; thus, any mass of air that
passes through the rotameter will also pass through the laminar mass flow meter.
The system was run at a desired inlet and outlet pressures until steady state, resulting in the
inlet mass flow splitting into the hot and cold streams that exit their respective rotameters.
The temperatures and pressures at all three sensor blocks as well as the two outlet plenums
were recorded in addition to readings from both rotameters and the temperature, pressure,
and standard volumetric flow rate from the laminar mass flow meter. The ball valve
upstream of the pressure regulator was then closed, and the laminar mass flow meter was
switched over to the other rotameter. The ball valve was then opened, and the system was
run with the same inlet and outlet pressures until steady state was achieved again. All the
values were then recorded for the second rotameter. This process was repeated for a variety
of outlet pressures for each of the three inlet pressures calibrated.
A function relating the mass flow rate to the volumetric flow rate reading of the rotameter
for both outlets at each inlet pressure was formed. Figure 2.15(a) and 2.15(b) show the data
points obtained during the calibration process for both the cold and hot outlet with an inlet
pressure of 0.62 [MPa]. The corresponding function used to convert the actual volumetric
flow rates of the rotameters to a mass flow rate were also plotted, showing the close
agreement between the data points and the functions used.
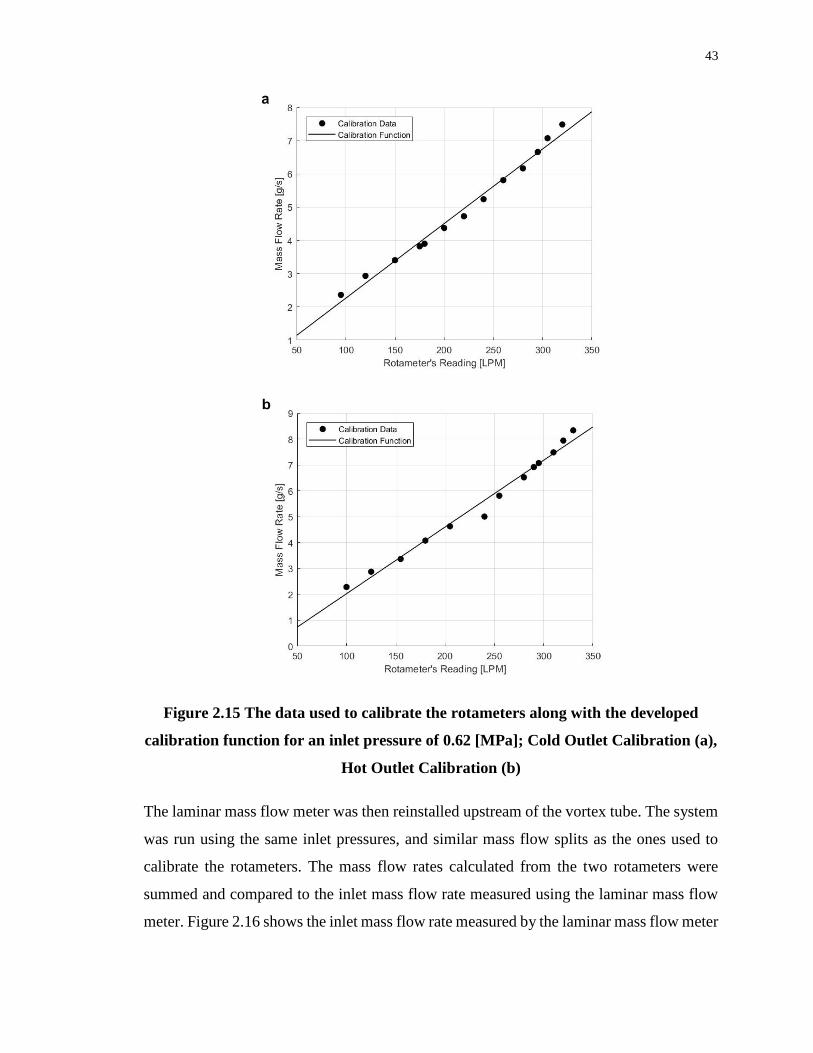
43
Figure 2.15 The data used to calibrate the rotameters along with the developed
calibration function for an inlet pressure of 0.62 [MPa]; Cold Outlet Calibration (a),
Hot Outlet Calibration (b)
The laminar mass flow meter was then reinstalled upstream of the vortex tube. The system
was run using the same inlet pressures, and similar mass flow splits as the ones used to
calibrate the rotameters. The mass flow rates calculated from the two rotameters were
summed and compared to the inlet mass flow rate measured using the laminar mass flow
meter. Figure 2.16 shows the inlet mass flow rate measured by the laminar mass flow meter

44
at the various cold mass fractions with an inlet pressure of 0.62 [MPa]; additionally, the
plot shows the mass flow rates out of each outlet obtained using the calibration functions,
as well as the sum of the two outlets. The average percent error of the summed mass flow
rates through the outlets was 5.92% with a standard deviation of 3.26% for the calibration
runs; whereas the experimental runs resulted in an average percent error of 5.57% with a
standard deviation of 3.47%.
Figure 2.16 Calibration Verification of Rotameters for Inlet pressure of 0.62 [MPa]
showing the calibrated flow rates out of both outlets, the total calibrated outlet flow
rate and the measured inlet flow rate.
2.5 Uncertainty Analysis
An uncertainty analysis was performed on the data collected as well as the values calculated
from the data, using approaches described by Wheeler et al. [59]. Table 2.2 shows the
summary of the sensors used as well as the reported accuracy, based on manufacturers
specifications and accuracy.

45
Table 2.2 Measuring equipment used in the present experimental setup
Sensor Manufacturer Model Number Accuracy
Laminar Mass
Flow Meter OMEGA FMA-2622A +- 1 % (FS)
Rotameter OMEGA FL-2065 +0 3 % (FS)
10 LPM (SI)
Pressure
Transducer Honeywell PX3AN2BS250PAAAX +- 0.25 % (FS)
Thermocouple Honeywell LTPCTGA20MBSITX01 +- 2.5 K
RTD Honeywell HEL-707-U-1-12-00 +- 0.5 K
These reported accuracies were used as the systematic uncertainty (𝐵𝑥) for their respective
sensors. For each experiment case conducted at steady state, ten values from each
temperature and pressure sensor were recorded. The standard deviation (𝜎𝑥) of the ten
values was calculated and used to formulate the random uncertainty (𝑃�̅�) using equation
(2.1):
𝑃�̅� = ±
𝑡𝜎𝑥
√𝑛 (2.1)
where 𝑛 is the number of values recorded, and 𝑡 is the Student's t-value for a 95%
confidence interval for the number of data points used.
The random and systematic uncertainties were combined, yielding the total uncertainty
(𝑊�̅�) of the sensor using equation (2.2).
𝑊�̅� = √𝐵𝑥2 + 𝑃�̅�
2 (2.2)
The uncertainty analysis of the measured data produced total uncertainty values for each
sensor reading for every data point. The maximum total uncertainty for the reported
temperatures and pressures were 2.501 [K] and 4.59 [kPa]. These uncertainties are similar
to the manufacture's reported accuracy, as the systematic uncertainties were considerably
larger than the random uncertainties calculated. Thus, when the random and systematic

46
uncertainties were individually squared and summed, the systematic uncertainty was found
to contribute far more than the random uncertainty. The flow rates found from the laminar
mass flow meter and the two rotameters were only recorded once for each data point. Thus,
no random uncertainty could be calculated, and the total uncertainty for these values is the
same as the manufacturers reported accuracy.
With the total uncertainty for each sensor known, the focus was turned to the values
calculated from the collected data. The calculated values included the temperature drop,
the pressure drop, the pressure ratio, and the cold mass fraction. Similar to the uncertainty
analysis of the collected data, the uncertainty of a calculated value was divided into the
systematic (𝐵𝑅) and random (𝑆𝑅) uncertainties found using equations (2.3) and (2.4)
respectively:
𝐵𝑅 = √∑(𝐵𝑥𝑖𝜕𝑅
𝜕𝑥𝑖)2𝑛
𝑖=1
(2.3)
𝑆𝑅 = √∑(𝜎𝑥𝑖𝜕𝑅
𝜕𝑥𝑖)2𝑛
𝑖=1
(2.4)
where (𝑅) is the equation of the calculated value, and (𝒙𝒊) are the variables in the equation
that pertain to values measured by the sensors.
Lastly, the systematic and random uncertainties for the calculated values were combined
using equation (2.5) yielding the total uncertainty.
𝑤𝑅 = √𝐵𝑅
2 + (𝑡𝑆𝑅)2 (2.5)
Again, the total uncertainty for each calculated value was found for every data point. The
resulting maximum total uncertainty for the temperature drop was 3.536 [K]; while the
pressure drop and pressure ratio calculations had a maximum uncertainty of 6.643 [kPa]
and 0.011 respectively. As for the cold mass fraction calculation, there was only a
systematic uncertainty; thus, the total uncertainty was equivalent to the systematic

47
uncertainty. The absence of a random uncertainty was the result of the cold mass fraction
being calculated using readings from the laminar mass flow meter and rotameters, which
do not have a standard deviation. The cold mass fraction had a total uncertainty of 0.030.
2.6 Repeatability Study
To evaluate the consistency of the experiment setup, a repeatability study was conducted.
Three runs were performed with an inlet pressure of 0.62 [MPa], and a pressure of 0.31
[MPa] at the cold outlet. Each run consisted of twelve data points over a range of cold mass
fractions. The temperature drops at the various cold mass fractions were compared across
the three runs and plotted in Fig. 2.17. The repeatability study shows that the trend in the
relation between the temperature drops and the cold mass fractions were similar for all
three runs. Furthermore, the magnitude of the temperature drop at any value of cold mass
fraction was within the 3.536 [K] (found from the uncertainty analysis) for the three runs
conducted.
Figure 2.17 The temperature drop at various cold mass fractions for the three runs
of inlet pressure of 0.62[MPa] and cold outlet Pressure of 0.31[MPa] showing the
repeatability of the experimental system.

48
2.7 Summary
The experiment overview was presented, starting with the setup of the system. There was
a strong emphasis on measuring the flow at three key locations; at the inlet, cold outlet and
hot outlet. The mass flow was measured using a laminar mass flow meter upstream of the
vortex tube, whereas rotameters were used on the outlets to measure the flow rate exiting
each outlet. Sensor blocks were placed before the inlet and aft of the two outlets, that
measured both the temperature and the pressure. In addition to the pressure and temperature
being measured at the sensor blocks, additional measurements were made in both outlet
plenums.
After defining the system, the design of the vortex tube used in the experiments was
reviewed. The design was significantly influenced by the knowledge gained from the
consolidated data obtained from the literature review. Where possible standard parts were
used in addition to using standard sizes. Great care was taken to ensure that the air was not
distributed between the sensor blocks and the plenums. Reduction to any disturbances was
made by ensuring a constant diameter through the sensor block, connecting pipe and
inlet/outlet of the plenums.
The experimental procedure described how the system was to be used and how the
operating conditions were controlled. The first control point was the inlet pressure. The
inlet pressure was set using a pressure regulator and monitoring the inlet sensor block's
pressure reading. The second control point was the pressure at the cold outlet, which was
set using the needle valve located directly downstream of the cold outlet sensor block. The
last control was the cold mass fraction, which was adjusted using the needle valve located
in the hot stream. Adjusting this needle valve changes the pressure at the vortex tube hot
outlet, which in turn changes the fraction of mass flow leaving the hot outlet.
The process and outcome of calibrating the rotameters were discussed. The rotameters were
calibrated using the laminar mass flow meter, which has a high accuracy. The outcome of
the calibration allows for a reading from the rotameter's scale to be used to calculate the
standard volumetric flow rate, and in turn, the mass flow rate through the rotameter. The
calibration was verified by performing the calibration cases again, however using the

49
system setup and experimental procedure outlined above. The calibration functions were
used to calculate the mass flow rate through both rotameters, and the two values were
summed. The summed value was compared to the inlet mass flow rate found using the
laminar mass flow meter; which resulted in close agreement.
An uncertainty analysis was conducted to establish how accurate the reported results were.
The analysis used the manufacturer's reported accuracies as the systematic uncertainties
and used the standard deviations in the data collected for calculating the random
uncertainties. These two types of uncertainties were combined to find the total uncertainty
for the measured data, in addition to the values calculated from the measured data.
Lastly, a repeatability study was performed to verify that the experiment was capable of
producing consistent results. A single case was performed three times, and the temperature
drop found at the various cold mass fractions of the three runs were compared. The
comparison showed that the temperature drops were in agreement (within the accuracy
found from the uncertainty analysis) between the three runs.

50
Chapter 3
3 Experimental Results
Three sets of experiments were conducted using the previously defined experimental setup.
For each set, three cases were performed each with a specific inlet pressure to be tested
across a range of cold mass fractions. The three inlet pressures tested were 0.48, 0.62, and
0.76 [MPa].
The purpose of conducting the three sets of experiments was to examine the impact of the
pressure at the cold outlet on the temperature separation phenomenon present in a vortex
tube. The first set of experiments held the pressure at the cold outlet constant (0.31 [MPa])
for all three cases. The second set of experiments focused on the pressure drop between the
inlet and the cold outlet. For all three cases, the cold outlet pressure was set to achieve a
pressure drop of 0.31 [MPa]. The last set of experiments examined the pressure ratio
between the inlet and the cold outlet. Therefore, the cold outlet pressure was set to half of
the inlet pressure, yielding a pressure ratio of 2.00 for each case.
The values selected for the constant cold outlet pressure, pressure drop, and pressure ratio,
resulted in one case being present in all three sets of experiments. This case was when the
inlet pressure was 0.62 [MPa]. When the cold outlet pressure was set to 0.31 [MPa], the
resulting pressure drop and pressure ratio were 0.31 [MPa] and 2.00, respectively. Having
one case present in all three sets of experiments allowed for easy comparison between
results from the different sets of experiments; resulting in this case being referred to as the
benchmark case. This case was also used in the repeatability study previously discussed.
Table 3.1 shows a summary of the seven unique cases performed.

51
Table 3.1 Summary of experimental test cases.
Case Experiment
Set
Inlet
Pressure
[MPa]
Cold Outlet
Pressure [MPa]
Pressure
Drop
[MPa]
Pressure
Ratio
1 Bench-mark 0.62 0.31 0.31 2.00
2 1 0.49 0.31 0.18 1.58
3 1 0.76 0.31 0.45 2.45
4 2 0.48 0.17 0.31 2.82
5 2 0.76 0.45 0.31 1.69
6 3 0.48 0.24 0.24 2.00
7 3 0.76 0.38 0.38 2.00
The data collected throughout the three experiments was also intended to be used in CFD
simulations of a vortex tube. The literature review showed that there was a lack of
information reported in articles that conducted experimental/numerical studies of vortex
tubes. The lack of information falls partially in the area of the geometry of the vortex tube.
However, there was also a significant lack of information from experiments that would be
useful in defining boundary conditions of a CFD simulation model. The values for the
temperature, pressure, and mass flow rate at the inlet and both outlets will be reported and
discussed for three cases. This information, along with the geometry presented in Chapter
2, will allow for accurate numerical reproduction of the vortex tube used in this research.
3.1 Results of the Three sets of Experiments
3.1.1 Constant Cold Outlet Pressure
The first set of experiments tested the vortex tube in a conventional way, where the cold
outlet pressure was constant (0.31 [MPa]), and several inlet pressures were examined. For
each tested inlet pressure, several measurements were made at various cold mass fractions.
Figure 3.1 show the temperature drop curves for the three cases with a constant cold outlet
pressure.

52
Figure 3.1 Temperature drop at various cold mass fractions for the constant cold
outlet pressure experiment set. (Case 1: inlet pressure 0.62 [MPa], pressure drop
0.31 [MPa], pressure ratio 2.00, inlet mass flow rate 9.89[g/s]. Case 2: inlet pressure
0.49 [MPa], pressure drop 0.18 [MPa], pressure ratio 1.59, inlet mass flow rate
7.05[g/s]. Case 3: inlet pressure 0.76 [MPa], pressure drop 0.45 [MPa], pressure
ratio 2.45, inlet mass flow rate 12.66[g/s].)
The effect of the inlet pressure on the temperature drop (shown in Fig. 3.1) was consistent
with experimental studies in the literature review. By increasing the inlet pressure, the
temperature drop produced by the energy separation phenomenon was also increased. The
highest inlet pressure tested (0.76 [Mpa]) yielded the most significant temperature drop
curve; with a maximum temperature drop of 17.08 [K]. Where the lowest inlet pressure
tested (0.49 [MPa]) yielded the least significant temperature drop curve; with a maximum
temperature drop of 8.17 [K]. The benchmark case having a median inlet pressure (0.62
[MPa]) yielded an intermediate temperature drop curve; with a maximum temperature drop
of 12.96 [K]. The sharp change in temperature drop at low cold mass fractions was
attributed to the rotameters not being able to accurately measure the flow rate at low flows.
An increase in the inlet pressure while holding the cold outlet pressure constant also
increases the pressure drop between the inlet and the cold outlet. Thus, the case with the
highest pressure drop (0.45 [MPa]) was also the case with the highest temperature drop

53
curve and the case with the lowest pressure drop (0.18 [MPa]) resulted in the lowest
temperature drop curve.
The pressure ratio between the inlet and the cold outlet was also influenced by the
increasing inlet pressure; where any increase to the inlet pressure would result in an
increase in the pressure ratio (for a constant cold outlet pressure). Therefore, the highest
pressure ratio tested (2.45) was the case with the most significant temperature drop curve;
whereas the lowest pressure ratio tested (1.58) yielded the least significant temperature
drop curve.
The inlet mass flow was also affected by the inlet pressure; where the inlet mass flow rate
would increase with an increase in the inlet pressure. The relation between the inlet
pressure and the inlet mass flow rate resulted in the greatest temperature drop curve being
achieved with the highest inlet mass flow rate (12.66 [g/s]), while the lowest temperature
drop curve occurs with an inlet mass flow rate of 7.05 [g/s].
The first set of experiments showed that the designed vortex tube was capable of producing
a significant temperature drop; it was also determined that the temperature drop produced
exhibited a similar reaction to the inlet pressure as the experiments in the literature review.
The inlet pressure has a causation relationship with the pressure drop and pressure ratio at
the cold outlet, in addition to the inlet mass flow rate. Therefore, it was unclear if the
increase in the inlet pressure was directly responsible for the increased temperature drop,
or if the increased temperature drop was the result of the increased inlet mass flow rate,
pressure drop or pressure ratio.
3.1.2 Constant Pressure Drop
The second set of experiments were aimed at determining if the magnitude of the
temperature drop was dependent on the inlet pressure or the pressure drop. The cold outlet
pressure was adjusted to achieve a constant pressure drop of 0.31[MPa] for the three inlet
pressures tested. If the temperature drop was dependent on the pressure drop, then the
temperature drop curves for the three cases should be comparable. The temperature drops
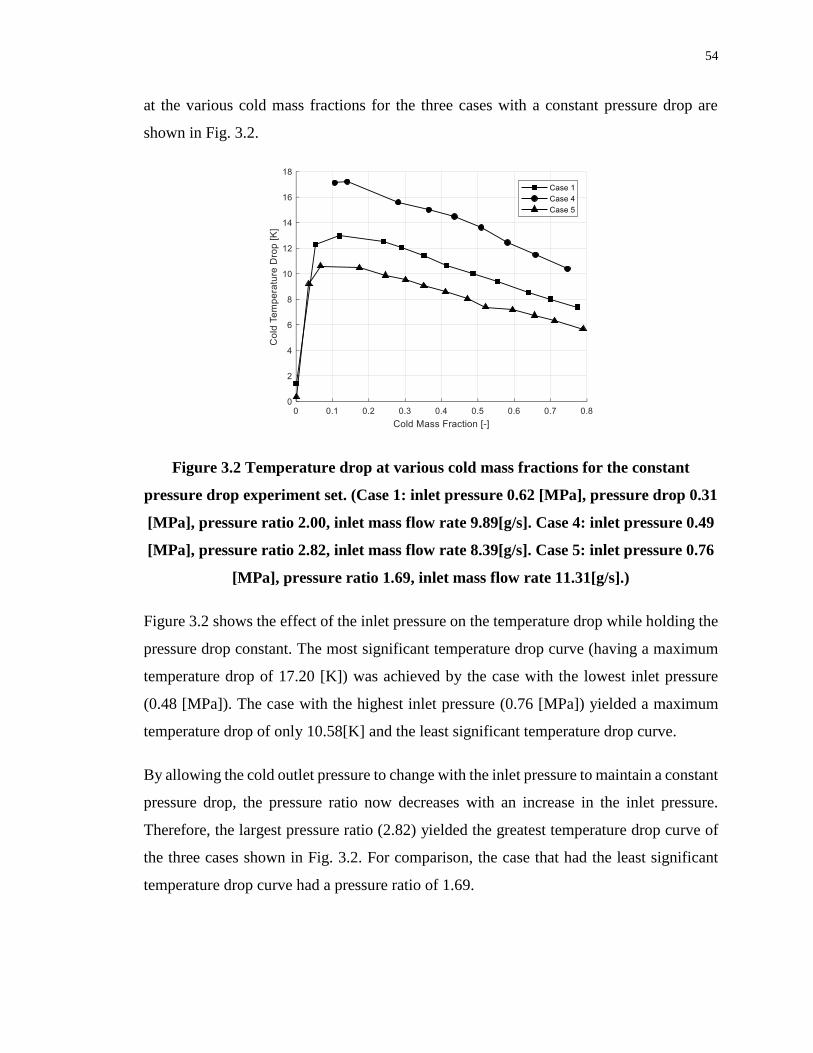
54
at the various cold mass fractions for the three cases with a constant pressure drop are
shown in Fig. 3.2.
Figure 3.2 Temperature drop at various cold mass fractions for the constant
pressure drop experiment set. (Case 1: inlet pressure 0.62 [MPa], pressure drop 0.31
[MPa], pressure ratio 2.00, inlet mass flow rate 9.89[g/s]. Case 4: inlet pressure 0.49
[MPa], pressure ratio 2.82, inlet mass flow rate 8.39[g/s]. Case 5: inlet pressure 0.76
[MPa], pressure ratio 1.69, inlet mass flow rate 11.31[g/s].)
Figure 3.2 shows the effect of the inlet pressure on the temperature drop while holding the
pressure drop constant. The most significant temperature drop curve (having a maximum
temperature drop of 17.20 [K]) was achieved by the case with the lowest inlet pressure
(0.48 [MPa]). The case with the highest inlet pressure (0.76 [MPa]) yielded a maximum
temperature drop of only 10.58[K] and the least significant temperature drop curve.
By allowing the cold outlet pressure to change with the inlet pressure to maintain a constant
pressure drop, the pressure ratio now decreases with an increase in the inlet pressure.
Therefore, the largest pressure ratio (2.82) yielded the greatest temperature drop curve of
the three cases shown in Fig. 3.2. For comparison, the case that had the least significant
temperature drop curve had a pressure ratio of 1.69.
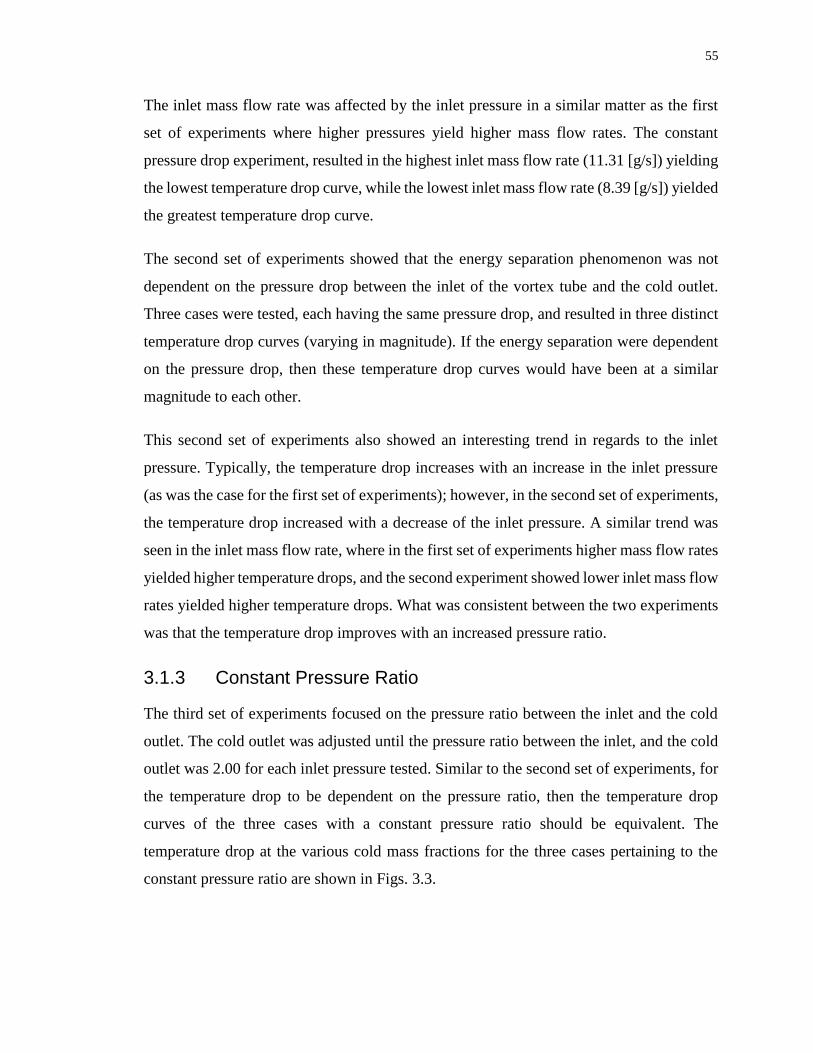
55
The inlet mass flow rate was affected by the inlet pressure in a similar matter as the first
set of experiments where higher pressures yield higher mass flow rates. The constant
pressure drop experiment, resulted in the highest inlet mass flow rate (11.31 [g/s]) yielding
the lowest temperature drop curve, while the lowest inlet mass flow rate (8.39 [g/s]) yielded
the greatest temperature drop curve.
The second set of experiments showed that the energy separation phenomenon was not
dependent on the pressure drop between the inlet of the vortex tube and the cold outlet.
Three cases were tested, each having the same pressure drop, and resulted in three distinct
temperature drop curves (varying in magnitude). If the energy separation were dependent
on the pressure drop, then these temperature drop curves would have been at a similar
magnitude to each other.
This second set of experiments also showed an interesting trend in regards to the inlet
pressure. Typically, the temperature drop increases with an increase in the inlet pressure
(as was the case for the first set of experiments); however, in the second set of experiments,
the temperature drop increased with a decrease of the inlet pressure. A similar trend was
seen in the inlet mass flow rate, where in the first set of experiments higher mass flow rates
yielded higher temperature drops, and the second experiment showed lower inlet mass flow
rates yielded higher temperature drops. What was consistent between the two experiments
was that the temperature drop improves with an increased pressure ratio.
3.1.3 Constant Pressure Ratio
The third set of experiments focused on the pressure ratio between the inlet and the cold
outlet. The cold outlet was adjusted until the pressure ratio between the inlet, and the cold
outlet was 2.00 for each inlet pressure tested. Similar to the second set of experiments, for
the temperature drop to be dependent on the pressure ratio, then the temperature drop
curves of the three cases with a constant pressure ratio should be equivalent. The
temperature drop at the various cold mass fractions for the three cases pertaining to the
constant pressure ratio are shown in Figs. 3.3.
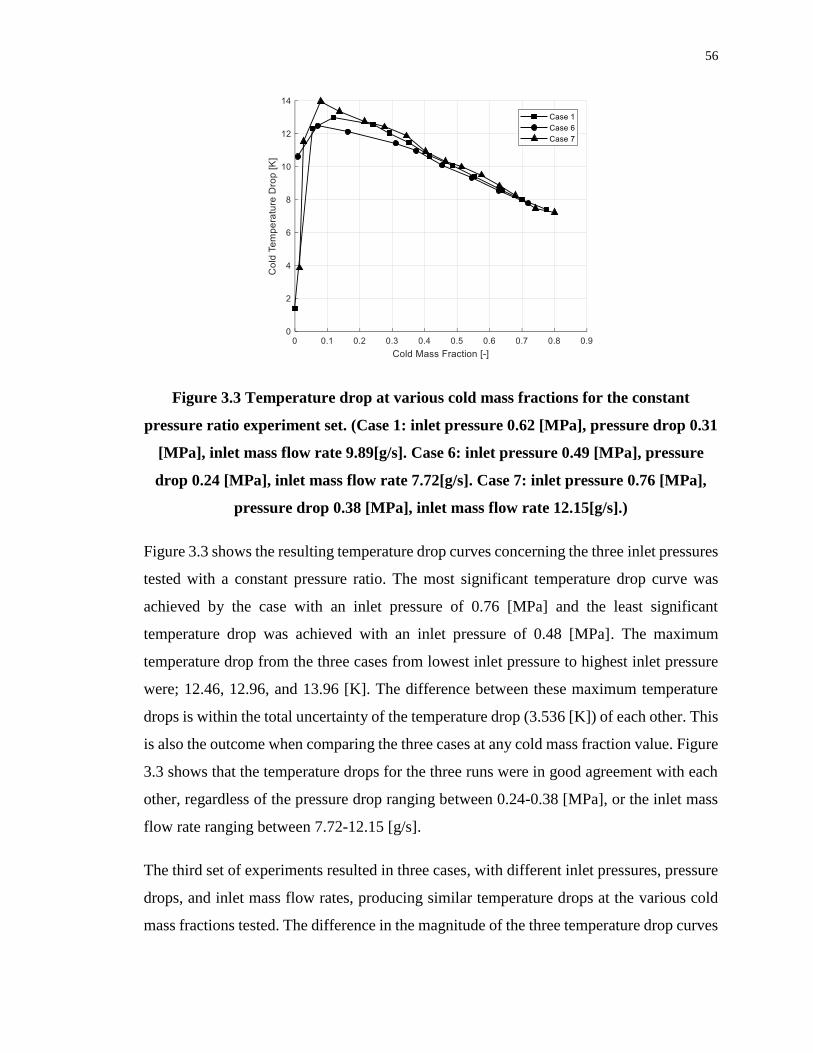
56
Figure 3.3 Temperature drop at various cold mass fractions for the constant
pressure ratio experiment set. (Case 1: inlet pressure 0.62 [MPa], pressure drop 0.31
[MPa], inlet mass flow rate 9.89[g/s]. Case 6: inlet pressure 0.49 [MPa], pressure
drop 0.24 [MPa], inlet mass flow rate 7.72[g/s]. Case 7: inlet pressure 0.76 [MPa],
pressure drop 0.38 [MPa], inlet mass flow rate 12.15[g/s].)
Figure 3.3 shows the resulting temperature drop curves concerning the three inlet pressures
tested with a constant pressure ratio. The most significant temperature drop curve was
achieved by the case with an inlet pressure of 0.76 [MPa] and the least significant
temperature drop was achieved with an inlet pressure of 0.48 [MPa]. The maximum
temperature drop from the three cases from lowest inlet pressure to highest inlet pressure
were; 12.46, 12.96, and 13.96 [K]. The difference between these maximum temperature
drops is within the total uncertainty of the temperature drop (3.536 [K]) of each other. This
is also the outcome when comparing the three cases at any cold mass fraction value. Figure
3.3 shows that the temperature drops for the three runs were in good agreement with each
other, regardless of the pressure drop ranging between 0.24-0.38 [MPa], or the inlet mass
flow rate ranging between 7.72-12.15 [g/s].
The third set of experiments resulted in three cases, with different inlet pressures, pressure
drops, and inlet mass flow rates, producing similar temperature drops at the various cold
mass fractions tested. The difference in the magnitude of the three temperature drop curves

57
was less than the uncertainty for the temperature drop; allowing for the three curves to be
considered equivalent to each other. The equivalent curves produced by the three cases
shows that the pressure ratio between the inlet and the cold outlet has a direct influence on
the temperature drop yielded from the energy separation phenomenon.
3.2 Pressure Ratio
The effect of the pressure ratio on the temperature drop was evident in all three sets of
experiments and was the only parameter to exhibit a constant effect. In the first and second
sets of experiments, the pressure ratio was varied for each case, and both sets of
experiments showed that a higher pressure ratio resulted in an increased temperature drop.
While in the third set of experiments the pressure ratio was constant, and the resulting
temperature drops were equivalent for all three cases.
To further show the effect of the pressure ratio on the temperature drop, the three cases
with an inlet pressure of 0.76 [MPa] (the highest inlet pressure tested) were plotted in Fig.
3.4. The figure shows the temperature drop curves for the various pressure ratios. The trend
of higher pressure ratios producing increased temperature drops is present. The case with
a pressure ratio of 2.45, yielded the most significant temperature drop curve having a
maximum temperature drop of 17.20 [K]. An intermediate temperature drop curve (having
a maximum temperature drop of 13.96 [K]) was achieved by the case with a pressure ratio
of 2.00. Lastly the case with a pressure ratio of 1.69 yielded the least significant
temperature drop curve having a maximum temperature drop of 10.58 [K].
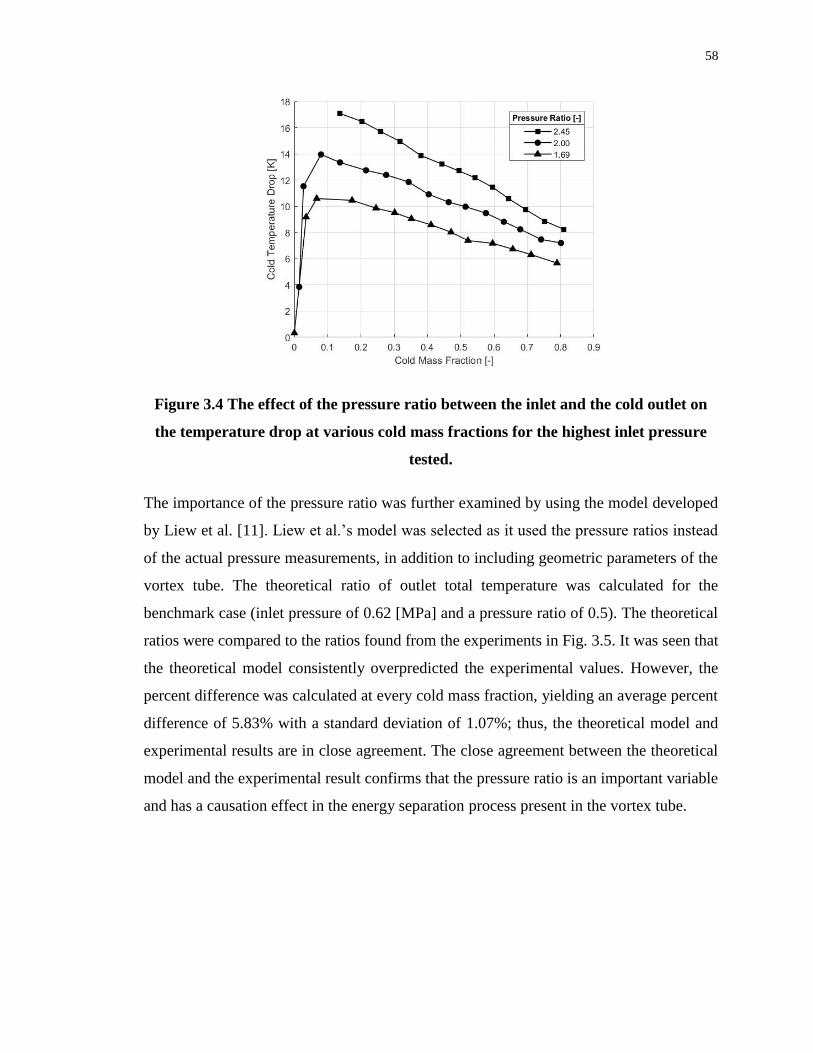
58
Figure 3.4 The effect of the pressure ratio between the inlet and the cold outlet on
the temperature drop at various cold mass fractions for the highest inlet pressure
tested.
The importance of the pressure ratio was further examined by using the model developed
by Liew et al. [11]. Liew et al.’s model was selected as it used the pressure ratios instead
of the actual pressure measurements, in addition to including geometric parameters of the
vortex tube. The theoretical ratio of outlet total temperature was calculated for the
benchmark case (inlet pressure of 0.62 [MPa] and a pressure ratio of 0.5). The theoretical
ratios were compared to the ratios found from the experiments in Fig. 3.5. It was seen that
the theoretical model consistently overpredicted the experimental values. However, the
percent difference was calculated at every cold mass fraction, yielding an average percent
difference of 5.83% with a standard deviation of 1.07%; thus, the theoretical model and
experimental results are in close agreement. The close agreement between the theoretical
model and the experimental result confirms that the pressure ratio is an important variable
and has a causation effect in the energy separation process present in the vortex tube.

59
Figure 3.5 Comparison between experimental results and theoretical calculations
(using Liew et al.’s [11] model) of the outlet total temperature ratio at various cold
mass fractions.
The low pressure experiment by Ahlborn et al. [33] was also examined for this pressure
ratio trend. Three of their runs were plotted in Fig. 3.6. The first run plotted was the
experiment with a vacuum pump connected to the cold outlet and the inlet exposed to the
atmosphere (referred to as the low inlet pressure run) yielding a pressure ratio of 2.23. The
other two runs shown were for the same vortex tube run with a compressed air inlet, and
the cold outlet exposed to the atmosphere. The pressure ratios of the two high inlet pressure
runs were calculated under the assumption that the cold outlet pressure was equivalent to
the atmospheric pressure reported. Figure 3.6 shows that the trend of increased pressure
ratios yielding increased temperature separation is present. The low inlet pressure run
produced a more significant temperature drop than the run with a high inlet pressure and
low pressure ratio, further demonstrating that the energy separation phenomenon is not
dependent on the inlet pressure of the vortex tube, but the pressure ratio between the inlet
and the cold outlet.

60
Figure 3.6 The effect of the pressure ratio between the inlet and the cold outlet on
the temperature drop at various cold mass fractions for the low and high inlet
pressure experimental results obtained from Ahlborn et al. [33].
With the temperature separation being dependent on the pressure ratio between the inlet
and the cold outlet, there is the potential that the vortex tube is a polytropic process; where
the pressure and volume are related by equation (3.1) with 𝑛 being the polytropic index
and 𝐶 being constant for the system.
𝑃𝑉𝑛 = 𝐶 (3.1)
By assuming air to be an ideal gas, the ideal gas law can be applied to equation (3.1),
yielding equation (3.2). This equation now relates the temperature ratio between the cold
outlet and the inlet to the pressure ratio and polytropic index.
𝑇𝑐𝑇𝑖= (
𝑃𝑖𝑃𝑐)
1−𝑛𝑛
(3.2)
The polytropic index is calculated for each data point collected in the seven cases and
shown in Fig. 3.7 for the various cold mass fractions. The polytropic index value changes
significantly with change in the cold mass fraction; however, a similar trend is seen in all
seven cases. The average polytropic index value was calculated from the seven runs at a

61
cold mass fraction around 0.1 yielding an average polytropic index of 1.069, with a
standard deviation of 0.005 (0.48% of the average value). Due to the polytropic index value
being dependent on the cold mass fraction and the small data set used, this value is not
reliable, and further investigation is needed to determine if the vortex tube is in fact a
polytropic process.
Figure 3.7 The polytropic index value for all seven cases tested on the present vortex
tube.
3.3 Boundary Conditions for CFD Simulations
An essential part of any CFD simulation is having well-defined boundary conditions.
Except for wall and symmetry boundary conditions, the vortex tube has three boundaries
to be defined; inlet, cold outlet, and hot outlet. These three boundaries can be defined as
either mass flow inlet/outlet or pressure inlet/outlet. The CFD simulation will also require
a temperature to be specified at a boundary; typically, the inlet temperature is defined, and
the outlet temperatures are found from the simulation results.
The mass flow rate, temperature and pressure measured at all three boundaries from three
experimental cases are provided in tables 3.2-3.4. Table 3.2 shows the data for the
benchmark case (case 1), which had an inlet pressure of 0.62 [MPa] and a pressure ratio of
0.5. Table 3.3 shows the data for the case with the most significant temperature drop (case
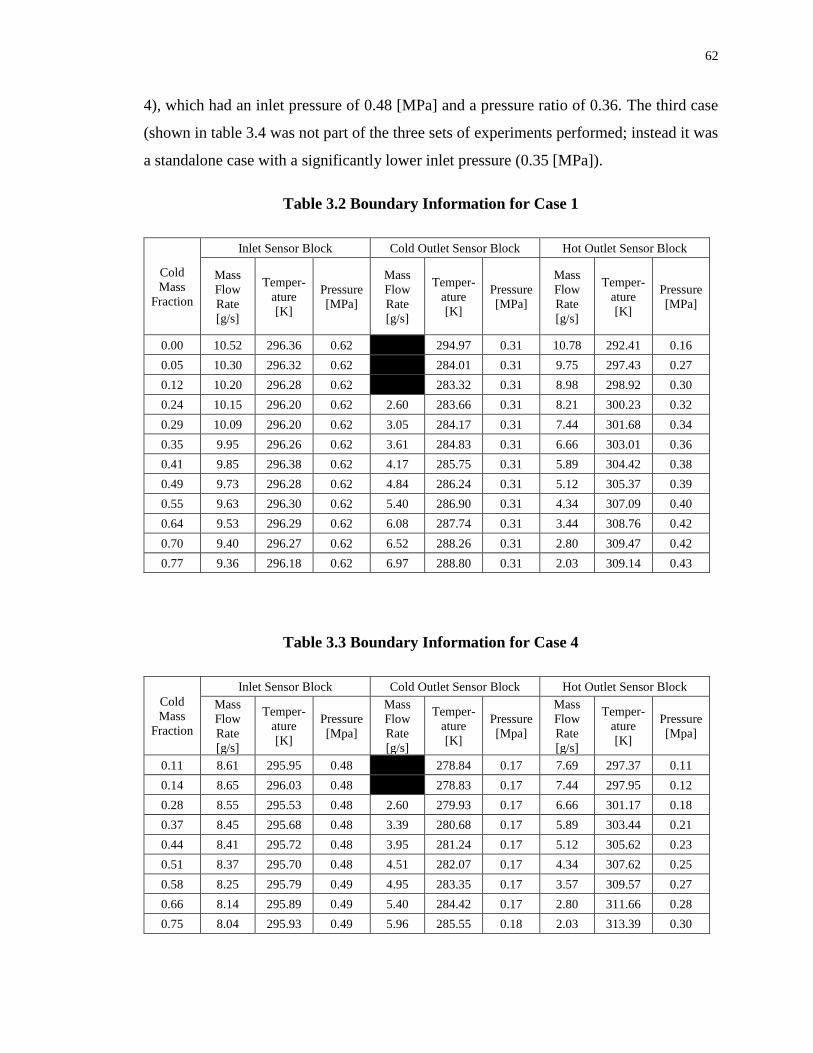
62
4), which had an inlet pressure of 0.48 [MPa] and a pressure ratio of 0.36. The third case
(shown in table 3.4 was not part of the three sets of experiments performed; instead it was
a standalone case with a significantly lower inlet pressure (0.35 [MPa]).
Table 3.2 Boundary Information for Case 1
Cold
Mass
Fraction
Inlet Sensor Block Cold Outlet Sensor Block Hot Outlet Sensor Block
Mass
Flow
Rate
[g/s]
Temper-
ature
[K]
Pressure
[MPa]
Mass
Flow
Rate
[g/s]
Temper-
ature
[K]
Pressure
[MPa]
Mass
Flow
Rate
[g/s]
Temper-
ature
[K]
Pressure
[MPa]
0.00 10.52 296.36 0.62 0.00 294.97 0.31 10.78 292.41 0.16
0.05 10.30 296.32 0.62 0.02 284.01 0.31 9.75 297.43 0.27
0.12 10.20 296.28 0.62 0.02 283.32 0.31 8.98 298.92 0.30
0.24 10.15 296.20 0.62 2.60 283.66 0.31 8.21 300.23 0.32
0.29 10.09 296.20 0.62 3.05 284.17 0.31 7.44 301.68 0.34
0.35 9.95 296.26 0.62 3.61 284.83 0.31 6.66 303.01 0.36
0.41 9.85 296.38 0.62 4.17 285.75 0.31 5.89 304.42 0.38
0.49 9.73 296.28 0.62 4.84 286.24 0.31 5.12 305.37 0.39
0.55 9.63 296.30 0.62 5.40 286.90 0.31 4.34 307.09 0.40
0.64 9.53 296.29 0.62 6.08 287.74 0.31 3.44 308.76 0.42
0.70 9.40 296.27 0.62 6.52 288.26 0.31 2.80 309.47 0.42
0.77 9.36 296.18 0.62 6.97 288.80 0.31 2.03 309.14 0.43
Table 3.3 Boundary Information for Case 4
Cold
Mass
Fraction
Inlet Sensor Block Cold Outlet Sensor Block Hot Outlet Sensor Block
Mass
Flow
Rate
[g/s]
Temper-
ature
[K]
Pressure
[Mpa]
Mass
Flow
Rate
[g/s]
Temper-
ature
[K]
Pressure
[Mpa]
Mass
Flow
Rate
[g/s]
Temper-
ature
[K]
Pressure
[Mpa]
0.11 8.61 295.95 0.48 0.02 278.84 0.17 7.69 297.37 0.11
0.14 8.65 296.03 0.48 0.02 278.83 0.17 7.44 297.95 0.12
0.28 8.55 295.53 0.48 2.60 279.93 0.17 6.66 301.17 0.18
0.37 8.45 295.68 0.48 3.39 280.68 0.17 5.89 303.44 0.21
0.44 8.41 295.72 0.48 3.95 281.24 0.17 5.12 305.62 0.23
0.51 8.37 295.70 0.48 4.51 282.07 0.17 4.34 307.62 0.25
0.58 8.25 295.79 0.49 4.95 283.35 0.17 3.57 309.57 0.27
0.66 8.14 295.89 0.49 5.40 284.42 0.17 2.80 311.66 0.28
0.75 8.04 295.93 0.49 5.96 285.55 0.18 2.03 313.39 0.30

63
Table 3.4 Boundary Information for Low Inlet Pressure
Cold
Mass
Fraction
Inlet Sensor Block Cold Outlet Sensor Block Hot Outlet Sensor Block
Mass
Flow
Rate
[g/s]
Temper-
ature
[K]
Pressure
[Mpa]
Mass
Flow
Rate
[g/s]
Temper-
ature
[K]
Pressure
[Mpa]
Mass
Flow
Rate
[g/s]
Temper-
ature
[K]
Pressure
[Mpa]
0.33 6.23 295.99 0.54 2.26 278.26 0.16 4.60 303.03 0.16
0.40 6.19 296.12 0.55 2.71 278.82 0.16 4.09 305.44 0.21
0.46 6.13 296.24 0.55 3.05 279.48 0.16 3.57 307.35 0.23
0.53 6.09 296.18 0.55 3.39 280.29 0.16 3.06 309.17 0.26
0.59 6.07 296.36 0.55 3.61 281.31 0.16 2.54 311.07 0.27
0.67 5.99 296.34 0.55 4.06 282.38 0.16 2.03 313.05 0.29
To reduce the complexity of the model of the vortex tube for CFD simulations, the outlet
plenums can be eliminated. The cold outlet boundary in the model would then be the orifice
in the vortex generator, and the hot outlet boundary would be the open area between the
tube and the plug. The pressures and temperatures recorded in the plenum can be used as
boundary conditions and for validating the model. Tables 3.5-3.7 provides the pressure and
temperature measured at both outlet plenums and the inlet sensor block, along with the
mass flow rates.
Table 3.5 Plenum Information for Case 1
Cold
Mass
Fraction
Inlet Sensor Block Cold Plenum Hot Plenum
Mass
Flow
Rate
[g/s]
Temper-
ature
[K]
Pressure
[MPa]
Mass
Flow
Rate
[g/s]
Temper-
ature
[K]
Pressure
[MPa]
Mass
Flow
Rate
[g/s]
Temper-
ature
[K]
Pressure
[MPa]
0.00 10.52 296.36 0.62 0.00 293.90 0.33 10.78 297.31 0.32
0.05 10.30 296.32 0.62 0.02 282.15 0.33 9.75 299.80 0.34
0.12 10.20 296.28 0.62 0.02 281.14 0.32 8.98 301.90 0.36
0.24 10.15 296.20 0.62 2.60 282.07 0.33 8.21 303.30 0.37
0.29 10.09 296.20 0.62 3.05 282.46 0.33 7.44 305.17 0.38
0.35 9.95 296.26 0.62 3.61 283.32 0.33 6.66 306.49 0.39
0.41 9.85 296.38 0.62 4.17 284.49 0.34 5.89 307.97 0.40
0.49 9.73 296.28 0.62 4.84 285.34 0.35 5.12 309.60 0.41
0.55 9.63 296.30 0.62 5.40 285.81 0.35 4.34 311.31 0.41
0.64 9.53 296.29 0.62 6.08 286.90 0.35 3.44 313.72 0.42
0.70 9.40 296.27 0.62 6.52 287.90 0.36 2.80 315.58 0.43
0.77 9.36 296.18 0.62 6.97 288.06 0.36 2.03 317.06 0.43

64
Table 3.6 Plenum Information for Case 4
Cold
Mass
Fraction
Inlet Sensor Block Cold Plenum Hot Plenum
Mass
Flow
Rate
[g/s]
Temper-
ature
[K]
Pressure
[Mpa]
Mass
Flow
Rate
[g/s]
Temper-
ature
[K]
Pressure
[Mpa]
Mass
Flow
Rate
[g/s]
Temper-
ature
[K]
Pressure
[Mpa]
0.11 8.61 295.95 0.48 0.02 276.01 0.19 7.69 304.16 0.21
0.14 8.65 296.03 0.48 0.02 276.01 0.19 7.44 304.23 0.21
0.28 8.55 295.53 0.48 2.60 278.27 0.20 6.66 306.95 0.23
0.37 8.45 295.68 0.48 3.39 278.74 0.20 5.89 309.91 0.25
0.44 8.41 295.72 0.48 3.95 279.82 0.21 5.12 312.32 0.26
0.51 8.37 295.70 0.48 4.51 280.83 0.22 4.34 314.89 0.27
0.58 8.25 295.79 0.49 4.95 282.38 0.22 3.57 317.22 0.28
0.66 8.14 295.89 0.49 5.40 284.49 0.23 2.80 320.02 0.29
0.75 8.04 295.93 0.49 5.96 285.81 0.24 2.03 322.35 0.31
Table 3.7 Plenum Information for Low Inlet Pressure
Cold
Mass
Fraction
Inlet Sensor Block Cold Plenum Hot Plenum
Mass
Flow
Rate
[g/s]
Temper-
ature
[K]
Pressure
[Mpa]
Mass
Flow
Rate
[g/s]
Temper-
ature
[K]
Pressure
[Mpa]
Mass
Flow
Rate
[g/s]
Temper-
ature
[K]
Pressure
[Mpa]
0.33 6.23 295.99 0.54 2.26 275.39 0.18 4.60 307.89 0.23
0.40 6.19 296.12 0.55 2.71 276.40 0.19 4.09 311.15 0.25
0.46 6.13 296.24 0.55 3.05 277.49 0.20 3.57 313.72 0.26
0.53 6.09 296.18 0.55 3.39 278.89 0.21 3.06 315.97 0.28
0.59 6.07 296.36 0.55 3.61 280.52 0.22 2.54 318.23 0.29
0.67 5.99 296.34 0.55 4.06 282.15 0.23 2.03 320.64 0.31
Reporting the mass flow rate and the pressure at all three boundaries, gives freedom in
selecting the type of boundary condition (mass flow or pressure) used in a CFD simulation.
The value of the other parameter can then be used in the validation of the flow through the
vortex tube. For example, if a CFD simulation were performed using a mass flow inlet, and
two pressure outlets, the simulation of the flow can be validated using the inlet pressure,
the mass flows out of the outlets, or even the cold mass fraction (which was also included
in tables 3.2-3.4). The temperatures at the inlet and the outlets were reported allowing for
the CFD simulation of the energy separation to be validated.
The data from the other cases conducted can be found in Appendix B.

65
3.4 Summary
The vortex tube developed for this research was used in three sets of experiments, each
containing three cases (with one case being present in all three sets of experiments). Each
case was tested over a range of cold mass fractions and evaluated based on the temperature
drop achieved. The first set of experiments held the cold outlet pressure constant, while the
second and third sets varied the cold outlet pressure to achieve a constant pressure drop
and pressure ratio, respectively.
The constant cold outlet pressure experiments showed that the vortex tube developed was
capable of achieving a substantial temperature drop. These experiments showed the typical
trend of higher inlet pressure resulting in higher temperature drops; however, it was unclear
if the inlet pressure on its own was responsible for the increased performance.
The constant pressure drop between the inlet and the cold outlet experiments yielded results
with the most significant temperature drop being produced with the lowest inlet pressure.
The pressure drop was dismissed as being responsible for the temperature separation as it
was constant for all three cases, but the temperature drops were not comparable between
the three cases.
The last set of experiments had a constant pressure ratio between the inlet and the cold
outlet. The temperature drops for the three cases were of equivalent magnitude (within the
uncertainty of the temperature drop measurements). The results from this set of
experiments show that the pressure ratio is an essential factor in the energy separation
phenomenon present in the vortex tube.
The importance of the pressure ratio was further shown by plotting the cases with the
highest inlet pressures and comparing the temperature drops for the different pressure ratios
of each case. This plot was consistent with the results of the three sets of experiments, in
that lower pressure ratios are capable of improved performance of vortex tubes. The
pressure ratio can be reduced by increasing the inlet pressure or decreasing the cold outlet
pressure. This is why when researchers increased the inlet pressure, increased temperature
66
separation was observed; however, this increase in the temperature separation was the
result of the reduction of the pressure ratio.
Lastly, the measured values of the mass flow rate, temperature and pressure, at the inlet
and outlets were reported for three cases. The first case reported was the benchmark case
(case 1) used in every set of experiments. The second case reported was the case that
produces the most significant temperature drop (case 4). The third case was not part of any
set of experiments, but was a standalone run conducted at a low inlet pressure. The reported
data allows for defining boundary conditions and validating CFD simulations of the vortex
tube developed for this research. With a validated CFD simulation, the internal flow and
energy separation phenomenon can be studied.

67
Chapter 4
4 Concluding Remarks
The research conducted for this thesis set out to fully define a vortex tube through
experimentation to perform and validate future CFD simulations. To accurately model and
validate a CFD simulation, the geometric, operational and performance parameters from
the experiments needed to be reported. The data reported in experimental and numerical
articles were consolidated and evaluated for values of the optimal geometric parameters.
This consolidated data heavily influenced the vortex tube designed for this research.
The design of the experimental setup focused on accurate measurements of the flow that
would be useful for applying boundary conditions and validating CFD simulations of the
vortex tube used in this research. Thus, the design incorporated plenums on both outlets,
as well as sensor blocks downstream of these plenums and one upstream of the inlet
plenum. The outlet plenums insured that the flows exiting the vortex tube were well mixed
and had a homogeneous temperature. It was essential to disturb the flow as little as possible
between the plenums and the sensor blocks to reduce any changes in the fluid properties.
The temperature and pressure were measured at each sensor block and outlet plenum, in
addition to the measured inlet and outlet mass flow rates. The designed experimental setup
yielded a vortex tube of known geometry with operational and performance parameters
precisely measured.
4.1 Research contributions
The contribution this thesis makes to the research on vortex tubes is three-fold; the
consolidation of reported data from prior studies, the importance of the pressure ratio
between the inlet and the cold outlet, and the fully defined parameters need for CFD
simulations.
The data collected from numerous experimental and numerical articles in the literature
provides a design tool for vortex tubes. Individual articles were shown to contradict other
articles in the literature review. Having collected a significant amount of data from
numerous studies, trends in the design parameters emerged, and the importance of Hilsch’

68
[2] third set of variables was evident. The data collected aided in the design of the vortex
tube used in this research and can be used to design additional vortex tubes with a specific
application in mind.
The three sets of experiments conducted showed the importance of Hilsch’ other sets of
variables (fluid properties of the compressed gas, the pressure at the outlets, and the cold
mass fraction). The effect of the cold mass fraction has been shown in numerous articles
and was not the focus of this research; however, it was seen that the magnitude of the
temperature drop was affected by the cold mass split. The research conducted for this thesis
revealed the importance of the ratio between the inlet pressure and the cold outlet pressure.
The three experiments conducted showed that the energy separation in a vortex tube could
be increased by increasing the pressure ratio. This ratio can be increased by increasing the
inlet pressure (Hilsch’ first set of variables) or by decreasing the cold outlet pressure
(Hilsch’ second set of variables). Therefore, the pressure at the cold outlet is as crucial to
the energy separation phenomenon as the inlet pressure is.
The third significant contribution is the detailed reporting of the vortex tube’s geometric,
operational, and performance parameters. The complete design of the vortex tube is
disclosed, allowing for it to be precisely modelled for numerical simulation. The
temperature, pressure, and mass flow rates were measured at specific points, where the
flow was sufficiently mixed, that would allow for boundary conditions to be applied easily
in a CFD simulation. Additional temperature and pressure measurements were made and
reported, allowing for simplified models to be constructed and simulated while still using
precise boundary conditions. Lastly, the reported data can be used to validate the simulation
allowing for the internal flow to be studied.
4.2 Future work
This thesis provides the data required to perform CFD simulations of a vortex tube capable
of producing significant energy separation. Thus, the potential future work would involve
creating a model of the vortex tube using the reported geometry, simulating the complex
flow using the mass flow rate, pressure, and temperature measured at the inlet and outlets

69
for boundary conditions and the remaining measured quantities for validating the
simulations.
With an accurate CFD simulation of a vortex tube, the complex internal flow can be
analyzed, for flow patterns, pressure gradients and temperature gradients. Having detailed
information on the internal flow may provide insight into the elusive mechanism that drives
the energy separation phenomenon.
If the process of energy separation can be fully understood, this opens the door to
improving the efficiency of the vortex tube as well as the potential to find new applications
for the vortex tube.
The experimental results from this research shows that the temperature drop was dependent
on the pressure ratio, however there was insufficient data to conclusively calculate the
polytropic index. Thus, additional future work would be to examine the potential of the
vortex tube being a polytropic process.

70
References
[1] G. J. Ranque, “Experiments on expansion in a vortex with simultaneous exhaust of
hot air and cold air,” J. Phys. Radium, vol. 4, no. 7, pp. 112–114, 1933.
[2] R. Hilsch, “The use of the expansion of gases in a centrifugal field as cooling
process,” Rev. Sci. Instrum., vol. 18, no. 2, pp. 108–113, 1947.
[3] R. G. Deissler and M. Perlmutter, “Analysis of the flow and energy separation in a
turbulent vortex,” Int. J. Heat Mass Transf., vol. 1, no. 2–3, pp. 173–191, 1960.
[4] B. C. U. Linderstrgm-lang, “The three-dimensional distributions of tangential
velocity and total-temperature in vortex tubes,” J . Fluid Mech, vol. 45, no. 1971,
pp. 161–187, 1971.
[5] Kurosaka M, “Acoustic streaming in swirling flow and the Ranque-Hilsch (vortex-
tube) effect,” J . Fluid Mech, vol. 124, no. 1982, pp. 139–172, 1982.
[6] M. Silverman, “The vortex tube: a violation of the second law?,” Eur. J. Phys., vol.
3, pp. 88–92, 1982.
[7] J. R. Simões-Moreira, “An air-standard cycle and a thermodynamic perspective on
operational limits of Ranque-Hilsh or vortex tubes,” Int. J. Refrig., vol. 33, no. 4,
pp. 765–773, 2010.
[8] M. H. Saidi and M. R. Allaf Yazdi, “Exergy model of a vortex tube system with
experimental results,” Energy, vol. 24, no. 7, pp. 625–632, 1999.
[9] M. Kargaran, A. Arabkoohsar, S. J. Hagighat-Hosini, V. Farzaneh-Kord, and M.
Farzaneh-Gord, “The second law analysis of natural gas behaviour within a vortex
tube,” Therm. Sci., vol. 17, no. 4, pp. 1079–1092, 2013.
[10] J. Lewins and A. Bejan, “Vortex tube optimization theory,” Energy, vol. 24, no. 11,
pp. 931–943, 1999.
[11] R. Liew, J. C. H. Zeegers, J. G. M. Kuerten, and W. R. Michalek, “Maxwell’s demon
in the ranque-hilsch vortex tube,” Phys. Rev. Lett., vol. 109, no. 5, pp. 3–6, 2012.
[12] J. G. Polihronov and A. G. Straatman, “Thermodynamics of angular propulsion in
fluids,” Phys. Rev. Lett., vol. 109, no. 5, pp. 1–4, 2012.
[13] K. Dincer, S. Tasdemir, S. Baskaya, and B. Z. Uysal, “Experimental investigation
of the effects of length to diameter ratio and nozzle number on the performance of
counter flow Ranque–Hilsch vortex tubes,” Appl. Therm. Eng., vol. 28, no. 17–18,
pp. 2380–2390, 2008.
[14] K. Dincer, S. Baskaya, B. Z. Uysal, and I. Ucgul, “Experimental investigation of the
performance of a Ranque-Hilsch vortex tube with regard to a plug located at the hot
outlet,” Int. J. Refrig., vol. 32, no. 1, pp. 87–94, 2009.
[15] M. H. Saidi and M. S. Valipour, “Experimental modeling of vortex tube
refrigerator,” Appl. Therm. Eng., vol. 23, no. 15, pp. 1971–1980, 2003.
[16] S. Y. Im and S. S. Yu, “Effects of geometric parameters on the separated air flow
temperature of a vortex tube for design optimization,” Energy, vol. 37, no. 1, pp.
71
154–160, 2012.
[17] A. Celik, M. Yilmaz, M. Kaya, and S. Karagoz, “The experimental investigation
and thermodynamic analysis of vortex tubes,” Heat Mass Transf., vol. 53, no. 2, pp.
395–405, 2016.
[18] S. U. Nimbalkar and M. R. Muller, “An experimental investigation of the optimum
geometry for the cold end orifice of a vortex tube,” Appl. Therm. Eng., vol. 29, no.
2–3, pp. 509–514, 2009.
[19] P. Promvonge and S. Eiamsa-ard, “Investigation on the Vortex Thermal Separation
in a Vortex Tube Refrigerator,” ScienceAsia, vol. 31, no. 3, p. 215, 2005.
[20] V. Kirmaci, “Exergy analysis and performance of a counter flow Ranque-Hilsch
vortex tube having various nozzle numbers at different inlet pressures of oxygen and
air,” Int. J. Refrig., vol. 32, no. 7, pp. 1626–1633, 2009.
[21] Y. Xue and M. Arjomandi, “The effect of vortex angle on the efficiency of the
Ranque-Hilsch vortex tube,” Exp. Therm. Fluid Sci., vol. 33, no. 1, pp. 54–57, 2008.
[22] O. Aydin and M. Baki, “An experimental study on the design parameters of a
counterflow vortex tube,” Energy, vol. 31, no. 14, pp. 2427–2436, 2006.
[23] O. Aydin, B. Markal, and M. Avci, “A new vortex generator geometry for a counter-
flow Ranque-Hilsch vortex tube,” Appl. Therm. Eng., vol. 30, no. 16, pp. 2505–
2511, 2010.
[24] B. Markal, O. Aydin, and M. Avci, “An experimental study on the effect of the valve
angle of counter-flow Ranque-Hilsch vortex tubes on thermal energy separation,”
Exp. Therm. Fluid Sci., vol. 34, no. 7, pp. 966–971, 2010.
[25] M. Avci, “The effects of nozzle aspect ratio and nozzle number on the performance
of the Ranque-Hilsch vortex tube,” Appl. Therm. Eng., vol. 50, no. 1, pp. 302–308,
2013.
[26] S. Eiamsa-ard, “Experimental investigation of energy separation in a counter-flow
Ranque-Hilsch vortex tube with multiple inlet snail entries,” Int. Commun. Heat
Mass Transf., vol. 37, no. 6, pp. 637–643, 2010.
[27] Y. T. Wu, Y. Ding, Y. B. Ji, C. F. Ma, and M. C. Ge, “Modification and experimental
research on vortex tube,” Int. J. Refrig., vol. 30, no. 6, pp. 1042–1049, 2007.
[28] K. D. Devade and A. T. Pise, “Effect of Mach number, valve angle and length to
diameter ratio on thermal performance in flow of air through Ranque Hilsch vortex
tube,” Heat Mass Transf., vol. 53, no. 1, pp. 161–168, 2017.
[29] A. Kumar, Vivekanand, and S. Subudhi, “Cooling and dehumidification using
vortex tube,” Appl. Therm. Eng., vol. 122, pp. 181–193, 2017.
[30] P. a. Ramakrishna, M. Ramakrishna, and R. Manimaran, “Experimental
Investigation of Temperature Separation in a Counter-Flow Vortex Tube,” J. Heat
Transfer, vol. 136, no. 8, p. 082801, 2014.
[31] S. Eiamsa-ard, K. Wongcharee, and P. Promvonge, “Experimental investigation on
energy separation in a counter-flow Ranque-Hilsch vortex tube: Effect of cooling a
72
hot tube,” Int. Commun. Heat Mass Transf., vol. 37, no. 2, pp. 156–162, 2010.
[32] R. T. Balmer, “Pressure-Driven Ranque-Hilsch,” vol. 110, no. June 1988, pp. 161–
164, 2017.
[33] B. Ahlborn, J. Camire, and J. U. Keller, “Low-pressure vortex tubes,” J. Phys. D.
Appl. Phys., vol. 29, no. 6, pp. 1469–1472, 1999.
[34] M. Attalla, H. Ahmed, M. S. Ahmed, and A. A. El-Wafa, “Experimental
investigation for thermal performance of series and parallel Ranque-Hilsch vortex
tube systems,” Appl. Therm. Eng., vol. 123, pp. 327–339, 2017.
[35] S. Subudhi and M. Sen, “Review of Ranque–Hilsch vortex tube experiments using
air,” Renew. Sustain. Energy Rev., vol. 52, pp. 172–178, 2015.
[36] C. M. Gao, K. J. Bosschaart, J. C. H. Zeegers, and A. T. A. M. De Waele,
“Experimental study on a simple Ranque-Hilsch vortex tube,” Cryogenics (Guildf).,
vol. 45, no. 3, pp. 173–183, 2005.
[37] Y. Xue, M. Arjomandi, and R. Kelso, “A critical review of temperature separation
in a vortex tube,” Exp. Therm. Fluid Sci., vol. 34, no. 8, pp. 1367–1374, 2010.
[38] H. M. Skye, G. F. Nellis, and S. A. Klein, “Comparison of CFD analysis to empirical
data in a commercial vortex tube,” Int. J. Refrig., vol. 29, no. 1, pp. 71–80, 2006.
[39] H. R. Thakare and A. D. Parekh, “Computational analysis of energy separation in
counter-flow vortex tube,” Energy, vol. 85, pp. 62–77, 2015.
[40] H. R. Thakare and A. D. Parekh, “Experimental investigation & CFD analysis of
Ranque—Hilsch vortex tube,” Energy, vol. 133, pp. 284–298, 2017.
[41] X. Liu and Z. Liu, “Investigation of the energy separation effect and flow
mechanism inside a vortex tube,” Appl. Therm. Eng., vol. 67, no. 1–2, pp. 494–506,
2014.
[42] V. Alekhin, V. Bianco, A. Khait, and A. Noskov, “Numerical investigation of a
double-circuit Ranque-Hilsch vortex tube,” Int. J. Therm. Sci., vol. 89, pp. 272–282,
2015.
[43] N. F. Aljuwayhel, G. F. Nellis, and S. A. Klein, “Parametric and internal study of
the vortex tube using a CFD model,” Int. J. Refrig., vol. 28, no. 3, pp. 442–450,
2005.
[44] U. Behera, P. J. Paul, K. Dinesh, and S. Jacob, “Numerical investigations on flow
behaviour and energy separation in Ranque-Hilsch vortex tube,” Int. J. Heat Mass
Transf., vol. 51, no. 25–26, pp. 6077–6089, 2008.
[45] C.-H. Sohn, C.-S. Kim, U.-H. Jung, and B. H. L. L. Gowda, “Experimental and
Numerical Studies in a Vortex Tube,” J. Mech. Sci. Tecchnology, vol. 20, no. 3, pp.
418–425, 2006.
[46] S. E. Rafiee and M. M. Sadeghiazad, “Experimental and 3D CFD investigation on
heat transfer and energy separation inside a counter flow vortex tube using different
shapes of hot control valves,” Appl. Therm. Eng., vol. 110, pp. 648–664, 2017.
[47] S. E. Rafiee and M. M. Sadeghiazad, “Three-dimensional and experimental

73
investigation on the effect of cone length of throttle valve on thermal performance
of a vortex tube using k-?? turbulence model,” Appl. Therm. Eng., vol. 66, no. 1–2,
pp. 65–74, 2014.
[48] H. A. Kandil and S. T. Abdelghany, “Computational investigation of different
effects on the performance of the Ranque-Hilsch vortex tube,” Energy, vol. 84, pp.
207–218, 2015.
[49] A. K. Dhillon and S. S. Bandyopadhyay, “CFD analysis of straight and flared vortex
tube,” IOP Conf. Ser. Mater. Sci. Eng., vol. 101, no. 1, 2015.
[50] M. Bovand, M. S. Valipour, K. Dincer, and A. Tamayol, “Numerical analysis of the
curvature effects on Ranque-Hilsch vortex tube refrigerators,” Appl. Therm. Eng.,
vol. 65, no. 1–2, pp. 176–183, 2014.
[51] T. Dutta, K. P. Sinhamahapatra, and S. S. Bandyopadhyay, “CFD Analysis of
Energy Separation in Ranque-Hilsch Vortex Tube at Cryogenic Temperature,” J.
Fluids, vol. 2013, pp. 1–14, 2013.
[52] B. A. Shannak, “Temperature separation and friction losses in vortex tube,” Heat
Mass Transf., vol. 40, no. 10, pp. 779–785, 2004.
[53] S. Mohammadi and F. Farhadi, “Experimental analysis of a RanqueeHilsch vortex
tube for optimizing nozzle numbers and diameter,” Appl. Therm. Eng., vol. 61, no.
2, pp. 500–506, 2013.
[54] O. Tlili El May, I. Mokni, H. Mhiri, and P. Bournot, “CFD investigation of a vortex
tube : Effect of the cold end orifice in the temperature separation mechanism,” Sci.
Acad. Trans. Renew. Energy Syst. Eng. Technol., vol. 1, no. 3, pp. 84–89, 2011.
[55] U. Behera et al., “CFD analysis and experimental investigations towards optimizing
the parameters of Ranque-Hilsch vortex tube,” Int. J. Heat Mass Transf., vol. 48,
no. 10, pp. 1961–1973, 2005.
[56] T. Farouk and B. Farouk, “Large eddy simulations of the flow field and temperature
separation in the Ranque-Hilsch vortex tube,” Int. J. Heat Mass Transf., vol. 50, pp.
4724–4735, 2007.
[57] T. Dutta, K. P. Sinhamahapatra, and S. S. Bandyopdhyay, “Comparison of different
turbulence models in predicting the temperature separation in a Ranque-Hilsch
vortex tube,” Int. J. Refrig., vol. 33, no. 4, pp. 783–792, 2010.
[58] S. Akhesmeh, N. Pourmahmou, and H. Sedgi, “Numerical Study of the Temperature
Separation in the Ranque-Hilsch Vortex Tube,” Am. J. Eng. Appl. Sci., vol. 1, no. 3,
pp. 181–187, 2008.
[59] R. J. Moffat, “Using Uncertainty Analysis in the Planning of an Experiment,” J.
Fluids Eng., vol. 107, no. 2, p. 173, 2009.

74
Appendices
Appendix A: Drawings
Figure A.1 Vortex Tube .................................................................................................... 75
Figure A.2 Hose Fitting .................................................................................................... 76
Figure A.3 Inlet Sensor Block .......................................................................................... 77
Figure A.4 Inlet Pipe ......................................................................................................... 78
Figure A.5 Inlet Plenum .................................................................................................... 79
Figure A.6 Vortex Generator (sheet 1) ............................................................................. 80
Figure A.7 Vortex Generator (sheet 2) ............................................................................. 81
Figure A.8 Main Tube....................................................................................................... 82
Figure A.9 Plug ................................................................................................................. 83
Figure A.10 Hot Plenum ................................................................................................... 84
Figure A.11 Plug Reinforcement ...................................................................................... 85
Figure A.12 Outlet Tube ................................................................................................... 86
Figure A.13 Outlet Sensor Block ...................................................................................... 87
Figure A.14 Cold Plenum ................................................................................................. 88
Figure A.15 RTD Cap ....................................................................................................... 89
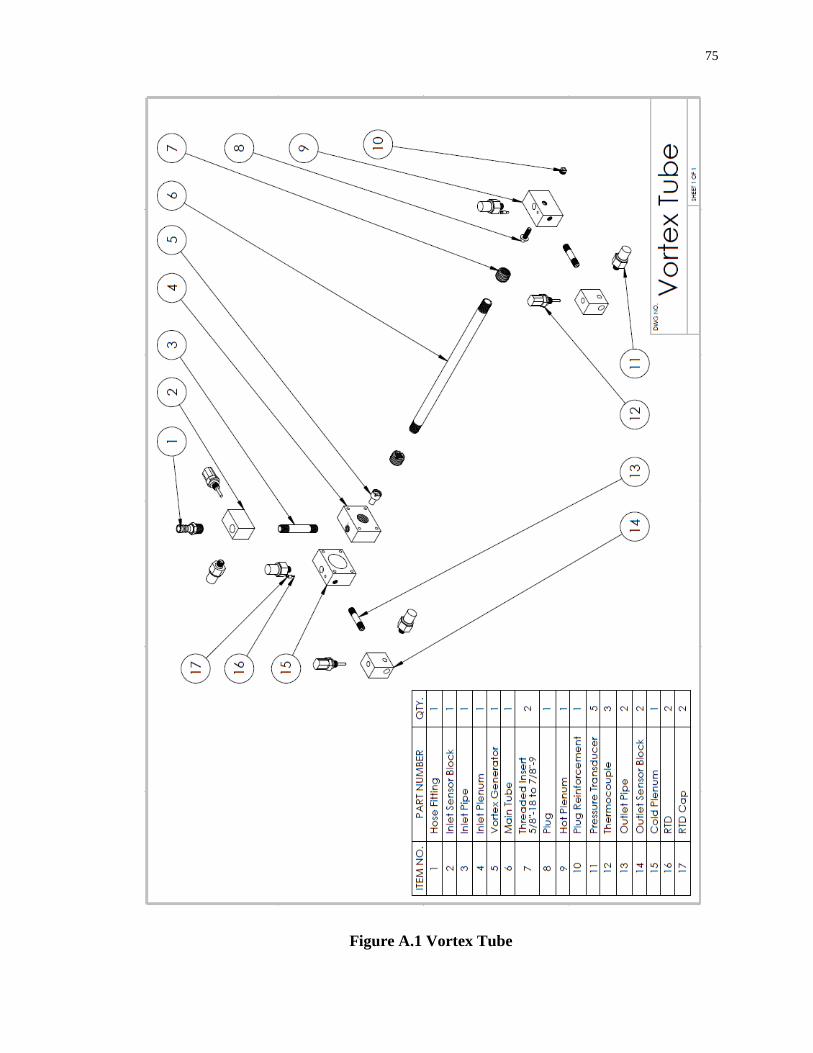
75
Figure A.1 Vortex Tube

76
Figure A.2 Hose Fitting

77
Figure A.3 Inlet Sensor Block

78
Figure A.4 Inlet Pipe
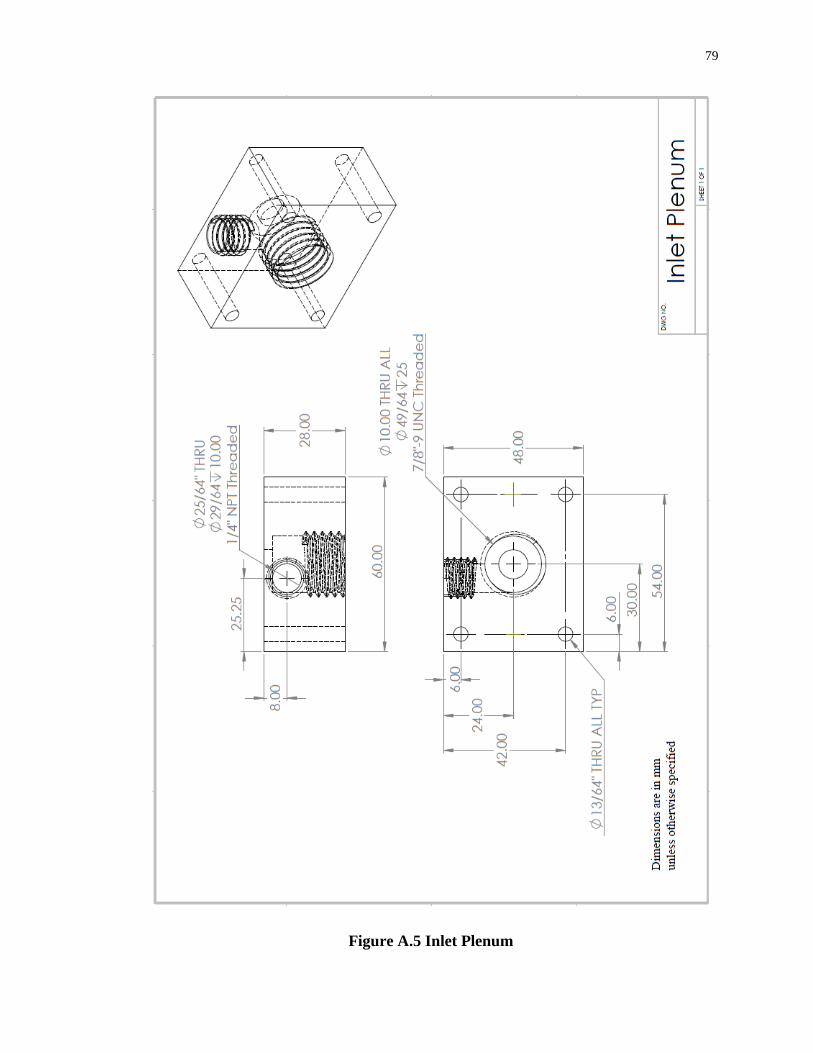
79
Figure A.5 Inlet Plenum
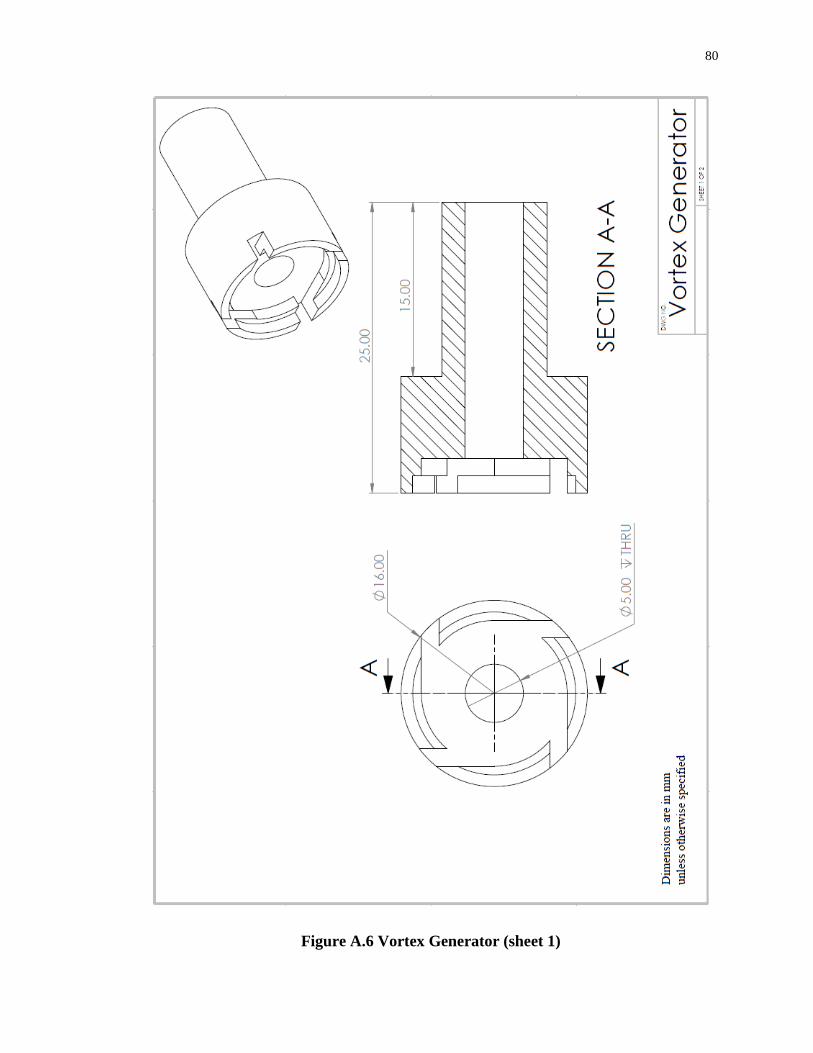
80
Figure A.6 Vortex Generator (sheet 1)

81
Figure A.7 Vortex Generator (sheet 2)

82
Figure A.8 Main Tube

83
Figure A.9 Plug

84
Figure A.10 Hot Plenum

85
Figure A.11 Plug Reinforcement
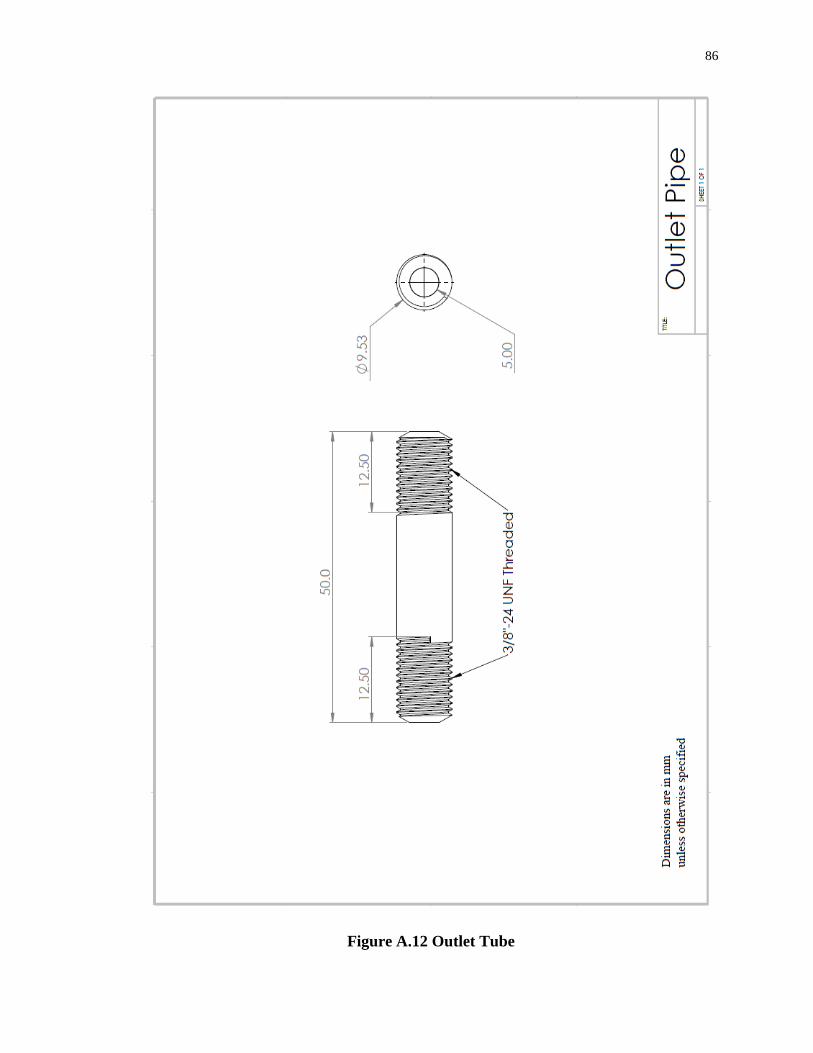
86
Figure A.12 Outlet Tube
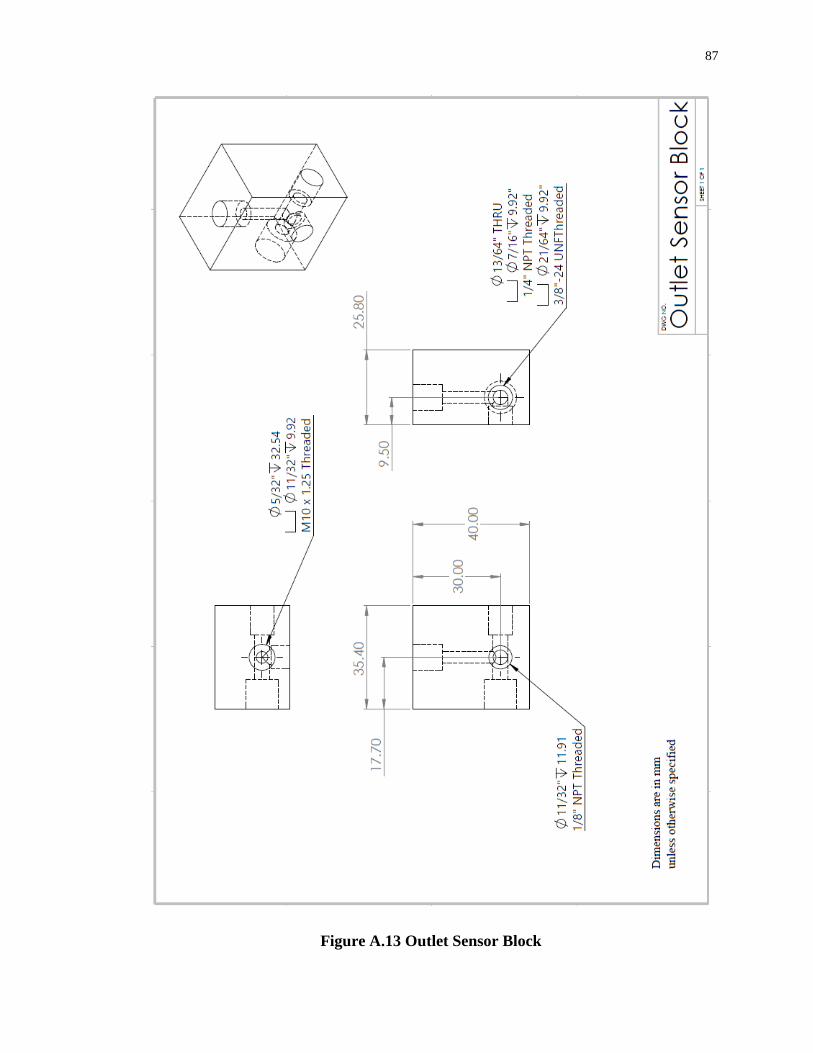
87
Figure A.13 Outlet Sensor Block

88
Figure A.14 Cold Plenum

89
Figure A.15 RTD Cap

90
Appendix B: Additional Experimental Data
Table B.1 Boundary Information for Case 2 .................................................................... 91
Table B.2 Boundary Information for Case 3 .................................................................... 91
Table B.3 Boundary Information for Case 5 .................................................................... 92
Table B.4 Boundary Information for Case 6 .................................................................... 92
Table B.5 Boundary Information for Case 7 .................................................................... 93
Table B.6 Plenum Information for Case 2 ........................................................................ 93
Table B.7 Plenum Information for Case 3 ........................................................................ 94
Table B.8 Plenum Information for Case 5 ........................................................................ 94
Table B.9 Plenum Information for Case 6 ........................................................................ 95
Table B.10 Plenum Information for Case 7 ...................................................................... 95

91
Table B.1 Boundary Information for Case 2
Cold
Mass
Fraction
Inlet Sensor Block Cold Sensor Block Hot Sensor Block
Mass
Flow
Rate
[g/s]
Temper-
ature
[K]
Pressure
[Mpa]
Mass
Flow
Rate
[g/s]
Temper-
ature
[K]
Pressure
[Mpa]
Mass
Flow
Rate
[g/s]
Temper-
ature
[K]
Pressure
[Mpa]
0.00 7.58 295.94 0.49 0.00 294.89 0.31 8.47 294.65 0.26
0.00 7.45 296.51 0.49 0.02 289.93 0.31 7.44 296.32 0.29
0.07 7.19 296.68 0.48 0.02 288.80 0.31 6.66 297.09 0.30
0.16 7.05 296.78 0.48 0.02 288.61 0.31 5.89 298.57 0.32
0.31 6.99 296.81 0.48 2.26 288.74 0.31 5.12 299.73 0.33
0.39 6.93 296.87 0.49 2.83 289.14 0.31 4.34 300.83 0.34
0.49 6.86 296.87 0.49 3.39 289.70 0.31 3.57 302.22 0.36
0.57 6.76 296.79 0.49 3.72 290.08 0.31 2.80 303.25 0.36
0.68 6.66 296.88 0.49 4.39 290.79 0.31 2.03 305.02 0.37
Table B.2 Boundary Information for Case 3
Cold
Mass
Fraction
Inlet Sensor Block Cold Sensor Block Hot Sensor Block
Mass
Flow
Rate
[g/s]
Temper-
ature
[K]
Pressure
[Mpa]
Mass
Flow
Rate
[g/s]
Temper-
ature
[K]
Pressure
[Mpa]
Mass
Flow
Rate
[g/s]
Temper-
ature
[K]
Pressure
[Mpa]
0.14 13.42 294.63 0.76 1.87 277.56 0.31 11.76 297.32 0.25
0.20 13.26 294.64 0.76 2.79 278.16 0.31 10.97 299.04 0.30
0.26 13.16 294.65 0.76 3.58 278.96 0.31 10.18 300.58 0.33
0.32 12.96 294.67 0.76 4.37 279.72 0.31 9.39 301.90 0.36
0.38 12.82 294.68 0.76 5.29 280.81 0.31 8.60 303.37 0.39
0.44 12.77 294.72 0.76 6.21 281.49 0.31 7.81 304.87 0.41
0.49 12.69 294.74 0.76 6.86 282.03 0.31 7.03 306.23 0.43
0.54 12.65 294.74 0.76 7.39 282.56 0.31 6.24 307.56 0.44
0.60 12.47 294.74 0.76 8.04 283.30 0.31 5.45 308.92 0.46
0.64 12.37 294.74 0.76 8.44 284.16 0.31 4.66 310.28 0.47
0.70 12.12 294.76 0.76 8.83 285.02 0.31 3.87 311.41 0.48
0.75 12.00 294.77 0.76 9.36 285.91 0.31 3.08 312.53 0.49
0.81 11.96 294.56 0.76 9.75 286.32 0.31 2.29 312.72 0.50

92
Table B.3 Boundary Information for Case 5
Cold
Mass
Fraction
Inlet Sensor Block Cold Sensor Block Hot Sensor Block
Mass
Flow
Rate
[g/s]
Temper-
ature
[K]
Pressure
[Mpa]
Mass
Flow
Rate
[g/s]
Temper-
ature
[K]
Pressure
[Mpa]
Mass
Flow
Rate
[g/s]
Temper-
ature
[K]
Pressure
[Mpa]
0.00 12.15 296.44 0.76 0.00 296.11 0.45 12.29 294.93 0.36
0.04 11.92 296.66 0.76 0.00 287.48 0.45 11.50 296.76 0.41
0.07 11.76 296.67 0.76 0.00 286.08 0.44 10.97 297.68 0.43
0.17 11.66 296.68 0.76 2.13 286.22 0.44 10.18 298.81 0.46
0.25 11.64 296.77 0.77 3.05 286.92 0.45 9.39 299.72 0.48
0.30 11.58 296.69 0.77 3.71 287.18 0.45 8.60 300.68 0.50
0.35 11.29 296.64 0.76 4.24 287.59 0.45 7.81 301.67 0.51
0.41 11.17 296.68 0.76 4.89 288.09 0.45 7.03 302.79 0.52
0.47 11.07 296.48 0.76 5.55 288.45 0.45 6.24 303.44 0.54
0.52 10.89 296.38 0.75 5.94 289.00 0.45 5.45 304.23 0.54
0.60 10.95 296.46 0.76 6.86 289.29 0.45 4.66 305.59 0.55
0.66 10.82 296.40 0.77 7.39 289.67 0.45 3.87 306.29 0.56
0.71 10.80 296.50 0.76 7.91 290.19 0.45 3.21 307.50 0.56
0.79 10.64 296.38 0.76 8.57 290.71 0.45 2.29 308.55 0.57
Table B.4 Boundary Information for Case 6
Cold
Mass
Fraction
Inlet Sensor Block Cold Sensor Block Hot Sensor Block
Mass
Flow
Rate
[g/s]
Temper-
ature
[K]
Pressure
[Mpa]
Mass
Flow
Rate
[g/s]
Temper-
ature
[K]
Pressure
[Mpa]
Mass
Flow
Rate
[g/s]
Temper-
ature
[K]
Pressure
[Mpa]
0.01 8.16 296.59 0.75 0.02 285.99 0.37 8.08 296.50 0.28
0.07 8.00 296.50 0.75 0.02 284.04 0.38 7.44 298.80 0.35
0.16 7.96 296.50 0.75 0.02 284.39 0.37 6.66 300.61 0.38
0.31 7.84 296.50 0.75 2.60 285.09 0.38 5.76 302.03 0.42
0.37 7.72 296.58 0.75 3.05 285.64 0.37 5.12 303.36 0.43
0.45 7.62 296.50 0.75 3.61 286.42 0.38 4.34 304.55 0.46
0.55 7.49 296.29 0.75 4.28 286.98 0.37 3.57 306.18 0.48
0.63 7.41 296.10 0.75 4.73 287.57 0.38 2.80 307.12 0.49
0.72 7.33 295.71 0.75 5.18 287.94 0.38 2.03 307.33 0.51

93
Table B.5 Boundary Information for Case 7
Cold
Mass
Fraction
Inlet Sensor Block Cold Sensor Block Hot Sensor Block
Mass
Flow
Rate
[g/s]
Temper-
ature
[K]
Pressure
[Mpa]
Mass
Flow
Rate
[g/s]
Temper-
ature
[K]
Pressure
[Mpa]
Mass
Flow
Rate
[g/s]
Temper-
ature
[K]
Pressure
[Mpa]
0.01 13.00 296.72 1.17 0.00 292.87 0.59 12.81 292.83 0.30
0.03 12.90 296.82 1.18 0.00 285.29 0.59 12.55 296.11 0.41
0.08 12.79 296.74 1.18 0.00 282.78 0.59 11.76 297.89 0.50
0.14 12.51 296.85 1.17 1.74 283.51 0.59 10.97 299.36 0.56
0.22 12.37 296.93 1.16 2.79 284.18 0.60 10.18 301.03 0.61
0.28 12.33 296.88 1.17 3.58 284.48 0.59 9.39 302.11 0.64
0.34 12.25 297.00 1.17 4.50 285.15 0.59 8.60 303.50 0.68
0.40 12.14 296.64 1.17 5.29 285.73 0.59 7.81 304.41 0.71
0.46 12.06 296.64 1.18 6.07 286.32 0.60 7.03 305.73 0.74
0.51 11.88 296.60 1.18 6.60 286.63 0.59 6.24 307.28 0.76
0.58 11.86 296.58 1.18 7.39 287.11 0.59 5.45 308.44 0.77
0.63 11.74 296.66 1.18 7.91 287.83 0.59 4.66 309.69 0.79
0.68 11.49 296.69 1.17 8.18 288.45 0.59 3.87 310.54 0.80
0.74 11.47 296.60 1.18 8.83 289.13 0.59 3.08 312.19 0.82
0.80 11.45 296.68 1.18 9.23 289.47 0.59 2.29 312.76 0.82
Table B.6 Plenum Information for Case 2
Cold
Mass
Fraction
Inlet Sensor Block Cold Plenum Hot Plenum
Mass
Flow
Rate
[g/s]
Temper-
ature
[K]
Pressure
[Mpa]
Mass
Flow
Rate
[g/s]
Temper-
ature
[K]
Pressure
[Mpa]
Mass
Flow
Rate
[g/s]
Temper-
ature
[K]
Pressure
[Mpa]
0.00 7.58 295.94 0.49 0.00 294.98 0.32 8.47 297.39 0.31
0.00 7.45 296.51 0.49 0.02 288.53 0.32 7.44 299.57 0.33
0.07 7.19 296.68 0.48 0.02 287.90 0.31 6.66 300.73 0.33
0.16 7.05 296.78 0.48 0.02 287.98 0.32 5.89 302.06 0.34
0.31 6.99 296.81 0.48 2.26 288.06 0.32 5.12 303.38 0.35
0.39 6.93 296.87 0.49 2.83 288.68 0.32 4.34 304.78 0.35
0.49 6.86 296.87 0.49 3.39 289.15 0.33 3.57 306.56 0.37
0.57 6.76 296.79 0.49 3.72 289.93 0.33 2.80 307.81 0.37
0.68 6.66 296.88 0.49 4.39 290.40 0.34 2.03 310.69 0.38

94
Table B.7 Plenum Information for Case 3
Cold
Mass
Fraction
Inlet Sensor Block Cold Plenum Hot Plenum
Mass
Flow
Rate
[g/s]
Temper-
ature
[K]
Pressure
[Mpa]
Mass
Flow
Rate
[g/s]
Temper-
ature
[K]
Pressure
[Mpa]
Mass
Flow
Rate
[g/s]
Temper-
ature
[K]
Pressure
[Mpa]
0.14 13.42 294.63 0.76 1.87 275.08 0.32 11.76 300.81 0.35
0.20 13.26 294.64 0.76 2.79 276.24 0.33 10.97 302.29 0.37
0.26 13.16 294.65 0.76 3.58 276.48 0.33 10.18 304.08 0.38
0.32 12.96 294.67 0.76 4.37 277.57 0.34 9.39 305.56 0.40
0.38 12.82 294.68 0.76 5.29 279.43 0.34 8.60 307.65 0.41
0.44 12.77 294.72 0.76 6.21 279.98 0.35 7.81 309.21 0.44
0.49 12.69 294.74 0.76 6.86 280.91 0.36 7.03 310.76 0.45
0.54 12.65 294.74 0.76 7.39 282.00 0.36 6.24 312.48 0.46
0.60 12.47 294.74 0.76 8.04 282.38 0.37 5.45 314.26 0.47
0.64 12.37 294.74 0.76 8.44 283.55 0.38 4.66 315.82 0.48
0.70 12.12 294.76 0.76 8.83 284.57 0.38 3.87 317.06 0.49
0.75 12.00 294.77 0.76 9.36 285.88 0.39 3.08 319.32 0.50
0.81 11.96 294.56 0.76 9.75 286.74 0.40 2.29 320.48 0.51
Table B.8 Plenum Information for Case 5
Cold
Mass
Fraction
Inlet Sensor Block Cold Plenum Hot Plenum
Mass
Flow
Rate
[g/s]
Temper-
ature
[K]
Pressure
[Mpa]
Mass
Flow
Rate
[g/s]
Temper-
ature
[K]
Pressure
[Mpa]
Mass
Flow
Rate
[g/s]
Temper-
ature
[K]
Pressure
[Mpa]
0.00 12.15 296.44 0.76 0.00 294.98 0.46 12.29 297.70 0.46
0.04 11.92 296.66 0.76 0.00 285.19 0.47 11.50 299.57 0.48
0.07 11.76 296.67 0.76 0.00 283.40 0.47 10.97 300.81 0.49
0.17 11.66 296.68 0.76 2.13 283.32 0.47 10.18 301.98 0.51
0.25 11.64 296.77 0.77 3.05 284.33 0.47 9.39 302.99 0.52
0.30 11.58 296.69 0.77 3.71 284.64 0.48 8.60 304.31 0.53
0.35 11.29 296.64 0.76 4.24 284.80 0.48 7.81 305.48 0.53
0.41 11.17 296.68 0.76 4.89 285.65 0.48 7.03 306.64 0.55
0.47 11.07 296.48 0.76 5.55 286.20 0.49 6.24 307.19 0.55
0.52 10.89 296.38 0.75 5.94 286.54 0.50 5.45 308.90 0.56
0.60 10.95 296.46 0.76 6.86 288.57 0.50 4.66 310.37 0.57
0.66 10.82 296.40 0.77 7.39 288.64 0.51 3.87 311.31 0.58
0.71 10.80 296.50 0.76 7.91 289.57 0.51 3.21 313.10 0.58
0.79 10.64 296.38 0.76 8.57 290.51 0.52 2.29 314.19 0.58
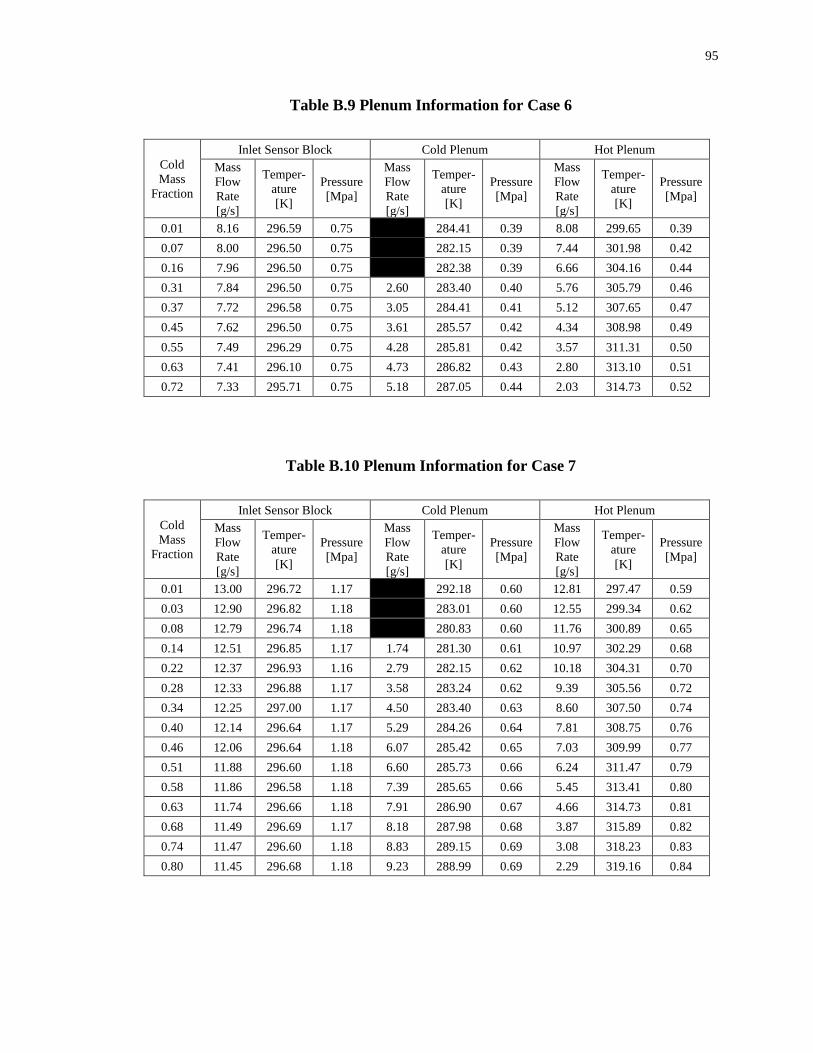
95
Table B.9 Plenum Information for Case 6
Cold
Mass
Fraction
Inlet Sensor Block Cold Plenum Hot Plenum
Mass
Flow
Rate
[g/s]
Temper-
ature
[K]
Pressure
[Mpa]
Mass
Flow
Rate
[g/s]
Temper-
ature
[K]
Pressure
[Mpa]
Mass
Flow
Rate
[g/s]
Temper-
ature
[K]
Pressure
[Mpa]
0.01 8.16 296.59 0.75 0.02 284.41 0.39 8.08 299.65 0.39
0.07 8.00 296.50 0.75 0.02 282.15 0.39 7.44 301.98 0.42
0.16 7.96 296.50 0.75 0.02 282.38 0.39 6.66 304.16 0.44
0.31 7.84 296.50 0.75 2.60 283.40 0.40 5.76 305.79 0.46
0.37 7.72 296.58 0.75 3.05 284.41 0.41 5.12 307.65 0.47
0.45 7.62 296.50 0.75 3.61 285.57 0.42 4.34 308.98 0.49
0.55 7.49 296.29 0.75 4.28 285.81 0.42 3.57 311.31 0.50
0.63 7.41 296.10 0.75 4.73 286.82 0.43 2.80 313.10 0.51
0.72 7.33 295.71 0.75 5.18 287.05 0.44 2.03 314.73 0.52
Table B.10 Plenum Information for Case 7
Cold
Mass
Fraction
Inlet Sensor Block Cold Plenum Hot Plenum
Mass
Flow
Rate
[g/s]
Temper-
ature
[K]
Pressure
[Mpa]
Mass
Flow
Rate
[g/s]
Temper-
ature
[K]
Pressure
[Mpa]
Mass
Flow
Rate
[g/s]
Temper-
ature
[K]
Pressure
[Mpa]
0.01 13.00 296.72 1.17 0.00 292.18 0.60 12.81 297.47 0.59
0.03 12.90 296.82 1.18 0.00 283.01 0.60 12.55 299.34 0.62
0.08 12.79 296.74 1.18 0.00 280.83 0.60 11.76 300.89 0.65
0.14 12.51 296.85 1.17 1.74 281.30 0.61 10.97 302.29 0.68
0.22 12.37 296.93 1.16 2.79 282.15 0.62 10.18 304.31 0.70
0.28 12.33 296.88 1.17 3.58 283.24 0.62 9.39 305.56 0.72
0.34 12.25 297.00 1.17 4.50 283.40 0.63 8.60 307.50 0.74
0.40 12.14 296.64 1.17 5.29 284.26 0.64 7.81 308.75 0.76
0.46 12.06 296.64 1.18 6.07 285.42 0.65 7.03 309.99 0.77
0.51 11.88 296.60 1.18 6.60 285.73 0.66 6.24 311.47 0.79
0.58 11.86 296.58 1.18 7.39 285.65 0.66 5.45 313.41 0.80
0.63 11.74 296.66 1.18 7.91 286.90 0.67 4.66 314.73 0.81
0.68 11.49 296.69 1.17 8.18 287.98 0.68 3.87 315.89 0.82
0.74 11.47 296.60 1.18 8.83 289.15 0.69 3.08 318.23 0.83
0.80 11.45 296.68 1.18 9.23 288.99 0.69 2.29 319.16 0.84

96
Curriculum Vitae
Name: Mark Parker
Post-secondary University of Ontario Institute of Technology
Education and Oshawa, Ontario, Canada
Degrees: 2012-2017 B.A.
The University of Western Ontario
London, Ontario, Canada
2017-2019 M.E.Sc
Related Work Teaching Assistant
Experience The University of Western Ontario
2017-2019