Embed Size (px)
Citation preview

An experimental comparison of detector performance for directand indirect digital radiography systems
Ehsan Sameia)
Departments of Radiology, Physics, and Biomedical Engineering, Duke University, DUMC 3302,Durham, North Carolina 27710
Michael J. FlynnDepartment of Diagnostic Radiology, Henry Ford Health System, Detroit, Michigan 48202
~Received 10 September 2002; accepted for publication 21 January 2003; published 26 March 2003!
Current flat-panel detectors either directly convert x-ray energy to electronic charge or use indirectconversion with an intermediate optical process. The purpose of this work was to compare directand indirect detectors in terms of their modulation transfer function~MTF!, noise power spectrum~NPS!, and detective quantum efficiency~DQE!. Measurements were made on three flat-paneldetectors, Hologic Direct-Ray DR-1000~DRC!, GE Revolution XQ/i~XQ/i!, and Philips DigitalDiagnost~DiDi ! using the IEC-defined RQA5~;74 kVp, 21 mm Al! and RQA9~;120 kVp, 40mm Al! radiographic techniques. The presampled MTFs of the systems were measured using anedge method@Sameiet al., Med. Phys.25, 102 ~1998!#. The NPS of the systems were determinedfor a range of exposure levels by two-dimensional~2D! Fourier analysis of uniformly exposedradiographs@Flynn and Samei, Med. Phys.26, 1612 ~1999!#. The DQEs were assessed from themeasured MTF, NPS, exposure, and estimated ideal signal-to-noise ratios. For the direct system, theMTF was found to be significantly higher than that for the indirect systems and very close to anideal function associated with the detector pixel size. The NPS for the direct system was found tobe constant in relation to frequency. For the XQ/i and DRC systems, the DQE results reflectedexpected differences based on the absorption efficiency of the different detector materials. UsingRQA5, the measured DQE values in the diagonal~and axial! direction~s! at spatial frequencies of0.15 mm21 and 2.5 mm21 were 64%~64%! and 20%~15%! for the XQ/i system, and 38%~38%!and 20%~20%! for the DRC, respectively. The DQE results of the DiDi system were difficult tointerpret due to additional preprocessing steps in that system. ©2003 American Association ofPhysicists in Medicine.@DOI: 10.1118/1.1561285#
Key words: image quality, digital radiography, flat panel x-ray detector, resolution, modulationtransfer function, MTF, noise, noise power spectrum, NPS, detective quantum efficiency, DQE
othvethflalaogethge
r
rp
onbthorrg
tial.eadandely.se-
rs,wopho-
di-.rtsred intedm
ide
a-
I. INTRODUCTION
Digital radiography has gained popularity in many areasclinical practice. Computed radiography or CR is perhapsmost abundant and common technology today with o10,000 systems in use worldwide. In the last few years, odigital technologies, most notably the solid state-basedpanel detector technology, have also gained popularity. Fpanel systems currently have a higher initial acquisition crelative to CR. However, they offer potential for better imaquality, lower radiation dose, and higher throughput. Astechnology becomes more widely available and technolocal issues are resolved, it is expected that the cost of thsystems will go down and clinical utilization will furtheincrease.
All flat-panel detectors consist of an x-ray photon absotion layer coupled to a solid-state array recording layer.1 Inthe absorption layer, the energy of the incident x-ray photis converted to either charge, or to visible light that is susequently converted to charge in a photodiode layer. Incommon solid-state layer, amorphous silicon circuits depited on a glass plate form an array of thin-film transistowith associated capacitors that collect the produced cha
608 Med. Phys. 30 „4…, April 2003 0094-2405 Õ2003Õ30„4
fer
ert-t-
st
ei-se
-
s-e
s-se.
Each element of the array is responsible for forming a spaelement of the image~i.e., pixel! recorded by the deviceAfter exposure, the charge stored on the capacitors is rline-by-line and element-by-element via associated gatedata lines that turn on the element transistors consecutivThe charge is then amplified, digitized, and stored for subquent processing and viewing.
There are currently two main types of flat-panel detectodirect and indirect. The main difference between the ttypes is the conversion process. For direct detectors, atoconductive layer, such as amorphous selenium (a-Se),converts the x-ray energy to electronic charges that arerected to the collecting pixel capacitors by an electric field2,3
For indirect detectors, a scintillation phosphor layer convethe energy of x-ray photons to visible light photons that asubsequently detected by the pixel photodiodes and storethe form of electronic charge in the capacitors associawith each pixel.4–6 The phosphor layer may be made frogranular phosphor material, such as Gd2O2S, or phosphormaterials with an oriented structure, such as cesium iod~CsI!.
The relative performance of direct and indirect digital r
608…Õ608Õ15Õ$20.00 © 2003 Am. Assoc. Phys. Med.

609 E. Samei and M. J. Flynn: An experimental comparison of detector performance 609
Medical Physics, Vo
TABLE I. The imaging systems and their characteristics.
ManufacturerDetector
typeDetectormaterial
Nominalthickness
Pixel pitch~size! Array size Imaging area
Direct RadiographyCorp. ~Hologic!DR-1000~DRC!
Direct a-Selenium 0.500 mm 0.139 mm 2560330722 subpanels
35343 cm2
General Electric Co,Revolution XQ/i~XQ/i!
Indirect CsI~Tl! a 0.2 mm 204832048single panel
41341 cm2
Philips MedicalSystems, DigitalDiagnost~DiDi !
Indirect CsI~Tl! 0.500 mm 0.143 mm 3001330014 subpanels
43343 cm2
aNot disclosed.
sert a
o-diee
hrta
e
yice
sly
t
anraretyora
foan
ithTheingctorin-iDi
foreali-es.raw,eto-
etytheap-
eamal
ded
t up
min
s
diographic systems influences their clinical effectiveneTherefore, there is a need to assess and compare the pmance of these systems. The performance of some direcindirect detectors has been previously studied, focusingthe evaluation of single systems.7–10 However, there are significant methodological differences between these stuthat make it difficult to directly compare their results. Thpurpose of this work was to assess the performance of tcommercial, full-sized, direct and indirect flat-panel digiradiographic systems. The characteristics considered wthe modulation transfer function~MTF!, the noise powerspectrum ~NPS!, and the detective quantum efficienc~DQE!. The three systems were evaluated using identmethods so that direct comparisons could be made. Somthe preliminary results of this investigation were previoureported in a conference proceedings.11 This paper reportsthe complete findings of this investigation and supersedesproceedings article.
II. MATERIALS AND METHODS
A. Imaging systems
The physical characteristics of the three systems testedtabulated in Table I. All systems were commercial-grade ahad full-sized recording fields suitable for standard adultdiographic applications. The XQ/i and DiDi systems weinstalled in the Radiology Department at Duke UniversiThe DRC system was installed at the manufacturer’s labtory, but was otherwise evaluated by the same methodsinvestigators. All three systems were FDA approvedclinical use. The systems were tested with configurations
l. 30, No. 4, April 2003
s.for-ndn
s
eelre
alof
he
red-
.a-ndrd
settings identical to those used for clinical procedures wthe exception that the antiscatter grids were removed.DRC system was tested with a carbon-fiber barrier coverthe detector. The XQ/i system was tested with the detebarrier containing the grid removed, but the system stillcluded an ionization chamber and the detector seal. The Dsystem was tested with the detector barrier in place. Beinitiating the measurements, all three systems were cbrated without grid according to manufacturers’ guidelinFor all data acquisitions, the images were transferred asunprocessed data to our research computers via magnoptical disks~MODs! or CD-R media. For the DRC and thXQ/i, the manufacturers verified that only basic uniformiand offset corrections were applied to the raw data. ForDiDi, some additional preprocessing corrections wereplied, as described in the Discussion.
B. X-ray techniques
The systems were evaluated using two standard bqualities, RQA5 and RQA9 described by an InternationElectrotechnical Commission~IEC! standard.12 The IECstandard defines the various RQA techniques by the adfiltration and the half-value-layer~HVL ! of the beam. Foreach of the systems tested, the RQA5 technique was seby placing 21 mm of aluminum~1100 alloy! in the beam.The kVp was then adjusted to obtain an HVL of 7.160.1mm. The RQA9 technique was obtained by placing a 40 maluminum filter in the beam and adjusting the kVp to obtaan HVL of 11.560.1 mm. Table II lists the kVp setting
TABLE II. The standard x-ray beam characteristics used to evaluate detector performance.
Detector TechniqueFiltration~mm Al!
HVL~mm Al! kVp
Intrinsic filtration:1.48 mm Pyrex,3.0 mm Oil, plus
Ideal SNR2,Energy-weighted
(#/mm2 mR)
Ideal SNR2,counting
(#/mm2 mR)Percent
difference
DRC RQA5 21 7.1 74 2.45 mm Al 255,731 262,773 2.7%RQA9 40 11.5 123 257,729 271,197 5.1%
XQ/i RQA5 21 7.1 74 1.90 mm Al 255,855 263,180 2.8%RQA9 40 11.5 120 259,531 272,738 5.0%
DiDi RQA5 21 7.1 78 2.25 mm Al 259,400 267,249 3.0%RQA9 40 11.5 120 259,527 272,687 4.9%

div
ncann
buac
onbeprda
erete
edmaged
Dhre
ys
asurot4.e
icto
ge
ui-y5
fogen
th-
sis
RC
610 E. Samei and M. J. Flynn: An experimental comparison of detector performance 610
required to obtain the desired HVLs. All kVps were verifieto be within 2 kVp of the desired values using a noninvasmethod.
All measurements used x-ray sources with high-frequegenerators, a small focal spot, and a source-to-image dist~SID! greater than 180 cm. There was a minimum of ominute delay between acquisitions to minimize the contrition of any potential lag signal in the acquired data. For eimage acquisition, a calibrated ion-chamber (1035 – 6 ion-ization chamber, 1015 x-ray monitor, Radcal CorporatiMonrovia, CA! was positioned half way between the tuand the receptor. The chamber was positioned so that itjected over the corner of the detector. Care was exerciseassure the entire collection volume of the chamber wwithin the beam. For each acquisition, the exact exposurthe detector was calculated using the inverse square oftive distances and relative signal variations across the detor area@see Sec. II E~h! below#.
C. System response and linearity
Linearity of the systems was verified within the testexposure range. At each beam quality, multiple uniform iages were acquired using different exposures. The averof the pixel values within 80% of the image were computand the results plotted as a function of exposure~Fig. 1!. Allthree systems demonstrated excellent linearity (R2.0.9996!.The pixel values in the DRC and XQ/i systems exhibitedlinear relationship with exposure, while those for the Disystem were proportional to the logarithm of exposure. Trelationships were used to linearize the image data withspect to exposure with zero offset, an important requiremof linear system analysis.
D. Modulation transfer function „MTF…
The presampled modulation transfer functions of the stems were measured using an established edge method.13 Forthis study, a new edge test device was constructed~Fig. 2!.The device consisted of a 535 cm2 square Pt90%– Ir10% foilwith a 0.1 mm thickness and 99.9% purity. The foil wlaminated between two, 1 mm thick slabs of acrylic. All foedges of the laminate were polished to submicron smoness. The edge device had a measured transmission of 4and 33.4% for the RQA9 and the RQA5 techniques, resptively.
For image acquisition, the device was placed perpendlar to the incident x-ray beam at the center of the detecwith a 5–10 degree angle between the detector array andedges of the device. It was verified that moving the eddevice by up to62.5 cm off-center would not affect thmeasured MTF, as independently verified by others.14 Im-ages were then acquired using RQA5 and RQA9 techniq~as described above! with an incident exposure at approxmately 2/3 of the saturation exposure for each imaging stem. The exposures used were 6.2 and 5.9 mR, 6.1 andmR, and 4.4 and 4.0 mR at RQA5 and RQA9 techniquesthe DRC, XQ/i, and DiDi systems, respectively. The imadata were processed to deduce the MTF using a rece
Medical Physics, Vol. 30, No. 4, April 2003
e
yce
e-h
,
o-tostola-c-
-es
aiee-nt
-
h-9%c-
u-r
thee
es
s-.4r
tly
developed MTF analysis program. This program used meods similar to those described in a prior report,13 with onlyminor differences. The major elements of the MTF analyprogram were as follows:
FIG. 1. The relationship between the pixel value and exposure for the D~a!, XQ/i ~b!, and DiDi ~c! systems at the RQA5 and RQA9 techniques.

alas
eth
Idg
on-havin
-
thto
-er
e-
and
mc
ora
he
uredly-5or
wasibedfol-
s,
hem
seir
on
tohethei-
o-
nscy
po-thesur-ce
PS-leftveere.
achbtainPSf them
u
611 E. Samei and M. J. Flynn: An experimental comparison of detector performance 611
~a! ROI extraction : From the linearized image data,central region of interest~ROI! containing the centrapart of a vertical or a horizontal edge transition wextracted.
~b! Angle determination: The exact angle of the edge linin the ROI was determined by a least square fit toedge transition data.
~c! ESF computation: The image data within the ROwere projected along the edge line to obtain the espread function~ESF! relating the pixel value to theperpendicular distance from the edge. In the projectithe data values within62.0 mm of the edge were rebinned into 0.1 pixel spacing. The raw ESF data twere not near the edge were smoothed using a mopolynomial fit ~Savitzky–Golay method!.15
~d! LSF computation: The ESF was differentiated to obtain the line spread function~LSF!. A Hann ~i.e., Han-ning! window function16 with a window width of 4 mmwas then applied to the LSF data in order to reduceinfluence of small differences in the LSF tails andcondition the data for spectral estimation.13
~e! MTF computation : The MTF, in the direction perpendicular to the original edge line, was computed by pforming a fast Fourier transformation~FFT! of the LSFand normalizing its value to unity at zero spatial frquency.
For detectors with multiple subpanels~i.e, DRC andDiDi !, the MTF was measured at the center of each subpseparately, and the results were averaged to obtain thetector’s MTF. The correlation coefficient of the MTFs froany two subpanels was also assessed. The value of therelation coefficient for the DRC system, or the minimum fthe six subpanel pairs for the DiDi system, was indicatedthe maximum variability of MTF among subpanels of tdetector.
FIG. 2. The cross section of the edge test device used for MTF measments.
Medical Physics, Vol. 30, No. 4, April 2003
e
e
,
tg
e
-
ele-
or-
s
E. Noise power spectrum „NPS…
The noise power spectra of the systems were measfrom uniform images using a two-dimensional Fourier anasis method.17 Uniform images were acquired using RQAand RQA9 beam qualities at multiple exposure levels. Feach acquisition, the precise exposure to the detectormeasured using a calibrated ion chamber, as descrabove. The major elements of the NPS analysis were aslows.
~a! ROI definition : The image data, excluding the edgewas divided into;100 ROIs, each 1283128 pixels insize.
~b! Removal of medium-scale nonuniformities: A two-dimensional second-order polynomial was fit to tdata within each ROI and the fit was subtracted frothe data to remove background trends.
~c! Noise conversion: The noise within each ROI waconverted to relative noise by dividing the data by thmean value.
~d! ROI NPS computation: A Hamming filter was appliedto the data followed by a fast Fourier transformati~FFT! to obtain each ROI’s NPS.
~e! Removal of large-scale nonuniformities: The NPSfrom each ROI was scaled by its mean value relativethat of the upper-left reference ROI. In doing so, tinfluence of large-scale nonuniformities, such asheel effect, on the overall resultant NPS was elimnated.
~f! 2D NPS computation: The scaled NPS for all theROIs were averaged to obtain the overall twdimensional NPS.
~g! 1D NPS computation: The one-dimensional~1D! NPSin the horizontal, vertical, and 45° diagonal directiowere obtained by averaging the directional frequenbands in the 2D NPS, central axes65 horizontal, ver-tical, or diagonal lines.
~h! Exposure determination: The effective exposure tothe detector was determined from the measured exsures corrected by the inverse-square law and byaverage signal difference between the image arearounding the ion-chamber and the upper-left referenROI. The exposure reported with the computed Nwas the detector exposure at the reference upperROI of the image. As all ROI NPS were scaled relatito the reference ROI@step~e!#, the computed averagNPS@step~f!# was associated with the proper exposu
For detectors with multiple subpanels~i.e., DRC andDiDi !, the NPS was measured within the central area of esubpanel separately, and the results were averaged to othe detector’s NPS. The correlation coefficient of the Nfrom any two subpanels was also assessed. The value ocorrelation coefficient for the DRC system, or the minimu
re-

teth
et
yThte
andate
ingra
teatha
f tin
dmn
ort
inmu
r
btit.tiaeceTehs
orapheag
p-ionrper-
msh-mtedthe
oseere
ns.astem
lrti-s,FTA9reily
ryIn
tionor-ervelstheter
us-de-for
theat
iseedemical
and
612 E. Samei and M. J. Flynn: An experimental comparison of detector performance 612
for the six subpanel pairs for the DiDi system, was indicaas the maximum variability of noise among subpanels ofdetector.
F. Detective quantum efficiency „DQE…
The detective quantum efficiencies of the systems wdeduced from the measured MTF, the measured NPS,exposure,X, and estimated values for the ideal SNR2 permR, q, as described in previous publications:17,18
DQE~ f !5G3MTF2~ f !
q3X3NPS~ f !. ~1!
In this equation,G is a gain factor that is equal to unitbecause of the data linearity and the NPS normalization.q values were calculated using an x-ray spectrum compuby an x-ray modeling and simulation program~xSpect,Henry Ford Health System!. The program is based onsemiempirical computational model for x-ray simulation aaccounts for various attenuation processes in the imformation.17 For each system, the spectra were first adjusto agree with the HVL measurements by slightly adjustthe assumed intrinsic filtration. The estimated intrinsic filttions associated with each system were then used insimulation program along with the added filtration and msured kVp values to simulate a spectrum incident ondetector. Theq values were estimated by assuming thatideal detector behaves as a perfect energy integrator ox-ray or alternatively as a photon counter as describedprevious publication.18
The calculatedq values for all three systems at RQA5 anRQA9 are reported in Table II. The variation among systeis due to differences in the estimated intrinsic filtrations athe measured kVps used to adjust the beam quality. Fgiven system and a beam quality, the difference betweentwo types ofq values range between 3% to 5%, dependon the kVp. For higher kVp spectra with a more nonsymetrical shape, there is more difference between the resof energy-weighted and countingq values. Based on ouprevious work,17,18 we used an energy-weightedq for theDQE computations. The reported DQEs, however, mayadjusted by the factors tabulated in Table II, if DQE esmates referenced to a ‘‘counting’’ ideal detector are sough19
The DQEs of the systems were computed for 1D spafrequencies in the horizontal, vertical, and diagonal dirtions. The 1D NPS values used for the three directions wderived from the 2D NPS as described above. Since the Mwas experimentally measured only in the horizontal and vtical directions, the diagonal MTF was estimated from tresults for the two axial directions. For the indirect systeman isotropic presampled MTF was assumed20 and the diago-nal MTF estimated as the average of the vertical and hzontal MTFs. For the direct system, since the samplingerture plays a determinant role in defining the MTF, tdiagonal presampled MTF was estimated from the averof axial MTFs using an aperture scaling function,
Medical Physics, Vol. 30, No. 4, April 2003
de
rehe
ed
ged
-he-enhea
sda
heg-lts
e-
l-reFr-e,
i--
e
MTFdiag~ f !5sincp
2 ~p f /& !
sincp~p f !MTFax~ f !, ~2!
where p is the pixel size in mm, andf is the spatial fre-quency in mm21. The numerator represents the Fourier reresentation of the pixel aperture in the diagonal direct~i.e., a triangular sampling function!, and the denominatoterm represents the Fourier representation of the pixel ature in the axial direction~i.e., a square sampling function!.Using this equation, MTFdiag is slightly higher than MTFax
by 0.001, 0.014, and 0.057 at 0.5f N , f N , and 1.5f N , wheref N is the Nyquist frequency.
III. RESULTS
Figure 3 illustrates the MTF results for the three systein the horizontal and vertical directions for the RQA5 tecnique. For comparison, the ‘‘ideal’’ MTFs for each systeare also shown in reference to the best possible MTF dictaby the aperture size of the detector elements. Comparingthree systems, the MTF for the DRC system was very clto the ideal sinc, whereas those for the indirect systems wnotably lower than their corresponding ideal sinc functioIt should be noted that the MTF for the DiDi system wenhanced by preprocessing of raw image data in that sys~see description in Discussion!. The horizontal and verticaMTFs were nearly identical for all three systems. The vecal MTFs were slightly higher than the horizontal onewhich may be attributed to the spatial structures of the Telements. The MTFs were also nearly identical for the RQtechnique~not shown!. Slight technique dependencies weobserved in the 0.1– 1 mm21 frequency range for the XQ/and DiDi systems for which the RQA9 MTFs were slightlower than the RQA5 results~maximum difference50.045 at0.6 mm21). This difference may be attributed to secondaradiation form the edge device at high x-ray energies.detectors that consisted of multiple subpanels, the resolucharacteristics for the subpanels were very similar. The crelation coefficients of the MTFs of the upper and lowsubpanels of the DRC system at various exposure lewere greater than 0.998. The correlation coefficients ofMTFs of the four subpanels of the DiDi system were greathan 0.997.
Figure 4 illustrates the 2D NPS for the three systemsing an RQA5 technique with 1–2 mR exposure. For thetectors with multiple subpanels, the spectrum is showneach subpanel. For the DRC system@Fig. 4~a!#, the NPS wasrelatively uniform across all frequencies. In comparison,two indirect detectors exhibited a sharp drop in the NPShigh frequencies. The XQ/i system exhibited elevated noin the horizontal direction, possibly due to slight structurnoise patterns in that direction. The NPS for the DiDi systshowed marked depression on the horizontal and vertaxes of the 2D spectra due to preprocessing~see Discussion!.Very similar behaviors were observed at other exposuresat RQA9 beam quality.

to image
613 E. Samei and M. J. Flynn: An experimental comparison of detector performance 613
FIG. 3. The measured MTFs for the DRC, XQ/i, and DiDi imaging systems. The increased MTF of the DiDi system at mid frequencies is partly duepreprocessed applied to raw image data in that system.
ner
toe
iD
ti
anmrre
thA
arprdistiaultie
buoeheur
esefre-ab-
er-ctedareer-erheas
rg-s.
msdif-gy,
beal
beef-is
e
edct
Figure 5 illustrates the NPS in the vertical, horizontal, a45° diagonal directions for the three systems at variousposures using the RQA5 and RQA9 techniques. As similaillustrated in Fig. 4, the NPS for the DRC direct detecwere relatively flat and similar to that for white noise. Thindirect systems@Figs. 5~c!, 5~d!, 5~e!, and 5~f!# exhibitedsignificant reduction at high spatial frequencies. For the Dsystem, the NPS decreased with increased exposure at athan the expected rate~,1/exposure!. Additionally, the DiDisystem demonstrated increased noise in the vertical direcat high exposures for frequencies above 2 mm21. The differ-ences in the noise characteristics of subpanels in multipdetectors are illustrated in Fig. 6 by plotting the minimucorrelation coefficient as a function of exposure. Poor colation is evident for the DiDi system at high exposures.
Figure 7 illustrates the axial and the diagonal DQE forXQ/i and DRC systems at three exposures using the RQand RQA9 techniques. The DQEs for the DiDi systemsnot reported as such results were affected by nonlinearprocessing operations applied to the ‘‘raw’’ image data, incated above and discussed in the Discussion. The DRCtem exhibited a nearly inverse-linear relationship with spafrequency for both RQA5 and RQA9 techniques. The resfrom the two subpanels were averaged, since the correlacoefficients of the DQE of the upper and lower subpanwere greater than 0.987. Compared to the DRC, the DQEthe XQ/i system was notably higher at lower frequenciesdropped more rapidly at higher spatial frequencies. For bsystems, the DQE at mid to high spatial frequencies whigher in the diagonal direction than the axial direction. Tdifferences were more notable for the XQ/i system. Furthmore, the DQE of the XQ/i system exhibits some expos
Medical Physics, Vol. 30, No. 4, April 2003
dx-lyr
iless
on
el
-
e5ee--ys-l
tsonlsoft
threer-e
dependency with lower DQEs at higher exposures. For thtwo systems, the magnitudes of the DQEs at near zeroquencies were consistent with expectation based on thesorption efficiencies for the detective materials. The diffence between the RQA5 and RQA9 results was as expein that the higher energy photons of the RQA9 techniqueless efficiently absorbed by the detector material. Furthmore, as thea-Se layer in the DRC system has a lowatomic number than the CsI layer in the XQ/i system, trelative reduction in DQE with increased beam energy wmore substantial for the DRC system.
IV. DISCUSSION
Digital radiography using solid-state detectors is emeing as a viable technology for acquiring digital x-ray imageMany manufacturers now offer medical imaging systebased on this technology. However, there are importantferences in the particular implementations of the technolomost notably in the use of photoconductor-based~i.e., direct!or phosphor-based approaches~i.e., indirect! for x-ray detec-tion. Ultimately, the utility of these approaches shouldexamined by clinical trials. In the absence of clinical triresults, the key physical attributes of these systems canevaluated experimentally and used to predict the clinicalficacy of various implementations of the technology. In thstudy, we have compared the resolution~MTF!, noise~NPS!,and signal-to-noise~DQE! characteristics of one direct-typand two indirect-type digital radiographic systems.
The MTFs determined for the three systems examinindicated that the MTF was notably higher for the dire

fspectra.
614 E. Samei and M. J. Flynn: An experimental comparison of detector performance 614
FIG. 4. The measured 2D NPS for the two subpanels of the DRC system at 1.74 mR~a!, for the XQ/i system at 1.19 mR~b!, and for the four subpanels othe DiDi system at 1.23 mR~c!. The data were acquired with the RQA5 beam quality. A consistent brightness and contrast setting was used for all
thit
esnemnssin
sem
heie
fordi-thee-theor
at a
eas-per-
detector system. Table III compares the MTF results. Fordirect detection DRC detector, the charge is collected wlittle spread and thus good resolution is expected relativthe indirect detection systems where light scattering caublur. The resolution response of the XQ/i system was seebe similar to that of CR systems. The other indirect systtested, the DiDi system, exhibited superior MTF respocompared to XQ/i. However, because of the preprocessteps applied to the raw image data in this system~describedbelow!, the results cannot be considered as a true repretation of the intrinsic resolution characteristics of the syste
Table IV compares the DQE results. In general, higDQE translates into better image SNR or reduced pat
Medical Physics, Vol. 30, No. 4, April 2003
ehtoesto
eg
n-.rnt
dose at comparable SNR. At lower frequencies, the DQEthe indirect XQ/i system was noticeably higher than therect DRC’s due to the good absorption characteristics ofdetection layer. The DQE for this system, however, dcreased more rapidly with frequency compared to that ofDRC. Also notable was the different limiting frequencies fthese two systems, 2.5 mm21 and 3.6 mm21, respectively.The DQE responses in the diagonal direction crossedfrequency of about 2.5 mm21 for RQA5 and at 2.9 mm21
for RQA9 ~Fig. 7!. The corresponding crossover point in thaveraged axial direction for the RQA5 technique w2.3 mm21. The axial DQEs did not cross for RQA9. At frequencies below these crossover points, the XQ/i system

C
615 E. Samei and M. J. Flynn: An experimental comparison of detector performance 615
FIG. 5. The measured NPS in the vertical~—!, horizontal~- - -!, and 45° diagonal~ ! directions with the RQA5 and RQA9 beam qualities for the DRsystem~a! and ~b!, the XQ/i system~c! and ~d!, and the DiDi system~e! and ~f!, respectively.
e
oth
ect,ys-teps
formed better while at frequencies above these crossovthe DRC system was superior.
We are not aware of prior reports on the performancethe DiDi system. Our results were notable with respect to
Medical Physics, Vol. 30, No. 4, April 2003
rs,
fe
differences between the DiDi system and the other indirsystem evaluated~i.e., XQ/i!. Upon a retrospective inquirythe manufacturer indicated the raw image data from that stem were preprocessed. In particular, two preprocessing s

alel
616 E. Samei and M. J. Flynn: An experimental comparison of detector performance 616
FIG. 6. The correlation coefficient of one-dimensionNPS estimates from multiple subpanels of multipandetectors evaluated.
itedext
s,pli-ndbeop-ata,
are applied to all raw images from that system:~a! Anunsharp-mask filter is applied to the linearly scaled data wa kernel size of 333 pixels. The enhancement factor appliincreases from 0 to 1.5 linearly with exposure up to anposure of 0.277 mR, beyond which the factor is constan1.5. ~b! Destriping filters are applied with kernels of 8139
Medical Physics, Vol. 30, No. 4, April 2003
h
-at
and 9381 pixels in the horizontal and vertical directionpresumably to reduce the detector structured noise. Amtudes of these filters change nonlinearly with signal level avariance. Ideally, the performance of this system shouldevaluated using image data prior to these preprocessingerations. However, in the absence of access to such d
al
FIG. 7. The DQE at RQA5 and RQA9 beam qualities for the DRC system in the diagonal~a! and axial~b! directions, and for the XQ/i system in the diagon~c! and axial~d! directions.
ali-
aidarthn-thS
anthte
in2
PSthisheof
theo
ove
ndgo-tionter-hethea
tionre-di-f
ialf
oren. 8,PS
-t
ic
a
617 E. Samei and M. J. Flynn: An experimental comparison of detector performance 617
carefully performed image quality assessments can be v9
if viewed in light of the particular characteristics of the image preprocessing.
For the DiDi system, the MTF data were acquired atexposure level at which the detector exposure at both sof the edge fell within the region where the applied unshmask filtering coefficients were constant. Thus, as far asfiltering operation, the MTF analysis did not violate the liearity requirement for a linear system analysis. However,destriping filters still applied. Furthermore, for the NPevaluations, the exposures were also beyond the constthreshold of the unsharp mask filtering. Thus, as far asfiltering process is concerned, the MTF and NPS are affecsimilarly, and the DQE remains unaffected. The destripfilters clearly impact the NPS results on the axes of the
TABLE III. The MTF results~obtained from the RQA5 and RQA9 techniques! are summarized by tabulating the average of the response inhorizontal and vertical directions. For comparison, the results for a typCR system are also shown.
MTF DRC XQ/i DiDia CRb
0.2 5.6 mm21 2.6 mm21 3.7 mm21 2.4 mm21
0.1 6.2 mm21 3.5 mm21 4.5 mm21 3.4 mm21
aReported values include the effects of preprocessing applied to raw imdata from this system.
bFuji, FCR-9501-HQ, ST-Va, 0.1 mm pixel, from Samei and Flynn~Ref.18!.
Medical Physics, Vol. 30, No. 4, April 2003
d
nespis
e
cyisd
gD
NPS. This effect can be minimized by extracting the 1D Nfrom a diagonal band through the 2D NPS, as done forreport. However, the MTF is still affected, thus impacting tresulting DQE. Thus, this study does not report the DQEthe DiDi system. Furthermore, any direct comparison ofMTF and NPS of this system with those from the other twsystems may only be made taking into account the abpreprocessing operations.
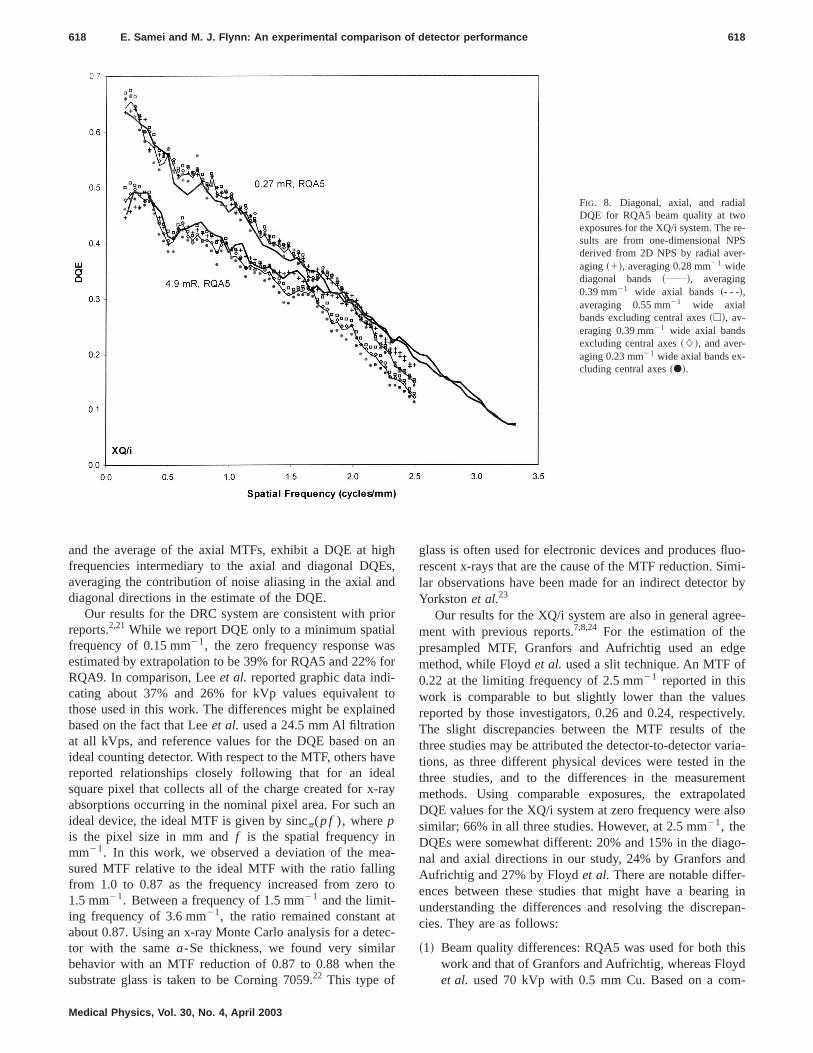
In this study, for the first time, we examined the noise aDQE performance of radiographic systems in the 45° dianal direction. The diagonal response enables the examinaof a system’s response beyond the cutoff frequency demined by the pixel spacing in the axial direction while at tsame time reduces the contribution of noise aliasing toDQE estimate. This is illustrated in Fig. 5, which showsdecreased NPS at high frequencies for the diagonal direcrelative to the axial directions. Figure 8 illustrates the corsponding increase in the DQE at high frequencies in theagonal direction ~0.049 at the Nyquist frequency o2.5 mm21 for RQA5, 0.27 mR! for the XQ/i system. Similarexamination of the DRC system response@Figs. 7~a! and7~b!# reveals a relatively smaller difference between the axand diagonal DQEs~0.011 at the Nyquist frequency o3.6 mm21 for RQA5, 0.38 mR!. As is seen for the NPSresults~Fig. 5!, the wide bandwidth of the noise spectrum fthis system results in similar aliasing in all directions whsampled by the square pixel aperture. Also shown in Figradial DQE, calculated from the radically averaged 2D N
heal
ge
tector
TABLE IV. The DQE at specific spatial frequencies for the RQA5 and RQA9 at approximately 0.3 mR deexposure. For comparison, the results for a typical CR system are also shown.Frequency (mm21)
DRC XQ/iCRa
70 kVp, 19 mm AlRQA5 technique
Diagonal Axial Diagonal Axial Axial
0.15 0.38 0.38 0.64 0.64 0.300.5 0.36 0.36 0.58 0.58 0.261.0 0.32 0.32 0.47 0.47 0.201.5 0.27 0.27 0.37 0.37 0.152.0 0.23 0.23 0.30 0.30 0.102.5 0.20 0.20 0.20 0.15 0.073.0 0.17 0.15 0.12 0.043.5 0.13 0.12 0.024.0 0.10 0.024.5 0.08 0.01
RQA9 technique 115 kVp, 19 mm Al
Diagonal Axial Diagonal Axial Axial
0.15 0.22 0.22 0.45 0.45 0.230.5 0.21 0.21 0.35 0.35 0.191.0 0.18 0.18 0.31 0.31 0.151.5 0.16 0.16 0.29 0.29 0.122.0 0.13 0.13 0.22 0.22 0.082.5 0.11 0.11 0.15 0.12 0.053.0 0.09 0.08 0.09 0.033.5 0.07 0.06 0.024.0 0.06 0.014.5 0.05 0.01
aFuji, FCR-9501-HQ, ST-Va, 0.1 mm pixel, from Samei and Flynn~Ref. 18!.
l
-S-
618 E. Samei and M. J. Flynn: An experimental comparison of detector performance 618
FIG. 8. Diagonal, axial, and radiaDQE for RQA5 beam quality at twoexposures for the XQ/i system. The results are from one-dimensional NPderived from 2D NPS by radial averaging~1!, averaging 0.28 mm21 widediagonal bands ~ !, averaging0.39 mm21 wide axial bands~- - -!,averaging 0.55 mm21 wide axialbands excluding central axes~h!, av-eraging 0.39 mm21 wide axial bandsexcluding central axes~L!, and aver-aging 0.23 mm21 wide axial bands ex-cluding central axes~d!.
igEn
iol
asfo-toe
aavaraa
ag
t
tecr
he
uo-imi-r by
ee-
gef
esely.theria-theent
atedlso
go-nd
g inan-
isyd
-
and the average of the axial MTFs, exhibit a DQE at hfrequencies intermediary to the axial and diagonal DQaveraging the contribution of noise aliasing in the axial adiagonal directions in the estimate of the DQE.
Our results for the DRC system are consistent with prreports.2,21 While we report DQE only to a minimum spatiafrequency of 0.15 mm21, the zero frequency response westimated by extrapolation to be 39% for RQA5 and 22%RQA9. In comparison, Leeet al. reported graphic data indicating about 37% and 26% for kVp values equivalentthose used in this work. The differences might be explainbased on the fact that Leeet al. used a 24.5 mm Al filtrationat all kVps, and reference values for the DQE based onideal counting detector. With respect to the MTF, others hreported relationships closely following that for an idesquare pixel that collects all of the charge created for x-absorptions occurring in the nominal pixel area. For suchideal device, the ideal MTF is given by sincp(p f ), wherepis the pixel size in mm andf is the spatial frequency inmm21. In this work, we observed a deviation of the mesured MTF relative to the ideal MTF with the ratio fallinfrom 1.0 to 0.87 as the frequency increased from zero1.5 mm21. Between a frequency of 1.5 mm21 and the limit-ing frequency of 3.6 mm21, the ratio remained constant aabout 0.87. Using an x-ray Monte Carlo analysis for a dettor with the samea-Se thickness, we found very similabehavior with an MTF reduction of 0.87 to 0.88 when tsubstrate glass is taken to be Corning 7059.22 This type of
Medical Physics, Vol. 30, No. 4, April 2003
hs,d
r
r
d
nelyn
-
o
-
glass is often used for electronic devices and produces flrescent x-rays that are the cause of the MTF reduction. Slar observations have been made for an indirect detectoYorkstonet al.23
Our results for the XQ/i system are also in general agrment with previous reports.7,8,24 For the estimation of thepresampled MTF, Granfors and Aufrichtig used an edmethod, while Floydet al. used a slit technique. An MTF o0.22 at the limiting frequency of 2.5 mm21 reported in thiswork is comparable to but slightly lower than the valureported by those investigators, 0.26 and 0.24, respectivThe slight discrepancies between the MTF results ofthree studies may be attributed the detector-to-detector vations, as three different physical devices were tested inthree studies, and to the differences in the measuremmethods. Using comparable exposures, the extrapolDQE values for the XQ/i system at zero frequency were asimilar; 66% in all three studies. However, at 2.5 mm21, theDQEs were somewhat different: 20% and 15% in the dianal and axial directions in our study, 24% by Granfors aAufrichtig and 27% by Floydet al. There are notable differ-ences between these studies that might have a bearinunderstanding the differences and resolving the discrepcies. They are as follows:
~1! Beam quality differences: RQA5 was used for both thwork and that of Granfors and Aufrichtig, whereas Floet al. used 70 kVp with 0.5 mm Cu. Based on a com

mu.h
phtha
,heth
t
a
ng
tige
,ly,onrsb
in
re
ay0%e-er
prula
ds
e,a
reshea
eroi
n-to
ral,hatde-the
alia-up
s inora-s-m-ots ofs ofbe
eth-
bestand
inicalm-aryndtednta-theduc-
ayt at
se-tedl for
emitedredeiDi
tingtheis
andver-mic
619 E. Samei and M. J. Flynn: An experimental comparison of detector performance 619
puter simulation by xSpect, assuming a nominal 500cron thickness of CsI, the DQE for a 70kVp/0.5 mm Cbeam is;3% higher than that for a 74 kVp/RQA5 beam
~2! Counting versus energy integrating ideal detectors: Tprevious two studies assumed the ideal detector as aton counting detector whereas this study assumedideal detector as an energy integrating detector. Therethus differences in the ideal SNR2 used in the studiesnot all of which can be explained by differences in tdefinition of the ideal detector. The values used forideal SNR2 per mR were 280 000 mm22 mR21 in Gran-fors and Aufrichtig, 271 500 mm22 mR21 in Floydet al., and 255 855 mm22 mR21 in this study. This dif-ference increases our RQA5 DQEs by 9.4% relativeGranfors’ DQE. For the Floydet al. results, the use of aslightly different technique also influences the ideSNR2. Assuming a nominal intrinsic filtration of 2.6 mmAl, a simulation by xSpect predicts an ideal countiSNR2/mR of 250 970 mm22 mR21 for a 70 kVp/0.5 mmCu as opposed to 271 500 used by Floydet al. ~4.9%difference! or 263 180 predicted for RQA5~see Table II!.
~3! Detector secondary layers: Granfors and Aufrichevaluated a detector with no secondary barriers excfor a protective seal. The system tested by Floydet al.included the detector cover plate~;9.0% and;5.1%attenuation at RQA5 and RQA9, respectively! and anautomatic exposure control~AEC! ionization chamber~;2.8% and;1.3% attenuation at RQA5 and RQA9respectively!. Our system included the AEC assembbut not the cover plate. Accounting for the attenuatilayer will increase our DQEs with respect to Granfoby 2.8% and decrease them with respect to Floyd’s9.0% at all frequencies. Similarly, the Floydet al. resultsshould be increased by 12% to be compared agaGranfors’.
~4! MTF differences: The slight differences in the measuMTFs, especially at high spatial frequencies, havesquared effect on the resultant DQE. Compared to Grfors’, the 0.04 MTF difference at the Nyquist frequencwhere we measured an MTF of 0.22, translates to 4difference in DQE. Compared to Floyds’, the corrsponding 0.02 MTF difference translates to 19% diffence in DQE. Floydet al. also used expectation MTF~EMTF! for the DQE assessment as opposed to thesampled MTF in the other two studies. That alone wohave a direct effect in increasing their reported DQEhigh spatial frequencies, approaching 67% at 2.5 mm21.
~5! 2D NPS to 1D NPS transformation: Different methohave been used to extract a 1D NPS from the 2D NPSorder to estimate the DQE. Granfors and Aufrichtig usradial averaging, Floydet al. used axial-band averagingwhile this study used the axial as well as a new diagonband averaging method. At low frequencies, the thmethods generate equivalent NPS and thus DQE, alustrated in Fig. 8. However, at high frequencies, tDQE is highest for the diagonal method followed by thof the radial method and the axial method. The diffence can be explained on the basis of reduced n
Medical Physics, Vol. 30, No. 4, April 2003
i-
eo-ere
e
o
l
pt
’y
st
dan-,
-
e-dt
ind
l-eil-
t-se
aliasing in the off-axes directions. Figure 8 also demostrates how the width of the frequency band averagedobtain the 1D NPS affects the resulting DQE. In genethe DQE is higher for wider bands and for the bands texclude the central axial axes. For the XQ/i system,pending on the exact method to deduce the 1D NPS,resulting DQE can vary by up to 0.05~8%! and 0.07~48%! at low and high frequencies.
~6! Dosimeter calibration: All methods estimated the ideSNR2 by experimentally measuring the exposure. Vartions in the response of different dosimeter devices ofto 5% must always be recognized.
The above comparisons demonstrate the complexitiecomparing performance measurements from different labtories that might use slightly different methodologies to asess the DQE of digital radiographic systems. Direct coparison of values from different studies is thus nstraightforward and should take into account the nuancethe assessment methodologies. Most valid comparisonthe performance of digital radiographic system may onlymade by investigations in which identical assessment mods are applied.
Amongst the three systems, certain differences areunderstood by considering the product of the exposurethe NPS determined in the diagonal direction as shownFig. 9. For systems whose noise is due only to statistfluctuations associated with the detection of a limited nuber of quanta, the exposure normalized NPS curves vlittle as a function of exposure, as seen for the DRC aXQ/i systems. The results for the DiDi system demonstrasignificant change with exposure due to added instrumetion noise and applied preprocessing filters. Generally,relative noise increased with exposure. This causes a retion in DQE with increasing exposure~not shown!. However,it should be pointed out that the DQE at high exposures mhave a relatively less clinical importance compared to thalower exposures in that the noise equivalent quanta~NEQ! ishigh enough so that the additional noise may be inconquential. Furthermore, for this particular system, the tesexposure levels were beyond the targeted exposure levethe system~0.285 mR, 2.5 uGy, 400 speed!. At low expo-sures, where the instrumentation noise for the DiDi systwas not noticeable, the exposure-normalized NPS exhibrelative elevation at intermediate frequencies when compato the XQ/i system. This is likely due to the effects of thenhancement filter that also increases the MTF of the Drelative to the XQ/i~see Fig. 3!.
For this study, we used a new edge device for evaluathe MTF. Compared to our previous edge test device,new device is thinner which makes it easier to align, andmade of a more rigid material~i.e., Pt–Ir alloy! which makesit more durable. The overall shape of the device is squareall four edges have been polished so that horizontal andtical MTF can be estimated from one exposure. The atonumber of this device (Z5;78) is lower than that for thelead edge that we have previously used (Z582)13 with a

PSd
-m
620 E. Samei and M. J. Flynn: An experimental comparison of detector performance 620
FIG. 9. The measured product of exposure and the Nin the 45° diagonal direction for the DRC, XQ/i, anDiDi systems at a low exposure level~—! ~0.38, 0.27,and 0.26 mR, respectively!, medium exposure level~–!~1.74, 1.19, and 1.23 mR, respectively!, and high expo-sure level~ ! ~6.88, 4.9, and 5.16 mR, respectively!. The data were acquired with the RQA5 beaquality.
ntthrvbuga-nedic
etry,oft-s,
ticsrsfer-nic
correspondingly lowerk-electron binding energy~78.4 com-pared to 88.0 keV!. For the RQA5 technique, no fluoresceradiation is emitted from either of the edge devices. ForRQA9 technique using either edge device, we have obselow frequency variations in the acquired signal that maydue to fluorescent radiation emitted by the test device. Fther work is required to identify a geometry and an edmaterial that will minimize the influence of fluorescent rdiation on the measured edge spread function at high egies. Additionally, in this work, new software was employto deduce the MTF from the image of the edge test dev
Medical Physics, Vol. 30, No. 4, April 2003
eeder-e
er-
e.
Using the same system and the same measurement geomwe have verified that the new test device and the new sware provide results comparable to our previous method13
as illustrated in Fig. 10.
V. CONCLUSIONS
A comparison of the physical performance characterisof a direct and two indirect digital radiography detectodemonstrated differences that were consistent with the difent methods used to convert absorbed x-ray to electro
deisd
FIG. 10. The comparison of MTF measurements mawith previous and new version of the MTF analysalgorithm~lines 1 and 2!, and between the previous annew edge test device~lines 1 and 3!. The results arenearly identical withR2.0.9997.

rs-ioth
tioiscighaor
helo
efooi
ro
momesucawha
xuan
laulig
thyd
ditivli-see
IIs-olo
an-or
a-
dg
Z.e-
or,’’
J.a-at-
R.-g-
,G.-
ca-
H.ticsy,’’
iveim-
g,n-
of
s
hede-
a
ry,
so-ys.
tor
for
ur,sfer
lu-gy
621 E. Samei and M. J. Flynn: An experimental comparison of detector performance 621
charge. The MTF of the direct detection system diffeslightly from the ideal function due to the effects of fluorecent radiation transport in the device. The indirect detectsystems demonstrate a reduction in MTF consistent withexpected light spread within the device. The direct detecsystem has a flat noise power spectrum indicating little nocorrelation from one pixel to another. The indirect detetion systems demonstrate diminished noise power at hspatial frequencies consistent with the effects of ligspread. The DQE for the direct system demonstrates a nelinear decrease with frequency. In comparison, the DQEthe indirect detection systems is seen to decrease moreidly at high frequencies. Overall, the high absorption of tindirect detection system provides better performance bea spatial frequency of approximately 2.5 mm21, while thenegligible blur, smaller Lubbert’s effect, and the small pixsize of the direct detection system provides better permance above that frequency. The DQE and the overall cclusions above cannot be readily drawn from the seconddirect system tested~the Philips Digital Diagnost System!due to the preprocessing applied to the raw image data fthat system.
The actual clinical performance of the various systedepends on many factors other than DQE, including theerating exposure ranges for the acquisition of clinical iages, detector sensitivity to scattered radiation, the usantiscatter grids, and image processing. Nevertheless, asing similar patient exposures, some general implicationsbe drawn from the comparison of the results on the tparticular direct and indirect digital radiography systems twere tested in this study~i.e., DRC and XQ/i!. The highMTF and superior DQE of the direct system above appromately 2.5 mm21 suggest that this system may be particlarly effective in radiographic applications where fine antomic structures need to be imaged with high detail acontrast. Utilization of this system for imaging trabecubone structures in skeletal extremities, for example, wothus be indicated. On the other hand, the extremely hDQE of the indirect system at frequencies below 2.5 mm21
makes it attractive in radiographic applications wherevisibility of low contrast anatomic structures is limited bnoise. Utilization of these systems for imaging of lung noules in thoracic imaging, for example, would thus be incated. Notwithstanding these conclusions are the relasignificance of high and low frequencies for particular cnical tasks, and clinical implications of signal and noialiasing in the direct systems, both of which await furthinvestigations.
ACKNOWLEDGMENTS
The authors gratefully acknowledge James T. Dobbinand Harrell G. Chotas of Duke University for helpful dicussions and valuable contributions to this study. The authalso wish to thank Ulrich Neitzel of Phillips MedicaSystems, Denny Lee, Brian Rodrick, and Greg Powell
Medical Physics, Vol. 30, No. 4, April 2003
s
nene-htrlyf
ap-
w
lr-n-n-
m
sp--ofm-n
ot
i---drdh
e
--e
r
I
rs
f
Direct Radiography Corp., and Carson Thomas, Paul Grfors, Ken Kump, Scott Schubert, and Ping Xue of GE ftheir assistance with this study.
a!Electronic mail: [email protected]. J. Yaffee and J. A. Rowlands, ‘‘X-ray detectors for digital radiogrphy,’’ Phys. Med. Biol.42, 1–39~1997!.
2D. L. Lee, L. K. Cheung, B. G. Rodricks, and G. F. Powell, ‘‘Improveimaging performance of a 14317-inch digital radiography system usinSe/TFT detector,’’ Proc. SPIE3336, 14–23~1998!.
3W. Zhao, I. Blevis, S. Germann, J. A. Rowlands, D. Waechter, andHuang, ‘‘Digital radiology using active matrix readout of amorphous slenium: Construction and evaluation of a prototype real-time detectMed. Phys.24, 1834–1843~1997!.
4J. H. Siewerdsen, L. E. Antonuk, Y. El-Mohri, J. Yorkston, W. Huang,M. Boudry, and I. A. Cunningham, ‘‘Empirical and theoretical investigtion of the noise performance of indirect detection, active matrix flpanel imagers~AMFPIs! for diagnostic radiology,’’ Med. Phys.24,71–89~1997!.
5C. Chaussat, J. Chabbal, T. Ducourant, V. Spinnler, G. Vieux, andNeyret, ‘‘New CsI/a-Si 1793179 x-ray flat-panel detector provides superior detectivity and immediate direct digital output for general radioraphy systems,’’ Proc. SPIE3336, 45–56~1998!.
6R. E. Colbeth, V. N. Cooper, D. L. Gilblom, R. A. Harris, I. D. JobM. E. Klausmeier-Brown, M. Marc, J. M. Pavkovich, E. J. Seppi, E.Shapiro, M. D. Wright, and J. M. Yu, ‘‘Characterization of a thirdgeneration multimode sensor panel,’’ Proc. SPIE3659, 491–500~1999!.
7P. R. Granfors and R. Aufrichtig, ‘‘Performance of a 41 cm341 cm amor-phous silicon flat panel x-ray detector for radiographic imaging applitions,’’ Med. Phys.27, 1324–1331~2000!.
8C. E. Floyd, Jr., R. J. Warp, J. T. Dobbins III, H. G. Chotas, A.Baydush, R. Vargas-Voracek, and C. E. Ravin, ‘‘Imaging characterisof an amorphous silicon flat-panel detector for digital chest radiographRadiology218, 683–688~2001!.
9J. H. Launders, S. M. Kengyelics, and A. R. Cowen, ‘‘A comprehensphysical image quality evaluation of a selenium based digital x-rayaging system for thorax radiography,’’ Med. Phys.25, 986–997~1998!.
10E. L. Gingold, D. L. Lee, L. S. Jeromin, B. G. Rodricks, M. G. Hoffberand C.L. Williams, ‘‘Development of a novel high-resolution direct coversion x-ray detector,’’ Proc. SPIE3977, 185–193~2000!.
11E. Samei, M. J. Flynn, H. G. Chotas, and J. T. Dobbins III, ‘‘DQEdirect and indirect digital radiographic systems,’’ Proc. SPIE4320, 189–197 ~2001!.
12IEC 1267,Medical Diagnostic X-ray Equipment—Radiation Conditionfor Use in the Determination of Characteristics, 1st ed.~IEC, Geneva,Switzerland, 1994!.
13E. Samei, M. J. Flynn, and D. A. Reimann, ‘‘A method for measuring tpresampled MTF of digital radiographic systems using an edge testvice,’’ Med. Phys.25, 102–113~1998!.
14K. A. Fetterly and N. J. Hangiandreou, ‘‘Image quality evaluation ofdesktop computed radiography system,’’ Med. Phys.27, 2669–2679~2000!.
15W. H. Press, S. A. Teukolsky, W. T. Vetterling, and B. P. FlanneNumerical Recipes in C, The Art of Scientific Computing, 2nd ed.~Cambridge University Press, Cambridge, 1992!, pp. 650–655.
16W. K. Pratt,Digital Image Processing~Wiley, New York, 1991!.17M. J. Flynn and E. Samei, ‘‘Experimental comparison of noise and re
lution for 2k and 4k storage phosphor radiography systems,’’ Med. Ph26, 1612–1623~1999!.
18E. Samei and M. J. Flynn, ‘‘An experimental comparison of detecperformance for computed radiography systems,’’ Med. Phys.29, 447–459 ~2002!.
19D. Hoeschen, ‘‘DQE of digital x-ray imaging systems: a challengestandardization,’’ Proc. SPIE4320, 280–286~2001!.
20K. A. Fetterly, N. J. Hangiandreou, B. A. Schueler, and E. R. Riteno‘‘Measurement of the presampled two-dimensional modulation tranfunction of digital imaging systems,’’ Med. Phys.29, 913–921~2002!.
21S. M. Kengyelics, A. R. Cowen, and A. G. Davies, ‘‘Image quality evaation of a direct digital radiography detector operating in a UK radiolodepartment,’’ Proc. SPIE3659, 24–35~1999!.

ia-PI
.ed
ment
622 E. Samei and M. J. Flynn: An experimental comparison of detector performance 622
22M. J. Flynn, S. Wilderman, and J. Kanicki, ‘‘Effect of secondary radtions on the performance of digital radiographic detectors,’’ Proc. S3336, 326–336~1998!.
23J. Yorkston, L. E. Antonuk, Y. El-Mohri, K. -W. Jee, W. Huang, MMaolinbay, X. Rong, J. H. Siewerdsen, and D. P. Truernicht, ‘‘Improv
Medical Physics, Vol. 30, No. 4, April 2003
Espatial resolution in flat panel imaging systems,’’ Proc. SPIE3336, 556–563 ~1998!.
24P. R. Granfors and R. Aufrichtig, ‘‘DQE~f! of an amorphous-silicon flat-panel x-ray detector: detector parameter influences and measuremethodology,’’ Proc. SPIE3977, 2–13~2000!.


![SPring-8€¦ · Web view(270 word limit) [PAGE 5: Experimental Details] 9. Experimental details (sketch of setup, measurement method, detector, concentration of samples, etc.)](https://img.dokumen.tips/doc/110x75/5f455901f18c24600051b99a/spring-8-web-view-270-word-limit-page-5-experimental-details-9-experimental.jpg)