Embed Size (px)
Citation preview

Available online at www.CivileJournal.org
Civil Engineering Journal
Vol. 2, No. 1, January, 2016
23
An Experimental and Numerical Comparison of Flow
Hydraulic Parameters in Circular Crested Weir Using Flow3D
Farhad Ghazizadeha*
, M. Azhdary Moghaddamb
a MSc. Civil Engineering Department, University of Sistan and Baluchestan, Zahedan, Iran
bAssistant Professor, Civil Engineering Department, University of Sistan and Baluchestan, Zahedan, Iran
Received 2 January 2016; Accepted 7 February 2016
Abstract
Circular crested weirs consist of a circular crested of upstream and downstream walls. These weirs are widely used in
hydraulic engineering as water discharge structures and can be used to control water level in channels and tanks. In the
present study, using Flow3D software, hydraulic properties were investigated to find weir geometry optimization through
CFD method. Also, this study attempted to investigate flow on some sections of circular crested weirs in 3 groups and 11
models. Upstream and downstream slope changes as well as the height of the weir were also studied. To validate the
model, laboratory models were used. In the research, flow depth parameters on crest, pressure distribution, velocity
distribution, energy loss on circular crested weirs, as well as the height and changes of upstream and downstream slope
were evaluated. Flow depth on the body of circular crest in this state is about 0.71 (H1). Upstream slope changes on flow
depth on the weir’s crest revealed that increasing upstream slope causes to the increase of flow relative depth (H1/R) on
the crest about 62%. Downstream changes in H1/R values less than 0.7 have no significant effect on discharge
coefficient; however, increasing H1/R values seems to cause more change in slope.
Keywords: Circular Crested Weirs, Flow3D, CFD, Upstream Slope of Weir, Downstream Slope of Weir.
1. Introduction
At the late 19th century and at the beginning of the 20th century, cylinder weirs (circular crested weir without
upstream and downstream slopes) were common before ogee spillways. During the 19th century, the attempt to
improve the capacity of weirs’ discharge capacity leads to designing circular crested weirs. In water distribution
systems, due to their affordability and easy construction compared to other weirs, circular crested weirs can be used to
measure the intensity of flow as well as water discharge structures in channels and tanks. The simplest type of circular
crested weirs is includes a circular crest with the radius of R and upstream and downstream walls. These walls are
tangentially installed on the surface of the crest. This set is vertically placed at the path of flow [1 and 2]. Figure 1
shows a circular crested weir with geometrical parameters and hydraulic parameters. Hydraulic parameters include
depth on crest’ maximum point (Y2), total water load at upstream of crest surface (H1), water depth at upstream (Y1)
and geometrical parameters entail weir crest radius, upstream and downstream walls’ slope (α, β) [3].
According to the studies performed by Bazin, during the 19th century, advancement was performed to improve
discharge capacity of these weirs which finally led to designing circular crested weirs [4]. Kreeger (1917) developed
Bazin’s studies to identify ogee weir profile. He also performed some experiments about circular crested weir profile
which was later used in designing France’s Burgundy Dam [5]. Sarginson (1972) investigated the effect of surface
tension on discharge coefficient of circular crested weirs. He used models with ventilation, water and Lissapol N
liquid with 0.034 < 𝜎 < 0.059 N/m (𝜎= surface tension) and crest’s radius of 0.0068-0.00315 m. in the interval of
2<H1/R < 4, he presented a relation to determine discharge coefficient [6].
* Corresponding author: [email protected]

Civil Engineering Journal Vol. 2, No. 1, January, 2016
24
Figure 1. A circular crested weir and cylinder weir with geometrical parameters and hydraulic parameters
Bos (1978) used available data and obtained the relation between discharge coefficient and H1/𝑅 in circular crested
weirs with downstream slope of β=45 and vertical upstream slope. In his study, discharge coefficient was increased
from 0.64 in H1/𝑅 = 0.5 to 1.48 in H1/𝑅 = 5.5 and for higher values of H1/𝑅 , discharge coefficient remained
constant. Further, se investigated the way of pressure changes on circular crested weirs in β conditions equaled 45°
and (H1/𝑅 ) <1 and presented a relation between relative static pressure on crest surfaces of (P/γH1) and the ration of
H1/𝑅 [7]. Ramamurthy and Ramamurthy AS and Vo ND (1993) studied the effect of suction and aeration of water
falling blade on circular crested weir. They focused on the performance of Dressler’s theory in circular crested weir
and compared the obtained discharge coefficient with laboratory information. Dressler’s studies can be accepted as a
relation for curve-shape flow of circular crested weir [8]. Chanson and Montes (1998) analyzed the effect of upstream
slope on flow characteristics on circular crested weir. The findings revealed that in a constant load, circular crested
weirs have a higher discharge capacity compared to broad crested and sharp edge weirs. They proposed the following
equation to compute circular crested weir’s discharge coefficient for flow conditions developed in upstream weir [9]:
Cd = 1.185(H
R)0.136 0.45<
H
R< 1.9 (1)
Where Hw indicates total load over weir’s crest and R indicates the radius of weir’s crest.
Liu, Huhe and Wenju (2002) modeled circular crested weirs in the two dimensional form. They considered
computations interval 2.2 times more than the diameter of weir and 50 times more than the diameter of weir. For
numerical modeling, they used control volume method and for multi-fuzzy flow simulation, they employed fluid
volume method as well as geometrical reconstruction model and reported a good consistency between the numerical
results and physical model [10]. Dargahi (2006) simulated ogee weir in the 3D form through CFD model and
compared the results with physical model. He employed k-Ɛ standard model and RNG for simulation [11]. In their
studies, Heidarpour et al. (2005) investigated pressure changes on laboratory weir’s crest using some circular crested
weirs. The models were put into a glass channel with the length of 7m, width of 0.32 m and the height of 0.35. This
channel was fed with a pump with the maximum discharge of 11.5 lit/s. The results obtained from laboratory analyses
revealed that pressure correction coefficient (pressure measured to hydrostatic pressure) was increased by increasing
upstream slope but it was not changed by increasing downstream slope [12].
In their studies on circular crested weirs, Bina and Beigipour (2005) reported that submergence coefficient of KS in
these weirs only depends on weir’s submergence percentage and increasing submergence percentage of (H2/H1) leads
to the decrease of KS coefficient. Moreover, increasing upstream and downstream slope in these weirs also leads to a
slight increase in submergence coefficient. Changing the radius and height of weir had no effect on discharge
coefficient [13]. Heidarpour et al. (2008) studied pressure distribution on cylinder and circular crested weirs with
various heights. In this research, modeling were performed at various heights of 0, 12.5, 15.7, 18.7 and 𝛽 = 𝛼 = 90. The obtained laboratory analyses revealed that for cylinder and circular crested weirs, increasing load on the weir
caused to exiting pressure distribution from hydrostatic state. Additionally, the height of weir had no significant effect
on pressure distribution; and by changing the height of weir, pressure distribution remained hydrostatic [14].
2. Geometrical Simulating Circular Crested Weir for Modelling Flow Numerical and
Determining Various Hydraulic Parameters
To model the hydraulic model of circular crested weirs in Flow3D Software, total solid body of the weir with flow
channel was constructed in 3D using geometrical software like AutoCAD, CATIA, Solidworks, etc. given to the
appropriate facilities of Solidworks 2011; it is used in the present study. In this study, 11 models of circular crested
weirs with various geometrical characteristics have been selected for 3D study of field flow simulation. Generally,
geometrical characteristics in plan and cutting of circular crested weir are as following. To construct geometrical
model of circular crested weirs, two separate parts of channel and weir were considered. Simulating geometrical
conditions of flow channel in which various models of circular crested weirs are placed have been shown in Figure 2.
Civil Engineering Journal Vol. 2, No. 1, January, 2016
25
Figure 2. Simulating laboratory channel using Solidworks Software 2011
After simulating the channel, various circular crested samples were constructed in D, E and F groups and placed in the
channel. Various groups have been shown in Table 1. as shown in the table, geometrical characteristics of circular
crested weirs have been presented.
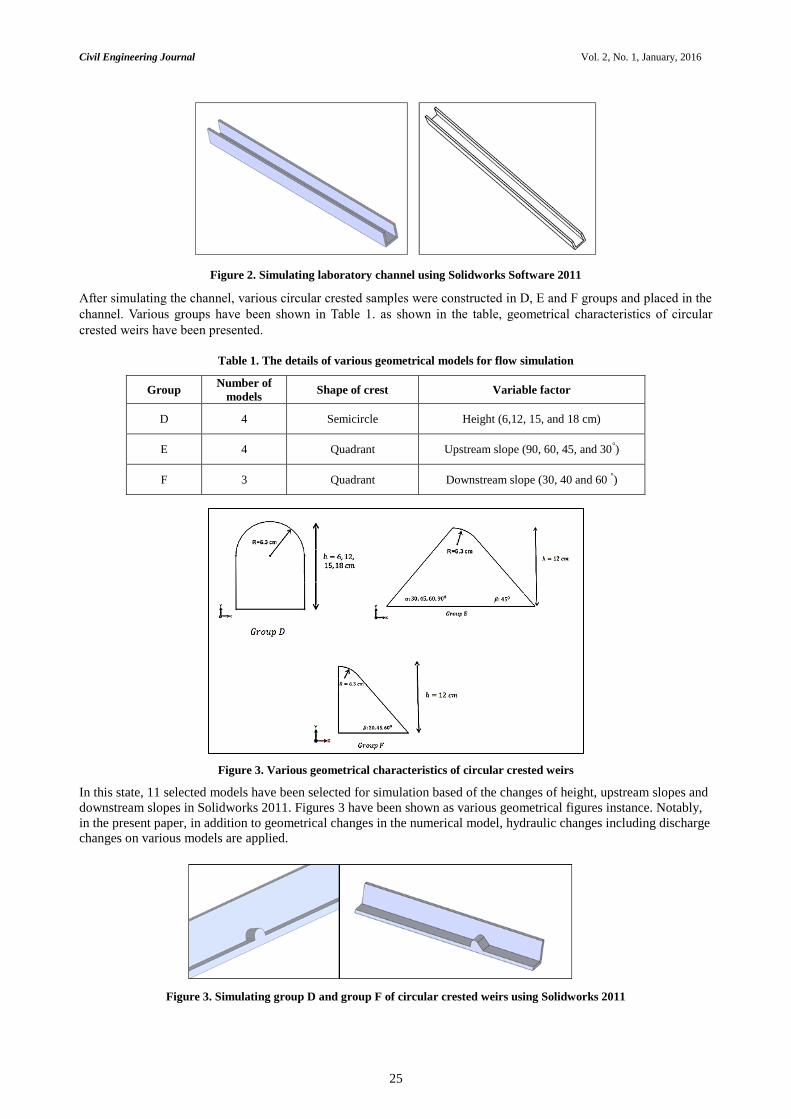
Table 1. The details of various geometrical models for flow simulation
Group Number of
models Shape of crest Variable factor
D 4 Semicircle Height (6,12, 15, and 18 cm)
E 4 Quadrant Upstream slope (90, 60, 45, and 30°)
F 3 Quadrant Downstream slope (30, 40 and 60 °)
Figure 3. Various geometrical characteristics of circular crested weirs
In this state, 11 selected models have been selected for simulation based of the changes of height, upstream slopes and
downstream slopes in Solidworks 2011. Figures 3 have been shown as various geometrical figures instance. Notably,
in the present paper, in addition to geometrical changes in the numerical model, hydraulic changes including discharge
changes on various models are applied.
Figure 3. Simulating group D and group F of circular crested weirs using Solidworks 2011
Civil Engineering Journal Vol. 2, No. 1, January, 2016
26
For all various states, geometrical conditions of circular crested weirs were created appropriate with them through
Solidworks 2011. To investigate hydraulic flow and conditions on each of the above models, boundary and primary
conditions should be applied in Flow3D numerical model.
3. Evaluating and Validating Flow Simulation Numerical Model in Circular Crested Weirs
In this simulation of flow on circular crested weirs using available laboratory data, non-viscous fluid,
incompressible fluid and air intake has been considered with the density of 1.2 kg/m3 and its shear stress of 0.073.
Notably, the laboratory model has been constructed using PVC which has been introduced in flow simulation by
Flow3D through standard materials with the height of below 0.3 mm. therefore, the value of the equal n coefficient
(0.01) is applied by Flow3D Software. All the stages of simulation and evaluation of models have been performed
with respect to the identical laboratory conditions. What discussed here is calibrating the numerical model in terms of
boundary and simulation conditions. To extract accurate and precise values of a numerical or laboratory model, it is
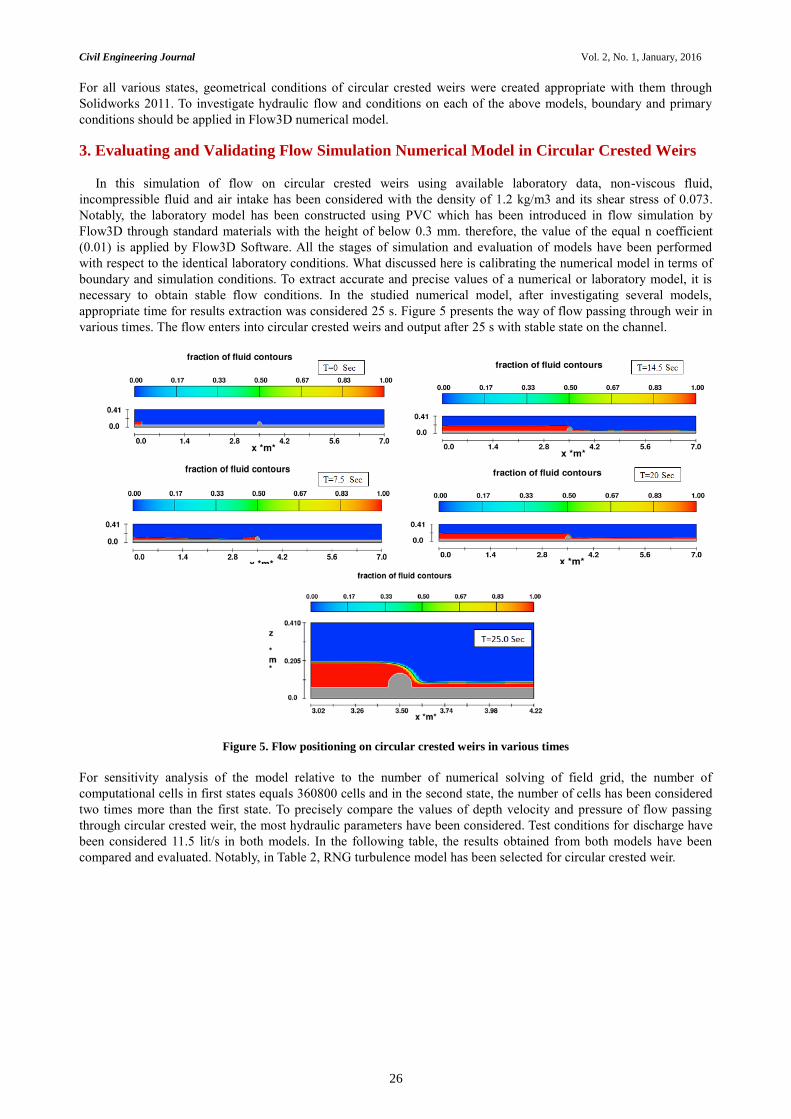
necessary to obtain stable flow conditions. In the studied numerical model, after investigating several models,
appropriate time for results extraction was considered 25 s. Figure 5 presents the way of flow passing through weir in
various times. The flow enters into circular crested weirs and output after 25 s with stable state on the channel.
Figure 5. Flow positioning on circular crested weirs in various times
For sensitivity analysis of the model relative to the number of numerical solving of field grid, the number of
computational cells in first states equals 360800 cells and in the second state, the number of cells has been considered
two times more than the first state. To precisely compare the values of depth velocity and pressure of flow passing
through circular crested weir, the most hydraulic parameters have been considered. Test conditions for discharge have
been considered 11.5 lit/s in both models. In the following table, the results obtained from both models have been
compared and evaluated. Notably, in Table 2, RNG turbulence model has been selected for circular crested weir.

Civil Engineering Journal Vol. 2, No. 1, January, 2016
27
Table 2. Comparing the time and error of flow simulation on circular crested weirs using various gridding
Fluid Depth (m) Pressure (Pa) Velocity (m/s) Hydraulic Parameter
0.0115 0.0115 0.0115 Discharge (m3/s)
32478 32478 32478 Solve elapsed time (S)
First Model (St1)
81548 81548 81548 Solve elapsed time (S) Second Model (St2)
First Model (St1): 360800 Cells & Second Model (St2): 721600 Comparison Between
Numerical Simulation and
Experimental
Flow3D
St2
Flow3D
St1 EXP
Flow3D
St2
Flow3D
St1 EXP
Flow3D
St2
Flow3D
St1 EXP
0.062 0.0609 0.06 606 621 602 0.889 0.915 0.87
1.75 % 2.3 % 2.8 % Relative Error %
Considering the values of (relative error of two models) simulation using gridding in the first and second states as
well as simulation time, it is revealed that in the first state, given that simulation time is almost the half of simulation
time in the second state, and on the other hand, the accuracy of hydraulic parameters in the first and second states have
no significant change, gridding in the first state is sleeted a the optimum gridding. Therefore, for other simulations, the
same gridding with the cell number of 36080 is used to solve flow computational field by Flow3D numerical model.
Given to gridding conditions of the above models and by investigating and comparing evaluation results with these
tests, the best size of gridding cells for numerical model of circular crested weirs for 1.5 cm in length and 1 cm in
width and in line with flow depth to improve flow depth results gridding corresponding to Solid model was considered
0.5 cm.
In numerical model of Flow3D, there are two turbulence models of standard K-ε and RNG for free surface flow. In
flow simulating using CFD models, turbulence model appropriate with flow conditions is one of the most important
parts of computational fluids dynamics. Accordingly, these two turbulence models were compared to simulate flow on
circular crested weirs. Table 3 shows the comparison and evaluation results related to flow simulation using standard
K-ε and RNG models.
Table 3. Comparing time and error of flow simulation on circular crested weirs using various turbulence models of
standard K-ε and RNG
Fluid Depth (m) Pressure (Pa) Velocity (m/s) Hydraulic Parameter
Q=0.0115(m3/s) Q=0.0115(m3/s) Q=0.0115(m3/s) Discharge (m3/s)
59975 59975 59975
Solve elapsed time (S)
K-ɛ Model
32478 32478 32478
Solve elapsed time (S)
RNG Model
First Model (St1): K-ɛ Model & Second Model (St2): RNG Model Comparison Between
Numerical Simulation and
Experimental
Flow3D Flow3D EXP Flow3D Flow3D EXP Flow3D Flow3D EXP
k-ε RNG
0.062 k-ε RNG
602 k-ε RNG
0.87 0.0609 0.063 621 603 0.915 0.873
3.1 % 2.8 % 4.7 % Relative Error %
Given to the above table, there is no significant difference between two models of standard K-ε and RNG. The results
of two models for flow simulation on circular crested weir are very similar. It should be noted that flow simulation on
circular crested weir here can be considered as a criterion to select appropriate turbulence model. The time value
required for turbulence model of K-ε is about two times more than RNG while their relative results are slightly
different. On the other hand, this turbulence model is used due to its advantages relative to other models such as K-ε.
Due to having additional term in equation ε, this model is rapidly strained for flows analyses and flows on surfaces
have been improved with high geometrical changes and this model has a high power to simulate transient flows [15].
Moreover, relying on a comparison done by Sabagh (2007), RNG turbulence model can be used with more confidence
compared to various turbulence models using Flow3D [16]. Given to the aforementioned, in all performed
simulations, 3D flow field has been solved though RNG turbulence model. Hence, in flow simulations on circular
crested weirs, various turbulence and boundary conditions of computational cell grid have been considered as in flow

Civil Engineering Journal Vol. 2, No. 1, January, 2016
28
boundary with flow discharge, flow depth, etc. and out flow boundary and lateral walls of computational cells were
considered in wall and symmetry, and floor and ceiling of computational cells grid were conspired wall and symmetry.
4. Investigating Simulation Results of Flow Simulation on Circular Crested Weir
As mentioned earlier, after performing various tests on the numerical model, the best possible results for the
performed modelling are presented here. Accordingly, output results for various inflow conditions are discussed.
Notably, here, 44 simulations with various geometrical and hydraulic conditions on circular crested weir have been
performed. Hydraulic conditions for each of geometrical conditions for various discharges have been considered 5.3,
7.4, 10, and 11.5 lit/s. For various hydraulic and geometrical conditions, the performed simulations in 3D in Flow3D
model have been evaluated. The following figure shows 3D flow pattern on circular crested weir for maximum
discharge. Figure 6 shows 3D flow profile on various groups of circular crested weirs.
Figure 6. 3D flow profile on various groups of circular crested weirs
After simulating flow on various groups of circular crested weirs, the effect of weir’s height, upstream slope and
downstream slope on the most important hydraulic parameters including flow depth on crest, flow velocity and
pressure on weirs’ crest have been evaluated and compared.
5. Investigating Flow Numerical Simulation Results on Flow Depth in Crest
In different groups of weirs’ crest models, the changes of flow height on relative depth of flow are investigated.
Accordingly, in the following figures, the values of flow depth simulated for central axis of cannel in longitudinal
direction has been shown. Notably, the exact values of flow depth can be extracted from Analyze section of Flow3D
model.
Group D
Group E
Group F
Civil Engineering Journal Vol. 2, No. 1, January, 2016
29
H1/R
0.0 0.2 0.4 0.6 0.8 1.0 1.2
ycr/H
1
0.0
0.2
0.4
0.6
0.8
1.0
h=18.7 cm Exp
h=15.7 cm Exp
h=12.5 cm Exp
h=18.7 cm Flow3D
h=15.7 cm Flow3D
h=12.5 cm Flow3D
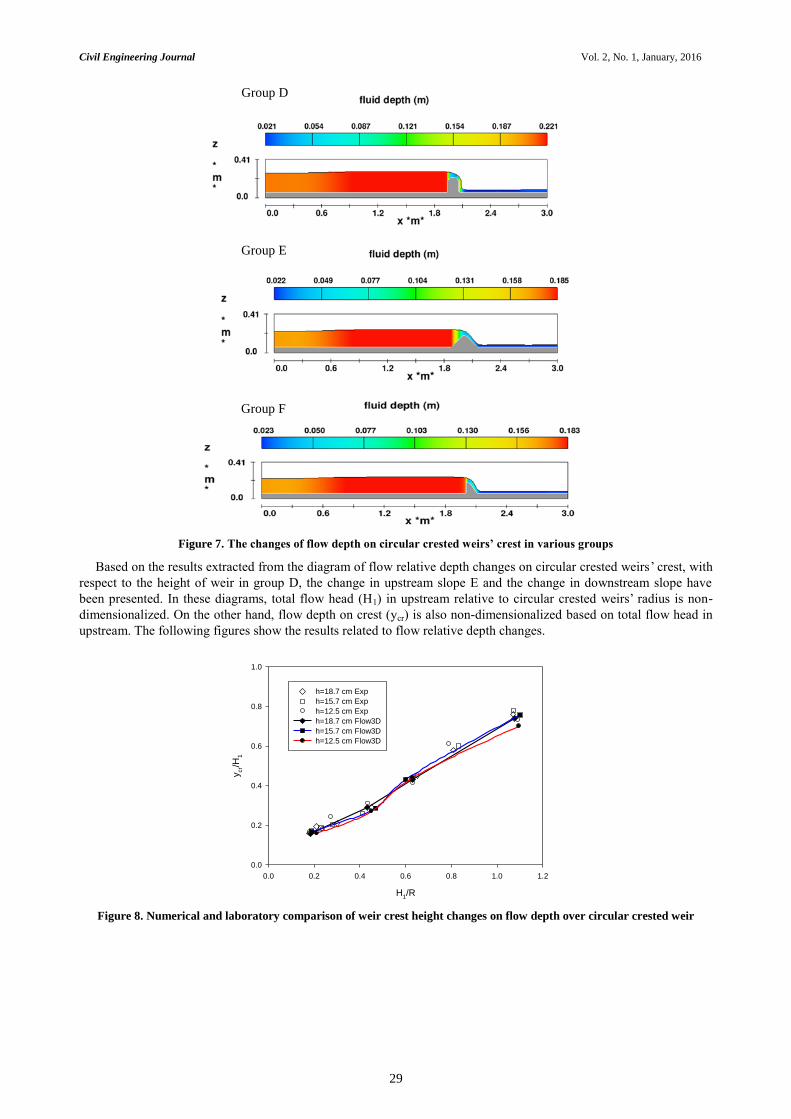
Figure 7. The changes of flow depth on circular crested weirs’ crest in various groups
Based on the results extracted from the diagram of flow relative depth changes on circular crested weirs’ crest, with
respect to the height of weir in group D, the change in upstream slope E and the change in downstream slope have
been presented. In these diagrams, total flow head (H1) in upstream relative to circular crested weirs’ radius is non-
dimensionalized. On the other hand, flow depth on crest (ycr) is also non-dimensionalized based on total flow head in
upstream. The following figures show the results related to flow relative depth changes.
Figure 8. Numerical and laboratory comparison of weir crest height changes on flow depth over circular crested weir
Group D
Group E
Group F

Civil Engineering Journal Vol. 2, No. 1, January, 2016
30
H1/R
0.0 0.2 0.4 0.6 0.8 1.0 1.2
y cr/H
1
0.0
0.2
0.4
0.6
0.8
1.0
a=30 , b=45 Exp
a=45 , b=45 Exp
a=60 , b=45 Exp
a=90 , b=45 Exp
a=30 , b=45 Flow3D
a=45 , b=45 Flow3D
a=60 , b=45 Flow3D
a=90 , b=45 Flow3D
Figure 9. Numerical and laboratory comparison of upstream slope changes on flow depth over circular crested weir
H1/R
0.0 0.2 0.4 0.6 0.8 1.0 1.2
y cr/H
1
0.0
0.2
0.4
0.6
0.8
1.0
a=90 , b=30 Exp
a=90 , b=45 Exp
a=90 , b=60 Exp
a=90 , b=30 Flow3D
a=45 , b=45 Flow3D
a=60 , b=45 Flow3D
Figure 10. Numerical and laboratory comparison of downstream slope changes on flow depth over circular crested weir
In the above figures, the effect of height change on flow depth has been shown. In these diagrams, filled points
indicate the results related to Flow3D simulations and empty points indicate the laboratory results. Accordingly, height
changed has almost no effect on depth over crest and flow depth over circular crest body in this state is about 71%
total load (H1). Investigating the effect of upstream slope is shown in the next figure indicating that the increase of
upstream slope leads to the increase of flow relative depth value (H1/R) on crest up to 62%. In comparative diagram of
the last section, the effect of downstream slope on flow has been also investigated. To investigate exact values of
laboratory and numerical results difference, the values extracted for groups D, E and F have been presented in the
following tables. Hence, according to the obtained results, the maximum simulation error equals 12.5% and the
average error is about 4%.
Table 4. The error values of laboratory results and numerical simulation results of flow depth on weir’s crest for group D
Group D H1/R
Exp
Ycr/H1
Exp
H1/R
Flow3D
Ycr/H1
Flow3D Error %
h=18.7 cm
0.180 0.160 0.184 0.156 2.500
0.450 0.290 0.432 0.295 1.724
0.650 0.450 0.631 0.430 4.444
1.070 0.760 1.077 0.740 2.632
h=15.7 cm
0.19 0.175 0.19 0.1677 4.171
0.41 0.26 0.47 0.2867 10.269
0.61 0.43 0.6 0.4307 0.163
1.072 0.78 1.1 0.7567 2.987
h=12.5 cm
0.183 0.168 0.21 0.159 5.357
0.435 0.31 0.45 0.27 12.503
0.632 0.412 0.63 0.44 6.796
1.09 0.73 1.095 0.7 4.110
Civil Engineering Journal Vol. 2, No. 1, January, 2016
31
Table 5. The error values of laboratory results and numerical simulation results of flow depth on weir’s crest for group F
F H1/R
Exp
Ycr/H1
Exp
H1/R
Flow3D
Ycr/H1
Flow3D Error %
=
=
0.18 0.175 0.19 0.18 2.857
0.45 0.35 0.47 0.36 2.857
0.81 0.68 0.6 0.61 10.294
1.07 0.81 1.1 0.89 9.877
=
=
0.19 0.21 0.21 0.21 0.000
0.41 0.35 0.45 0.35 0.000
0.83 0.71 0.63 0.625 11.972
1.072 0.88 1.095 0.83 5.682
=
=
0.183 0.17 0.23 0.167 1.765
0.435 0.38 0.44 0.33 12.158
0.79 0.715 0.61 0.63 11.888
1.09 0.86 1.11 0.76 11.628
Table 6. The error values of laboratory results and numerical simulation results of flow depth on weir’s crest for group E
E H1/R
Exp
Ycr/H1
Exp
H1/R
Flow3D
Ycr/H1
Flow3D Error %
=
=
0.18 0.175 0.184 0.185 5.714
0.45 0.33 0.431 0.37 12.121
0.65 0.56 0.630 0.53 5.357
1.07 0.81 1.077 0.84 3.704
=
=
0.19 0.21 0.19 0.19 9.524
0.41 0.35 0.47 0.36 2.857
0.83 0.71 0.6 0.65 8.451
1.072 0.88 1.1 0.85 3.409
=
=
0.183 0.17 0.21 0.18 5.882
0.435 0.42 0.45 0.37 11.905
0.79 0.73 0.63 0.65 10.959
1.09 0.86 1.095 0.81 5.814
=
=
0.187 0.181 0.23 0.167 7.735
0.41 0.39 0.44 0.35 10.256
0.8 0.72 0.61 0.63 12.500
1.105 0.81 1.11 0.75 7.407
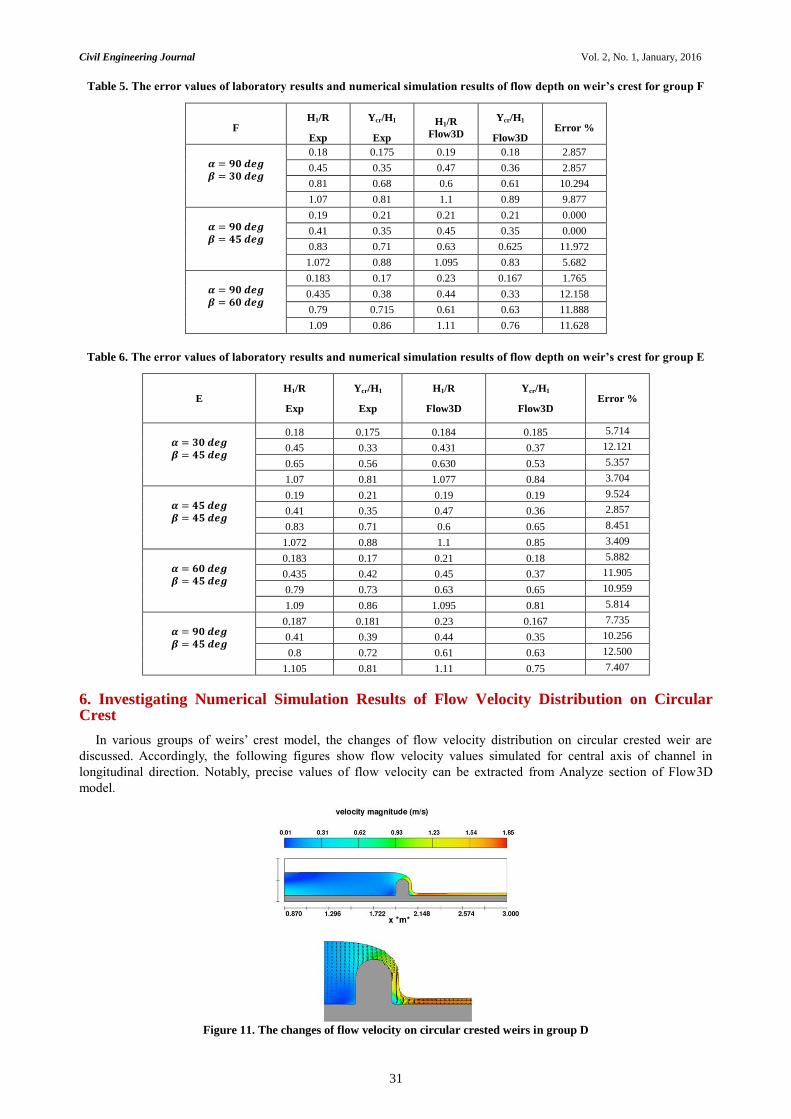
6. Investigating Numerical Simulation Results of Flow Velocity Distribution on Circular Crest
In various groups of weirs’ crest model, the changes of flow velocity distribution on circular crested weir are
discussed. Accordingly, the following figures show flow velocity values simulated for central axis of channel in
longitudinal direction. Notably, precise values of flow velocity can be extracted from Analyze section of Flow3D
model.
Figure 11. The changes of flow velocity on circular crested weirs in group D

Civil Engineering Journal Vol. 2, No. 1, January, 2016
32
Figure 12. The changes of flow velocity on circular crested weirs in group E
Figure 13. The changes of flow velocity on circular crested weirs in group F
Velocity distribution on circular crested weirs is presented according to the Dressler’s equation:
=
1 ( ⁄ )
(1)
Where u indicates flow velocity; y indicates flow depth from floor; R denotes bed curvature (crest), and U1 indicates
velocity in crest’s floor (Figure 14).
Figure 14. Velocity distribution parameters on circular crested weirs’ crest [17]
Based on Dressler’s equation, changes in velocity values is non-dimentionalized based on velocity in channel’s floor
(u/U1). Diagrams of velocity change based on the changes of weir’s height, upstream and downstream slopes of weir
are presented in the following figures. Notably, Dressler’s proposed model shown in next figures pertains to cylinder
weir presented by Dressler [17].

Civil Engineering Journal Vol. 2, No. 1, January, 2016
33
u / U1
0.0 0.2 0.4 0.6 0.8 1.0 1.2
y /
R
0.0
0.2
0.4
0.6
0.8
Dressler & Sivakomaran
h=18.7 cm Flow3D
h=15.7 cm Flow3D
h=12.5 cm Flow3D
h=6.45 cm Flow3D
Figure 15. Numerical comparison with Dressler’s equation in height changes of weir’s crest on flow velocity
u / U1
0.0 0.2 0.4 0.6 0.8 1.0 1.2
y / R
0.0
0.1
0.2
0.3
0.4
0.5
0.6
0.7
Dressler & Sivakomaran
a=30 , b=45 Flow3D
a=45 , b=45 Flow3D
a=60 , b=45 Flow3D
a=90 , b=45 Flow3D
Figure 16. Numerical comparison with Dressler’s equation in upstream slope changes of weir’s crest on flow velocity
u / U1
0.0 0.2 0.4 0.6 0.8 1.0 1.2
y / R
0.0
0.1
0.2
0.3
0.4
0.5
0.6Dressler & Sivakomaran
a=90 , b=30 Flow3D
a=90 , b=45 Flow3D
a=90 , b=60 Flow3D
Figure 17. Numerical comparison with Dressler’s equation in downstream slope changes of weir’s crest on flow velocity
According to the above figures, the effect of weir’s height does not lead to a significant change in velocity distribution.
On the other hand, as shown in the diagram, velocity distribution based on Dresslers’ equation has an appropriate
correspondence. Given to Figure 3, upstream slope change on velocity distribution over crest is obvious since due to
Civil Engineering Journal Vol. 2, No. 1, January, 2016
34
creating edge on the crest, flow simulation results differ from Dressler’s equation. In this figure, it is observed that in
y/R ratios, velocity distribution changes due to upstream slope change is higher than less y/R ratios. Given to slope
changes and flow simulation results, the cause of approaching velocity distribution to Dresslers’s equation can be
stated as following: the lower the value of upstream slope, the more uniform the flow line will be and the closer flow
velocity distribution to flow figure will be. As shown in above figures, in all simulations, upstream slope is 90° and it
is likely that velocity equation is not similar to velocity distribution of Dressler’s equation and simulated results.
Velocity distribution depends on downstream slopes and just like upstream slope change, it differs from Dressler’s
equation. Their difference is that the difference value of the results with Dressler’s equation is not as much upstream
slope. So, it can be concluded that downstream slope in comparison with upstream slope change has less effect and its
change has slight effect on velocity distribution.
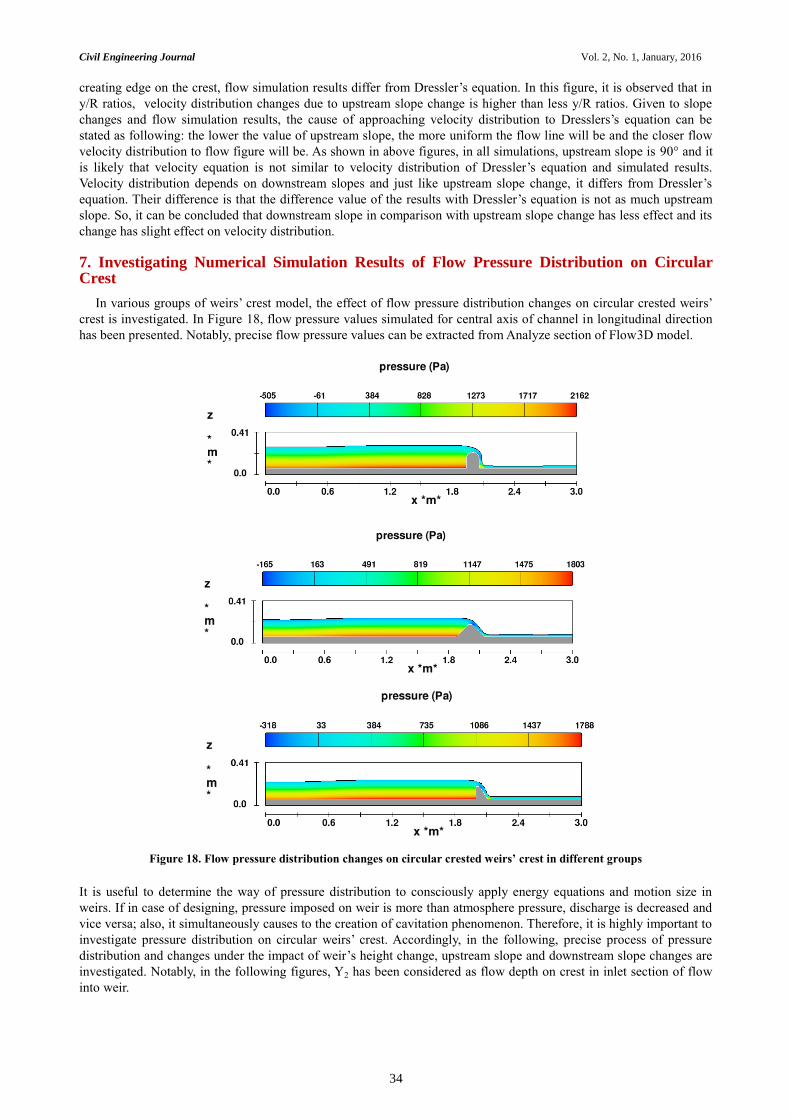
7. Investigating Numerical Simulation Results of Flow Pressure Distribution on Circular Crest
In various groups of weirs’ crest model, the effect of flow pressure distribution changes on circular crested weirs’
crest is investigated. In Figure 18, flow pressure values simulated for central axis of channel in longitudinal direction
has been presented. Notably, precise flow pressure values can be extracted from Analyze section of Flow3D model.
Figure 18. Flow pressure distribution changes on circular crested weirs’ crest in different groups
It is useful to determine the way of pressure distribution to consciously apply energy equations and motion size in
weirs. If in case of designing, pressure imposed on weir is more than atmosphere pressure, discharge is decreased and
vice versa; also, it simultaneously causes to the creation of cavitation phenomenon. Therefore, it is highly important to
investigate pressure distribution on circular weirs’ crest. Accordingly, in the following, precise process of pressure
distribution and changes under the impact of weir’s height change, upstream slope and downstream slope changes are
investigated. Notably, in the following figures, Y2 has been considered as flow depth on crest in inlet section of flow
into weir.

Civil Engineering Journal Vol. 2, No. 1, January, 2016
35
P/Y2
0.0 0.2 0.4 0.6 0.8 1.0
y /
Y2
0.0
0.2
0.4
0.6
0.8
1.0
h=6.30 cm Flow3D
h=12.5 cm Flow3D
h=15.7 cm Flow3D
h=18.7 cm Flow3D
Figure 19. Pressure changes due to the change of circular crested weirs’ crest for group D
In Figure 19, static pressure changes in various heights in circular crested weirs have been shown. As observed,
increasing depth leads to the increase of static pressure. Notably, the process of pressure changes relative to simulated
flow depth has s relatively linear distribution.
Figure 20. Pressure changes due to upstream slope change of circular crested weirs’ crest for group E
In Figure 20, static pressure distribution in depth has been shown for upstream slope changes. Based on these
diagrams, increased upstream slope leads to the increase of static pressure in a constant head which its changes amount
become more in lower depth. Notably, closer to water surface, less changes of P/Y2 due to upstream slope change. In
general, increasing upstream slope leads to the increase of static pressure such that it’s increasing percentage in low
depths and near to flow surface is higher.
Figure 21. Pressure changes due to the change of downstream slope change in circular crested weirs’ crest for group F
Civil Engineering Journal Vol. 2, No. 1, January, 2016
36
In Figure 21, static pressure changes due to downstream slope changes have been presented. Static pressure
distribution in various heads according to downstream of 30°, 45° and 60° are placed in a group. The effect of flow
head change on pressure distribution is more obvious than the effect of change in downstream slope. In a constant
head, increasing downstream slope leads to the decrease of static pressure value, which its changes amount is not
obvious as much as load changes do.
8. Conclusion
The present work was an attempt to investigate hydraulic characteristics and parameters due to the change of
geometry of circular crested weir using CFD method. In this regard, Flow3D model was investigated by changing
gridding as well as changing turbulence model. To validate the results, laboratory models were used. In the following,
the obtained results are presented:
Height change on depth over crest has almost no effect and flow depth over circular crest body in this state is
about 71% of total load (H1).
Upstream slope change on flow depth over weir’s crest indicates that increasing upstream slope leads to the
increase of flow relative depth (H1/R) over crest as much 62%.
Downstream change on flow depth change over crest is almost slight.
Weir’s height has no significant effect in velocity distribution.
Velocity distribution I consistent with Dressler’s equation.
Upstream slope change on velocity distribution over crest is obvious since due to creating edge on the crest,
flow simulation results differ from Dressler’s equation. In this figure, it is observed that in y/R ratios,
velocity distribution changes due to upstream slope change is higher than less y/R ratios. Given to slope
changes and flow simulation results, the cause of approaching velocity distribution to Dresslers’s equation
can be stated as following: the lower the value of upstream slope, the more uniform the flow line will be and
the closer flow velocity distribution to flow figure will be.
Downstream change compared to upstream slope has less effect and its change has slight effect on velocity
distribution.
Static pressure change in various heights in circular crested weirs reveals that increasing depth leads to the
increase of static pressure. Notably, the process of pressure changes relative to simulated flow depth has a
relatively linear distribution.
Increasing upstream slope leads to the increase of static pressure, which it increasing percentage in low
depths and near to flow surface is higher.
In a constant head, increasing downstream slope leads to the decrease of static pressure whose changes
amount is not clear as much as load changes do.
9. References
[1] Ramamurthy, Amruthur S., and Ngoc-Diep Vo. "Characteristics of circular-crested weir." Journal of hydraulic engineering 119,
no. 9 (1993): 1055-1062.
[2] Chaudhry, M. Hanif. Open-channel flow. Springer Science & Business Media, 2007.
[3] Bagheri, Sara, and Manouchehr Heidarpour. "Overflow characteristics of circular-crested weirs." Journal of Hydraulic Research
48, no. 4 (2010): 515-520.
[4] Bazin, Mikhail. Recent experiments on the flow of water over weirs. Engineers Club of Philadelphia, 1890.
[5] Creager, William Pitcher. Engineering for masonry dams. J. Wiley & sons, Incorporated, 1917.
[6] Sarginson, E. J. "The influence of surface tension on weir flow." Journal of Hydraulic Research 10, no. 4 (1972): 431-446.
[7] Bos, Marinus Gijsberthus. "Discharge measurement structures." NASA STI/Recon Technical Report N 78 (1976): 31395.
[8] Ramamurthy, Amruthur S., and Ngoc-Diep Vo. "Characteristics of circular-crested weir." Journal of hydraulic engineering 119,
no. 9 (1993): 1055-1062.
[9] Chanson, Hubert, and J. Sergio Montes. "Overflow characteristics of circular weirs: Effects of inflow conditions." Journal of
irrigation and drainage engineering 124, no. 3 (1998): 152-162.
[10] Chunrong, Liu, Huhe Aode, and Ma Wenju. "Numerical and experimental investigation of flow over a semicircular weir."
Acta Mechanica Sinica 18, no. 6 (2002): 594-602.
[11] Dargahi, Bijan. "Experimental study and 3D numerical simulations for a free-overflow spillway." Journal of Hydraulic
Engineering 132, no. 9 (2006): 899-907.

Civil Engineering Journal Vol. 2, No. 1, January, 2016
37
[12] Heydarpour, M., M. R. Chamani, and E. Khorami. "Characteristics of circular-crested and cylindrical weirs." (2006): 21-30.
[13] Bina, M., and Beygipour, Gh.H. , Hydraulic of Submerged Flow in circular-crested Weirs. Proceeding of the 5th Iranian
Hydraulic Conference, Shahid Bahonar University. Kerman, Iran, P 49-57, 2005. (In Persian)
[14] Heidarpour M, Habili JM, Haghiabi AH. 2008. Application of potential flow to circular-crested weir. Journal of Hydraulic
Research IAHR 46(5): 699-702.
[15] Release, FLOW3D. "3.2: User Manual." AEA Industrial Technology, Harwell Laboratory, Oxfordshire, United Kingdom
(1992).
[16] SabaghYazdi S R, Shamlou H, Rostami F. Educational application of FLOW3D Software to investigate turbulence simulation
of 3-d flow in hydraulic jump pool with concrete barriers, technology and education magazine, 2008; 2(4):PP 110-12.
[17] Dressler, Robert F. "New nonlinear shallow-flow equations with curvature." Journal of Hydraulic Research 16, no. 3 (1978):
205-222.