Embed Size (px)
Citation preview

An Examination of Positive Behavior Supports in Alabama
by
Melissa E. Card
A dissertation submitted to the Graduate Faculty of
Auburn University
in partial fulfillment of the
requirements for the Degree of
Doctor of Philosophy
Auburn, Alabama
August 1, 2015
Keywords: Positive Behavior Supports, academic achievement
Approved by
Maria Witte, Co-Chair, Professor of Educational Foundations, Leadership, and Technology
James Wright, Co-Chair, Associate Dean of College of Education
Hank Williford, Professor of Kinesiology, College of Education

ii
Abstract
This dissertation examined the effects of Positive Behavior Supports (PBS) on academic
achievement in the state of Alabama as measured by the scores of the Alabama Reading and
Math Test (ARMT) for fourth graders. In this study, four districts that implemented PBS prior to
2005–2006 school year were matched with four like districts that had not implemented PBS.
The researcher for this study used the National Center for Education Statistics website to
examine the demographic data at the school district level for all 131 districts in the state of
Alabama, then systemically paired each of the four PBS districts with a similar non-PBS district
based on seven indicators. Districts were matched based on geographic category (i.e. rural, large
urban city, etc.), number of schools, number of students, number of positions that are full-time or
part-time positions (i.e. two half-time positions equal one full-time position) [Full-time
Equivalent] (FTE), student/teacher ratio, number of English language learners (ELL), and the
racial make-up of the total population under age 18. The racial categories included White,
Black, Hispanic or Latino, American Indian or Alaska native, Asian, and Hawaiian or other
Pacific Islander. ARMT scores of these eight school districts were reviewed to identify
relationships. The null hypothesis of no difference between PBS and non-PBS ARMT scores for
Reading 2010, 2011 and 2012 was rejected. The null hypothesis of no difference between PBS
and non-PBS ARMT scores for Math 2010 and 2011 was rejected. Even though PBS districts
faired better on the ARMT than the matching non-PBS counterparts, the data did not yield a
statistically significant difference under analysis of chi-square.

iii
Acknowledgments
I wish to acknowledge and express my sincere gratitude to my committee members Dr.
Maria Witte, Dr. James Wright and Dr. Hank Williford for their continued support throughout
my graduate studies. The patience, encouragement, guidance and support from this committee
has been unbelievable to me, during the process. Thank you dearly for your commitment.
Thank you Dr. Williford for the many data meetings I needed for clarification and your
input regarding the abundance of data points. Thank you Dr. Wright for the message of “it’s not
a race, it’s a journey,” this kept me focused on each transition to the finish. And Dr. Witte, your
consistency about the process and always responding to my many questions, thank you.
Also, special thanks to my professional colleagues at Auburn University Montgomery,
Dr. Mona Hurston, Dr. Rhonda Morton, Dr. Timothy Lewis, Dr. Yvette Bynum and Dr. Tara
Beziat for providing encouraging words, guidance through the process, support and
understanding my frustrations. Last but not least, thank you HEAVENLY FATHER for giving
me the knowledge, patience and ability to complete the journey of attaining my Ph.D., and for
blessing me with the love and support of my wonderful husband, Nigel Card, and children Arin
Denay and Ava Makenzie Card.

iv
Table of Contents
Abstract ........................................................................................................................................... ii
Acknowledgements ........................................................................................................................ iii
List of Tables ............................................................................................................................... viii
List of Figures ..................................................................................................................................x
Chapter 1: Introduction ....................................................................................................................1
Statement of the Problem .....................................................................................................8
Purpose of Study ..................................................................................................................9
Research Questions ............................................................................................................10
Significance of Study .........................................................................................................10
Limitations .........................................................................................................................11
Definition of Terms............................................................................................................11
Chapter 2: Literature Review .........................................................................................................14
Purpose of Study ................................................................................................................14
Research Questions ............................................................................................................15
Origins of Discipline Practices in Public Education ..........................................................15
History of Positive Behavior Supports ..............................................................................17
Context and Need for School-Wide Positive Behavior Supports ......................................20
Components of Positive Behavior Supports ......................................................................25
Four Philosophical Ideas of Positive Behavior Supports ...................................................30

v
Three-tiered Approach to Prevention/Continuum of Support ...............................30
Instructional Emphasis ...........................................................................................38
Functional Perspective ...........................................................................................38
Sustainability Priority ............................................................................................41
Successful Implementation Assumptions and Solutions ...................................................43
Systems Approach .............................................................................................................44
Implementation Levels.......................................................................................................46
Individual Students ................................................................................................46
Classrooms .............................................................................................................46
School-wide ...........................................................................................................47
Districts ..................................................................................................................48
States ......................................................................................................................48
Academics, Behavior and PBS ..........................................................................................53
Behavioral Effects of Positive Behavior Supports.............................................................54
Academic Effects of Positive Behavior Supports ..............................................................56
Positive Behavior Supports and Instructional Time ..........................................................57
Chapter 3: Method and Procedures ................................................................................................59
Purpose of Study ................................................................................................................59
Research Questions ............................................................................................................60
Researcher’s Role ..............................................................................................................61
Participants .........................................................................................................................61
Research Design.................................................................................................................62
Instrumentation ..................................................................................................................63

vi
Reading Portion of the ARMT ...............................................................................64
Mathematics Portion of the ARMT .......................................................................65
Validity ..............................................................................................................................67
Reliability ...........................................................................................................................70
Inter-rater Agreement Measures ............................................................................70
Standard Error of Measurement .............................................................................71
Data Collection ..................................................................................................................74
Data Analysis .....................................................................................................................75
Summary ............................................................................................................................76
Chapter 4: Results ..........................................................................................................................77
Quantitative Descriptive Statistics .....................................................................................77
Research Question 1 ..............................................................................................78
Data Analysis .....................................................................................................................81
Research Question 2 ..............................................................................................82
Research Question 3 ..............................................................................................85
Research Question 4 ..............................................................................................89
Research Question 5 ..............................................................................................89
Chapter 5: Discussion ....................................................................................................................91
Findings Related to the Literature......................................................................................91
Implications........................................................................................................................94
Limitations .........................................................................................................................94
Recommendations for Future Studies ................................................................................95
Concluding Remarks ..........................................................................................................97
vii
References ......................................................................................................................................98

viii
List of Tables
Table 1: Reading: Intercorrelations of Domains, Standards, and Total Scores ...........................68
Table 2: Mathematics: Intercorrelations of Domains, Sub-Domains, and Total Scores .............69
Table 3: Inter-Rater Agreement Coefficients for ARMT ............................................................71
Table 4: Means, Standard Deviations, Number of Items, Reliability Coefficients, and
Standard Error of Measure (SEM) for Reading and Mathematics ................................72
Table 5: Reliability Coefficients for Gender and Ethnicity .........................................................72
Table 6: Reliability Coefficients for Limited English Proficient (LEP) and
Special Education. .........................................................................................................73
Table 7: Number of Schools, Means, Standard Deviations, and Reliability
Coefficients for Schools ................................................................................................74
Table 8: Cohort Identification for Alabama School Districts Included in the Study ..................75
Table 9: PBS 1 and Non-PBS 2 Demographics ..........................................................................78
Table 10: PBS 3 and Non-PBS 4 Demographics ..........................................................................79
Table 11: PBS 5 and Non-PBS 6 Demographics ..........................................................................80
Table 12: PBS 7 and Non-PBS 8 Demographics ..........................................................................80
Table 13: ARMT Reading Scores for year 2010 ...........................................................................83
Table 14: ARMT Reading Scores for year 2011 ...........................................................................84
Table 15: ARMT Reading Scores for year 2012 ...........................................................................85
Table 16: ARMT Math Scores for year 2010 ................................................................................86
Table 17: ARMT Math Scores for year 2011 ................................................................................87

ix
Table 18: ARMT Math Scores for year 2012 ................................................................................88
Table 19: ARMT Reading Scores for year 2010, 2011, 2012 .......................................................89
Table 20: ARMT Math Scores for year 2010, 2011, 2012 ............................................................90

x
List of Figures
Figure 1. The Four Elements of Positive Behavior Supports ..................................................... 25
Figure 2. Behavioral and Biomedical Sciences/Major Assumptions ..........................................29
Figure 3. Integration of Academics and Social Behavior Three-Tiered
Continuum of Behavior Support ................................................................................. 31
Figure 4. Individualized Behavior Support Elements .................................................................39
Figure 5. 2 Basic Functions of Positive and Negative Reinforcers .............................................41
Figure 6. Social Competence and Academic Achievement in Evidence-based Practice ............45
Figure 7. Positive Behavior Support Implementation Levels .................................................... 46
Figure 8. Positive Behavior Support Organizational Logic Model .............................................49

1
CHAPTER 1: INTRODUCTION
In the late 1990s, all schools in the United States received a document from the U. S.
Secretary of Education entitled Early Warning, Timely Response: A Guide to Safe Schools. The
compelling message of the document acknowledged that collaborative efforts must be made to
respond to increasing violent and disruptive behaviors of students in schools (Dwyer, Osher, &
Warger, 1998).
With a lot of legislative involvement regarding discipline and the immense amount of
funds geared to reform and strengthen education, school administrators and teachers across the
country have been charged with ensuring that students attend schools that have safe and orderly
environments where they can receive a meaningful education (Council for Exceptional Children,
2008; Sugai, Sprague, Horner, & Walker, 2000; Yell & Rozalski, 2008). In 2001, the
Elementary and Secondary Education Act, better known as No Child Left Behind Act (NCLB)
brought education services into the accountability equation, designed to improve student
achievement and change the culture of America's schools (U S Department of Education, 2005).
In 2004, Congress added a provision to the Missing, Runaway, and Exploited Children’s Act,
which allowed the United States Department of Education to award a grant to the National
Academy of Science to study rampage shooting (Newman, 2004). In 2009, Congress passed the
Gun Free School Zones Act (Kopel, 2009) to combat violence in our schools. Additionally, in
2009, the American Recovery and Reinvestment Act (ARRA) invested billions of dollars into the

2
NCLB accountability equation to: (1) support early learning/early childhood education programs;
(2) reform K–12 education, and close the achievement gap, by investing in innovative strategies
to improve student outcomes; and (3) increase access to higher education in the form of college
affordability, and expanding college financial aid (White House, n.d.). Most significantly,
amendments to the 1997 Individuals with Disabilities Act (IDEA) defined positive behavioral
interventions and supports (PBIS), functional behavioral assessments (FBA), and positive
behavior supports (PBS) into policy and practice and inserted them in the business of discipline
and classroom and behavior management in every school in America (Sugai & Horner, 2002a; U
S Department of Education, 2005). Goodwin (2009), Meece and McColskey (1997), Cohen,
McCabe, Michelli, and Pickeral (2009), and Cohen and Pickeral (2007) agreed that a positive
school climate is associated with academic achievement, effective risk prevention efforts,
increased student graduation rates, teacher retention, and healthy youth development.
Due to the increased attention regarding acts of school violence, bullying, student
victimization, antisocial and dangerous behaviors in schools, many school systems have resorted
to zero tolerance and other punitive practices, hoping to gain control of the problems. However,
the American Psychological Association (2008) agrees that these reactive and get tough
approaches to challenging student behaviors have been criticized as a short-term solution that
leaves out an important function of schools – teaching and learning (Noam, Warner, & Van
Dyken, 2001; Sugai & Horner, 2002a). An alternative response to challenging behaviors, which
is proactive, preventative, and able to facilitate effective change in schools and individual
students, is the use of Positive Behavior Interventions and Supports (PBIS) (Sugai & Horner,
2002a).

3
Curtin and Litke (1999) discussed the concept of misuse of power in schools. These
authors explained that violence does not have to be overt or physical but can include covert and
psychologically damaging actions. Inconsistent and emotionally charged punishments can lead
to persistent and increased behavioral problems. In an effort to control behaviors some educators
use inappropriate actions, such as shame tactics, name-calling, drawing everyone’s attention to
an embarrassing situation, or removal of the student from the classroom setting. To exclude
students from instruction is deemed a form of institutional violence, because it keeps students
from learning information they would otherwise learn if allowed access to the curriculum. This
form of psychological violence damages a child’s self-respect; children believe they are bad
because they are told they are bad, but what should be taking place is instruction on what
behaviors are appropriate (Curtin & Litke, 1999).
A review of research was conducted by the Southern Poverty Law Center (SPLC; 2008)
on the effects of school discipline in correlation to student dropout rates to teacher retention.
The Center specifically examined student dropout rates and teacher retention in the State of
Alabama. They reported that in Alabama 29 students dropped out of high school every school
day, and that the state of Alabama adds 4,000 teachers a year to schools – only to see 50 percent
of the teachers leave the profession within the first five years of teaching. The SPLC stated:
A great number of our teachers and students are dropping out for the same reason: school
discipline. Left with few alternatives for handling problems in the classroom, many
schools employ discipline methods that research tells us are counterproductive and lead
to dropping out: suspensions, expulsions, placements in alternative schools, and referrals
to the criminal justice system. (Southern Poverty Law Center, 2008) (p. 3)

4
The Southern Education Foundation (SEF; 2008) revealed that the rationale related to
student dropout is complex and can differ from district to district around the state of Alabama:
To resolve the problem of school dropouts, Alabama needs to tackle a set of issues that
define the needs of the entire education system: academic preparation for achievement,
positive school environments, targeting effective programs, successful recovery and
prevention measures, and adequate financing. (p 1).
The Southern Education Foundation reviewed each contributing factor of dropouts in
detail, but the following discussion focuses on one factor – lack of positive school environments.
The Southern Education Foundation (2008) found that all Alabama schools suspended an
average of one out of every 10 students in the 2004–2005 school year, resulting in Alabama
suspending 1.5 of every 10 students and 1.7 of every 10 Black students in high schools. Some
Alabama high schools suspended one out of every two or three students; many times the same
few students were suspended repeatedly. Removing students out of general population of school
and away from highly qualified instruction only extends the academic failure of the student and
contributes to the difficulty for the student to achieve (Southern Education Foundation, 2008).
Dinkes, Cataldi, Lin-Kelly and Snyder (2007) reported that the problem of exclusionary
discipline is not exclusive to Alabama. The School Survey on Crime and Safety reported that 48
percent of public schools in the United States took serious disciplinary action against students.
Of these actions, 74 percent were suspensions that lasted five days or more, 5 percent were
expulsions, and 20 percent were transfers to specialized schools (Dinkes et. al., & Snyder, 2007).
The Office of Civil Rights’ Data Collection Report revealed 3,328,754 out of school student
suspensions and 102,077 expulsions were reported in 2004–2005 (U.S. Department of
Education, 2006).

5
Wallace, Goodkind, Wallace, and Bachman (2008) warned that suspensions and
expulsions have serious implications for students’ short-term academic performance and their
longer-term social and economic well-being. When students are removed from school, they
potentially increase the amount of time spent without supervision and with other youth who are
not in school (Wallace et al., 2008). Removal from school has a significant correlation with
serious negative outcomes, including poor academic achievement, grade retention, delinquency,
and substance use (Raffaele-Mendez & Knoff, 2003).
The use of exclusionary school discipline practices “does not appear to work as a
deterrent to future misbehavior” (Raffaele-Mendez & Knoff, 2003, p. 31). On the contrary,
suspensions typically lead to additional suspensions and eventually expulsion or dropping out
(Brown, 2007; Civil Rights Project/Advancement Project, 2000; Raffaele Mendez, 2003; Suh &
Suh, 2007). Exclusionary discipline policies fail to improve school-wide safety, are associated
with lower academic achievement and higher rates of dropout, prolonged graduation time,
increased academic disengagement, and a failure to change future behavioral problems (Achilles,
Mclaughlin, & Croninger, 2007; American Psychological Association Zero Tolerance Task
Force, 2008; Arcia, 2006; Christle, Jolivette, & Nelson, 2005).
Clearly, inappropriate and pervasive behavioral issues are a major problem in education
and have been linked to acute and chronic school failure (Algozzine, Wang, & Violette, 2011;
Crews, Bender, Cook, Gresham, & Vanderwood, 2007; Lassen, Steele, & Sailor, 2006;
McIntosh, Horner, Chard, Boland, & Good, 2006; Stewart, Benner, Martella, & Marchand-
Martella, 2007; Vanderstaay, 2006; Vaughn, Wanzek, Murry, Sammacca, Linan-Thompson &
Woodruff, 2009). Yeo (1997) discussed the importance of an educator’s formal preparation in
the science and practice of educating students and how teacher preparation influences what

6
students learn. Many teachers enter at-risk environments unprepared to teach at-risk students.
Yeo (1997) and French, Seifman, Allen and Aber (2000) agreed that even teachers who are well
prepared to teach students academically often do not have the knowledge or training to deal with
severe behavioral issues; therefore, they require an expanded view of their role to meet the
current challenges of an at-risk environment. Also, French et al., (2000) expressed that teacher
attitudes and behaviors can significantly influence minority and at-risk student achievement.
To address behavioral needs in schools, the Office of Special Education Programs
(OSEP), a division of the United States Department of Education, created the OSEP Center on
Positive Behavioral Interventions and Supports (PBIS) to guide educators in selecting
scientifically-based behavioral interventions. Positive Behavior Supports is described as a
system approach used to teach behaviors to school-aged students. PBS emphasizes the use of
systems, data and practices to produce desirable outcomes, and is defined by the U. S. Office of
Special Education Programs (OSEP), Technical Assistance Center on Positive Behavioral
Interventions and Supports (2010) as:
a. an operational, decision-making framework that guides selection and implementation
of evidence-based academic and behavioral practices for improving academic and
behavioral outcomes for all students;
b. a broad range of systemic and individualized strategies for achieving important social
and learning outcomes while preventing problem behavior with all students; and
c. an effective, proactive procedural process that structures school-wide discipline, for
improved social competence and academic achievement for all students.
Sugai and Simonsen (2012) described PBIS as an operational framework or a broad
approach for enhancing the adoption and implementation of a continuum of evidence-based

7
interventions to achieve academic and behavioral outcomes for all students. PBIS has been used
in schools to teach behavioral expectations, positively reinforce the behavioral expectations that
were taught, and collect and use data in educational decision-making. Schools that establish
systems to implement positive behavior supports with fidelity and sustainability develop
teaching and learning environments that a) are more engaging, responsive, preventive, and
productive; b) are less reactive, aversive, dangerous, and exclusionary; and c) maximize
academic engagement and achievement for ALL students (Alabama Positive Behavior Support
Center, 2010).
School-wide Positive Behavior Intervention and Support (SWPBIS) is directed at
multiple levels of support – universal, secondary, and tertiary. This three-tiered prevention logic
requires that all students, in all settings, receive supports at the universal interventions or primary
tier. The next level of support, secondary interventions, addresses specialized group settings
such as the classroom or selected groups of students who require behavior supports beyond those
provided at the universal level. The final levels of support, tertiary interventions, are targeted
interventions for students that display chronic maladaptive behavior and require intense,
specialized intervention planning (Irvin, Horner, Ingram, Todd, Sugai, & Sampson, 2006; Irvin,
Tobin, Sprague, Sugai & Vincent, 2004; Putman, Luiselli, Handler & Jefferson, 2003; Safran &
Oswald, 2003; Sugai et al., 2000).
Lewis, Powers, Kely, and Newcomer (2002) outlined previously conducted studies that
have implemented SWPBIS and have shown successful results in a one-year period. Taylor-
Greene (1997) demonstrated a 42% reduction in behavior offenses that resulted in a discipline
report by clearly defining school-wide expectations and teaching students how to meet each
expectation; Nakasato (2000) demonstrated a reduction in daily office referrals across six

8
elementary schools through the development of universal PBS strategies; and Scott (2001)
demonstrated 65% to 75% reductions in out-of-school suspensions and in-school detentions,
which subsequently allowed students to be more successful in class to the point of increased
standardized test scores (p. 182). These studies reflect the use of defining school-wide behaviors
and subsequently teaching expected behavior to students. Public Citizens for Children and
Youth (2009) also showed positive outcomes and results in the reduction of problem behaviors
exhibited school-wide.
Statement of the Problem
Sugai, Horner, and McIntosh (2007) reported that many educators request assistance in
the area of behavior management and classroom management. In an attempt to regain behavioral
control, educators have reviewed and implemented a number of social and behavioral programs
and interventions in schools, such as the Gang Resistance Education and Training (GREAT)
Program, the Stop & Think Social Skills Program, and the First Step to Success Program
(Esbensen, Peterson, Taylor, Freng, Osgood, Carson, & Matsuda, 2011; Knoff, 2001; Sprague &
Perkins, 2009). Another program example is the Assessment of Inclusivity and Multiculturalism
(AIM) program, created by the National Association of Independent Schools (NAIS, 2011).
AIM is a tool used to evaluate a school’s culture to determine whether or not it possesses
inclusivity and multiculturalism (NAIS, 2011). Cohen and Pickeral (2007) stated, “Positive
school climate is associated with and/or predictive of academic achievement, effective risk
prevention efforts, and healthy youth development” (p. 14).
Although PBS is strongly supported as an evidence-based practice in the literature, many
schools in Alabama continue to rely on traditional methods (suspension and expulsion) when
responding to the challenging behaviors of most students. The district-wide approach of

9
implementing PBS in Alabama was addressed beginning in 1999 by training ten (10) Alabama
school districts. The impact of the initial training and subsequent trainings on the rates of office
discipline referrals (ODRs), out-of-school suspensions, and academic achievement has not been
explored.
Purpose of Study
The purpose of this study was to investigate the relationship of school-wide positive
behavior supports to academic achievement in Alabama schools. This study compared the 2009–
2010, 2010–2011 and 2011–2012 fourth grade Alabama Reading and Math Test (ARMT) scores
of four school districts in Alabama that have implemented Positive Behavior Support (PBS) to
four non-PBS school districts in Alabama. Demographic data were examined at the local district
level for eight schools in the State of Alabama. Districts that have fully implemented PBS
included all schools within the district that were trained in Tier I PBS and implemented PBS.
Then, based on seven indicators, each school district was paired with a similar non-PBS school
district. The total number of Alabama school districts totaled 131; the non-PBS schools totaled
115 schools that had not implemented PBS prior to the 2009–2010 school year. The districts
were matched based on geographic category (i.e. rural, large urban city, etc.), number of schools,
number of students, amount spent per student on instruction, student/teacher ratio, number of
English language learners (ELL), and the racial make-up of the total population under 18. The
racial categories were White, Black, Hispanic or Latino, American Indian or Alaska native,
Asian, and Hawaiian or other Pacific Islander.

10
Research Questions
The study was guided by the following research questions:
1. What are the demographic characteristics of the four PBS and four non-PBS
school districts in Alabama?
2. What are the differences between reading achievement scores among the PBS and
non-PBS school districts in Alabama?
3. What are the differences between math achievement scores among the PBS and
non-PBS school districts in Alabama?
4. What are the differences in reading achievement scores among the PBS and non-
PBS school districts in relation to the number of years of implementation of positive behavior
supports?
5. What are the differences in math achievement scores among the PBS and non-
PBS school districts in relation to the number of years of implementation of positive behavior
supports?
Significance of the Study
The study has practical significance for Alabama educators at state and local levels, and
other states implementing any form of Positive Behavior Supports or other system-wide
behavioral programs. Research could link academic success to effective reduction in
nonacademic barriers, including behavior. Policymakers and practitioners may be able to use the
information to acquire a snapshot of the current status of PBS in Alabama.
This study will explore implementing effective discipline practices and the shift toward
proactive discipline. It is imperative that the field of education gain insight regarding
educational outcomes as measured by state indicators. Alabama universities involved in teacher

11
or leadership preparation programs could apply research findings to evolve best practices used in
their preparation programs.
Results of this study are intended to contribute to the depth and breadth of knowledge on
best practices in public school systems. This study could add to the limited research available
regarding PBS in Alabama. This study could support improvements in problem disciplinary
behavior, school climate, organizational health and academic achievement within school districts
and school systems (Sugai & Simonsen, 2012).
Limitations
The limitations associated with the study include:
1. Essential to a district-wide approach, each PBS school team receives the same
training and information; however, the team is responsible for training the school
staff, and the interventions implemented at each site are unique to the school/district;
2. Each PBS school in every school district does not implement the same academic
programs; and
3. Every PBS school will have teachers/instructors with different degrees of education
and years of experience.
Definition of Terms
The terminology used in this study is defined as follows:
Discipline: the use of appropriate, logical consequences for behavior resulting in long
term and positive behavioral changes (Sprague, Sugai, Horner & Walker, 1999).
Dropout rate: percentage of students who voluntarily withdraw from school prior to
graduation (Christle, Nelson & Jolivette, 2004).
12
Exclusionary practice: suppression of student misbehavior through removal from an
educational setting, such as time-out, suspension, expulsion (Cartledge & Lo, 2006).
Expulsion: to remove, isolate or separate pupils who create disciplinary problems in the
classroom or other school activity and whose presence in the classroom may be detrimental to
the best interest and welfare of the class as a whole; expulsions are removal from the school
setting for a time period of more than ten school days (Code of Alabama [2001 Replacement]).
Functional Behavior Assessment (FBA): an investigative process that results in an
understanding of why behaviors occur (Steege & Watson, 2009).
Individualized Education Plan (IEP): an IEP is an education plan based on the child’s
unique needs and not on the child’s disability (Alabama Disabilities Advocacy Program, 2007).
Office discipline referrals (ODRs): an event in which (a) a student engaged in a
behavior problem that violated a rule/social norm in the school, (b) a problem was observed by a
member of the school staff, or (c) the event resulted in a consequence delivered by administrative
staff who produced a permanent (written) product defining the whole event (Sugai et al., 2000).
Out of school suspension (OSS): a disciplinary sanction that requires the student to be
excluded from the school building for a specified period of time (Christle et al., 2004).
Positive Behavior Support (PBS): a three-tiered system approach aimed at increasing
prosocial/positive behaviors among students, while preventing problem behavior (Glover, 2007).
Risk factors: individual and environmental influences that predict negative outcomes for
children (Morrison, Furlong, D’Incau & Morrison, 2004).
Safety: freedom from danger, harm or loss (Morrison et al., 2004).
School-wide positive behavior support (SWPBS): system change to minimize or
prevent behavior problems (Sugai et al., 2007).

13
Suspension: disciplinary sanction that requires a student to be excluded from school
(Skiba & Peterson, 2000).
Zero tolerance: policy mandating predetermined consequences for specified behaviors
(Stader, 2004).

14
CHAPTER 2: REVIEW OF LITERATURE
The purpose of this review of literature is to examine the history of student discipline,
origins and characteristics of PBS, particularly in relation to Applied Behavior Analysis (ABA),
discuss briefly the limitations of traditional discipline approaches and to examine various
system-based components of PBS. The review will conclude with a summation of current
research related to the implementation of school-wide and statewide PBS in Alabama. Sources
used for this review include relevant studies, theoretical articles, books, professional journals and
several reports related to positive behavior supports.
Purpose of Study
The purpose of this study was to investigate the relationship of school-wide positive
behavior supports to academic achievement in Alabama schools. This study compared the 2009–
2010, 2010–2011 and 2011–2012 fourth grade Alabama Reading and Math Test (ARMT) scores
of four school districts in Alabama that have implemented Positive Behavior Support (PBS) to
four non-PBS school districts in Alabama. The study examined the ARMT scores of the four
PBS school districts, to determine if implementing PBS contributed to a change in the ARMT
scores. Demographic data were examined at the local district level for eight schools in the State
of Alabama. Districts that have fully implemented PBS included all schools within the district
that were trained in Tier I PBS and implemented PBS. Then, based on seven indicators, each
school district was paired with a similar non-PBS school district. The total number of Alabama
school districts totaled 131; the non-PBS schools totaled 115 schools that had not implemented

15
PBS prior to the 2009–2010 school year. The districts were matched based on geographic
category rural, large urban city, number of schools, number of students, amount spent per
student on instruction, student/teacher ratio, number of English language learners (ELL), and the
racial make-up of the total population under 18. The racial categories were White, Black,
Hispanic or Latino, American Indian or Alaska native, Asian, and Hawaiian or other Pacific
Islander.
Research Questions
The study was guided by the following research questions:
1. What are the demographic characteristics of the four PBS and four non-PBS
school districts in Alabama?
2. What are the differences between reading achievement scores among the PBS and
non-PBS school districts in Alabama?
3. What are the differences between math achievement scores among the PBS and
non-PBS school districts in Alabama?
4. What are the differences in reading achievement scores among the PBS and non-
PBS school districts in relation to the number of years of implementation of positive behavior
supports?
5. What are the differences in math achievement scores among the PBS and non-
PBS school districts in relation to the number of years of implementation of positive behavior
supports?
Origins of Discipline Practices in Public Education
Cremin (1970, 1988) reported that disrespectful and rowdy behavior of students has been
tracked as far back as the colonial days, proving that educators have always had to deal with

16
troubling students. The dramatic difference of behavior now and behavior then is the severity of
behaviors, the social problems facing children, families, and schools, and more importantly, the
ways that schools and professionals have viewed the problems (Danforth & Smith, 2005).
Prior to the 1900s, American schools applied Protestant morality in forging the
immigrant child into a civilized citizen – work ethic, religion and civility. Early public schools
were founded by political leaders for the purpose of educating young children with values and
beliefs of democracy. Nelson, Palonsky and McCarthy (2004) described that with the birth of
the Industrial Revolution, parents and children spent more time away from each other and their
homes. As a result, the family was unable to carry out all of its functions (i.e., basic social skills
training for school success, appropriate peer interaction, complying with authority figures and
staying on task). Therefore, schools supported families that were viewed as incapable of
correctly raising children and provided needed moral correction and behavioral skills in an
educational environment (Danforth & Smith, 2005; Nelson et al., 2004).
Danforth and Smith (2005) noted that by 1900:
the United States changed from a primarily agricultural country into a world industrial
power. The American population was transforming into a modern form that united
industrial production and urban living, including eastern and southern European
immigrants, as well as, Americans, from farming communities. These areas in New York
and Chicago became known as the urban ghettos. These urban ghettos became the
reservoir of the industrial workforce, and the public schools faced enormous challenges
educating the children of the immigrants. (p. 15)
Realizing the delinquent youth were primarily immigrants coping with the social prejudices,
unjust laws, and economic inequalities, government officials and the public became concerned.

17
Industrialization brought about these new series of social concerns, including disease, crime, and
poverty, and the birth of juvenile delinquency (Danforth & Smith, 2005). With the view of the
child as deficient, helping professions flourished and the initial intervention efforts for
delinquency was geared to social reform, but after 1915 that effort drastically shifted from social
and political inequalities toward viewing the child as evidencing a defective character
(Provasnik, 2006).
History of Positive Behavior Support
Positive Behavior Supports is rooted in the field of behaviorism, a term coined by John
Watson (Kendler, 1987). However, research on the manipulation of behavior began much
earlier, with the work of classical conditioning by Ivan Pavlov. Additionally, the research work
of B. F. Skinner (1938) on behavior reinforcement gave rise to the field of behaviorism.
According to Skinner, the most critical factor in controlling behavior lies in arranging
appropriate reinforcement contingencies in the environment. Skinner’s work concerning
reinforcement and related factors has been evident even in behavior management (Slavin, 2003).
The early work of Pavlov, Skinner, Thorndike and Watson in behaviorism was critical to the
development of the field of Applied Behavior Analysis (ABA) (Sugai & Horner, 2002a). ABA
is grounded in the understanding and improvement of socially significant human behavior, and
uses direct intervention practices that are mirrored in PBS: positive reinforcement, stimulus
control, antecedent manipulations and contingency management (Dunlap, 2006).
Dunlap and Horner (2006) reported that Applied Behavior Analysis (ABA) was
established in the 1960s as a science to produce socially important changes in behavior. Positive
Behavior Supports (PBS) emerged in the 1980s as a strategy for intervention and support,
borrowing concepts and methods from ABA and other disciplines. PBS became an approach for

18
understanding and addressing problem behavior, to enhance quality of life (QOL) and minimize
challenging behavior for individuals of all ages and abilities (Berkman & Meyer, 1988;
Donnellan, LaVigna, Negri-Shoultz & Fassbender, 1988; Donnellan, LaVigna, Zambito &
Thvedt 1985; Dunlap, Carr, Horner, Zarcone & Schwartz, 2008; Evans & Meyer, 1987; Horner,
Dunlap & Koegel, 1988; LaVigna & Donnellan, 1986). This practical approach for decreasing
problem behaviors materialized from the controversy surrounding the use of aversive
consequences with people identified with developmental disabilities (Lavigna & Donnellan,
1986; Lee, Sugai, & Horner, 1999); and concerns about problem behaviors in schools, such as,
fighting, violence, vandalism, truancy, lack of discipline, and drug use and efforts to improve
educational services and opportunities for students with disabilities (Sugai & Horner, 2002b).
The on-going debate about positive behavior support and its relation to applied behavior
analysis suggested that PBS was a new science, evolved from, and yet different than, ABA (Carr,
Dunlap, Horner, Koegel, Turnbull, & Sailor, 2002). It is commonly accepted that the origins of
PBS were clearly grounded in Applied Behavior Analysis (ABA). Baer, Wolf, and Risley
(1968) defined the systemic extension of the principles of operant psychology to problems and
issues of social importance. Brown, Michaels, Oliva and Woolf (2008) indicated the design,
implementation, and evaluation of environmental modifications produced socially significant
improvement in human behavior. The Normalization/Inclusion Movement suggested that people
with disabilities should live in the same settings as others and have access to the same types of
opportunities. Person-centered values embraced that humanistic values should be informed by,
not replaced by empiricism; which enhanced opportunities for choice and avoided the use of
strategies that dehumanized and degraded.

19
Dunlap and Horner (2006) and Risley (2003) viewed PBS as an opportunity to build upon
the ABA tradition by incorporating concepts and strategies from a variety of sources to address
issues and problems. Two major contributions from ABA to PBS include: (1) a conceptual
framework relevant to behavior change, and (2) a number of assessment and intervention
strategies. Chance (1998) and Miltenberger (1997, 2008) reported that with respect to concepts,
(setting event, establishing operations, stimulus control, generalization, and maintenance) ABA
served as a critical catalyst for the development of PBS. With respect to assessment strategies,
Carr (1977) and Iwata, Dorsey, Slifer, Bauman, and Richmond (1994) reported that ABA
originated functional analysis – an experimental method for determining motivation of a variety
of socially significant behavior – thus facilitating intervention planning, designed to change
behavior in a desirable direction. Regarding intervention strategies, ABA developed educational
methods for reducing problem behavior (Sulzer-Azaroff & Mayer, 1991). Although, PBS has
incorporated the elements of ABA, it has also developed beyond this parent discipline to assume
its own identity; its identity has been strongly influenced by conducting research and
interventions in natural community settings (Carr, 1977; Weiss, DelPizzo-Cheng, LaRue &
Sloman, 2009).
PBS interventions tend to focus on sustained behavior change within natural settings,
including the natural social systems in which individuals behave (Tincani, 2007). Although
advocates acknowledge the influence of ABA in the heritage of PBS, they argue that the
combined elements of PBS embrace a new science to reduce challenging behavior (Dunlap,
2006; Weiss et al., 2009).

20
Context and Need for School-wide Positive Behavior Support
Educators and schools across the nation face many difficult challenges: to provide safe
environments, which create safe school climates that support learning (Skiba, 2000), and allow
students to receive academic instruction and assessments. Academic instruction and assessment
are often overshadowed by the need to meet the behavioral and emotional needs of many
students. Searching for a solution to school disruptions and violence, many public schools have
adopted zero tolerance policies (Dinkes, Kemp, Baum, & Snyder, 2009) that mandate the
application of predetermined consequences for specific offenses, regardless of the circumstances,
discipline history, and age of the person involved (Stader, 2004).
The term ‘zero tolerance’ first received national attention in the 1980s, and referred to the
impounding of seagoing vessels for carrying any amount of drugs. In the 1990s, the language of
zero tolerance became widely adopted by many organizations, ranging from the environmental
pollution arena to education. Zero Tolerance language even became part of national policy with
the Gun-Free Schools Act of 1994 during President Clinton’s administration and again in the
1997 revision of the Individuals with Disabilities Act. Such policies assumed that by removing
the disruptive students from the school environment, school would be safer and more effective
for those remaining (Skiba, Rausch & Ritter, 2005). The use of suspension and expulsion, which
removes the student from academic instruction, continues to be the cornerstone of zero tolerance
policy (Skiba, 2000). This climate of fear has prevailed and has generated support for the more
punitive methods of school discipline.
Skiba and Peterson (2000) suggested that zero tolerance policies in schools have not met
the preliminary goals of maintaining school safety or improving student behavior, but instead has
been associated with a number of unintended consequences for students. The evidence of some

21
negative school outcomes associated with zero tolerance include lower achievement (Raffaele
Mendez, 2003: Rausch, Skiba & Simmons, 2005), higher rates of dropout (Bowditch, 1993;
Skiba et al., 2005), high rates of recidivism (Tobin, Sugai & Covin, 1996), and finally students
of color are disproportionality affected by zero tolerance without any evidence of higher rates of
misbehavior within the population (Skiba, Michael, Nardo, & Peterson, 2002)
The traditional discipline approaches (e.g. get tough, zero-tolerance policy, suspension or
expulsion) in schools still consist of reactive, exclusionary practices that often affect
disadvantaged and minority youth in much greater proportions than their counterparts (Cartledge
& Johnson, 2004; Gilliam, 2005; Jones, 2010; Kaufman, Jaser, Vaughan, Reynolds, Donato,
Bernard, & Hernandez-Brereton, 2010; Monroe, 2005; Skiba, Horner, Chung, Rausch, May, &
Tobin, 2011).
The overrepresentation of African American students in disciplinary exclusions has been
a persistent concern for many years. As early as the 1970s, more Black than White students have
received some sort of school disciplinary action (Civil Rights Project/Advancement Project,
2000; Cartledge & Johnson, 2004; Raffaele-Mendez & Knoff, 2003; Skiba et al., 2002; Stader,
2004; Zhang, Katsiyannis & Herbst, 2004). Some research studies provided evidence that Black
males were disciplined with greater frequency and severity than their White peers (Cartledge &
Johnson, 2004; Gregory, Skiba & Noguera, 2010; Gregory & Weinstein, 2008; Monroe, 2005).
Raffaele-Mendez and Knoff (2003) reported that Black students accounted for only a small
portion (17%) of the nation’s public school population, but also accounted for a higher
percentage (32%) of school suspensions.
Zhang et al., (2004) agreed that if African American students were being denied access to
learning opportunities due to disciplinary exclusions, they were at a greater risk of exclusion-

22
related consequences, such as retention, delinquency and drop-out. Unfortunately, the idea that
zero tolerance policies have contributed to improved student behavior or school safety remains
unsupported by any evidence (Noam et al., 2001; Skiba & Knesting 2001; Skiba & Peterson,
2000; Zhang et al., 2004). Although student behavior may result in suspension, it is more
affected by school-controlled factors, including administrative structure, teacher beliefs, and
biases (Christle et al., 2004).
Discipline policies for schools are usually set at the district level within the framework of
state and federal policy. However, the characteristics of a school are important factors in how
discipline policies are interpreted and implemented. Christle et al., (2004) studied suspension
rates in Kentucky middle schools and found that schools with low suspension rates used a variety
of successful incentive programs to promote positive academic and social behavior. The
aesthetics of the said schools were cleaner, brighter and had a more relaxed décor as opposed to
the schools that had high suspension rates. Teacher behavior in the low suspension rate schools
was more consistent on several variables; challenging students academically, setting high
expectations, and facilitating success. The schools with low suspension rates demonstrated
greater consistency than did schools with high suspension rates in their focus on positive,
proactive disciplinary measures rather than reactive, punitive strategies.
Raffaelle-Mendez, Knoff, and Ferron (2002) examined the relationship between school
demographic variables and out-of-school suspension rates and observed a number of trends.
First at the elementary level, schools with low suspension rates were more likely to use positive
reinforcement for desired behaviors as a formal component of a school-wide discipline plan than
were schools with high suspension rates. Next, schools with high suspension rates focused more
heavily on punishment for inappropriate behavior than did schools with low suspension rates.

23
Additionally, low suspension rate schools used school-wide social skills training to communicate
acceptable behavior. Finally, parental involvement was much more evident at low suspension
rate schools than high suspension rate schools. The variable at the middle school and high
school levels that characterized the major difference between schools with low suspension rates
and high suspension rates were staff training, parental involvement, and administrator’s beliefs
about how students should be treated to reduce problem behavior. Higher rates of training and
parental involvement were more evident in schools with low suspension rates than schools with
high suspension rates.
While it is imperative to analyze current school discipline practices and how many
students are suspended, Raffaele-Mendez and Knoff (2003) discussed other demographic
characteristics of schools, and the types of infractions that perpetuate the use of suspensions. By
understanding the data and the implications of the data, schools could attempt to address the
increase of disciplinary exclusions (Zhang et al., 2004) with a comprehensive, systemic and
sustained use of research validated practices found in school-wide systems of PBS (Safran &
Oswald, 2003; Sugai et al., 2000)
Newman (2004) and Yeo (1997) discussed the importance of formal education
preparation and how teacher preparation influences what teachers learn. Further they listed that
many teachers enter at-risk environments unprepared to teach at-risk students and most teachers
lacked the knowledge or training regarding severe behavioral issues. French et al., (2000)
concluded that the attitudes and behaviors of teachers significantly influence minority and at-risk
student achievement. Research suggests that student achievement is related to a complex
interaction of several factors: teacher quality is positively related to student achievement (Lasley,
Siedentop, & Yinger, 2006); teaching style is related to student achievement (Opendakken &

24
Van Damme, 2006); and using research-based best practice teaching strategies has also been
shown to increase student achievement (Kaplan & Owings, 2002). Additionally, school factors
also interact with teacher factors to make complex relationships affecting student achievement;
class size has continued to be a controversial topic in the research regarding its impact on student
achievement (Hattie, 2005); and the educational leadership of the school also indirectly impacts
student achievement (Heck, Lassen, & Marcoulides, 1990; Wahlstrom, Louis, Leithwood, &
Anderson, 2010). These studies also provided evidence and analyses to substantiate classroom
climate variables to support student achievement. Understanding classroom climate variables
will allow for professional development for teachers to focus on areas to increase student
achievement. Furthermore, understanding the importance of teachers and their impact on student
performance will help individuals at universities examine teacher preparation programs.
Teachers must come to the profession not only highly qualified but feeling prepared for what
they need to do in the classroom.
School discipline research suggested effective strategies for creating a safe school and
used discipline as a tool to teach acceptable behavior (Hamilton, 2008; Skiba & Peterson, 2000),
established procedures to ensure that disciplinary processes were fair and consistent (Kajs, 2006)
and involved restorative justice strategies that focused on restoring the harm caused by
wrongdoing (Amstutz & Mullett, 2005; Morrison, Blood & Thorsborne, 2005). This
reconceptualized approach to school discipline requires that schools change from an
authoritarian model to an inclusive model with youth and relationships as the focal point of the
school community (Varnham, 2005). Utilizing restorative justice in school disciplinary matters
may also allow school administrators to develop a problem solving approach to student behavior
and may serve as an alternative to zero tolerance policies (Morrison et al., 2004). Ultimately,
25
teaching appropriate behavior may be a powerful strategy for improving student behavior,
creating a safe school environment, and attending to the developmental needs of youth.
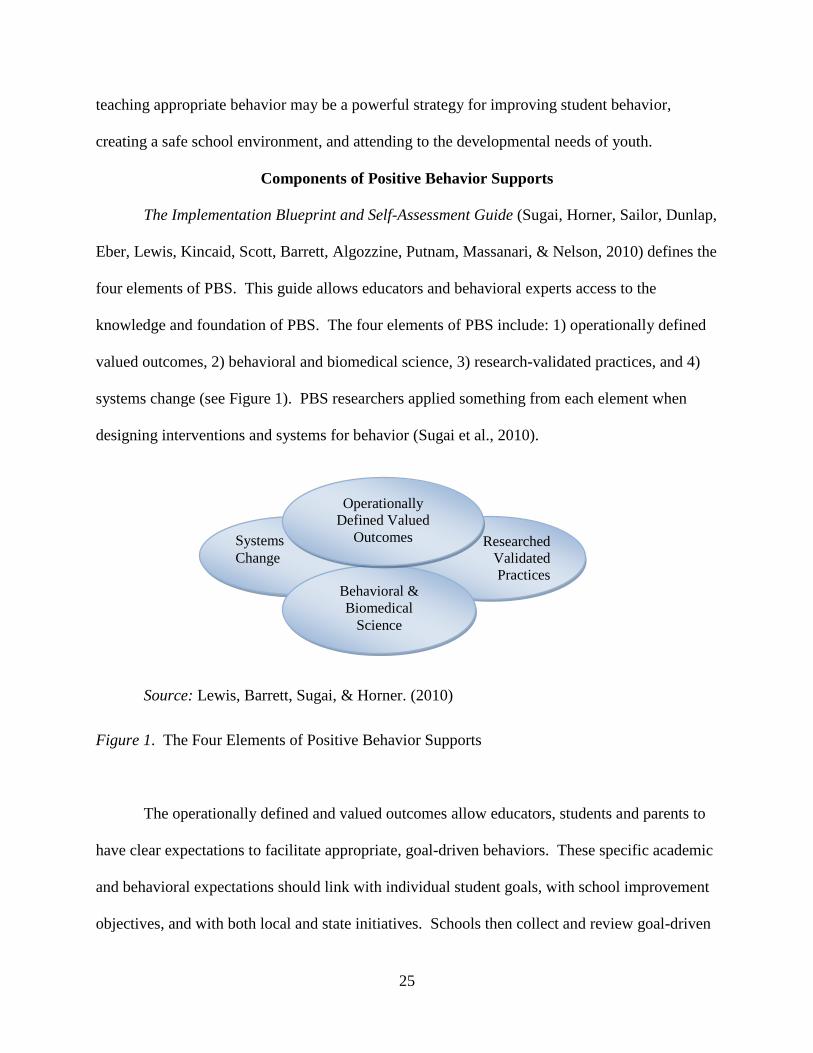
Components of Positive Behavior Supports
The Implementation Blueprint and Self-Assessment Guide (Sugai, Horner, Sailor, Dunlap,
Eber, Lewis, Kincaid, Scott, Barrett, Algozzine, Putnam, Massanari, & Nelson, 2010) defines the
four elements of PBS. This guide allows educators and behavioral experts access to the
knowledge and foundation of PBS. The four elements of PBS include: 1) operationally defined
valued outcomes, 2) behavioral and biomedical science, 3) research-validated practices, and 4)
systems change (see Figure 1). PBS researchers applied something from each element when
designing interventions and systems for behavior (Sugai et al., 2010).
Source: Lewis, Barrett, Sugai, & Horner. (2010)
Figure 1. The Four Elements of Positive Behavior Supports
The operationally defined and valued outcomes allow educators, students and parents to
have clear expectations to facilitate appropriate, goal-driven behaviors. These specific academic
and behavioral expectations should link with individual student goals, with school improvement
objectives, and with both local and state initiatives. Schools then collect and review goal-driven
Researched
Validated
Practices
Systems
Change
Behavioral &
Biomedical
Science
Operationally
Defined Valued
Outcomes

26
data for evaluation and modifications to the existing PBS system, when needed (Cohen, Kincaid,
& Childs, 2007; Horner, Sugai, Eber, & Lewandowski, 2004b; Irvin et al., 2004; Irvin et al.,
2006; Safran, 2006). An example: a high school PBS team reviews the school disciplinary data
and discovers an incidence of office referrals related to tardiness between class changes. The
goal of the team is to reduce tardiness between classes by a certain percentage by a designated
time period. With the goal in mind, educators should allow time for students to have a
demonstration of appropriate behavior during class change time, and then allow students the
opportunity to practice the appropriate behavior, and the opportunity to display the appropriate
behavior during a trial time period. The demonstrations could include such behaviors as
practicing opening combination lockers, having a quick conversation with a friend, and moving
with a purpose. Behavioral expectations would be posted in the halls. Also, teachers are present
in the halls between classes to reward and remind students, and discourage behavior that would
keep students from being on time (i.e. standing around talking with peers for extended time,
horse play, etc.). At the midpoint timeline, the school administrators along with the PBS team
examine the same data points as before regarding office referrals and tardiness. The data check
indicates if the intervention is being effective regarding the office referrals and tardiness issue.
The data discovery should be shared with the entire faculty and staff, either to reward staff or to
have input regarding modifications to the intervention.
The second PBS element addresses research in the fields of behavioral and biomedical
science. From this research, the designers of PBS systems learned the following major relevant
factors of behavior (see Figure 2):
1. Humans learn behaviors. Therefore, behaviors can be taught and reshaped (Lane,
Wehby, Menzies, Doukas, Munton, & Gregg, 2003; Lee, 2010; Sailor & Paul, 2004).

27
People learn behaviors from the environment that assist them in getting what they
want or to get them out of situations they do not like. The approach for teaching
behavior is the same as teaching math or reading.
2. Behavior follows laws, which makes it predictable. Therefore, it can be anticipated
with reasonable accuracy (Chandler & Dahlquist, 2002; McLaren & Nelson, 2009;
Scott & Caron, 2006). Educators have the ability to anticipate the behaviors of
students if they recognize the patterns. For example, if they have observed a student
balling up their paper and throwing it to the ground whenever they receive a math
worksheet, they can anticipate that this behavior will continue unless a different
action is taken (i.e., student receives one-on-one instruction when a math assignment
is given).
3. The biophysical characteristics of an individual influence how that person reacts to
environmental events (Carr et al., 2002; Chandler & Dahlquist, 2002; Turnbull,
Stowe, & Huerta, 2007). Someone with Attention Deficit Hyperactivity Disorder
(ADHD) will most likely react differently to a stimulus than someone without this
disorder. Therefore, creating an appropriate classroom environment, or working with
a student to cope with environments they cannot change would constitute an
appropriate accommodation and service intervention.
4. Understandably then, school environmental variables play a vast role in supporting all
students, especially those with mental health issues (Carter & Horner, 2009; McLaren
& Nelson, 2009; Turnbull et al., 2007). The key to this statement is drilling down to
understand how the environment affects students. For example, a common
behavioral technique that teachers use is to move the class clown to the front of the

28
room to be closer. The idea is that the teacher will be able to keep an eye on that
student to correct undesirable behavior. This intervention does not take into account
the motivation for the disruptive behavior. If the student is using his behavior to gain
attention from his classmates, then moving him from the back to the front gives him
the entire class as an audience. However, if a student is misbehaving because she is
easily distracted, then sitting her in the back of the class gives her an entire room of
classmates to draw her attention away from the task at hand. Again, the key is to
know the student’s motivation.
5. Therefore, evaluating and shaping environments can affect behavioral reactions (Carr
& Sailor, 1994; Sailor, Stowe, Turnbull, & Kleinhammer-Tramill, 2007). School
administrators should break-up their office referral data by area, they should examine
data to discover if specific physical locations were more susceptible to inappropriate
behavior. If so, the PBS team should gather information to see what might be done to
make a positive change. For example, if a school faces a park and the data show that
there are more office referrals from the classrooms that face that park, the teachers in
those classrooms might want to try window coverings. After a predetermined time
period all data should be examined again for effectiveness of the intervention.
6. Gathering and using behavioral data for decision making is crucial to continuous
improvement in the PBS interventions, programs and systems abilities (Chandler &
Dahlquist, 2002; Hirsch, Lewis-Palmer, Sugai, & Schnacker, 2004; Winkel, Saegert,
& Evans, 2009). Based on the examples already given, this statement goes without
saying. However, in the example above, the situation called for analysis of area
office referrals, but many schools chose to go farther. They looked at referrals by
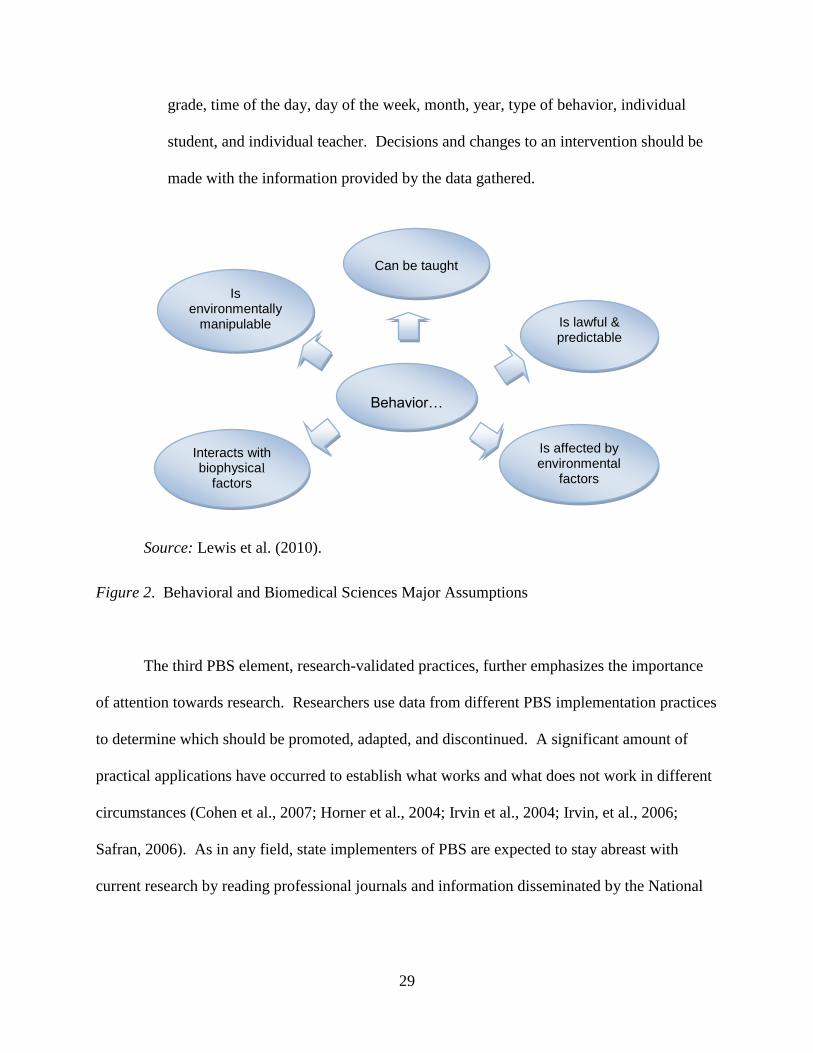
29
grade, time of the day, day of the week, month, year, type of behavior, individual
student, and individual teacher. Decisions and changes to an intervention should be
made with the information provided by the data gathered.
Source: Lewis et al. (2010).
Figure 2. Behavioral and Biomedical Sciences Major Assumptions
The third PBS element, research-validated practices, further emphasizes the importance
of attention towards research. Researchers use data from different PBS implementation practices
to determine which should be promoted, adapted, and discontinued. A significant amount of
practical applications have occurred to establish what works and what does not work in different
circumstances (Cohen et al., 2007; Horner et al., 2004; Irvin et al., 2004; Irvin, et al., 2006;
Safran, 2006). As in any field, state implementers of PBS are expected to stay abreast with
current research by reading professional journals and information disseminated by the National
Behavior…
Is affected by environmental
factors
Interacts with biophysical
factors
Can be taught
Is lawful & predictable
Is environmentally
manipulable
30
Center of PBIS, attending professional conferences and interacting with their assigned PBIS
Center Resource Agent to discuss current practices within their state.
The fourth PBS element deals with systems change. Successful large-scale
implementation of PBS creates major change within the classroom, the school, the school district
and at the state level. Additionally, PBS allows administrators and internal personnel to shape
their behavioral interventions to address their specific needs; this reduces the amount of
professional resistance that can occur. After all, the PBS system in an inner-city high school of
3,000 students will look different than the system working at a rural elementary school of 300
students (Edmonson & Sailor, 2000; Lassen et al., 2006; Lawson & Sailor, 2000; Sailor et al.,
2007; Sugai et al., 2010; Utley & Sailor, 2002). Sugai et al. (2010) agreed that behavioral
interventions are chosen by a specialist to fit individual school environments and students (i.e.,
math instruction looks different at an elementary school than a high school).
Four Philosophical Ideals of Positive Behavior Supports
The National Center on PBIS (Sugai et al., 2010), indicated that there are four
philosophical ideals that influence the formation of PBS implementation practices. These ideals
include the Three-Tiered Approach to Prevention/Continuum of Support, Instructional Emphasis,
Functional Perspective, and Sustainability Priority (Sugai et al., 2010).
Three-Tiered Approach to Prevention/Continuum of Support
The three-tiered approach to prevention, most commonly known as the triangle, is the
most recognizable figure linked with Positive Behavior Supports. Figure 3, the triangle,
represents the relationship of behavior and academics. A comprehensive amount of research
contributed to the formation of this three-tiered approach (Sugai et al., 2000; Walker, Horner,
Sugai, Bullis, Sprague, Bricker, & Kaufman, 1996). Each tier represents a level of services

31
available to students; many educators have discovered that a student will likely receive a range
of services from each tier and the student would not likely remain in the same tier for the
duration of all services.
Source: Lewis et al. (2010).
Figure 3. Integration of Academic and Social Behavior Three-Tiered Continuum of Behavior
Support.
Tier One or the Primary Tier, focuses on universal interventions. The universal behavior
support system of services focuses on the prevention of problem behaviors for all students.
Schools focus on prevention by creating an environment that promotes desirable behavior,
teaching social skills, rewarding positive behavior and responding to undesirable behavior
(Horner, 2007; Simonsen, Myers, & Briere, 2011). During this stage of support, students gain

32
knowledge of the behavioral expectations of the school, the reward system for appropriate
behavior and the continuum of consequences for problem behavior. Additionally during the
universal stage, data collection occurs for decision-making (Lewis et al., 2010). The three-tiered
triangle shows that 80 to 90 percent of all students respond to the universal interventions of
supports.
Tier Two, or the Secondary Tier, focuses on targeted levels of support for students at risk
of succeeding without additional support (Horner, 2007; Simonsen et al., 2011). Tier Two
services aid school personnel in reducing existing problem behaviors with immediate and
effective responses with at-risk students and/or group interventions. Tier Two components
include universal screening, collecting and using data for decision-making and progress
monitoring for at risk students. This second level of interventions serves to increase structure
and predictability by increasing contingent adult feedback, linking academic and behavioral
performance and increasing home/school communication (Lewis et al., 2010).
One commonly used Tier Two intervention is check-in/checkout (CICO) (Simonsen et
al., 2011). Todd, Campbell, Meyer, and Horner (2008) detailed that using CICO the student
typically checks-in with a school faculty or staff member in the morning. The faculty or staff
member would be someone trustworthy to the student. The faculty or staff member and student
would then discuss personal goals for the day; then, as the student ventures through the day, the
student would receive written feedback from each of his/her teachers. At the end of the day, the
student would check-out with his designated person by reviewing and discussing the feedback
received from other faculty/staff. The benefits of this program are that:
…it can provide (a) structure and prompts that a student needs through the day, (b) adult
written feedback through the day, (c) visual reminders of personal goals for the day, (d)

33
data collection, and (e) communication between adults at school and home. (Todd et al.,
2008, p. 47)
Single-subject experiments revealed decreases in the frequency of problem behaviors with
students who participated in CICO (Fairbanks, Sugai, Guardino, & Lathrop, 2007; Hawken,
2006; Hawken, MacLeod, & Rawlings, 2007; Todd et al., 2008), especially students whose
behavior functioned to gain positive attention (McIntosh, Campbell, Carter, & Dickey, 2009).
The triangle shows that five to ten percent of at-risk students redirect with Tier Two
interventions.
Tier Three, or the Tertiary Tier, focuses on individualized intensive wraparound
interventions that integrate school, family and community resources (Simonsen et al., 2011) for
one to five percent of students. Tier Three interventions focus on individual students with
behavior that may be intense, such as acts of violence or aggression towards other students or
teachers (Chen & Astor, 2009; Henry, 2009; Jones, Bradshaw, Haynie, Simons-Morton, Gielen
& Cheng, 2009). The National PBIS Center developed a list of Tier Three components, which
include:
1. Functional Behavioral Assessments;
2. Team based comprehensive assessments;
3. Linking of academic and behavior supports, individualized intervention based on
assessment information focusing on (a) prevention of problem contexts; (b)
instruction on functionally equivalent skills, and instruction on desired performance
skills; (c) strategies for placing problem behavior on extinction; (d) strategies for
enhancing contingence reward of desired behavior; and (e) use of negative or safety
consequences if needed; and

34
4. Collection and use of data for decision-making. (Lewis et al., (2010), p. 25)
Further explanation of functional behavioral assessments, team based comprehensive
assessments and the collection and use of data for decision-making follows below. B. F. Skinner
(1938) examined the need to functionally assess behaviors, he wrote the following:
Once in possession of a set of terms we may proceed to a kind of description of behavior
by giving a running account of a sample of behaviors as it unfolds itself in some frame of
reference. This is a typical method in natural history.… It may be classified as a
narration.… From data obtained in this way it is possible to classify different kinds of
behavior and to determine relative frequencies of occurrence. But although this is,
properly speaking, a description of behavior, it is not a science in the accepted sense.
We need to go beyond mere observation to a study of functional relationships. We need
to establish laws by virtue of which we may predict behavior, and we may do this only
by finding variables of which behavior is a function. (p. 8)
Skinner discussed the inadequacy of simply describing and classifying a behavior. To effect
positive and significant change, one must understand the functional relationship between the
environment and behavior.
Steege and Watson (2009) defined a Functional Behavioral Assessment (FBA) as:
…an investigative process that results in an understanding of why behaviors occur. More
formally, FBA is a set of assessment procedures that result in the identification and
description of the relationships between the unique characteristics of the individual and
the contextual variables that trigger, motivate, and reinforce behavior. The FBA is used
as the basis for designing individually tailored interventions. (p. 7)

35
The above definition states that conducting an FBA is an investigative process; therefore, school
personnel would not be expected to conduct an FBA without proper training and/or guidance.
FBAs contain data collection of an individual student’s behavior that may include when the
behavior occurred, where it occurred, the duration of behavior, what precipitated the behavior,
the staff’s response, and the student’s response to the staff’s response. The decision of when to
conduct an FBA, based on the severity or frequency of a behavior, is up to the team in charge of
FBAs. This team may be the IEP team, PBS Team or the Problem Solving Team. The team
should have criteria in place to prompt an FBA (i.e., a certain number of incidents of the same
behavior or a behavior that has been categorized as severe). The person conducting an FBA
should be a person involved in the behavior (i.e., the classroom teacher, school counselor)
(Steege & Watson, 2009).
Team based comprehensive assessments and the collection and use of data for decision-
making refers to the evaluation of a student using multiple sources of relevant information
(Steege & Watson, 2009). Lane, Kalberg, Parks, and Carter (2008) pointed out that the team, as
in the case of a PBS team, is made up of members that the principal has assembled. These
usually include the principal, assistant principal in charge of disciple, a counselor, a general
education teacher, a special education teacher and a staff member. The team decides what data is
relevant, depending on the issue; the team may choose to look at a student’s grades, IQ scores, an
observation log of a certain behavior, medical records, results of certain tests conducted, an
interview of the student, or teacher or parent. They use the reviewed information to get a
comprehensive depiction of the needs of the student (Lane et al., 2008).
Some educators may feel overwhelmed with all that is involved in providing services at
Tier Two and Three. However, 50 percent of a school’s office discipline referrals are six to nine

36
percent of the same students (Barrett, Katsiyannis, & Zhang, 2009; Sprague, Golly, Bernstein,
Munrkes, & March, 1999; Sugai, et al., 2000). Therefore, providing services to these students
not only benefits the student, but also reduces the amount of time teachers and administrators
spend on disciplinary actions.
Generally, the preventive approach of the three-tiered model requires specific actions to
be effective. Schools must remove and add certain practices, change their environment and teach
social skills. Schools must remove factors, such as certain teacher behaviors, that provoke
problem behaviors and undesirable intervention practices. An example is a teacher who sits at
her desk, while students work on an assignment, and only pays attention to those misbehaving.
Though difficult to believe, some children prefer negative attention as opposed to no attention at
all (Hendley, 2007).
Subsequently, schools must add factors, again such as certain teacher behaviors, that
provoke appropriate behaviors and desirable intervention practices (Glasser, 1998; Sutherland,
Lewis-Palmer, Stichter, & Morgan, 2008). In a similar example, a teacher walks among rows
and verbally praises students who are on-task. This example demonstrates a practice which
encourages the continuation of a desired behavior – being on-task – with the positive reinforcer
of verbal praise.
Removing consequences that maintain and strengthen the frequency of inappropriate
behaviors and undesirable intervention practices can be difficult. Many teachers fall into the trap
of a verbal back-and-forth with a student after a disruptive behavior, which continues to disrupt
the class. A better solution, if possible, is to address the student after class when he has no
audience (Hendley, 2007; Kerr & Nelson, 2002).
37
Adding positive consequences that maintain and strengthen the frequency of appropriate
behaviors and desirable intervention practices is ideal. If a student is helpful to a classmate
without being asked, public verbal praise and extra computer time increase the likelihood she,
and others, will demonstrate similar behaviors (Hendley, 2007; Kerr & Nelson 2002; Sailor &
Roger, 2005; Utley & Sailor, 2002).
Positive Behavior Support clearly promotes positive interactions between school
personnel and students. However, that does not mean that there are no consequences when an
inappropriate behavior occurs. Hendley (2007) cautions that educators must set consequences;
in addition to clearly understanding what behaviors are expected of them, students must also be
completely aware of the consequences when an infraction does occur. Unfortunately, the
inappropriate use of consequences can result in negative outcomes. Consequences must be
consistent; students should not earn a timeout for talking out of turn, and the next month receive
an office discipline referral for the same infraction. Consequences should also promote
emotional safety (Glasser, 1998). Teachers should avoid the use of sarcasm or humiliation
tactics when imposing consequences; these actions do not promote emotional safety (Hendley,
2007).
The ideal PBS school strives to create an environment that maximizes opportunities to
teach and practice appropriate behaviors and desirable intervention practices which include clear
displays of expected behaviors throughout the school (e.g., written rules, reward/
acknowledgement systems, the system some call Caught Being Good). In this system school
personnel give rewards randomly when they see a student demonstrating a desirable behavior
(Hendley, 2007; Sailor et al., 2007).
38
Teaching social skills and behavioral expectations that lead to desired behaviors is also a
preventive approach. Just as educators teach academic skills, they must also teach some students
appropriate behavioral skills, such as social skills. If children misbehave they are sometimes
seen as bad, instead of lacking a skill that must be taught. For that reason, educators must
reexamine their notions about behaviors, and then teach what they want to see from their
students (Dunlap, Iovannone, Wilson, Kincaid & Strain, 2010; Knoff, 2001).
Instructional Emphasis
The second philosophical ideal that influences the formation of PBS implementation
practices is Instructional Emphasis, which is teaching social skills and functional replacement
behaviors; this practice will reduce problematic behaviors (Dunlap et al., 2010; Kame’enui &
Darch, 2004; Kerr & Nelson, 2002; Knoff, 2001). Part of this Instructional Emphasis relies on
schools defining, teaching and encouraging behavioral expectations. At-risk students are
targeted for active, often pre-defined curricula of core skills, whereas high-risk students receive
specific individualized social skill instruction based on their functional behavioral assessment.
Functional Perspective
The third philosophical ideal that influences the formation of PBS implementation
practices is Functional Perspective (Dunlap et al., 2010; Ruble & Akshoomoff, 2010). The
Alabama Positive Beahvior Support Center (n.d) warned that while function-based behavior
support planning may seem simple, the intensity and complexity of a behavior by a student may
call for complex planning on the part of experts who know the child and desire to serve in the
best interest of the child. The National PBIS Center listed examples of these type of behaviors:
1. Behaviors that are low frequency but high intensity (e.g., vandalism, fighting, running
away).

39
2. Behaviors that have multiple functions (e.g., profanity is used in one situation for
accessing attention and in another situation to avoid attention).
3. Large and multiple response classes of problem behaviors (e.g., profanity, hitting,
stealing, crying, and biting are used to access peer attention).
4. Behaviors that are covert and difficult to observe (e.g., drug/tobacco use, stealing,
cheating, and lying).
5. Behaviors that are situation-specific (e.g., profanity is observed when a particular
teacher corrects the student, but not with other teachers, or in other situations).
6. Behaviors that have a long history (e.g., early antisocial behaviors). (Sugai & Horner,
2002b)
Source: Lewis et al. (2010).
Figure 4. Individualized Behavior Support Elements
The Functional Perspective approach uses positive and negative reinforcers to promote
changes in both behavior and individual student behavioral intervention plans. Crone and

40
Horner (2003) discussed the principles behind positive and negative reinforcers (see Figure 5).
Positive reinforcers increase the likelihood of a certain behavior by adding a stimulus (Chiu, &
Deldin, 2007; Hayward & Low, 2007). Walker, Shea, and Bauer (2007) define positive
reinforcement as the “presentation of a desirable reinforcer after the behavior has been
exhibited” (p. 342). It is the “process of reinforcing a target behavior in order to increase the
probability that the behavior will recur” (p. 342). The token system is a great example; a child
demonstrates a desirable behavior and he receives some type of token that can be exchanged for
something the child wants. Negative reinforcers increase the likelihood of a certain behavior by
subtracting a stimulus (Fisher, Adelinis, Volkert, Keeney, Neidert & Hovanetz, 2005;
Kobayashi, Nomoto, Watanabe, Hikosaka, Schultz, & Sakagami, 2006; Sitaraman, Zars, & Zars,
2007). Walker et al. (2007) defined negative reinforcement as “the strengthening of a behavior
as a consequence of the removal of an already operating aversive stimulus” (p. 342). An
example would be decreasing the number of math problems in a homework assignment for
staying on-task through the math lesson.

41
Source: Lewis et al. (2010).
Figure 5. Two Basic Functions of Positive and Negative Reinforcers
Sustainability Priority
The fourth and final philosophical ideal that influences the formation of PBS
implementation practices is Sustainability Priority (McIntosh et al., 2010; Stormont et al., 2010;
Sugai et al., 2000). The Sustainability Priority emphasizes small change, multiple approaches,
and use of data.
Sustainability of any new intervention greatly increases when a school enacts the smallest
amount of change possible to still obtain maximum effects. As some people are resistant to
change, this will most likely lead to cooperation in implementation (Sugai et al., 2007).
Sustainability also increases when multiple approaches are considered to solving a specific
42
problem. Taylor (2003) discussed the need to examine certain factors when considering different
interventions to solve a problem like maladaptive behaviors. School administrators should (a)
conduct a formal assessment to ensure a new intervention will not overlap or interfere with
current initiatives, (b) gain evidence that an intervention is relevant and effective, (c) insure that
an intervention is well defined and the outcome indicators are relevant, and (d) implement
mechanisms that will assess and evaluate the fidelity of an intervention (Taylor, 2003).
New programs can lack sustainability, because conditions in education constantly change
due to alterations in priorities and resources (Coburn, 2003). Latham (1988) reported that any
school reform has two to three years before any new initiative is added or will replace the
existing school reform plan. Therefore, collecting and using data to make informed decisions
increase the likelihood that a successful program will last (McIntosh et al., 2010). Additionally,
PBS must be implemented with fidelity to ensure successful sustainability (Sugai et al., 2010).
To further the discussion on sustainability, Datnow (2005) discussed the sustainability of
school-level comprehensive school reform (CSR) models. Like PBS, CSR models target whole-
school change, focus on student achievement, require a new understanding about the
expectations educators have of their students and emphasize prevention as opposed to
remediation. CSR models are particularly vulnerable due to the involvement of the state in
educational policy connected to standards and accountability, and the high turnover rate among
district-level superintendents. Therefore, Datnow conducted a study to examine 13 schools that
were implementing CSR models. Several indicators were found which assisted or hindered the
sustainability of their initiatives. They included:
1. Initiatives were sustained if they “helped educators meet new local district and state
demands, or at least did not conflict with them.” (p. 146)

43
2. Initiatives were sustained if they had the “ability to adapt to local circumstances.” (p.
146)
3. Initiatives were not sustained if they “require substantial funding to initiate,
implement, and sustain over time.” (p. 147)
4. Initiatives were sustained if they established “a stable resource base that could last
through leadership and political changes…” (p. 147)
5. Initiatives were not sustained when low performing schools faced high state
accountability demands. In these cases the schools abandoned the reform “in favor of
test preparation.” (p. 147)
Datnow (2005) also stressed the need for policy makers to be aware of how their decisions affect
CSR models before implementation.
Successful Implementation Assumptions and Solutions
Before sustainability can take place, successful implementations must occur. To achieve
successful large-scale implementation of Positive Behavior Supports, the PBIS Center (Sugai et
al., 2010) indicated that there are seven important assumptions and solutions that must be
addressed. They include the following:
1. PBS must be implemented with high accuracy for maximum effectiveness. In other
words, school personnel must be trained in the evidence-based practices of this
behavioral framework and implement PBS with fidelity.
2. The PBS system put in place must be sustainable to affect meaningful change and
improvement in behavior.
3. PBS must be in place at a school for five to ten years for maximum effectiveness to
be observed.

44
4. Implementation must be delivered by trained personnel.
5. Outcome data must be used to make decisions, changes and continuation of PBS.
6. Implementation will require consideration and modification for individual school and
community needs.
7. PBS systems must be created so that they are achievable and sustainable. (Sugai et
al., 2010)
Systems Approach
Many school systems employ a train-and-hope approach, even though Stokes and Baer
(1977) condemned this type of training over three decades ago. Stokes and Baer (1977)
indicated that a school starts with a problem that is difficult to solve. Then they identify an
expert in the area of the quandary. The expert comes to provide training to the administration
and faculty and leaves with the hope that they will now have the expertise to solve their own
problem. However, because the school personnel lack supports and capacity, the intervention is
not implemented correctly. Additionally, no further training, resources or policies are put in
place to support the change. The truly interesting aspect of this phenomenon is that when the
next challenge arises that the school cannot solve on their own, they employ the same train-and-
hope method as before (Horner, 2003; Stokes & Baer, 1977; Sugai et al., 2010).
Horner (2003) explained that the fundamental problem with the train-and-hope approach
is that the individuals of the school are left to their own devices to implement the intervention in
question. The systems approach, an essential aspect of PBS, considers the school as a unit.
Horner believes the collective actions of each member of the school, characterize that institution.
However, he does recognize that the institution does not engage in behaviors; individuals within

45
the organization produce behaviors. To achieve successful implementation, the individuals
within a school must act together to achieve a common goal (Horner, 2003).
Sugai et al. (2010) reported that the PBS systems approach relies on four different
elements. These elements encourage an interactive and self-monitoring process that leads to
correction and improvement. These elements include outcomes, practices, data, and systems (see
Figure 6). Outcomes consist of academic and behavioral targets sanctioned by students and their
families and school personnel. The practices put into place are evidence-based strategies. Data
provides information to identify progress, or lack thereof, needed for an alteration of the system
and the overall effects of the intervention. Lastly, systems are the policies and procedures
developed to support accurate and sustainable implementation of PBS (Sugai et al., 2010).
Source: Lewis et al. (2010).
Figure 6. Social Competence and Academic Achievement in Evidence-Based Practice

46
Implementation Levels
The systems approach of PBS (Sugai et al., 2010) relies on several implementation levels
of support. These levels include individual student, classroom, school-wide, district, community
and state (Sugai et al., 2010).
Source: Lewis et al. (2010).
Figure 7. Positive Behavior Support Implementation Levels
Individual Students
Individual students who do not respond to the primary and secondary school-wide
positive behavior support (SWPBS) interventions receive individualized and intensive behavioral
plans created from their functional-based behavior assessment results. These plans are based on
individual students’ behavioral data, which is most often observational data collected by their
teachers (Chandler & Dahlquist, 2002).
Classrooms
Classrooms provide support by giving students clear expectations on routines, structures
and appropriate behaviors. Routines, such as a repetitive daily schedule, allow students the
comfort of knowing what subject to prepare for at the conclusion of an activity. Structures can
address classroom management problems (Crone & Horner, 2003), such as leaving personal

47
items in inappropriate places around the room. For young children, each student may have their
own cubby area so each student is conscious to where personal belongings should be contained
when entering the classroom. PBS also provides clear expectations on appropriate behaviors;
school administrators, faculty and staff are trained to create classroom rules and post them at the
beginning of the year. These rules can even be created with students to stimulate student
cooperation; then teachers should discuss each rule with the students to reassure clear
understanding of classroom expectations (Crone & Horner, 2003).
School-wide
As in the classroom, students and staff are aware of school-wide behavioral expectations
across all school settings through a proactive approach at the start of and throughout each school
year, instead of being punished as behaviors occur. PBS suggests being proactive with students
regarding expected behaviors initially and consistently. Many behavioral problems occur outside
the classrooms, such as in the halls, playground, lunchroom or gymnasium. Students need to
know what behaviors are expected of them in these settings, as well. Transition periods, moving
from one class to another, produce a great deal of problem behaviors. These behaviors can be
lessened with clear expectations (Edmonson & Sailor, 2000). Therefore, students should be
taught behavioral expectations during transitions in the hall. Like hallway transitions, outdoor
activities such as recess can promote many behavioral problems (Crone & Horner, 2003). Knoff
(2005) promotes teaching social skills to support appropriate behaviors. One such skill is
waiting for a turn. Children cannot be expected to just automatically know how to be patient.
Students must be taught this skill (Knoff, 2005).

48
Districts
Districts support their individual schools with leadership and implementation resources.
Leadership support is important to the success of a new intervention. The district superintendent
serves as the leader at this level; consequently, PBS technical assistance providers greatly
encourage superintendent support before trainers enter schools in a district (Handler, Rey,
Connell, Thier, Feinberg, & Putnam, 2007).
Districts also support their individual schools with implementation resources. These
resources are outlined in the PBS Implementation Self-Assessment and Planning Tool document,
developed by the PBIS Center, Sugai et al. (2010), and used at the state level. The 36 features in
this document are similar at the district and state level and will be discussed in the next section
on state implementation.
States
The PBIS Center (Sugai et al., 2010) developed a checklist of items that educational
leaders at the state and district level need to implement, support and sustain PBS. This checklist
is called the PBS Implementation Self-Assessment and Planning Tool. This document is split
into ten categories: leadership team, funding, visibility, political support, policy, training
capacity, coaching capacity, evaluation capacity, behavioral expertise, and school/district
demonstrations. These categories also make-up the PBS Organizational Logic Model (see
Figure 8). The 36 features under ten categories outlined below provide a specific structure for
educational administrators.

49
Source: Lewis et al. (2010).
Figure 8. Positive Behavior Support Organizational Logic Model.
A summary of the features of the PBS Implementation Self-Assessment and Planning Tool
are listed below:
Leadership Team (Coordination)
1. Leadership Team is configured to address multi-school (district) and/or multi-district
(region, state) leadership and coordination.
2. Leadership Team is established with representation from appropriate range of
stakeholders (e.g., special education, general education, families, mental health,
administration, higher education, professional development, evaluation and
accountability).
3. Leadership Team completes PBS Implementation Blueprint self-assessment at least
annually.
4. Leadership Team completes a 3-5 year prevention-based action plan that delineates
actions linked to each feather of the Implementation Blueprint.

50
5. Leadership Team establishes regular meeting schedule (at least quarterly) and
meeting process (agenda, minutes, dissemination).
6. Leadership Team has established individual(s) who have adequate and designated
time to manage day-to-day operations.
7. Leadership Team has established individuals who put policy and action planning into
practice.
8. Leadership Team has established individuals who inform leadership team on
implementation outcomes.
Funding
9. Recurring/stable state funding sources are established to support operating structures
and capacity activities for at least three years.
10. Funding and organizational resources across related initiatives are assessed and
integrated.
Visibility
11. Dissemination strategies are identified and implemented to ensure that stakeholders
are informed about activities and accomplishments (e.g., website, newsletter,
conferences, TV).
12. Procedures are established for quarterly and public acknowledgement of
implementation activities that meet criteria.
Political Support
13. Student social behavior is one of the top three to five goals for the political unit (state,
district, region).

51
14. Leadership Team reports to the political unit at least annually on the activities and
outcomes related to student behavior goal and SWPBS implementation.
15. Participation and support by administrator from state chief or equivalent administrator
are agreed upon and secured.
Policy
16. SWPBS policy statement developed and endorsed.
17. Procedural guidelines and working agreements have been written and referenced for
implementation decision making.
18. Implementation data and outcomes are reviewed semi-annually to refine policy.
19. Audit of effectiveness, relevance, and implementation integrity of existing related
(similar outcomes) initiatives, programs, etc. is conducted annually to refine policy.
Training Capacity
20. Leadership Team gives priority to identification and adoption of evidence-based
training curriculum and professional development practices.
21. Leadership Team has established local training capacity to build and sustain SWPBS
practices.
22. Leadership Team has established plan for continuous regeneration and updating of
training capacity.
Coaching Capacity
23. Leadership Team has developed a coaching network that establishes and sustains
SWPBS.

52
24. Individuals are available to provide coaching and facilitation supports at least
monthly with each emerging school team (in training and not at implementation
criteria), and at least quarterly with established teams.
25. Coaching functions are identified and established for internal (school level) and
external (district/regional level) coaching supports.
Evaluation Capacity
26. Leadership Team has developed an evaluation process and schedule for assessing (a)
extent to which teams are using SWPBS, (b) impact of SWPBS on student outcomes,
and (c) extent to which the leadership team’s action plan is implemented.
27. School-based data information systems (e.g., data collection tools and evaluation
processes) are in place.
28. District and/or state level procedures and supports are in place for system level
evaluation.
29. Annual report of implementation integrity and outcomes is disseminated.
30. At least quarterly dissemination, celebration, and acknowledgement of outcomes and
accomplishments.
Behavioral Expertise
31. At least two individuals on leadership team have behavioral expertise and experience
to ensure implementation integrity of SWPBS practices and systems at three capacity
levels: (a) training, (b) coaching, and (c) evaluation.
32. Individuals with behavioral expertise have SWPBS content competence.
33. The interaction and relationship between effective academic instruction and school-
wide behavior support are visible and promoted.

53
34. SWPBS behavioral expertise includes fluency with the process and organizational
strategies that support and enhance the use of evidence-based behavioral practices.
School/ District Demonstrations
35. At least 10 schools have adopted SWPBS, and can be used as local demonstrations of
process and outcomes.
36. At least 2 districts/regions have established demonstrations of system-level leadership
teams to coordinate SWPBS implementation in 25% (3 schools) or more of their
schools.
(Sugai et al., 2010, p. 65)
Academics, Behavior and PBS
No Child Left Behind and a high stakes accountability climate are forcing school
administrators to improve academic achievement indicators, thus affecting the sustainability of
school-wide initiatives like PBS. Therefore, PBS researchers have conducted a great deal of
research to see if a connection between PBS and academic improvement exists (Algozzine et al.,
2011; Horner et al., 2004; Lassen et al., 2006; Luiselli, Putnam, Handler, & Feinberg, 2005;
Putnam, Handler, & O’Leary-Zonarich, 2003; Putnam, Handler, Ray & O’Leary-Zonarich, 2002;
Scott & Barrett, 2004; Sugai, Lewis-Palmer, & Hagan-Burke, 1999-2000). If educational leaders
find a link between PBS and academic achievement, they will be more likely to implement the
framework with fidelity and work toward sustainability.
The study by Lassen et al., (2006) examined the effectiveness of a school-wide PBS
intervention in an inner city middle school over 3 years. The study revealed that reductions in
student problem behavior and improvements in standardized test scores were visible.

54
Behavioral Effects of Positive Behavior Supports
A positive school culture is an important key that makes a difference for students
(Goodwin, 2009). Students need both a rich learning experience and solid preparation to meet
the required standards. A flexible and highly differentiated instructional program is the only
variable approach to meeting the goal of success for all students (Rettig, McCullough, Santos, &
Watson, 2003). In fact, schools implementing PBS have found when PBS is implemented with
fidelity, students experience improved academic achievement and an increase in appropriate
behavior (Ruiz, Ruiz, & Sherman, 2012).
Several studies found a link between behavioral problems and academic performance
(Lassen et al., 2006; McIntosh et al., 2006; Scott & Barrett, 2004). Knowing that PBS decreases
maladaptive behaviors (Irvin et al., 2004; Scott & Barrett, 2004), researchers began to examine
the potential effects of behavioral interventions on academic improvement.
Algozzine, Putman and Horner (2007), Horner, Sugai and Anderson (2010), and Putman,
Horner and Algozzine (2006) discussed the link between behavior and academic performance in
terms of classic coercion, yet other educators and researchers found academics intrinsically
linked to behavior (Colvin & Fernandez, 2000; Kern, Choutka, & Sokol, 2002; Perciado, Horner,
& Baker, 2009; Witt, VanDerHeyden, & Gilbertson, 2004). Still other researchers further
identified behavioral/academic predictors at the elementary, middle and high schools levels
(Herman, Reinke, Lambert & Ialongo, 2008; Horner, Sugai, Smolkowski, Eber, Nakasato, &
Todd 2009; Lassen et al., 2006; Morrison, Anthony, & Storino, & Dillon, 2001).
McIntosh et al. (2006) deduced that when students struggled academically they were
more likely to develop problem behaviors maintained by escape/avoidance of academic
demands. Additionally, Moore, Anderson and Kumar (2005) found curricular expectations

55
triggered undesirable behavior when the curricular expectations were not appropriately aligned
with the current skill levels of the students.
Perciado et al. (2009) evaluated the effectiveness of a function-based intervention to
improve behavior and reading outcomes for Latino English language learners (ELLs). The study
included four Latino ELL students in an elementary school general education setting and directly
observed them for fourteen weeks. The results documented a functional relationship between
intervention and reduction of problem behavior (Perciado et al., 2009).
Lassen et al. (2006) examined the number of ODRs and suspensions and the test scores of
a standardized reading and math test in an urban middle school. The number of ODRs and
suspensions predicted scores on the standardized tests (Lassen et al., 2006).
Morrison et al. (2001) reviewed students’ records who were referred to an in-school
suspension program. They discovered that students who had never before received an office
discipline referral earned higher grade point averages (GPA) than those with one or more ODRs
(Morrison et al., 2001).
Horner et al. (2009) studied the link between the PBS training and technical assistance
for elementary schools in Hawaii and Illinois. The three-year study performed in the third grade
classes documented that PBS training and technical assistance were related to improved
implementation of universal level PBS practices. The improved implementation of PBS was
related to improvements in the perceived safety of the school settings and the third graders
meeting or exceeding state reading assessment standards (Horner et al., 2009).
Herman et al. (2008) investigated the role of low academic competence, and sampled
African American boys and girls. The results supported the path from academic competence in

56
first grade to depressive symptoms in seventh grade that correlated to conduct problems,
inattention and social problems (Herman et al., 2008).
Academic Effects of Positive Behavior Supports
Academic achievement is one characteristic that exerts powerful influences on school
engagement (Finn & Rock, 1997; Perdue, Manzeske, & Estell, 2009). Time spent away from the
classroom due to office discipline referrals (ODRs), suspensions and expulsions equates to time
away from the classroom, academic instruction and the learning processes, which highly
correlates with poor academic achievement (Bodovski & Farkas, 2007; Canady & Rettig, 2008).
Therefore, researchers began to examine the effects of PBS on instruction time and academic
achievement.
Lassen et al. (2006) conducted a three-year study which looked at ODRs, suspensions
and the standardized reading and math test scores of an inner city urban school pre- and post-
PBS implementation. The study revealed that ODRs and suspensions decreased after the
implementation of PBS. While reading test scores did not change, math scores increased from
baseline to year three (Lassen et al., 2006).
Luiselli et al. (2005) completed a similar study to that of Lassen et al. (2006). They
implemented PBS in an urban school and found decreases in ODRs and suspensions. They also
found an increase in students’ reading and mathematics achievement tests. Reading scores
increased 18 percent, while math scores increased 25 percent (Luiselli et al., 2005).
Chen (2007) completed a study that confirmed student background is associated with
student behavior and student learning. School disorder affects student achievement negatively
both directly and indirectly, which was measured by student attendance. The study suggested

57
that policy initiatives could be implemented to improve school climate and therefore reduce
school disorder and improve student achievement (Chen, 2007).
Lastly, Bradshaw, Mitchell and Leaf (2009) used data from a five-year longitudinal study
conducted in 37 elementary schools to examine PBS intervention effects on behavioral and
academic outcomes for students. The researchers reviewed the PBS training, PBS
implementation and fidelity, office discipline referrals, and academic achievement. Observations
revealed that improvements in the PBS schools tended to out pace the improvements in the non-
trained schools on three of the four state assessments (Bradshaw et al., 2009).
Positive Behavior Supports and Instructional Time
Scott and Barrett (2004) implemented school-wide positive behavior support in an urban
elementary school. During the next two years, ODRs decreased by 562 and suspensions by 55
annually. This is linked to instruction time, because the authors estimated that ODRs took the
student away from 20 minutes of instruction and suspension removed them from school for an
entire day. After the implementation of PBS, school-wide instruction increased an average of
29.5 days for ODRs and 50 days for suspensions (Scott & Barrett, 2004).
Putnam et al. (2002) conducted a similar pre- and post-PBS implementation study in a
low-performing urban school. The researchers hypothesized the amount of instructional time
gained, if any, would be due to less time out of the classroom with discipline consequences.
Their results revealed a 169 day increase, school-wide, in instructional time over a semester
verses a similar semester prior to PBS implementation which resulted in a 57 percent increase in
instruction time over pre-intervention results (Putnam et al., 2002).
With a clear understanding of the impact ODRs have on instruction time, Scott and
Barrett (2004) emphasized the importance of tracking the amount of time spent on ODRs. A

58
four-step system was created to record time spent on ODRs, with the intent that it be used to
compare semesters or years to truly evaluate the impact of PBS. First, Scott and Barrett
suggested that schools keep up with the time spent on each referral. Keeping up with the time
spent on each referral can be easily accomplished by adding student time in and out to the
referral form. Also, suggested was a place on the form for administrators to record time spent on
dealing with the proper paperwork after the student returned to the classroom. Second, schools
should track the total number of ODRs processed. Tracking the total number of ODRs processed
allows school administrators to compare ODRs by semester from year to year to determine if
improvement occurred. Third, schools should average the student time and administrator time
spent on ODRs in minutes, hours and days. The amount of time spent on ODRs is valuable
information to have when reporting to outside interests. Fourth, school administrators must
share the information learned with key stakeholders, such as their faculty and staff, parents and
district level administrators. The amount of time taken by processing ODRs is crucial
information to have when evaluating if a PBS program should stay the course or potentially
make changes (Scott & Barrett, 2004).

59
CHAPTER 3. METHODS AND PROCEDURES
Algozzine, Putnam, and Horner (2007) reviewed research related to the relationship
between academic achievement and social behavior. These researchers found that most studies
illustrated simple correlations, and that few researchers investigated functional relationships.
Information presented in this chapter is intended to add to the limited amount of research
regarding the potential effects of Positive Behavior Supports on the performance scores of fourth
grade students on a standardized reading and math test in the State of Alabama. Data collection
was in compliance with the research guidelines as set by the Auburn University Institutional
Research Board. This chapter will discuss: (a) the researcher’s role, (b) participants, (c) research
design, (d) instrumentation (including validity and reliability), (e) data collection procedures, and
(f) data analysis.
Purpose of Study
The purpose of this study was to investigate the relationship of school-wide positive
behavior supports to academic achievement in Alabama schools. This study compared the 2009–
2010, 2010–2011 and 2011–2012 fourth grade Alabama Reading and Math Test (ARMT) scores
of four school districts in Alabama that have implemented Positive Behavior Support (PBS) to
four non-PBS school districts ARMT scores. Demographic data were examined at the local
district level for the 8 schools in the State of Alabama. Districts that have fully implemented
PBS included all schools within the district that were trained in Tier I PBS and implemented
PBS. Then, based on seven indicators each school district was paired with a similar non-PBS

60
school district. The total number of Alabama school districts totaled 131; the non-PBS schools
totaled 115 schools that had not implemented PBS prior to the 2009–2010 school year. The
districts were matched based on geographic category (i.e. rural, large urban city, etc.), number of
schools, number of students, amount spent per student on instruction, student/teacher ratio,
number of English language learners (ELL), and the racial make-up of the total population under
18. The racial categories were White, Black, Hispanic or Latino, American Indian or Alaska
native, Asian, and Hawaiian or other Pacific Islander.
Research Questions
The study was guided by the following research questions:
1. What are the demographic characteristics of the four PBS and four non-PBS
school districts in Alabama?
2. What are the differences between reading achievement scores among the PBS and
non-PBS school districts in Alabama?
3. What are the differences between math achievement scores among the PBS and
non-PBS school districts in Alabama?
4. What are the differences in reading achievement scores among the PBS and non-
PBS school districts in relation to the number of years of implementation of positive behavior
supports?
5. What are the differences in math achievement scores among the PBS and non-
PBS school districts in relation to the number of years of implementation of positive behavior
supports?

61
Researcher’s Role
The role of the researcher for this study was to focus on the potential effects of Positive
Behavior Supports on the academic performance scores of fourth grade students on a
standardized reading and math test. The researcher examined each PBS school district with its
matched non-PBS district to verify if either district obtained higher academic achievement scores
on the ARMT.
During the period of this study, the researcher held the role of Positive Behavior Support
Trainer at the Alabama Positive Behavior Support Center. This study provided the researcher
with an opportunity to analyze data collected from the Alabama school districts for the purpose
of determining if the implementation of PBS had any effects on academic achievement
performance.
Participants
The participants were eight Alabama school districts: four PBS school districts (districts
that had implemented PBS) and four matched non-PBS school districts (districts that had not
implemented PBS). Demographic data was examined at the local district level for eight school
districts in the State of Alabama (Alabama State Department of Education, 2010). Districts that
had fully implemented PBS included all those in which all schools within the district were
trained in Universal Tier I PBS and showed evidence of implementation of PBS. Then,
systematically each school district was paired with a similar non-PBS school district based on
seven indicators. Alabama has a total of 131 school districts, and as of 2009, 57 of the schools
districts (44%) were trained in Universal Tier I PBS and show evidence of implementation of
PBS; 74 of the schools districts (56%) are not trained in Universal Tier I PBS.

62
Since the demographic data gathered came from the National Center for Education
Statistics, each school district pair was assigned a code, such as PBS 1 and Non-PBS 2, PBS 3
and Non-PBS 4, etc., in order to maintain anonymity of each district. The school districts were
closely matched to ensure that academic test scores, for the PBS districts and non-PBS districts,
be compared more accurately and conclusions could be determined. Note that in some cases the
matched districts may differ greatly on one or two indicators, however, most of the indicators
between matches were similar, and each district was matched as closely as possible.
The districts were matched based on seven indicators: (1) geographic category (i.e. rural,
large urban city, etc.), (2) number of schools, (3) number of students, (4) student/teacher ratio,
(5) number of teaching positions, (6) number of English language learners (ELL), and (7) the
racial make-up of the total population under 18. The racial categories included White, Black,
Hispanic or Latino, American Indian or Alaska native, Asian, and Hawaiian or other Pacific
Islander.
Research Design
The four school districts in the State of Alabama that implemented PBS since the 2005–
2006 school year were each matched with a similar non-PBS school district based on the above
mentioned seven characteristics from the National Center for Education Statistics. The 2009–
2010, 2010–2011 and 2011–2012 fourth grade reading and math ARMT results from each school
district were examined. Student academic success was determined by a placement in Level III
and IV on the ARMT, which indicates the percentage of students who met or exceeded the
State’s standards in the perspective categories. Each level of achievement (i.e., I, II, III, IV) on
the ARMT test was converted from a percentage to a number for each category (i.e., reading and

63
math), each district (i.e., PBS and Non-PBS), and each year of the test administration (i.e., 2009–
2010, 2010–2011 and 2011–2012).
Instrumentation
The Alabama Reading and Mathematics Test (ARMT) was used to measure academic
success of the four PBS and four Non-PBS school districts examined for comparison. The
ARMT is a criterion-referenced test and is given during the spring of each year (since 2003–
2004). It consists of selected items from the Stanford Achievement Test (Stanford 10) which
mandates the Alabama state content standards in reading and mathematics. In assurance that all
content standards are covered for the ARMT, additional test items were developed. The
combination of these test items creates the ARMT; it has a 100% alignment to the Alabama state
content standards in reading and mathematics. The primary purpose of the ARMT is:
To assess students’ mastery of state content standards in reading and mathematics,
To report individual and group performance,
To report relative strengths and weaknesses of individuals and groups, and
To provide data to study changes in performance over time.
The following achievement levels are used in reporting ARMT performance:
Level IV – Exceeds academic content standards,
Level III - Meets academic content standards (proficient or grade-level performance),
Level II – Partially meets academic content standards, or
Level I – Does not meet academic content standards.
The performance results of the ARMT are used for accountability for grades three through eight
as well as meeting one of the requirements of the No Child Left Behind Act. The fourth grade
ARMT performance focus was chosen, because grade four is the level that the State Department

64
of Alabama concentrates on regarding risk to future academic achievement (Alabama State
Department of Special Education, 2004, Fall).
Reading Portion of the ARMT
The Alabama Reading and Math Test: Specifications for Reading, Grade 4 or Bulletin
2005, No. 83 (Morton, 2005a) provided information about the reading portion of the ARMT.
The content of the document focused on (a) two item types Reading Vocabulary – RV and
Reading Comprehension – RC which together produce a Reading Total – RT and (b) five ARMT
content standards for reading. The two item types included multiple-choice items with four-
option multiple-choice responses worth one point, and the open-ended items that valued three
points per response. The five ARMT content standards for the fourth grade reading portion are
listed below:
1. Standard 1 (S1) - Demonstrate word recognition skills, including structural analysis.
Examples of structural analysis are root words, prefixes, and suffixes.
2. Standard 2 (S2) - Demonstrate reading vocabulary knowledge, including recognition
of a variety of synonyms and antonyms.
3. Standard 3 (S3) - Use a wide range of strategies, including distinguishing fiction from
nonfiction, and making inferences to comprehend fourth-grade literary/recreational
materials in a variety of genres. Examples include novels, short stories, poetry, and
trade books.
4. Standard 4 (S4) - Identify literary elements and devices, including characters,
important details, and similes in literary and recreational materials, and identify
important details in textual and informational materials.

65
5. Standard 5 (S5) - Use a wide range of strategies and skills, including using sentence
structure, locating information, and distinguishing fact from fiction, to comprehend
fourth-grade functional, textual, and informational reading materials. (Morton, 2005a)
Mathematics Portion of the ARMT
The Alabama Reading and Math Test: Specifications for Mathematics, Grade 4 or
Bulletin 2005, No. 84 (Morton, 2005b) provided information about the math section of the
ARMT. The content of the document focused on (a) three item types Math total – MT which
consists of Procedure - PR + Problem Solving - PS and (b) 17 math content standards. The three
item types included multiple-choice items, gridded items and open-ended items. The four option
multiple-choice items and gridded items valued as one point, and the open-ended items were
worth three points. The 17 fourth grade ARMT math content standards are arranged in five
categories: number sense and operations (NSO), algebra (PRA), geometry (GMY), measurement
(MST) and data analysis and probability (DAP). The five categories and the 17 content
standards for the fourth grade math portion of the ARMT are below:
Number Sense and Operations:
1. Standard 1 (S1) - Demonstrate number sense by comparing and ordering decimals to
hundredths and whole numbers to 999,999.
2. Standard 2 (S2) - Write money amounts in words and dollar-and-cent notation.
3. Standard 3 (S3) - Rename improper fractions as mixed numbers and mixed numbers
as improper fractions.
4. Standard 4 (S4) - Demonstrate addition and subtraction of fractions with common
denominators.

66
5. Standard 5 (S5) - Round whole numbers to the nearest ten, hundred, or thousand, and
decimals to the nearest tenth.
6. Standard 6 (S6) - Solve problems, including word problems that involve addition and
subtraction of four-digit numbers with and without regrouping.
7. Standard 7 (S7) - Solve problems, including word problems, involving the basic
operations of multiplication and division on whole numbers through two-digit
multipliers and one-digit divisors.
8. Standard 8 (S8) - Recognize equivalent forms of commonly used fractions and
decimals.
Algebra:
9. Standard 9 (S9) - Write number sentences for word problems that involve
multiplication or division.
10. Standard 10 (S10) - Complete addition and subtraction number sentences with a
missing addend or subtrahend.
Geometry:
11. Standard 11 (S11) - Identify triangles, quadrilaterals, pentagons, hexagons, or
octagons based on the number of sides, angles, and vertices.
12. Standard 12 (S12) - Find locations on a map or a grid using ordered pairs.
Measurement:
13. Standard 13 (S13) - Calculate elapsed time in hours and minutes.
14. Standard 14 (S14) - Measure length, width, weight, and capacity using metric and
customary units, and temperature in degrees Fahrenheit and degrees Celsius.
Data Analysis and Probability:

67
15. Standard 15 (S15) - Represent categorical data using tables and graphs, including bar
graphs, line graphs, and line plots.
16. Standard 16 (S16) - Determine if outcomes of simple events are likely, unlikely,
certain, equally likely, or impossible.
17. Standard 17 (S17) - Represent numerical data using tables and graphs including bar
graphs and line graphs. (Morton, 2005b)
Validity
Ross and Shannon (2008) asserted that the extent to which our data collection
instruments, or processes, measure what they are supposed to measure is an indication of
validity. According to Aiken and Groth-Marnat (2005) validity can be established by using a
panel of experts. The validity of an instrument refers to the extent to which the instrument
measures what it is intended to measure. The validity of the ARMT was determined by a panel
of experts, created by the Alabama State Board of Education. The panel of experts reviewing the
instrument consisted of educators from each of the 131 Alabama school districts and each district
board of education. In addition, the panel of experts reviewed the content of the tests, selected
specific reading passages, reviewed specific test items, and determined achievement levels
(Morton, 2005b). The State Board also established a panel of experts to form the Accountability
Advisory Committee and, based on the recommendations of the State Board, the use of the
ARMT was implemented on June 2003 (Morton, 2005b).
The validity of the ARMT was further tested with a correlation analysis. Table 1 and
Table 2 show the inter-correlations of the Reading and Mathematics domains and sub-domains
and the aggression of domain scores for the totals. Testing the ARMT’s validity with a

68
correlational analysis examined the likelihood that the items in Table 1 and 2 were assessed as
the test developers claimed.
There are a few items to be noted from Table 1. Reading Total (RT) consists of RV, RC,
S1, S2, S3, S4, and S5. Reading Vocabulary (RV), and Reading Comprehension (RC) are
Stanford 10 subtests. Whereas, Standard 1 (S1), Standard 2 (S2), Standard 3 (S3), Standard 4
(S4) and Standard 5 (S5) are ARMT content reading standards.
Table 1
Reading: Intercorrelations of Domains, Standards, and Total Scores
Reading 4 RT RV RC S1 S2 S3 S4 S5
Reading Total (RT) 1.00
Reading Vocabulary (RV) 0.78 1.00
Reading Comprehension (RC) 1.00 0.71 1.00
Standard 1 (S1) 0.70 0.53 0.70 1.00
Standard 2 (S2) 0.85 0.87 0.82 0.57 1.00
Standard 3 (S3) 0.89 0.65 0.89 0.55 0.72 1.00
Standard 4 (S4) 0.92 0.70 0.92 0.55 0.73 0.75 1.00
Standard 5 (S5) 0.89 0.63 0.90 0.57 0.70 0.73 0.77 1.00
In Table 1 the intercorrelation between RT and S4, which measures identification skills
of literary elements and devices, was < = 0.92. This was the highest correlation compared to
other standards intercorrelations with RT. However, the intercorrelation between RT and S1,
which measures word recognition skills, was < = 0.70. This was the lowest correlation compared
to other standards intercorrelations with RT.

69
There are a few items to be noted from Table 2. Math Total (MT) consists of Procedure
(PR), Problem Solving (PS), Number Sense & Operations (NSO), Algebra (PRA), Geometry
(GMY), Measurement (MST) and Data Analysis & Probability (DAP). Procedure (PR) and
Problem Solving (PS) are Stanford 10 subtests. Whereas, Number Sense and Operations (NSO),
Algebra (PRA), Geometry (GMY), Measurement (MST), and Data Analysis and Probability
(DAP) are ARMT content standards.
Table 2
Mathematics: Intercorrelations of Domains, Sub-Domains, and Total Scores
Mathematics 4 MT PR PS NSO PRA GMY MST DAP
Math Total (MT) 1.00
Procedure (PR) 0.80 1.00
Problem Solving (PS) 0.99 0.73 1.00
Number Sense & Operations (NSO) 0.95 0.84 0.93 1.00
Algebra (PRA) 0.83 0.63 0.83 0.75 1.00
Geometry (GMY) 0.69 0.48 0.70 0.54 0.48 1.00
Measurement (MST) 0.78 0.55 0.79 0.66 0.60 0.57 1.00
Data Analysis & Probability (DAP) 0.81 0.57 0.81 0.69 0.61 0.52 0.57 1.00
In Table 2 the intercorrelation between MT and NSO, which measures Standards 1
through 8, was < = 0.95. This was the highest comparison with other cluster intercorrelations
with MT; and the intercorrelation between MT and GMY, which measures Standards 11 and 12,
was 0.69. This was the lowest comparison with other cluster intercorrelations with MT
(Alabama State Department of Special Education, 2004, Fall).

70
Reliability
The most widely used method for estimating reliability is Cronbach’s alpha. Kimberlin
and Winterstein (2008) defined Cronbach’s alpha as a function of the average inter-correlations
of items and the number of items in the scale. Dimitrov (2010) explained that reliability of
measurements indicates the degree to which they are accurate, consistent, and replicable when
(a) different people conduct the measurement, (b) using different instruments that purport to
measure the same trait, and (c) there is incidental variation in measurement conditions.
Cronbach’s alpha reliability coefficient is one method used to compute the correlation
values. The normal range for Cronbach’s alpha is between 0 and 1; the higher the score (closer
to 1), the more reliable the scale and the greater the internal consistency (Gliem & Gliem, 2003).
The internal consistency using Cronbach’s coefficient alpha to test reliability on the ARMT for
grades four, six, and eight was measured by Harcourt. According to Fowler (1995), one way to
ensure that scores on an instrument are reliable is to complete a field test. However, the item
level data was not available, and therefore the researcher was unable to complete sample specific
reliabilities. The reliability measures for the ARMT are depicted in Tables 3 through 6, which
was reported from the Alabama Reading and Math Test, Grades 4, 6, and 8, Technical Manual
(Alabama State Department of Education, 2004, Fall); however, for this study only grade 4 was
reported.
Inter-rater Agreement Measures
Table 3 provides statistics on the reliability coefficient of the ARMT with the inter-rater
agreement measures. The inter-rater agreement simply calculates the amount of agreement
among readers of the open-ended items with a check score procedure. Examiners randomly

71
selected ten percent of tests, with valid scores on the prompts, for a second independent review.
Table 3 demonstrates the inter-rater coefficients for the open-ended items of the ARMT.
Table 3
Inter-Rater Agreement Coefficients for ARMT
Inter-Rater Agreement
Subject and Grade % Perfect +/- Adjacent
Reading 4 73 94
Mathematics 4 91 99
Table 3 also shows the percent perfect agreement coefficient between fourth grade
reading and fourth grade math. The reading rating is more subjective than math. However,
when small amounts of disagreement were allowed, discrepancies between subjects decreased.
When researchers apply the inter-rater agreement of + 1 there is only a three percent difference
between reading and math.
Standard Error of Measurement
Table 4 addresses the standard error of measurement (SEM), which is the standard
deviation of errors of measurements of test scores from a particular group of examinees. SEM is
also another index of reliability. A measurement error is the discrepancy between an observed
score and the true score. An observed score of a student is an estimate of their true score, due to
the fact that the SEM is inversely related to reliability, the lower the standard error, the higher
the reliability. The measurement error is most commonly expressed as standard deviation units,
because the standard error of measurement is the standard deviation of the measurement error

72
distribution. Tables 4 through 7 report the reliability coefficients, among other measures for
subject, gender and ethnicity, limited English proficient and special education students, and
schools. In Table 4, MC refers to the number of multiple-choice items, GR refers to the number
of gridded-response items and OE refers to the number of open-ended items.
Table 4
Means, Standard Deviations, Number of Items, Reliability Coefficients, and Standard Error of
Measure (SEM) for Reading and Mathematics
Subject and Grade Mean SD MC GR OE Item Number Points Reliability SEM
Reading 4 44.12 14.06 60 . 4 64 72 0.93 3.72
Mathematics 4 41.11 14.33 56 4 4 64 72 0.93 3.79
In Table 5, the values in parentheses are raw score means of reliability coefficients for
gender and ethnicity for subjects Reading and Math of the ARMT assessment.
Table 5
Reliability Coefficients for Gender and Ethnicity
Subject and Grade Female Male
Reading 4 0.93 (46) 0.94 (42)
Math 4 0.92 (41) 0.94 (41)
Black Native American Asian White Hispanic
0.92 (38) 0.93 (46) 0.93 (50) 0.93 (48) 0.93 (38)
0.92 (35) 0.93 (42) 0.93 (51) 0.93 (45) 0.93 (37)

73
Students in special education received services related to the disability categories
identified in the Individual with Disabilities in Education Act (2004). These categories include
specific learning disability, mental retardation, autism, emotional disturbance, deaf-blindness,
hearing impairment, visual impairment, speech or language impairment, orthopedic impairment,
traumatic brain injury, multiple disabilities, and other health impairment. Table 6 represents the
reliability coefficients for limited English proficient and special education students.
Table 6
Reliability Coefficients for Limited English Proficient (LEP) and Special Education
LEP Special Education
N Mean SD
Reliability
Coefficients
N Mean SD
Reliability
Coefficients
Reading 4 837 32.93 12.89 0.91 5983 27.21 12.73 0.91
Math 4 900 33.11 12.99 0.92 6050 25.90 12.68 0.92
Note that some of the schools in Table 7 with less than 100 students were removed from
the analysis, therefore, raw score means and SDs do not represent the total population of
Alabama students (Alabama State Department of Special Education, 2004, Fall).

74
Table 7
Number of Schools, Means, Standard Deviations, and Reliability Coefficients for Schools
Subject and Grade Number of Schools Means SD Reliability of School Means
Reading 4 143 45.30 13.97 0.96
Mathematics 4 142 42.10 14.32 0.96
Data Collection
The Alabama school districts were identified and obtained from the Alabama State
Department of Education Directory (2010), an annually updated list of all school districts,
including personnel. This document lists all school districts in the state of Alabama
alphabetically by district. The names of Alabama school districts that were trained in Universal
Tier I PBS were provided by the Alabama Positive Behavior Support Center (2010). The
Alabama school district demographic data was gathered from National Center for Education
Statistics (NCES). All data collected from the Alabama Reading and Mathematics Test (ARMT)
were collected from the Alabama Department of Education.
Each PBS system was systemically matched with a non-PBS system based on seven
indicators from the NCES website. The researcher examined the fourth grade reading and math
results from the 2009–2010, 2010–2011 and 2011–2012 ARMT for each of the school districts.
Student academic success was determined by placement in Level III and IV on the ARMT,
which indicates the percentage of students who met or exceeded the Alabama State standards.
Since the demographic data gathered came from the National Center for Education
Statistics, each school district pair was assigned a code, such as PBS 1 and Non-PBS 2, PBS 3
and Non-PBS 4, etc., in order to maintain anonymity of each district. The school districts were

75
closely matched to ensure that academic test scores, for the PBS districts and non-PBS districts,
be compared more accurately and conclusions could be determined. Note that in some cases the
matched districts may differ greatly on one or two indicators, however, most of the indicators
between matches were similar, and each district was matched as closely as possible.
Table 8
Cohort Identification for Alabama School Districts Included in the Study
Districts Locale Year 1 Year 2 Year 3
PBS 1 Rural 2009–2010 2010–2011 2011–2012
Non-PBS 2 City 2009–2010 2010–2011 2011–2012
PBS 3 Suburb 2009–2010 2010–2011 2011–2012
Non-PBS 4 Suburb 2009–2010 2010–2011 2011–2012
PBS 5 Rural 2009–2010 2010–2011 2011–2012
Non-PBS 6 Town 2009–2010 2010–2011 2011–2012
PBS 7 Town 2009–2010 2010–2011 2011–2012
Non-PBS 8 Rural 2009–2010 2010–2011 2011–2012
Data Analysis
The data were collected and coded for input into Statistical Package for the Social
Sciences (SPSS) version 21.0. Demographic characteristics were described using descriptive
data such as mean scores, maximum and minimum scores and frequency distributions were
calculated for data obtained from the Demographic Profile, Section I of the questionnaire.

76
Tuckman (1988) stated that the purpose of a statistical test was to determine whether the
data collected from two or more samples are equivalent and if the differences can be accounted.
He further explained that chi-square tests were applicable to problems in data analysis in the
behavioral sciences area, in both manipulative experiments and survey analysis. The chi-square
test tells whether the independent samples have significantly different distributions across the
categories, and whether the frequencies obtained in the cells of the table are different from the
frequencies expected based on chance variation (Tuckman, 1988). Chi-square tests are
appropriate with variables expressed as nominal scales or unordered categories such as religion,
marital status and experimental conditions (Cohen, 1977).
Summary
This chapter discussed the researcher’s role, participants of the study, research design,
and instrumentation. The validity of the instrument was confirmed through the use of an
independent panel of experts, and an internal consistency reliability test. Data collection was in
compliance with the research guidelines as set by the Auburn University Institutional Research
Board.
The purpose of this study was to examine the potential effects of Positive Behavior
Supports on performance scores of fourth grade students on a standardized reading and math test
specific to the State of Alabama. Chapter 4 will report the results of the study as described in
Chapter 3 and present the results of the analysis of the data collected of the four PBS and four
non-PBS school districts in this study.

77
CHAPTER 4. RESULTS
A quantitative design was used to determine if a relationship existed between Alabama
Reading and Math achievement scores and school-wide positive behavior supports in 8 Alabama
school districts. Four districts that were trained and had implemented Universal Tier I PBS were
compared to four similar school districts that were not trained or had not implemented Universal
Tier I PBS. In this chapter the researcher describes the results of the quantitative analyses.
Quantitative Descriptive Statistics
Each of the evaluated Alabama school districts were selected from the Alabama State
Department of Education Directory (2010), an annually updated list of all school districts,
including personnel. This document listed all school districts in the state of Alabama
alphabetically by district. The names of Alabama school districts that were trained in Universal
Tier I PBS were provided by the Alabama Positive Behavior Support Center 2010. The Alabama
school district demographic data was gathered from National Center for Education Statistics
(NCES) in 2009. All data collected from the Alabama Reading and Mathematics Test (ARMT)
was collected from the Alabama Department of Education website that housed the Alabama
ARMT results.
Each PBS school system was systemically matched with a non-PBS school system based
on four of the seven indicators from the NCES website. The four indicators were 1) total schools
in the district, 2) total number of students in the school district, 3) the number of full-time
teaching equivalent positions in the school district and 4) student/teacher ratio for the school

78
district. The researcher examined the fourth grade ARMT reading and math results from school
year 2009–2010, 2010–2011 and 2011–2012 for each of the school districts. Student academic
success was determined by placement in Level III and IV on the ARMT, which indicates the
percentage of students who met or exceeded the State of Alabama standards.
Research Question 1
What are the demographic characteristics of the four PBS and four non-PBS school
districts in Alabama?
The following four PBS and four non-PBS school districts in Alabama were matched
based on relative demographic information including the total number of schools in the districts
and the total number of students in the school district. PBS 1 school district was initially trained
in Positive Behavior Supports in 2002, received follow-up training in 2003 and 2004, and in
2011 the entire school district was re-trained. The non-PBS 2 school district was not PBS
trained. The two school districts were similar based on the total number of schools, the total
number of students in each of the districts, FTE, and student/teacher ratio. Table 9 shows
demographic data for PBS 1 and Non-PBS 2.
Table 9
PBS 1 and Non-PBS 2 Demographics
Demographic Indicator PBS 1 Non-PBS 2
Total Schools 47 53
Total Students 27,880 23,374
FTE 1,685.29 1,738.10
Student/Teacher Ratio 16.54 13.45

79
PBS 3 school district was matched with non-PBS 4 school district. PBS 3 school district
was initially trained in Positive Behavior Supports in 2002, received follow-up training in 2003
and 2004, and the non-PBS 4 school district was not PBS trained. Demographic data were
similar and student/teacher ratios were relatively similar. Table 10 shows PBS 3 school district
and Non-PBS 4 school district demographic data.
Table 10
PBS 3 and Non-PBS 4 Demographics
Demographic Indicator PBS 3 Non-PBS 4
Total Schools 10 19
Total Students 8,654 9,405
FTE 464.0 543.0
Student/Teacher Ratio 18.65 17.32
PBS 5 school district was matched with non-PBS 6 school district. PBS 5 school district
was initially trained in Positive Behavior Supports in 2004 and received follow-up training in
2009, and the non-PBS 6 school district was not PBS trained. Demographic data were similar in
total schools for each school district and Table 11 shows PBS 5 and Non-PBS 6 demographic
data.

80
Table 11
PBS 5 and Non-PBS 6 Demographics
Demographic Indicator PBS 5 Non-PBS 6
Total Schools 4 5
Total Students 1,104 1,637
FTE 79.50 96.0
Student/Teacher Ratio 13.89 17.05
PBS 7 school district demographics reported 14 total schools, and non-PBS 8 school
district had 12 schools. PBS 7 school district was initially trained in Positive Behavior Supports
in 2004 and received follow-up training in 2005, and the non-PBS 8 school district was not PBS
trained. Total student data were very closely matched with 4,674 in district 7 and 4,104 in
district 8. Table 12 shows the PBS 7 and Non-PBS 8 demographic data.
Table 12
PBS 7 and Non-PBS 8 Demographics
Demographic Indicator PBS 7 Non-PBS 8
Total Schools 14 12
Total Students 4,674 4,104
FTE 276.5 291.0
Student/Teacher Ratio 16.90 14.10

81
Data Analysis
Data analyses were conducted to address each research question.
1. What are the demographic characteristics of the four PBS and four non-PBS
school districts in Alabama?
2. What are the differences between reading achievement scores among the PBS and
non-PBS school districts in Alabama?
3. What are the differences between math achievement scores among the PBS and
non-PBS school districts in Alabama?
4. What are the differences in reading achievement scores among the PBS and non-
PBS school districts in relation to the number of years of implementation of positive behavior
supports?
5. What are the differences in math achievement scores among the PBS and non-
PBS school districts in relation to the number of years of implementation of positive behavior
supports?
The results of the chi-square tests were evaluated to determine significance of PBS
implementation regarding academic scores of fourth graders in Reading and Math in the selected
four districts that had implemented PBS and the four districts that had not implemented PBS.
A chi square (X2) test of independence was used to determine a possible association or
significance between schools that implemented PBS related to academic scores of reading and
math in these selected Alabama school districts. The dependent variable of the study was
identified as the archived ARMT reading and math achievement scores, and the categorical
independent variables were years 2010, 2011, and 2012 for each of the school districts that were
randomly selected.

82
A total of 18,420 ARMT reading scores for year 2010, 2011, and 2012 for the eight
school districts (four PBS and four Non-PBS), and a total of 18,388 ARMT math scores for years
2010, 2011, and 2012 for the eight school districts were included in this study. Table 13
represents the chi square analysis for reading scores in association with the school districts that
implemented PBS and the schools districts that did not implement PBS in 2010.
Research Question 2
What are the differences between reading achievement scores among the PBS and non-
PBS school districts in Alabama?
Table 13 shows the ARMT reading scores for year 2010. A total of 6,344 fourth grade
ARMT reading scores were reported in 2010. Chi Square analysis indicated that students who
participated in PBS schools scored significantly higher on the ARMT reading for 2010 compared
to students who attended non-PBS schools (X2 (3) = 80.61, p < .001). Therefore, the null
hypothesis of no difference between PBS schools and non-PBS schools ARMT reading scores
for 2010 was rejected. The primary difference was that 32.6% (2,070) of the PBS schools’
reading achievement scores were in the high category vs. 26.1% (1,655) of the non-PBS schools’
reading achievement scores. Thus there was a strong association that a greater number of
students who attended PBS schools, scored higher on the ARMT reading than students who
attended non-PBS schools.

83
Table 13
ARMT Reading Scores for year 2010
Ratings PBS Percent Non-PBS Percent Total
Low 25 (0.4%) 18 (0.3%) 43
Below Average 328 (5.2%) 480 (7.6%) 808
Above Average 824 (13.0%) 944 (14.8%) 1768
High 2070 (32.6%) 1655 (26.1%) 3725
Total Count 3247 (51.2%) 3097 (48.8%) 6344
X2 (3) = 80.61, p < .001
Table 14 shows the ARMT reading scores for year 2011. A total of 6,208 fourth grade
ARMT reading scores were reported in 2011. Chi square analysis indicated that students who
participated in PBS schools scored significantly higher on the ARMT Reading for 2011
compared to students who attended non-PBS schools (X2 (3) = 54.55, p < .001). Therefore, the
null hypothesis of no difference between PBS schools and non-PBS schools ARMT reading
scores for 2011 was rejected. The primary difference was that 33.1% (2,054) of the PBS
schools’ reading achievement scores were in the high category vs. 25.2% (1,567) of the non-PBS
schools’ reading achievement scores. Thus there was a strong association that a greater number
of students who attended PBS schools, scored higher on the ARMT reading than students who
attended non-PBS schools.

84
Table 14
ARMT Reading Scores for year 2011
Ratings PBS Percent Non-PBS Percent Total
Low 2 (0.0%) 0 (0.0%) 2
Below Average 301 (4.8%) 384 (6.2%) 685
Above Average 938 (15.1%) 962 (15.5%) 1900
High 2054 (33.1%) 1567 (25.2%) 3621
Total Count 3295 (53.1%) 2913 (46.9%) 6208
X2 (3) = 54.55, p < .001
Table 15 shows the ARMT Reading scores for year 2012. A total of 5,868 fourth grade
ARMT reading scores were reported in 2012. Chi square analysis indicated that students who
participated in PBS schools scored significantly higher on the ARMT Reading for 2012
compared to students who attended non-PBS schools (X2 (3) = 23.66, p < .001). Therefore, the
null hypothesis of no difference between PBS schools and non-PBS schools ARMT reading
scores was rejected. The primary difference was that 34.7% (2,035) of the PBS schools’ reading
achievement scores were in the high category vs. 27.7% (1,624) of the non-PBS schools’ reading
achievement scores. Thus there was not a strong association that a greater number of students
who attended PBS schools, scored higher on the ARMT reading than students who attended non-
PBS schools.
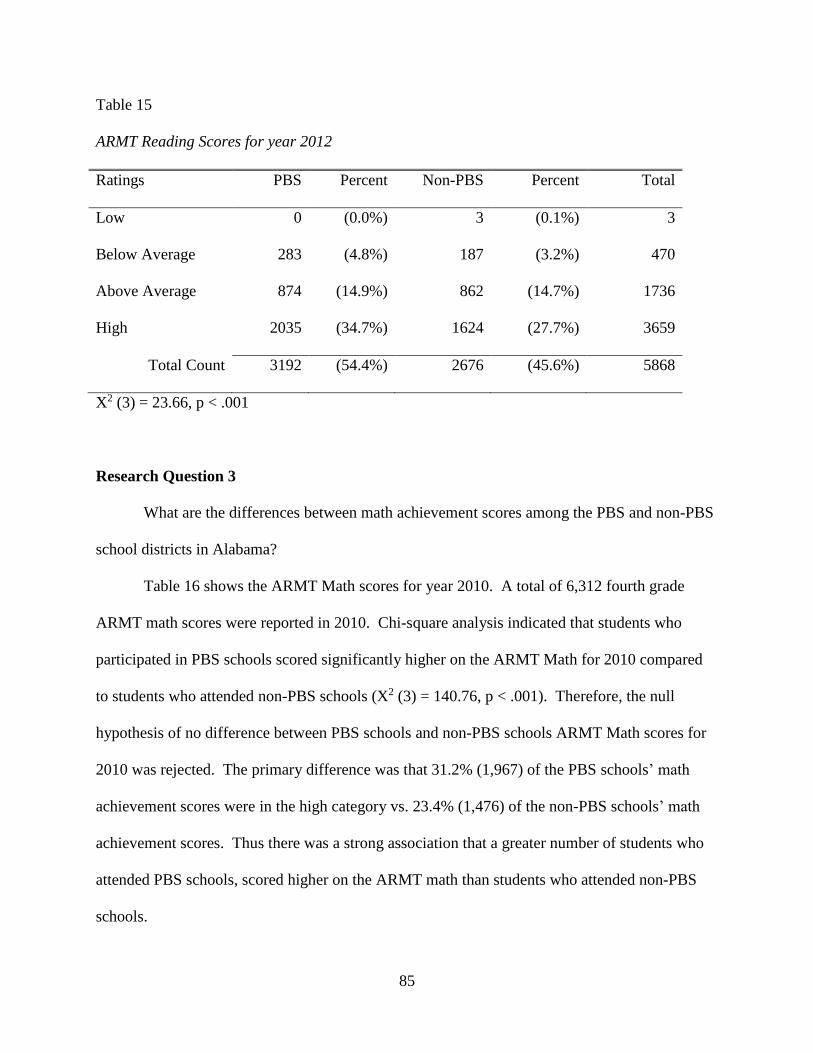
85
Table 15
ARMT Reading Scores for year 2012
Ratings PBS Percent Non-PBS Percent Total
Low 0 (0.0%) 3 (0.1%) 3
Below Average 283 (4.8%) 187 (3.2%) 470
Above Average 874 (14.9%) 862 (14.7%) 1736
High 2035 (34.7%) 1624 (27.7%) 3659
Total Count 3192 (54.4%) 2676 (45.6%) 5868
X2 (3) = 23.66, p < .001
Research Question 3
What are the differences between math achievement scores among the PBS and non-PBS
school districts in Alabama?
Table 16 shows the ARMT Math scores for year 2010. A total of 6,312 fourth grade
ARMT math scores were reported in 2010. Chi-square analysis indicated that students who
participated in PBS schools scored significantly higher on the ARMT Math for 2010 compared
to students who attended non-PBS schools (X2 (3) = 140.76, p < .001). Therefore, the null
hypothesis of no difference between PBS schools and non-PBS schools ARMT Math scores for
2010 was rejected. The primary difference was that 31.2% (1,967) of the PBS schools’ math
achievement scores were in the high category vs. 23.4% (1,476) of the non-PBS schools’ math
achievement scores. Thus there was a strong association that a greater number of students who
attended PBS schools, scored higher on the ARMT math than students who attended non-PBS
schools.

86
Table 16
ARMT Math Scores for year 2010
Ratings PBS Percent Non-PBS Percent Total
Low 39 (0.6%) 102 (1.6%) 141
Below Average 416 (6.6%) 636 (10.1%) 1052
Above Average 818 (13.0%) 858 (13.6%) 1676
High 1967 (31.2%) 1476 (23.4%) 3443
Total Count 3240 (51.4%) 3072 (48.7%) 6312
X2 (3) = 140.76, p < .001
Table 17 shows the ARMT Math scores for year 2011. A total of 6,208 fourth grade
ARMT math scores were reported in 2011. Chi square analysis indicated that students who
participated in PBS schools scored significantly higher on the ARMT Math for 2011 compared
to students who attended non-PBS schools (X2 (3) = 106.92, p < .001). Therefore, the null
hypothesis of no difference between PBS schools and non-PBS schools ARMT Math scores for
2011 was rejected. The primary difference was that 34.7% (2,153) of the PBS schools’ math
achievement scores were in the high category vs. 25.0% (1,553) of the non-PBS schools’ math
achievement scores. Thus there was a strong association that a greater number of students who
attended PBS schools, scored higher on the ARMT math than students who attended non-PBS
schools.

87
Table 17
ARMT Math Scores for year 2011
Ratings PBS Percent Non-PBS Percent Total
Low 25 (0.4%) 59 (1.0%) 84
Below Average 423 (6.8%) 535 (8.6%) 958
Above Average 689 (11.1%) 772 (12.4%) 1461
High 2153 (34.7%) 1553 (25.0%) 3706
Total Count 3290 (53.0%) 2919 (47.0%) 6209
X2 (3) = 106.92, p < .001
Table 18 shows the ARMT Math scores for year 2012. A total of 5,867 fourth grade
ARMT math scores were reported in 2012. Chi square analysis indicated that students who
participated in PBS schools scored significantly higher on the ARMT Math for 2012 compared
to students who attended non-PBS schools (X2 (3) = 6.88, p < .076). Therefore, the null
hypothesis of no difference between PBS schools and non-PBS schools ARMT math scores for
2012 was rejected. The primary difference was that 35.8% (2,100) of the PBS schools’ math
achievement scores were in the high category vs. 29.1% (1,707) of the non-PBS schools’ math
achievement scores. Thus there was not a strong association that a greater number of students
who attended PBS schools and scored higher on the ARMT math than students who attended
non-PBS schools.

88
Table 18
ARMT Math Scores for year 2012
Ratings PBS Percent Non-PBS Percent Total
Low 38 (0.6%) 24 (0.4%) 62
Below Average 317 (5.4%) 304 (5.2%) 621
Above Average 722 (12.3%) 655 (11.2%) 1377
High 2100 (35.8%) 1707 (29.1%) 3807
Total Count 3177 (54.2%) 2690 (45.8%) 5867
X2 (3) = 6.88, p < .076
Research Question 4
What are the differences in reading achievement scores among the PBS and non-PBS
school districts in relation to the number of years of implementation of positive behavior
supports?
Table 19 shows a summary of the data for ARMT Reading scores year 2010, 2011, and
2012. A total of 18,420 fourth grade ARMT reading scores were reported for 2010 - 2012. An
evaluation of the data shows consistency of the students who participated in PBS schools scored
higher in ARMT Reading year 2010, 2011, and 2012 compared to students who attended non-
PBS schools.

89
Table 19
ARMT Reading Scores for year 2010, 2011, and 2012
Ratings 2010 2011 2012
PBS Non-PBS PBS Non-PBS PBS Non-PBS
Low 25 (0.4%) 18 (0.3%) 2 (0.0%) 0 (0.0%) 0 (0.0%) 3 (0.1%)
Below Average 328 (5.2%) 480 (7.6%) 301 (4.8%) 384 (6.2%) 284 (4.8%) 187 (3.2%)
Above Average 824 (13.0%) 944 (14.8%) 938 (15.1%) 962 (15.5%) 874 (14.9%) 862 (14.7%)
High 2070 (32.6%) 1655 (26.1%) 2054 (33.1%) 1567 (25.2%) 2035 (34.7%) 1624 (27.7%)
Total 3247 (51.2%) 3097 (48.8%) 3295 (53.1%) 2913 (46.9%) 3182 (54.4%) 2676 (45.6%)
Research Question 5
What are the differences in math achievement scores among the PBS and non-PBS
school districts in relation to the number of years of implementation of positive behavior
supports?
Table 20 shows a summary of the data for ARMT Math scores year 2010, 2011, and
2012. A total of 18,388 fourth grade ARMT math scores were reported for 2010 - 2012. An
evaluation of the data shows consistency of the students who participated in PBS schools scored
higher in ARMT math year 2010, 2011, and 2012 compared to students who attended non-PBS
schools.

90
Table 20
ARMT Math Scores for year 2010, 2011, and 2012
Ratings 2010 2011 2012
PBS Non-PBS PBS Non-PBS PBS Non-PBS
Low 39 (0.6%) 102 (1.6%) 25 (0.4%) 59 (1.0%) 38 (0.6%) 24 (0.4%)
Below Average 416 (6.6%) 636 (10.1%) 423 (6.8%) 535 (8.6%) 317 (5.4%) 304 (5.2%)
Above Average 818 (13.0%) 858 (13.6%) 689 (11.1%) 772 (12.4%) 722 (12.3%) 655 (11.2%)
High 1967 (31.2%) 1467 (23.4%) 2153 (34.7%) 1533 (25.0%) 2100 (35.8%) 1707 (29.1%)
Total 3240 (51.4%) 3072 (48.7%) 3290 (53.0%) 2919 (47.0%) 3177 (54.2%) 2690 (45.8%)

91
CHAPTER 5. DISCUSSION
Major challenges face present day educators attempting to meet the academic and
emotional needs of diverse learners in classrooms across the country. The single most common
request for assistance from teachers is related to behavior and classroom management (Oliver,
Wehby, & Reschly, 2011). Chapter one of this study presented the conceptual framework, the
statement of the problem, purpose of the study, significance of the study, and definition of terms.
Chapter two explored a review of related literature regarding the origin of discipline practices in
public education, history of positive behavior supports (PBS), need for school-wide positive
behavior supports (SWPBS), components of PBS, implementation assumptions and solutions,
systems approach, and academic behavior and PBS. Chapter three described the research and
data collection methods used in this study. Results of the hypothesis testing were discussed in
Chapter four and Chapter five begins with a summary of the study, a discussion of the findings
related to the literature, and concludes with implications, limitations and recommendations for
future studies.
Findings Related to the Literature
The application of SWPBS has become an important intervention approach system for
schools in the United States with over 9,000 U.S. schools implementing the evidence-based,
data-driven framework proven to reduce disciplinary incidents, increase school safety, and
support improved academic outcomes (Horner, et al., 2009). Schools implementing SWPBS
aspire to establish a safe and orderly environment with a positive school climate in order to

92
maximize teaching and learning opportunities for all students (Campbell, 2009). According to
Campbell, implementing SWPBS was one proactive approach to aid in reducing disciplinary
problems in schools.
Findings from this study were similar to other studies reviewed in the literature. Studies
reviewed had similar research goals and examined standardized test scores of students after
schools implemented PBS. Lassen et al. (2006) conducted a three-year study which looked at
ODRs, suspensions and the standardized reading and math test scores of an inner city urban
school pre and post PBS implementation. The study revealed that ODRs and suspensions
decreased after the implementation of PBS. While reading test scores did not change, math
scores increased from baseline to year three (Lassen et al., 2006).
The study conducted by Lassen et al. (2006) was similar to the current study in that it
examined the standardized reading and math test scores of a school that had implemented PBS.
However, the major difference was the Lassen et al. (2006) study examined schools at pre and
post PBS implementation and did not compare the experimental school to a matched non-PBS
school. Results of that study reported no change in reading test scores, but reported math scores
increased from baseline to year three. The current study revealed no significant difference
between both reading and math scores for PBS verses non-PBS districts. The results found a
strong association that a greater number of students who attended a PBS school, scored higher on
the ARMT than students who attended non-PBS schools.
Luiselli et al. (2005) completed a similar study that examined the standardized reading
and math test scores of a school that had implemented PBS; however, it too examined schools
that conducted pre and post PBS implementation and did not compare the experimental school to
a matched non-PBS school. Luiselli et al. (2005) implemented PBS in an urban school and

93
found decreases in ODRs and suspensions. They also found an increase in students’ reading and
mathematics achievement test scores. Reading scores increased 18 percent, while math scores
increased 25 percent (Luiselli et al., 2005). The current study showed no significant difference
between both reading and math scores for PBS verses non-PBS districts; but showed a strong
association that a greater number of students who attended PBS schools scored higher on the
ARMT than students who attended non-PBS schools.
The study more similar to the current study was conducted in Illinois by Horner et al.
(2004). The Horner et al. (2004) study analyzed reading academic achievement scores in 19
elementary schools within the state of Illinois that implemented PBS versus those schools that
had not implemented PBS. Of these schools, 13 implemented school-wide PBS between the
1997–1998 and 2001–2002 school years. The researchers qualified a PBS school to be any
school that scored a minimum of 80 percent on the School Evaluation Tool (SET) (Horner et al.,
2004) and if 80 percent of their students could state their school-wide expectations. The
researchers compared 1997–1998 and 2001–2002 state reading tests for third graders in all 19
schools. Ten of the PBS schools, or 77 percent, showed an improvement in reading test scores
from 1997–1998 and 2001–2002. Only one of the non-PBS schools, or 16 percent, showed
improvement in their reading test scores over the same period of time. The Horner et al. (2004)
study differed from the current study because it examined scores from an Illinois specific State
Achievement Test which was different from the ARMT and the participants were third graders
instead of fourth graders. The results of Horner et al. (2004) study and the current study showed
a positive difference in achievement between schools that had implemented PBS verses those
that had not implemented PBS.

94
Implications
Findings generated by this study provide implications for future action. A possible action
for the Alabama State Department of Education is to continue to analyze data from the schools
that have implemented PBS. Another possible action would be to analyze the changes in
behavior, academic scores and school climate of the schools that were part of this study.
The results of this study provided practical applications for school districts and
superintendents regarding PBS schools and academic achievement. Even though PBS districts
fared better on the ARMT than the matching non-PBS counterparts, the data did not yield a
statistically significant difference under an analysis of chi-square.
Limitations
Even though PBS districts faired better on the ARMT than the matching non-PBS
counterparts, the data did not yield a statistically significant difference under an analysis of chi-
square. This could be due to the low number of school districts that were part of the study.
However, as of the 2005–2006 school year, only 16 districts in the State of Alabama had fully
implemented PBS with fidelity. To yield more accurate results, more districts need to implement
PBS with fidelity.
Another limitation of the study was that the data available was aggregate data.
Specifically, ARMT scores are presented as percentage scores at the district level. Results may
have reflected differently if the raw data, at the school level were available for analysis.
Another limitation of the study was the acknowledgement that other State of Alabama
initiatives, if any, may have been implemented in the school districts that were participants of the
study. Several Alabama statewide initiatives may be available to schools/districts that if they
meet certain qualifications. Examples of statewide initiatives include: Alabama Reading

95
Initiative (ARI), Alabama Math and Science Technology Initiative (AMSTI), State Improvement
Grants (SIG), and Alabama Schools in Motion (ASIM). All schools or school districts may have
access to any of the a fore mentioned state initiatives and if selected to participate these programs
and initiatives, once implemented may affect reading, math and science scores, regardless of the
status of PBS status.
Additionally, the relationship of the school principal and successful implementation of
SWPBS can be of further limitation for the present study. School administrators play a key role
in the success of initiatives implemented within their schools. Without the support of school
administration, initiatives such as PBS may be unsuccessful.
Recommendations for Future Studies
The results of this study presented evidence for the need to conduct further research to
strengthen findings of a relationship between PBS and academic achievement. A possible action
for the Alabama State Department of Education (ALSDE) is to continue to analyze data from
schools in the study implementing PBS to analyze changes in behavior, academic learning, and
school climate over a longer period of time (5–10 years). Another possible action would be to
analyze the changes in behavior, academic scores, and school climate of additional schools in the
district that are not implementing PBS. The development of questions or surveys that explicitly
relate to PBS would be helpful to explore during staff meetings or professional learning
development meetings, and would provide critical feedback on the success and challenges of the
program. The ALSDE would continue to benefit from exploring other successful models of
programs and current information provided by the U.S. Department of Education, U.S. Office of
Special Education Programs, and the National Technical Assistance Center on Positive
Behavioral Interventions and Supports.

96
Experts, trainers, and developers of PBS seem to be saying that further research needs to
occur to explore the effects and benefits of PBS on academic achievement. One of the leading
experts and researchers of PBS, and the co-founder of the OSEP Center for Positive Behavioral
Interventions and Supports, George Sugai, spoke of this need in Boston at the 2006 International
Conference of the Association of Positive Behavior Support. Sugai encouraged graduate
students in the audience of his session to conduct theses and dissertations on three aspects of
PBS; one of which was the effect of PBS on academic achievement.
Putnam et al. (2006) discussed several needs in the area of PBS research. Putnam et al.
pointed out that most of the studies conducted were a pre-post comparison, with few, if any,
experimental controls for outside factors. Therefore, the authors suggested that studies should be
conducted with more rigorous controls. Secondly, PBS research historically focused on the
behavioral impact of PBS. However, now that researchers have recently began exploring the
potential effects of PBS and academics, further study should be conducted on academic
achievement. In addition, the authors suggested the studies that indicated a link between PBS
and academic achievement should be replicated. Third, the authors suggested isolating aspects
of PBS to discover which mechanisms had the greatest impact on academic improvement. For
example, the following factors lead to greater academic achievement: increased instruction time,
prompting and feedback for academic skill performance and less peer support for academic
failure. The authors believed a greater analysis of the factors above, and other PBS aspects,
would aid in creating stronger supports for academics. Fourth, research should be conducted to
see if certain schools benefit more academically from PBS. Researchers should examine what
characteristics make model PBS performer schools different from those that show lesser effects.
Lastly, studies that find behavioral indicators that predict academic problems should be
97
replicated. Early PBS interventions are the key to lessening or preventing behavioral and
academic problems, as students get older (Putnam et al., 2006).
Additional topics for future research include the relationship of the school principal and
successful implementation of SWPBS and teacher job satisfaction. Armstrong (2012),
investigated research from the Project on the Next Generation of Teachers at the Harvard
Graduate School of Education which examined how working conditions predicted teachers’ job
satisfaction. According to Johnson, Kraft, and Papay (as cited in Armstrong, 2012), the Harvard
project made a link between teacher satisfaction and growth in student achievement and found
conditions most important for teacher satisfaction were ones that shaped the social context of
teaching and learning. Johnston, Kraft, and Papay identified the “three most important elements
for teacher satisfaction were collegial relationships, the principal’s leadership, and school
culture” (as cited in Armstrong, 2012).
Concluding Remarks
Attempts to control disruptive behaviors cost considerable teacher time at the expense of
academic instruction. Educators face continuous challenges in efforts to establish and maintain
safe and orderly classroom environments where teachers can teach and students can learn (Scott,
White, Algozzine, & Algozzine, 2009). The research from this study strengthens the evidence
that a positive relationship between SWPBS and academic learning exists, and thus contributes
to the current literature. These supports foster a positive school climate offering a framework for
the adoption and implementation of a continuum of evidence-based interventions to achieve
academically and behaviorally important outcomes for all students (Sugai, 2013). It is
imperative to continue the research using PBS to improve the effectiveness of the teaching and
learning in our schools.

98
REFERENCES
Achilles, G. M., Mclaughlin, M. J., & Croninger, R. G. (2007). Sociocultural correlates of
disciplinary exclusion among students with emotional, behavioral, and learning
disabilities in the SEELS national dataset. Journal of Emotional and Behavioral
Disorders, 15(1), 33–45.
Aiken, L., & Groth-Marnat, G. (2005). Psychological testing and assessment. Boston, MA:
Allyn and Bacon.
Alabama Positive Behavior Support Center (The). (n.d.). Three-tiered approach to prevention.
Retrieved January 10, 2011, from http://www.alabamapbs.aum.edu
Alabama Positive Behavior Support Center (The). (2010). Positive behavior support schools
trained. Montgomery, AL.
Alabama Disabilities Advocacy Program. (2007). Special education in Alabama: A right not a
favor. Montgomery, AL.
Alabama State Department of Education. (2010). Alabama Education Directory. Retrieved
January 15, 2010, from http://www.alsde.edu/general/SDE_Directory.pdf
Alabama State Department of Special Education. (2004, Fall). Alabama Reading and Math Test
(ARMT): Grades 4, 6, and 8: Technical manual. Antonio, TX: Harcourt Assessment, Inc.
Alabama Reading and Mathematics Test (ARMT). Alabama Department of Education. Retrieved
August 14, 2011, from http://www.alsde.edu/Accountability/preAccountability.asp

99
Algozzine, B., Putnam, B., & Horner, R. (2007). Which came first? The achievement or the
behavior problem? Charlotte, NC: University of North Carolina at Charlotte, Behavior
and Reading Improvement Center.
Algozzine, B., Wang, C., & Violette, A. S. (2011). Reexamining the relationship between
academic achievement and social behavior. Journal of Positive Behavior Interventions,
13(1), 3–16.
American Psychological Association Zero Tolerance Task Force. (2008). Are zero tolerance
policies effective in schools? An evidentiary review and recommendations. American
Psychologist, 63(9), 852–862.
Amstutz, L. S., & Mullett, J. H. (2005). The little book of restorative discipline for schools:
Teaching responsibility; creating caring climates. Intercourse, PA: Good Books.
Arcia, E. (2006). Achievement and enrollment status of suspended students: Outcomes in a large,
multicultural school district. Education and Urban Society, 38(3), 359–369.
Armstrong, A. (2012). Build higher levels of job satisfaction. The Leading Teacher, 7(6), 4–5.
Baer, D. M., Wolf, M. M., & Risley, T. R. (1968). Some current dimensions of applied behavior
analysis. Journal of Applied Behavior Analysis, 1, 91–97.
Barrett, D. E., Katsiyannis, A., & Zhang, D. (2009). Predictors of offense severity, adjudication,
incarceration, and repeat referrals for juvenile offenders: A multicohort replication study.
Remedial and Special Education, 31(4), 261–275.
Berkman, K. A., & Meyer, L. H. (1988). Alternative strategies and multiple outcomes in the
remediation of severe self-injury: Going “all out” nonaversively. Journal of the
Association for Persons with Severe Handicaps, 13, 76–86.

100
Bodovski, K., & Farkas, G. (2007). Mathematics growth in early elementary school: The roles
of beginning knowledge, student engagement, and instruction. The Elementary School
Journal, 108(2), 115–130.
Bowditch, C. (1993). Getting rid of troublemakers: High school disciplinary procedures and the
production of dropouts. Social Problems, 40, 493–509.
Bradshaw, C. P., Mitchell, M. M., & Leaf, P. J. (2009). Examining the effects of schoolwide
positive behavioral interventions and supports on student outcomes. Journal of Positive
Behavior Interventions, 12(3), 133–148.
Brown, T. M. (2007). Lost and turned out: Academic, social, and emotional experiences of
students excluded from school. Urban Education, 42, 432–456.
Brown, F., Michaels, C. A., Oliva, C. M., & Woolf, S. B. (2008). Personal paradigm shifts
among ABA and PBS experts: Comparisons in treatment acceptability. Journal of
Positive Behavior Interventions, 10, 212–227.
Campbell, J. V. (2009). A study of perceptions relating to the implementation of positive
behavior support and school climate in a small, urban elementary school community.
(Doctoral dissertation). Available from ProQuest Dissertations and Theses database.
(305160782)
Canady, R. L., & Rettig, M. D. (2008). Elementary school scheduling: Enhancing instruction for
student achievement. Larchmont, NY: Eye on Education.
Carr, E. G. (1977). The motivation of self-injurious behavior: A review of some hypotheses.
Psychological Bulletin, 84(4), 800–816.

101
Carr, E. G., Dunlap, G., Horner, H. R., Koegel, R. L., Turnbull, A., P., & Sailor, W. (2002).
Positive behavior supports: Evolution of an applied science. Journal of Positive Behavior
Interventions, 20, 4–16.
Carr, E. G., & Sailor, W. (1994). Should only positive methods be used by professionals who
work with children and youth? (Reply to Birnbrauer). In E. Gambrill & M. Mason (Eds.),
Children: Controversial issues (pp. 223–253). Los Angeles, CA: Sage.
Carter, D. R., & Horner, R. H. (2009). Adding function-based behavioral support to First Step to
Success: Integrating individualized and manualized practices. Journal of Positive
Behavior Interventions, 11(1), 22–34.
Cartledge, G., & Johnson, C.T. (2004). School violence and cultural sensitivity. In J.C. Conoley,
& A.P. Goldstein (Eds.), School violence intervention (2nd ed., pp. 441–482). New York:
The Guilford Press.
Cartledge, G., & Lo, Y. (2006). Teaching urban learners, culturally responsive strategies for
developing academic and behavioral competence. Champagne, IL: Research Press.
Chandler, L. K., & Dahlquist, C. M. (2002). Functional assessment: Strategies to prevent and
remediate challenging behavior in school settings. Upper Saddle River, NJ:
Merrill/Prentice Hall.
Chance, P. (1998). First course in applied behavior analysis. Pacific Grove, CA: Brooks/Cole.
Chen, G. (2007). School disorder and student achievement: A study of New York City
elementary schools. Journal of School Violence, 6(1), 27–43.
Chen, J., & Astor, R. A. (2009). Students’ reports on violence against teachers in Taiwanese
schools. Journal of School Violence, 8, 2–17.

102
Chiu, P. H., & Deldin, P. J. (2007). Neural evidence for enhanced error detection in major
depressive disorder. American Journal of Psychiatry, 164(4), 608–616.
Christle, C. A., Jolivette, K., & Nelson, C. M. (2005). Breaking the school to prison pipeline:
Identifying school risk and protective factors for youth delinquency. Exceptionality, 13,
69–88.
Christle, C. A., Nelson, C. M., & Jolivette, K. (2004). School characteristics related to the use of
suspension. Education and Treatment of Children, 27, 509–526.
Civil Rights Project/Advancement Project (The). (2000). Opportunities suspended: The
devastating consequences of zero tolerance and school discipline. Proceedings of a
National Summit on Zero Tolerance. Cambridge, MA: Harvard Civil Rights Project.
Coburn, C. E. (2003). Rethinking scale: Moving beyond numbers to deep and lasting change.
Educational Researcher, 32(6), 3–12.
Cohen, J. (1977). Statistical power analysis for the behavioral sciences. Academic Press,
Orlando Florida.
Cohen, J., McCabe, L., Michelli, N. M., & Pickeral, T. (2009). School climate: Research, policy,
practice, and teacher education. Teachers College Record, 111, 180–213.
Cohen, J., & Pickeral, T. (2007, April 18). How measuring school climate can improve your
school. Education Week, 14.
Cohen, R., Kincaid, D., & Childs, K. (2007). Measuring school-wide positive behavior support
implementation: Development and validation of the “Benchmarks of Quality.” Journal of
Positive Behavior Interventions, 9(4), 203–213.
Colvin, G., & Fernandez, E. (2000). Sustaining effective behavior support systems in an
elementary school. Journal of Positive Behavior Interventions, 2, 251–253.

103
Council for Exceptional Children 2008 Policy Manual.
Cremin, L. A., (1970). American Education: The colonial experience 1607–1783. New York,
Evanston and London: Harper and Row.
Cremin, L. A. (1988). American Education: The metropolitan experience 1876–1980. New
York: Harper and Row.
Crews, S. D., Bender, H., Cook, C. R., Gresham, F. M., & Vanderwood, M. (2007). Risk
protective factors of emotional and/or behavioral disorders in children and adolescents: A
mega-analytic synthesis. Behavioral Disorders, 32, 64–77.
Crone, D. A., & Horner R. H. (2003). Building positive behavior support systems in schools:
Functional behavioral assessment. New York: Guilford.
Curtin, D., & Litke, R. (Eds.). (1999). Institutional violence. Atlanta, GA: Amsterdam.
Danforth, S., & Smith, T. O. (2005). Engaging troubling students: A constructivist approach.
Thousand Oaks, CA: Corwin Press.
Datnow, A. (2005). The sustainability of comprehensive school reform models in changing
district and state contexts. Educational Administration Quarterly, 41(1), 121–153.
Dimitrov, D.M. (2010). Contemporary treatment of reliability and validity in educational
assessment. Mid-Western Educational Researcher, 23(1), 23–28.
Dinkes, R., Cataldi, E. F., Lin-Kelly, W., & Snyder, T. D. (2007). Indicators of school crime
and safety: 2007. Washington, DC: National Center for Education Statistics, Institute of
Sciences, U.S. Departments of Education and Bureau of Justice.
Dinkes, E., Kemp, J., Baum, K., & Snyder, T. D. (2009). Indicators of School Crime and Safety:
2009. Washington, DC: National Center for Education Statistics, Institute of Education

104
Sciences, U.S. Department of Education, and Bureau of Justice Statistics, Office of
Justice Programs, U.S. Department of Justice.
Donnellan, A. M., LaVigna, G. W., Negri-Shoultz, N., & Fassenbender, L. L. (1988). Progress
without punishment: Effective approaches for learners with behavior problems. New
York: Teachers College Press.
Donnellan, A. M., LaVigna, G. W., Zambito, J., & Thvedt, J. (1985). A time-limited intensive
intervention program model to support community placement for persons with severe
behavior problems. Journal of the Association for Persons with Severe Handicaps, 10,
123–131.
Dunlap, G. (2006). The applied behavior analytic heritage of PBS: A dynamic model of action-
oriented research. Journal of Positive Behavior Interventions, 8(1), 58–60.
Dunlap, G., Carr, E. G., Horner, R. H., Zarcone, J. R., & Schwartz, I. (2008). Positive behavior
support and applied analysis: A familial alliance. Behavior Modification, 32, 682–698.
Dunlap, G., & Horner, R. H. (2006). The applied behavior analytic heritage of PBS: A dynamic
model of action-oriented research. Journal of Positive Behavior Interventions, 8, 58–60.
Dunlap, G., Iovannone, R., Wilson, K. J., Kincaid, D. K., & Strain, P. (2010). Prevent-teach-
reinforce: A standardized model of school-based behavioral intervention. Journal of
Positive Behavior Interventions, 12(1), 9–22.
Dwyer, K., Osher, D., & Warger, C. (1998). Early warning, timely response: A guide to safe
schools. Washington, DC: US Department of Education.
Edmonson, H., & Sailor, W. (2000). Comprehensive behavior supports for students whose
behavior impedes their learning. In Visions for the 21st century, conference compendium
(pp. 92–93). New York: National Down Syndrome Society.

105
Education Law. (January 2005) – Student Issues: Suspensions and Expulsions.
Esbensen, F. -A., Peterson, D., Taylor, T. J., Freng, A., Osgood, D. W., Carson, D., & Matsuda,
K. (2011). Evaluation and evolution of the Gang Resistance Education and Training
(G.R.E.A.T.) program. Journal of School Violence, 10, 53–70. doi:
10.1080/15388220.2010.519374
Evans, I. A., & Meyer, L. H. (1987). An educative approach to behavior problems: A practical
decision model for interventions with severely handicapped learners. Baltimore:
Brookes.
Fairbanks, S., Sugai, G., Guardino, D., & Lathrop, M. (2007). Response to intervention:
Examining classroom behavior support in second grade. Council of Exceptional Children,
73(3), 288–310.
Finn, J. D., & Rock, D. A. (1997). Academic suces among students at risk for school failure.
Journal of Applied Psychology, 82, 221–234.
Fisher, W. W., Adelinis, J. D., Volkert, V. M., Keeney, K. M., Neidert, P. L., & Hovanetz, A.
(2005). Assessing preferences for positive and negative reinforcement during treatment
of destructive behavior with functional communication training. Research in
Developmental Disabilities, 26(2), 153–168.
Fowler, F. (1995). Improving survey questions: Design and evaluation. California: Sage
Publications, Inc.
French, S. E., Seifman, E., Allen, L., & Abner, J. L. (2000). Racial/ethnic identity, congruence
with the social context, and the transition to high school. Journal of Adolescent Research,
15, 587–602.

106
Gilliam, W. S. (2005). Prekindergarteners left behind: Expulsion rates in states prekindergarten
systems. Black Issues in Higher Education, 22(8), 10.
Glasser, W. (1998). Choice theory in the classroom. New York: Harper-Collins.
Gliem, J., & Gliem, R. (2003). Calculating, interpreting, and reporting Cronbach’s alpha
reliability coefficient for Likert-type scales. Paper presented at the Midwest 84 Research
to practice conference in Adult, Continuing, and Community Education. Retrieved on
September 29, 2011 from https://scholarworks.iupui.edu/bitstream/handle/
1805/344/Gliem%20&%20Gliem.pdf?sequence=1
Glover, D. M. (2007). The impact of a school-wide positive behavior support plan on high
school student’s perceptions of school climate and peer relationships. (PhD, Loyola
University Chicago).
Goodwin, B. (2009). Culture: The schools “secret sauce” of school improvement. Changing
Schools, 60, 1–3.
Gregory, A., Skiba, R. J., & Noguera, P. A. (2010). The achievement gap and the discipline gap:
Two sides of the same coin? Educational Researcher, 39(1), 59–68.
Gregory, A., & Weinstein, R. S. (2008). The discipline gap and African American: Defiance or
cooperation in the high school classroom. Journal of School Psychology, 46, 455–475.
Hamilton, M. (2008). Restorative justice reconceptualizing school disciplinary theory and
practice. Doctoral Dissertation. University of the Pacific. Dissertations & Theses: A&I
database. (Publication No AAT 3303484)
Handler, M. W., Rey, J., Connell, J., Thier, K., Feinberg, A., & Putnam, R. (2007). Practical
considerations in creating school-wide positive behavior support in public schools.
Psychology in the Schools, 44(1), 29–39.

107
Hattie, J. (2005). The paradox of reducing class size and improving learning outcomes.
International Journal of Educational Research, 43, 387–425.
Hawken, L. S. (2006). School psychologists as leaders in the implementation of a targeted
intervention: The Behavior Education Program. School Psychology Quarterly, 21, 91–
111.
Hawken, L. S., MacLeod, K. S., & Rawlings, L. (2007). Effects of the Behavior Education
Program on office disciple referrals of elementary school students. Journal of Positive
Behavior Intervention, 9, 94–101.
Hayward, M.D., & Low, M. J. (2007). The contribution of endogenous opioids to food reward is
dependent on sex and background strain. Neuroscience, 144 (1), 17–25.
Heck, R. H., Lassen, T. J., & Marcoulides, G. A., (1990). Instructional leadership and school
achievement: Validation of a causal model. Educational Administration Quarterly, 26(2),
94–125.
Hendley, S. L. (2007). Use positive behavior support for inclusion in the general education
classroom. Intervention in School and Clinic, 42(4), 225–228.
Henry, S. (2009). School violence beyond columbine a complex problem in need of an
interdisciplinary analysis. American Behavioral Scientist, 52(9), 1246–1265.
Herman, K. C., Reinke, W. M., Lambert, S. F., & Ialongo, N. S. (2008). Low academic
Competence in first grade as a risk factor for depression cognitions and symptoms in
middle school. Journal of Counseling Psychology, 55(3), 400–410.
Hirsch, E. J., Lewis-Palmer, T., Sugai, G., & Schnacker, L. (2004). Using school bus discipline
referral data in decision making: Two case studies. Preventing School Failure, 48(4), 4–
9.

108
Horner, R. H. (2007). Discipline prevention data. Eugene, OR: University of Oregon, Office of
Special Education Programs Center on Positive Behavior Interventions and Supports.
Horner, R. H. (2003, March 27). Extending positive behavior support to whole schools:
Sustainable implementation. Keynote Address. First International Conference on Positive
Behavior Support. Orlando, Florida.
Horner, R. H., Dunlap, G., & Koegel, R. L. (Eds.). (1988). Generalization and maintenance:
Life-style changes in applied settings. Baltimore: Brookes.
Horner, R. H., Sugai, G., Anderson, C. M. (2010). Examining the evidence base for school-wide
positive behavior support. Focus on Exceptional Children, 42(8).
Horner, R. H., Sugai, G., Eber, L., & Lewandowski, H. (2004). Illinois Positive Behavior
Interventions and Support Project: 2003–2004 Progress Report. University of Oregon:
Center on Positive Behavior Interventions and Supports & Illinois State Board of
Education.
Horner, R. H., Sugai, G., Smolkowski, K., Eder, L., Nakasato, J., Todd, A., (2009). A
randomized, wait-list controlled effectiveness trial assessing school-wide positive
behavior support in elementary schools. Journal of Positive Behavior Interventions, 11,
133–144.
Horner, R. H., Todd, A., Lewis-Palmer, T., Irvin, L., Sugai, G., & Boland, J. (2004). The
school-wide evaluation tool (SET): A research instrument for assessing school-wide positive
behavior support. Journal of Positive Behavior Intervention, 6(1), 3–12.
Irvin, L. K., Horner, R. H., Ingram, K., Todd, A. W., Sugai, G., Sampson, N. K. (2006). Using
office discipline referral data for decision making about student behavior in elementary

109
and middle school: An empirical evaluation of validity. Journal of Positive Behavioral
Interventions, 8, 10–23.
Irvin, L. K., Tobin, T. J., Sprague, J. R., Sugai, G., & Vincent, C. G. (2004). Validity of office
discipline referral measures as indices of school-wide behavioral status and effects of
school-wide behavioral interventions. Journal of Positive Behavior Interventions, 6, 131–
147.
Iwata, B. A., Dorsey, M. F., Slifer, K. J., Bauman, K. E., & Richman, G. S. (1994). Toward a
functional analysis of self-injury. Journal of Applied Behavior Analysis, 2(27), 197–209.
Jones, J. (2010). Education department reviewing complaints about inequities in K–12 discipline,
supportive services. Diverse Issues in Higher Education, 27(20), 6.
Jones, V. C., Bradshaw, C. P., Haynie, D. L., Simons-Morton, B. G., Gielen, A. C., & Cheng, T.
L. (2009). A glimpse into urban middle schools on probation for “persistently dangerous”
status: Identifying malleable predictors of fighting. Journal of School Violence, 8(4),
284–300.
Kajs, L. T. (2006). Reforming the discipline management process in schools: An alternative
approach to zero tolerance. Educational Research Quarterly, 29(4), 16–27.
Kame’enui, E. J., & Darch, C. B. (2004). Instructional classroom management: A proactive
approach to behavior management (2nd ed.). White Plains, NY: Longman.
Kaplan, L. S., & Owings, W. A. (2002). The politics of teacher quality: Implications for
principals. NASSP Bulletin, 86(633), 22–41.
Kaufman, J. S., Jaser, S. S., Vaughan, E. L., Reynolds, J. S., Donato, D. D., Bernard, S. N., &
Hernandez-Brereton, M. (2010). Patterns in office referral data by grade, race/ethnicity,
and gender. Journal of Positive Behavior Interventions, 12(1), 44–54.

110
Kern, L., Choutka, C. M., & Sokol, N. G. (2002). Assessment-based antecedent interventions
used in natural settings to reduce challenging behavior: A review of the literature.
Education and Treatment of Children, 25, 113–130.
Kerr, M. M., & Nelson, C. M. (2002). Strategies for addressing behavior problems in the
classroom. Upper Saddle River, NJ: Merrill.
Kendler, H. H. (1987). Historical foundations of modern psychology. Chicago, IL: The Dorsey
Press.
Kimberlin, C., & Winterstein, G. (2008). Research Fundamentals, 65, 2277–2284.
Knoff, H. M. (2001). The stop & think social skills program: Grades 6-8 manual. Longmont,
CO: Sopris West Educational Services
Knoff, H. M. (2005). The stop & think parenting book: A guide to children’s good behavior.
Longmont, CO: Sopris West Educational Services.
Kobayashi, S., Nomoto, K., Watanabe, M., Hikosaka, O., Schultz, W., & Sakagami, M. (2006).
Influences of rewarding and aversive outcomes on activity in macaque lateral prefrontal
cortex. Neuron, 51(6), 861–870.
Kopel, D. B. (2009). Pretend gun-free school zones: A deadly legal fiction. Connecticut Law
Review, 42(2), 515–584.
Lane, K. L., Kalberg, J. R., Parks, R. J., & Carter, E. W. (2008). Student risk screening scale
initial evidence for score reliability and validity at the high school level, Journal of
Emotional and Behavioral Disorders, 16(3), 178–190.
Lane, K. L., Wehby, J., Menzies, H. M., Doukas, G. L., Munton, S. M., & Gregg, R. M. (2003).
Social skills instruction for students at risk for antisocial behavior: The effects of small-
group instruction. Behavioral Disorders, 28(3), 229–248.

111
Lasley, T. J., Siedentop, D., & Yinger, R. (2006). A systemic approach to enhancing teacher
quality: The Ohio model. Journal of Teacher Education, 57(1), 13–21.
Lassen, S. R., Steele, M. M., & Sailor, W. (2006). The relationship of school-wide positive
behavior support to academic achievement in an urban middle school. Psychology in the
Schools, 43(6), 701–712.
LaVigna, O. R., & Donnellan, A.M. (1986). Alternatives to punishment: Solving behavior
problems with non-aversive strategies. New York: Irvington.
Latham, G. (1988). The birth and death cycles of education innovations. Principal, 68(1), 41–43.
Lawson, H., & Sailor, W. (2000). Integrating services, collaborating, and developing connections
with schools. Focus on Exceptional Children, 33(2), 1–22.
Lee, Y., Sugai, G., & Horner, R. H. (1999). Using an instructional intervention to reduce
problem and off-task behaviors. Journal of Positive Behavior Interventions, 4 (1), 195–
204.
Lee, C. H. (2010). Personal and interpersonal correlates of bullying behaviors among Korean
middle school students. Journal of Interpersonal Violence, 25(1), 152–176.
Lewis, T. J., Barrett, S., Sugai, G., & Horner, R. H. (2010). Blueprint for schoolwide positive
behavior support training and professional development. National Technical Assistance
Center on Positive Behavior Interventions and Support, Eugene.
Lewis, T. J., Powers, L. J., Kely, M. J., & Newcomer, L. L. (2002). Reducing problem behaviors
on the playground: An investigation of the application of schoolwide positive behavior
supports. Psychology in the Schools, 39, 181–190.

112
Luiselli, J. K., Putnam, R. F., Handler, M. W., & Feinberg, A. B. (2005). Whole-school positive
Behavior Support: Effects on student discipline problems and academic performance.
Educational Psychology, 25(2–3), 183–198.
McIntosh, K., Campbell, A. L., Carter, D. R., & Dickey, C. R., (2009). Differential effects of a
tier two behavior intervention based on function of problem behavior. Journal of Positive
Behavior Interventions, 11, 68–81.
McIntosh, K., Filter, K. J., Bennett, J. L., Ryan, C., & Sugai, G. (2010). Principles of sustainable
prevention: Designing scale-up of School-wide Positive Behavior Support to promote
durable systems. Psychology in the Schools, 47(1), 5–21.
McIntosh, K., Horner, R. H., Chard, D. J., Boland, J. B., & Good III., R. H. (2006). The use of
reading and behavior screening measures to predict nonresponse to school-wide positive
behavior support: A longitudinal analysis. School Psychology Review, 35, 275–291.
McLaren, E, M., & Nelson, C. M. (2009). Using functional behavior assessment to develop
behavior interventions for students in Head Start. Journal of Positive Behavior
Interventions, 11(1), 3–21.
Meece, J., & McColskey, W. (1997). Improving student motivation: A guide for teachers and
school improvement teams.
Miltenberger, R. (1997). Behavior modification: Principles and procedures. Pacific Grove, CA:
Brooks/Cole.
Miltenberger, R. (2008). Behavior modification: Principles and procedures (4th ed.). Pacific
Grove, CA: Brooks/Cole

113
Morrison, B., Blood, P., & Thorsborne, M. (2005). Practicing restorative justice in school
communities: The challenge of culture change. Public Organization Review, 5(4), 335–
357.
Morrison, G. M., Anthony, S., Storino, M., & Dillon, C. (2001). An examination of the
disciplinary histories and the individual and educational characteristics of students who
participate in an in-school suspension program. Education and Treatment of Children, 24,
276–293.
Morrison, G. M., Furlong, M. J., D’Incau, B., & Morrison, R. L. (2004). The safe school:
Integrating the school reform agenda to prevent disruption and violence at school. In J. C.
Conoley & A. P. Goldstein (Eds.), School violence intervention: A practical handbook
(2nd ed., pp. 256–296). New York: The Guilford Press.
Monroe, C. R. (2005). Why are “bad boys” always black? Causes of disproportionality in school
discipline and recommendations for change. The Clearing House, 79(1), 45.
Morton, J. B. (2005a). Alabama Reading and Math Test: Specifications for reading grade 4
(Bulletin 2005, No. 83). Montgomery, AL: Alabama State Department of Education.
Morton, J. B. (2005b). Alabama Reading and Math Test: Specifications for mathematics grade 4
(Bulletin 2005, No. 84). Montgomery, AL: Alabama State Department of Education.
Nakasato, J. (2000). Data-base decision making in Hawaii’s behavior support effort. Journal of
Positive Behavior Interventions,2, 247–251.
National Association of Independent Schools (The). (2011, February 2). Assessment of
inclusivity and multiculturalism (AIM) [Web Post]. Retrieved from http://www.nais.org
Nelson, J. L., Palonsky, S. B., & McCarthy (2004). Critical issues in education: Dialogues and
dialectics (5th ed.). New York: McGraw Hill.

114
Newman, K. S. (2004). Rampage: The social roots of school shootings. NY: Basic Books.
No Child Left Behind Act of 2001, Pub. L. No. 107-110 (2001).
Noam, G. G., Warner, L. A., & Van Dyken, L. (2001). Beyond the rhetoric of zero tolerance:
Long-term solutions for at-risk youth. New Directions for Youth Development, 20, 155–
182.
Oliver, R. M., Wehby, J. H., & Reschly, D. J. (2011). Teacher classroom management practices:
Effects on disruptive or aggressive student behavior. Campbell Systematic Reviews,
2011.4. doi 10.4073/esr.2011.4
Opdenakker, M., & Van Damme, J. (2006). Teacher characteristics and teaching styles as
effectiveness enhancing factors of classroom practices. Teaching and Teacher Education,
22, 1–21.
Perdue, N. H., Manzeske, D. P., & Estell, D. B. (2009). Early predictors of school engagement:
Exploring the role of peer relationships. Psychology in the Schools, 46(10), 184–197.
Preciado, J. A., Horner, R. H., & Baker, S. K. (2009). Using a function-based approach to
decrease problem behavior and increase reading academic engagement for Latino English
language learners. Journal of Special Education, 42, 227–240.
Provasnik, S. (2006). Judicial activism and the origins of parental choice: The court’s role in the
institutionalization of compulsory education in the United States, 1891–1925. History of
Education Quarterly, 46(3), 311–347.
Public Citizens for Children and Youth. (2009). Positive behavior supports (PBS) in
Philadelphia: Where we’ve been and where we need to go. Report by PCCY (pp. 1–24).

115
Putnam, R. F., Handler, M., & O’Leary-Zonarich, C. (2003). Improving academic achievement
using school-wide behavioral support interventions. Paper presented at the Annual
Conference of the Association of Behavior Analysis. San Francisco, CA.
Putnam, R. F., Handler, M., Ray, J., & O’Leary-Zonarich, C. (2002). Classwide behavior
support interventions: Using functional assessment practices to design effective
interventions in general classroom settings. Paper presentation at the Annual Conference
of the Association of Behavior Analysis. Toronto, Canada.
Putman, R. F., Luiselli, J., Handler, M. W., & Jefferson, G. L. (2003). Evaluating student
discipline practices in a public school through behavioral assessment of office referrals.
Behavior Modification, 27, 505–523.
Putnam, R. P., Horner, H. H., & Algozzine R. (2006, January). Academic achievement and
implementation of school-wide behavior support. Positive Behavioral Interventions and
Supports Newsletter, 3(1), 1–6.
Raffaele-Mendez, L. M. (2003). Predictors of suspension and negative school outcomes: A
longitudinal investigation. New Directions for Youth Development, 99, 17–33.
Raffaele-Mendez, L. M., & Knoff, H. M. (2003). Who gets suspended from school and why: A
demographic analysis of schools and disciplinary infractions in a large school district.
Education and Treatment of Children, 26, 30–51.
Raffaele-Mendez, L. M., Knoff, H. M., & Ferron, J. M. (2002). School demographic variables
and out-of-school suspension rates: A quantitative and qualitative analysis of a large,
ethnically diverse school district. Psychology in the Schools, 39, 259–277.

116
Rausch, M. K., Skiba, R. J., & Simmons, A.B. (2005, April). The academic cost of discipline:
School disciplines contribution to achievement. Paper presented at the American
Educational Research Association Conference, Montreal, Canada.
Rettig, M. D., McCullough, L. L., Santos, K., & Watson, C. (2003). A blueprint for increase
student achievement. Educational Leadership, 61(3), 71–76.
Risley, T. R. (2003, March 27). Applied behavior analysis as a necessary, but not sufficient
component in the past and future of positive behavior support. Keynote address at the
First International Conference on Positive Behavior Support, Orlando, FL.
Ross, M., & Shannon, D. (2008). Applied quantitative methods in education. IA: Kendall/Hunt.
Ruble, L. A., & Akshoomoff, N. (2010). Autism spectrum disorders: Intervention options for
parents and educators. Communiqué Handout, 38(5), 1–6.
Ruiz, A., Ruiz, G., & Sherman, N. (2012). A longitudinal study on the effect of the Texas
behavior support initiative on rural middle school students. Rural Educator, 33(2), 225–
228.
Safran, S. P. (2006). Using the effective behavior supports survey to guide development of
school-wide positive behavior support. Journal of Positive Behavior Support, 8, 3–9.
Safran, S. P., & Oswald, K. (2003). Positive behavior supports: Can schools reshape disciplinary
practices? Exceptional Children, 69, 361–373.
Sailor, W., & Paul, J. (2004). Framing positive behavior support in the ongoing discourse
concerning the politics of knowledge. Journal of Positive Behavior Interventions, 6, 37–
49.
Sailor, W., & Roger, B. (2005). Rethinking inclusion: Schoolwide applications. Phi Delta
Kappan, 86, 503–509.

117
Sailor, W., Stowe, M. J., Turnbull III, H. R., & Kleinhammer-Tramill, P. J. (2007). A case or
adding a social-behavioral standard to standards-based education with schoolwide
positive behavior support as its basis. Remedial & Special Education, 28(6), 366–376.
Scott, T. M., & Barrett, S. B. (2004). Using staff and student time engaged in disciplinary
procedures to evaluate the impact of school-wide PBS. Journal of Positive Behavior
Interventions, 6(1), 21–27.
Scott, T. M. (2001). A school-wide example of positive behavior support. Journal of Positive
Behavior Interventions, 3, 88–94.
Scott, T. M., & Caron, D. (2006). Functional behavior assessment at the school-wide level:
Determining predictability and function of typical problem behaviors. Preventing School
Failure 50(1), 13–20.
Scott, J. S., White, R., Algozzine, B., & Algozzine, K. (2009). Effects of positive unified
behavior support on instruction. The International Journal on School Disaffection, 6(2),
41–48.
Simonsen, B., Myers, D., & Briere, D. E. (2011). Comparing a behavioral check-in/check-out
(CICO) intervention to standard practice in an urban middle school setting using an
experimental group design. Journal of Positive Behavior Interventions, 13(1), 31–48.
Sitaraman, D., Zars, M., & Zars, T. (2007). Reinforcement pre-exposure enhances spatial
memory formation in Drosophila. Journal of Comparative Physiology A: Neuroethology,
Sensory, Neural & Behavioral Physiology, 193(8), 903–908.
Skiba, R. J. (2000). Zero tolerance, zero evidence: An analysis of school disciplinary practice.
Indiana: Indiana Education Policy Center.

118
Skiba, R. J., Horner, R. H., Chung, C., Rausch, M. K., May, S. L., & Tobin, T. (2011). Race is
not neutral: A national investigation of African American and Latino disproportionality
in school discipline. School Psychology Review, 40(1), 85–107.
Skiba, R. J., & Knesting, K. (2001). Zero tolerance, zero evidence: An analysis of school
disciplinary practice. New Directions for Youth Development, 92, 17–43.
Skiba, R. J., Micheal, R. S., Nardo, A. C., & Peterson, R. L. (2002). The color of discipline:
Sources of racial and gender disproportionality on school punishment. Urban Review,
34(4), 317–342.
Skiba, R. J., & Peterson, R. L. (2000). School discipline at a crossroads: From zero tolerance to
early response. Exceptional Children, 66(3), 335–347.
Skiba, R. J., Rausch, M. K., & Ritter, S. (2005). The National Conference of the Hamilton Fish
Institute on School and Community Violence: Persistently Safe Schools Conference.
Purdue, IN: Indiana University Center for Evaluation and Education Policy.
Skinner, B. F. (1938). The behavior of organisms: An experimental analysis. New York: D.
Appleton-Century Company.
Slavin, R. E. (2003). Educational psychology theory and practice (7th ed). New York: Pearson
Education, Inc.
Southern Education Foundation (The). (2008a). Dead end: Dropout crisis imperils Alabama’s
economy. Montgomery, AL: Southern Education Foundation.
Southern Education Foundation (The). (2008b). High school dropouts: Alabama’s number one
education and economic problem. Atlanta, GA: The Southern Education Foundation.

119
Southern Poverty Law Center. (2008, July). Effective discipline for student success: Reducing
student and teacher dropout rates in Alabama. Montgomery, AL: Southern Poverty Law
Center.
Sprague, J., Golly, A., Bernstein, L., Munrkes, A. M., & March, R. M. (1999). Effective school
classroom discipline: A training manual. Eugene, OR: University of Oregon, Institute on
Violence and Destructive Behavior.
Sprague, J., & Perkins, K. (2009). Direct and collateral effects of the first step to success
program. Journal of Positive Behavior Interventions, 11(4), 208–221.
Sprague, J., Sugai, G., Horner, R., & Walker, H. (1999). Using office discipline referral data to
evaluate school-wide discipline and violence preventions interventions. Oregon School
Study Council, 42(2).
Stader, D. L. (2004). Zero tolerance as public policy: The good, the bad, and the ugly. Clearing
House, 78, 62–66.
Steege, M. W., & Watson, T. S. (2009). Conducting school-based functional behavioral
assessments. New York: The Guilford Press.
Stewart, R. M., Benner, G. J., Martella, R. C., & Marchand-Martella, N. E. (2007). Three-tier
models of reading and behavior: A research review. Journal of Positive Behavior
Interventions, 9, 239–253.
Stokes, T. F. & Baer, D. M. (1977). An implicit technology of generalization. Journal of Applied
Behavior Analysis 10(2), 349–367.
Stormont, M., Reinke, W. M., & Herman, K. C. (2010). Introduction to the special issue: Using
prevention science to address mental health issues in schools. Psychology in the Schools,
47(1), 1–4.

120
Sugai, G. (2013). Using systems, data, & practices interdependently to drive school and district-
wide improvement. Retrieved from
www.pbis.org/common/pbisresources/.../School_improvement_big_ideas.pdf
Sugai, G., & Horner, R. H. (2002a). The evolution of discipline practices: School-wide positive
behavior supports. Behavior Psychology in the Schools, 23–50.
Sugai, G., & Horner, R. H. (2002b). Introduction to a special series on positive behavior support
in schools. Journal of Emotional & Behavioral Disorders, 10, 130–135.
Sugai, G., Horner, R. H., & McIntosh, K. (2007). Best practices in developing a broad-scale
system of school-wide positive behavior support. Best Practices in School Psychology,
1–15.
Sugai, G., Horner, R. H., Sailor, W., Dunlap, G., Eber, L., Lewis, T., Kincaid, D., Scott, T.,
Barrett, S., Algozzine, R., Putnam, R., Massanari, C., & Nelson, M. (2010). School-wide
positive behavior support: Implementers’ blueprint and self-assessment. Eugene, OR:
University of Oregon.
Sugai, G., Lewis-Palmer, T., & Hagan-Burke, S. (1999-2000). Overview of the functional
behavioral assessment process. Exceptionality, 8, 149–160.
Sugai G., Lewis-Palmer, T., Todd, & Horner, R. H. (2001). School-wide evaluation tool. Eugene:
University of Oregon.
Sugai, G., & Simonsen, B. (2012). Positive behavioral Interventions and supports: History
defining features and misconceptions. University of Connecticut, Center for PBIS &
Center for Positive Behavioral Interventions and Supports.

121
Sugai, G., Sprague, J. R., Horner, R. H., & Walker, H. M. (2000). Preventing school violence:
The use of office discipline referrals to assess and monitor schoolwide discipline
intervention. Journal of Emotional & Behavioral Disorders, 8, 94–102.
Suh, S., & Suh, J. (2007). Risk factors and levels of risk for high school dropouts. Professional
School Counseling, 10(3), 297–306.
Sulver-Azaroff, B., & Mayer, G. R. (1991). Behavior analysis for lasting change. Fort Worth,
TX: Holt, Rinehart & Winston.
Sutherland, K. S., Lewis-Palmer, T., Stichter, J., & Morgan, P. L. (2008). Examining the
influence of teacher behavior and classroom context on the behavioral and academic
outcomes for students with emotional or behavioral disorders. Journal of Special
Education, 41(4), 223–233.
Taylor, J. (2003). Institutional diversity in UK higher education: Policy and outcomes since the
end of the binary divide. Higher Education Quarterly, 57(3), 266–193
Taylor-Greene, S. (1997). School-wide behavioral support: Starting the year off right. Journal of
Behavioral Education, 7, 99–112.
Tincani, M. (2007). Moving forward: Positive behavior support and applied behavior analysis.
The Behavior Analyst Today, 4(8), 492–499.
Tobin, T., Sugai, G., & Colvin, G. (1996). Patterns in middle school discipline records. Journal
of Emotional and Behavioral Disorders, 4. Retrieved from
https://aumnicat.aum.edu/login?url=http://search.ebscohost.com/login.aspx?direct=true&
db=aph&AN=9605152724&site=ehost-live
Tuckman, B. (1988). Conducting educational research. Orlando FL: Harcourt Brace Jovanovich.

122
Todd, A. W., Campbell, A. L., Meyer, G. G., & Horner, R. H. (2008). The effects of a targeted
intervention to reduce problem behaviors: Elementary school implementation of check
in–check out. Journal of Positive Behavior Interventions, 10(1), 46–55.
Turnbull, H. R., Stowe, M., & Huerta, N. (2007). Free appropriate public education: Law and
the education of children with disabilities (7th ed.). Denver: Love.
U.S. Department of Education. (2005). Office of civil rights elementary and secondary school
survey: 2000. Washington, DC: U.S. Department of Education.
U.S. Office of Special Education Programs’ Technical Assistance Center on Positive Behavioral
Interventions and Supports. (2010). PBIS home. Retrieved November 2, 2010, from
http://www.pbis.org
Utley, C. A., & Sailor, W. (Eds.). (2002). Urban issues. Journal of Positive Behavior
Interventions, 4(4).
Vanderstaay, S. L. (2006). Learning from longitudinal research in criminology and the health
sciences. Reading Research Quarterly, 41, 328–350.
Varnham, S., (2005). Seeing things differently: Restorative justice and school discipline.
Education and Law, 17, 87–104.
Vaughn, S., Wanzek, J., Murry, C. S., Sammacca, N., Linan-Thompson, S., Woodruff, A. L.
(2009). Response to early reading intervention: Examining higher and lower responders.
Exceptional Children, 75, 165–183.
Wahlstrom, K. L., Louis, K. S., Leithwood, K., & Anderson, S. (2010). Investigating the links to
improved student learning: Executive summary of research findings.
123
Walker, H. M., Horner, R. H., Sugai, G., Bullis, M., Sprague, J. R., Bricker, D., & Kaufman, M.
J. (1996). Integrated approaches to preventing antisocial behavior patterns among school-
age children and youth. Journal of Emotional and Behavioral Disorders, 4(4), 194–209.
Walker, J. E., Shea, T. M., & Bauer, A. M. (2007). Behavior management: A practical approach
for educators (9th ed.). Upper Saddle River, NJ: Pearson.
Wallace, J. M., Goodkind, S., Wallace, C. M., & Bachman, J. G. (2008). Racial, ethnic, and
gender differences in school discipline among U.S. high school students: 1991–2005.
Negro Education Review, 59(1–2), 47–62.
Weiss, M. J., DelPizzo-Cheng, E., LaRue, R. H., & Sloman, K. (2009). ABA and PBS: The
dangers in creating artificial dichotomies in Behavioral Intervention. The Behavior
Analyst Today, 10(3–4), 428–439.
White House, Education (The). (n.d.). American Recovery and Reinvestment Act. Retrieved
September 8, 2010, from http://www.whitehouse.gov/issues/education
Witt, J. C., VanDerHeyden, A. M., & Gilbertson, D. (2004). Troubleshooting behavioral
interventions. A systematic process for finding and eliminating problems. School
Psychology Review, 33, 363–383.
Winkel G., Saegert, S., & Evans, G. W. (2009). An ecological perspective on theory, methods,
and analysis in environmental psychology: Advances and challenges. Journal of
Environmental Psychology, 29(3), 318–328.
Yell, M. L., & Rozalski, M. E. (2008). The impact of legislation and litigation on discipline and
student behavior in the classroom. Preventing School Failure, 52, 7–16.
Yeo, F. (1997). Teacher preparation and inner-city schools: Sustaining educational failure. The
Urban Review, 29, 127–143.

124
Zhang, D., Katsiyannis, A., & Herbst, M. (2004). Disciplinary exclusions in special education: A
4-year analysis. Behavioral Disorders, 4, 337–347.