Embed Size (px)
Citation preview

An evolutionary breeding approach to
improve bread quality of spring wheat
for low input organic farming systems
Trials from 2011-2013, Scientific report
Edwin Nuijten

© 2019 Louis Bolk Instituut
An evolutionary breeding approach to improve bread qual-
ity of spring wheat for low input organic farming systems - Tri-
als from to 2011-2013 - Trials from 2011-2013, Scientific report
Dr. Edwin Nuijten
Publication number 2019-015 LbP
26 pages
This publication is available on
www.louisbolk.org/publications
www.louisbolk.nl
T +31 343 523 860
Kosterijland 3-5
3981 AJ Bunnik
The Netherlands
@LouisBolk
Louis Bolk Institute: Louis Bolk Institute: Research and advice
to advance sustainable agriculture, nutrition and health

Contents 3
Contents
Summary 4
1 Introduction 5
The aim and hypotheses of this research 6
2 Material and Methods 7
3 Results 10
Comparison over three years 10 Other parameters 14 Comparison of effect of selection strategies in two countries 14 Comparison of populations in the Netherlands in 2013 17
4 Discussion, prospects and conclusions 24
References 26

4 An evolutionary breeding approach to improve bread quality of spring wheat for low input organic farming systems
Summary
The Dutch organic agriculture is in need of wheat varieties adapted to organic conditions.
Modern wheat varieties do not give satisfactory baking quality when grown under organic
and low input conditions. More diversity within varieties would make varieties more stable,
adaptable and resilient against stresses. However, natural selection results in phenotypes
with increased natural fitness, and baking quality traits are not directly correlated to fitness.
Therefore evolutionary breeding is not expected to improve bread making properties of
wheat. The overall aim of our research is to provide the organic sector with a new decen-
tralized (participatory) wheat breeding approach that allows for the selection of locally
adapted high baking quality varieties. In this project natural selection has been compared
with various selection approaches by the breeder and selection by the farmers. During three
years the overall performance of three composite cross populations (CCPs) has been com-
pared with two varieties commonly grown organically in the Netherlands and Germany. In
the last year the new selections have been compared with the original populations and the
two standard varieties. Results show that the populations have better yield stability than the
varieties, and equal or slightly better baking quality. The selection approaches had no effect
on yield and baking quality parameters (protein content, sedimentation, Hagberg falling
number, gluten content and gluten index). However, the selections made by the breeder
and the farmers resulted in populations with increased plant height and lower tillering. The
breeder prefers his selection approach as it results in lower tillering which in turn should im-
prove baking quality, but the farmers prefer natural selection as they prefer high tillering to
improve weed competitiveness. Hence, the modified selection approach has had no effect
on yield and baking quality but does have effect on various agronomic traits. The effect on
the agronomic traits is appreciated differently by the breeder and the farmers. Two popula-
tions with the highest yield potential, good yellow rust resistance and lodging tolerance will
be cultivated by seven farmers in 2014.

Introduction 5
1 Introduction
Organic spring wheat growers in Netherlands and Sweden rely on a limited number of varie-
ties that were developed 15-20 years ago (Thasos and Lavett in NL; Dacke in Sweden). To
diminish this dependence on a limited number of varieties and increase diversity on their
farms they are looking for new varieties.
However, more modern wheat varieties do not give satisfactory baking quality when grown
under organic and low input conditions (Osman et al., 2008; Wolfe et al., 2008). Besides high
baking quality, varieties for the organic sector also should possess a number of other traits to
support organic cropping conditions like e.g. rapid early growth and longer straw to sup-
press weeds. Such traits are also rare in modern wheat varieties (Baresel, 2006; Lammerts van
Bueren et al, 2010).
A further concern of the organic sector is the genetic structure of modern varieties. Diversity
is an important component of organic management to deal with biotic (pests, diseases)
and abiotic (e.g. drought) stresses and more heterogeneity in soil fertility. However, the main
stream breeding method – pedigree selection - results in varieties with a high degree of ge-
netic homogeneity. Maintaining more genetic diversity within varieties would make crops
more resilient against stresses (Finckh, 2008). Furthermore, the genetic diversity would also al-
low such varieties to co-evolve with changes in climate and adapt itself to new growing en-
vironments (farms).
Main stream conventional breeding may be able to develop varieties with traits like better
baking quality and weed suppressiveness by merely shifting priorities in selection to these
traits and conduct (part of) the selection under organic conditions (Löschenberger et al,
2008; Wolfe et al., 2008). Creating more genetically diverse varieties would require a funda-
mentally different breeding approach.
Evolutionary breeding is such an approach that was first studied in the 1930s (Suneson, 1956)
and currently revived by a number of organic breeding groups (Philips & Wolfe, 2005; Mur-
phy et al., 2005). Evolutionary breeding consists of creating highly diverse populations by
mixing the progenies of crosses between multiple varieties with contrasting traits. These
highly diverse populations are generally called Composite Cross Populations (CCP). In sub-
sequent generations these CCPs are allowed to adapt to the environment by simply multi-
plying these in bulk. Selection is mainly conducted by the growing environment itself (natural
selection) but may be complemented by mild, simple, low budget forms of selection like
roguing undesired plant types and removing smaller grades of seeds during seed cleaning.
According to a number of authors, especially under low input conditions, natural selection in
CCPs has resulted in increased yield, yield stability and agronomic performance (Soliman &

6 An evolutionary breeding approach to improve bread quality of spring wheat for low input organic farming systems
Allard, 1991; Danquah & Barrett, 2002; Phillips & Wolfe, 2005). Natural selection results in phe-
notypes with increased natural fitness. However, baking quality traits are not directly corre-
lated to fitness and therefore evolutionary breeding is not expected to improve bread mak-
ing properties of wheat (Dawson et al, 2008).
To overcome this draw back, in the USA Murphy et al (2005) propose a combination of evo-
lutionary and directional selection. In this research we studied a similar modified evolution-
ary breeding approach that also currently is under development at the German organic
spring wheat breeding programme of Getreidezűchtungsforschung Dottenfelderhof (GD). In
this modified evolutionary breeding scheme CCPs are grown by farmers, but every second
generation progenies of ears selected at the farm are grown at the breeding station and
tested for quality traits. Best lines are mixed again and the CCPs are returned to the farmer
for further on farm selection.
The aim and hypotheses of this research
The overall aim of our research is to provide the organic sector with a new decentralized
(participatory) wheat breeding approach that allows for the selection of locally adapted
high baking quality varieties. Therefore in this research we have:
Studied the effect of evolutionary breeding on baking quality and yield
Compared the results of a modified evolutionary breeding approach with a regular evo-
lutionary breeding approach on baking quality and yield.
The hypotheses that were tested are:
1. CCPs that have been multiplied three cycles at a low input organic location have im-
proved yield in comparison to the original population
2. Baking quality traits (protein content, SDS-sedimentation, wet gluten content, gluten in-
dex, Hagberg falling number and loaf volume) of CCPs that have been multiplied for
three generations are similar to the original population
3. The modified evolutionary breeding scheme results in both improved yield as well as im-
proved baking quality traits (see hypothesis 2) compared to the regular evolutionary
breeding scheme.
4. CCPs that have been multiplied for three cycles at an organic farm are higher yielding
at that particular farm, than CCPs that have been multiplied at the breeding station in
another agro-ecological region.

Material and Methods 7
2 Material and Methods
Research period
January 1, 2011 – December 31, 2013
Research sites
Site 1: organic farm with average sandy soils in the Netherlands
Site 2: organic (bio-dynamic) breeding nursery of GD with relatively fertile loamy soils in Ger-
many.
Materials: populations and standard varieties
To assemble CCPs for the evolutionary breeding scheme1, F4 populations from the regular
scheme with outstanding performance for baking quality traits (protein content, SDS-sedi-
mentation value – measure for protein quality) and agronomic traits (plant health, vigour,
yield) are mixed into new populations. These new CCPs consist of seeds of between 4 and 8
F4-populations that originate from different crosses. After mixing these CCPs are available to
farmers to start evolutionary breeding on their farm.
For this experiment, three CCPs, ER II-2008, ER III-2009 and ER-IV-2009, were grown at Site 1
and Site 2, together with the two standard varieties, Lavett and Thasos. CCP ER II-2008 is sup-
posed to have better baking quality than ER III-2009 and ER-IV-2009. Under organic condi-
tions, Lavett is the common summer wheat cultivated in the Netherlands and Thasos is more
commonly cultivated in Germany.
Set-up
Each year trials were sown in a randomized block design with four replications in both sites.
Harvests were carried out with a trial plot harvester.
2011 Three CCPs were grown at Site 1 and Site 2, together with the two standard varieties.
Shortly before harvest at both sites about 200 ears/CCP were selected, based on ear
size, ear health, and plant-health. After harvest a further visual selection among the
200 ears was made, based on vitreousness of the kernels as vitreous kernels are ex-
pected to have higher protein contents. Additionally, two farmers (HM and J) have
made ear selections of respectively 50 and 150 good ears per population.
2012 For the ordinary evolutionary breeding scheme the harvest of the three CCPs is sown
at the same sites again and compared with the standard varieties. For the modified
evolutionary breeding scheme the selected ears of 2011 were sown as ear-rows at site
2 (per population about 150 to 170 ear rows). The harvest of these ear-rows was se-
lected for plant traits (plant length, ear size, lodging tolerance, tillering and general
stand) and grain quality traits (vitreousness of the kernels and SDS-sedimentation) by
the breeder of GD. To improve the selection process, it has been decided not only to
1 The regular spring wheat breeding scheme of GD starts with three generations of bulk multiplication
(with selection for seed size), followed by a typical pedigree breeding scheme from the F4 generation
onwards.
8 An evolutionary breeding approach to improve bread quality of spring wheat for low input organic farming systems
select between rows based on vitreousness of the kernels, but also based on SDS-sedi-
mentation. In order to make sure that this is financially feasible, it has been decided at
this stage to give less priority to protein content. The selections of the farmers have
been multiplied in small plots.
2013 At Site 1 the following material was compared: the harvest of the three CCPs of 2012
of site 1, the improved CCPs with Dutch and German origin, the stored samples of the
original seeds (harvest 2010) of the CCPs, bulked ear selections conducted by two
farmers in 2011 for all three populations, and the two standard varieties. Additionally,
at site 2 a trial was conducted including the original populations, the improved popu-
lations with Dutch and German origin and the two standard varieties.
Field evaluations
During the growing season the trials were evaluated for standard criteria for Dutch organic
variety trials, namely soil cover, plant health, susceptibility to leaf and ear diseases, plant
length, earliness and grain yield. Additionally, at site 1 number of ears / square meter were
measured in 2013.
Laboratory analyses and baking trials
Samples of all accessions were analysed for standard quality parameters (SDS-sedimenta-
tion, Hagberg Falling number, wet gluten content and gluten index) at the lab of GD. In
2012 and 2013 protein content was analysed for site 1.
Baking trials and bread evaluation were carried out in close collaboration with a commer-
cial organic baker. Baking recipe included whole meal flour, water, yeast and salt, without
any further additions of bread improvers.
Ear selections for improved CCPs
In 2012, of each CCP 150 to 170 individual ear progenies were sown and evaluated at the
research farm in Germany. Before harvest, about 60 progenies were selected per CCP
based on ear-size (big and droopy: heavy kernels and better run-off of rain water), plant
height: not too tall and not too short, tolerance for lodging, earliness (not too late). Some dif-
ferences were observed between ear progenies selected in the Netherlands and Germany
in 2011.
ER II-2008: the Dutch ear progenies were more diverse (in terms of plant height, lodging
and yield) than the German ear progenies.
ER III-2009: the German ear progenies were more diverse, particularly in terms of lodging.
ER IV-2009: No clear difference was observed between the ear progenies from the Neth-
erlands and Germany. Compared to ER II-2008 and ER III-2009, they looked relatively ho-
mogeneous.
Weather
2011: Weather conditions were exceptional in the Netherlands. After the sowing of the trial in
mid-March, there was hardly any rainfall till mid-June, the time of flowering. August, the

Material and Methods 9
month of harvesting, was characterized by continuous rainfall, leading to delayed harvest-
ing which in turn resulted in sprouting in the ear, particularly with the CCPs.
2012: Weather conditions were quite average. A good year for cereal growth: temperatures
were moderate during the season, and with adequate rainfall.
2013: Temperature in the Netherlands was below average after sowing, and average from
June onwards. The time of ripening was characterized with little rainfall. There was no diffi-
culty with the harvesting of the trial.

10 An evolutionary breeding approach to improve bread quality of spring wheat for low input organic farming systems
3 Results
The results are described in three sections:
-a comparison over three years over two locations of the populations versa the varieties
-a comparison of selection strategies by the breeder over two locations
-a comparison of selection strategies, including selection by farmers over one location
Comparison over three years
Based on a comparison of two trial sites and three seasons the populations have yields similar to
the two varieties, and somewhat better baking quality than the two varieties. The values of the
CCPS for SDS sedimentation are somewhat higher than for the standard varieties and are very ac-
ceptable according to Dutch baking standards. Also the values for Hagberg falling number are
good, except for those in 2011 which were due to the wet weather which caused a delay in har-
vesting. In particular CCP ER II-2008 had a low Hagberg falling number. It was thought that the ger-
mination in the ear would be most in the ears that have better baking quality2, and as a result bak-
ing quality would decrease, but the figures in table 1 for CCP ER II-2008 indicate this seems not the
case. The values for wet gluten content are better for the CCPs than for the standard varieties. The
wet gluten percentages at the Dutch trial site are much higher in 2012 than in 2011 and 2013,
which almost automatically means lower values for gluten index in 2012 compared to 2011 and
2013. At the German trial site fewer differences were visible. Differences in grain yield seem not to
have a clear relationship with differences in one of the baking quality parameters. To explain dif-
ferences in baking quality parameters we would need to consider a complex of additional factors,
such as vegetative growth and weather conditions at various stages of plant growth.
No clear differences in yield were found between the cultivars and the populations (Tables 1 and
2). Population ER II-2009 tends to have the lowest yield in both trial sites. An interaction between
accession and year was observed for the cultivars but not for the populations (Tables 2a and 2b),
which confirms that populations have better yield stability than varieties. Population ER IV-2009
seems to be the most stable as it has the lowest levels of significance for year and country effect
(Table 3). In general, yields at the German trial site were higher than at the Dutch trial site. Im-
portant to notice is the low yield of the CCPs at the Dutch trial site in 2011 (Table 1). In the Nether-
lands, growing conditions were most favourable in 2013, followed by 2012, while in 2011 the first
part of the growing season was extremely dry, and the second part very wet. Yields of 5 to 6
ton/ha are considered very good for organic farming on sandy soils in the Netherlands. In Ger-
many yields were somewhat better in 2011 and 2012 compared to 2013, but generally the differ-
ences are not very big.
2 Observations in the field showed that the genotypes of CCP ER II-2008 with best baking quality parameters
had highest levels of sprouting in the ears, which concurs with the lowest Hagberg falling number.

Results 11
The baking parameters give somewhat contrasting results. For sedimentation no interaction terms
are observed (Table 2), whereas for the other three parameters (Hagberg falling number, wet glu-
ten and gluten index) all interaction terms are highly significant. The results on sedimentation show
that population ER III-2009 has the highest level and the variety Thasos has the lowest level in both
countries over all years (LSD for variety is 2.2). Population ER II-2008 seems to be the most stable in
sedimentation (Table 3).
For Hagberg Falling number the interaction terms are smaller for the varieties than for the popula-
tions (Tables 2a and 2b), indicating that the varieties are more stable than the populations. The
lower levels of significance in Table 3 indicate that the variety Thasos is more stable for Hagberg
Falling number than the variety Lavett and the populations.
Wet gluten shows the highest significance levels for all interaction terms. When analyzing the varie-
ties and the populations separately, large significant interactions remain for Year x Country (Tables
2a and 2b). The term Year x County is particularly large for the populations. For the populations,
the Accession x country term is also significant. Hence, it can be deduced that the cultivars are
more stable in wet gluten than the populations. However, in both locations the populations tend
to have higher levels of wet gluten compared to the varieties across the three seasons (Table 1).
Also, population ER II-2008 has consistently higher levels of wet gluten compared to the other two
populations in both locations over all seasons. In regards of the two varieties, it cannot be de-
duced which has a higher wet gluten content over the other. So, the better stability of the two va-
rieties is likely related to their relatively lower levels of wet gluten.
For gluten index the interactions seem smaller for the cultivars than for the populations (Tables 2a
and 2b). Gluten index tends to be negatively related with wet gluten content. Because the differ-
ences for wet gluten content are larger among the populations, the gluten index also varies more
for the populations than for the cultivars. Based on Table 3, it cannot be deduced which of the va-
rieties and populations is more stable in gluten index. Also, it cannot be deduced whether the vari-
eties or the populations as a group are more stable or more adapted.
12 An evolutionary breeding approach to improve bread quality of spring wheat for low input organic farming systems
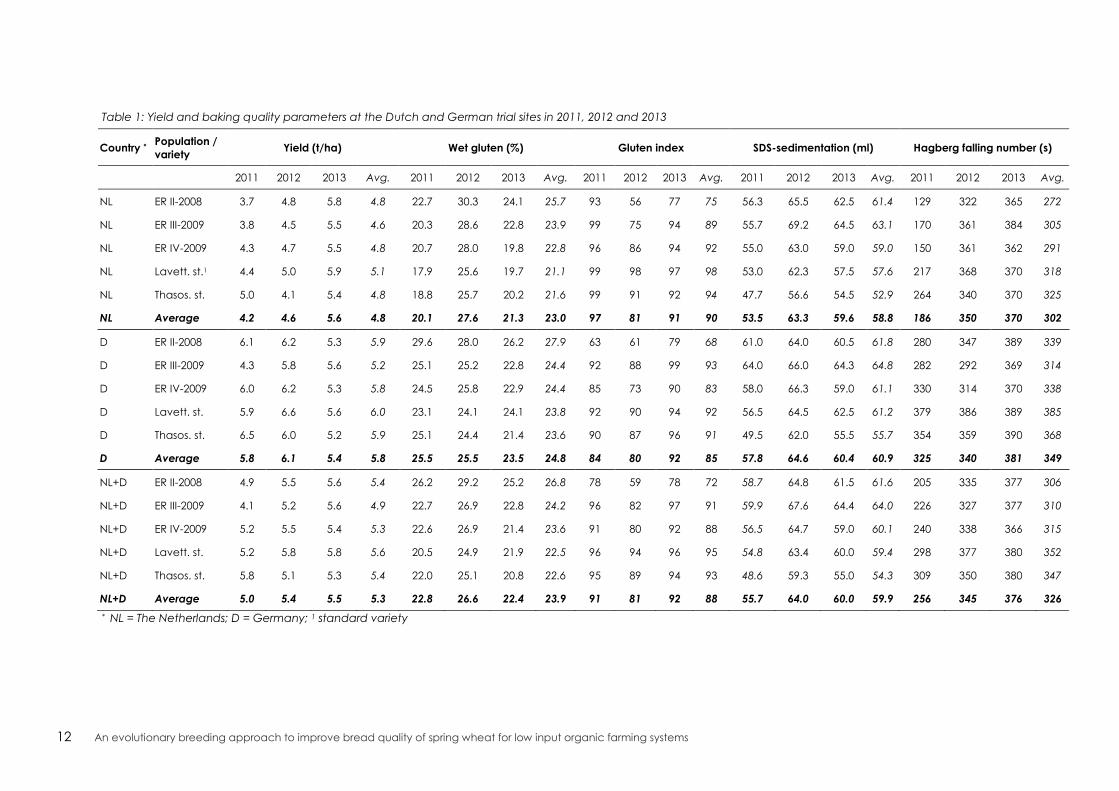
Table 1: Yield and baking quality parameters at the Dutch and German trial sites in 2011, 2012 and 2013
Country * Population /
variety Yield (t/ha) Wet gluten (%) Gluten index SDS-sedimentation (ml) Hagberg falling number (s)
2011 2012 2013 Avg. 2011 2012 2013 Avg. 2011 2012 2013 Avg. 2011 2012 2013 Avg. 2011 2012 2013 Avg.
NL ER II-2008 3.7 4.8 5.8 4.8 22.7 30.3 24.1 25.7 93 56 77 75 56.3 65.5 62.5 61.4 129 322 365 272
NL ER III-2009 3.8 4.5 5.5 4.6 20.3 28.6 22.8 23.9 99 75 94 89 55.7 69.2 64.5 63.1 170 361 384 305
NL ER IV-2009 4.3 4.7 5.5 4.8 20.7 28.0 19.8 22.8 96 86 94 92 55.0 63.0 59.0 59.0 150 361 362 291
NL Lavett. st.1 4.4 5.0 5.9 5.1 17.9 25.6 19.7 21.1 99 98 97 98 53.0 62.3 57.5 57.6 217 368 370 318
NL Thasos. st. 5.0 4.1 5.4 4.8 18.8 25.7 20.2 21.6 99 91 92 94 47.7 56.6 54.5 52.9 264 340 370 325
NL Average 4.2 4.6 5.6 4.8 20.1 27.6 21.3 23.0 97 81 91 90 53.5 63.3 59.6 58.8 186 350 370 302
D ER II-2008 6.1 6.2 5.3 5.9 29.6 28.0 26.2 27.9 63 61 79 68 61.0 64.0 60.5 61.8 280 347 389 339
D ER III-2009 4.3 5.8 5.6 5.2 25.1 25.2 22.8 24.4 92 88 99 93 64.0 66.0 64.3 64.8 282 292 369 314
D ER IV-2009 6.0 6.2 5.3 5.8 24.5 25.8 22.9 24.4 85 73 90 83 58.0 66.3 59.0 61.1 330 314 370 338
D Lavett. st. 5.9 6.6 5.6 6.0 23.1 24.1 24.1 23.8 92 90 94 92 56.5 64.5 62.5 61.2 379 386 389 385
D Thasos. st. 6.5 6.0 5.2 5.9 25.1 24.4 21.4 23.6 90 87 96 91 49.5 62.0 55.5 55.7 354 359 390 368
D Average 5.8 6.1 5.4 5.8 25.5 25.5 23.5 24.8 84 80 92 85 57.8 64.6 60.4 60.9 325 340 381 349
NL+D ER II-2008 4.9 5.5 5.6 5.4 26.2 29.2 25.2 26.8 78 59 78 72 58.7 64.8 61.5 61.6 205 335 377 306
NL+D ER III-2009 4.1 5.2 5.6 4.9 22.7 26.9 22.8 24.2 96 82 97 91 59.9 67.6 64.4 64.0 226 327 377 310
NL+D ER IV-2009 5.2 5.5 5.4 5.3 22.6 26.9 21.4 23.6 91 80 92 88 56.5 64.7 59.0 60.1 240 338 366 315
NL+D Lavett. st. 5.2 5.8 5.8 5.6 20.5 24.9 21.9 22.5 96 94 96 95 54.8 63.4 60.0 59.4 298 377 380 352
NL+D Thasos. st. 5.8 5.1 5.3 5.4 22.0 25.1 20.8 22.6 95 89 94 93 48.6 59.3 55.0 54.3 309 350 380 347
NL+D Average 5.0 5.4 5.5 5.3 22.8 26.6 22.4 23.9 91 81 92 88 55.7 64.0 60.0 59.9 256 345 376 326
* NL = The Netherlands; D = Germany; 1 standard variety

Results 13
Table 2: F and p-values for the various components (country, year, accession and their interactions) for
yield and the baking quality parameters, based on all accessions, two trial sites and the years 2011 to
2013, calculated with ANOVA (* = p ≤ 0.05; ** = p ≤ 0.01 and *** ≤ 0.001).
Accession Year Country Accession x
Year
Accession x
Country
Year x Coun-
try
Accession x
Year x Country
Yield (t/ha) 2.92
*
4.83
**
66.73
***
3.52
***
0.65
25.14
***
1.41
SDS-sedimentation
(ml)
17.42
***
41.53
***
9.11
**
0.56
0.77
2.94
1.34
Hagberg falling num-
ber (s)
29.72
***
413.31
***
193.02
***
9.63
***
7.41
***
152.69
***
7.79
***
Wet gluten (%) 16.23
***
541.18
***
506.79
***
50.75
***
39.91
***
350.71
***
41.23
***
Gluten
Index
72.13
***
43.36
***
12.29
***
4.01
***
5.28
***
15.09
***
4.4
***
Table 2a: F and p-values for the various components (country, year, accession and their interactions) for
yield and the baking quality parameters, based on the cultivars Thasos and Lavett, two trial sites and the
years 2011 to 2013, calculated with ANOVA (* = p ≤ 0.05; ** = p ≤ 0.01 and *** ≤ 0.001).
Accession Year Country Accession x
Year
Accession x
Country
Year x Coun-
try
Accession x
Year x Country
Yield (t/ha) 0.02
0.09
35.78
***
5.95
**
1.05
12.59
***
1.9
SDS-sedimentation
(ml)
20.92
***
21.79
***
12.89
***
0.22
0.1
0.06
1.11
Hagberg falling num-
ber (s)
5.8
*
69.33
***
40.24
***
6.02
**
1.85
61.05
***
3.4
*
Wet gluten (%) 0.45
32.56
***
14.94
***
1.88
0.96
15.69
***
1.88
Gluten
Index
7.49
**
9.02
***
20.31
***
3.66
*
5.67
*
9.33
***
2.37
Table 2b: F and p-values for the various components (country, year, accession and their interactions) for
yield and the baking quality parameters, based on three populations, two trial sites and the years 2011
and 2012, calculated with ANOVA (* = p ≤ 0.05; ** = p ≤ 0.01 and *** ≤ 0.001).
Accession Year Country Accession x
Year
Accession x
Country
Year x Coun-
try
Accession x
Year x Country
Yield (t/ha) 3.31
*
7.41
**
34.01
***
2.32
0.55
13.69
***
1.74
SDS-sedimentation
(ml)
6.7
**
19.43
***
1.67
0.36
0.36
4.51
*
1.14
Hagberg falling num-
ber (s)
1.42
361.59
***
176.36
***
4.09
**
3.9
*
99.79
***
10.02
***
Wet gluten (%) 21.99
***
744.53
***
643.47
***
1.23
3.99
*
514.51
***
0.88
Gluten
Index
61.58
***
36.92
***
5.29
*
0.67
6.6
**
12.32
***
4.2
**

14 An evolutionary breeding approach to improve bread quality of spring wheat for low input organic farming systems
Table 3: F and p-values per accession for yield and various baking quality parameters based on two trial
sites and three seasons, calculated with ANOVA (* = p ≤ 0.05; ** = p ≤ 0.01 and *** ≤ 0.001).
ER II-2008 ER III-2009 ER IV-2009 Lavett Thasos
Yield (t/ha) Year 1.35
15.08
***
0.1
2.13
3.14
Country 15.25
***
8.65
**
11.01
**
28.02
***
11.06
**
Year * country 10.13
***
3
3.62
2.7
11.22
***
SDS-sedimentation
(ml)
Year 4.63
*
5.45
*
11.16
***
15.9
***
10.56
**
Country 0.01
0.55
2.09
8.88
**
2.64
Year * country 1.84
3.69
*
0.57
0.46
0.64
Hagberg falling
number (s)
Year 118.02
***
223.48
***
77.36
***
37.82
***
37.22
***
Country 26.52
***
89.53
***
92.76
***
44.8
***
3.04
Year * country 34.18
***
45.46
***
44.66
***
54.04
***
10.61
**
Wet Gluten (%} Year 226.85
***
248.51
***
281.46
***
12.7
***
22.51
***
Country 238.44
***
185.58
***
222.74
***
14.24
**
2.07
Year * country 160.84
***
172
***
188.42
***
9.97
***
7.65
**
Gluten
Index (%)
Year 11.72
***
12.76
***
16.33
***
0.32
10.87
***
Country 3.08
2.74
23.54
***
33.79
***
0.72
Year * country 9.49
**
4.5
*
2.54
2.84
6.05
*
Other parameters
The accessions did not differ significantly for soil cover. The CCPs clearly had a longer plant height
than the two standard varieties (110 to 120 cm for the CCPs compared to 103 to 105 cm for the
standard varieties). In 2011, none of the varieties seemed to have been severely affected by dis-
eases due to the lack of rain during the period mid-March mid-June. In 2012 and 2013 all acces-
sions were moderately affected by the fungal diseases Septoria (Mycosphaerella graminicola)
and yellow rust (Puccinia recondita). In 2011 yellow rust was not observed in the field.
Comparison of effect of selection strategies in two countries
The two selection strategies by the breeder were compared with the original population at two
sites for the parameters yield, various baking parameters, plant height, and yellow rust and septo-
ria resistance.

Results 15
Yield
No significant differences were observed for yield (Tables 4 and 5). As yield is a factor highly influ-
enced by environment, no significant difference is perhaps not surprising. Also no trend can be ob-
served: For populations ER II-2008 and ER III-2009 the Dutch selection performs slightly better in the
Netherlands and the German selection slightly better in Germany, but for population ER IV-2009
this is vice versa.
Baking parameters
No effect of selection strategy on baking parameters was observed. For Hagberg Falling number,
clear interactions were observed but no trend is visible that selection in a particular site has led to
improved Hagberg falling number in that site. Wet gluten is clearly influenced by trial site effect: in
Germany wet gluten is generally higher than in the Netherlands. Differences in gluten index, wet
gluten content and sedimentation are the result of differences among populations.
Agronomic performance
For plant height a significant interaction was found for population x trial field. No significant effect
was found for selection method. A possible explanation is the fact that in the Netherlands the se-
lections of population ER III-2009 were clearly taller than in Germany.
For yellow rust, selection by the breeder has a positive effect on rust resistance. For both yellow rust
and septoria differences were observed between the trial sites in Germany and the Netherlands.
No significant differences were observed between populations.
16 An evolutionary breeding approach to improve bread quality of spring wheat for low input organic farming systems
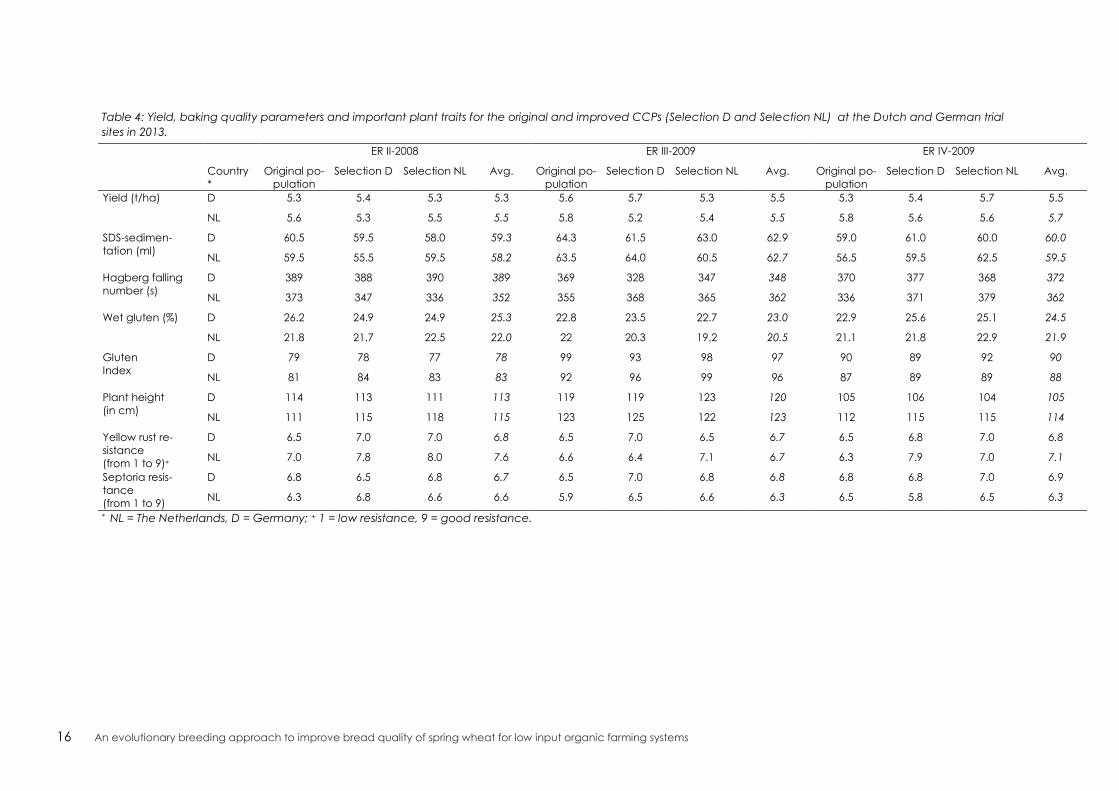
Table 4: Yield, baking quality parameters and important plant traits for the original and improved CCPs (Selection D and Selection NL) at the Dutch and German trial
sites in 2013.
ER II-2008 ER III-2009 ER IV-2009
Country
*
Original po-
pulation
Selection D Selection NL Avg. Original po-
pulation
Selection D Selection NL Avg. Original po-
pulation
Selection D Selection NL Avg.
Yield (t/ha) D 5.3 5.4 5.3 5.3 5.6 5.7 5.3 5.5 5.3 5.4 5.7 5.5
NL 5.6 5.3 5.5 5.5 5.8 5.2 5.4 5.5 5.8 5.6 5.6 5.7
SDS-sedimen-
tation (ml)
D 60.5 59.5 58.0 59.3 64.3 61.5 63.0 62.9 59.0 61.0 60.0 60.0
NL 59.5 55.5 59.5 58.2 63.5 64.0 60.5 62.7 56.5 59.5 62.5 59.5
Hagberg falling
number (s)
D 389 388 390 389 369 328 347 348 370 377 368 372
NL 373 347 336 352 355 368 365 362 336 371 379 362
Wet gluten (%) D 26.2 24.9 24.9 25.3 22.8 23.5 22.7 23.0 22.9 25.6 25.1 24.5
NL 21.8 21.7 22.5 22.0 22 20.3 19.2 20.5 21.1 21.8 22.9 21.9
Gluten
Index
D 79 78 77 78 99 93 98 97 90 89 92 90
NL 81 84 83 83 92 96 99 96 87 89 89 88
Plant height
(in cm)
D 114 113 111 113 119 119 123 120 105 106 104 105
NL 111 115 118 115 123 125 122 123 112 115 115 114
Yellow rust re-
sistance
(from 1 to 9)+
D 6.5 7.0 7.0 6.8 6.5 7.0 6.5 6.7 6.5 6.8 7.0 6.8
NL 7.0 7.8 8.0 7.6 6.6 6.4 7.1 6.7 6.3 7.9 7.0 7.1
Septoria resis-
tance
(from 1 to 9)
D 6.8 6.5 6.8 6.7 6.5 7.0 6.8 6.8 6.8 6.8 7.0 6.9
NL 6.3 6.8 6.6 6.6 5.9 6.5 6.6 6.3 6.5 5.8 6.5 6.3
* NL = The Netherlands, D = Germany; + 1 = low resistance, 9 = good resistance.

Results 17
Table 5: For the comparison of breeder selection strategies, F and p-values for the various compo-
nents (population, selection strategy, country and their interactions) for yield, various baking qual-
ity and plant parameters based on trial sites in the Netherlands and Germany in 2013, calculated
with ANOVA (* = p ≤ 0.05; ** = p ≤ 0.01 and *** ≤ 0.001).
Population Selection
strategy
Country Population x
selection
strategy
Population x
Country
Selection strat-
egy x,Country
Population x Se-
lection strategy x
Country
Yield 0.38
0.27
0.32
0.27
0.19
0.81
0.27
SDS- Sedimen-
tation
6.1
**
0.07
0.42
1.33
0.08
0.35
1.03
Hagberg falling
number
3.49
*
0.07
4.73
*
2.56
*
9.41
***
1.41
3.14
*
Wet gluten % 3.46
*
0.03
20.42
***
1.01
0.17
0.26
0.47
Gluten index 32.97
***
0.57
0.22
0.26
1.61
0.92
0.3
Plant height 61.37
***
1.33
27.99
***
0.09
5.32
**
1.33
1.86
Yellow rust re-
sistance
3.02
4.47
*
4.3
*
0.73
1.42
0.5
1.57
Septoria re-
sistance
0.08
1.12
6.34
*
1.16
0.81
0.18
0.8
Comparison of populations in the Netherlands in 2013
In this section all populations are compared with an additional set of improved populations
selected by farmers (HM and J). In tables 6 to 18 the standard varieties with fresh seed (mul-
tiplied in 2012) are put in the column natural selection. The values for the varieties Thasos
and Lavett were added in tables 6 to 18.
Yield
No significant differences were found between the selection approaches and between the
accessions, partly because of some variation in the trial field. This is illustrated by the large
differences in yield of the two standards: Of Lavett the seed from 2012 shows a higher yield,
whereas of Thasos the 2010 seed shows a higher yield (Table 6). The variation among plots is
smaller for the populations than for the varieties, confirming the greater yield stability of the
populations.
Table 6: Overview of yields (in t/ ha) of all materials (original population, natural selection, breeder
selection in the Netherlands and Germany, selections by two farmers and two reference varieties)
at the trial site in the Netherlands in 2013.
Original po-
pulation
Natural
Selection
Breeder selection Farmer selection
Accession 2010 2012 D NL HM J Average
ER II-2008 5.8 5.9 5.8 5.8 5.5 6.1 5.8
ER III-2009 6.0 5.5 5.4 5.7 5.5 5.6 5.6
ER IV-2009 6.0 5.5 5.8 5.9 5.5 5.3 5.8
Selection Avg. 5.9 5.6 5.7 5.8 5.5 5.7 5.7
Thasos 5.9 5.4 5.6
Lavett 5.3 5.9 5.6
18 An evolutionary breeding approach to improve bread quality of spring wheat for low input organic farming systems
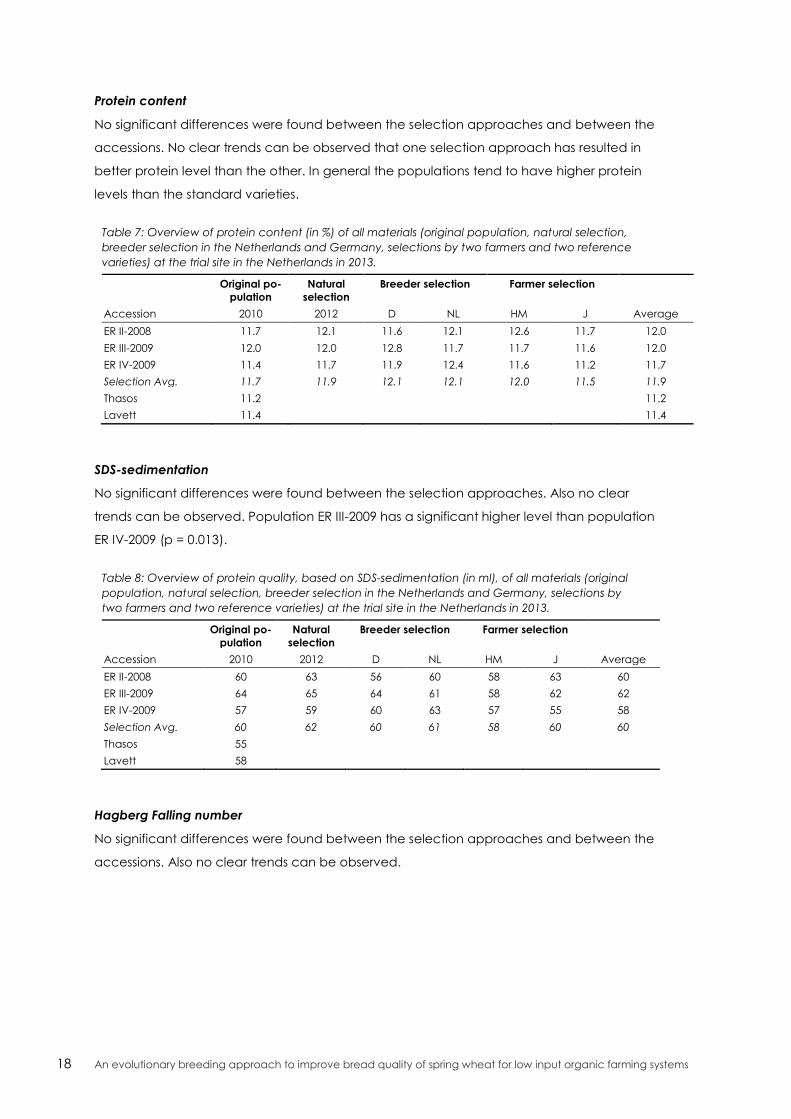
Protein content
No significant differences were found between the selection approaches and between the
accessions. No clear trends can be observed that one selection approach has resulted in
better protein level than the other. In general the populations tend to have higher protein
levels than the standard varieties.
Table 7: Overview of protein content (in %) of all materials (original population, natural selection,
breeder selection in the Netherlands and Germany, selections by two farmers and two reference
varieties) at the trial site in the Netherlands in 2013.
Original po-
pulation
Natural
selection
Breeder selection Farmer selection
Accession 2010 2012 D NL HM J Average
ER II-2008 11.7 12.1 11.6 12.1 12.6 11.7 12.0
ER III-2009 12.0 12.0 12.8 11.7 11.7 11.6 12.0
ER IV-2009 11.4 11.7 11.9 12.4 11.6 11.2 11.7
Selection Avg. 11.7 11.9 12.1 12.1 12.0 11.5 11.9
Thasos 11.2 11.2
Lavett 11.4 11.4
SDS-sedimentation
No significant differences were found between the selection approaches. Also no clear
trends can be observed. Population ER III-2009 has a significant higher level than population
ER IV-2009 (p = 0.013).
Table 8: Overview of protein quality, based on SDS-sedimentation (in ml), of all materials (original
population, natural selection, breeder selection in the Netherlands and Germany, selections by
two farmers and two reference varieties) at the trial site in the Netherlands in 2013.
Original po-
pulation
Natural
selection
Breeder selection Farmer selection
Accession 2010 2012 D NL HM J Average
ER II-2008 60 63 56 60 58 63 60
ER III-2009 64 65 64 61 58 62 62
ER IV-2009 57 59 60 63 57 55 58
Selection Avg. 60 62 60 61 58 60 60
Thasos 55
Lavett 58
Hagberg Falling number
No significant differences were found between the selection approaches and between the
accessions. Also no clear trends can be observed.

Results 19
Table 9: Overview of Hagberg Falling number (enzyme activity, in s) of all materials (original popu-
lation, natural selection, breeder selection in the Netherlands and Germany, selections by two
farmers and two reference varieties) at the trial site in the Netherlands in 2013.
Original po-
pulation
Natural
selection
Breeder selection Farmer selection
Accession 2010 2012 D NL HM J Average
ER II-2008 373 365 347 336 337 375 355
ER III-2009 355 384 368 365 346 359 363
ER IV-2009 336 362 371 379 342 341 355
Population Avg. 355 370 362 360 342 358 358
Thasos 370 370
Lavett 370 370
Percentage Wet Gluten
No significant differences were found between the selection approaches. Also no clear
trends can be observed. Population ER II-2008 has significant higher levels of wet gluten
compared to populations ER III-2009 and ER IV-2009 (p = 0.005), which confirms the other
analyses.
Table 10: Overview of wet gluten content (in %) of all materials (original population, natural selec-
tion, breeder selection in the Netherlands and Germany, selections by two farmers and two refer-
ence varieties) at the trial site in the Netherlands in 2013.
Original po-
pulation
Natural
selection
Breeder selection Farmer selection
Accession 2010 2012 D NL HM J Average
ER II-2008 21.8 24.1 21.7 22.5 23.0 21.5 22.4
ER III-2009 22.0 22.8 20.3 19.2 20.4 19.9 20.8
ER IV-2009 21.1 19.8 21.8 22.9 20.0 18.9 20.7
Selection Avg. 21.6 22.2 21.3 21.5 21.1 20.1 21.3
Thasos 20.2
Lavett 19.7
Gluten index
For gluten index a significant interaction was found (p = 0.017) and a significant effect for
population (p < 0.001). Population ER II-2008 selected by farmer HM is interesting as it has
high wet gluten content and high gluten index. Also population ER IV-2009 selected by the
breeder in the Netherlands combines high wet gluten content with high gluten index.
Table 11: Overview of gluten index (in %) of all materials (original population, natural selection,
breeder selection in the Netherlands and Germany, selections by two farmers and two reference
varieties) at the trial site in the Netherlands in 2013.
Original po-
pulation
Natural
selection
Breeder selection Farmer selection
Accession 2010 2012 D NL HM J Average
ER II-2008 81 76 84 83 93 85 84
ER III-2009 92 94 96 99 98 95 95
ER IV-2009 89 94 89 89 83 92 89
Selection Avg. 87 88 90 91 91 90 89
Thasos 94
Lavett 98

20 An evolutionary breeding approach to improve bread quality of spring wheat for low input organic farming systems
Baking tests
For the baking test not all material was included in order to optimise the results of the baking
test. Material from population ER III-2009 was excluded because of its lower scores for vari-
ous agronomic traits, such as yellow rust resistance, plant height and lodging resistance (see
below). All doughs had good stability and were not sticky. Some doughs had better baking
quality: the figure 1 means the best score, and 3 was the lowest score. A score of 3 is still rea-
sonably good (see photo’s below). Overall population ER II-2008 and the variety Lavett had
the best baking quality. When tasting the bread everybody agreed that the bread made
from the populations tasted much better than the bread made from variety Lavett, and also
better than the bread made from the variety Thasos.
Table 12: Overview of baking quality of a selected set of materials (original population, natural se-
lection, breeder selection in the Netherlands and Germany, selections by two farmers and two ref-
erence varieties) at the trial site in the Netherlands in 2013.
Original po-
pulation
Natural
selection
Breeder selection Farmer selection
Accession 2010 2012 D NL HM J Average
ER II-2008 2 1 1,8 2 1,7
ER III-2009
ER IV-2009 2 3 1,5 2 2 2 2,1
Selection Avg. 2 2 1,6 2 2 2 1,9
Thasos 2,5 1,5 2,0
Lavett 1,5 2 1,8
ER II-2008 (original population): Score 2 ER IV-2009 (original population): Score 2
ER II-2008 (natural selection): Score 1 ER IV-2009 (natural selection): Score 3

Results 21
Plant height
For plant height a significant interaction between selection approach and population (p =
0.027) and significant differences between selection approaches (p < 0.001) and between
populations (p < 0.001) was found. Population approaches the breeder and by farmer HM
tend to result in taller plants than the natural selection. Hence, to prevent populations from
getting to tall natural selection seems better than artificial selection.
Table 13: Overview of average plant height (in cm) of all materials (original population, natural
selection, breeder selection in the Netherlands and Germany, selections by two farmers and two
reference varieties) at the trial site in the Netherlands in 2013.
Original po-
pulation
Natural
Selection
Breeder selection Farmer selection
Accession 2010 2012 D NL HM J Average
ER II-2008 111 116 115 118 120 115 116
ER III-2009 123 117 125 122 123 122 122
ER IV-2009 112 113 115 115 116 113 114
Selection Avg. 115 115 118 118 119 117 117
Thasos 104 107
Lavett 108 106
Lodging tolerance
No significant differences were found between the selection approaches. Population ER III-
2009 is significantly more susceptible to lodging than the other two populations. Population
ER III-2009 is also clearly taller than the other two populations.
Table 14: Overview of lodging tolerance of all materials (original population, natural selection,
breeder selection in the Netherlands and Germany, selections by two farmers and two reference
varieties) at the trial site in the Netherlands in 2013 (1 = low; 9 = high lodging resistance).
Original po-
pulation
Natural
selection
Breeder selection Farmer selection
Accession 2010 2012 D NL HM J Average
ER II-2008 8.9 8.4 8.3 7.8 7.5 8.3 8.2
ER III-2009 6.8 6.5 7.1 7.4 7.3 6.9 7.0
ER IV-2009 8.6 8.6 8.8 8.4 8.5 8.6 8.6
Selection Avg. 8.1 7.8 8.1 7.9 7.8 7.9 7.9
Thasos 9.0 8.8
Lavett 9.0 9.0
1000 kernel weight
No significant differences were found between the selection approaches and between
populations. All populations have higher 1000 kernel weights than the varieties Thasos and
Lavett.

22 An evolutionary breeding approach to improve bread quality of spring wheat for low input organic farming systems
Table 15: Overview of 1000 kernel weight (in gram) of all materials (original population, natural se-
lection, breeder selection in the Netherlands and Germany, selections by two farmers and two ref-
erence varieties) at the trial site in the Netherlands in 2013.
Original po-
pulation
Natural
selection
Breeder selection Farmer selection
Accession 2010 2012 D NL HM J Average
ER II-2008 46.3 45.0 46.3 46.2 46.2 43.7 45.6
ER III-2009 48.6 44.3 47.6 47.6 43.9 46.5 46.4
ER IV-2009 48.4 45.7 47.2 45.1 49.0 45.8 46.9
Selection Avg. 47.8 45.0 47.0 46.3 46.4 45.3 46.3
Thasos 42.1 43.6 42.8
Lavett 40.8 41.9 41.3
Tillering
Selection approaches are significantly different (p = 0.013) and also the populations differ in
tillering (p = 0.036). The original population has the highest tillering, followed by the natural
selection. All selection approaches (by the breeder and by the farmers) have clearly lower
tillering than the natural selection. Dutch farmers prefer high tillering as it helps to suppress
weeds. According to the breeder a low tiller number results in better baking quality, but this
effect was not clearly visible. Of the populations population ER III-2009 has clearly the high-
est number of tillers, comparable to the varieties Thasos and Lavett.
Table 16: Overview of tillering (in tillers / m2) of all materials (original population, natural selection,
breeder selection in the Netherlands and Germany, selections by two farmers and two reference
varieties) at the trial site in the Netherlands in 2013.
Original po-
pulation
Natural
selection
Breeder selection Farmer selection
Accession 2010 2012 D NL HM J Average
ER II-2008 535 591 559 540 536 593 559
ER III-2009 709 595 563 574 609 606 609
ER IV-2009 665 638 563 535 483 522 568
Selection Avg. 636 608 562 550 543 574 579
Thasos 648 634
Lavett 653 575
Yellow rust resistance
No significant differences were found between the selection approaches. Populations ER II-
2008 and ER IV-2009 have better yellow rust resistance than population ER III-2009 (p = 0.005).
The yellow rust resistance of populations ER II-2008 and ER IV-2009 is not as good as the vari-
ety Lavett, but still reasonably good. Yellow rust resistance is very important in the Nether-
lands. The selections by the breeder tend to be better than the natural selection.
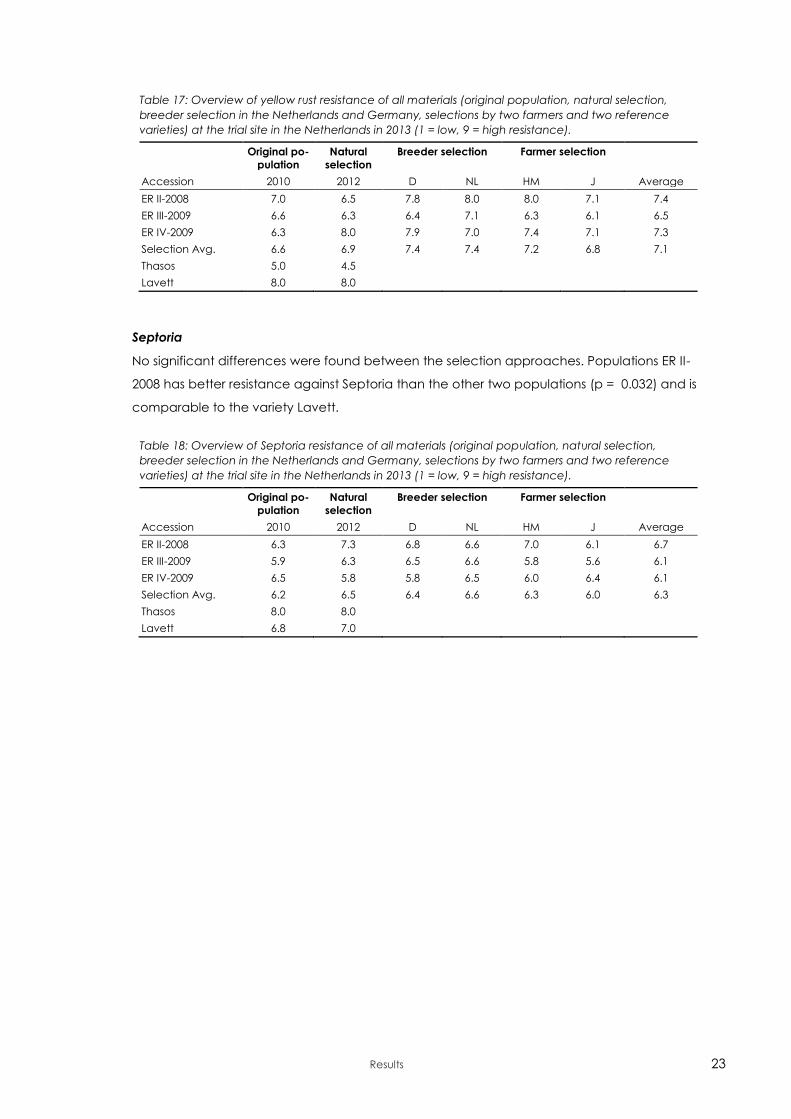
Results 23
Table 17: Overview of yellow rust resistance of all materials (original population, natural selection,
breeder selection in the Netherlands and Germany, selections by two farmers and two reference
varieties) at the trial site in the Netherlands in 2013 (1 = low, 9 = high resistance).
Original po-
pulation
Natural
selection
Breeder selection Farmer selection
Accession 2010 2012 D NL HM J Average
ER II-2008 7.0 6.5 7.8 8.0 8.0 7.1 7.4
ER III-2009 6.6 6.3 6.4 7.1 6.3 6.1 6.5
ER IV-2009 6.3 8.0 7.9 7.0 7.4 7.1 7.3
Selection Avg. 6.6 6.9 7.4 7.4 7.2 6.8 7.1
Thasos 5.0 4.5
Lavett 8.0 8.0
Septoria
No significant differences were found between the selection approaches. Populations ER II-
2008 has better resistance against Septoria than the other two populations (p = 0.032) and is
comparable to the variety Lavett.
Table 18: Overview of Septoria resistance of all materials (original population, natural selection,
breeder selection in the Netherlands and Germany, selections by two farmers and two reference
varieties) at the trial site in the Netherlands in 2013 (1 = low, 9 = high resistance).
Original po-
pulation
Natural
selection
Breeder selection Farmer selection
Accession 2010 2012 D NL HM J Average
ER II-2008 6.3 7.3 6.8 6.6 7.0 6.1 6.7
ER III-2009 5.9 6.3 6.5 6.6 5.8 5.6 6.1
ER IV-2009 6.5 5.8 5.8 6.5 6.0 6.4 6.1
Selection Avg. 6.2 6.5 6.4 6.6 6.3 6.0 6.3
Thasos 8.0 8.0
Lavett 6.8 7.0

24 An evolutionary breeding approach to improve bread quality of spring wheat for low input organic farming systems
4 Discussion, prospects and conclusions
Overall, of the three populations populations ER II-2008 and ER IV-2009 have shown most po-
tential for cultivation on sandy soils.in the Netherlands. They have yields and baking quality
similar or somewhat better to the reference varieties. The populations seem better in taste
than the two standard varieties. In 2014, 7 Dutch farmers will grow these two populations un-
der varying soil conditions (from sandy to clay).
The results show that the yield stability of the populations is better compared to the two vari-
eties. In terms of baking quality the two standard varieties seem better than the populations.
In particular, the populations have less stability for Hagberg Falling number than the stand-
ard varieties. It is good to mention here that these two standard varieties have been culti-
vated for about 20 years, and are the result of a long selection process, and that till today,
no other pure line varieties were found with equal baking characteristics. The populations,
however, have higher levels of wet gluten content and SDS-sedimentation compared to the
two standard varieties.
Of all three populations the various selection approaches have not shown differences in
yields and baking quality parameters. Natural selection has not led to an improvement of
yield, but also not a decrease of baking quality. The selections made by the breeder have
also not resulted in better yield and baking quality. The selections made by the farmers also
seem not to have had any effect on yield and baking quality. Further improvement also
seems difficult as the yield and baking quality of the three original populations was already
good. The low yields of the original population in 2011 can be attributed to the poor
weather of that season.
The selections made by the breeder and the farmer did have effect for other traits, in partic-
ular plant height and tillering. What is often mentioned to be feared for with natural selec-
tion is that plant height increases. Our results indicate that this is not the case. Rather, selec-
tion by the breeder and farmers is more likely to result in increased plant height. The breeder
and the farmers tend to select for taller plants when selecting big ears. Plants that tiller less
also tend to produce bigger ears. Selection of good ears results in lower tiller number. The
breeder considers this as progress, but the farmers prefer high tiller numbers. When weed
pressure is low, low tillering perhaps is preferred as it results in better baking quality, but when
weed pressure is high, high tillering is preferred. Hence, the breeder considers the modified
breeding approach as a better method and will continue with it. The farmers prefer adapta-
tion through natural selection. They are also curious how to stimulate tillering even more.
Prospects
In 2014, seven Dutch organic farmers will cultivate two populations, ER II-2008 (very good
baking quality) and ER IV-2009 (good baking quality and good agronomic performance)
Discussions and conclusions 25
and we will follow the development of these populations in the project 2013-63 titled ‘Mak-
ing the results of evolutionary breeding in spring wheat functional for farmers, using a chain
perspective’. This new project also coincides with an EU experiment to change legislation to
accommodate populations. Together with these farmers and the regulatory office in the
Netherlands (NAK) we will propose to the EU how this legislation should look like to make it
practical for Dutch farmers.
Conclusions
The project has shown that two populations of wheat have potential for Dutch organic agri-
culture. They have better yield stability than the standard varieties in combination with good
baking quality. To further improve adaptation to local conditions, Dutch farmers prefer natu-
ral selection as it seem not to have negative impact on baking quality, but maintains tillering
capacity. Natural selection seem not to lead to an increase in plant height. The breeder
sees the modified selection approach as valuable and will continue elaborating this ap-
proach further.

26 An evolutionary breeding approach to improve bread quality of spring wheat for low input organic farming systems
References
Baresel JP (2006) Weizenzűchtung fűr den Őkologischen Landbau. Selektionsmöglichkeiten
fűr pflanzenbauliche und Qualitätsmerkmale. Verlag Dr. Köster, Berlin, Germany
Danquah EY, Barrett JA (2002) Grain yield in Composite Cross Five of barley:effects of natu-
ral selection. Journal of Agricultural Science 138:171-176
Dawson JC, Murphy KM, Jones SS (2008) Decentralized selection and participatory ap-
proaches in plant breeding for low input systems. Euphytica 160:143-154
Finckh MR (2008) Integration of breeding and technology into diversification strategies for
disease control in modern agriculture. European Journal of Plant Pathology: 121:399-409
Haglund Å, Johansson L, Dahlstedt, L (1998) Sensory evaluation of wholemeal bread from
ecologically and conventionally grown wheat. Journal of Cereal Science 27:199-207
Hildermann I, Thommen A, Dubois D, Boller T, Wiemken A, Mäder P (2009) Yield and baking
quality of winter wheat cultivars in different farming systems of the DOK long-term trial.
Journal of Science of Food and Agriculture 89:2477-2491
L-Baeckström G, Hanell U, Svensson G (2004) Baking quality of winter wheat grown in differ-
ent cultivating systems, 1992-2001: a holistic approach. Journal of Sustainable Agriculture
24:53-79
Lammerts van Bueren ET, Jones SS, Tamm L, Murphy KM, Myers JR, Leifert C, Messmer MM
(2010) The need to breed crop varieties suitable for organic farming, using wheat, to-
mato and broccoli as examples: a review. NJAS doi 10.1016/j.njas.2010.04.001
Löschenberger F, Fleck A, Grausgruber H, Hetzendorfer H, Hof G, Lafferty J, Marn M, Neu-
mayer A, Pfaffinger G, Birschitzky J (2008) Breeding for organic agriculture: the example
of winter wheat in Austria. Euphytica 163: 469-480
Murphy K, Lammer D, Lyon S, Carter B, Jones SS (2004) Breeding for organic and low-input
farming systems: an evolutionary participatory breeding method for inbred cereals. Re-
newable Agriculture and Food Systems: 20:48-55
Osman A, van den Brink L, Lammerts van Bueren E (2008) Comparing organic and conven-
tional VCU testing for spring wheat in the Netherlands. In: Rey F, Fontaine L, Osman A, van
Waes J (eds.). Proceedings of the COST ACTION 860 – SUSVAR and ECO-PB Workshop on
Value for Cultivation and Use testing of organic cereal varieties. What are the key issues?
28th and 29th February 2008, Brussels, Belgium. SUSVAR, COST, ECO-PB, ITAB, Paris, France,
pp. 37-41
Phillips SL, Wolfe MS (2005) Centenary Review. Evolutionary plant breeding for low input sys-
tems. Journal of Agricultural Science 143:245-254
Przystalski M, Osman A, Thiemt EM, Rolland B, Ericson L, Østergård H, Levy L, Wolfe M, Büchse
A, Piepho H-P, Krajewski P (2008) Comparing the performance of cereal varieties in or-
ganic and non-organic cropping systems in different European countries. Euphytica 163:
417-433
Soliman KM, Allard RW (1991) Grain yield of composite cross populations of barley: effects of
natural selection. Crop Science 31:705-708
Suneson CA (1956) An evolutionary plant breeding method. Agronomy Journal 48:188-191
Wolfe MS, Baresel JP, Desclaux D, Goldringer I, Hoad S, Kovacs G, Löschenberger F, Mied-
aner T, Østergård H, Lammerts van Bueren ET (2008) Developments in breeding cereals
for organic agriculture. Euphytica 163:323-346