Embed Size (px)
Citation preview

An Evolutionary Approach to Macroeconomic Growth Modelling∗
June 27 2005
By
Dr. Kenneth I. Carlaw
Senior Lecturer
Department of Economics
University of Canterbury
Christchurch, New Zealand
Email: [email protected]
And
Professor Richard G. Lipsey
Department of Economics
Simon Fraser University
Vancouver, British Columbia
Canada
Email: [email protected]
∗ This work received funding support from the Australian Department of Communications, Information Technology and the Arts, Consultancy Commission No. DCON/05/7

Abstract: An important objective of growth theory is to understand the economy’s aggregate growth behaviour. Our view is that long run aggregate growth can be best understood as an historical, irregular path dependent process, operating in an environment of uncertainty that is occasionally punctuated by the arrival of general purpose technologies (GPTs), which transform economies and societies. Thus, our approach is inherently evolutionary, and contrasts with the more traditional Newtonian approach to economic growth theorising. However, evolutionary theories of technological change typically start with micro behaviour, rejecting the concept of representative agents and instead building on diversity and selection, which leads to a problem of aggregating from the realistic micro behaviour to observed macro relations. The approach adopted here seeks to bridge the gap between macro observations and micro evolutionary behaviour by drawing extensively on Lipsey, Carlaw and Bekar (2005, forthcoming) and Carlaw and Lipsey (2006) and by extending Carlaw and Lipsey (2001 and 2004) and Carlaw (2004). We build a macroeconomic theory of GPT – driven economic growth and then amend it sequentially to incorporate an increasing amount of behaviour that is consistent with the microeconomic evidence of evolutionary change.
The recent revolution in Information and Communications Technology (ICT) is a transforming GPT that sits at the centre of the latest of the debate about what causes economic growth and productivity change and which provides an empirical backdrop to guide the theorising presented here. We present advances in the theory of endogenous GPT-driven growth that will enable a more thorough analysis of the relationship between the process of ICT diffusion and economic and productivity growth. In particular, the theory models the behaviour of the myriad complementarities and structural adjustment costs observed to accompany transforming GPTs. In the model, economic agents face an uncertain future and so do the best they can with limited knowledge of present relations.
The result is a model of growth that is sustained but not stationary. Several lines of pure research and development are modelled, each of which produce a sequence of GPTs. Several GPTs can exist simultaneously and interact with each other in the multiple lines of applied R&D and final consumption. Differences with respect to each GPT’s set of complementarities and structural adjustment cost are modelled to demonstrate how different GPTs impact the economy. The model is calibrated using Australian data on ICT diffusion and national accounts to demonstrate how ICT manifests in recent economic and productivity growth in Australia.
We adopt our incremental approach to linking micro evolutionary behaviour with observed macro relations because it complements the current investigations of many other economists who are developing micro-based evolutionary models, and because, as far as we can see, the development of micro evolutionary models has not yet produced theories capable of dealing with what is observed about aggregate technologically driven growth.
Another reason for adopting this approach is that the first generation of aggregate GPT models and John Foster’s book Evolutionary Macroeconomics have not given rise to a burst of model building analogous to that of the micro evolutionary approaches which followed the publication of Nelson and Winter’s path breaking Theory of Economic Change. This may be because the Newtonian equilibrium concepts used in first-generation aggregate GPT models, and the assumptions needed to make these and most
1

Neoclassical growth models analytically tractable could not be extended to model the more complex reality of economic growth driven by GPTs. In contrast, the model of Carlaw and Lipsey (2001), although originally designed to modestly advance aggregate GPT modelling, proved sufficiently versatile to incorporate some of the realistic complexities that are key to evolutionary models. We exploit that inherent versatility in the current research by adding more complexity to the model to incorporate more realistic micro evolutionary behaviour and to enable a closer analysis of the impact of ICT on economic growth and productivity in Australia.
2
Table of Contents
1. Introduction..................................................................................................................... 4 From Micro to Macro...................................................................................................... 4 Our approach................................................................................................................... 5
2. GPT-Driven Growth Theory to Date .............................................................................. 6 3. Multiple GPTs and Structural Adjustment Costs............................................................ 7
3.1 More than one pure knowledge sector ...................................................................... 8 3.2 Multiple Structural Adjustment Costs .................................................................... 11
4. The Simulation Model .................................................................................................. 17 4.1 Simulation Structure ............................................................................................... 17 4.2 Parameterization ..................................................................................................... 19 4.3 TFP and Knowledge Growth Calculations ............................................................. 19
5. Monte Carlo Analysis ................................................................................................... 22 5.1 Base line model....................................................................................................... 22 5.2 Variations in K and V ............................................................................................. 26
6. Calibrating the Model to Available Data ...................................................................... 29 7. Summary and Further Research Avenues..................................................................... 33 References......................................................................................................................... 35
3

We differ from the mainstream, Neoclassical view of economic growth on the following issues. First, long term growth is best understood as an historical, path dependent process, operating in an environment of uncertainty that is occasionally punctuated by the arrival of general purpose technologies (GPTs), which transform economies and societies. Second, to deal adequately with technological change we need to get inside the black box of the neoclassical production function and model technology as structured. Third, contrary to the predictions of neoclassical aggregate growth theory, there is no reason to expect any tight relation between the rates of change in technology and in total factor productivity. Fourth, given the third proposition, there is no productivity paradox in seeing high rates of technological change combined with low rates of growth of measured productivity. Fifth, technological change can best be measured by counter factual experiments of what would have happened without the technology in question and/or by direct measures of technological change that do not depend on observations of productivity and output. Sixth, the relationship between technological change and economic performance, measured as output and productivity growth, can only be understood by analysing technology independent of output and productivity observations.
1. Introduction Two distinct views of economic processes can be discerned in the attempts to understand economic growth and change: the neoclassical and the evolutionary view.
‘Neoclassical’ is our collective term for the well-known body of theory based on rational maximizing agents operating under well-defined exogenous scarcity constraints.1 It produces its most general results by focusing on the static equilibrium state of a model of price-taking representative agents, which allows micro outcomes to be aggregated to produce unique macro outcomes. Where growth is studied, it is in terms of an aggregate production function with flat (i.e., unstructured) technology. In Solow’s version, technological change is exogenous; in the newer versions it is endogenous.
Evolutionary theories have been developed explicitly to analyse long term growth using dynamic evolutionary concepts involving heterogeneous agents. Instead of focusing on equilibrium states, these theories seek to model the processes by which technologies evolve under the impact of a stream of innovations. This requires dealing explicitly with such real world aspects of innovation as uncertainty, path dependency and the complex hierarchical structures of technologies.
From Micro to Macro Although the behaviour that produces economic growth is rooted at the level of individual agents, most economists and policy makers seek to understand growth at the macro level in terms of such aggregates as the rates of growth of GDP, total factor productivity, labour productivity, and per capita living standards.
1 It has been an extraordinarily successful theory. It has produced a rich set of predictions about reactions to many types of shocks and its static equilibrium properties (such as the equality of the value of one factor's marginal products everywhere in the economy) are used as maintained assumptions in many measurement exercises.
4

Neoclassical analysis has the advantage of starting with macro behavioural assumptions and so of yielding macro results from the outset. This gives it the problem (among others) of reconciling the assumed macro behaviour with the detailed research knowledge about the micro behaviour that creates growth and change.2 .
Evolutionary theory makes much closer and richer contact with what is known about technology, technological change, and the micro behaviour of the relevant agents. Its big problem is to produce predictions about the aggregate relations that mainly concern policy makers.
Our approach
We accept the evolutionary view of economic change and growth. However, we do not try in our research to aggregate upwards from existing micro evolutionary theories. Instead, we first build a macro model of GPT-driven growth and then amend it incrementally to incorporate an increasing number of What Lipsey, Bekar and Carlaw (1998b) identify as the Structural-Evolutionary (S-E) characteristics of an economy.
We see our approach as complementary to, not competitive with, models that deal more explicitly with evolutionary processes at the micro economic level. We chose it for several reasons. First, many other economists are currently investigating micro-based evolutionary models and we feel that our comparative advantage lies in complementing this literature by working from the macro down to the micro. Second, as far as we can see, the development of micro evolutionary models has not yet produced theories capable of dealing routinely with what is observed about aggregate, economy-wide, technologically driven, economic growth. Third, no one knows the potential of a particular line of theoretical enquiry until that line has been investigated⎯a theme that recurs throughout the study of technological innovations. Thus, when something new is being attempted, there is value in having many different attacks on the same problem, which in this case is explaining long-term growth and technological change as an evolutionary process. Fourth, we think that the first generation of aggregate GPT models has not given rise to a burst of subsequent model building because the equilibrium concept used in the first generation of aggregate GPT models did not easily lend itself to an extension to the many complications needed to go beyond the crude assumptions that were necessary to make these models analytically tractable. The equilibrium concept used in our simulation models is versatile enough to handle more realistic complexities that take the model closer to S-E characteristics.
As a starting point to establish the state of the art in GPT theorizing we summarize the earlier work of Carlaw and Lipsey (2001 and 2006) and Lipsey, Carlaw and Bekar (2005)3 along with the empirical analysis presented in Carlaw (2004). This earlier research forms the theoretical foundation of GPT-driven growth that we seek to advance 2 Neoclassical macro theory can be reconciled with micro theory of perfect competition and the Dixit-Stigltz version of monopolistic competition but not with the mixture of market structures that characterises the real world⎯price-taking, non-Dixit–Stiglitz monopolistic competition (i.e., where all differentiated goods are not equally substitutable in a representative consumer’s taste function, oligopoly and monopoly. 3 The material is presented in the order that it was conceived. The lag in publication time through Journals due to refereeing and rejection processes means that the 2006 piece was actually formulated before the 2005.
5

here. In Section 3 first we state the Lipsey, Carlaw and Bekar (2005) theory of GPT-driven growth which incorporates multiple GPTs, multiple lines of applied R&D and more than one line of final production. This model allows for many types of technological complementarities of the sort discussed in Carlaw and Lipsey (2002). We then report our theoretical advances for this paper, namely incorporating multiple structural adjustment costs in all lines of applied R&D in the multi-sector system. This step allows us to simulate and specifically calibrate the model to the Australian economy for the recent period of ICT diffusion. ICT is generally regarded to be a GPT that has significant structural adjustment cost and some of the empirical data collected for Australia’s industrial sectors may be used to determine these structural adjustment costs. Section 4 outlines the simulation procedures used and provides baseline parameters for the simulation. It also lays out the complicated TFP growth rate calculation procedure for the model. Section 5 provides the baseline simulation and Monte Carlo experiments based in part on parameter calibrations using the available Australian data. Section 6 compares the available Australian data to the experimental results as a first cut at relating the data to the theoretical frontier. Section 7 provides a mapping of possible avenues of further research including suggestions for data development that will allow for more extensive testing and calibration of the theoretical model.
2. GPT-Driven Growth Theory to Date The GPT concept was invented by Bresnahan and Trajtenberg in (1992), however, the concept of structured technology dates at least back to Nelson and Winter (1980), Freeman and Perez’s (1982) Technoeconomic Paradigms and Mokyr’s (1990) Macro Inventions. Helpman’s (1998) volume on long run growth and GPTs is a collection of the first generation of GPT growth models which were inspired by the earlier work of Bresnahan and Trajtenberg. Since Helpman’s book very little has been done to advance the state of GPT theorising with the exception of Carlaw and Lipsey (2001 and 2006) and Chapters14 and 15 of Lipsey, Carlaw and Bekar (2005). Part of the problem for further development has been that need to step out of the traditional mould of modelling economic growth as a stationary equilibrium concept. Carlaw and Lipsey (2001) first introduced a non-stationary equilibrium concept into GPT modelling and have refined the model to include a number of complexities that the first generation of GPT models could not. The model requires computer simulation to solve to the transitional equilibrium in each time period and is also consistent with the stylized growth facts presented in Jones (1998).
One of the virtues of the Carlaw and Lipsey model is that it can be used to conduct Monte Carlo experiments. Carlaw (2004) exploits this capacity to examine the issue of whether and under what condition total factor productivity (TFP) measures technological change. The view that TFP does not measure technological is presented Carlaw and Lipsey (2001, 2003 and 2006 forthcoming), Lipsey and Carlaw (2004) and Lipsey, Carlaw and Bekar (2005 forthcoming). Carlaw (2004) echoes this view and uses some models developed for Lipsey, Carlaw and Bekar (2005) that incorporate multi-sectors into a model of endogenous GPT-driven growth.
Two models: a basic three sector model, and a four sector model that includes structural adjustment costs taken from Lipsey, Carlaw and Bekar (2005 forthcoming) are used by
6

Carlaw (2004) to assess measures of ICT diffusion in Australia relative to measured TFP. In the models, a sequence of GPTs arrive each at uncertain times and with uncertain productive impacts that diffuse according to a logistic process. The models assume behaviour that results in resource allocations such that a non-stationary equilibrium is generated, which is consistent with observed growth throughout history. The models have the property that in the absence of future GPTs there are diminishing returns and growth asymptotically approaches zero. But the arrival of new GPTs rejuvenates and sustains the growth process.
Carlaw (2004) confirms the arguments of Carlaw and Lipsey (2003) and Lipsey and Carlaw (2004) that TFP is not a measure of technological change. Under assumptions of zero structural adjustment costs, TFP is positively correlated with direct measures of technological change. However, it persistently under estimates such technological change. Under conditions of positive structural adjustment costs, TPF growth is negatively correlated with measured technological change and persistently underestimates technological change when a new GPT arrives and overestimates technological change as the GPT matures. In both models TFP fails to detect the arrival of the big technological shocks of GPTs.
When real data is analysed for the Australian productive capital stock the results are found to be consistent with the predictions of the model. That is ICT is a major new transforming GPT that generates the kind of structural adjustment costs discussed in Lipsey, Bekar and Carlaw (1998b) and Lipsey, Carlaw and Bekar (2005 forthcoming). In ten of the twelve sectors of the Australian economy and in ten of the sixteen OECD economies Carlaw (2004) examines, TFP shows a negative correlation with independent measures of technological change and in a number of cases this correlation is significant.
3. Multiple GPTs and Structural Adjustment Costs The models developed in Chapters 14 and 15 of Lipsey, Carlaw and Bekar (2005) which were used in Carlaw (2004) are limited in their scope of application because of some of the simplifying assumptions used to establish the theory of GPTs. One of the limitations in that research is that the models contain only one GPT at any time.
Yet a new transforming GPT such as ICT often appears in a small number of production activities and then, as it develops, it overtakes incumbent technologies in many other production activities.4 Two of the major problems caused by the modelling limitation of only one GPT are, first, that the behaviour of the macro economy is predominantly determined by the behaviour of the single GPT and its related applied technologies (something that is obviously incorrect in most modern economies where several GPTs currently are in existence) and, second, that relations of complementarity and
4 For example, the steam engine first competed with horse powered capstans to pump water out of mines, later with waterwheels to power factories, later with horse drawn vehicles to power railway engines, and later with wind and sail to power riven and ocean going, transport ships. When it entered shipping, it first competed with horse and person drawn river barges, then with river vessels, then with row boats to tug big sailing ships in harbour, then with passenger packets on short hauls such as the English Channel, then with three masted sailing ships on long haul passenger traffic and high value freight and, finally nearly a century after it first took to the water, with long distance bulk freight.
7

displacement of GPTs among several contemporaneous GPTs and lines of applied R&D cannot be modelled.
With respect to the first limitation, it is obvious that the macro behaviour of the whole economy mirrors that of a typical GPT much more closely when there is only one GPT in operation at any one time, as opposed to when there are several, each at a different stage in their development and each of which will give way to a challenger at a different point in time.
With respect to the second limitation, the historical cases discussed in Chapters 5 and 6 of Lipsey, Carlaw and Bekar (2005 forthcoming) show many examples of GPTs that complement each other rather than compete. An example is the complementary relationship between electricity and electronic computers, where the latter could not exist without the former. The examples also show many cases where a GPT of the type categorical type displaces an existing GPT in the same category, as for example when the power GPT of steam displaced that of water wheels in mechanical textile manufacturing in the First Industrial Revolution.
Some of these complementary relations have been partially modelled by Lipsey, Carlaw and Bekar (2005 forthcoming, Chapter 14) by endogenising the coefficient that determines how much pure knowledge is actually useful in a new GPT. Doing this allows knowledge accumulated in the past to influence the impact of future GPTs. Lipsey, Carlaw and Bekar (2005 forthcoming) also develop a model that allows two GPTs to coexist. However, they stop short of incorporating the structural adjustment costs associated with many GPTs when they arrive.
In the current research we adopt the Lipsey, Carlaw and Bekar (2005) model of multiple GPTs and multiple industrial sectors and modify it to include structural adjustment cost for the several lines of GPT generating pure knowledge. First however, we summarize the multiple GPT model presented in Lipsey, Carlaw and Bekar (2005).
3.1 More than one pure knowledge sector As already mentioned a limitation in all previous GPT models except that of Lipsey Carlaw and Bekar (2005) is that they contain only one GPT at any one time.
In this section we develop a model that allows for J pairs of consumption and applied R&D sectors to exist along with X lines of pure knowledge production. Each line of pure knowledge is capable of producing a sequence of GPTs through time.
Resources must be allocated among 2J + X sectors:
(1) , ,1 1 1
J J X
,j j x
t c t a tj j x
g tR r r= = =
= + + r∑ ∑ ∑
j = (1,…,J) denotes the J types of consumption and applied R&D production. x = (1,…,X) denotes the X types of pure knowledge production. The J consumption sectors are defined in equation 2.
(2) 1, , ,( ) ( )j
j t j t c tc A r 2α α= , i (0,1], 1,2iα ∈ =
8

Applied R&D will now utilize GPTs produced from each of the pure knowledge sectors so the production function for each applied R&D activity now has three arguments, two types of GPT knowledge, and resource inputs. Each GPT arrives with a set of parametric coefficients, ν, that determines it own productive potential and how it alters that of the other type of GPT.
(2)
1
1, , , , , 11 1
, , , 1
max ( ) , ( ) ( )
(1 )
(0,1), (1, , 1).
x x
z z
X Xx x x x j
j t j t t z j t t z a tx x
j t j t j t
i
a G G
A a A
i X
β βν ν
ε
β
+
− −= =
−
⎧ ⎫⎡ ⎤ ⎡ ⎤= ⎨ ⎬⎢ ⎥ ⎢ ⎥
⎣ ⎦ ⎣ ⎦⎩ ⎭= + −
∈ = +
∏ ∏
K
,xr β
Suppose a new GPT of type 1 arrives, bringing with it a new set of νs, each drawn from a beta distribution and denoted tz. We now compare two combinations: the existing type-2 GPT with the old type-1 GPT, denoted z-1 and the existing type–2 with the new type-1 GPT denoted z. selecting the one that leads to the higher output. Depending on the realization of the νs, the new GPT may have to wait for any adoptions, or it may be adopted in one sector immediately and in the other much later, or it may immediately eliminate its competitor everywhere.5
Having defined ν ∈ Vt as a set of random variables for the purposes of laying out the theory, it is important to note that Vt can also serve as an important point of contact between empirical research and the theory. Instead of allowing Vt to be determined as a set of draws from a random distribution, it could be determined from available data on the GPT under examination. For example, for the empirical analysis of this research Vt will be chosen to match the characteristics of ICT in relation to other technologies in Australia’s industrial sectors. This capability to calibrate the model by choosing Vt from real data opens up the possibility for a number of policy experiments. A number of intervention scenarios can now be tested in the simulation of the model by manipulating the relative values of the parameters contained in Vt. The values would have to be chosen based on the available empirical evidence and a set of judgements about how the intervention might affect the system under examination. In this way scenarios of how and when policy makers might expect there interventions with respect to ICT to impact on economic growth and productivity is possible.
Resources must now be allocated among X types of pure knowledge research, which requires keeping tract of the accumulation of pure knowledge and the arrival process of GPTs from the X sources of pure knowledge. GPTs arrive in each line of activity in the same way as in the three sector model of Lipsey, Carlaw and Bekar (2005 forthcoming, Chapter 14), i.e., *
, ,x t x tλ λ≥ .
5 Note that equation 11 represents the impact of the actual current stock of pure knowledge on the applied R&D sector where expectations of the current stock of pure knowledge are employed in the maximization procedure defined below in equation 16.
9

(3) ( ) ( ) 1
, ,1
JjJ
xx t j j t t g t
j
g A rσσ
μ θ ,+
=
=∏ , (0,1], 1,..., 1i i Jσ ∈ = + .
Potential useful knowledge in each of the X lines of pure research is accumulated according to:
(4) , , ,(1 )p p1x t x t x tG g Gδ −= + −
Actually useful pure knowledge (when the GPT arrives):
(5) ( ),
1 1,
( )
, , , , ,( )1
z x
z z zz x
t th
x t x t x t x t x tt teG G G G
e
τ γ
τ γϖ− −
+ −
+ −
⎛ ⎞= + −⎜ ⎟
+⎝ ⎠
where
(6) ( ), 1 , , -1
,, 1
- if
otherwise
h p hx t x t x th
x t hx t
G G GG
G
*ϑ λ λ−
−
⎧ + ≥⎪= ⎨⎪⎩
and tz,x is the arrival date of the zth GPT in pure knowledge sector x, and γ and τ are calibration parameters controlling the rate of diffusion. θt is distributed uniformly with support [0.8, 1.2] and λ and ϑ are drawn from beta distributions as in the three sector model of Lipsey, Carlaw and Bekar (2005, Chapter 14).
The maximization problem requires the redefinition of the objective function to include the X lines of pure knowledge research. Once again agents take only the current marginal products into account when allocating resources across the 2J + X sectors. We simplify by assuming a representative agent with additive utility defined over the J lines of final consumption output.
(7)
{ }( )
( ) ( )
, , ,
21
1
1
, ,,, , 1
, , ,1 1 1
, , ,
, , , 1
, , , , , 11 1
max ( )=
. .
(1 )
max ( ) , ( ) ( )
j
j j xc t a t g t
x x
z z
J
J t j tr r r j
J J Xj j x
t c t a t g tj j x
jj t j t c t
j t j t j t
X Xx x x x j
j t j t t z j t t z a tx x
U c c
s t
R r r r
c A r
A a A
a G G
ϕ
αα
β β
ε
ν ν ,xr β +
−
=
= = =
−
−= =
= + +
=
= + −
⎧ ⎫⎡ ⎤ ⎡ ⎤= ⎨ ⎬⎢ ⎥ ⎢ ⎥
⎣ ⎦ ⎣ ⎦⎩ ⎭
∑
∑ ∑ ∑
∏ ∏
( ) ( ) ( ) 31 2
, , , 1
, 1, 2, ,
(1 )x t x t x t
xx t t t g t
G g G
g A A rσσ σ
δ
μ μ
−= + −
=
The development of the model this far opens up a number of obvious possibilities to bring it closer to the observed reality of an economic system in which several GPTs are
10

operating with many applications and many consumption goods. For example, this simple framework can be extended to many sectors simply by adding more lines of production to the three main production activities. To this point the characteristics of both the applications and the efficiency logistic curves have been incorporated into model. The macro behaviour of the economy is an aggregation of the different technological diffusion processes being driven by the existing GPTs, and is not now dominated by a single GPT. Using Mote Carlo methods to track the diffusion of a given GPT across the various applications sectors would also provide insights into how such diffusion processes manifest themselves in the observed economic data produced by statistical agencies. Furthermore, the number of GPTs modelled and the number of line of applied R&D and final consumption production can be calibrated to match with empirical data in a given economy. Finally, and possibly most importantly policy intervention scenarios can be played out with respect to policy designed to influence ICT. The size and timing of the impacts such interventions on economic growth and productivity can be determined in an experimental fashion. What remains to be done is to model structural adjustment costs in each of the lines of applied R&D activity in the system. We do this in the next section.
3.2 Multiple Structural Adjustment Costs As has already been mentioned, a limitation with the model developed thus far is that the structural adjustment costs associated with each GPT in the system are different in their impact across time and space. Fortunately, structural adjustment costs associated with the arrival of some new GPTs such as ICT can be modelled sector by sector now that the model incorporates multiple lines of applied R&D. In this phase the theoretical framework of Lipsey, Carlaw and Bekar (2005 forthcoming, Chapter 15) will be extended to model these multiple types of structural adjustment costs which will reflect the different ways that ICT enters and impacts on different industrial sectors of the economy requiring sometimes significant additional investments in complementary technologies.
The development of this theoretic component is of key importance for two reasons. First, ICT has different structural impacts from other GPTs and these are different in the various sectors of an economy. For example, ICT in manufacturing has different structural impacts than ICT in financial services. ICT impacts both sectors in terms of the organization of information flows, however, in manufacturing computers have impacts in the form of CAD and CNC that impact machine efficiencies and plant and production flow organization, whereas, it facilitates vital and instantaneous flows of information on assets prices in the financial services sector. Allowing differentiated structural adjustment costs by sector enables better detection of when and how ICT generates economic growth in the form of productivity gains in specific industrial sectors.
Second, modelling differentiated structural adjustments allows for more sophisticated policy scenario experimentation within the modelling framework.
Lipsey, Carlaw and Bekar (2005 forthcoming) argue that often a new GPT is not well adapted to what they define as the existing facilitating structure, real resources must be
11

invested in altering many of the elements of that structure.6 We assume that all of the structural adjustments are accomplished by the applied R&D sector (Lipsey, Carlaw and Bekar, 2005 forthcoming, chapter 15). This assumption is made for simplicity, and because many of the actual structural adjustment problems do occur in the application of the GPT to various uses. For example, the application of ICT to financial services required a new organizational technology, new design of banks, changes in industrial concentration, and in workers’ skills.
With the introduction of structural adjustment costs, equations (2) and (3) – (6) are unaltered. The resource constraint now allocates resources across 2J + 2X activities: J consumption sectors, J applied R&D sectors, and X pure R&D sectors, plus X structural adjustment sectors.
(8) , ,,
1 1 1 1a t g t s t
J J X X
,
j j xt c t
j j x x
xR r r r= = = =
= + + + r∑ ∑ ∑ ∑
where, ,x
s tr , is the amount of the resource used in each line of structural adjustment associated with each of the X GPTs in the system.
Once again, the model captures the behaviour of GPTs acting as complements and as a displacer of the GPT that exists from the same line of pure knowledge research. Again whether the new GPT is chosen depends on whether the set of GPTs and their related νx
j and κx
j parameters creates the most output with the new GPT or the old GPT. In either case the choice between to the first two terms is then complementary with the resources allocated to each line of applied R&D. Each line of production of applied knowledge is altered to include the possibility of allocating resources to the activity of adjusting the structure with a structural adjustment cost, SAt , defined in equation 10, which reduces the immediate impact of the new GPT on productivity in that particular applied R&D sector.
(9)
( ) ( ) 2 1
1 1 11, , , , , , ,, ,
1 1
, , , 1
max ( ) , ( ) ( )
(1 )
x xX x X x X
x xz z z z z zz z
X Xx x x x j
j t x t j t x t x t j t x t a tj t j tx x
j t j t j t
a G SA G SA
A a A
β ββ β βν χ κ ν χ κ
ε
+ +,r +
− − −−= =
−
⎧ ⎫⎡ ⎤ ⎡= ⎨ ⎬⎢ ⎥ ⎢
⎣ ⎦ ⎣⎩ ⎭= + −
∏ ∏ ⎤⎥⎦
with (0,1], 1,..., 2 1i i Xβ ∈ = + ,
,
0 with Prob 0.5 Beta with Prob 0.5x
z
xtj t
Vν⎧
∈ = ⎨⎩
, and
. ,
0 with Prob 0.5 Beta with Prob 0.5
xj t tKκ
⎧∈ = ⎨
⎩
6 Although we do not introduce labour explicitly in the model, we note that these structural adjustment costs can be significant when the arriving GPT separates workers from there work because an old technology and its corresponding skills embodied in the human capital of labour are made obsolete.
12

Once again for the sake of theoretical exposition the random coefficients used to model the productivity of each of the X GPTs in the J lines of applied R&D, Vt, is an XxJ array of random variables with elements , z
xj tν that take on the values of 0 with probability 0.5
and values drawn from a beta distribution with probability 0.5. However, in addition and again for theoretical exposition, we have random coefficients for the effect the structural adjustment costs from each GPT in each line of applied R&D, Kt, is an XxJ array of random variables with elements ,
xj tκ that take on values of 0 with probability 0.5 and
values drawn from a Beta distribution with probability 0.5. This is done to reflect the behaviour that each GPT will potentially have different structural adjustment costs in each line of applied R&D.7
As is the case in the previous model with νxj ∈ Vt, κ xj ∈ Kt can be determined by real
world data rather that by drawings from a distribution of random numbers. Once again this allows the model to make empirical contact and enables its calibration to the Australian data. And, it opens avenues for further, more sophisticate policy experimentation. Policy makers can speculate with respect to interventions that influence the structural adjustment costs thus affecting the speed of adjustment to the new technology and the speed of impact of the technology on economic growth and productivity. As we noted in the introduction, ICT is a technology that impacts directly on organizational structures throughout the economy, many of which are government organizations, institutions and laws. Experimentation on the relative values of Kt in relation to those of Vt in the various sectors of the Australian economy will potentially aid in developing expectations of the impact of policy adjustments both within government institutions and on the wider economy.
We model the productivity in each line of applied research as being determined by two forces: the first arrives as the productivity enhancing effect of the logistic diffusion of a the current xth GPT ( ,x tGχ in equation 9) and the second is the effective structural adjustment associated with the xth GPT (SAx,t in equation 9).8 But the effective structural adjustment itself depends on two things (as shown in equation 10), first, the accumulated amount of adjustment achieved by allocating resources to structural adjustment, which tends to increase effective adjustment and, second, the need for further adjustment introduced by the arrival of a new GPT, which tends to decrease current effective adjustment.
,x tSA is defined as follows:
(10) ,,
,
x tx t
x t
SSA
SC= .
7 Note once again that equation (9) represents the impact of the actual current stock of pure knowledge on the applied R&D sector where expectations of the current stock of pure knowledge are employed in the maximization procedure defined below. 8 We have made an additional change by weighting the diffusion of the GPT by a fractional coefficient, χ, so that we can apportion the stock of pure knowledge into that which positively influences the production of at in the applied R&D sector and that proportion (1- χ) which positively influences the production of st in the structural adjustment sector. As mentioned in an earlier footnote we break this stock up to avoid increasing returns to accumulating knowledge and facilitate easier TFP calculations that follow.
13
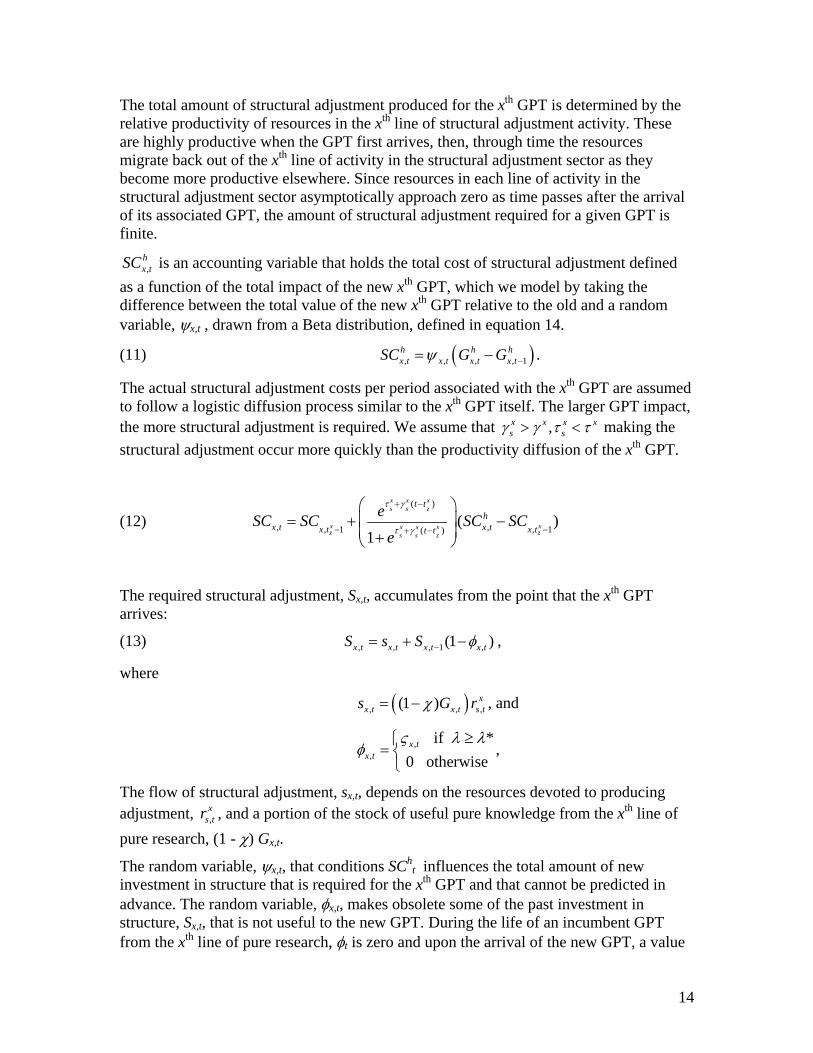
The total amount of structural adjustment produced for the xth GPT is determined by the relative productivity of resources in the xth line of structural adjustment activity. These are highly productive when the GPT first arrives, then, through time the resources migrate back out of the xth line of activity in the structural adjustment sector as they become more productive elsewhere. Since resources in each line of activity in the structural adjustment sector asymptotically approach zero as time passes after the arrival of its associated GPT, the amount of structural adjustment required for a given GPT is finite.
,hx tSC is an accounting variable that holds the total cost of structural adjustment defined
as a function of the total impact of the new xth GPT, which we model by taking the difference between the total value of the new xth GPT relative to the old and a random variable, ψx,t , drawn from a Beta distribution, defined in equation 14.
(11) ( ), , , ,h hx t x t x t x tSC G Gψ 1
h−= − .
The actual structural adjustment costs per period associated with the xth GPT are assumed to follow a logistic diffusion process similar to the xth GPT itself. The larger GPT impact, the more structural adjustment is required. We assume that ,x x x x
s sγ γ τ τ> < making the structural adjustment occur more quickly than the productivity diffusion of the xth GPT.
(12) ( )
, ,, 1 , 1( )( )
1
x x xs s z
x xx x xz zs s z
t th
x t x tx t x tt t
eSC SC SC SCe
τ γ
τ γ
+ −
− −+ −
⎛ ⎞⎜ ⎟= + −⎜ ⎟+⎝ ⎠
The required structural adjustment, Sx,t, accumulates from the point that the xth GPT arrives:
(13) , , , 1 ,(1 )x t x t x t x tS s S φ−= + − ,
where
( ), ,(1 ) ,x
x t xs Gχ= − t s tr , and
,,
if *0 otherwisex t
x t
ς λ λφ
≥⎧= ⎨⎩
,
The flow of structural adjustment, sx,t, depends on the resources devoted to producing adjustment, ,
xs tr , and a portion of the stock of useful pure knowledge from the xth line of
pure research, (1 - χ) Gx,t.
The random variable, ψx,t, that conditions SCht influences the total amount of new
investment in structure that is required for the xth GPT and that cannot be predicted in advance. The random variable, φx,t, makes obsolete some of the past investment in structure, Sx,t, that is not useful to the new GPT. During the life of an incumbent GPT from the xth line of pure research, φt is zero and upon the arrival of the new GPT, a value
14

between 0 and 1 is chosen randomly from a uniform distribution. It is applied once and then reverts to zero.
(14) [ ], ( | , ) , 0 2x t x xbeta xψ ο ν η ο= < <
The constant οx allows the random variable drawn from the beta distribution to take on values larger than one. This, combined with the calibration of ν and η, determines the probability that ψx,t is greater than or less than one. ςx,t is drawn from a uniform distribution with support of [0, 1].
The maximization problem includes the allocation of resources to J lines of final consumption, J lines of applied R&D, X lines of pure research and X lines of structural adjustment. Once again a representative agent with an additive utility function defined over the J lines of consumption output is assumed.
(15)
{ }( )
, , , ,
, ,
1 2
,, , , 1
,1 1 1 1
, , ,
max ( )
. .
( ) ( )
j
j j x xc t a t g t s t
a t g t s t
JJt j t
r r r r j
J J X Xj j x
t c tj j x x
jj t j t c t
U c c
s t
,
xR r r r
c A r
ϕ
α α
=
= = = =
=
= + + +
=
∑
r∑ ∑ ∑ ∑
( ) ( ) 2 1, , , , , , ,, ,
11
, , , 1
max ( ) , ( ) ( )
(1 )
x xX x X x X
x xz z
X Xx x x x j
j t x t j t x t x t j t x t a tj t j txx
j t j t j t
a G SA G SA
A a A
β ββ β βν χ κ ν χ κ
ε
+ +,r +
==
−
⎧ ⎫⎡ ⎤ ⎡ ⎤= ⎨ ⎬⎢ ⎥ ⎢ ⎥
⎣ ⎦⎣ ⎦⎩ ⎭= + −
∑∏
( ) ( ) ( ) 31 2
, , , 1
, 1, 2, ,
(1 )x t x t x t
xx t t t g t
G g G
g A A rσσ σ
δ
μ μ
−= + −
=
and equations (10 – 14)
The maximization problem is altered slightly from the model presented in Section 3.1 to include the allocation of resources for producing structural adjustment. The new structural adjustment sector requires that extra marginal products be included for the X lines of structural adjustment in the system. Resources are still allocated so as to maximise the utility from each line of consumption output in each current period by equating the expected marginal increase in consumption from a unit of resources allocated to each of the J applied R&D, X pure knowledge and X structural adjustment sectors of the system, but with productivity in each taken as given. We could assume that a social planner makes the entire allocation over the four sectors. Alternatively we could assume that the allocation is made by private price taking agents in the consumption and
15

applied research sectors9 and by a government that taxes agents in the other two sectors to pay for pure research and structural adjustment, which has the assumed payoff just described.
We have modelled the cost of adjusting the facilitating structure to each new GPT in each line of pure knowledge research as depending on both the size of the required new investment and the amount of obsolescence that the pre-existing structure experiences. This has some interesting implications. First, structural adjustment costs are a potential source of productivity slowdowns that do not directly result from characteristics built into GPTs themselves. We demonstrate this prediction in the subsequent research for this project when we calculate TFP for both the baseline model of section 3.1 and the structure adjustment model of this section.
Second, the arrival of each GPT in each line of pure knowledge research will result in different structural adjustment costs, which mirrors the empirical experience.
Third, different GPTs may cause structural adjustment costs and related productivity slowdowns for different reasons. Structural investments of the sort that get counted at their resource costs, such as public infrastructure or policy structure adjustments, will not contribute to measured increases in productivity. If these costs are big enough, a productivity slowdown of the sort originally discussed by Paul David (1990) can result as resources are diverted to structural adjustment with no productivity pay off. Once the structure has been adjusted to the new GPT, these resources are freed up to migrate back to productivity enhancing activities and a temporary productivity boom may ensue. Unlike the diversion of resources to an R&D sector that occurs in other authors’ GPTs models as a direct consequence of the characteristics of the GPTs, but which are too small to generate empirically significant productivity slowdowns, our resource diversions into structural adjustment can be large enough to do so. Thus our theory presents an opportunity to investigate further the causes of productivity slowdowns. In this section, we model the structural adjustment costs as stochastic. In reality, the characteristics of some GPTs undoubtedly lead to high structural adjustment costs and, therefore, large productivity slowdowns, whereas others with different characteristics do not come with high structural adjustment costs, and therefore, do not generate slowdowns. Our modelling to this point allows us to demonstrate cases where productivity is sometimes slowed and sometimes negatively correlated with the arrival of GPTs, the outcome depending on the structural adjustment requirements. Thus we are able pose empirically testable hypotheses in which some GPTs cause slowdowns while others do not and test them in actual data.
This last point is particularly important for the experiments that are planed in the Australian industrial level data on national accounts and investments. Firstly, the structural adjustment cost impact parameters defined in the variable Kt in can be empirically determined as can ICTs complementarity characteristics defined in Vt. Secondly, the empirically determined Kt and Vt can be related to each other through the theory and productivity and growth measurements determined from them. Thirdly, various relatively sophisticated policy intervention experiments are feasible with the
9 Dixit-Stiglitz style monopolistic competition can be introduced into these two sectors with an increase in complexity and no change in the qualitative behaviour of the model.
16

advancement of the theory to include multiple lines of production, research and structural adjustment costs. Thus, expectations of the timing and impact of such interventions on economic growth and productivity can be formulated in advance of implementing policies.
4. The Simulation Model In this section we lay out the details of our simulation of the model presented in section 3 and 4. Those models laid out the theory of GPT creation and diffusion, and the subsequent economic growth that GPTs induce in a general way. In this research, however, we are interested in a particular GPT, ICT, in a particular context, Australia. We, therefore, impose more structure on the model when we come to simulating by introducing specific characteristics of ICT and Australia. We then lay out the parameter calibrations used for our baseline simulation. Finally, we lay out the details of how we calculate TFP and knowledge growth in the various sectors modelled in the simulation and in aggregate and perform some test simulations.
4.1 Simulation Structure First, Australia has not produced the GPT’s currently used in its economic production. Therefore, we must make an assumption with respect to how GPTs arrive exogenously and are picked up by the applications sector. We have a couple of options for handling the GPT sectors in the model. One option is to assume that they are completely exogenous and that GPTs simply arrive from abroad. However this has a limiting characteristic in the sense that to be able to adopt a GPT requires that a sufficient scientific knowledge base exists within the adopting country. We therefore take a second option and assume that resources allocated to the pure knowledge sectors are used to create a scientific knowledge base that is sufficient to implement GPTs as they arrive in the system.
Under this assumption there are a number of possibilities for modelling the behaviour that allocates resources to the pure knowledge sectors. One option is to have an exogenous allocation of resources to these sectors, which might reflect a tax transfer system of the sort used to fund part of tertiary education (e.g. public universities) in Australia. Another option is to allow for endogenous allocation of resources to these sectors based on their expected marginal products in pure knowledge production. We model both of these options in the simulation procedures. But they turn out to be qualitatively similar in terms of their impact on the aggregate behaviour of the model, particularly the rates of knowledge growth and productivity change. So for simplicity and ease of exposition we allow endogenous allocations of resources to the pure knowledge sectors. This is equivalent to assuming that the tax transfer system is dynamically optimal for maximizing the expected utility from all lines of current consumption.
Second, because GPTs are not produced in Australia we assume that the allocation of resources to the pure knowledge sectors and to each line of structural adjustment are largely for developing Australia’s absorptive capacity for GPTs. The stocks of potential pure knowledge are possible indicators of general absorptive capacity, while the structural adjustments associated with each GPT are potential indicators of the specific capacity to absorb the that GPT into the economy. However, we must note that the arrival
17
of each new GPTs may mean that this stock of accumulated knowledge for structural adjustment in the old GPT is not necessarily appropriate to the newly arrived GPT and therefore some is rendered obsolete. Also some of the general pure knowledge may be unsuitable for a given GPT and so it is affected by obsolescence as well. We have modelled this in the obsolescence factors for pure knowledge and accumulated structural adjustment.
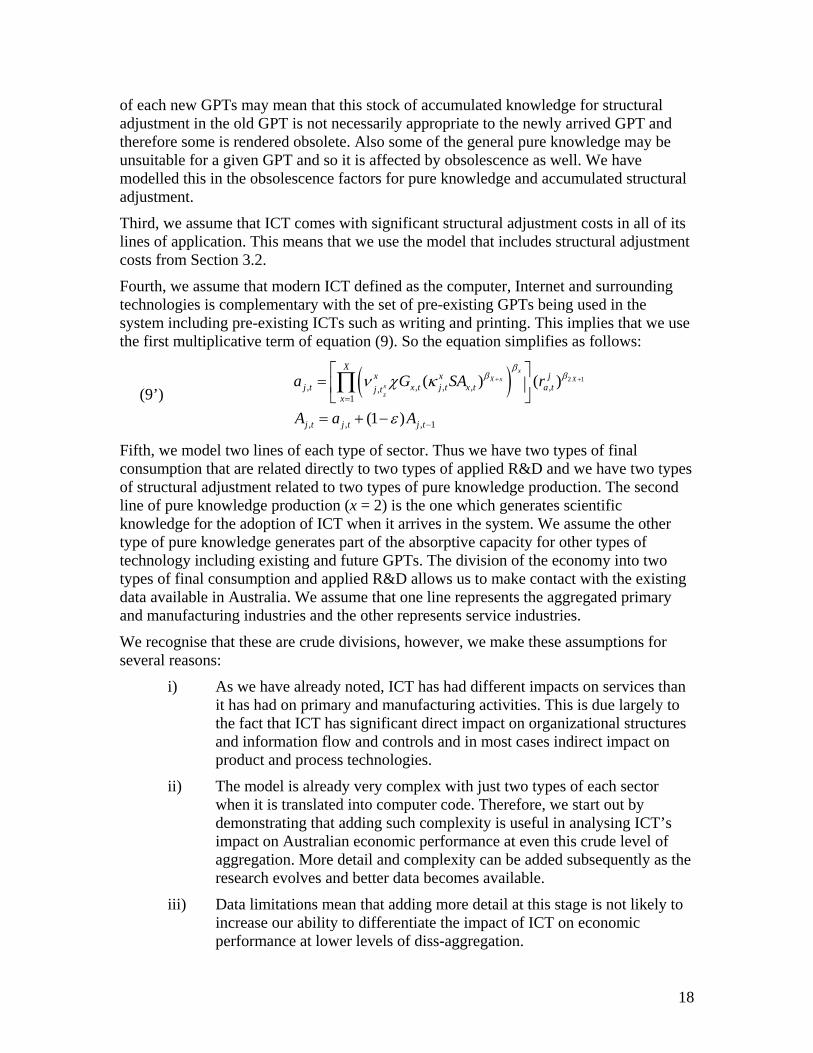
Third, we assume that ICT comes with significant structural adjustment costs in all of its lines of application. This means that we use the model that includes structural adjustment costs from Section 3.2.
Fourth, we assume that modern ICT defined as the computer, Internet and surrounding technologies is complementary with the set of pre-existing GPTs being used in the system including pre-existing ICTs such as writing and printing. This implies that we use the first multiplicative term of equation (9). So the equation simplifies as follows:
(9’) ( ) 2 1, , , ,,
1
, , , 1
( ) ( )
(1 )
xX x X
xz
Xx x j
j t x t j t x t a tj tx
j t j t j t
a G SA r
A a A
ββ βν χ κ
ε
+ +
=
−
⎡ ⎤= ⎢ ⎥⎣ ⎦
= + −
∏ ,
Fifth, we model two lines of each type of sector. Thus we have two types of final consumption that are related directly to two types of applied R&D and we have two types of structural adjustment related to two types of pure knowledge production. The second line of pure knowledge production (x = 2) is the one which generates scientific knowledge for the adoption of ICT when it arrives in the system. We assume the other type of pure knowledge generates part of the absorptive capacity for other types of technology including existing and future GPTs. The division of the economy into two types of final consumption and applied R&D allows us to make contact with the existing data available in Australia. We assume that one line represents the aggregated primary and manufacturing industries and the other represents service industries.
We recognise that these are crude divisions, however, we make these assumptions for several reasons:
i) As we have already noted, ICT has had different impacts on services than it has had on primary and manufacturing activities. This is due largely to the fact that ICT has significant direct impact on organizational structures and information flow and controls and in most cases indirect impact on product and process technologies.
ii) The model is already very complex with just two types of each sector when it is translated into computer code. Therefore, we start out by demonstrating that adding such complexity is useful in analysing ICT’s impact on Australian economic performance at even this crude level of aggregation. More detail and complexity can be added subsequently as the research evolves and better data becomes available.
iii) Data limitations mean that adding more detail at this stage is not likely to increase our ability to differentiate the impact of ICT on economic performance at lower levels of diss-aggregation.
18

Six, we assume that V and K are determined from existing data. In particular we manipulate the relative and absolute sizes of these parameters for each GPT in the two types of consumption and applied R&D. This enables us to introduce differences between services and the primary and manufacturing activities as measured from the available data. It also allows for Monte Carlo tests of policy interventions to facilitate structural adjustment.
4.2 Parameterization The parameter values used to simulate the results of the multiple sector model with structural adjustment.
J = 2 X = 2 μ = 0.5 χ = 0.8
α1 = 1 α2 = 0.3 β1 = 0.7 β2 = 0.7
β3 = 1 β4 = 1 β5 = .03 σ1 = 1
σ2 = 0.3 A0,j = 1 G0,x = 1 S0,x = 1
ε = 0.01 δ = 0.01 φ = 0.01 γ = 0.07
τ = -5.5 γs = 0.08 τs = -4 ϕ1 = 0.5
ϕ2 = 0.5 T = 250
, , ,,1 1 1 1
1000a t g t s t
J J X Xj j x x
t c tj j x x
R r r r r= = = =
= + + + =∑ ∑ ∑ ∑
In the base line case ϑ is not endogenised so ω = 0. For λ we seed the system with specific arrival dates to match the diffusion horizon of ICT in Australia. For ϑ we choose ν = 10 and η = 5. For ϖ we choose ν = 12 and η = 5 and multiply all values of xt by 1.5. We set the parameters for complementarity among GPTs and for structural adjustment to constants , 0.5x
j tzν = and . In subsequent simulations we manipulate these and other parameters to incorporate empirical estimates and to test possible policy interventions. In each case the deviation from the base case is noted.
, 0.5xj tκ =
4.3 TFP and Knowledge Growth Calculations
In this section, we calculate MFP growth using our simulated data and ask under what conditions, if any, changes in MFP measure technological change.10 These calculations illustrate a more general argument (given in the Appendix to Chapter 4 of Lipsey, Carlaw and Bekar (2005 forthcoming), Carlaw and Lipsey (2003) and Lipsey and Carlaw (2004)) that changes in MFP measure only a small subset of the spillovers associated with technological change and not technological change itself.11
10 In what follows technological knowledge, pure and applied knowledge and technology are used interchangeably. 11 As we noted in the introduction we are not the first to argue that MFP does not measure technological change. See, for example, Jorgenson and Griliches (1967) and Hulten (2000). However, we go further than
19

To calculate total factor productivity growth in the model we start with an accounting identity that includes all of the inputs and outputs where total revenue equals total cost
(16) , ( ) ( )( )
( ) ( )( )
, , , ,1 1 1 1
, , , , , ,1
, , , , , , ,1
(1 ) (1 )
J J X X
c j j a j J g x x s x xj j x x
J
rc j c j ra j a j Ac j j Ga j jj
X
rg x g x rs x s x Gs x x Ag x x As x xx
p c p a p b p s
q r q r q A q G
q r q r q G q A q SA
μ χ
χ μ
= = = =
=
=
+ + +
≡ + + +
+ + + − + − +
∑ ∑ ∑ ∑
∑
∑
where pi’s, are output prices and q{ , , , }i c a g s∈ y’s, with the subscripts , are input prices. Note that we include SA{ , , , , , , , , }y rc ra rg rs Ac Ga Gs Ag As∈ t as an
input rather than just St because it is the ratio of St to SCt that matters in the production function for applied R&D. We divide through the identity by pc,1 to establish relative prices of everything in terms of final consumption of type j = 1.
(16’) ( ) ( )
( ) ( )
, , , ,1
2 1 1 1,1 ,1 ,1 ,1
, , , ,, ,
1 ,1 ,1 ,1 ,1
, ,, ,, ,
,1 ,1 ,1 ,1
(1 ) (1 )
J J X Xc j a j g x s x
j J x xj j x xc c c c
Jrc j ra j Ac j Ga j
c j a j j jj c c c c
rg x Ag xrs x Gs xg x s x x x
c c c c
p p p pc c a b s
p p p p
q q q qr r A G
p p p p
q qq q qr r G A
p p p p
μ χ
χ μ
= = = =
=
+ + + +
⎛ ⎞≡ + + +⎜ ⎟⎜ ⎟
⎝ ⎠
+ + + − + − +
∑ ∑ ∑ ∑
∑
,
1 ,1
XAs x
xx c
SAp=
⎛ ⎞⎜ ⎟⎜ ⎟⎝ ⎠
∑
Input prices are established as:
(17)
, ,
, ,
, ,
, , ,
rc j c j rc j
ra j a j ra j
rg x g x rg x
rs x s x rs x
q q p MP
q q p MP
q q p MP
q q p MP
,
,
,
= =
= =
= =
= =
which implies:
these other authors by arguing that MFP is only an imperfect measure of a small subset of the spillovers associated with technological change and that sustained growth with zero MFP change is possible.
20

, ,1
,1 ,
, ,1
,1 ,
, ,1
,1 ,
, ,1
,1 ,
for 1c j rc
c ra j
a j rc
c ra j
g x rc
c rg x
s x rc
c rs x
p MPj
p MP
p MPp MP
p MPp MP
p MPp MP
= ≠
=
=
=
Similarly we can derive input prices relative to the price of the consumption good as follows:
(18)
, 1 , , , ,1 ,1,1
,1 ,1 ,1 ,1 ,1
, , ,1 ,1,1
,1 ,1 ,1
, , , ,1,
,1 ,1 ,
, , , ,1,
,1 ,1 ,
, ,
,1
rc j ra j rg x rs x c rcrc
c c c c c
Ac j Ag x c AA
c c c
Ga j a j Ga j rcGa j
c c ra j
Sa j a j S j rcS j
c c ra j
Gs x s x
c
q q q q p MPMP
p p p p pq q p MP
MPp p p
q p MP MPMP
p p MP
q p MP MPMP
p p MP
q PP
≠ = = = = =
= = =
= =
= =
= , ,1,
,1 ,
Gs x rcGs x
c rs x
MP MPMP
P MP=
Resources can be used in both lines of each of the four activities. So the first line of equation (18) shows all of the resource input prices equal to each other and determined by the marginal product of resources in the consumption sector. The input prices of the knowledge stocks are not the same in all production functions because A and G are not substitutes. So, while A used in the consumption sectors can be substituted for A used in the pure knowledge sectors G used in the applied knowledge sector is not a substitute for A anywhere else. The second line of equation (18) shows the price of the applied knowledge stock being equal in both the consumption and pure knowledge sector. Specific adjustments for the price of the stock of pure knowledge and the stock of accumulated structural adjustment must be made in the last three lines of equation (18) to make them consistent in its with all other prices.
Since the data generated by our model are discrete, we use a Törnqvist index to calculate MFP. Our model allows us to measure the rate of growth of technology directly as the rate of change of the knowledge stocks At and . These stocks are also aggregated using a Törnqvist index.
tG
Letting Yi’s represent the outputs of the three sectors and Xy’s represent their inputs, the Törnqvist index of MFP changes is:
21

(19) [ ] [ ]1 1
, , 1 , , 1 , , 1 , , 1
ln( ) ln( ) ln( ) ln( )
0.5( ) ln( ) ln( ) 0.5( ) ln( ) ln( )t t t t t
i t i t i t i t h t h t h t h ti h
TFP Y Y X X
w w Y Y v v X X− −
− − −
Δ = − − −
⎡ ⎤ ⎡= + − − + −⎣ ⎦ ⎣∑ ∑ − ⎤⎦,
Where the w’s and v’s represent share weights for outputs and inputs. Measuring MFP and knowledge growth for the individual sectors is straight forward in the modelling framework since we know the exact specifications of the production functions.
5. Monte Carlo Analysis We are now ready to simulate the model. In this section we report our baseline simulation and calculate knowledge growth and TFP from it. We then systematically engage in experiments on the parameters of the model to generate predictions about the impact of ICT in various sectors of the Australian economy given these parameterizations.
5.1 Base line model We run the base line simulation with the parameters identified Section 5.2 and calculate TFP and technological knowledge growth rates in aggregate and for the two sub-sectors of services industries, and primary and manufacturing industries. The model is seeded with GPT arrival times and run for 350 iterations that can be regarded as annual increments. So the data can be regarded as an annual time serries. The first 50 observations are not used as they merely wash out initial values of the stock variables. The initial arrivals of GPTs are set to establish a stock of existing GPTs. Pure knowledge sector 1 has an arrival at period 87(37) which is meant to roughly correspond to the emergence of electricity and the electrification of manufacturing and primary production. Pure knowledge sector 2 has an arrival of a GPT at period 175 (125) which is meant to roughly correspond to the emergence of Modern ICT. This GPT diffuses over the next 175 iterations. Figure 1 shows the growth rates of aggregate TFP and technological knowledge.
22

Figure1. Base Line Growth Rates
-10.00%-8.00%-6.00%-4.00%-2.00%0.00%2.00%4.00%6.00%8.00%
10.00%
1 27 53 79 105 131 157 183 209 235 261 287
Time
Aggregate TFPAggregate Knowledge
Figure 1 shows the growth rates of aggregate TFP and technological knowledge. Technological knowledge growth is everywhere higher that measured TFP and the growth rates are negatively correlated.
The growth rates of technological knowledge and TFP are negatively correlated and TFP growth is everywhere lower than knowledge. The correlation between TFP growth and knowledge growth is -0.89 and is statistically significant at the 5% level.
We also calculate TFP and knowledge growth rates for our two sub-sectors. Each of these sectors comprises an applied knowledge sector that uses both types of GPT and both types of associated structural adjustment and an associated final consumption sector. We treat sector one as representative of the primary and manufacturing industries and sector two as representative of the services industries.
Figure 2 shows the growth rates of TFP and technological knowledge in the primary and manufacturing sector. Once again we observe TFP growth is lower than knowledge growth and a negative correlation between the two. The correlation coefficient is -0.99 and is significant.
23

Figure 2. Primary and Manufacturing Sector Growth Rates
-5.00%-4.00%-3.00%-2.00%-1.00%0.00%1.00%2.00%3.00%4.00%5.00%
1 27 53 79 105 131 157 183 209 235 261 287
Time
Prim. & MFG TFPPrim. &MFG Knowledge
Figure 3 shows the growth rates of TFP and technological knowledge in the services sector.
Figure 3. Service Sector TFP and Knowledge Growth Rates
-5.00%-4.00%-3.00%-2.00%-1.00%0.00%1.00%2.00%3.00%4.00%5.00%
1 25 49 73 97 121 145 169 193 217 241 265 289
Time
Services TFPServices Knowledge
Again the rate of TFP growth is lower that that of knowledge growth and the two serries are negatively correlated. The correlation coefficient in this case is -1.00 and it is significant.
Table 1 reports the correlation coefficients and their significance as well as average growth rates of the period.
Table 1
Time Period Correlation T-stat Average Average
24

300 Iterations Coefficient TFP Growth
Knowledge Growth
Aggregate -0.24513 -34.1528 2.40E-02 7.07E-02
Primary and Manufacturing -0.97734 -47.0182 3.93E-03 1.33E-02
Services -0.98595 -54.8033 3.50E-03 1.72E-02
For this base line case we also note that the aggregate growth rate of final consumption is not driven by the growth rate of any single sequence of GPTs but rather by the interaction of the GPTs in the applied R&D and structural adjustment sectors. Figure 4 shows the growth rate of aggregate consumption which corresponds to final value added output and the growth rates of the stocks of pure knowledge which are driven by the arrival and diffusion of GPTs.
Figure 4. Aggregate Consumption and Pure Knowledge Growth Rates
-15.00%-10.00%-5.00%0.00%5.00%
10.00%15.00%20.00%25.00%30.00%
1 28 55 82 109 136 163 190 217 244 271 298
Time
Aggregate ConsumptionPure Knowledge Type 1Pure Knowledge Type 2
The growth rate of consumption is greater than the growth of pure knowledge and is uncorrelated with either of the pure knowledge growth rates. This is an important result because it demonstrates that in economies where more that one GPT is in simultaneous existence the emergence of a given GPT will be difficult to detect in the aggregate statistics even though it impacts on all sectors in the economy. The reason is that it impacts in a way that interacts with the other GPTs and applied technologies in the system, becoming and integrated component in much wider technological systems of production, each with particular technological characteristics. We now move to simulations that look at these different technological characteristics by making some of the parameters of the model different in the two sub sectors.
Figure 5 reports the natural log of the final value added output modelled as consumption for each of the sectors.
25

Figure 5. Log of Consumption in Sectors 1 and 2
0.00
5.00
10.00
15.00
20.00
25.00
30.00
1 32 63 94 125 156 187 218 249 280
Time
Prime. & MFGConsumptionServices Consumption
Not surprisingly the two patterns are coincident. This result is due to the symmetry in the parameterizations used for the base case. We report this figure to establish a baseline for comparison in subsequent simulations.
5.2 Variations in K and V To move closer to some more realistic assumptions we relax the assumption that the V’s and K’s of the parameterisation are equal to each other. In particular we model the service sector as having potentially higher structural adjustment costs and at the same time weaker complementarities with existing GPTs in the system. To model this behaviour in the simulation we assume that 1, 2,
x xt tκ κ> and 1, 2,
x xt tν ν> . We set the
parameters as follows: and 1, 2,0.5, 0.3x xt tκ κ= = 1, 2,0.5, 0.3x x
t tν ν= = . Table 1 reports the correlations between the growth rates of technological knowledge and TFP.
Table 2
Time Period 300 Iterations
CorrelationCoefficient t-stat
Average TFP
Growth
Average Knowledge
Growth
Aggregate -0.40339 -20.0498 2.22E-02 4.97E-02Primary and Manufacturing -0.94781 -31.5706 6.49E-03 1.62E-02
Services -0.97162 -39.9932 2.29E-03 7.35E-03
As is clear from Table 1 the pattern of higher technological growth relative to TFP growth persists and the correlations are negative and significant. We also see that the average growth rates for knowledge and TFP are lower for the aggregate and for the Services sector but higher for the Primary and Manufacturing sector relative to the base line. This is a reflection of the lower values of 2,
xtκ and 2,
xtν used in this simulation
relative to the base line.
26

Figures 6 – 8 plot growth rates in aggregate and in the two sectors
Figure 6. Aggregate TFP and Knowledge Growth Rates
-10.00%
-5.00%
0.00%
5.00%
10.00%
1 34 67 100 133 166 199 232 265 298
Time
Aggregate TFP
Aggregate Know ledge
Figure 7. Primary and Manufacturing TFP and Knowledge Growth Rates
-5.00%
-3.00%
-1.00%
1.00%
3.00%
5.00%
1 31 61 91 121 151 181 211 241 271 301
Time
Prim. & MFG TFP
Prim. * MFG Know ledge
Figure 8. Services TFP and Knowledge Growth Rates
-5.00%
-3.00%
-1.00%
1.00%
3.00%
5.00%
1 29 57 85 113 141 169 197 225 253 281
Time
Services TFP
Services Know ledge
The growth rates show a similar pattern to those of the base line though as we noted in table 2 the average growth rate in the primary and manufacturing sector is higher than the
27

base line and the growth of the aggregate and services sector are lower both in terms of technological knowledge and TFP.
Figure 9 plots the log of the final value added output measured by the consumption levels of each of the sectors.
Figure 9. Log of Consumption levels
0
5
10
15
20
25
1 23 45 67 89 111 133 155 177 199 221 243 265 287
Time
Consumption Prim & MFGConsumption Services
The change in parameter values shows a lowering of the time path of consumption for the service sector. However the growth rates of consumption in the two sectors is the same throughout the simulation. This is because the K and V parameters are set to be lower in the services sector for all time periods.
An alternative assumption is to let the difference between the primary and manufacturing sector, and the services sector be introduced at the arrival data of the modern ICT GPT (i.e., period 175 (125)). In this case the set of V and K parameters are set as
and 1, 2,0.5, 0.5x xt tκ κ= = 1, 2,0.5, 0.5x x
t tν ν= = up to period 174 and then to
and 1, 2,0.5, 0.3x xt tκ κ= = 1, 2,0.5, 0.3x x
t tν ν= = from period 175 onward. The justification for this parameter selection is that it generates a consumption pattern for the services sector and the primary and manufacturing sector that mirrors that of the actual Australian data.
The alternative assumption alters both the growth rate and log of consumption level time paths. These are shown in Figures 10 and 11.
28

Figure 10 Growth rates
-25.00%-20.00%-15.00%-10.00%-5.00%0.00%5.00%
10.00%15.00%20.00%
1 26 51 76 101 126 151 176 201 226 251 276 301
Time
Consumption Prim & MFG
Consumption Services
Figure 11. Log of Consumption levels
0
5
10
15
20
25
30
1 22 43 64 85 106 127 148 169 190 211 232 253 274 295
Time
Consumption Prim & MFG
Consumption Services
We call this our simulation 2 and report some interesting comparative statistics from it in relation to the available Australian data and draw some comparisons in the next section.
6. Calibrating the Model to Available Data In this section we calculate TFP change and ICT diffusion rates for the primary and manufacturing sector in Australia which we assume to comprise Agriculture, Forestry and Fishing, Mining, Manufacturing, Electricity, Gas and Water, and Construction. We also calculate TFP change and ICT diffusion rates for the services sector in Australia which we assume to comprise Wholesale and Retail Trade, Accommodation, Cafes and Restaurants, Transportation and Storage, Communication, Finance and Insurance, and Culture and Recreational Services. We use the ABS productivity data available for these industrial sectors of the economy. We calculate share weights based on value added output for each sector and use these to aggregate measures of TFP and ICT diffusion. ICT diffusion is calculated in each case, using a Tornquist index, as the rate of change of contributions to the productive capital stock of computers and software in each industrial sector. Given the limitations of the data we are able to construct a time serries of only 18 annual observations, from 1987 to 2003.
29

Figures 12 and 13 report ICT diffusion rates and TFP change for the primary and manufacturing sector, as well as the services sector in Australia.
Figure12. Growth Rates in Australia's Primary and Manufacturing Sector
-5.00%
0.00%
5.00%
10.00%
15.00%
20.00%
25.00%
30.00%
Jun.1
987
Jun.1
989
Jun.1
991
Jun.1
993
Jun.1
995
Jun.1
997
Jun.1
999
Jun.2
001
Jun.2
003
Time
Prim & MFG TFP
Prim. & MFG ICT Diffusion
Figure 13. Growth Rates in Australia's Services Sector
-10.00%-5.00%0.00%5.00%
10.00%15.00%20.00%25.00%30.00%35.00%40.00%
1 2 3 4 5 6 7 8 9 10 11 12 13 14 15 16 17
Time
Services TFP
Services ICT Diffusion
In both Figure 12 and 13 ICT diffusion rates are higher than TFP change. In the case of the services sector the relationship between ICT diffusion and TFP change is negative.
Table 3 reports the correlation coefficients, statistical significance and average rates of TFP change and ICT diffusion for the primary and manufacturing sector and the services sector in both the Australian data and our simulation 2. In the case of our simulation 2 data we make the calculations for 18 observations starting from period 177 in the simulation run. We choose this period because it follows on the arrival of the GPT and
30

eliminates the spikes that occur in the growth rates due a level jump in the stock of pure knowledge that occurs when the GPT arrives.
Table 3 Time Period
18 annual observations 1987-2003
Correlation Coefficient t-stat
Average TFP Growth
Average Knowledge
Growth SIMULATION (2)
Primary and Manufacturing 2.689395 0.421249 0.0197 0.0207Services -20.6807 -1.20953 0.0055 0.0149
REAL DATA
Primary and Manufacturing 0.028955 0.199305 0.018358 0.207959
Services -0.10927 -2.06356 -0.00344 0.217082
Interestingly, given the limited calibration exercise that we have done and the limitations of the available data, simulation 2 results are similar to the statistics taken from the actual Australian data. In both measures of the relationship between TFP change and ICT diffusion we see a negative correlation and some degree of statistical significance. We also see a lack of significant correlation between TFP change and ICT diffusion in the primary and manufacturing sector. The average growth rates of TFP are also similar between the simulation and the actual data while the knowledge growth rates are clearly dissimilar with the simulation producing knowledge growth rates that are lower than the actual ICT diffusion rates in Australia. However, part of the explanation for the difference in knowledge growth rates is that the simulation includes the growth rate of all knowledge (i.e., from all GPTs currently in use and their applications) while the ICT diffusion rates measure only the contribution to the productive capital stock of computers and software.
Another similarity is observed between simulation 2 and the actual data in terms of the measured indexes of value added output of the two sectors. Figure 14 reports the index of value added output for the primary and manufacturing sector and the services sector in Australia for 29 observations, 1975 to 2003. The divergent pattern between the two sectors bares some similarity to the plot of the log of value added output measured as consumption for the same two simulated sectors in our simulation 2 shown in Figure 13. However, Services appear to catch up to primary and manufacturing value added output towards the end of the time serries where as this does not occur in Figure 13. However, when an index of the value added output is constructed for the simulation data (i.e., with the year 2002 or observation 28 taken as the numeraire), the patterns do look similar. The indexes from the Australian data are shown in Figure 14 and the indexes from the simulation are shown in Figure15.
31

Figure 14. Indexes of Australian Value Added Output
0
0.2
0.4
0.6
0.8
1
1.2
Jun.
1975
Jun.
1977
Jun.
1979
Jun.
1981
Jun.
1983
Jun.
1985
Jun.1
987
Jun.1
989
Jun.1
991
Jun.1
993
Jun.1
995
Jun.1
997
Jun.1
999
Jun.2
001
Jun.2
003
Primary & MFGServices
We can compare the Australian time series of the indexes of value added output for the services sector and the primary and manufacturing sector to similar index derived from the simulation. Figure 15 plots indexes constructed for 29 observations starting from period 177 (127) for the two sectors.
Figure 15. Indexes of Value Added Output
0.000
0.200
0.400
0.600
0.800
1.000
1.200
1 3 5 7 9 11 13 15 17 19 21 23 25 27 29
Time
Prim. & MFGServices
Once again there is a strong similarity between the patterns of output from the simulation and the Actual Australian data. None of these statistical comparisons can be regard as full tests of the model since we are unable to test all of the structural parameters given the data limitations. They are, however, consistent with the predictive patterns of the simulation and indicate the need for further research and data development to enable such testing.
32

They are certainly at odds with the predictions of standard economic growth modelling that predicts that TFP change is contemporaneously, positively correlated with technological change.
7. Summary and Further Research Avenues The research thus far has advanced the frontier of GPT driven endogenous growth by extending the methodology originally developed by Carlaw and Lipsey (2001) and which was refined in a number of subsequent publications. Our extensions allow for several GPTs to exist simultaneously and exhibit varying degrees of complementarity and structural adjustment cost with in the multiple applied R&D final consumption sectors in the system. The aggregate behaviour of the system is not determined by the diffusion pattern of any single GPT. This is of fundamental importance because it means that GPTs cannot be detected by traditional aggregate measures of economic performance.
Furthermore, differential impacts of GPTs such as ICT can now be studied. We have begun this research by examining in a simulation environment and in the Australian data, the differential impact of ICT on the primary and manufacturing sector relative to the services sector. Our calibration exercise thus far has revealed that this line of investigation is potentially a very useful way to understand how ICT is impacting on the Australian economy. We have seen that a calibration that takes account of the differential structural adjustment costs of ICT in the two sectors produces measures that closely match the actual measures in Australia.
Having demonstrated that GPT theory and its application to the Australian data is a potentially very fruitful line of investigation, we must now ask how can this line of research advance further? Three possibilities that can be implemented immediately are: i) Mote Carlo experiments of possible technology shocks and policy interventions, ii) development of better data to test the structural parameters of the theoretical model, and iii) derivation of stylized growth facts (e.g., constant capital – output ratio) for Australia and testing of whether these are matched by the simulation model.
Monte Carlo experiments will allow for the exploration of a number of counterfactuals that can help guide policy judgements. One such counterfactual that is of importance to the current research is to ask what the productivity impact would have been if ICT had not entered into the Australian economy. Others experiments that can be contemplated with the current theory include the forecasting of the productivity impact of emerging Biotechnology and Nanotechnology. Still other possibilities opened up by the advancement of the theory, are experiments to test the impact of policy interventions in Australia.
The development of data that measures structural adjustment costs and complementarities among technologies will allow for better calibration and testing of the current theory. Data that measures production activities designed to apply general purpose technologies could enable direct parameter estimation of the applied R&D sector. Data on public and private expenditures on inputs and outputs that are designed to develop Australia’s absorptive capacity would allow for direct parameter estimation of the pure knowledge sectors in the current theory. The consumption sectors could be estimated directly using
33

currently available data on value added output. However, in the absence of the other data this would enable only partial testing of the model.
Currently available data can be used to establish a set of stylized growth facts of the sort reported in Jones (1998). The model can then be examined in relation to these growth facts to determine if it is consistent with them. Lipsey, Carlaw and Bekar (2005) report some of these test for consistency in their chapter 14. But these could be refined specifically for the Australian data.
There are of course many other lines of research that can follow on from the development of the theoretical frontier. The on going agenda to introduce more of the micro behaviour modelled in evolution theory into a macro growth framework is an example of such research. However, these are lines of research that will require many years of research and theoretical development. As such they fall outside the scope of the current paper.
34

References
Aghion, P. and P. Howitt (1998), “On the Macroeconomic Effects of Major Technological Change”, in E. Helpman (ed), General Purpose Technologies and Economic Growth, (Cambridge: MIT Press), 121-144.
Bresnahan, Timothy F., Manuel Trajtenberg (1992), “General Purpose Technologies: engines of growth?” NBER working paper, 4148.
Carlaw, K. I. and R.G. Lipsey (2006 forthcoming) “GPT-Driven, Endogenous Growth”, forthcoming in The Economic Journal.
Carlaw, K. I. “ICT in Australian Economics Performance: An Investigation of the Assumptions Influencing Productivity Estimates”, presented to the Asia Pacific Productivity Conference, Brisbane, Australia, July 14-16, 2004.
Carlaw, K.I. and R. G. Lipsey (2003) “Productivity, Technology and Economic Growth: What is the relationship?” Journal of Economic Surveys, 17(3), 457-495.
Carlaw, K. I. and R.G. Lipsey (2002) “Externalities, complementarities and Sustained Economic Growth”, Research Policy, 31(8-9), 1305-1315.
David. P. (1990) “The Dynamo and the Computer: An Historical Perspective on the Modern Productivity Paradox” American Economic Review, 80(2), 355-61.
David, P. and G. Wright (1999) “General Purpose Technologies and Surges in Productivity: Historical Reflections on the Future of the ICT Revolution”, University of Oxford Discussion papers in Economic and Social History, Number 31.
Freeman, Christopher and Perez, Carlota (1988), “Structural Crises of Adjustment: Business Cycles and Investment Behaviour”, in Dosi et al. (1988), 38–66.
Grossman, Gene M. and Elhanan Helpman (1991), Innovation and Growth in the Global Economy, (Cambridge Mass: MIT Press).
35

Helpman, E. and M. Trajtenberg (1998a), “A Time to Sow and a Time to Reap” in E. Helpman (ed), General Purpose Technologies and Economic Growth, (Cambridge: MIT Press), 55-84.
Helpman, E. and M. Trajtenberg (1998b), Diffusion of General Purpose Technologies, in E. Helpman (ed), General Purpose Technologies and Economic Growth, (Cambridge: MIT Press), 85-119.
Howitt, P. (1998) “Measurement, Obsolescence, and General Purpose Technologies”, in E. Helpman ed. (1998) General Purpose Technologies and Economic Growth, MIT Press: Massachusetts, 219 – 251.
Hulten, C. R. (1992). “Growth Accounting when Technological Change is Embodied in Capital,” American Economic Review, 82(4), 964-980.
Hulten, C. R. (2000) ‘Total Factor Productivity: A Short Biography,’ NBER Working Paper, 7471, (Washington: National Bureau of Economic Research).
Jones, C. I. (1998) Introduction to Economic Growth, (New York: W.W. Norton and Company)
Jorgenson, D.W. (1966). “The Embodiment Hypothesis,” Journal of Political Economy, 74(1), 1-17.
Jorgensen, D. and Z. Griliches (1967) ‘The Explanation of Productivity Change,’ Review of Economic Studies, 34, 249-83.
Lipsey, Richard G., Kenneth I. Carlaw and Cliff Bekar (2005 forthcoming) Economic Transformations: General Purpose Technologies and Long-run Economic Growth (Oxford University Press: Oxford, UK)
Lipsey, R. G. and K. I. Carlaw (2004) “Total Factor Productivity and the Measurement of Technological Change”, Canadian Journal of Economics 37(4), 1118-50.
Mokyr, Joel (1990), The Lever of Riches: Technological Creativity and Economic Progress, (New York: Oxford University Press).
36

Nelson, R. R. (1964) ‘Aggregate Production Function and Medium-Range Growth Projections,’ American Economic Review, 54, 575-606.
Rymes, Thomas K., (1971) On Concepts of Capital and Technical Change, (Cambridge: Cambridge University Press).
37