Embed Size (px)
Citation preview
i
For official use only
AN EVALUATION STUDY
OF
COMMUNITY FISH PONDS
PROGRAMME
IN
HIMACHAL PRADESH
Planning Department,
Himachal Pradesh.
ii
FOREWORD
Fisheries sector occupies a very important place in the socio-
economic development. It has been recognized as a powerful income and
employment generator as it stimulates growth of number of subsidiary
industries and is a source of cheap and nutritious food besides being a
foreign exchange earner. Most importantly, it is the source of livelihood
for a large section of economically weaker/ backward population. For the
promotion of this sector, various government schemes are operational. One
of the programme is for Scheduled Castes population, which is funded
under Scheduled Castes Sub Plan.
Rural Planning Committee of 10th
Vidhan Sabha (2005-06) in
its 27th
report under item 3 and 4 had recommended to check the
construction quality of fish ponds constructed during the 3 years period of
the year 2002-03 to 2004-05 under Scheduled Castes Sub Plan and fix
responsibility of defaulting individuals/ agencies for poor construction
quality.
The task of conducting an evaluation study of Community Fish
Ponds Programme in Himachal Pradesh was thus entrusted to Planning
Department. The evaluation division of this department conducted the
study. The field work was done with the help of District Planning Cells.
The findings of the study show that all is not well with the
implementation of the programme. The study, beside outlining the
deliverance of the scheme, has also brought into focus some critical issues
of concern. The findings of the study ware conveyed to Fisheries
department and they were requested to take corrective measures. The
follow up action by Fisheries department is outlined in Addendum.

iii
Help rendered by Fisheries department officials who co-ordinated with
panchayat functionaries and local public is duly acknowledged. The officers and
officials of the Planning Department, who were associated with the study, deserve
kudos for toiling hard in bringing out the study in the present form.

iv
PREFACE
The community tanks have the potential for increasing fish production
through community participating fish culture. These tanks are generally not used
for fish production due to inadequate financial and technical resources. With
government intervention and community participation, some of them are now
being used for fish culture. Recognizing the potential of increasing fish production
through the development of community tanks, the State department of Fisheries is
running Community Fish Pond Programme under Scheduled Castes Sub Plan for
Scheduled Castes families through Fish Farmers Development Agency. The
Community Fish Culture Programme has played a significant role in improving
the socio-economic status of the weaker sections of the society.
The main objectives of evaluation study of this programme were to
make an assessment of the construction quality of ponds in terms of functionality
or non-functionality, role of individuals/agencies for poor construction quality,
economics of ponds, public perception about the genuineness of fish ponds and to
suggest the corrective measures for effective implementation of the programme.
The findings of the study shows that out of 32 ponds, 18 ponds were
functional at the time of survey. Non-functionality of tanks is due to lack of water
supply and also due to leakage of tanks. The study reveals that average cost of
production per pond is Rs. 10183 per annum. The average annual outturn per pond
is 510 Kg and net revenue is Rs. 9197 per annum. The cost of majority of surveyed
tanks (27) was found to be less than Rs.1.5 lacs per pond.
The results of this study are expected to be useful for future planning
and implementation of this programme. I acknowledge my thanks to the officers
and officials associated with the study.

v
CONTENTS
PART–I CHAPTERS
Chapter Subject Page No.
I Introduction 1-2
II Objectives 3
III Methodology 4-6
IV Analysis and Results 7-16
V Summary of Findings 17-18
VI Schedules 19-23
VII Addendum
Follow up Action by Fisheries Department 24
PART-II-TABLES
Table No. Title Page No. (Chapter-III)
1. Districtwise breakup of community fish ponds 4
2. Areawise distribution of sampled fish ponds 6
3. Year of construction of sampled fish ponds 6
( Chapter-IV)
1 Type of construction of fish ponds. 7
2 Source of water supply to fish ponds. 8
3 Districtwise status of fish ponds . 9
4 Maintenance of fish ponds. 10
5 Source/ Agency for procurement of fish seed 11
6 Average cost of production/ pond. 12
7 Annual return profile/pond. 13
8 Reasons for non-functionality of ponds 14
9. Cost and subsidy profile of ponds. 15
10. Districtwise public participation about non
functionality of ponds. 16

1
CHAPTER-I
INTRODUCTION
Himachal Pradesh has the privilege of having vast network of
fisheries resources in the form of snow fed perennial rivers and streams
besides man-made reservoirs, other impoundments, viz. lakes, soil water
conservation in the form of check dams, kuhls and village pond etc. While
these resources are means of rich proteins food in the form of fish, it also
provides source of earning livelihood to thousands of people. Despite having
tremendous potential of raising the state's fish production, aquaculture could
not make any discernible impact in the state in earlier years in view of
inadequate availability of quality seed and lack of technical know-how which
could benefit the state's complex topography. The running water scheme
initiated in the state has provided an adequate answer to many of the
problems of pond fish culturists. In view of plenty of water flowing in the
form of streams, kuhls vis-a-vis availability of mirror carps and trout seed in
the state, the scheme of running water fish culture is getting popular among
the fish farmers of the state. The pond culture is also getting big impetus in
view of availability of fish seed, initiation of several extension and training
schemes.
Fish Farmers Development Agencies (FFDAs) which were set
up in the state are rendering technical and financial assistance to the farmers
for excavating ponds and improving the existing water area. These agencies

2
have introduced the fish culture in the state by utilizing the waste land and
unused water area. These agencies have been established in the state with the
following functions:
1. Renovation/ reclamation of ponds and tanks.
2. Construction of new ponds.
3. Production of running water fish culture in the state.
4. Imparting training to the farmers for fish farming and also the
dissemination of silviculture technologies.
5. Production of integrated fish farming with piggery, poultry
ducking etc.
6. Assistance for the establishment of fish mills in the state to the
farmers.
7. Establishment of fish farmers training centres.

3
CHAPTER-II
OBJECTIVES
Rural Planning Committee of 10th Vidhan Sabha (2005-06) in its
27th report under item 3 and 4 has recommended to check the construction
quality of community fish ponds constructed during the year 2002-03 to
2004-05 under Scheduled Castes Sub Plan for Scheduled Castes and to fix
the responsibility of defaulting individuals / agencies for poor construction
quality.
Keeping this in view, the evaluation of community fish ponds
has been conducted with the following main objectives:-
1. To study the construction quality of community fish ponds.
2. To study the functional and non functional community fish ponds and
the reasons for non functional community fish ponds.
3. To study the economics of community fish ponds.
4. To study the role of individuals / agencies for poor construction quality
of community fish ponds.
5. To know the public perception about the community fish ponds.
6. To suggest the corrective measures for more effective implementation
of the programme.

4
CHAPTER-III
METHODOLOGY
The department of Fisheries supplied a list of all the community
fish ponds constructed during the year 2002-03 to 2004-05 under Scheduled
Castes Sub Plan for Scheduled Castes. The district wise breakup of
community fish ponds constructed is as under:-
Table-1
District wise breakup of community fish ponds
Name of the Districts No of Blocks No of Panchayats No. of Fish Ponds
BILASPUR 2 3 3
CHAMBA 2 3 3
HAMIRPUR 2 2 2
KANGRA 5 7 7
KULLU 1 1 1
MANDI 3 4 4
SIRMOUR 1 3 3
SHIMLA 2 3 3
SOLAN 2 3 3
UNA 3 3 3
Total 23 32 32
These 32 ponds were constructed in ten districts of the state
during the year 2002-03 to 2004-05. Keeping in view the total number of
ponds and the seriousness of evaluation, it was decided to select all these 32
ponds as sampled ponds to conduct the study.
5
A schedule for data collection was designed covering all aspects
which are as under :-
Section-I deals with general features, viz. identification of pond, quality
and area of pond, year/ cost of construction, source of water
supply, status of pond etc.
Section-II includes economics of fish ponds, viz. maintenance of ponds,
procurement / variety of seed, cost of production and return
profile.
Section-III deals with the reasons of non-functionality of ponds.
Section-IV deals with the construction quality of Fish Ponds, viz. cost of
construction, amount of subsidy, detail of work, present status of
pond and the agency responsible for construction/ technical
guidance etc.
Section-V includes public perception about fish ponds.
The District Planning Cells of the department did the data
collection in all the ten districts of the state. The officials of District Planning
Cells visited the pond sites, interviewed the fish farmers and also contacted
the local panchayat representatives and officials concerned to ascertain the
information.
Area wise distribution and construction year of sampled
fish ponds are as follow :-
6
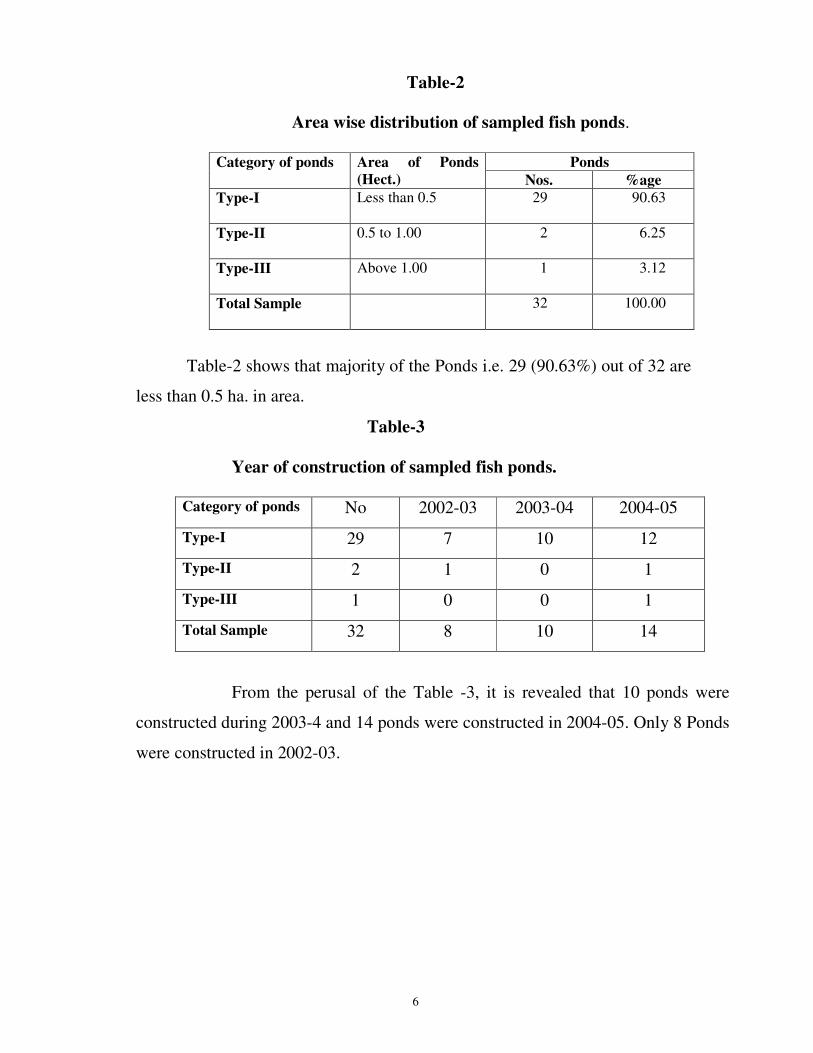
Table-2
Area wise distribution of sampled fish ponds.
Ponds Category of ponds Area of Ponds
(Hect.) Nos. %age
Type-I Less than 0.5 29 90.63
Type-II 0.5 to 1.00 2 6.25
Type-III Above 1.00 1 3.12
Total Sample 32 100.00
Table-2 shows that majority of the Ponds i.e. 29 (90.63%) out of 32 are
less than 0.5 ha. in area.
Table-3
Year of construction of sampled fish ponds.
Category of ponds No 2002-03 2003-04 2004-05
Type-I 29 7 10 12
Type-II 2 1 0 1
Type-III 1 0 0 1
Total Sample 32 8 10 14
From the perusal of the Table -3, it is revealed that 10 ponds were
constructed during 2003-4 and 14 ponds were constructed in 2004-05. Only 8 Ponds
were constructed in 2002-03.
7
CHAPTER-IV
ANALYSIS AND RESULTS
After data collection of all 32 fish ponds, it was compiled and
tabulated. Analysis of result was done as per the objectives of the study. The
results of the evaluation survey are discussed as under:-
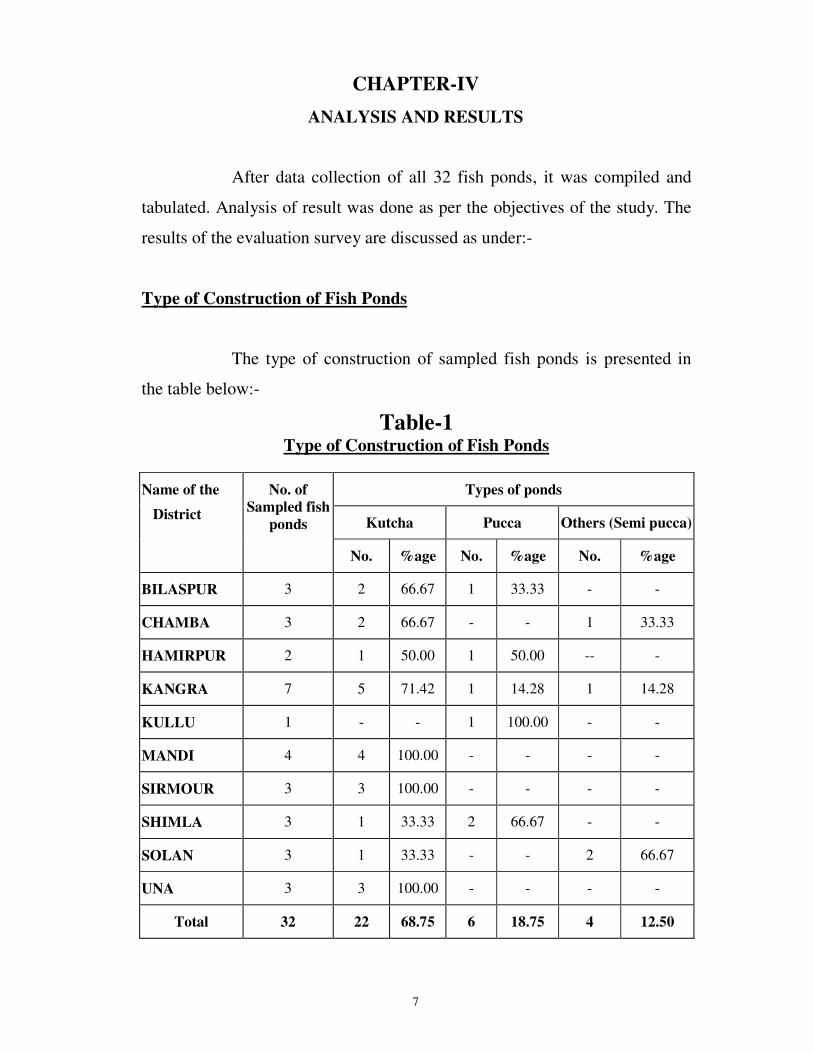
Type of Construction of Fish Ponds
The type of construction of sampled fish ponds is presented in
the table below:-
Table-1 Type of Construction of Fish Ponds
Types of ponds
Kutcha Pucca Others (Semi pucca)
Name of the
District
No. of
Sampled fish
ponds
No. %age No. %age No. %age
BILASPUR 3 2 66.67 1 33.33 - -
CHAMBA 3 2 66.67 - - 1 33.33
HAMIRPUR 2 1 50.00 1 50.00 -- -
KANGRA 7 5 71.42 1 14.28 1 14.28
KULLU 1 - - 1 100.00 - -
MANDI 4 4 100.00 - - - -
SIRMOUR 3 3 100.00 - - - -
SHIMLA 3 1 33.33 2 66.67 - -
SOLAN 3 1 33.33 - - 2 66.67
UNA 3 3 100.00 - - - -
Total 32 22 68.75 6 18.75 4 12.50
8
From the table, it has been observed that type of construction of
all ponds in Mandi, Sirmour and Una districts are kutcha(excavated) in
nature. Kangra district is having 5 kutcha ponds out of total 7 ponds. Bilaspur
and Chamba district each is having 2 kutcha Ponds. Shimla district is having
2 pucca ponds out of total 3 ponds. The 4 semi pucca ponds have also been
found constructed in Chamba, Kangra and Solan district. It may be concluded
that majority of ponds i.e. 22 (68.75%) out of 32 are kutcha ponds, 6
(18.75%) are pucca ponds and 4 (12.50%) ponds are semi pucca.
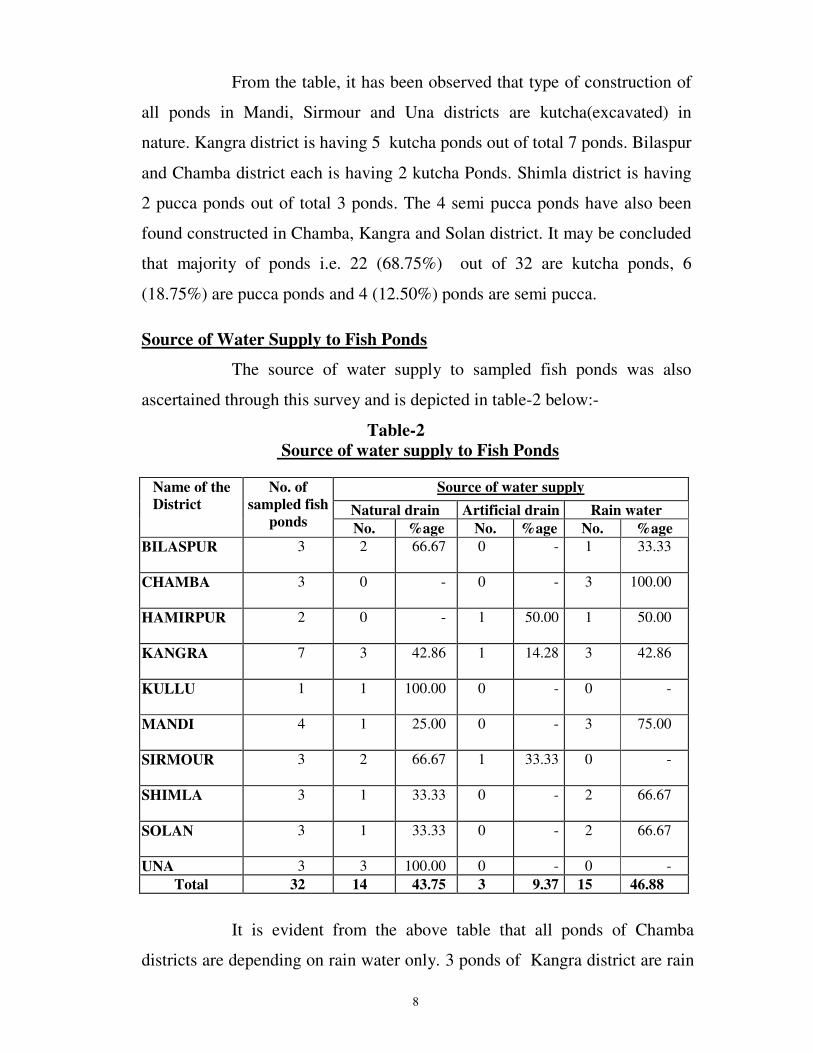
Source of Water Supply to Fish Ponds
The source of water supply to sampled fish ponds was also
ascertained through this survey and is depicted in table-2 below:-
Table-2
Source of water supply to Fish Ponds
Source of water supply
Natural drain Artificial drain Rain water
Name of the
District
No. of
sampled fish
ponds No. %age No. %age No. %age
BILASPUR 3 2 66.67 0
- 1 33.33
CHAMBA 3 0 - 0 - 3
100.00
HAMIRPUR 2 0
- 1 50.00 1
50.00
KANGRA 7 3
42.86 1 14.28 3 42.86
KULLU 1 1
100.00 0 - 0 -
MANDI 4 1 25.00 0
- 3 75.00
SIRMOUR 3 2
66.67 1 33.33 0
-
SHIMLA 3 1
33.33 0 - 2
66.67
SOLAN 3
1 33.33 0
- 2
66.67
UNA 3 3 100.00 0 - 0 -
Total 32 14 43.75 3 9.37 15 46.88
It is evident from the above table that all ponds of Chamba
districts are depending on rain water only. 3 ponds of Kangra district are rain
9
water based while 3 are having natural drain. All the ponds of Una and Kullu
and 2 ponds each in Bilaspur and Sirmour district are having natural drain.
One pond each in Hamirpur, Kangra and Sirmour districts is having artificial
drain. It may be concluded that majority of ponds i.e. 15 (46.88%) out of 32
are rain water based, 14 (43.75%) are having natural drain and only 3 (9.37%)
are based on artificial rain.
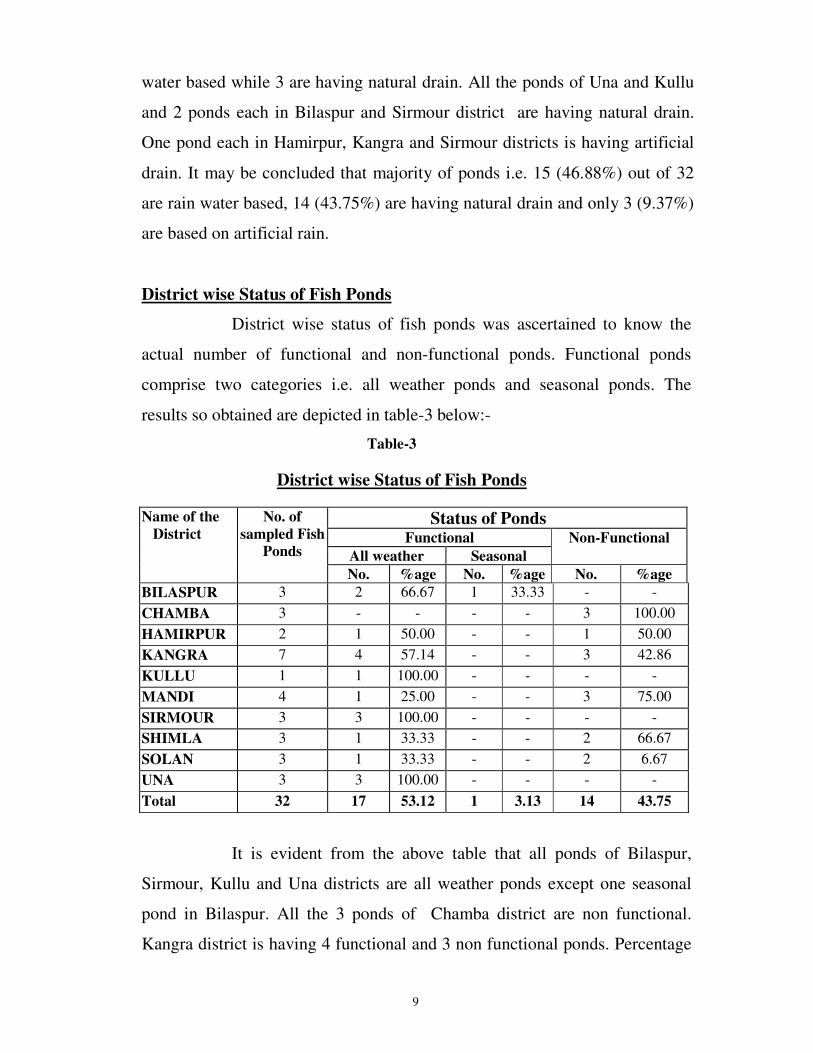
District wise Status of Fish Ponds
District wise status of fish ponds was ascertained to know the
actual number of functional and non-functional ponds. Functional ponds
comprise two categories i.e. all weather ponds and seasonal ponds. The
results so obtained are depicted in table-3 below:-
Table-3
District wise Status of Fish Ponds
Status of Ponds Functional
All weather Seasonal
Non-Functional
Name of the
District
No. of
sampled Fish
Ponds
No. %age No. %age No. %age
BILASPUR 3 2 66.67 1 33.33 - -
CHAMBA 3 - - - - 3 100.00
HAMIRPUR 2 1 50.00 - - 1 50.00
KANGRA 7 4 57.14 - - 3 42.86
KULLU 1 1 100.00 - - - -
MANDI 4 1 25.00 - - 3 75.00
SIRMOUR 3 3 100.00 - - - -
SHIMLA 3 1 33.33 - - 2 66.67
SOLAN 3 1 33.33 - - 2 6.67
UNA 3 3 100.00 - - - -
Total 32 17 53.12 1 3.13 14 43.75
It is evident from the above table that all ponds of Bilaspur,
Sirmour, Kullu and Una districts are all weather ponds except one seasonal
pond in Bilaspur. All the 3 ponds of Chamba district are non functional.
Kangra district is having 4 functional and 3 non functional ponds. Percentage

10
of non functional ponds is on higher side in Mandi (75.00%), Shimla
(66.67%) and Solan (66.67%) districts. It may be concluded that majority of
ponds i.e. 18 (56.25%) out of 32 are functional while 14 (43.75%) ponds are
non functional.
Maintenance of Fish Ponds
District wise maintenance status of fish ponds was ascertained to
know the actual number of ponds maintained by Panchayat itself or through
individual on lease basis. The results so obtained are depicted in the table-4 as
follows :-
Table-4
Maintenance of Fish Ponds
Maintenance of Fish Ponds
By Panchayat By Panchayat through
Individual on lease basis
Name of the
District
No. of
sampled Fish
Ponds
No. %age No. %age
BILASPUR 3 - - 3 100.00
CHAMBA 3 3 100.00 - -
HAMIRPUR 2 1 50.00 1 50.00
KANGRA 7 5 71.43 2 28.57
KULLU 1 - - 1 100.00
MANDI 4 2 50.00 2 50.00
SIRMOUR 3 - - 3 100.00
SHIMLA 3 2. 66.67 1 33.33
SOLAN 3 3 100.00 - -
UNA 3 1 33.33 2 66.67
Total 32 17 53.12 15 46.88

11
It is clear from the above table-4, that all ponds in Chamba and
Solan districts are maintained by Panchayat itself while all the ponds in
Bilaspur, Kullu and Sirmour districts are maintained by Panchayat through
individual on lease basis. In all, 17 (53.12%) ponds are maintained by
Panchayat itself and 15 (46.88%) ponds are maintained by Panchayat through
individual on lease basis.
Source/Agency for procurement of Fish Seed
Source/agency for procurement of fish seed i.e. government
source, private source or self produced source was obtained through this
survey and is depicted in the table-5 as follows :-
Table-5
Source/Agency for procurement of Fish Seed
Govt.
Source
Private Source Name of the
District
No. of Functional
Fish Ponds
No. %age No. %age
BILASPUR 3 3 100.00 - -
CHAMBA - - - - -
HAMIRPUR 1 1 100.00 - -
KANGRA 4 3 75.00 1 25.00
KULLU 1 1 100.00 - -
MANDI 1 1 100.00 - -
SIRMOUR 3 - - 3 100.00
SHIMLA 1 1 100.00 - -
SOLAN 1 - - 1 100.00
UNA 3 2 66.67 1 33.33
Total 18 12 66.67 6 33.33

12
From the above table-5, it is seen that procurement of fish seed
for all functional ponds of Bilaspur, Hamirpur, Kullu, Mandi and Shimla
districts has been done from government source only. Procurement of fish
seed for all the ponds of Sirmour district and one pond each of Kangra, Solan
and Una has been done from private source. It may be concluded that
procurement of fish seed for majority of Ponds i.e. 12 (66.67%) out of 18 has
been done from government source and for remaining 6 (33.33%) ponds from
private source.
Average Cost of production / pond
The study is based on three categories of ponds i.e. Size less than
0.5 hect., between 0.5 to 1.00 hect. and above 1.00 hect. Since majority of
sampled fish ponds i.e. 29(90.63%) out of 32 ponds, fall in the size less than
0.5 hect. category, therefore it was decided to work out simple averages for
all the 32 ponds.
In the study, the analysis of Average cost of production / pond
which includes seed cost, feed cost, mannuring cost, labour cost, other
operational cost etc. was also conducted and is depicted in the table-6
below:-
Table-6
Average Cost of production / pond
Cost of production in (Rs.)
Seed cost 2098
Feed cost 4385
Manuring cost 1200
Labour cost 2250
Other operational cost 250
Total average cost 10183

13
It is evident from the above table-6, that seed cost, feed cost,
manuring cost, labour cost, other operational cost per pond is Rs. 2098, 4385,
1200, 2250 and 250 respectively. Total Average Cost of Production per pond
is Rs. 10183.
Return Profile/ Pond
Average Annual Out Turn (kg), Total Out Turn (Rs.) and Net
Revenue (Rs.) was also obtained through this survey and is depicted in the
table-7 below:-
Table-7
Annual Return Profile/ Pond
Return Profile
Average annual out turn (kg) 510
Average price of fish (Rs./kg) 38
Total out turn (Rs.) 19380
Total average cost (Rs.) 10183
Net Revenue (Rs.) 9197
It is evident from the above table-7 that Average Annual Out
Turn is 510 kg and Average Price of fish is Rs. 38/kg. Total Out Turn is Rs.
19380 which has been calculated by multiplying the Average Annual Out
Turn with Average Price of fish. Net Revenue is Rs.9197 which has been
calculated by deducting the total Average Cost from Total Out Turn. This
shows that community fish pond venture is profitable and it has helped local
farmers in additional income generation.

14
Reasons for Non-functionality of Ponds
District wise reasons for non-functionality of ponds which
include mainly non-availability/ lack of water supply in pond, damage due to
rain / flood, leakage of water etc. were also analysed through this survey and
the same are depicted in the table-8 below:-
Table-8
Reasons for Non-functionality of Ponds
Reasons for Non-functionality of Ponds
Nam
e of
Dis
tric
ts
Dis
tric
t W
ise
Non
fun
ctio
nal
Pon
ds
i)
Non
-avail
ab
ilit
y/
lack
of
w
ate
r
sup
ply
in
pon
d
ii)
Sali
nit
y o
f w
ate
r
iii)
Dam
age
du
e to
rain
/flo
od
iv)
L
eak
age
of
wate
r
v)
Sil
tati
on
vi)
P
rese
nce
of
Dok
a
fish
vii
)Fau
lt i
n d
esig
n o
f
pon
d
vii
i)N
on
-avail
ab
ilit
y
of
qu
ali
ty
se
ed
ix)
Lack
of
prop
er
train
ing
x)L
ack
of
resp
on
sib
ilit
y
xi)
Mark
etin
g
prob
lem
xii
)No
n c
o-
op
erati
on
fr
om
D
epart
men
t
xii
i) C
on
sid
ered
to
av
ail
su
bsi
dy u
nd
er
the
sch
em
e.
xiv
) O
ther
(
Sp
ecif
y)
Inco
mp
lete
/ S
eed
not
intr
od
uce
d
BILASPUR -
- - - - - - - - - - - - - -
CHAMBA
3
- - - 2 - - - - - - - - - 1
HAMIRPUR 1 - - - 1 - - - - - - - - - -
KANGRA 3
3 - - 1 - - - - - - - - - -
KULLU
- - - - - - - - - - - - - - -
MANDI
3
1 - - - - - - - - - - - - 2
SIRMOUR - - - - - - - - - - - - - - -
SHIMLA
2
1 - 2 1 - - - - 1 1 - - - -
Solan 2
2 - - 2 - - - - - - - - - -
UNA
- - - - - - - - - - - - - - -
Total 14 7 0 2 7 0 0 0 0 1 1 0 0 0 3
It has been observed from the above table-8, that 7 out of 14 (50%)
ponds are non-functional due to non-availability/ lack of water supply in ponds,
beside other reasons, as some ponds are having more than one reason for
failure. In may also be seen that some number of ponds, i.e. 7 (50%) are
perceived to be non functional due to leakage of water. Two ponds have been
damaged due to rain / flood and also due to lack of proper training/ lack of

15
responsibility. Three ponds are non-functional due to other reasons like non-
completion/ non introduction of fish seed.
Cost and Subsidy Profile of Ponds
Cost and subsidy profile of ponds was obtained through this
survey and is depicted in the table-9 below:-
TABLE-9
Cost And Subsidy Profile of Ponds
Cost of Construction (Rs.) Amount of Subsidy (Rs.) Name of the
District
No. of
sampled
fish
ponds
Less
than 1
lacs
1 and less
than
1.5 lacs
1.5- 2
lacs
Less than
1 lacs
1 and less
than
1.5 lacs
1.5- 2 lacs
BILASPUR 3 1 2 - 1 2 -
CHAMBA 3 1 2 - 1 2 -
HAMIRPUR 2 1 1 - 1 1 -
KANGRA 7 4 2 1 4 2 1
KULLU 1 1 - - 1 - -
MANDI 4 - 4 - - 4 -
SIRMOUR 3 1 1 1 1 1 1
SHIMLA 3 1 1 1 1 1 1
SOLAN 3 - 2 1 - 2 1
UNA 3 1 1 1 1 1 1
Total 32
(100)
11
(34)
16
(50)
5
(16) 11 16 5
Note : Figure in parenthesis are percentages to total.
It is clear from the above table-9, that amount of subsidy is equal
to the cost of construction. Cost of construction has been classified into three
categories i.e. less than Rs. 1 lacs, Rs. 1 lacs and less than Rs. 1.5 lacs and Rs.
1.5-2 lacs and number of ponds constructed under these three categories are
11(34%), 16 (50%) and 5 (16%) respectively. Thus, cost of construction of 27
ponds is less than Rs. 1.5 lacs per pond.
16
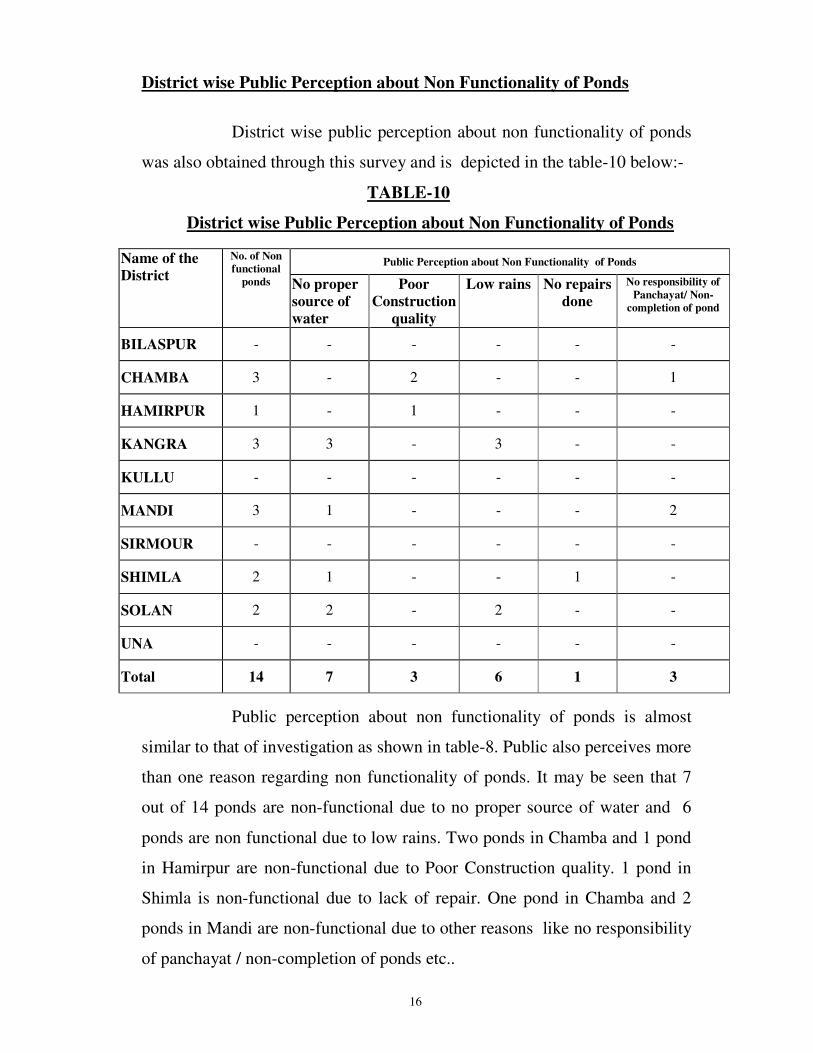
District wise Public Perception about Non Functionality of Ponds
District wise public perception about non functionality of ponds
was also obtained through this survey and is depicted in the table-10 below:-
TABLE-10
District wise Public Perception about Non Functionality of Ponds
Public Perception about Non Functionality of Ponds Name of the
District
No. of Non
functional
ponds No proper
source of
water
Poor
Construction
quality
Low rains No repairs
done
No responsibility of
Panchayat/ Non-
completion of pond
BILASPUR - - - - - -
CHAMBA 3 - 2 - - 1
HAMIRPUR 1 - 1 - - -
KANGRA 3 3 - 3 - -
KULLU - - - - - -
MANDI 3 1 - - - 2
SIRMOUR - - - - - -
SHIMLA 2 1 - - 1 -
SOLAN 2 2 - 2 - -
UNA - - - - - -
Total 14 7 3 6 1 3
Public perception about non functionality of ponds is almost
similar to that of investigation as shown in table-8. Public also perceives more
than one reason regarding non functionality of ponds. It may be seen that 7
out of 14 ponds are non-functional due to no proper source of water and 6
ponds are non functional due to low rains. Two ponds in Chamba and 1 pond
in Hamirpur are non-functional due to Poor Construction quality. 1 pond in
Shimla is non-functional due to lack of repair. One pond in Chamba and 2
ponds in Mandi are non-functional due to other reasons like no responsibility
of panchayat / non-completion of ponds etc..
17
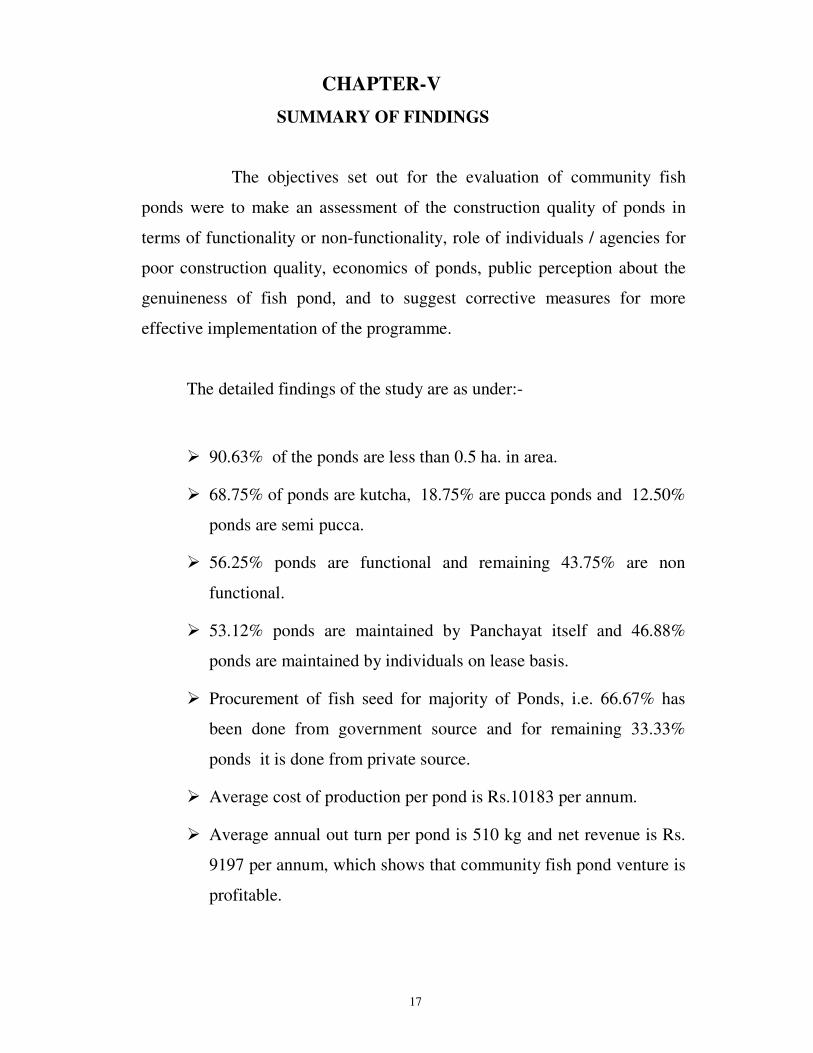
CHAPTER-V
SUMMARY OF FINDINGS
The objectives set out for the evaluation of community fish
ponds were to make an assessment of the construction quality of ponds in
terms of functionality or non-functionality, role of individuals / agencies for
poor construction quality, economics of ponds, public perception about the
genuineness of fish pond, and to suggest corrective measures for more
effective implementation of the programme.
The detailed findings of the study are as under:-
� 90.63% of the ponds are less than 0.5 ha. in area.
� 68.75% of ponds are kutcha, 18.75% are pucca ponds and 12.50%
ponds are semi pucca.
� 56.25% ponds are functional and remaining 43.75% are non
functional.
� 53.12% ponds are maintained by Panchayat itself and 46.88%
ponds are maintained by individuals on lease basis.
� Procurement of fish seed for majority of Ponds, i.e. 66.67% has
been done from government source and for remaining 33.33%
ponds it is done from private source.
� Average cost of production per pond is Rs.10183 per annum.
� Average annual out turn per pond is 510 kg and net revenue is Rs.
9197 per annum, which shows that community fish pond venture is
profitable.

18
� 50% 0f the ponds are non-functional due to non-availability/ lack
of water supply in ponds. Similarly 50% ponds are not functioning
due to leakage of water, beside some other reasons.
� 50% of total sampled ponds cost between Rs. 1 lac and less than
Rs. 1.5 lacs whereas 34% are in the category of less than Rs. 1 lac
and 16% falls in the category of Rs. 1.5 lacs and Rs. 2 lacs. .

19
QUICK EVALUATION STUDY ON COMMUNITY PONDS FOR FISH
PRODUCTION IN HIMACHAL PRADESH
Section-I
General Features
1. Name of the District __________________________________
2. Name of the Block __________________________________
3 Name of the Panchayat __________________________________
4. Name of fish pond
__________________________________
__________________________________
5. Quality of pond
a) Kutcha __________________________________
b) Pucca __________________________________
c) Other (Specify) __________________________________
6. Area of pond (in Hect.) _________________________________
7. Year of construction/Renovation _________________________________
8. Source of water supply
a) Natural drain ___________________________________
b) Artificial drain ___________________________________
c) Rain water ___________________________________
d) Other (Specify) ___________________________________
9. Cost of construction of pond
Total Cost _________________________________
a) Labour Cost _________________________________
b) Capital cost _________________________________
10. Status of pond
a) Functional _________________________________
b) Non-functional _________________________________
11. Whether the pond is seasonal/all weather _________________________________

20
Section-II
Economics of Fish Pond
1. If functional, who maintains the pond
(i) Individual
(ii) Panchayat
(iii) Agency /individual to whom the pond is leased.
(Name of the agency/Individual)
i) Other (specify)
2. Agency from where the seed is procured
(i) Govt. Source.
(ii) Private Source.
(iii)Self Produced
(iv) Other (specify)
3. Variety of seed /seeds
i)
ii)
iii)
iv)
4. Cost of Production
i) Seed cost ____________
ii) Feed cost ____________
iii) Mannuring ____________
iv) Labour Cost ____________
v) Other operational cost ____________
5. Return Profile
(i.) Annual out turn of fish catch (Year-wise)
(ii) Price of fish (Rs.per Kg.)
(iii) Total outturns (in Rs.) (Col. 13 + 14)
(iv) Net revenue (year-wise)
(v) If leased, the Annual lease money received.
21
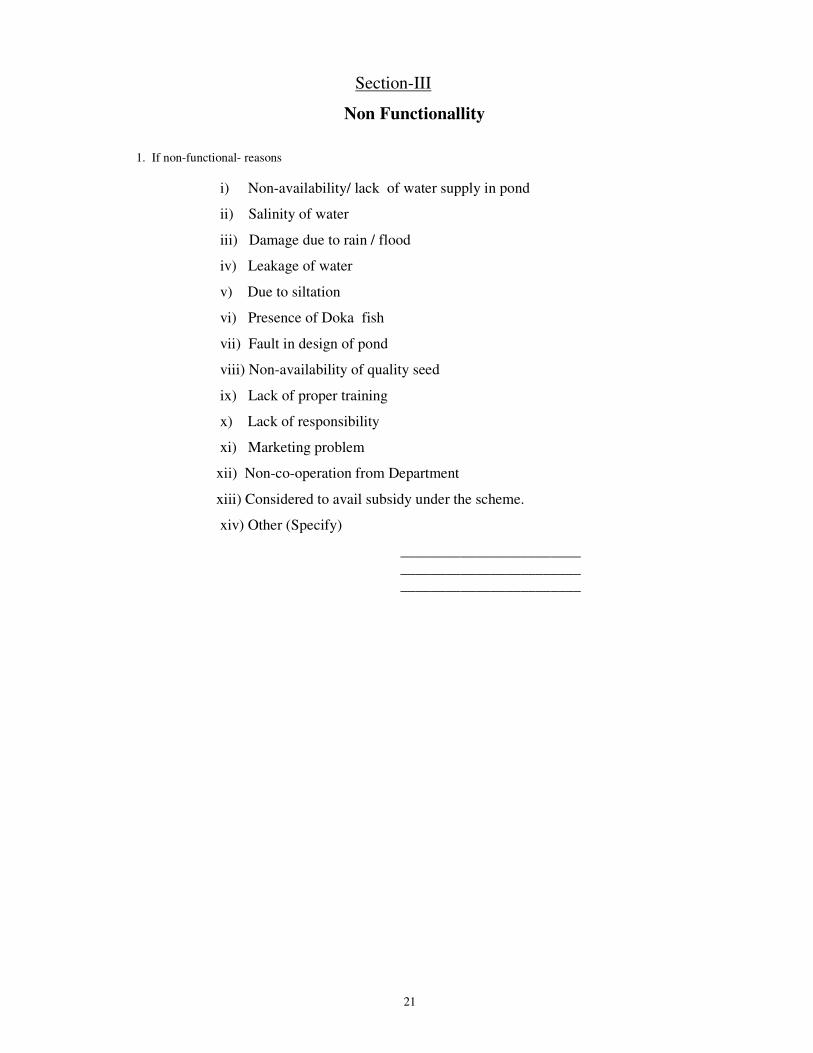
Section-III
Non Functionallity
1. If non-functional- reasons
i) Non-availability/ lack of water supply in pond
ii) Salinity of water
iii) Damage due to rain / flood
iv) Leakage of water
v) Due to siltation
vi) Presence of Doka fish
vii) Fault in design of pond
viii) Non-availability of quality seed
ix) Lack of proper training
x) Lack of responsibility
xi) Marketing problem
xii) Non-co-operation from Department
xiii) Considered to avail subsidy under the scheme.
xiv) Other (Specify)
________________________
________________________
________________________
22
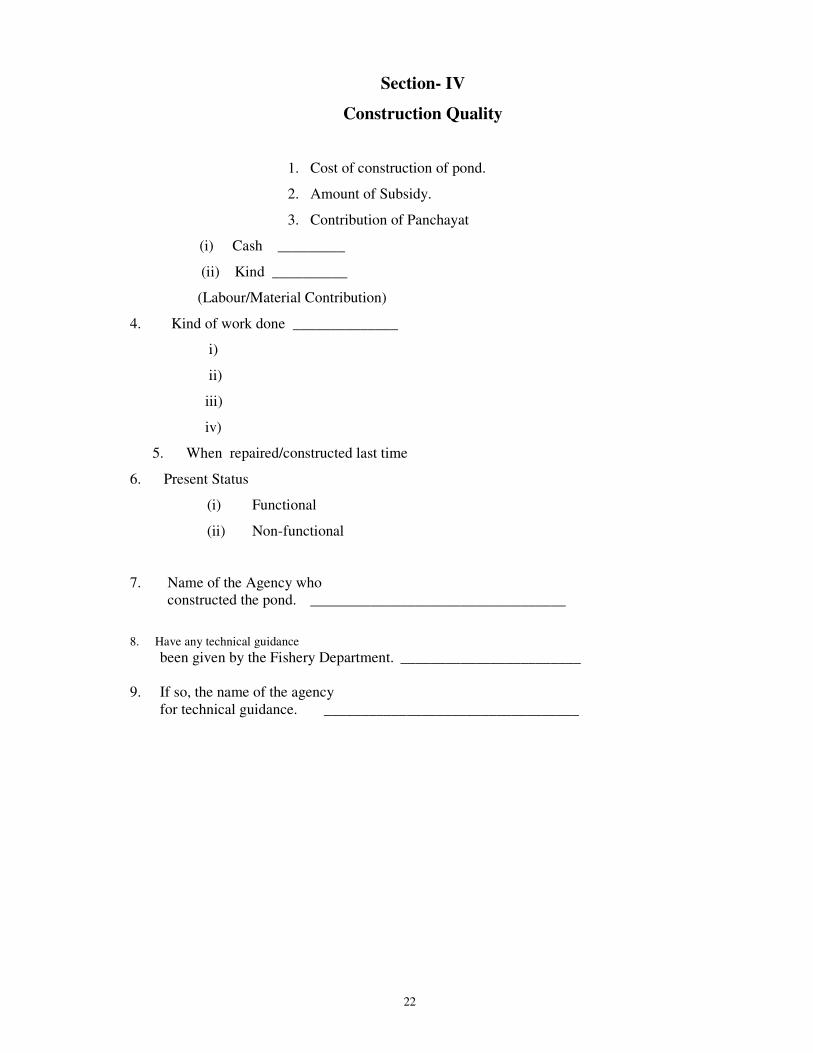
Section- IV
Construction Quality
1. Cost of construction of pond.
2. Amount of Subsidy.
3. Contribution of Panchayat
(i) Cash _________
(ii) Kind __________
(Labour/Material Contribution)
4. Kind of work done ______________
i)
ii)
iii)
iv)
5. When repaired/constructed last time
6. Present Status
(i) Functional
(ii) Non-functional
7. Name of the Agency who
constructed the pond. __________________________________
8. Have any technical guidance
been given by the Fishery Department. ________________________
9. If so, the name of the agency
for technical guidance. __________________________________

23
Section-V
Public Perception
1. Has the pond been repaired/constructed ______________
2. If Yes, when _____________
3. Who constructed the pond ______________
4. Is there fish in the pond ______________
5. Does the panchayat lease this pond for fishing ______________
6. If the pond functional and has water through out the year __________
7. If not, reasons:
(i) No proper source of water to pond.
(ii) Poor construction quality.
(iii) Low rains.
(iv) No repairs done.
(v) No responsibility of the panchayat.
8. Is there any sale of fish.
9. Any specific observation.
Signature of Village Pradhan
Signature of the Investigator
24
ADDENDUM
FOLLOW UP ACTION BY FISHERIES DEPARTMENT
As a consequence of findings of the study, the Department of
Fisheries, Govt. of Himachal Pradesh was requested vide Planning
Department’s letter No. PLG/SPM (E) dated 28th July, 2007 for outlining the
strategy for making 14 non functional ponds (out of 32 fish ponds) as
functional. The Director of Fisheries vide his letter No. Fish-F (4)-20/91- T.D-
111-8223 dated 30th August, 2008, which was concurred by Principal Secretary
(Fisheries) to the Govt. of Himachal Pradesh vide his letter No. Fish-D(1)-
19/2007 dated 28th
February, 2009, has intimated that out of identified 14 non
functional fish ponds, 7 have been made functional and leased out to the
Panchayats . As regarding remaining fish ponds(7), it was intimated by the
Fisheries department that non functional fish ponds, which are either leaking
or whose source of water has gone dry, would not be considered for repair.
Moreover, as stipulated under Scheduled Castes Sub Plan, repair/ renovation of
fish ponds is done after five years of their completion.