Embed Size (px)
Citation preview
AN ABSTRACT OF THE THESIS OF
Amadou Makhtar Diop for the degree of Doctor of Philosophy
in Crop Science presented on September 20, 1988.
Title: An Evaluation of Weed Interference in Rice Grown on Hydromorphic
Soils in West Africa
Abstract approved:_Redacted for PrivacyA. P. Appleby
Field, screenhouse, and laboratory experiments were conducted to
study weed interference in rice grown on hydromorphic soils at theInternational Institute of Tropical Agriculture (IITA) at Ibadan, Nigeria.
Rice and weeds emerged at the same time, 1 week after planting.
Weed dry weight was significantly reduced when the crop was kept weed-free
for at least 4 weeks after emergence. Initial weeding for 2 weeks was not
effective, because weeds reappeared and competed actively with rice plants.
Season-long weed competition reduced rice grain yield by 73%.
Weed competition reduced the number of tillers and panicles of rice.
The detrimental effect of early weed interference was not offset by keeping
the crop weed-free later in the growing season. At 6 weeks after emergence,
most of the weed species had reached flowering stage when rice was still
producing tillers. Handweeding at 2 and 6 weeks was effective enough to
reduce weed pressure. Rice seems to be most sensitive to weed interference
during this period from the second to the sixth week.

AN EVALUATION OF WEED INTERFERENCE IN RICE GROWN ONHYDROMORPHIC SOILS IN WEST AFRICA
by
Amadou Makhtar Diop
A Thesis
submitted to
Oregon State University
in partial fulfillment ofthe requirements for the
degree of
Doctor of Philosophy
Completed September 20, 1988
Commencement June 1989

Approved:
--\\
Redacted for PrivacyProfessor of Crop Science in charge hf major ,
Reda6ted for PrivacyHead of department of Crop Science
Dean of
Redacted for Privacy%A I 4V %.1%..1 I VV./I
q
Date thesis is presented September 20, 198a.
Typed by Amadou Makhtar Diop

ACKNOWLEDGEMENTS
I thank God for allowing my parents to witness the completion of my
graduate studies.
I wish to express my sincere gratitude to all people who, somehow,
have contributed to the success of this study. I thank Bill Brewster, Bob
Spinney, and all my colleagues graduate students for their criticism and for
sharing their experiences with me during my stay at Corvallis.
I am very grateful to the International Development Research Center
(IDRC), Canada, for sponsoring my M.Sc. degree program at the University of
the Philippines and at the International Institute of Rice Research (IRRI), and
my Ph.D. program at Oregon State University and at the International Institute
of Tropical Agriculture (IITA). Special thanks to Andrew Ker and Mrs. M.
Beaussart, for their prompt actions in solving the different problems I faced in
the course of these programs. My thanks also go to the International Institute
of Tropical Agriculture (IITA), for supporting my research activities in Ibadan,
Nigeria.
I would like to express my sincere gratitude to my co-major professor,
Dr. Arnold Appleby, who was a source of intellectual stimulation and for his
guidance and support during my studies at Corvallis and preparation of this
manuscript.
My other co-major professor, I. 0. Akobundu, for his guidance and
criticism in the process of the resesarch I conducted at IITA, and the
preparation of the first draft of the manuscript, and members of my committee,
Steve Radosevich, for his constructive criticism and encouragement during
my stay at Corvallis and while I was doing my research at IITA; Larry Burrill,
G. Crabtree, and D. C. England for their time and support they have given
me. I also thank R. D. Williams, who served in my committee in the first part

of this program, and M. L. Roush for accepting to serve as informal member
of this committee. M. L. Roush has shared with me her experience in
experimental approach and analysis of plant-plant interactions. I am also
grateful to J. E. Hill, University of California Davis, who provided me seeds of
barnyardgrass that I used in my preliminary studies at OSU.
At the International Institute of Tropical Agriculture (IITA), I would like
to acknowledge the assistance, support, and constructive criticism of K. Alluri,
T. Massajo, R. Acquino of the rice program, and M. Palada of RCMP
program. I also thank E. Deganus, D. Osiru, K. Dashill, L. Jackai, A.
Goldman, and E. Field, for their moral support and advice at a crucial period
of this program. I also acknowledge the staff of the International Plant
Protection Center (IPPC) of Oregon State University for their support and for
allowing me to use their facilities during the last part of the preparation of this
manuscript.
Finally, I sincerely wish to express my gratitude to a wonderful person,
Ugochi Anoka, who gave me love and affection that are an endless source of
inspiration. Ugochi has also spent hours proofreading this manuscript at IITA.

TABLE OF CONTENTS
Chapter I. INTRODUCTION AND LITERATURE REVIEW 1
INTRODUCTION 1
LITERATURE REVIEW 5Crop-weed interactions 5Interference: Allelopathy and competition 6
Allelopathy 6Competition 9
Critical period of weed competition 13Effects of weed competition on crop yield 15Methods for studying weed competition 17Analysis of plant growth 24
Chapter II. WEED INTERFERENCE WITH RICE 26
INTRODUCTION 26MATERIALS AND METHODS 27
Experiment 2.1. Critical period of weed interference 27Experiment 2.2. Growth analysis 29Experiment 2.3. Competitive influence of monospecific weed
density on rice 31Experiment 2.4. Allelopathic potential of selected weed
species 32RESULTS AND DISCUSSION 34
Experiment 2.1. Critical period of weed interference 34Experiment 2.2. Growth analysis 37Experiment 2.3. Competitive influence of monospecific weed
density on rice 39Experiment 2.4. Allelopathic potential of selected weed
species 42
Chapter III. GROWTH AND COMPETITIVE RELATIONSHIPS OFRICE, JUNGLE RICE, AND WILD POINSETTIA ASINFLUENCED BY PLANT DENSITY AND PROPORTION 62
INTRODUCTION 62MATERIALS AND METHODS 63
Experiment 3.1. Influence of plant proportion and density oncompetitive relationships between rice,jungle rice, and wild poinsettia(Dial lel experiment) 63

Experiment 3.2. Effects of intraspecific and interspecificcompetition on growth of rice, jungle rice,and wild poinsettia (Addition series) 64
Experiment 3.3. Effects of plant density and proportion oncompetitiveness of jungle rice and wildpoinsettia in different rice backgrounddensities (Modified replacement series) 65
RESULTS AND DISCUSSION 69Experiment 3.1.
Experiment 3.2.
Experiment 3.3.
Influence of plant proportion and density oncompetitive relationships between rice,jungle rice, and wild poinsettia(Dial lel experiment) 69Effects of intraspecific and interspecificcompetition on growth of rice, jungle rice,and wild poinsettia (Addition series) 71
Effects of plant density and proportion oncompetitiveness of jungle rice and wildpoinsettia in different rice backgrounddensities (Modified replacement series) 73
Chapter IV, GENERAL DISCUSSION AND CONCLUSIONS 101GENERAL DISCUSSION 101CONCLUSIONS 107
REFERENCES 109
APPENDIX 119

LIST OF FIGURESFigure Page
2.1. Planting design of an additive scheme with rice, jungle rice,and wild poinsettia 45
2.2. Linear relationships between rice grain yield and weed density;rice grain yield and weed dry weight at harvest 46
2.3. Relationships between duration of weed competition and ricegrain yield. IITA, 1987 (dry season) 47
2.4. Plant height at different sampling dates 48
2.5. Absolute growth of rice, jungle rice, and wild poinsettia atdifferent growth periods 49
2.6. Rice dry weight as influenced by density of jungle rice orwild poinsettia at harvest 50
2.7. Root growth of wild poinsettia, jungle rice, and rice at 4weeks after emergence 51
3.1. Planting scheme of monocultures of rice, jungle rice, and wildpoinsettia 79
3.2. Planting scheme of rice, jungle rice, and wild poinsettia 80
3.3. Schematic representation of a modified replacement seriesdesign with jungle rice and wild poinsettia planted withdifferent rice densities 81
3.4. Dry weight as affected by intraspecific competition at harvest 82
3.5. Density response: reciprocal of per plant biomass againstdensity 83
3.6. Density response of rice, jungle rice, and wild poinsettia:reciprocal of individual plant biomass at 12 weeks afteremergence 84
3.7. Leaf area of individual plants as influenced by density 85
3.8. Replacement series diagrams, depicting the effect of weedproportion planted with different rice densities 86

Figure Page
3.9. Jungle rice and wild poinsettia responses to intraspecificcompetition 87
3.10. Monoculture responses of jungle rice and wild poinsettia 88
3.11. Yield response to density: Yp=projected yield; Ymax=maximumyield; Kn=density at which 50% Ymax is reached 89
3.12. The relationship between individual plant weight and density(double log transformation) 90

LIST OF TABLES
Table Page
2.1a. Effect of weeding on weed growth at 10 weeks after emergenceand at harvest. IITA, 1986 (rainy season) 52
2.1b. Rice yield components as affected by weeding. IITA,1986 (rainy season) 53
2.2 a. Effect of weeding on weed growth at 6 weeks afteremergence and at harvest. IITA, 1987 (dry season) 54
2.2 b. Rice yield components as affected by weeding. IITA,1987 (dry season) 55
2.3. Mean values of LAR and NAR for rice, jungle rice,and wild poinsettia. IITA, January 1987 56
2.4. Relative growth rate of rice, jungle rice, and wildpoinsettia at different growth periods. IITA, January 1987 56
2.5. Rice growth as influenced by jungle rice density.IITA, 1987 57
2.6. Rice growth as influenced by wild poinsettia density.IITA, 1987 58
2.7. Allelopathic effect of selected weed species on plantgrowth. IITA, August 1987 59
2.8. Effect of plant aqueous extracts on shoot length (cm) of riceand cowpea. IITA, August 1987 60
2.9. Effect of plant aqueous extracts on radicle length (cm) of riceand cowpea. IITA, August 1987 61
3.1. Density and proportion of rice, jungle rice, andwild poinsettia in binary associations with ricegrown in pots. IITA, 1987 91
3.2. Effect of rice stand and weed density on rice growth at harvestIITA, 1987 92

Table Page
3.3. Yield-density relationship between rice and jungle riceor wild poinsettia. IITA, 1987 (dry season) 93
3.4. Rice tillers per plant, as influenced by density of rice andjungle rice or wild poinsettia IITA, 1987 94
3.5. Effect of intraspecific competition on wild poinsettia growthat 6 weeks after emergence. IITA, 1987 (rainy season) 95
3.6. Effect of intraspecific competition on jungle rice growthat 6 weeks after emergence. IITA, 1987 (rainy season) 96
3.7. Effect of intraspecific competitioh on rice growth at 6 weeksafter emergence. IITA, 1987 (rainy season) 97
3.8. Yield-density relationship between rice and jungle riceor wild poinsettia. IITA, 1987 (rainy season) 98
3.9. Monoculture response of jungle rice and willdpoinsettia to density. IITA, 1987 (rainy season) 99
3.10. Yield-density relationship between jungle rice and wildpoinsettia grown at different proportions with different rice
densities. IITA, 1987 (rainy season) 100

AN EVALUATION OF WEED INTERFERENCE IN RICE GROWN
ON HYDROMORPHIC SOILS IN WEST AFRICA
Chapter I.
INTRODUCTION AND LITERATURE REVIEW
INTRODUCTION
Cereals are the world's most important food crops. Cereals provide
three-quarters of the energy needs of humans and more than one half of
their protein needs. Wheat and rice together provide 60% of the world's
carbohydrate for human energy (Gallagher, 1984). Rice has become an
increasingly important crop in many countries in tropical Africa. In 1985
paddy rice production in Africa was 9.5 million tons, of which 3.9 million
tons (41%) were from West Africa (FAO, 1986).
In the last 15 years, drought has contributed to a reduction in the
total land area for crop production in Africa. Rice is one of the crops that
has been most affected. The unfavorable weather has complicated further
the food deficit problem already resulting from low productivity, pests, and
high human population pressure. Consequently, African countries import
more rice than other countries of the world. African countries in 1984imported 3.1 million tons of milled rice, which constitutes 27.2% of the
world's imports of that commodity (FAO, 1987).
West African countries spend over 378 million dollars on riceimportation. This expenditure is obviously a major drain on the scarce
foreign exchange reserves. It is, therefore, important to increase rice
production efforts in African countries. Rice is grown under widely diverse

2
hydrological conditions. Rice lands have been classified on the basis of
natural water supply into pluvial, phreatic, and fluxial soils (Moormann and
Veldkamp, 1978). Pluvial soils receive water from rainfall only. They are
generally well-drained. Phreatic soils receive water from both rainfall and
subterranean water supplies. Fluxial soils rely mainly on surface water.
Rice ecologies in which fluxial soils occur include swamp, deep water, and
mangrove. The pluvial and phreatic soils also are known as 'dryland' and
'hydromorphic' soils, respectively.
Hydromorphic soils are poorly drained, often water-logged,tropical soils that are high in organic matter. Such soils are often fertile
when drained (IITA, 1980). These soils occur in the forest, forest-savanna,
and savanna ecological zones of West Africa. They are found over a wide
range of land forms such as inland depressions, river valleys, and flood
plains.
Hydromorphic soils are among the untapped natural resources of
West Africa. Water-logging associated with poor drainage, iron toxicity, and
weed infestation are among the major constraints to agronomic use of these
soils. Improved water management practices and introduction of
iron-tolerant rice cultivars will contribute to rice production in hydromorphic
soils. Both drainage and flood control are important. Although rice is themajor annual food crop which thrives on land that is water-saturated orinundated during part or all of its growth cycle, its production inhydromorphic soils can be adversely affected by uncontrolled floodings
(Moormann and Veldkamp, 1978). These workers recommend drainage of
the land and interception of the interflow water by deep drainage ditches
across the line of flow as a means of reducing damage to rice byuncontrolled flooding.
3
Reports from several countries indicate that weed problems in rice
are more serious on hydromorphic soils than in paddy fields (Bertrand,
1973; De Datta, 1974; Akobundu and Fagade, 1978; Crauford and
Lembela, 1978; Schwaar, 1983 ; Akobundu and Ahissou, 1983). Both
dryland weeds and weeds adapted to water-logged conditions are
problems on hydromorphic soils (Akobundu and Fagade, 1978). Weed
growth in such an environment is favored by the presence of ample supply
of water, while weed control is difficult. Herbicides that provide good weed
control in paddy fields and dryland rice cultures do not persist long enough
to provide satisfactory weed control in hydromorphic soils (IITA, 1976).
Poor weed control in hydromorphic soils could be attributed to flooding
which is not always predictable and occurs at varying times after planting.
Without adequate flood control, both preemergence and postemergence
herbicide applications are unreliable. Schwaar (1983) reported that
successful application of postemergence herbicides to rice in many parts
of West Africa was difficult and often impossible because flooding often
occurs shortly after planting. While some progress has been made through
breeding and use of improved crop husbandry practices to alleviate rice
production constraints such as iron toxicity and inherent low productivity of
rice, weed infestation in hydromorphic rice has remained a difficult problem
for most rice growers, particularly smallholder farmers.
The objectives of this research were to:
1. determine if a critical period of weed competition with rice grown
on hydromorphic soils exists.
2. evaluate the competitive ability of rice and selected weed
species.

4
3. assess the effects of weed species on growth and development
of rice.
4. understand the nature of weed interference in rice culture.

LITERATURE REVIEW
Crop-weed interactions
5
Organisms that exist within sufficient proximity often interact. In
plant communities, interaction is used to refer to all mutual influences of one
plant on another (Trenbath, 1976). This is true in a weed-crop association.
According to Silvertown (1982), plant interactions may be asymmetrical
(affecting only one species) or symmetrical (affecting both species). The
symmetry of an interaction between species obviously will affect the
outcome of plant-plant association.
In an environment where individuals are small in size or far apart,
interaction may not take place until they experience a conflict of interest,
which can be, for example, a result of limitation in resources. When plantspecies are in association, the effects of their interactions can be positive,
neutral, or negative. Burkholder (1952) described different types of plantinteraction. These include mutualism, commensalism, competition,
amensalism, and parasitism. Examples of positive interactions arecommensalism and mutualism, while those of negative interaction arecompetition and amensalism. Crops are often selected for yield or harvest
attributes rather than competitiveness and this selection is done inweed-free growth conditions. Although weeds may also be affected byneighboring plants, crop yields are in most cases reduced. However, weed
growth also is often reduced by crop presence.

6
Interference: Allelopathy and Competition
Harper (1961) defined interference as 'any interaction that mayoccur among plant species in mixtures which causes a reduction in plastic
growth or survival of one or both species'. The consideration of the term
'space' as embracing all resources, makes it possible to examine theoutcome of interference in the context of proximity to neighboringindividuals without actual determination of the kind or amount of
resources for which the interaction occurs. Therefore, the factors that
affect the outcome of interference between plants should not be limited toenvironmental resources.
Weeds may interfere with crops not only through competition but
also through allelopathy. Trenbath and Harper (1973) suggested thatlower crop yields in the presence of weeds may be due to competition for
environmental resources, allelopathic effect, or presence of neighborspromoting disease incidence or lodging in the associated crop. Types ofinterference covered in my studies are competition and allelopathy. Thelatter is an example of amensalism, a type of interaction in which growth of
one of the organism (plants) is depressed while the other is unaffected
(Akobundu, 1987). Although effects of weed-crop interference havetraditionally been attributed to competition for environmental resources,
Barnes and Putnam (1986) pointed out that the ability of plant to chemically
interfere also may be important.
Allelopathy
Allelopathy is any direct or indirect harmful effect of one plant on
another through production of chemicals that escape into the environment

7
(Rice, 1974). The fact that extracts of a plant are inhibitory to other plants
does not always indicate that the donor plant has allelopathic action against
other plants (Rice, 1979). Rather, allelopathy occurs when a chemical
released by a donor plant causes injury to another plant in the same
habitat. An inhibitory effect can result from direct action of such chemicals
or from an interaction between chemicals and soil microorganisms. The
effect of an allelochemical may be inhibitory or stimulatory to neighboring
plants depending on its concentration in the surrounding medium (Rice,
1979; Weston and Putnam, 1986; Barnes and Putnam, 1986). Toxic
substances that inhibit growth of some species at some concentrations may
stimulate growth of the same or different species at other (lower)concentrations. In addition to the living leaves and roots of a donor plant,
the dead and decaying plant parts could be a source of allelochemicals.
Whether annual weed species have allelopathic effects on crops is
debatable. Perennial weeds such as quackgrass (Agropyron repens),
nutsedge (Cyperus rotundus ) and johnsongrass (Sorghum halepense)
often have been implicated as being allelopathic (Schrieber and Williams,
1967; Bhowmik and Doll, 1984). The amount of corn root growing in soil
containing residues of giant foxtail (Setaria faberii), crabgrass (Digitaria
sanguinalis ), or yellow foxtail (Setaria glauca ) were less than in soilwithout plant residues (Schreiber and Williams, 1967). Although this
observation does not prove that toxins are present, it suggests thispossibility.
In recent years annual weeds have shown allelopathic potential.
When allelopathic potential of weed residues (shoot materials) was
evaluated on corn and soybeans, common Iambsquarters (Chenopodium
album) extract reduced coleoptile growth of corn (Bhowmik and Doll,

8
1982). In greenhouse studies, they also found that residues of
lambsquarters, redroot pigweed (Amaranthus retroflexus), and yellow
foxtail had allelopathic activity on corn and soybeans.
Few studies clearly assess the effects of weed residues ongrowth inhibition and nutrient uptake in crops. Bhowmik and Doll (1984)
reported that, regardless of nutrient level, all plant residues used except
those of common ragweed inhibited corn height, leaf area, and total dry
weight. Weed residues generally reduced N uptake in corn and soybeans.
Growth inhibition caused by weed residues could be due to interference
with growth processes in plants or other causes such as altered pH, nutrient
availability or carbohydrate : nitrogen ratios.
Allelopathic influence of weeds upon crops include reduction in
seed germination, root and shoot growth, stand density, yield, resistance
to pathogens, nodulation, and nitrogen fixation (Rice, 1974). Plant gowth
is affected mainly through the effects of toxic chemicals on cell division,
mineral uptake, and photosynthesis (Einhellig, 1986). Specific effects of
allelopathy on plant growth has seldom been studied in the field, because
of difficulties in separating effects of allelopathy from those of competition.
Putnam (1978) reviewed extraction and bioassay techniques used forallelopathic studies. The most difficult process is the isolation and
extraction of toxic substances from plant materials in the form they exert
their effects in nature. Extraction using ground plant material in aqueous
solvents are subject to criticism, since cell constituents may interfere with
substances suspected to be toxic. In addition, problems arise when it is
uncertain if an effective concentration of the chemicals can be released
into the environment (Akobundu, 1987).
Several techniques have been proposed for the study ofallelopathy. In addition to the methods for toxin isolation followed by simple

9
bioassay, a stair-step system has been proposed (Bell and Koeppe, 1972).
In this system, donor plants and recipient plants are grown separately in
pots filled with sand solution and alternated in a stair-step fashion so that
any liberated chemical substance from the weed will leach down and come
into contact with the roots of the crop.
Recently, questions have arisen concerning of allelopathy as the
inhibitory effect from a living donor or the effect from dead plant materials.
In case of the latter, any plant material could exert an inhibitory effect on
neighboring plants. In this context, the suggestion by Akobundu (1987)
that the term allelopathy be limited to the detrimental effects of chemical
sustances released by living plants into their environment, seems to
minimize confusion especially on demonstration of allelopathic potential
of given species. In plant extracts or litter there is a variety of organic
compounds which may be in different in forms when they are naturally
released through leachates, root extracts, or decomposition of litter.
Demonstration of allelopathic potential of selected weed species
is not a major objective of my thesis work. However, since weed
interference is being evaluated, I have made attempts to account for any
chemical interaction, bearing in mind that the ability of weeds to interfere
with the crop may not be wholly due to their competition for environmental
resources.
Competition
Competition is another mechanism of plant interference and
can be distinguished from allelopathy since it does not involve the release
of allelochemicals. Grime (1977) defined competition as the tendency of
neighboring plants to utilize the same quantum of light, ion of mineral
nutrient, molecule of water, or volume of space. However, for competition

10
to occur, an environmental resource must be limiting. In other words, two
plants do not compete with each other while environmental resources
satisfy their needs.
Plants respond to density stress in different ways and the
populations are regulated via density-dependent processes of plasticity and
mortality. At low density, individual plants contribute their expected yield
to the total yield per unit area (Harper, 1977). With increasing density,
plants have the ability to alter their size, biomass, and number. At high
densities, plants may respond to one another by altering their growth form,
by allocating environmental resources to different parts, or by altering the
impact on fecundity. This response to density has been referred to as
plasticity (Radosevich and Holt, 1984). Each of these responses is anexpression of competition. Silvertown (1982), noted that competition
among plant species does not distinguish between plastic growth andmortality.
It must be remembered, however, that two types of competition
(intraspecific and interspecific) can take place in mixed plant populations.
This separation is important to understand interactions that occur among
plants in associations. Competition among individuals of the same species
is known as intraspecific competition (Antonovics and Levin, 1980;Radosevich and Holt, 1984). Negative interaction among plants of dif-
ferent species is interspecific competition.
The competitive ability of plants is determined by the space aspecies is able to occupy at the beginning of the growing season, therelative rate at which a plant can expand into unoccupied space , and the
access of the plants to factors limiting growth (Spitters and van den Bergh
1982). Competitive advantage of some species is largely associated with
rapid emergence and rapid root and shoot growth during the early stages.

11
Black et al., (1969) suggest that competitive ability depends on the net
capacity of a plant to assimilate carbon dioxide and use the
photosynthates to extend its foliage, or increase its size. For example at
high temperatures and light intensity, plants which have the C4 cycle
should have a photosynthetic advantage over plants that do not. Theoutcome of interference also is influenced by factors such as crop density
and onset and duration of interactions among plants.
In a crop-weed association, density of both weeds and crop have
an impact on the resulting interactions. At low total density, individual
plants may not share the same space, consequently, interference does not
occur. Studies on effects of weed density on crop yield show little yieldreduction at low weed densities (Smith, 1968; Zimdahl, 1980; Bhan,1983). As weed density increases, the proximity of neighboring plants
increases and competition ultimately occurs. Thereafter, individual plants
react to the presence of each other and the aboundance of space or
environmental resources. Antonovics and Levin (1980) have demonstrated
that density-dependent processes affect natural plant populations. They
referred to the 'ecologically effective distance' as the interplant distance
beyond which effects of density are absent. Consequently, the space each
plant preempts is proportional to its size. At high densities, there is anoverlapping of the area occupied by individual plant species and resources
are more likely to become limiting.
There is an optimum weed density for a given level of resources
beyond which significant mortality occors. This phenomenon is termed
selfthinning (Antonovics and Levin, 1980). Radosevich (1987) noted that
increasing the amount of a limited resource such as water or fertility
when plant density is already high usually enhances mortality. This form
of mortality is frequently a consequence of increased population density

12and differences in sizes of individuals (Sagar and Harper, 1961). One
hypothesis for this phenomenon is that as density increases and resources
become limiting, bigger plants grow bigger and suppress smaller plants.
In plant competition studies, influences of proportion of eachspecies in a mixed community often have been confounded withinfluences of total plant density. Each species will respond mainly tointerspecific interactions. These relationships are influenced by theincrease in number of any component of the mixture (Radosevich andHolt, 1984). Such increase in number would lead to a more intenseintraspecific competition.
Growth and development of cereals and other crops is sensitive tocompetition from weeds. Many studies on weed competition with rice
have been reported in the literature (Boerema, 1963; Smith, 1968 and1984; Swain, 1973; Swain et al., 1975; Moody, 1978; Dominicata and
Alcala, 1983; Utomo, 1981; Singh and Ram, 1984).
Rice-weed competition studies have focused on effects of water(Okafor and De Datta, 1976; Cruz et al., 1983; Munger et al., 1987),mineral nutrients (Pande and Bhan, 1966; Kleinig and Noble, 1968; De
Datta et al., 1969; Sahai and Bhan, 1984;), and light (Okafor and De Datta,
1976; Donald, 1958). Sahai and Bhan (1984) found that weedsremoved high quantities of nitrogen up to 60 days after seeding, and
barnyardgrass (E. colona) was the most competitive weed species. The
degree and pattern of damage to rice plants caused by weed competition
depends also on the weed species. The onset and duration of competition
is also a determining factor for the outcome of crop-weed interactions.
Barnyardgrass, one of the most common weeds that infests rice, has been
used for competition studies in many parts of the world. Noda et al., (1969)
reported that high densities of barnyardgrass increased rice height,

13
significantly reduced tillering and panicle number, and delayed heading.
In later studies, Noda (1973) observed that barnyardgrass at densities of
more than 80 plants per m2 lowered the assimilatory activity of rice. The
fact that rice has a water requirement nearly twice that of most other tropical
grasses (Black et aL, 1969) may explain the adverse effect of barnyardgrass
on the crop. Smith (1968) reported that rice and barnyardgrass growing
together under irrigated conditions competed primarily for nutrients
because the two species produced overlapping fibrous root systems. The
yield of irrigated rice was reduced by 82% from barnyardgrass competition
at a density of 100 weed plants per unit area (Andrade, 1983).
Competition studies have been performed with weeds other than
barnyardgrass. At the International Rice Research Institute (IRRI, 1983)
crop failure was reported when irrigated rice was grown under
season-long competition from Scirpus maritimus. Panicle weight of the
crop was more affected than panicle number. When Cyperus difformis
grew with rice, Swain et at, (1975) found that the number of panicles was
affected the most. They also noted that weed removal prior to tillering ledto significantly higher grain yields than when weeds were removed late.
The number of rice tillers was positively correlated with the number ofrice panicles. On the other hand, Smith (1984) did not observe anysignificant reduction in stand of drilled paddy rice due to competition from
dayflower (Commelina diffuse) for up to 80 days after seeding.
Critical period of weed competition
In a crop-weed association, delayed emergence of one species may
markedly influence its contribution to the total output of the interaction.
Determination of thecof the period during which crops are more sensitive to

14weed competition is necessary for development of integrated weedmanagement programs. This information is useful in formulating guidelinesfor herbicide use and in determining if and when other control measuresare necessary to minimize yield reduction due to weed competition.
Dawson (1970), Schreiber (1982), and Lolas (1986) pointed out the
importance of determining critical periods of competition when setting up
weed management programs. The knowledge of these periods guides thefarmer in deciding when weeding should be done or how long the cropcan tolerate weed competition. It is known that a period exists during which
most crops can tolerate competition without yield reductions. This is usuallywhen crop and weed plants are small. The optimum period for weedcontrol for a given crop is determined on the basis of the critical periodwhen that crop is sensitive to weed competition (Spitters and van denBergh, 1982).
The duration of weed interference affects competitive relation-ships of weeds and crops. Weed competition in direct-seeded ortransplanted rice during the early growth stages of rice reduced grainyields more severely than when competition occurred after rice plantsbecame well developed. According to Noda (1973), barnyardgrass
competition during early crop growth stages reduced the number of ricepanicles, while later competition reduced grain weight. Singh and Ram(1984) concluded that the first 45 days after sowing rice were most
important for weed removal in order to obtain higher yields of direct-seededrice. Dominicata and Alcala (1983) reported that the critical period of
weed competition for transplanted irrigated rice was from 2 to 6 weeksafter transplanting. The critical period of weed competition is affected bydifferences in environmental conditions, weed species composition, andplant density and size.

15Plants vary in their plasticity and interactions with the environment.
Studies on critical periods of competition do not, therefore, provide enough
insight for determining the level of weed control necessary to achievebiologically or economically optimal crop production. The determinationof critical period of weed competition in terms of time period does not allow
adjustment for the different environmental factors which may affect cropand weed growth. Therefore, reference to the growth stage, physiological,and morphological states of the crop are important in understanding
competition and determining critical periods of weed control. The criticalperiods of competition may involve complex interactions as well as different
mechanisms and phenomena that occur in a discontinuous manner.
Effects of weed competition on crop yield
Many studies on the effect of weed infestation on field crops showthat weed competition reduces crop yield (Smith, 1968; Utomo, 1981;Andrade, 1983; Bhan, 1983; Tisdell et al., 1984). It is now evident thatmerely showing that weeds reduce crop yield is not enough. Manyresearchers have advocated additional information such as time of weed
seedling emergence in relation to competition, duration of weed-cropassociation, effects of weed species and density on crops, effects of crops
on weeds, impact of environmental factors, etc (Dawson, 1970; IRRI, 1983;
Dominicata and Alcala, 1983).
Bowden and Friesen (1967) studied the effect of wild oat densityand stage of growth at the time of weed removal on yield of both spring
sown wheat and flax. Their studies showed that wild oat significantly
reduced yield of wheat and flax at densities of 48 plants m-2 and 12 plants
m-2, respectively, and that competition with the crop started before wild oat

16reached the 1-2 leaf stage of growth. Dawson (1970) studied the timeand duration of weed infestation in relation to weed-crop competition and
concluded that there was a physiological similarily between weeds and
crop with respect to their needs for growth factors. It should, however, be
recognized that plant species differ in their requirements for levels of
environmental resources. The stages of crop growth during whichcompetition with weeds occurs is important (Dawson, 1964; Wilson andCole, 1966).
The extent of crop loss caused by weeds depends on several
factors that include species of weeds present, density of weeds and crop,duration of weed-crop association, and growth and distribution of weeds
(Hill and Santelmann, 1969; Noda, 1973; Williams et al., 1984; Chubband Friesen, 1985). Since weeds vary in their competitive ability with
crops, the differences between species and also within species in different
competitive situations should be known in order to determine whensubstantial crop losses are likely to occur (Wells, 1979). Competitionstudies have been carried out with different crops grown in
association with different weed species. Buchanan and Burns (1970)
conducted a series of experiments to study the period of weed-free
maintenance after cotton emergence and found that the crop requires aweed-free period of approximately 8 weeks to produce maximum yields inAlabama. If herbicides are used for initial weed control, the herbicide
must have sufficient residual effects for the duration of this critical period.
Zimdahl (1980) reviewed several works demonstrating the
detrimental effects of weeds on various crops. These studies describe
the extent of yield or economic loss that occurs at various weed densities
and under different conditions. Smith (1968) found that barnyardgrass
competition with dry-seeded rice reduced grain yields from 8 to 79%
17when competition began at crop emergence and lasted for periodsranging from 15 days to maturity. Andrade (1983) examined the effects
of barnyardgrass density on yield of irrigated rice and found that grain yield
decreased by 16% with 5 plants m-2 and by up to 80% with 80-100plants m-2. The effect of weed density was significantly influenced bynitrogen levels (Kleinig and Noble, 1968). A low population of weed
seedlings can become a serious problem in rice under high soil fertilityconditions.
Type of rice cultivars also affects weed competition. De Datta
(1972), Smith (1974; 1984), and Moody (1978) showed that rice cultivars
grown in paddy fields differ in their ability to compete with weed. Effects of
cultivar differences in relation to weed competition have also beenreported under hydromorphic conditions (Akobundu and Ahissou, 1985).
In the latter study, plots with a profusely tillering cultivar, Adny-11, had a
signicantly lower weed weight than plots with cultivars that tiller moderately.
Methods for studying weed competition
Different methods have been used to evaluate weed-cropinteractions. These are additive, substitutive, systematic, and neighborhoodapproaches.
Additive method
The additive method was commonly used in earlier studies ofinterference. The additive method of competition study involves growing
weeds at varying densities in association with a constant population of acrop plant. This experimental approach is widely used because of itsrelevance to actual field situations, where one or more weed species infest

18an area already occupied by a crop. It has also an advantage because it
permits the assessment of effects of weeds on yield and cost to thefarmer under current management constraints (Dekker etat,1 983).
In spite of its practicality, this approach has recieved considerablecriticism because of its failure to control adequately the interferences
associated with proximity factors especially density and proportion, on plantresponses (yield). In the additive approach, the total density of plantsvaries and the proportion among species also changes simultaneously
with density. Thus, two of the major components of competition (density
and proportion) vary, making it difficult to interpret the relative effect of either
factor. This complication has been demonstrated by numerous workers
(Harper, 1977; Zimdahl, 1980; Carlson and Hill, 1985). To reduce theimpact of two simultaneously changing variables, Carlson and Hill(1985), studying wild oat competition with spring wheat, expressed the
response of wheat (yield) as a function of the ratio of wild oat density to totalstand density.
Substitutive method
The substitutive or replacement series design (de Wit, 1960) is
commonly used to study interactions between component species in amixture. In this approach, a range of mixtures is generated by starting with amonoculture of species A, and then progressively replacing plants ofspecies A with those of species B until a monoculture of species B isobtained. This type of design requires that all stands have the same density
and that the two species occur in varying proportions. Each species isgrown alone to assess intraspecific competition. The outcome ofcompetition can be represented in different models. From the resulting
graphs it is possible to determine whether competition has occured and if

19so, which of the species is the most successful components of the mixture.
The relative yield total (RYT) has been used for comparisons betweenmixtures and monocultures (de Wit and van den Bergh, 1965) while the
regression analysis approach has been used to examine the densitydependent effects of the associated species (Hill, 1973). Utomo (1981)used the space occupation and replacement series concept developedfrom de Wit's (1960) model to describe the complex of environmentalfactors that affect plant growth and interaction between weed species andupland rice. He found that maximum yield was obtained when the available
space is compeletely occupied by the population of the crop plants. To
determine the competition effects between plants, therefore,environmental factors contributing to the growth of plants should beconsidered.
Connolly (1986) evaluated different indices proposed for analysisand interpretation of results obtained from replacement series experiments.
He indicated that the assessment of species aggressiveness is influenced
by the replacement lines selected, and idices, generally, variedsignificantly. The relative yield total (RYT) was the most stable of all indicestested. Difficulties associated with the replacement series approach alsoinclude the confounding effects of intra- and interspecific competition(Harper, 1977; Connolly, 1986; Radosevich, 1986), because, in most of thestudies, the total density is held constant and this prevents the assessment
of the density dependence of RYT. For better interpretation of dataobtained from substitutive or replacement series experiments, it is
necessary to have a range of total densities of mixtures and monoculturesof each species. In many of these studies, yield is frequently the onlyparameter assessed (Jolliffe et al., 1984). However, the basis of yield
variations in monocultures and mixtures could be better understood if

20observations on other plant characteristics such as leaf area and dry
matter partitioning are made. When species of different individual sizes are
involved in mixtures and the yield measured in terms of biomass other than
seed production, the use of indices such as relative crowding coefficient,
aggressivity, or competitive ratios, tends to favor the larger species(Connolly, 1986).
Interpretation of data obtained from replacement series is difficult
when species of different strategies or growth forms are involved. In this
case, Radosevich (1987) suggested that proportions expressed as ratios of
biomass may be more appropriate than ratios based on plant density.
Systematic method
The concept of systematic design was developed by Nelder (1962)
for spacing studies involving single species. This design is important for
competition studies focusing on proximity factors (density, proportion, and
spatial arrangement). It is useful for competition studies in row crops such
as soybean, corn, cassava, or vegetables. The advantage of this design is
that it can be used to provide a wide range of plant densities without
changing the pattern of arrangement (Bleasdale, 1961). This type of
arrangement can account for spatial relationship among plants and it is also
possible to consider density and proportion of the species under study.
This technique is widely used in studies on effects of intraspecificcompetition on crop yields. Spitters (1983) has criticized this design,
pointing out that plant arrangements in this design are not consistent with
pratical weed situations, and that the influence of total density is notadequately addressed.
Spitters (1983) introduced another systematic method known as the
addition series. In the addition series approach to competition studies, the

21
densities of the two species under study vary in two directions, generating
a wide range of species proportions. The response of each species to
density and proportion of the components of the mixtures is influenced by
intra- and interspecific competition. These competition effects can beestimated with the addition series experiments. The model suggested by
Spitters (1983), was derived from the yield-density models originally
developed by Shinosaki and Kira (1956), Willey and Heath (1969), and
Watkinson (1980). It is a simple model to quantify the competition effect andestimate the degree of intraspecific and interspecific competition.
This approach suggested by Spitters (1983) uses the reciprocal
yield law to describe plant interactions. This law can be expressed by thefollowing equation:
1/W=A+BN (1)
where: 1/W is the reciprocal of individual plant weight,
A is a constant equal to the reciprocal of the theoretical
maximum plant size,
B is the slope of the line reflecting the relationship between
individual plant weight (W) and density (N).
The equation predicts that individual plant weight, size or yielddecreases as density increases. According to Radosevich (1987), this
principle is important in understanding interactions between neighboringplants. With the assumption that the effects from intraspecific and
interspecific competition are additive, Spitters (1983) suggests that it can
be expanded to a two- or multispecies reciprocal yield equation:

221/V1/1=Ai +Bi .1 Ni +Bi .2N2 (2)
where: B11 and B12 are regression coefficients which quantify the effects
of intra- and interspecific competition, respectively. This equation also can
be used to predict the competitive ability of one species, based on the total
and relative density of all other species in the mixture (Radosevich 1987).
This model does not account for spatial arrangement. Radosevich (1987)believes that there may be valid statistical arguments for morerandomization, since the treatments are arranged according to directionor orientation.
Spitters (1983) defined the relative competition ability of each
species as the ratio of regression coefficients. The relative competitiveability of species 1 in association with species 2 is defined by the ratio
B1.1/B1.2 and intraspecific and interspecific competitive effects are
quantified by these coefficients, B1.1 and B1.2 , respectively.
Neighborhood method
Most of the previously discussed designs used density tomeasure the outcome of competitive relationships. Weiner (1982)pointed out that, while density has been a basis for description of plant
populations, plasticity and spatial arrangement limit its use in describingand predicting the behavior of plant populations. He proposed the use of a
neighborhood approach for describing the behavior of individual plants aswell as those of plant populations. For example, seed production of
individual annual plants within a population is a function of the number ofindividuals within each of several concentric neighborhoods. When
several plant species share the available space, seed production of

23individual plants can be ultimately affected by the presence of neighbors.
Mack and Harper (1977) reported that the seedling growth of
individual grasses was a function of the biological space available to each
of the individual seedlings. This biological space was defined not only by
the position but also by the stage of growth of neighbors. However,
different types of neighbor effect might be achieved by a variety of
character combinations in response to their associated species and
environments (Sano et al., 1984). The increased proximity of neighbors
may lead to a lower growth rate and dry matter production of an individual
plant. Weiner (1982) used a neighborhood model to show that the effect
of increasing competition was to reduce seed production in a hyperbolic
fashion, and that the contribution of each individual to this effect was
inversely proportional to the square of its distance from the test individual.
The importance of spatial arrangement in interference studies has
been reported by several workers (Fisher and Miles, 1973; Radosevich and
Holt, 1984). Fisher and Miles (1973) developed several theoretical
models for interference between crop plants arranged at points of a
rectangular lattice and randomly located weeds. Their assumption
regarding interspecific interactions is that a plant grows from emergence
until it meets another plant.
Ultimately, each plant establishes its own zone of exploitationand the field is occupied by many non-overlapping weed and crop
domains. Goldberg and Weiner (1983) described the effect of neighboring
plants on a target species using the slope of a regression model relating the
performance of target individuals with the amount of neighbors. The major
advantage of their design is that it measures competition on the basis of
individual plant biomass. Different measures of amount of neighbors can
suggest the mechanisms of competition. The general theory of plant

24growth analysis can provide information which may help explain plant
responses to the environment, competition relationship between different
species, and the allocation and partitioning of dry matter.
Analysis of plant growth
Observations of plant characteristics ( e.g. leaf area and dry matter
partitioning) are important factors to explain the yield variations inmonocultures and mixtures (Jolliffe et al., 1984). Growth analysis
experiments satisfactorily complement field studies where the interactions
among species are not readily detectable. The technique of mathematical
growth analysis provides a convenient means of examining the process of
total dry matter production and leaf area expansion that are important indetermining a plant's vegetative growth and potential competitivenessunder a variety of environmental conditions (Patterson, 1982). The relative
growth rate has been proposed as a means of integrating physiological
attributes of a species (Evans, 1972; Grime and Hunt, 1975). Roush and
Radosevich (1985) indicated that integrative growth rates (such as relativegrowth rate) and growth responses that are partitioned into more tightly
defined physiological and morphological parameters could prove valuablein characterizing aggressiveness among weed species.
As Ralph (1976) has proposed, analysis of growth data to estimate
growth rates is always desirable. However, he believes that the estimation
of growth rates often presents some problems because while growth is
continuous, measurements are, for practical reasons, made only atintervals and errors arising from the measurement as a result of imperfect
control of growing conditions or from sampling procedures are always
present. According to Grime and Hunt (1975), the relative growth rate

25exerts a major influence upon dry matter production. In the studies ofGilmour (1985), a pattern emerged which indicated that dry matterproduced during vegetative growth could be used as a prediction of final
grain yield of rice.
Potter and Jones (1977) suggested that partitioning ofphotosynthate into new leaf area is an important component of growth. A
great portion of the dry weight of higher plants is derived from CO2
assimilated through photosynthesis. In an earlier competition study
(We lbank, 1961), the use of dry weight and leaf area provided evidenceof the factors involved in root competition between Impatiens parvifloraand Agropyron repens. Simultaneous growth analysis under controlled
conditions is a useful tool in assessing the competitive ability of eachspecies when grown in mixtures.

26
Chapter II.
WEED INTERFERENCE WITH RICE
INTRODUCTION
Weeds interfere with crops in three ways: through competitive
interference, allelopathy (chemical interference), or directly through changes
in physical or biological environment that affect plant growth. Although my
thesis reserch dealt with the first two, which are the direct causes ofinterference, emphasis will be on competition.
The wide range of dryland and wetland weed species that interfere with
crops in hydromorphic soils makes weed control in rice more difficult than in
upland or lowland rice. The outcome of weed competition depends on factors
such as duration and onset of crop-weed association, density, proportion, and
architecture of weeds and crop, and the competitive ability of specific weeds
competing with the crop.
The other component of interference is allelopathy, which involves
inhibitory effects of chemicals released by a donor plant. Fuerst and Putnam
(1983) pointed out that few studies, if any, have definitively separated the
components of weed interference because of the complexity of this
phenomenon. Nevertheless, attempts have been made in this thesisresearch to investigate the possible involvement of competition and chemical
interference in rice-weeds association on hydromorphic soils.
Specific objectives are to:
1. determine the critical period of weed interference.
2. assess the efforts of weed density on rice growth.
3. evaluate the allelopathic potential of selected weed species.

27MATERIALS AND METHODS
Field and screenhouse experiments were conducted from June
1986 to November 1987 at the International Institute of Tropical Agriculture
(IITA), Ibadan, Nigeria (7029'N, 3045'E), a location with subhumid tropical
climate. Fields were irrigated whenever necessary during the dry season to
supplement residual soil moisture in the hydromorphic soils. Weed seeds
used for these studies were collected periodically from plants occuring on
hydromorphic soils at IITA.
Land preparation was accomplished by rotovating the field twice
before seeding rice. In each of the field experiments , a compound fertilizer
(15-15-15) was applied at the rate of 30 kg ha-1 each of N, P and K at rice
planting. Additional nitrogen was applied as urea at 4 and 8 weeks (30 kg
N ha-1) each time after sowing rice.
All the screenhouse experiments were conducted using plastic pots
(perforated at the base) filled with sieved greenhouse soil. Full strength
Hoagland's nutrient solution (Hoagland and Arnon, 1950) was provided asneeded. Pots were kept moist throughout the experiment by sub-
irrigation. Specific details of each experiment follow.
Experiment 2.1. Critical period of weed interference.
Two experiments were conducted to determine the critical period
for weed control in rice (Oryza sativa L.). The first experiment was
established during the 1986 rainy season. The field had been in a short-
duration fallow prior to the experiment. The field was first sprayed with
glyphosate (N-phosphonomethyl glycine) at the rate of 2.8 kg ha-1 to
suppress perennial weeds. Tillage followed 3 weeks after spraying.

28Rice seeds (var. ITA 306) were drilled by hand at the rate of 50 kg
ha-1 with 25cm spacing between rows. Two weeks after emergence rice
seedlings were thinned to maintain approximately 20 cm spacing within
rows. Two sets of weeding treatments were used (Dawson, 1970):
a) Maintaining weed-free periods for 0, 2, 4, 6, or 8 weeks afterrice emergence (WAE), followed by not weeding each of these
treatments until harvest.
b) Allowing natural weed population to grow for 0, 2, 4, 6, or 8 WAE
followed by keeping the plots weed-free until harvest.
Two additional hand weeding treatments included in this study
were weeding twice 2 and 6 WAE and at 4 and 8 WAE. Weeding was done
by frequent hand pullings.
The experiment was conducted as a randomized complete block
design with four replications. Plot size was 3 by 5 m. Rice in these plots
was sprayed two times at 15-day intervals with benomyl [methy11-
(butylcarbamoy1)-2-benzimidazole carbamate] at 1.0 kg a.i. ha-1 to control
rice blast. The experiment was repeated in the dry season of 1987
(January-April) on another hydromorphic soil. A few modifications to the
1986 experiment included replacing the ITA 306 rice variety with ITA 222
which is blast tolerant. The two hand weeding treatments were substituted
with keeping one plot weed-free for 1 WAE, and keeping another plot
unweeded for 1 WAE. This field had only a few perennial weeds present
at the time of land preparation and was not sprayed with a preplantherbicide.
Data collection and analyses.
Time of emergence and growth stages of the crop and weeds were
recorded at the beginning of the growing season. Rice plant height, tiller

29number, and panicle number were recorded at harvest. Mature rice was
hand harvested from a 2 by 3 m center quadrat in each plot and the grain
was threshed for yield determination based on grain weight adjusted to
14% moisture.
Weeds were counted and dry weight determined 10 weeks after
rice emergence (WAE) and at crop harvest. Data were obtained from two
25 by 50 cm quadrats per plot taken from an area outside that from which
yield data where to be collected. The above-ground portion of weeds
within the same quadrats, were clipped, oven dried at 800C for 48 h,separated by species, and weighed for dry weight determination.
Analysis of variance was conducted on the different parameters
measured on each evaluation date. Mean separation was performed
where applicable using Duncan's Multiple Range Test (DMRT) at 5%probability level. The two sets of treatments (weed-free maintenance and
unweeded periods) were subjected separately to regression analysis.
Experiment 2.2. Growth analysis.
Rice, jungle rice [Echinochloa colona (Linn.) Link], and wildpoinsettia (Euphorbia heterophylla Linn.) were grown in pots in thescreenhouse to study their growth and development. Six rice seeds (var.
ITA 222) and 10 seeds of each weed species were planted in plastic pots
which had a diameter of 17.8 cm. Five days after emergence, the plants
were thinned to 1 plant of each species per pot. The pots were replicated
20 times and arranged in a randomized complete block design.
Data collection and analyses.
Destructive samples were taken four times from each of the four

30replicates at 2, 4, 6, and 8 weeks after emergence (WAE). The fifth set of
four replicates was maintained for the last harvest at weed maturity. During
growth measurements, plants were ranked from smallest to largest.Plant height was measured at each sampling date. The number of
tillers and branches was also recorded. Shoots were removed at soil level
and washed. Leaf area per plant was determined at each harvest using a
Licor leaf area meter, model LI-3000. Dry weight data were collected asdescribed in the previous experiment. The biomass of roots was measured
only during the first two samplings, because separation of roots from the
soil was difficult in later samplings. Soil was washed from the roots of each
plant before separating shoots from roots.
Growth analysis formulas were used to derive parameters such as
absolute growth (G) for a given time period, relative growth rate (RGR), leaf
area ratio (LAR), net assimilation rate (NAR), and root/shoot ratio (R/S).
These parameters were calculated with the instantaneous values from
growth analysis formulas of Radford (1967) and Patterson (1982).
Absolute growth was expressed as weight (W) increase over time (t)(Radford, 1967):
G = (W2-W1)/(t2-t1) (3)
The relative growth rate was calculated from the natural log of
weight increase over time using the following equation (Patterson, 1982):
RGR = (InW2-InW1)/(t2-t1) (4)
where W1, W2 are the dry weight at beginning and at end of harvest

31
interval; t1, t2 are time of harvest (days). This equation determines the
weight increase relative to the size already attained (W1). The leaf area
ratio (LAR) which is a component of RGR was calculated on the basis of the
leaf area per unit dry matter produced. The net assimilation rate (NAR)
characterizing the efficiency of production of new material per unit leaf area
that is present, was calculated from the following formula (Patterson, 1982):
NAR = (W2-W1/T2-T1)(InA2-InA1 /A2-A1) (5)
where A1, A2 are leaf area at beginning and end of harvest interval.
Root/shoot ratio was calculated as the ratio of below-ground to above-
ground biomass produced. Dry matter production for each species was
determined from the above-ground portion of the plants at final harvest.
Analysis of variance of the growth parameters was conducted at each
sampling date. Means were separated by DMRT, at 5% probability level.
Experiment 2.3. Competitive influence of monospecific weed densityon rice.
This experiment was conducted to assess the influence of two weed
species, jungle rice and wild poinsettia, on rice (var. ITA 306) using an
additive approach (Harper, 1977). The experiment was established
outdoors. About 10 seeds of each plant species were planted in 25.4 cm
diameter plastic pots. Seedlings were thinned to desired densities (Figure
2.1) at one week after emergence. Weed densities were two, four, and six
plants per pot, which are equivalent to 40, 80, and 120 plants m-2,

32respectively, under field conditions. The treatments consisted of an
individual rice plant grown alone or in association with two, four, or six
plants of jungle rice or wild pinsettia (Figure 2.1). The experimental design
was a randomized complete block design with 10 replications.
Data collection and analyses.
Destructive sampling was done at the tillering stage, 6 weeks after
emergence (WAE), with one set of five replicates. Number of tillers, leaf
area, and dry weight of shoots were determined. The plants were cut at soil
level and oven dried as stated earlier. Another set of five replicates was left
to grow until 12 WAE. Dry weight of each species was determined.
Analysis of variance was performed with two binary associations
(rice-jungle rice) and (rice-wild poinsettia), and dry weight of individual rice
plants were related to density of each weed species using regression
analysis.
Experiment 2.4. Allelopathic potential of selected weed species.
An experiment was conducted in a screenhouse to assess
allelopathic potential of selected weed species that grew with rice on
hydromorphic soils using 11.4 cm diameter plastic pots. Top soil used for
this study was collected to a depth of 15 cm from each of the sites on which
uniform stands of the following weeds grew in monoculture: Echinochloa
colona, Euphorbia heterophylla, Cyperus difformis and Fimbritylis littoralis
Soils from each weed site were used to fill four plastic pots (diameter 11.4
cm), one for each soil collection. Another set of four pots were filled with
greenhouse soil (top soil taken from a tropical forest) and used as a control
treatment. Fifteen rice seeds (var.ITA 222) were planted in each pot. There

33were five treatments (including the control) in this study and these were
arranged in a randomized complete block design with four replications.
Height of all rice seedlings in a pot was measured at 3 WAE beforeseedlings were thinned to five plants of uniform stage of growth.
In a related study, concentrations of leaf aqueous extracts of the
same species were also tested for effect on germination, shoot and radicle
length of rice and cowpea (a species sensitive to growth inhibitors) grown in
petri dishes. The dried materials (20g of each weed species) were soaked
in 200 ml distilled water for 2 hrs and filtered using Whatman No.1 filter
paper to obtain an aqueous extract concentration that is described here as
full strength. Different concentrations of the various weed leaf extractswere diluted to obtain additional concentrations of 1/20 and 1/40 by
adding 10-m1 extracts to 200 and 400m1 of distilled water, respectively.
Seeds/test solutions (8 ml/petri dish) were incubated in a germinatorchamber with a light/dark (12/12 hrs) cycle and temperature regime (250C)
optimum for germination. Distilled water was used for moistening seeds ofcontrol treatments.
Data collection and analyses.
Rice germination was monitored at 3, 5, and 7 days after sowing
(DAS) in the screenhouse. Plant height measurements (five plants per pot)
were done at 4 WAP and harvested to determine the fresh weight of shoots
and the data were analysed statistically. Percent germination, and radicle
and shoot length of rice and cowpea were recorded at 3 days and 1 WAP
and data obtained were analysed statistically.

34RESULTS AND DISCUSSION
Experiment 2.1. Critical period of weed interference
Rice and weeds emerged at about the same time, 1 week afterplanting (WAP). Two weeks after emergence (WAE), weeds were at 4-6
leaf stage, while rice had 6 leaves. The major weed species in this field
were Fimbristylis littoralis Gaudet, Cyperus iria Linn., C. difformis Linn.,
Echinochloa colona (Linn.) Link., Leptochloa caerulescens Steud.,Eleusine indica Gaertn., Ageratum conyzoides Linn., and Pentodonpentandrus (Schum & Thonn.) Vatke. Although recently developed lands
are said to be relatively free of jungle rice (Swain, 1973), this plant occurred
frequently on the experimental site. However, its frequency was less than
that of L. caerulescens and sedges, especially at harvest, mainly because
of its shorter life cycle. The observation on frequency of each species was
based on the number of individuals of each weed species in the different
plots, before the weeds were pooled together for total weed density and dry
weight. Tillering started in jungle rice at 2 WAE and at 3 WAE for rice.
Weed growth was significantly influenced by the treatments (Table2.1a). At 10 WAE, weed growth was significantly reduced in plots keptweed-free for at least 4 weeks as compared to weed growth in unweededplots. Extending weed-free periods beyond the 4th week did not reducedweed growth significantly. Weed density and dry weight of the 2-weekgrowth period (from the 8th to the 10th WAE) were similar to when weeds
were allowed to grow for 6 weeks (from the 4th to the 10th WAE). At
harvest, weed growth was reduced only in plots kept weed-free for 6 WAE.
This suggests that when the weed-free period was shorter, weeds

35reappeared and grew actively until harvest. This is why initial weeding for 2
weeks was not effective in preventing yield loss since weed competition
begins early enough to damage the crop. The frequent soil disturbance
during weeding operations may have favored germination of more weed
seeds that were allowed to germinate and the plants to grow for a longerperiod.
Weed species in the dry season experiment were similar to those in
the previous trial, except that Ludwigia octovalvis (Jacq.) P. Raven was
present instead of Leptochloa caerulescens . Fimbristylis littoral's and rice
plants emerged at the same time (4 days after planting). At 6 WAE, most
weed species had reached flowering stage, while rice had produced 4 to 6tillers. In this experiment weed population was much higher (Table 2.2a)
than in the previous experiment (Table 2.1a), which did not receive any
rainfall from planting to early tillering stage. The dry season experiment
was irrigated and therefore had adequate moisture for good cropestablishment. At 6 WAE, weed pressure was lowest in plots keptweed-free until the 4th week. As in the previous trial, extending the
weed-free period beyond the 6th WAE did not reduce the number, and dryweight of weeds.
Rice grain yield was significantly increased when rice was keptweed-free for the first 2 WAE in the wet season (Table 2.1b), and the first 6
weeks in the dry season (Table 2.2b). Despite the higher weed density
and biomass, rice yields were much higher in the dry than in the wet season
study. This is probably because a higher solar radiation occurs in the
lowland tropics during the dry season than during the wet season. The
negative role of low solar radiation on rice yield during the rainy season in
West Africa has previously been reported by many workers (Posner, 1978;

36Lawson, 1980; IITA, 1982). Late weeding, after the 6th WAE did not reduce
significantly the detrimental effects of weeds on rice grain yield and yield
components. This observation was probably because rice plants could not
recover from the negative effect of early weed interference. Most of the
weed species had reached the flowering stage (6 WAE) when rice was still
tillering. There was a tendency for the rice plants to produce as many
panicles as tillers in plots kept weed-free for different periods. Uncontrolled
weed growth reduced rice grain yield by 72.5% in 1986 and 58.2% in 1987
(Tables 2.1b and 2.2b). Weeds significantly reduced tillering and number of
panicles in rice. Keeping rice crop weed-free for 6 WAE was necessary to
minimize weed-related grain yield loss and reduction in yield components.
When rice was weeded at 2 and 6 WAE, grain yield was similar to yield from
plots kept weed-free until harvest. These results suggest that most
intensive weed growth occurred between the 4th and 6th weeks after crop
emergence.
Regression analysis on rice grain yield, and weed density and
biomass indicates that the rate of change in rice grain yield is better
described by the equation with weed biomass as the independent variable
(Figure 2.2). The linear relationship was described with a coefficient of
determination of 0.77. There are two possible explainations to the low
value (0.22) of this coefficient between yield and weed density. Either the
assumption of linearity is incorrect or there are some factors other than
density affecting grain yield. Several others (Hill and Santelmann, 1969;
Noda, 1973; Chubb and Friesen, 1985) have pointed out that the extent of
crop loss due to weeds depends on factors that include not only density but
also species, duration of weed competition and growth, size, and
distribution of weeds. Rice grain yields were related to the duration of weed

37competition (Figure 2.3). The variations in grain yield were best described
by a second and third degree polynomials for plots left unweeded and
weed-free for a certain period of time, respectively. Weed-free for only 1 or
2 WAE was not sufficient enough to improve yields. To obtain high yields, it
was necessary to remove the weeds from the 2nd to 6th WAE, thereafter, no
yield increase was observed. Substantial yield reductions occured when
weeds were allowed to compete with rice during the first 4 weeks after crop
emergence.
The detrimental effect of early weed presence is not offset by
keeping the crop weed-free later in the season, especially if the weed-crop
association, occurs when the crop is sensitive to weed competition. Weed
removal later in the growing season does not benefit the crop. In both
experiments, extending the period of weed removal beyond the 6th week
did not increase significantly rice yields in this study. These results suggest
an existence of a critical period (2-6 WAE) of weed interference with rice
grown on hydromorphic soils which may vary with seasons andenvironmental conditions. It is during this period that rice plants produce
majority of tillers that later leads to optimal crop productitity. Swain et al.,
(1975) reported that rice yield reduction due to weeds was more
pronounced when competition took place during the pre-tillering and
tillering stages of its growth. Results of this study are consistent with these
observations.
Experiment 2.2. Growth Analysis
Both weed species emerged 3 to 5 days before rice. Wild poinsettia
(Euporbia heterophylla) emerged 3 days after planting, while jungle rice,

38also called jungle rice (Echinochloa colona), emerged 2 days later. Rice
plants were taller than the two weed species initially, but neither grass
species was significantly taller than wild poinsettia for the first 2 WAE(Figure 2.4). Jungle rice and rice grew taller than wild poinsettia 4 WAE,
suggesting that competition for light may not be critical in a rice/jungle rice
association during this early growth period. From the 4th WAE the sharpest
increase in plant height was observed with jungle rice and wild poinsettia.At 8 WAE, rice plants were significantly shorter than either of the weedspecies. Root/shoot ratios of the three plant species were not significantly
different from one another. In a related experiment (Experiment 3.1), the
root biomass of individual plants of rice and jungle rice were similarly
greater than that of wild poinsettia (Figure 2.7). This observation suggests
that, when these species are grown together, below-ground competitionfor water and nutrients could be more intensive in mixtures of rice and
jungle rice than rice and wild poinsettia.
Jungle rice produced more tillers than rice when both were grown
separately in pots under identical conditions. Although shoot length was
the same in both jungle rice and wild poinsettia, the latter, because of its
upright growth habit, had greater canopy development than jungle ricewhich has decumbent tillers. Consequently, jungle rice plants couldinfluence rice growth if both are grown in close proximity.
The efficient use of environmental resources by rice plants at the
begining of the growing season is reflected in its high NAR (Table 2.3). Atthis period, rice plants required the least amount of leaf area to produce a
unit of dry matter. This observation is supported by the negative correlation
found between leafiness and competitiveness for four species in theCentral Valley of California, a region of high temperature and light intensity

39(Roush and Radosevich, 1985). The LAR of wild poinsettia was notsignificantly different from that of jungle rice. Variations in NAR values
occurred only between the second and fourth weeks after emergence. Riceand jungle rice were the most efficient producers of new plant materials per
unit leaf area. Significant differences in NAR were observed between the
second and the fourth WAE. This period falls in the critical period of weed
control noted in the previous experiment 2.1.
The increase in absolute growth was similar in both weed species (Figure
2.5). Their response curves were sigmoidal over an 8-week growth period
while that of rice had not reached equilibrium at 8 WAE. Between the 2nd
and 6th weeks, both weeds had a sharp increase in their absolute growth
before leveling at 8 WAE. Rice grew fastest between the second and thefourth week, while jungle rice had an absolute growth (G) that was
significantly greater than those of rice and wild poinsettia in the periodbetween 4 and 6 WAE (Table 2.4). This indicates that both weeds grew
rapidly at a period (4 to 6 WAE) when rice seedling growth was slow. Thus,
each of the weed species could be more competitive with rice if the crop
and weeds were associated at that stage of rice development. The twoweed species apparently can utilize environmental resources before the
period of rapid growth is reached by rice plants.
Experiment 2.3. Competitive influence of monospecific weed densityon rice.
At a population as low as 2 weed plants/pot, jungle rice
suppressed the growth of rice (Table 2.5). At 6 WAE and at harvest, jungle
rice caused significant reductions in all parameters of rice growth. Under
field conditions, this density of 2 plants per pot corresponds approximately
40to 40 plants m-2. At this density, competition from jungle rice can result in
73, 63, and 76% reduction of leaf area , rice tillers, and dry weight of
individual plants, respectively (Table 2.5). At harvest, similar trends were
observed but the effects were more pronounced. The tiller number and dry
weight of rice were reduced by 73-84% and 54-87 %, respectively.
Increase in density of jungle rice from 2 to 6 plants per pot did not cause
significant reduction in rice growth.
Rice was not significantly affected at 6 WAE by wild poinsettia at
densities of 2, 4, and 6 plants/pot (Table 2.6). The leaf area, number of
tillers, and dry weight of rice varied slightly with increased density of wild
poinsettia as compared to the rice plant grown alone. The presence of wild
poinsettia caused only 24-33% reductions in tiller number and 18-35% in
dry weight at harvest. The weed-free rice produced more tillers and dry
matter than with either weed species at any density.
These observations indicate that rice performance is influenced
when grown in association with either weed species. Although competition
from 2 plants of wild poinsettia caused significant reductions of the number
of rice tillers (Table 2.6), the dry weight of rice was significantly affected only
when its density was 6 plants m-2. The effect of wild poinsettia was less
pronounced than jungle rice (Figure 2.6). The rate of decrease in dryweight of individual rice plants was greater in the rice-barnyardgrass (-17.8,
R2=.988, p=0.006) than in rice-wild poinsettia association (-6.2, R2=.919,
p=0.04).
These results suggest that jungle rice may have subjected rice to
greater below-ground competition than wild poinsettia which did not
produced enough roots to compete with rice early in the growing season
(Figure 2.7). However, this species could allocate resources for the

41
production of a canopy that could have affected rice growth later in the
season.
The results support the observations under field conditions, where
jungle rice showed greater competitiveness than wild poinsettia when
associated with rice plants. Tiller number, leaf area, and dry weight of
weeds were negatively correlated with the rice dry weight. The effect of
the tiller number of jungle rice was the greatest (r=-0.685).
There was a highly negative correlation of tiller or branch number
and dry weight of weeds with tillers and dry weight of rice. The number of
tillers was most affected (86.7 and 64.0% for jungle rice and 50 and 64%
for wild poinsettia). Because of its rapid growth, jungle rice had the ability to
use available resources more efficiently and produced a large number of
tillers, thus preventing rice from doing so.
In the rice-wild poinsettia association, competition took place at a
later stage and because more resources (space, water, and nutrients) were
available early, rice formed large number of tillers before wild poinsettia
produced branches. The below-ground competition had taken place
earliest in the rice-barnyardgrass association because both species have
the ability to produce voluminous root system as compared to wildpoinsettia.
There was an indication that jungle rice competition affected rice
yield through the reduction of tiller production (Table 2.5). In the other
experiments (Chapter III), jungle rice had started to produce tillers 2 weeks
before rice. Wild poinsettia may have been affected by intraspecific
competition. However, it is difficult to separate the confounded effects of
intra- and interspecific competition in this experiment. Further increase in
density of both weed species did not significantly affect rice growth (Tables

422.5 and 2.6). The confounded effects not only affects the outcome ofcompetition, but also influences the interpretation of the results (Harper,
1977; Radosevich, 1987), especially if conclusions on the competitiveness
of rice against each weed species are made. Nevertheless, there is an
indication that increasing the density of jungle rice had a detrimental effect
on rice growth at 6 WAE and at harvest. Wild poinsettia had a significant
effect on rice only at harvest. Results from the growth analysis experiment
suggest that jungle rice had a significantly greater absolute growth (Figure
2.5) and relative growth rate (Table 2.4) than rice during the period of 4 to 6
weeks after crop emergence. These data indicate that jungle rice should
not be allowed to compete with rice from the seedling stage to tillering.
Provided that water and nutrients are not limiting, rice overcame the effects
of competition from wild poinsettia at densities as high as 40 plants m-2.
Experiment 2.4. Allelopathic potential of selected weed species.
None of the weed species tested for allelopathic propertiesaffected the germination of rice. The addition of nutrient solution may
have excluded the effects that could have resulted from competition for the
essential element and water, although hydromorphic soils are fertile by
nature. Under such conditions, the concentration of inhibitory compounds
may not be high enough to affect germination of rice seeds. Rice (1984)
pointed out that drought and nutrient deficiency had a synergistic effect on
the concentration of chlorogenic and isochlorogenic acids. Such factorsincrease concentrations of inhibitors.
The observations on seedling growth revealed a possibleallelopathic effect of Fimbritylis littoralis . (Table 2.7). At 3 weeks after
planting (WAP), plant height was significantly lower when rice was grown

43on soil where this species was growing alone. The other weed species had
less pronounced effects. The fresh weight of shoots at 4 WAP followed a
similar pattern. The others species had a slight effect on both parameters
measured. Although the differences were significant compared to the
control when rice was grown on greenhouse soil, this may not necessarily
be an effect of allelopathic substances that would be released under
natural conditions. As mentioned by Rice (1979), any plant extract may
have an effect on plant growth, depending on its concentration. Einhellig
(1986) indicated that the concentration of phytotoxins also is affected by
age of the plants and the persistence of the chemical compound once
released into the environment, since they can be subject to inactivation and
chemical or microbial degradation.
The laboratory experiment on germination, shoot, and radicle
length of rice and cowpea showed the greatest effect on the latter. All
plant aqueous extracts used, inhibited shoot length of cowpea 1 week after
planting at the high concentration (10%) (Table 2.8). Shoot growth of rice
was reduced by extracts from wild poinsettia and C. difformis . The lowest
concentration of extracts did not have an effect on shoot length of rice.
However, a more pronounced stimulatory effect was observed on the shoot
length of cowpea that received the different extracts. At low concentration,
these extracts stimulated shoot growth of both test species, which means
that they may have acted as auxin compounds and, therefore, may inhibit
growth at much higher concentrations. This growth-stimulating property of
sublethal doses (hormesis) of auxin-type compounds on plants
has been reported by Wiedman and Appleby (1972), Ries (1976), Einhellig
(1986), and Putnam and Tang (1986).
These observations suggest that there must be some phytotoxins
present in the different extracts used. Less effects were observed on radicle

44length of the two test species (Table 2.9). Cowpea was not significantly
affected by any of the plant extracts. The greatest inhibition of rice was
caused by the highest concentration of the extracts obtained from wild
poinsettia. Lower concentrations of the different extracts also stimulated
the radicle length of both rice and cowpea.
A certain level of interference of the selected weed species with rice
through chemical means is obvious. However, more research is needed for
a better understanding of the nature of weed interference in rice grown on
hydromorphic soils. Higher concentration of the extracts will be required to
show clearly the allelopathic potential of each of the weed species. For
these results to be conclusive, toxic substances must be isolated from the
suspected species and prove to cause symptoms similar to those previously
diagnosed. Fuerst and Putnam (1983) pointed out that the isolation of a
toxic substance is the first step in obtaining direct evidence that the
interference which such plant species is due to a chemical. However, the
isolation of toxic substances in the form they exert their action in nature is a
very difficult process.

45
Figure 2.1. Planting design of an additive scheme with rice ( x ), jungle rice( o ), and wild poinsettia ( )

46
5500.
5000.
4500,
4000.
3500
1000
2500
200012
5500
5000,
4500.
4000,
3500
3000
2500
2000
15 20 25 30
Weed density (No.m-2)35 40
2 4 e
Weed dryto 12 1i
weight (g m-2)14 1
Figure 2.2. Linear relationships between rice grain yield and weed density;rice grain yield and weed dry weight at harvest.

47
4-4 5500a
5000.tr
O0-- Y = 5371.74 - 909.75x + 73.00x2, P2= .8712441.427 431.723x + 287.098x2 24.161x3 R2. .984Y"
4500.11.--4
w 4000.4 4-4 i
Weed-free
3500.
fa
N... Vr
w 3000.
wu 2500..L___r
a1
Unweeded2000
T , T .0 1 2 3 4 5 6 ; 8 9
Time (weeks after emergence)
Figure 2.3. Relationships between duration of weed competition and ricegrain yield. IITA, 1987 (dry season).

1104
loo.
Go.
80.a) 70,
ro 60
Q. 50
40
30
20
RiceJungle rice
r Wild poinsettia
3 4 5
Sampling date(weeks after emergence)
7
Figure 2.4. Plant height at different sampling dates.
V
48

A Rice 0Jungle rice Wild poinsettia& .
49
3 4 5 6
Growth period(weeks after emergence)
7 9
Figure 2.5. Absolute growth of rice, jungle rice, and wild poinsettia atdifferent growth periods.

y -6.187x 38.199, R-squred: .9190-- y a -17.772x 37.103, R-squared: .988
0 .2 .4 6 .8 1 1.2 1.4 1.6
Weed density, x (In of 1+x)
18 2
50
Figure 2.6. Rice dry weight as influenced by density of jungle rice or wildpoinsettia at harvest.

Wild poinsettia Jungle rice Rice
51
Figure 2.7. Root growth of wild poinsettia, jungle rice, and rice at 4 weeksafter emergence.

52
Table 2.1a. Effect of weeding on weed growth at 10 weeks after emergence (WAE) and atharvest. IITA, 1986 (rainyseason).
Weeksafter riceemergence
10 WAE At harvest
Weed density(No.hr2)
Weed dry weight(g m-2)
Weed density(No.m-2)
weed dry weight(g m-2)
Weed-free l0 29.6a2 23.1 a 15.9 ab 7.7 ab
2 25.8 a b 15.8 a 18.1 a 8.6a
4 18.4bc 3.3 b 11.0 bc 4.2 bc
6 11.3cd 1.3 b 75c 1.8c
8 9.6 cd 1.3 b 8.7c 2.2c
2 and 6 12.3 c d 2.3 b 9.8 bc 2.0 c
4 and 8 6.9 d 1.4 b 8.0C 2.8c
cv% 41.6 51.4 38.7 57.8P-value < .001 < .0001 .01 < .01
1 Plots maintained weed-free for a certain period of time (weeks after emergence) and thenleft unweeded until harvest.
2 Means (square root transformations) in each column followed by the same letter (s) are notsignificantly different by the Duncan Multiple Range Test (DMRT).

53
Table 2.1b. Rice yield components as affected by weeding. IITA, 1986 (rainy season).
Weeks1after riceemergence
Grain yield, kg ha-1 Tillers, no.plant-1 Panicles, no.plant-1
weed-free unweeded weed-free unweeded weed-free unweeded
0 514a2 1873a 4a 9b 4a 8a
2 1226b 1771 a 6ab 8 b 6ab 7 a b
4 1315 b 1665 a b 8c 9b 8c 8a
6 1503 b 2180a 9c 8b 9c 8a
8 1729 b 1308 b 8 c 7 a 8 c 6 b
2 and 6 1679 b 1679 ab 9c 9b 9c 9a
4 and 8 1471 b 1471 b 9c 9b 9c 9a
cv% 23.3 19.1 16.8 11.6 15.9 14.3P-value < .001 .05 < .001 .01 < .001 .01
1 Plots maintained weed-free or unweeded for a certain period of time (weeks afteremergence) and then left unweeded or weed-free until harvest.
2 Means in each column followed by the same letter (s) are not signifi cantly different bythe Duncan Multiple Range Test (DMRT).
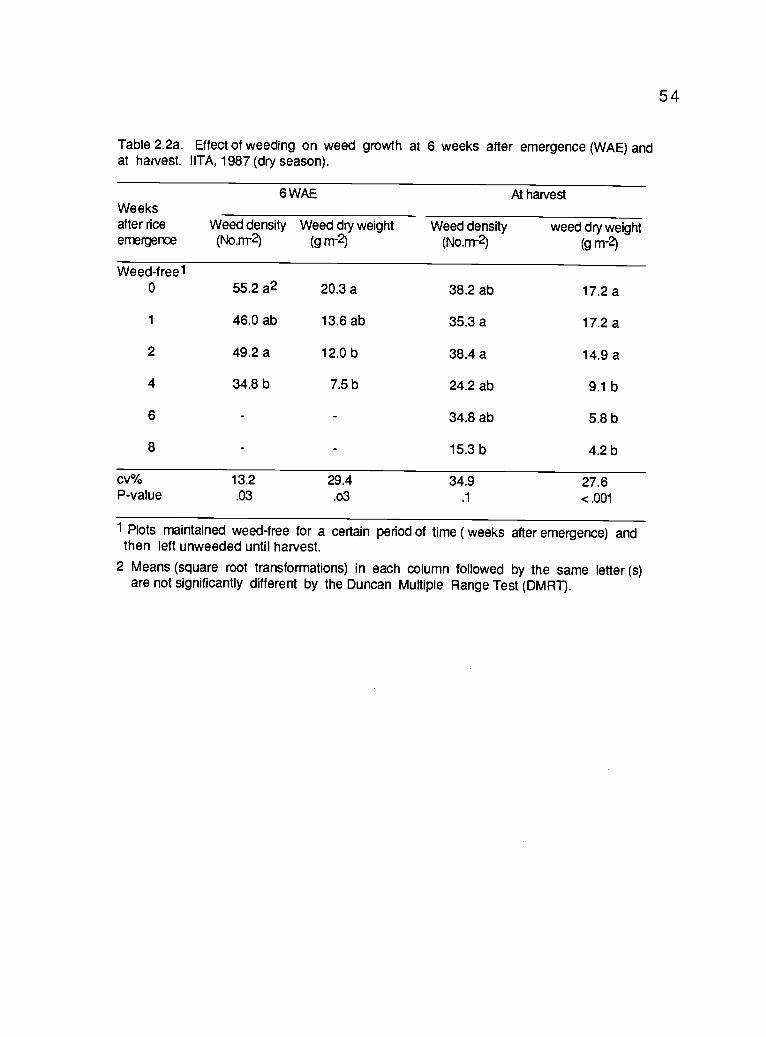
54
Table 2.2a. Effect of weeding on weed growth at 6 weeks after emergence (WAE) andat harvest. IITA, 1987 (dry season).
Weeksafter riceemergence
6 WAE At harvest
Weed density(No.m-2)
Weed dry weight(g m-2)
Weed density(No.m-2)
weed dry weight(g m-2)
Weed-free10 55.2 a2 20.3 a 38.2 ab 17.2 a
1 46.0 ab 13.6 ab 35.3 a 17.2 a
2 49.2 a 12.0 b 38.4 a 14.9 a
4 34.8 b 7.5 b 24.2 ab 9.1 b
6 34.8 ab 5.8 b
8 15.3 b 4.2 b
cv% 13.2 29.4 34.9 27.6P-value .03 .o3 .1 < .001
1 Plots maintained weed-free for a certain period of time ( weeks after emergence) andthen left unweeded until harvest.
2 Means (square root transformations) in each column followed by the same letter (s)are not significantly different by the Duncan Multiple Range Test (DMRT).

55
Table 2.2b. Rice yield components as affected by weeding. IITA, 1987 (dry season).
Weeks1after riceemergence
Grain yield, kg ha-1 Tillers Parides(No./L. meter)2
weed-free unweeded weed-free unweeded weed-free unweeded
0 2446 bc3 5856 a 62 b 86 a 49 c 81a
1 2161 c 4078 b 61 b 80 ab 57 be 75 ab
2 2759 be 3541 be 73 ab 81 ab 67 abc 75 ab
4 3545 b 2907 be 77 ab 73 ab 75 ab 73 ab
6 5096 a 3108 be 82 ab 64 b 78 ab 59 b
8 4961 a 2479 c 89 a 61 b 81 a 54 b
cv% 23.3 19.1 16.8 11.6 15.9 14.3P-value < .001 .05 < .001 .01 < .001 .01
1 Plots maintained weed-free or unweeded for a certain period of time (weeks afteremer-gence) and then left unweeded or weed-free until harvest.
2 Number per linear meter row.
3 Means in each column followed by the same letter (s) are not significantly different byDMRT.

56
Table 2.3 Mean values of LAR and NAR for rice, jungle rice, and wild poinsettia. IITAJanuary 1987.
Leaf area ratio (LAR)(cm2 g2)
Net assimilation rate (NAR)(g dm-2 day-1)
Species 2-4WAE1 4-6WAE 6-8WAE 2-4WAE 4-6WAE 6-8WAE
Rice 281.6 200.3 a2 133.0 a 69.5 a 218.4 437.7
Jungle rice 532.8 130.5 b 81.8 b 50.6 ab 334.6 425.7
Wild poinsettia 356.9 155.0 b 91.0 b 40.8 b 253.7 386.9
CV% 48.0 11.3 23.1 20.8 30.4 26.8P-value ns .004 .04 .02 ns ns
1 WAE = weeks after emergence.2 Means in a column followed by the same letter (s) are not significantly different by
DMRT.
Table 2.4. Relative growth rate of rice, jungle rice, and wild poinsettia at different growthperiods. IITA, January 1987.
Growth periodSpecies 2-4 4-6 6-8
Rice .056 .050 .123Jungle rice .052 .122 .052Wild poinsettia .049 .078 .062
CV% 18.2 15.8 29.0P-value .001 .001 .01Lsd .05 .006 .02 .05

57
Table 2.5. Rice growth as influenced by jungle rice density. IITA, 1987.
Weed density(plants/pot)
Rice leaf area(cm2plant-1)
Rice tillers
(no. plant-1)Rice dry weight
(g plant-1)
6 WAE1 Harvest 6 WAE Harvest
0 589.0 a2 16a 30a 5.9a 38.0a
2 177.5 b 6b 8b 1.4 b 17.3b
4 133.8 b 6 b 7b 1.9 b 6.8b
6 121.9 b 5 b 5b 1.1 b 4.8b
CV% 27.3 15.1 19.4 40.3 25.2P-value <. 0001 < .0001 < .0001 <.01 < .001
1 WAE= Weeks after emergence.
2 Means in a colomn followed by the same letter (s) are not significant by DMRT.

58
Table 2.6. Rice growth as influenced by wild poinsettia density. IITA, 1987.
Weed density(plants/pot)
Rice leaf area
Rice tillers
(no Plartl)Rice dry weight
(g plant-1)
(c n2 plant-1) 6 WAE1 Harvest 6 WAE Harvest
0 589.0 16 30 a 3.9 38.0 a
2 635.8 16 23 b 4.4 31.0 ab
4 623.0 15 22 b 4.5 30.4 ab
6 594.3 15 20 b 4.1 24.6 b
Cv% 35.8 7.5 18.5 22.1 25.2P-value ns ns < .001 ns .002
1 WAE = Weeks after emergence.
2 Means in a column folowed by the same letter (s) are not significant by DMRT.

59
Table 2.7. Allelopathic effect of selected weed species on plant growth. IITA, August 1987.
Soil sample frommonocultures of weeds Rice plant height, cm Rice fresh weight, gl5plants
E. colona 17.0 13
E. heterophylla 18.1 18
C. difformis 19.9 1.7
F. littoralis 11.5 05
Greenhouse soil(control)
22.2 3.0
CV% 9.4 9.4Lsd .05 2.5 .7

60
Table 2.8. Effect of plant aqueous extracts on shoot length (cm) of rice and cowpea. IITA, August1987.
Rice Cowpea
Concentration
Treatment 1/10 1/40 1/10 1/40
E. colona 4.4 ab1 5.4 3.3 b 9.0 ab
E. hetrophylla 3.5 b 5.4 2.3 b 10.3 ab
C. difformis 3.6 b 5.1 3.2 b 11.1a
F. litoralis 3.9 ab 5.1 3.5 b 6.1 b
Distilled water 4.8 a 5.1 8.1 a 9.4 ab
CV% 17.1 4.8 28.1 26.2P-value <.1 ns <.01 <1
1 Means in a column followed by the same letter (s) are not significantly different by DMRT.

61
Table 2.9. Effect of plant aqueous extracts on radicle length (cm) of rice and cowpea. IITA,August 1987.
Rice Cowpea
Concentration
Treatment 1/10 1/40 1/10 1/40
E.colona 6.4 a1 7.6 ab 3.8 6.8
E. heterophylla 4.3 b 8.5 a 3.3 6.2
C. difformis 6.2 a 6.8 b 4.7 6.6
F. littoral's 5.7 ab 7.2 b 5.1 7.6
Distilled water 7.0 a 6.9 b 5.4 5.6
CV% 18.2 7.9 36.6 28.7P -value < .1 < .1 ns ns
1 Means in a column followed by the same letter (s) are not significantly different by DMRT.

62Chapter III.
GROWTH AND COMPETITIVE RELATIONSHIPS OF RICE,JUNGLE RICE, AND WILD POINSETTIA AS INFLUENCED
BY PLANT DENSITY AND PROPORTION
INTRODUCTION
In plant communities, competition occurs both between plants of
different species, and between individuals of the same species. In
competition studies the effects of intraspecific and interspecific competition
are often confounded, and this makes the interpretation of the relative
effects of both types of competition difficult (Harper,1977; Zimdahl, 1980;
Spitters, 1983; Jolliffe et al., 1984; Connolly, 1986). To separate these
effects it is necessary to grow a range of densities of each of the species
involved, in monocultures and in mixtures as well (Jolliffe et al., 1984;
Connolly, 1986).
The relative competitive ability of weeds in crops may be influenced
by crop density. Thurston (1962) and Carlson and Hill (1985) demonstrated
that increasing crop density decreased weed growth and yield losses due
to weed competition. The following experiments were carried out to
examine in greater detail the competitive relationships described in chapter
II between rice and associated weeds.

63MATERIALS AND METHODS
Experiment 3.1. Influence of plant proportion and density on competitiverelationships between rice, jungle rice, and wild poinsettia(Diallel experiment).
An experiment was conducted to obtain information on the nature of
intraspecific and interspecific interference when rice, jungle rice (also called
barnyardgrass), (Echinochloa colona), and wild poinsettia (Euphorbia
heterophylla) are grown as separate species (Figure 3.1) and in mixtures
(Table 3.1) at densities of one to four plants per pot. Plants were grown
outdoors, in pots as in the experiment 2.3. Treatments were replicated four
times. Plants were sampled at 12 WAE for weeds and at crop maturity (17
WAE) for rice.
Data collection and analyses.
Data collection included tiller number and dry weight. The
yield-density model, 1/W = A+BN (equation 1, chapter I), describing the
relationship of individual plant biomass (Spitters, 1983) was used to estimate
the effect of intraspecific competition on each species grown in monocultures.
Data collected at 4 WAE included tiller number, leaf area, and dry weight for
weeds at 12 WAE and for rice at maturity. The response of each species to
intraspecific competition was assessed by comparing the regressioncoefficients (slopes of the estimated linear regression) depicting the rate of
change of individual plant weight as density increases. In mixtures, the
relative competitive ability of the species was estimated from the regression
coefficients of the expanded model (Spitters, 1983) for two-species mixtures.
The relative competitive ability of rice against each of the weed species was
calculated as the ratio of the regression coefficients that characterize intra-
and interspecific competition.

64Experiment 3.2. Effects of intraspecific and interspecific competition on
growth of rice, jungle rice, and wild poinsettia (Additionseries).
Two addition series described by Spitters (1983) were used in this
study, varying the densities of rice in two binary associations with each ofthe selected weed species. This provided a means of assessing the effect
of crop density on the competitive ability of jungle rice and wild poinsettia
against rice. Plot size was 1 by 1 m. The experimental design was a
randomized complete block with six replications.
Jungle rice and wild poinsettia seeds were broadcast uniformly and
slightly raked into the soil. The densities of weeds were 0, 10, 20, 40, and
80 plants m-2 while rice seeds were drilled by hand to obtain 0, 20, 40, 60,
and 80 plants m-2 (Figure 3.2). Rice variety ITA 222 was used for this
study. Two weeks after emergence, plants were thinned to desired
densities. Seedlings that did not emerge by that time were replaced with
seedlings from a nursery plot. Weeds other than the planted jungle rice and
wild poinsettia were removed by handweedings. A compound fertilizer
(15-15-15) was applied at the rate of 30 kg ha-1 each of N, P, and K at 3and 6 weeks after emergence.
Data collection and analyses.
One set of three replications was used for destructive sampling at 6
WAE to determine the number of tillers, leaf area, and dry weight of theaboveground parts of plants (rice and weeds). The other set of threereplications was harvested 12 WAE as the weeds started to senesce.Analysis of variance and mean separation by DMRT at 5% probability level
were performed for the growth parameters measured. Linear regression
analysis was done with the data on individual plant weight and density as
proposed by Spitters (1983) to assess the effects of intra- and interspecific

competition:
1NVR = A + BRRNR + BREcNEc (6)
65
1NVR= A + BRRNR + BREhNEh (7)
where 1/W is the reciprocal weight of individual rice plants.
A is the theororetical reciprocal weight of individual rice plants
growing in the absence of competition.
BRR is the coefficient of intraspecific competition among individual
rice plants resulting from the increase in rice density.
BREc and BREh are coefficients of interspecific competition in the
rice-jungle rice and rice-wild poinsettia associations,
respectively.
NR, NEc, and NEh are densities of rice, jungle rice, and wild
poinsettia, respectively.
The relative competitive ability of rice against each of the weed
species was estimated from the regression coefficients of the expanded
models describing the yield-density relationships.
Experiment 3.3. Effects of plant density and proportion on competitivenessof jungle rice and wild poinsettia in different ricebackground densities (Modified replacement series).
A replacement series design was used to assess the competitive
ability of the two weed species in association with rice (var. ITA 222) at
different densities under field conditions. The experiment was established
in the 1987 rainy season. Rice seeds were drilled by hand and seeds of
jungle rice and wild poinsettia were broadcast uniformly as described in

66experiment 3.2. Replacement series of the two weed species were
subjected to different background densities of rice. Weed species at ratios
of 100:0, 75:25, 50:50, 25:75, and 0:100 of jungle rice and wild poinsettia,
respectively, were grown in association with rice densities of 0, 20, 40, 60,
and 80 plants m-2 (Figure 3.3).
Seedlings of the two weed species were thinned to desired
densities of each species to make up each weed proportion. Seedlings of
other weeds were removed by frequent hand weedings. Total plant
densities (rice plus weeds) varied from 80 to160 plants m-2. Plant growth
in these mixtures should be influenced by intraspecific and interspecific
competition. To isolate the intraspecific effect, each species also was
grown in a monoculture at the following densities: 10, 20, 40, and 80 plants
m-2. Plot size was 1 by 1 m and each treatment was replicated six times in
a randomized complete block design.
Data collection and analyses.
Weeds and rice were sampled from a 0.5 by 0.5 m quadrat placed at
the center of each plot. Plants were sampled at harvest (12 WAE) and
actual densities and dry weight of the above-ground portions of each
species were determined . Measurements were made prior to the rice
harvest to minimize loss in weed dry matter during senescence. The data
were analyzed by calculating the relative yields and relative yield total for
the two weed species in each rice stand. Replacement series diagrams
were used to qualitatively assess the competitiveness of each weed
species at different rice densities.
Intraspecific competition was assessed from monoculture densities
using the reciprocal of individual plant weight and plant density, method
described by Shinozaki and Kira (1956) and Spitters (1983) and the double
reciprocal of total biomass and plant density suggested by Jolliffe et al.,

67(1984). In the latter, monoculture yields (biomass) of each species (Ym)
were compared to their projected yields (Yp) , and the linear regression
coefficients of the reciprocal yield and reciprocal density were used toestimate the maximum yields (Ymax) and the density (Kn) at which yieldreaches 50% of Ymax:
1N = 1Nmax + (Kn/Ymax)(1/N) (8)
The projected yields (expected yield in the absence of intraspecific and
interspecific competition) were calculated as:
Yp = (Ymax/Kn) * N (9)
The species monoculture responses (SMR) and their relative values
(RSMR) were calculated using the following formulas:
SMR = Yp -Ym (10)
RSMR = (Yp - Ym)/ Yp (11)
Log transformations of individual plant weight and density also wereperformed. The sensitivity of these different analytical methods ofassessing intraspecific competition was evaluated based on thecoefficients of determination.
The quantitative relationships between weed proportion, cropdensity, and biomass of jungle rice and wild poinsettia were assessed
using the expanded yield-density model of Spitters (1983):

1/WEc = A + BEc.EcNEc + BEc.EhNEh + BEc.RNR (12)
1/WEh = A + BEh.EhNEh + BEc.EhNEh + BEh.RNR (13)
68
where 1/WEc and 1/WEh are the reciprocal weight of jungle rice
and wild poinsettia, respectively.
A is their theoretical reciprocal weight of individual plants in
the absence of competition.
BEcEc and BEhEh are coefficients of intraspecific competition
among jungle rice and wild poinsettia plants, respectively.
BEcEh, BEhEc, BEcR, and BEhR are coefficients of interspecific
competition between jungle rice-wild poinsettia, wild poinsettia-
jungle rice, jungle rice-rice, and wild poinsettia-rice,
respectively.
NEc, NEh, and NR are densities of jungle rice, wild poinsettia, and
rice, respectively.
69RESULTS AND DISCUSSION
Experiment 3.1. Influence of plant proportion and density on competitiverelationships between rice, jungle rice and wild poinsettia(Diallel experiment).
Pure stands of rice were more productive than those of either weed
species (Figure 3.4). Rice produced twice the amount of jungle rice dry
weight as did either of the weed species. The least amount of dry matter
was produced by the stands of wild poinsettia. For all the species, the dry
weight per plant was significantly affected at densities of 2 plants/pot andabove.
The response of each species to intraspecific competition was
described by the yield-density model (11W = A + B N) presented in Figure
3.5. In this model, the intercept A is the theoretical reciprocal weight of an
individual plant growing in the absence of competition, and the regression
coefficient B describes the degree of intraspecific competition resulting from
the increase in density. The steepness of the slope of this model indicates
the relative sensitivity of the species to intraspecific competition. Wild
poinsettia was most responsive to intraspecific competition, i.e. 3 times
greater than jungle rice and more than 6 times than rice.
In the rice-weed mixtures, more detrimental effect to the crop plants
was caused by the presence of jungle rice as a neighbor than wildpoinsettia (Table 3.2). jungle rice plants produced large numbers of tillers
at the detriment of rice plants. The number of rice tillers was notsignificantly affected by its density, when it was grown alone. When single
rice plants were grown with jungle rice at different densities, two jungle rice
plants were needed to significantly reduce rice tillers. However, dry weight

70was significantly reduced when only one jungle rice plant competed with
rice compared to a single rice stand. At a rice density of two plants/pot, one
jungle rice plant was competitive enough to significantly affect tillerproduction of rice. In addition to the interspecific competition, individual rice
plants competed for the space available in the pots. In the absence of the
weeds, doubling the density of rice reduced dry weight per plant by 48 %.
There was no significant variation in rice tillers and dry weight due to the
presence of either one or two jungle rice plants.
Wild poinsettia competition (one plant per pot) reduced tillerproduction in a rice stand of two plants (Table 3.2). At this highest rice
density of 2 plants per pot, increasing the density of the two weed species
did not cause further significant reduction in tiller and dry matter production
of rice. When rice density was increased to 2 plants/pot, the rice plants
suffered from intraspecific competition as well. The effect of jungle rice was
more detrimental to the growth and development of rice than that of wild
poinsettia.
The reciprocal yield models expanded to two-species mixtures
(Spitters, 1983), describe the relationships of mean biomass of individual
rice plants and densities of each species in the rice-barnyardgrass or
rice-wild poinsettia associations (Table 3.3). The variations in thereciprocal mean weight of individual rice plants due to density were
accounted for 56 and 75% with jungle rice and wild poinsettia, respectively,
as competitors. In both models, rice density had the greatest influence on
the outcome of interactions among plants in the two binary mixtures.
Although jungle rice densities significantly influenced the response of rice
plants (p= .01), wild poinsettia density had no significant effect (p= 0.3) on
the biomass of individual rice plants. The relative competitive ability for rice
associated with jungle rice was directly calculated from the equations

71(Table 3.3) as the ratios of regression coefficients characterizing
intraspecific and interspecific competition. This ratio was 2.6, indicating that
rice was more competitive than either weed species.
Similarly, rice density had the greater influence on its tillerproduction (Table 3.4). The effect of jungle rice on rice tillers was significant
(p= .09). The effect of wild poinsettia was not significant (p= .30). The
coefficients of rice density were consistently greater in both associations for
both growth parameters measured (.009 and .018 for dry weight and tillers,
respectively). Therefore, crop density, should be a cultural practice to
consider when manipulating plant populations to improve crop production
or for describing competitive relationships.
Experiment 3.2. Effects of intraspecific and interspecific competition ongrowth of rice, jungle rice, and wild poinsettia (Additionseries).
All three species were significantly reduced in tiller number or
branches per plant as a response to crowding at 6 WAE. Significant
variations in number of branches, leaf area, and dry weight of wildpoinsettia was observed in response to density (Table 3.5).
Jungle rice (Table 3.6) responded to crowding at high densities (40
plants m-2). Increasing density decreased the number of tillers, leaf area,
and dry matter production of individual plants. jungle rice produced thehighest dry matter at all densities and greater number of tillers than rice.
This was due to less effect of intraspecific competition on its tillering ability
than that of rice (Table 3.7).
Rice response to crowding was similar to that of jungle ricealthough the latter had more tillers and dry matter production (Table 3.6
72and 3.7). The leaf area of these two species was almost identical,
suggesting a comparable ability to capture light. Rice tiller production and
leaf area per individual plants also were influenced by density. However,
the dry matter was reduced at densities as low as 40 plants m- 2 (Table
3.7). Rice tiller number and leaf area were only affected when its densityreached 60 plants m-2.
The density response of each species was described by thereciprocal yield model (1/W = A + BN) that characterize the effect of
intraspecific competition on biomass yield of individual plant species at 12
WAE (Figure 3.6). Increased density affected wild poinsettia the most. The
effect of density on the average individual plant weight of wild poinsettia
was more than twice that of density on jungle rice. Rice was the least
affected by increasing species density. Similar trends were observed in the
leaf area produced (Figure 3.7).
Two-species reciprocal-yield models (Spitters, 1983) (equations 6
and 7) for rice and jungle rice or wild poinsettia, in the modified addition
series experiment, are presented in Table 3.8. These models describe 77
to 83 percent of the variations in reciprocal mean weight of individual rice
plants as additive and linear functions of the densities in the binary weed
systems (rice-barnyardgrass and rice-wild poinsettia). In both models, rice
density had the greatest influence on its own biomass response and jungle
rice had the greater influence on the biomass response of individual rice
plants than wild poinsettia, based on the regression coefficients thatcharacterize interspecific competition. Relative competitive ability of rice
was calculated from the reciprocal-yield models (Table 3.8) as the ratios of
regression coefficients characterizing intra- and interspecific competition.
Rice was more competitive than either weed species. In agricultural terms,
this means that the effect of adding 1 rice plant was approximately

73equivalent to the presence of 5 jungle rice plants. The variations in weight
of individual rice plants were better explained by the model that describes
the relationships of reciprocal yield of rice in the association with jungle rice
(R2= .83; p=.0001) than with wild poinsettia. Densities of both rice and
barnyard- grass had a significant effect on the dry weight of individual rice
plants. These relationships were reasonably well described by the model
of rice-wild poinsettia association (R2= .77; p= .0001). Although, the effect
of wild poinsettia density on rice dry weight was not significant (p=0.23).
The reason may be that the effect of wild poinsettia on rice was notnoticeable at the time of sampling (12 WAE). In experiment 3, Chapter II,
where each of the weed species was associated with rice grown in plastic
pots, competition between rice and jungle rice plants began at a earlier
stage than with wild poinsettia. The density effect of the latter on rice tillers
and dry weight was only significant at harvest. The response of rice to its
own density was , as in experiment 1 (Table 3.4), similar in bothassociations (rice-barnyardgrass and rice-wild poinsettia), judging from the
parameter estimates for rice density (Tables 3.4 and 3.8). These results
suggest that varying seeding rate may have improved the competitive
ability of rice against both weed species.
Experiment 3.3. Effects of plant density and proportion on competitiveness ofjungle rice and wild poinsettia in different rice backgrounddensities (Modified replacement series).
Qualitative comparisons of the replacement series diagrams
suggest that interference among jungle rice and wild poinsettia was more
intense as rice density increased and as proportion of jungle rice increased
than in the absence of rice (Figure 3.8). In the absence of rice, a relative
yield total (RYT) greater than 1 indicates an overyielding of the mixtures. At

74a ratio of 50:50, the RYT was equal to 1.7, suggesting that the two species
partitioned resources such that both performed better than in a similar
density monocultures. As rice was added the RYT dropped below unity,
indicating that competition occurred when total density increased. Wild
poinsettia responded to the presence of rice at lower densities of rice than
did jungle rice. In the absence of rice, both weed species produced dry
weight similar or more than their expected yield. As rice plants were added
at a density of 40 plants m-2 to the weed mixture, wild poinsettia dry weight
was reduced by more than 50% when it was associated with jungle rice in a
1:1 ratio. jungle rice biomass was reduced when rice density was 80 plants
m-2. The positive response of jungle rice in association with wild poinsettia
was reduced as more rice was added to the mixture. Overall, jungle rice
was in advantage over wild poinsettia.
Results from previous experiments (Figure 3.5, 3.6, and 3.7) showed
that wild poinsettia was more sensitive to intraspecific competition than
jungle rice. Although conventional methods of interpretation of data from
replacement series experiment do not include information on the species
response to intraspecific competition, the performance of each species in
monocultures does provide a means to evaluate the separated effects of
intraspecific competition. The regression analysis of individual plant weight
on density provided equations that describe the relationship of biomass
yields to density of each of the weed species:
1/WEc = .063 + .001 NEc,
R2 ..78 (14)
1NVEh = .518 + .007NEh , R2 = .78 (15)
where WEc and WEh are the individual plant biomass yield of jungle rice
and wild poinsettia, respectively, and NEc and NEh are their respective

75densities. The overall interpretation of the models are similar to those from
the addition series: wild poinsettia is more sensitive to intraspecificcompetition than jungle rice. The effect of density on biomass of individual
wild poinsettia plants was seven times more than the effect of density on
jungle rice biomass (Figure 3.9), judging from the regression coefficients
characterizing intraspecific competition.
The same data were analyzed using the double reciprocal of total
biomass (1/Y) and density (1/N) proposed by Jolliffe et al., (1984). The
yield-density relationship was described most precisely for jungle rice bythe linear equation:
Jungle rice: 1/Y = .0014 + .05 1/N , R2 = .90 (16)
Wild poinsettia: 1/Y = .011 + .178 1/N, R2 = .63 (17)
where Y and N are the total weight of the plant stand and density of junglerice, respectively. In the case of wild poinsettia, this relationship wasdescribed with an R2 of 0.63 (Figure 3.10). According to the analysis
suggested by Spitters (1983), 78% of the variations in the biomass of the
two species was accounted in both jungle rice and wild poinsettia.However, the analytical method suggested by Jolliffe et al., (1984) provided
a more detailed interpretation of plant response to density by comparing the
actual yield with the projected yield of each species.
Maximum yield of wild poinsettia was 90.9 g m-2 (Figure 3.11). This
species required a lower density (16 plants m-2) to reach 50% of itsconstant final yield. These results are consistent with the interpretation that
wild poinsettia was more sensitive to intraspecific competition than jungle
rice. Constant final yield of jungle rice was only approached at the highest
density used in this study. Greater number of monoculture densities ( > 80

76plants m-2) should have been included for better fitting of the maximum
yield of jungle rice. Field observations at the experimental site indicated
that this species could occur at populations as high as 180 plants m-2.
Monoculture response of each weed species, characterizing the
differences between the projected yield per unit area and the actual
monoculture yield (Jolliffe et al., 1984) varied significantly with increase in
density (Table 3.9). Wild poinsettia responded significantly (p< .001) at
density of 20 plants m-2, while jungle rice was influenced by higher
densities. Considering the differences in plant size of the two species,
intraspecific competition effects also were assessed on a relative basis.
Both species showed similar responses compared to the results obtained
with absolute values of their monoculture responses. Wild poinsettia
responded to the addition of plants of the same species to the monocultures
more than did jungle rice. These results support the observations in earlier
experiments ( 3.1 and 3.2).
The response of wild poinsettia to density was most precisely
described by a log transformation of both biomass and density, and using a
regression model (R2 = .82, Figure 3.12). The individual plant weight of
wild poinsettia reached a minimum value before its highest density in this
study. This supports that wild poinsettia was very sensitive to intraspecific
competition. The large differences in yield potentials (projected yields) of
the two species can account partly for the greater advantage of jungle rice.
At 6 WAE, jungle rice produced twice as many tillers as rice (Tables 3.6 and
3.7), while wild poinsettia only had 2 to 5 branches (Table 3.5). The rapid
growth and shorter life cycle enable jungle rice to efficiently use the
available resources early in the growing season to the detriment of the rice
plants. When the species are growing together in mixtures, the contribution
of intraspecific competition may have a large influence on the mixture

77response of wild poinsettia (Grime and Hunt, 1975).
Methods of analysis and interpretation such as the conventional
replacement series approach that consider the relative yield of both species
were appropriate for describing the general competitive relationships
between jungle rice and wild poinsettia. More definitive interpretations (that
include quantitative assessments) could have been obtained if the two
species were grown in several sets of replacement series at different total
densities as suggested by Connolly (1987). For this purpose, the same
data were analyzed using the expanded model (Spitters, 1983) of
yield-density relationships involving the three species: rice, jungle rice, and
wild poinsettia. This model described 72% (p= .0001) of the variations in
the reciprocal mean weight of individual jungle rice plants (Table 3.10).
Density of both rice and jungle rice had a significant influence on jungle rice
biomass. The degree of competition between rice and jungle rice plants
may have been so high that the effect of increasing density of wildpoinsettia was not significant. In addition to the interspecific competition,
more sensitive to intraspecific competition than either of the other species
(experiments 2.2, 3.1 and 3.2). This could be the reason why the biomass
of wild poinsettia was poorly described by the model (R2= 0.13). The poor
relationships between densities of each species with the reciprocalbiomass of wild poinsettia plants may also be due to the distribution of this
species in the field, or there may have been some factors other thandensity, that affected its growth. Predicting the biomass yield of wildpoinsettia from the densities of all three species of the mixture is difficult.
In summary, wild poinsettia was the most sensitive species to
intraspecific competition under both screenhouse and field conditions. In
the binary associations, the response of the reciprocal of individual plant
weight of rice was almost identical in both associations (rice-jungle rice and

78rice-wild poinsettia). In the mixtures, rice density significantly influenced
the competitive relationships between jungle rice and wild poinsettia.
Overall, jungle rice was more competitive than wild poinsettia.
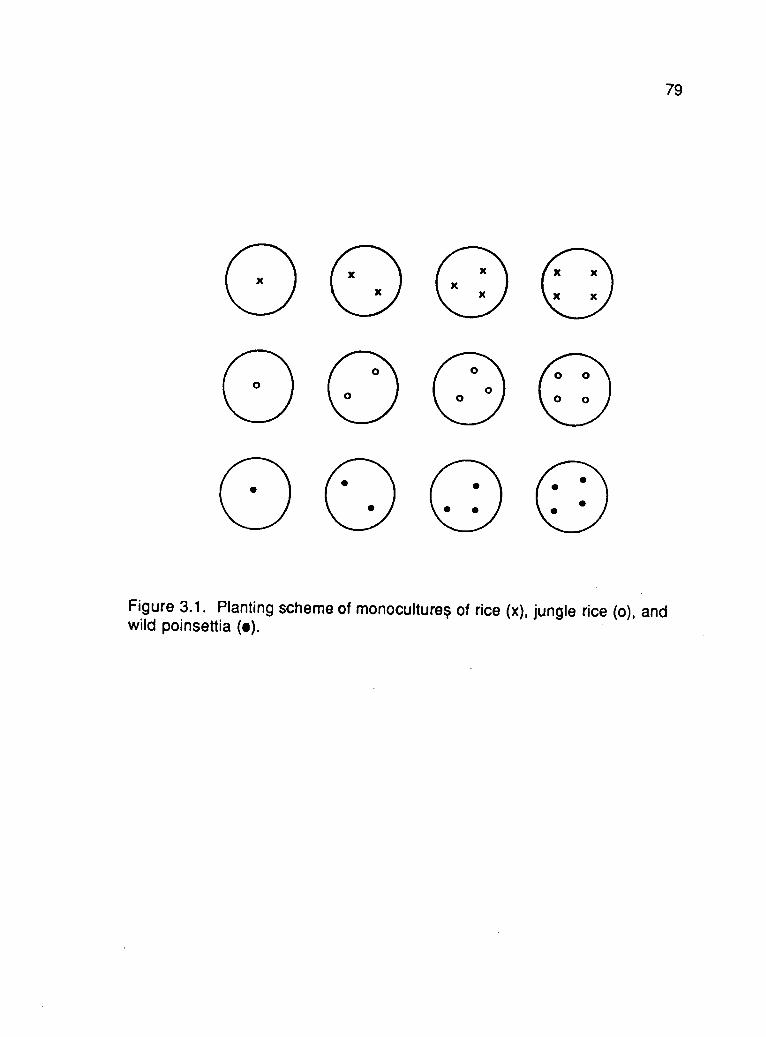
79
Figure 3.1. Planting scheme of monoculture§ of rice (x), jungle rice (o), andwild poinsettia (I).

0
E 200
40U)
a)Vc.) 60
80
Weed density (No. m-2)0 10 20 40 00
I r
momm .. - -,0 - emioNa AP. ow. - =11111
.= :a 111 =1111
ammo memo Ow.
Ec
Eh
80
Figure 3.2. Planting scheme of rice, jungle rice (Ec), and wild poinsettia(Eh).
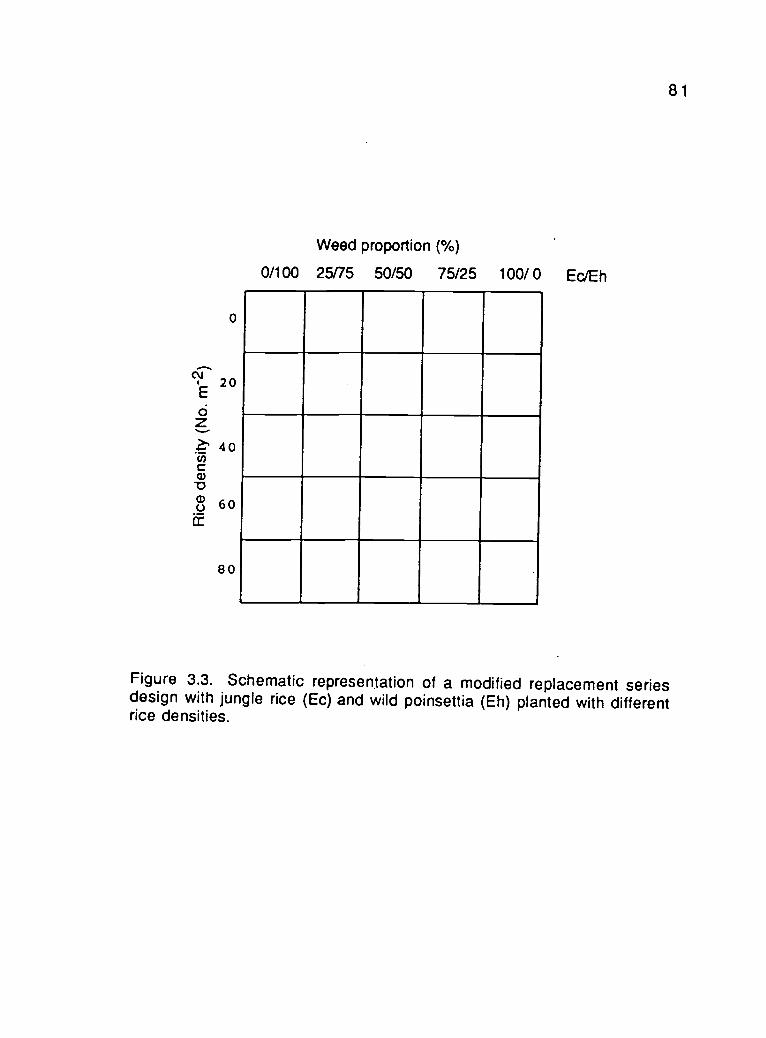
0
20
ci
40coca)D0 60if
80
Weed proportion (%)
0/100 25/75 50/50 75/25 100/ 0 Ec/Eh
81
Figure 3.3. Schematic representation of a modified replacement seriesdesign with jungle rice (Ec) and wild poinsettia (Eh) planted with differentrice densities.

82
120
-- 100...-
E03 80.a0)
80..60)._W 40.
0 20
o Rice a Jungle rice Wild poinsettia
ILsd.05
0
I
I,i 2
.3
Plant density (No./pot)
4
Figure 3.4. Dry weight as affected by intraspecific competition at harvest.

.4
.2 .
.1.
0
- - Wild poinsel ia 1/Y=.027+.064N, R2.11, .47
Darnyardgrass 1/Y= .0031+.019N,.0012+.009N,
R2=R2=
.86
.90Rice 1/Y=
ow
....,1 2
Plant density (No./pot)
4
83
Figure 3.5. Density response: reciprocal of per plant biomass againstdensity.

to.
.o
.8.
.7
.8
.5.
4 .,
- - Wild poinsettia 1/W = .309 + .005N, R2= .69Barnyardgrass 1/W = .03 + .002N, R2= .65
1/W = .036 + .00IN, R2= .77
.3.
.2.
.110 20
.... - -40 80
Plant density (No. m-2)
84
Figure 3.6. Density response of rice, jungle rice, and wild poinsettia :
reciprocal of individual plant biomass at 12 weeks after emergence.

85
.014
.012
.01Q
.008
.00Ct.
.002
wild poinsettia 1/Y = .004 + .00007X, R2= .913
Jungle rice 1/Y = .0007 + .00005X, R2= .995
.-- Rice 1/Y = .0001 + .00005X, R2= .939
-"..20 25 30 36 40 45 60, 65 60 65 70 76 80
Plant density (No. m-2)
Figure 3.7. Leaf area of individual plants as influenced by density.
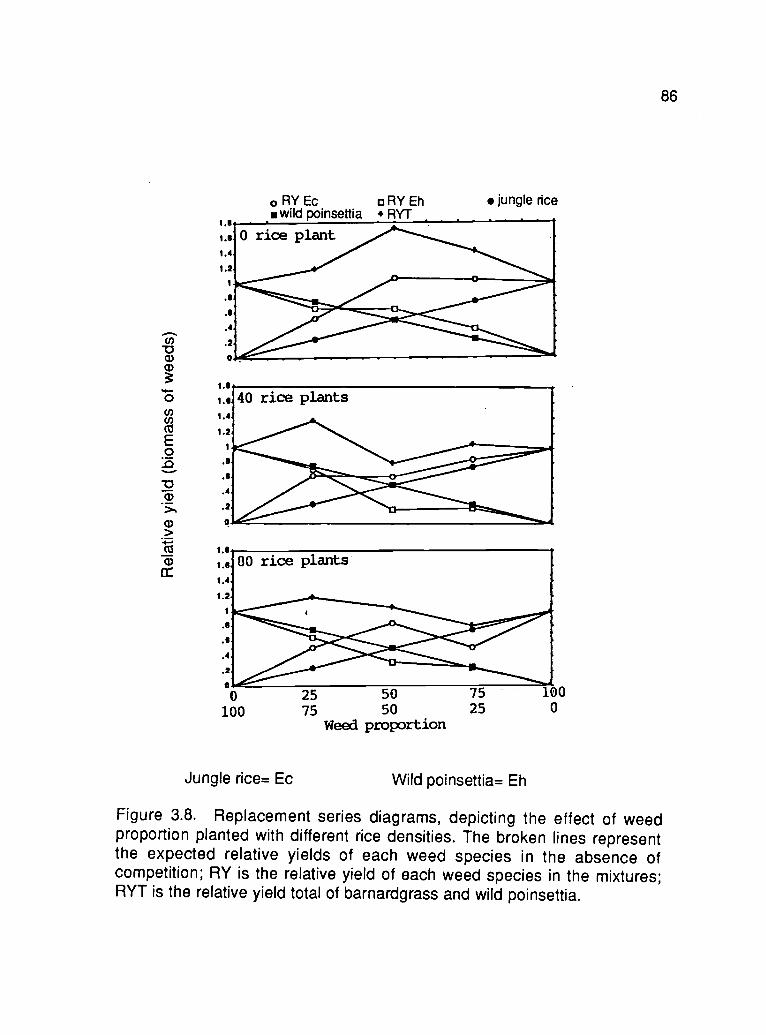
o RY Ec DRY Ehwild poinsettia RYT
jungle rice
40 rice plants
.1
.4
.2
80 rice plants'
.4.
.2
0
0
10025 5075 50
Weed proportion
75 10025
Jungle rice= Ec Wild poinsettia= Eh
0
86
Figure 3.8. Replacement series diagrams, depicting the effect of weedproportion planted with different rice densities. The broken lines representthe expected relative yields of each weed species in the absence ofcompetition; RY is the relative yield of each weed species in the mixtures;RYT is the relative yield total of barnardgrass and wild poinsettia.

1.6
1.4.
1.2
1.0.
.8
.6.
.4.2.0
. . ,- Wild poinsettia : 11w- .518+.007N, 112. .777
Jungle rice : 1/Was .063+.001N, R21-.783
......'"......'"'"............._..
on............"*".........".
ar.....'
.......,,s......
10 15 20 25 30 36 40 45 60 55 60 65 70 75 60
Plant density (No. m-2)
87
Figure 3.9. Jungle rice and wild poinsettia responses to intraspecificcompetition
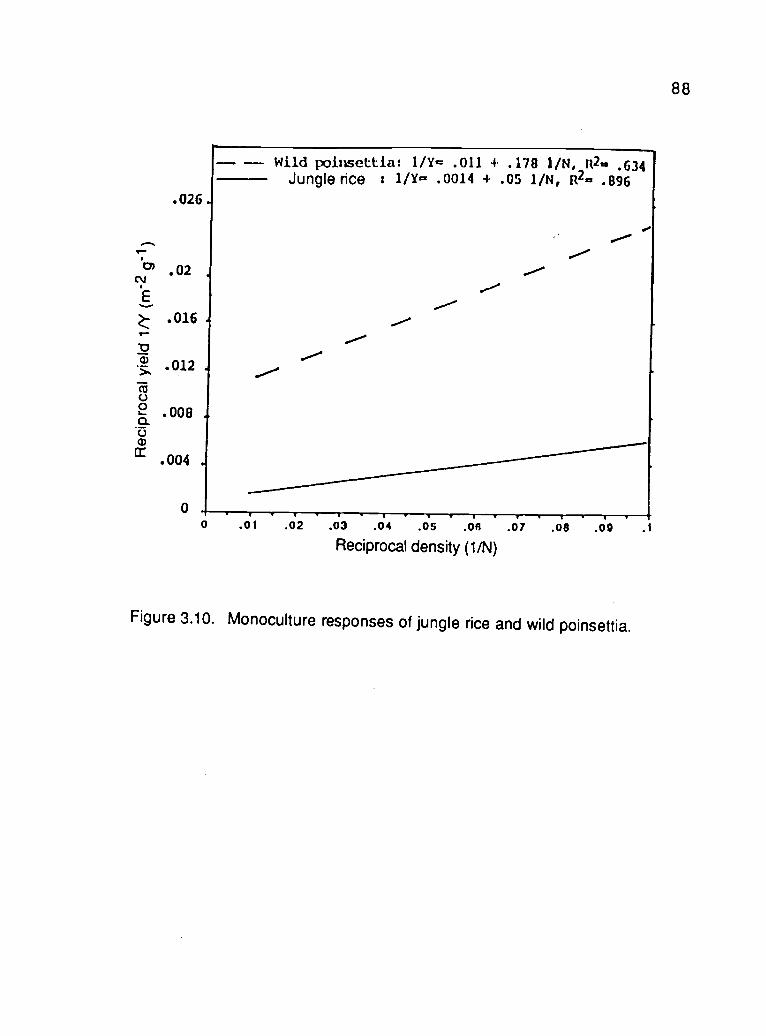
88
.026
..-
1:7) .02
.016
.5,4) .012To(.)2 .008
CC .004
0
- Wild poinsettia: 1/Y= .011 -f .178 1/N, R2r. .634Jungle rice s 1/Yr. .0014 + .05 1/N, 112g, .896
01 1- 7-
.01 .02 .03 .04 .05 .04 .07
Reciprocal density (1/N).08 .00
Figure 3.10. Monoculture responses of jungle rice and wild poinsettia.

cv 400.iEc:7)
--7.(1)V)ctiE 200.0
1-61
-0 100a)
5-
10 20 30 40 50
Plant density (No. m-2)
89
Figure 3.11. Yield response to density: Yp= projected yield; Ymax=maximum yield; Kn= density at which 50% Ymax is reached.

Log plant density (x)
90
Figure 3.12. The relationship between individual plant weight and density(double log transformation).
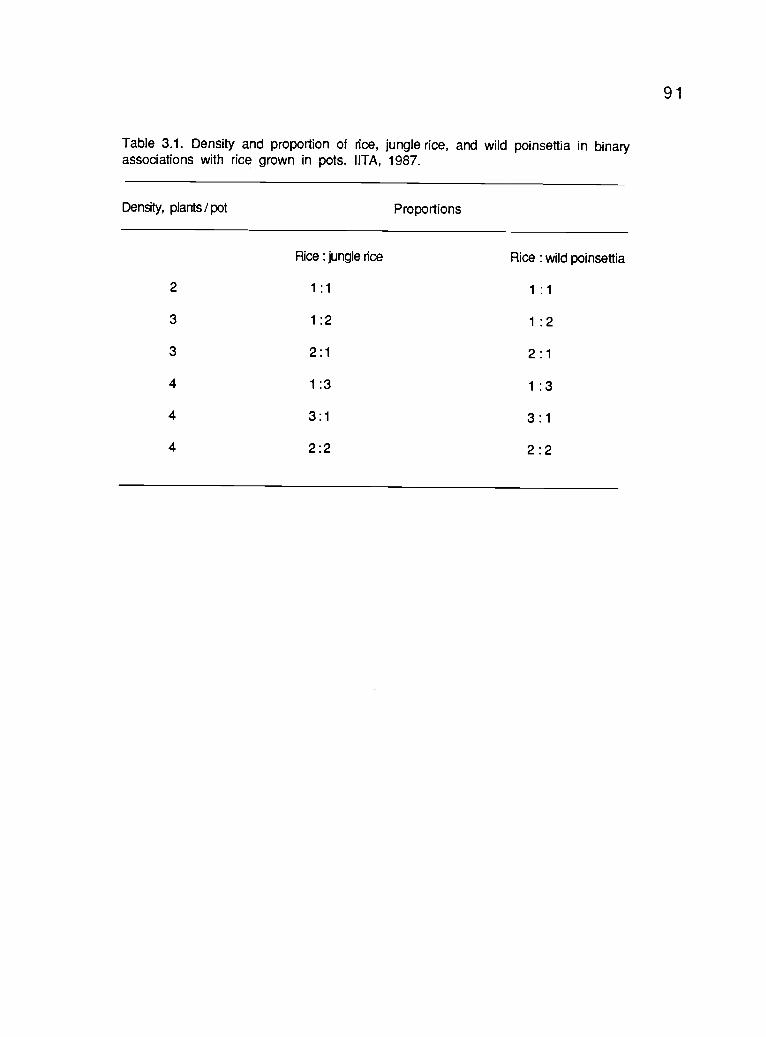
91
Table 3.1. Density and proportion of rice, jungle rice, and wild poinsettia in binaryassociations with rice grown in pots. IITA, 1987.
Density, plants / pot Proportions
Rice : jungle rice Rice : wild poinsettia
2 1:1 1 : 1
3 1:2 1 : 2
3 2:1 2 : 1
4 1 :3 1 : 3
4 3:1 3 : 1
4 2:2 2 : 2

92
Table 3.2. Effect of rice stand and weed density on rice growth at harvest. IITA, 1987.
Density, no.plant-1
Rice Weed total
1 0 1
1 2
2 3
Mean
2 0 2
1 3
2 4
Mean
Lsd.05 for meansat each rice density :
Lsd.05 for means inthe same rice density :Lsd.05 for Means indifferent rice density :
Rice vs jungle rice Rice vs wild poinsettia
Tillers
(no.plant-1)
Dry weight
(g plant-1)
Tillers
(no.plant-1)
Dry weight
(g plant-1)
36 110.0 36 110.0
32 87.1 33 108.8
26 77.0 39 108.8
31 91.4 36 109.2
30 57.0 30 57.0
17 51.9 19 59.2
17 41.1 19 52.2
21 50.0 23 56.1
ns 22.9 5 15.6
10 18.1 10 ns
14 26.8 10 17.9

93
Table 3.3. Yield-density relationship between rice and jungle rice or wild poinsettial.IITA, 1987 (dry season).
Rice-jungle rice
Model 1 / WA = .0003 + .009 NA + .0034 NE A2 = .56 p= .0002
Parameter Param. est. s.e. p-value
Rice density .009 .0021 .0003Jungle rice density .003 .0013 .01
Rice-wild poinsettia
Model 1 / WA = .004 + 0.009 NA + .0007 NEh A2 = .75 p= .0001
Parameter Param. est. s.e. p-value
Rice density .009 .001 .0001Wild poinsettia density .0007 .0007 .3
1 Yield density models (Spitters, 1983) describing the response of individual plantbiomass of rice, to the densities of rice (NR) and jungle rice (NEc) or wild poinsettia(NEh).

94
Table 3.4. Rice tillers per plant, as influenced by density of rice and jungle rice or wildpoinsettia. IITA, 1987.
Rice jungle rice
Model 1/No.Tillers = .005 + . 018 NR + .009 NEc R2 = .829 P= .07
Parameter Param.est. s.e p-value
Rice density .018 .006 .06Jungle rice density .009 .003 .09
Rice - wild poinsettia
Model 1/No.Tillers = .005 + .018 NR + .004 NEh R2 = . 756 P= .1
Parameter Param. est. s.e P-value
Rice density .018 .006 .06Wild poinsettia density .004 .003 .3
1 Yield- density models (Spitters, 1983) describing the response of number of tillersper plant of rice to the densities of rice (NR) and jungle rice (NEc) or wild poinsettia(NEh)
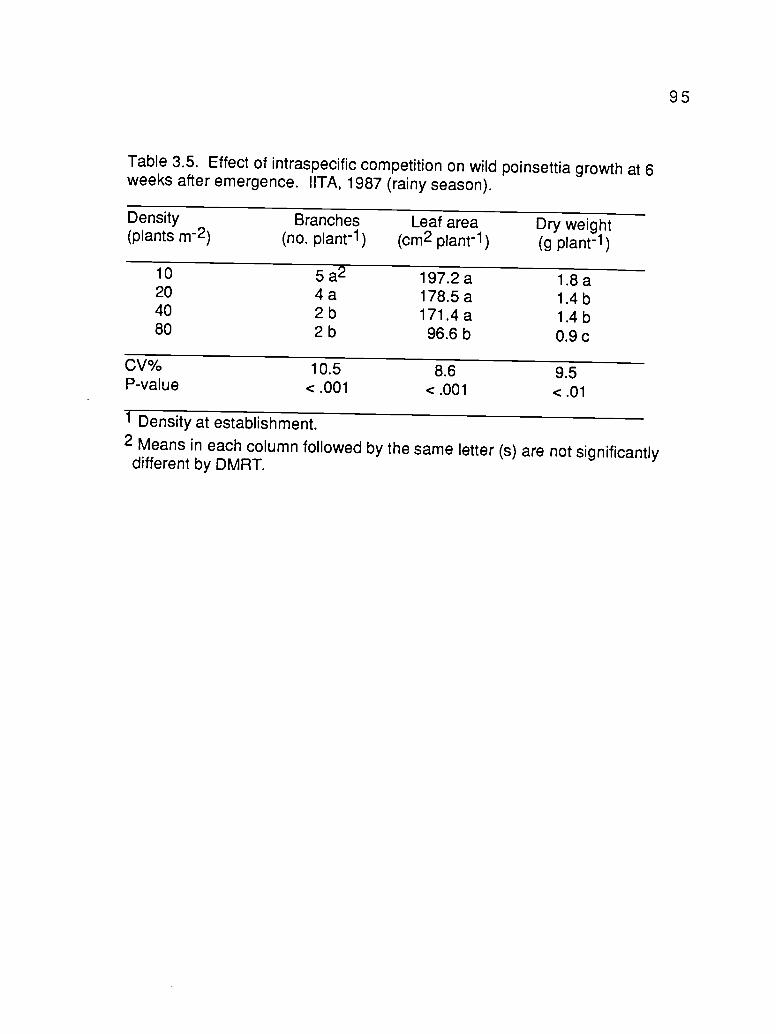
95
Table 3.5. Effect of intraspecific competition on wild poinsettia growth at 6weeks after emergence. IITA, 1987 (rainy season).
Density(plants m-2)
Branches(no. plant-1)
Leaf area(cm2 plant-1)
Dry weight(g plant-1)
10 5a-2- 197.2a 1.8a20 4a 178.5a 1.4b40 2b 171.4a 1.4b80 2b 96.6b 0.9c
CV% 10.5 8.6 9.5P-value < .001 < .001 < .01
1 Density at establishment.2 Means in each column followed by the same letter (s) are not significantlydifferent by DMRT.
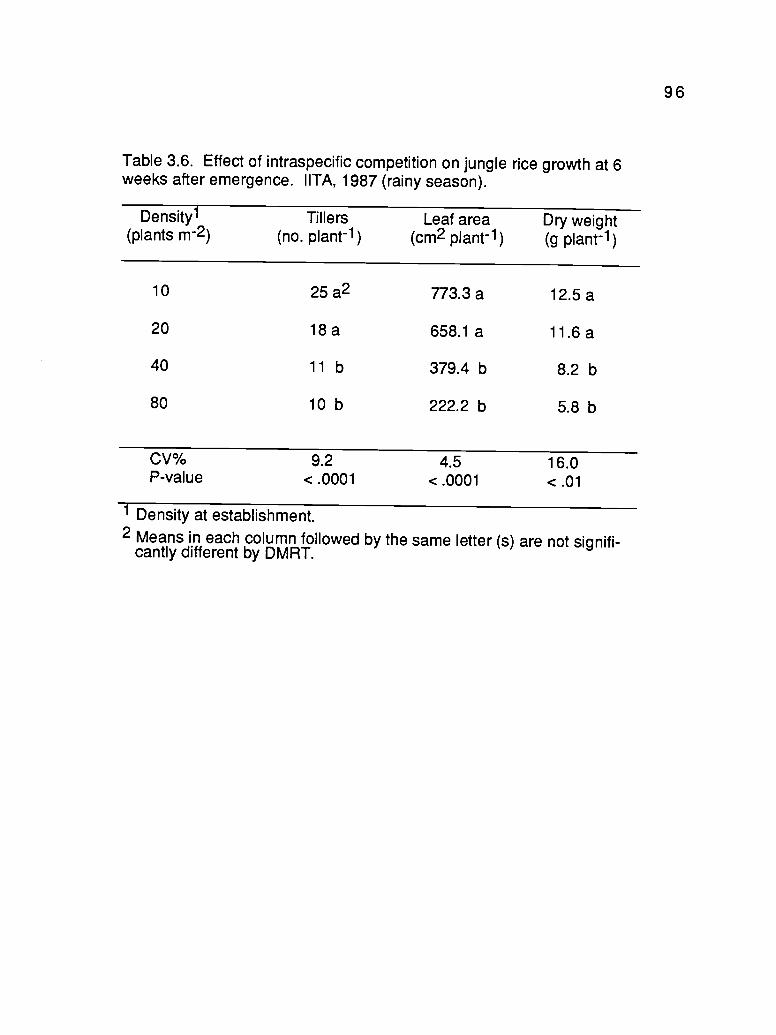
96
Table 3.6. Effect of intraspecific competition on jungle rice growth at 6weeks after emergence. IITA, 1987 (rainy season).
Densityl(plants m-2)
Tillers(no. plant-1)
Leaf area(cm2 plant-1)
Dry weight(g plant-1)
10 25a2 773.3 a 12.5 a
20 18 a 658.1 a 11.6 a
40 11 b 379.4 b 8.2 b
80 10 b 222.2 b 5.8 b
CV% 9.2 4.5 16.0P-value < .0001 < .0001 < .01
1 Density at establishment.2 Means in each column followed by the same letter (s) are not signifi-
cantly different by DMRT.

97
Table 3.7. Effect of intraspecific competition on rice growth at 6 weeks afteremergence. IITA, 1987 (rainy season).
Denstyl(plants m-2)
Tillers(no. plant-1)
Leaf area(cm2 plant-1)
Dry weight(g plant-1)
20 12 a2 782.9 a 8.4 a
40 12 a 649.6 a 5.0 b
60 6b 316.8b 3.8b
80 4 c 228.0 b 3.2 b
CV% 8.5 13.4 23.9P-value < .001 < .0001 < .01
1 Density at establishment2 Means in each column followed by the same letter (s) are not signifi-
cantly different by DMRT at 5% probabilty level.

98
Table 3.8. Yield-density relationship between rice and jungle rice or wild poinsettia) .
IITA, 1987 (rainy season).
Rice-jungle rice
Model 1 / WR = .023 + .0015 NR + .0003 NEC R2 = .83 p= .0001
Parameter Param. est. s.e. p-value
Rice density .0015 .0001 .0001Jungle rice density .0003 .00008 .0027
Rice-wild poinsettia
Model 1 / WR = .026 + .0012 NR + .0001 NEh R2 = .77 p= .0001
Parameter Param. est. s.e. p-value
Rice density .0012 .0001 .0001Wild poinsettia density .0001 .00008 .23
1 Yield-density models (Spitters, 1983) describing the response of individual plantbiomass of rice, to the densities of rice (NR) and jungle rice (NEC) or wild poinsettia(NEh).
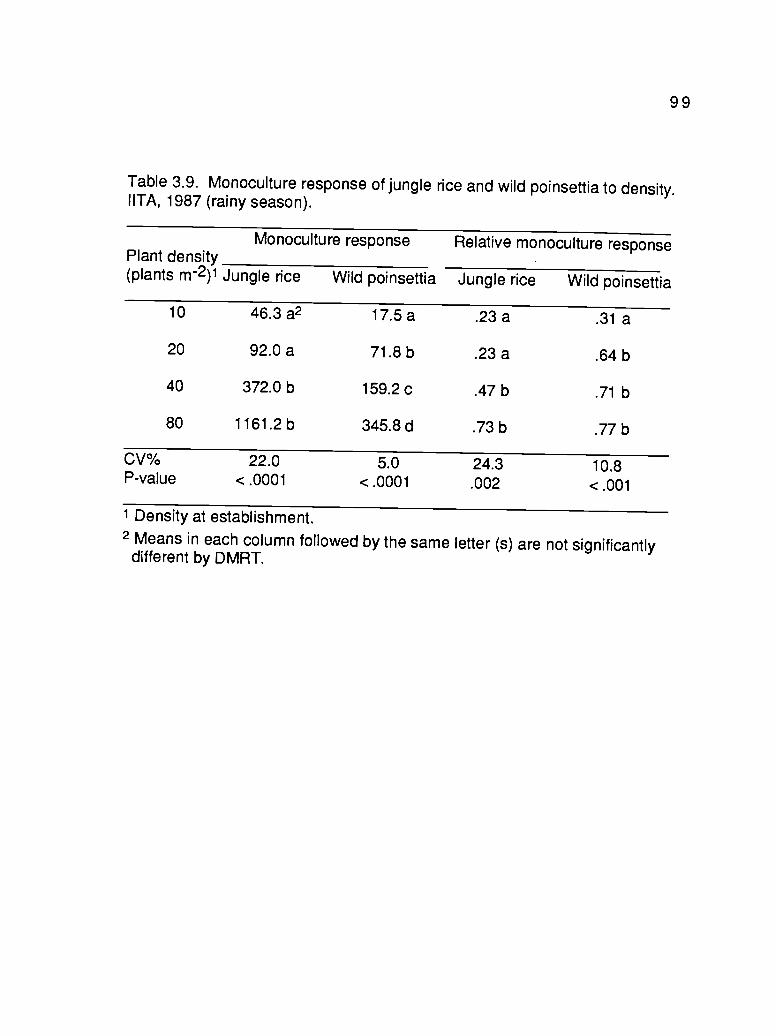
99
Table 3.9. Monoculture response of jungle rice and wild poinsettia to density.IITA, 1987 (rainy season).
Plant density(plants m-2)1
Monoculture response Relative monoculture response
Jungle rice Wild poinsettia Jungle rice Wild poinsettia
10 46.3 a2 17.5 a .23 a .31 a
20 92.0 a 71.8 b .23 a .64 b
40 372.0 b 159.2 c .47 b .71 b
80 1161.2 b 345.8 d .73 b .77 b
CV% 22.0 5.0 24.3 10.8P-value < .0001 < .0001 .002 < .001
1 Density at establishment.
2 Means in each column followed by the same letter (s) are not significantlydifferent by DMRT.

100
Table 3.10. Yield-density relationship between jungle rice and wild poinsettia grown at differentproportions with different rice densities. IITA, 1987 (rainy season).
Jungle rice
Model 1/WEc = .003 + .002 NEc .0006 NE + .002 NR R2= .72 p= .0001
Parameter Param. est. s.e. P-value
Jungle rice density .002 .0007 .01Wild poinsettia density .0006 .0007 .4Rice density .002 .0004 .0001
Wild poinsettia
Model 1/WEh = .26 + .007 NE + .006 NEc + .0002 NR R2..13
Parameter Param. est. s.e. P-value
Wild poinsettia density .007 .0004 .14Jungle rice density .006 .0004 .19Rice density .0002 .0002 .9
p= .41
1 Expanded yield-density model (Spitters, 1983) describing the response of individualplant biomass of jungle rice (1/WEc) and wild poinsettia (1/WEh) to densities ofjungle rice (NEC), rice (NR), and wild poinsettia (NEh)

101
Chapter IV.
GENERAL DISCUSSION AND CONCLUSIONS
GENERAL DISCUSSION
In West Africa, efforts to increase total crop production are pushing
old land uses toward radical changes and encouraging investigation of the
enormous resources that have not been used. One of the approaches is to
focus on genes for resistance to different diseases and pests, and recently,
to tolerance to different problems (e.g. iron toxicity) and adaptation to
different moisture conditions (e.g. drought, deep water etc.). Obviously, the
genetic approach cannot solve all problems, and weeds remain a major
constraint to improving rice production in hydromorphic soils.
I believe that, before research programs are developed, information
must be gathered to characterize the ecosystems of various areas of rice
cultivation for maximum use of their potential for improved crop production.
At the International Institute of Tropical Agriculture (IITA), Resource
Management research (RMR) is one component of the Resource and Crop
Management Program (RCMP). One of the activities of this component is
land characterization. My research work fits this aspect of the program.
Realistic management solutions cannot be developed withoutproper characterization and understanding of different crop-pestinteractions. Untimely weed control is a common practice of farmers in
West Africa. The critical period of weed interference has been established
in different rice cultures. Previous works have been criticized, because
little or no information was obtained in terms of phenological,
morphological, or physiological states of the crop. These states change in
time, season, and by location. The results of my research indicated that,

102when rice and weeds emerge at the same time, the crop is more sensitive to
weed interference during the early stages of growth, prior to tillering.
Consequently, its tiller production is primarily affected by competition from
weeds such as jungle rice, which produces twice as many tillers as does
rice. Proper weed control should aim to minimize crop-weed interference
during this period in order to reduce yield losses. The efficient use of
environmental resources by weeds is reflected in their biomass, which had
an inverse linear relationship with rice grain yield, suggesting that weed dry
weight is a better parameter reflecting competitive ability than density(Figure 2.2, Chapter II). This is because of the nonuniformity of natural
weed populations and growth plasticity of plant species. Few weed plants
may produce dry weight per unit area that equates that produced by a more
dense population, because of the plastic response of plants.
However, it could have been interesting to look at the effect ofproportion of selected weed species on the critical period. This could have
been done by establishing proportions of two major weed species, but the
area required would be much greater than when rice is associated with
natural weed populations. The experiment, therefore, may become toolarge to conduct efficiently. It is tedious to prevent interference from weeds
other than the selected species because weeds grow in profusion in warm
and moist hydromorphic soils.
In newly developed hydromorphic lands, sedges are thepredominant weed species, followed by grasses. A wide range of weeds,
including broadleaved species, interfere with rice grown on hydromorphic
soils because of the warm temperatures and the fluctuation of water table.
In my studies, jungle rice and wild poinsettia were selected because they
present different morphological characters, germinate readily, and their
biology is better understood than that of sedges. Efforts should be made,

103
however, toward more biological studies on sedges to enable theirconsideration as potential competitors, and for a better understanding of weed
interference in this rice culture.
Jungle rice and wild poinsettia were different in their interaction with rice.
Early interference is expected from jungle rice, whose below-ground
competition is greater than that of wild poinsettia, judging from the volume of
roots each species produced in the first 4 WAE (Figure 2.7). Jungle rice also
has the ability to produce tillers faster than rice. In the growth analysis
experiment (experiment 2.2), plants were not grown until maturity and data on
seed production were not obtained for a complete picture of plant potentials
for competition. Observations of when rice and jungle rice produce maximum
numbers of tillers would be helpful in determining why tiller production of rice
is affected by the presence of weeds during the critical period of interference.
Jungle rice started tillering one week before rice; consequently, the production
of large number of decumbent tillers by jungle rice, left less space available
for the crop at its tillering stage.
Wild poinsettia seemed to have greater potential to compete with rice for
light, because of its upright growth habit. In a crowding situation, wild
poinsettia plants tend to grow tall, and to produce fewer branches (experiment
3.2). As a result, the individual plant biomass was reduced with increasing
density. Jungle rice did not seem to reach a yield plateau with the densitiesused. In preliminary studies where jungle rice density per m2 varied from 50
to 200, a yield plateau was reached by both jungle rice and wild poinsettia,
which made the interpretation of density effects on intra- or interspecificcompetition difficult. Therefore, it was a good decision to consider lowdensities (10, 20, 40, and 80 plants m-2, but the range hould have been
greater to include 120 and 160 plants per m2.
Jungle rice was more competitive than wild poinsettia in binary
1 04
mixtures with rice, as well as in their associations in different densities of
rice background (experiments 3.2 and 3.3). Since intraspecific competition
had an impact on the outcome of competition, additional sets ofreplacement series mixtures at different total densities would have allowed
better interpretation. In my study, competition was assessed between
plants grown both in the field (experiments 2.1, 3.2, and 3.3) and in pots(experiments 2.2, 2.3, and 3.1). Under both conditions, wild poinsettia
showed the the greatest sensitivity to intraspecific competition and jungle
rice was more competitive than wild poinsettia when grown in mixtures. The
high productivity of jungle rice (twice the number of tillers as produced by
rice at 6 WAE when individual plants were grown at low densities inexperiment 3.2, Tables 3.6 and 3.7), could explain its greater competitive
ability than wild poinsettia in mixtures with rice. Sahai and Bhan (1984)have found that barndyardgrass was the most competitive among several
weeds for nitrogen applied to drilled rice. This species is able to establish
and grow fast and efficiently make use of the available resources toproduce large number of tillers and seeds before it completes its shortgrowth cycle. On the other hand, wild poinsettia apparently had a shading
effect on rice plants later in the growing period. Its density effects on rice
were only perceived at harvest (experiment 2.3, Table 2.5). Thephysiological and morphological attributes of the two weed species conferthe ability to compete with rice in different ways and at different periodsduring the crop growing season. This makes development of a weedmanagement program difficult in rice growing on hydromorphic soils, where
both jungle rice and wild poinsettia can cause serious problems.
The sensitivity of the models varied with the species and with the
experimental conditions. The models described 56 to 83 % the variation
in individual plant biomass. In plants grown in pots , another competition

1 05factor (space) may have had an influence on the outcome of plantinteractions.
In the growth analysis experiment, because competition for light
between rice and wild poinsettia is suspected, plants should have beengrown in larger pots or in 1 by 1 m-square wooden containers with 50 cmheight, filled with greenhouse soil, in order to monitor the leaf area index.This would, eventually, provide more information on when and whycompetition for light becomes important.
As earlier mentioned, the outcome of competition depends not only
on density and proportion of weed species, but also on the crop attributes.
Therefore, different varieties would have shown different responses to weedinterference. It could be interesting to study the interference between two
weed systems and some promising rice varieties, suitable for hydromorphicsoils. Increasing crop density proved to increase the competitive ability ofrice. One aspect of future research on crop-weed competition could beoriented towards the manipulation of plant population to improve thecompetitive ability of our crops against major weeds, to improve weedcontrol and save money to low-income African farmers. Traits ofindividuals that contribute to rapid growth proved ( Chapter II and Roushand Radosevich, 1985) to have a positive influence on the competitiveability of plant species in mixtures. This calls on plant breeders, cropphysiologists, ecologists, and weed scientists for close collaborations in thetask of developing successful and ecologically sound weed managementstrategies.
At present, handweeding twice is a practical option to keep weedpressure at a low level. However, this practice does not give satisfactoryresults when rice fields are infested by perennial weeds . The use of
herbicides has been disappointing because most of the recommended

106compounds are exposed to rapid breakdown in the warm and moistconditions of hydromorphic soils. Mechanical weeding is also unsuccessful
because of a lack of water control. Land preparation twice, at the end of the
cropping season and prior to the onset of rains, in combination withpostemergence herbicides or handweeding, could be a good weed controlpackage for improved rice production in hydromorphic soils.
Although allelopathy is difficult to prove, I tried, using a simplebioassay technique, to look for involvement of this phenomenon in weedinterference with rice grown on hydromorphic soils. The results suggest alevel of toxic substances in some of the weed species that affect the growth
of rice seedlings. Soils on which uniform stands of the weeds grew and leafaqueous extracts were used, because , under field conditions, the released
substances may not be available in the root zone. They can be brokendown by microorganisms, transformed to a more toxic form, tied up by soilparticles, or lost through evaporation or leaching. The presence of a toxicsubstance in leaf extract of a given species is not necessarily allelopathic,
unless it accumulates in a sufficient amount to exert an inhibitory effect.Another difficulty is to simulate natural environmental conditions in thelaboratory or greenhouse. For conclusive evidence, one should be able todevise a method based on Koch's postulates as applied to identification ofa previously unknown disease. The toxic substance must be isolated,identified, and applied to a test species to reproduce symptoms similar tothose originally observed, although avoiding contamination in the isolationprocess is not always easy.

107CONCLUSIONS
1. On hydromorphic soils, direct-seeded rice and weeds emerge at the
same time. Consequently, weed interference occurs soon afterplanting.
2. The critical period of weed interference in direct-seeded rice grown onhydromorphic soils in subhumid tropics starts from the second week
until the sixth week after crop emergence.
3. In addition to grain yield, rice tiller and panicle numbers appeared to begood indicators of crop response to weed interference.
4. Jungle rice was more competitive than wild poinsettia. It caused thegreatest damage to rice plants at densities as low as 40 plants m-2.Intraspecific competition among plants of the crop and weeds, had an
impact on the outcome of weed interference.
5. Based on growth analysis and plant form, jungle rice is a potentialcompetitor for water and nutrients, while wild poinsettia has a greaterpotential to compete for light when associated with rice.
6. Data from competition studies, where species of different life forms are
involved, should be interpreted with caution. In such situation,assessment of the outcome of competition based on relative, ratherthan absolute, values would be more suitable.
1 087. Methods of analysis also should include both qualitative and quanti-
tative assessments of the competitive relationships. Perhaps, the useof the expanded yield-density model is an alternative for interpretationof data obtained from replacement series experiments.
8. The outcome of weed interference was mainly due to weed
competition for limited resources, because there was only littleevidence for chemical inhibition of the crop growth. However,
chemical interaction seemed to occur in rice associations with wild
poinsettia and F. littoralis .

109REFERENCES
1. Akobundu, I. 0. 1987. Weed Science in the Tropics: Principlesand practices. John Wiley and Sons, Chichester.
2. Akobundu, I. 0. and A. Ahissou. 1985. Effect of interrow spacingand weeding frequency on the performance of selected ricecultivars on hydromorphic soils of West Africa. Crop Prot. 4: 71-76.
3. Akobundu, I.O. and S.O. Fagade. 1978. Weed problems of Africarice lands. Pages 181-192 in Buddenhagen, W.I. and G.J. Persley,eds. Rice in Africa. Academic Press, London.
4. Andrade, V.A. 1983. Effect of different densities of ricegrass(Echinochloa spp.) on the yield of irrigated rice (0. sativa L.). RiceAbstr. 6(7): 175.
5. Antonovics, J. and D.A. Levin. 1980. The ecological and geneticconsequencies of density-dependent regulation in plants. Annu.Rev. Ecol. Syst. 111: 411-452.
6. Barnes, J. P. and A.R. Putnam. 1986. Evidence for allelopathy byresidues and aqueous extracts of rye (Secale cereale). Weed Sci.34: 384-390.
7. Bell, D.T. and D.E. Koeppe. 1972. Noncompetitive effects of giantfoxtail on the growth of corn. Agron. J. 64: 321-325.
8. Bertrand, R. 1973. Contribution a I'etude hydrolique, pedologiqueet agronomique des sots gris sableux hydromorphes de Casamance(Senegal). L'Agronomie Tropical 28: 1145-1192.
9. Bhan, V.M. 1983. Effects of hydrology, soil moisture regime andfertility management on weed populations and their control in rice.Pages 47-56 in Proc. Conf. Weed Control in Rice. Aug. 31-Sept. 4,1981. International Rice Research Institute. Los Banos,Philippines.
10. Bhowmik, P.C. and J.D. Doll. 1982. Corn and soybean response toallelopathic effect of weed crop residues. Agron. J. 74: 601-606.

1 1 011. Bhowmik, P.C. and J.D. Doll. 1984. Allelopathic effects of annual
weed residues on growth and nutrient uptake of corn andsoybeans. Agron. J. 76: 383-388.
12. Black, C.C., T.M. Chen, and R.H. Brown. 1969. Biochemical basisfor plant competition. Weed Sci. 17: 338-344.
13. Bleasdale, J. K. A. 1967. Systematic designs for spacingexperiments. Exp. Agric. 3: 73-85.
14. Boerema, E.B. 1963. Control of barnyardgrass in rice in theMurrumbigee irrigation area using 3,4-dichloropropionanalide.Aust. J. of Exp. Agric. Anim. Husb. 3: 333-337.
15. Bowden, B.A. and G. Friesen. 1967. Competition of wild oats(Avena fatua L.) in wheat and flax. Weed Res. 7: 349-359.
16. Buchanan, G.A. and E.R. Burns. 1970. Influence of weedcompetition on cotton. Weed Sci. 18: 149-154.
17. Burkholder, P.R. 1952. Cooperation and conflict among primitiveorganisms. Amer. Sci. 40: 601-631.
18. Carlson, H.L. and J.E. Hill. 1985. Wild oat (Avena fatua)competition with spring wheat: Plant density effects. Weed Sci.33: 176-181.
19. Chubb, W.O. and G.H. Friesen. 1985. Wild oat interference insunflower. Can. J. Plant Sci. 65: 219-222.
20. Connolly, J. 1986. On difficulties with replacement-seriesmethodology in mixture experiments. J. Applied Ecol. 23: 125-137.
21. Connolly, J. 1987. On the use of responsive models in mixtureexperimenys. Oecologia 72: 95-103.
22. Crauford, R. and R.M. Lembela. 1978. Country Statement. Pages351-352 in Buddenhagen, I.W. and G.J. Persley, eds. Rice in Africa.Academic Press, New York.
23. Cruz, R.T., J.C. O'Toole, and K. Moody. 1983. Leaf water potentialof weeds and rice (0. sativa). Weed Sci. 31: 410-414.

1 1 124. Dawson, J.H. 1964. Competition between irrigated field beans
and annual weeds. Weeds 12: 206-208.
25. Dawson, J.H. 1970. Time and duration of weed infestation inrelation to weed-crop competition. South. Weed Sci. Soc. 23: 13-25.
26. De Datta, S.K. 1972. Chemical weed control in tropical rice in Asia.PANS 18: 433-440.
27. De Datta, S.K. 1974. Weed control in rice: present status and futurechallenge. Philipp. Weed Sci. Bull. 1: 1-16.
28. De Datta, S.K., J.C. Moomaw and R.T. Bantilan. 1969. Effects ofvarietal types, methods of planting and nitrogen level on competitionbetween rice and weeds. Pages 152-163 in Proc. Asian-PacificWeed Control Interchange. College of Agric. University of ThePhilippines, Los Banos, Laguna, Philippines.
29. Dekker, J.H., W.F. Meggitt, and A.R. Putnam. 1983. Experimentalmethodologies to evaluate allelopathic plant interactions: theAbutilon theophratis-Glycine max model. J. of Chem. Ecol. 9:945-981.
30. Dominicata, J. and E. Alcala. 1983. Critical stage of rice (IR-54) asinfluence by weed control duration. Newsletter of the Weed Sci. Soc.of the Philippines. 11 : 4-5.
31. Donald, C.M. 1958. The interaction of competition for light and fornutrients. Aust. J. of Agric. Sci. 9: 421-435.
32. Einhellig, F.A. 1986. Allelopathic effects on plant processes. Pages171-188 in Putnam, A.R. and C. Tang, eds. The science ofallelopathy. John Wiley and Sons.
33. Evans, G.C. 1972. The quantitative analysis of plant growth.Univ. of California Press, Berkeley.
34. Fisher, R.A. and R.E. Miles. 1973. The role of spatial pattern inthe competition between crop plants and weeds: a theoreticalanalysis. Math. Biosci. 18: 335-350.
35. Food and Agricultural Organisation. 1985. Production Yearbook.Rome: FAO stat. ser. 39(17).

1 1 236. Food and Agricultural Organisation. 1987. Food Outlook. Rome:
FAO. No.5.
37. Fuerst, E.P. and A.R. Putnum. 1983. Separating competitive andallelopathic components of interference: Theoritical principles. J. ofChem. Ecol. 9: 937-944.
38. Gallagher, E.J. 1984. Cereal production. Butterworths, RoyalDublin Soc.
39. Gilmour, J.T. 1985. Predicting rice grain yield from dry matterproduction at late tillering. Agron. J. 77: 169-170.
40. Grime, J.P. 1977. Evidence for the existence of three primarystrategies in plant and its relevance to ecological andevolutionary theory. Am. Nat. 111: 1169-1194.
41. Grime, J.P. and R. Hunt. 1975. Relative growth rate: its range andadaptive significance in local flora. J. Ecol. 63: 393-422.
42. Harper, L.J. 1961. Approaches to the study of plant competition.Mithorpe, F.L., ed. Mechanisms in biological competition. Soc. Exp.Biol. Symp. 15: 1-39.
43. Harper, L.J. 1977. Population biology of plants. Academic Press,London.
44. Hill, J.E. 1973. Methods of analysing competition with specialreference to herbage plants: II. Effects of associate plants. Camb.:J. Agric. Sci. 81: 91-98.
45. Hill, J.E. and P.W. Santelman-n. 1969. Competitive effects ofannual weeds on Spanish peanut. Weed Sci. 17: 1-2.
46. Hoagland, D.R. and D.I. Arnon. 1950. The water culture method ofgrowing plants without soil. California Agricultural ExperimentStation Circular 347.
47. International Institute of Tropical Agriculture. 1973. Annual report for1972. IITA, Ibadan, Nigeria.
48. International Institute of Tropical Agriculture. 1976. Annual report for1975. IITA, Ibadan, Nigeria.

1 1 349. International Institute of Tropical Agriculture. 1980. Annual report for
1979. IITA, Ibadan, Nigeria.
50. International Institute of Tropical Agriculture. 1982. Annual report for1981. IITA, Ibadan, Nigeria.
51. International Rice Research Institute. 1983. Annual report for 1982.IRRI, Los Banos, Philippines.
52. Jolliffe, P.A., A.N. Minjas, and V.C. Runeckles. 1984. A reinter-pretation of yield relationships in replacement series experiments.J. Applied Ecol. 21: 227-243.
53. Kleinig, C.R. and J.C. Noble. 1968. Competition between rice andbarnyard grass (Echinochloa): I. The influence of weed densityand nutrient supply in the field. Aust. J. Exp. Agr. Anim. Husb. 8:358-363.
54. Lawson, T.L. 1980. Agroclimatic constraints to dryland rice produc-tion in West Africa. Pages 37-45 in Proc. Symposium Agrometeo-rology of rice crop. IRRI, Los Banos, Philippines.
55. Lolas, P.C. 1986. Weed community interference in burley andoriental tobacco (Nicotiana tabacum ). Weed Res. 26: 1-7.
56. Mack, R.N. and J.L. Harper. 1977. Interference in dune annuals:spatial pattern and neighbourhood effects. J. Ecol. 65: 345-363.
57. Moody, K. 1978. Crop-weed competition. Philipp. J. Weed Sci. 5:28-43.
58. Moormann, F.R. 1973. General assessment of lands in which riceis grown in West Africa. WARDA doc. S/73/10. West Africa RiceDevelopment Association, Monrovia, Liberia.
59. Moormann, F.R. and W.J. Veldkamp. 1978. Land and rice in Africa:Constraints and potentials. Pages 29-43 in Buddenhagen,I.W. andG.J. Persley, eds. Rice in Africa. Academic Press, London.
60. Munger, P.H., J.M. Chandler, J.T. Cothren, and F.M. Hons. 1987.Soybean (Glycine max.)-Velvetleaf (Abuilon theophrasti)interspecific competition. Weed Sci. 35: 647-653.

1 1 461. Nelder, J.A. 1962. New kinds of systematic designs for spacing
studies. Biometrics 18: 283-307.
62. Noda, K. 1973. Competitive effects of barnyardgrass (E. crus-gaffi)on rice. Pages 145-150 in Proc. Asian-Pacific Weed Sci. Conf.March 12-16, 1973. Rotorua, New Zealand.
63. Noda, K., K. Ozawa, and K. Ibaraki. 1968. Studies on the damage torice plants due to weed competition (effect of barnyardgrasscompetition on growth, yield and some eco-physiological aspectsof rice plants). Bull. Kyushu Agric. Exp. Stn. Chikugo, Japan:Fukuoka Prefecture. In Weed Abstr.18 : 290-291.
64. Okafor, L.I. and S.K. De Datta. 1976. Competition between uplandrice and purple nutsedge for nitrogen, moisture and light. Weed Sci.24 : 43-46.
65. Pande, H.K. and V.M. Bhan. 1966. Effects of row spacing and levelof fertilization on growth , yield and nutrient uptake of upland paddyand associates weeds. II Riso 15: 47-67.
66. Patterson, D.T. 1982. Effect of light and temperatures on weed/cropgrowth and competition. Pages 407-421 in Hatfield, J.L. and I.J.Thomason, eds. Biometeorology and Integrated PestManagement. Academic Press, New York.
67. Posner, J.L. 1978. Radiation solaire et croissance et productivite'du riz pluvial (Oryza sativa) en Afrique de I' Ouest. AgronomieTropicale 3: 275-290.
68. Potter, J.R. and J.W. Jones. 1977. Leaf area partitioning as animportant factor in growth. Plant Physiol. 59:10 -14.
69. Putnam, A.R. and C. Tang. 1986. Allelopathy: state of the science.Pages 1-47 Putnam, A.R. and C. Tang, eds. The science ofallelopathy. John Wiley and Sons, New York.
70. Radosevich, S.R. 1986. Methods to study crop and weedinteractions. In Altieri, M.A. and M.Z. Liebman, eds. Weedmanagement in agroecosystems: Ecological approaches. CRCPress.
71. Radosevich, S.R. and J.S. Holt. 1984. Weed Ecology: Implicationsfor Vegetation Management. John Wiley and Sons, New York.

1 1 572. Radford, P.J. 1967. Growth analysis formulae- their use and
abuse. Crop Sci. 7: 171-175.
73. Ralph, O.E. 1976. Modeling of plant growth. Annu. Rev. PlantPhysiol. 27: 407-434.
74. Rice, E.L. 1974. Allelopathy. Academic Press, New York.
75. Rice, E.L. 1979. Allelopathy- an update. Bot. Rev. 45:15 -109.
76. Rice, E.L. 1984. Allelopathy. Academic Press, New York.
77. Ries, S.K. 1976. Subtoxic effects on plants. Pages 313-344 inAudus, L.J., ed. Herbicides: Physiology, biochemistry and ecology.2nd edition. Academy Press, New York.
78. Roush, M.L. and S.R. Radosevich. 1985. Relationships betweengrowth and competitiveness of four annual weeds. J. AppliedEcol. 22: 895-905.
79. Sagar, G.R. and J.P. Harper 1961. Controlled interference withnatural populations of Plantago lanceolata , P. major and P. media.Weed Res. 1: 163-176.
80. Sahai, B. and V.M. Bhan. 1984. Competition for nitrogen betweenweeds and drilled rice- effect of time of weed removal. Proc.Annual conf. Indian Soc. Weed Sci. Haryana, India. Reported inRice Abstr. 7 : 206.
81. Sano, Y., R. Sano, and H. Morighima. 1984. Neighbour effectsbetween two co-occuring rice species, 0. sativa and 0. glaberimaJ. Applied Ecol. 21: 245-254.
82. Schreiber, M.M. 1982. Modeling the biology of weeds forintegrated weed management. Weed Sci. 30: Supplem. 1: 3-16.
83. Schreiber, M.M. and J.L. Williams, Jr. 1967. Toxicity of rootresidues of weed grass species. Weed Sci. 15: 80-81.
84. Schwaar, D.C. 1983. Weed control of paddy rice in fadama, bollsand other flooded lands of WEst Africa. Pages 158-166 in Proc.Biannual Conf.West African Weed Sci. Soc. October 17-22,Abidjan, Cote d' Ivoire.

1 1 685. Silvertown, J.W. 1982. Introduction to plant population ecology.
Longman, London.
86. Shinozaki, K. and T. Kira. 1956. Intraspecific competition amonghigher plants. VII. Logistic theory of the C-D effect. J. of the Institute ofPolytechnics, Osaka City University 7: 35-72.
87. Singh, S.P. and P. Ram. 1984. Critical period of crop-weedcompetition in rice. In Proceeding of the Annual Conf. of IndianSoc. of Weed Sci. Haryana, India. Reported in Rice Abstr. 7(10):206.
88. Smith, R.J., Jr. 1968. Weed competition in rice. Weed Sci. 16:252-255.
89. Smith, R.J., Jr. 1974. Competition of barnyardgrass with ricecultivars. Weed Sci. 22: 423-426.
90. Smith, R.J., Jr. 1984. Competition of spreading dayflower(Commelina diffuse) with rice (Oryza sativa). Weed Sci. 32:116-119.
91. Spitters, C.J.T. 1983. An alternative approach of the analysis ofmixed cropping experiments: I. Estimation of competition effects.Neth. J. Agric. Sci. 31:1 -11.
92. Spitters, C.J.T. and J.P. van den Bergh. 1982. Competitionbetween crop and weeds: A system approach. Pages 137-148 inHolzner, W. and N. Numata, eds. Biology and ecology of weeds.W. Junk, The Hague.
93. Swain, D.J. 1973. Weeds and weed control in rice in New SouthWales, Australia. Pages 134-139 in Proc. Asian-Pacific Weed Sci.Soc. Conf. March 12-16. Rotorua, New Zealand.
94. Swain, D.J., M.J. Nott and R.B. Trounce. 1975. Competitionbetween Cyperus difformis and rice: the effect of time of weedremoval. Weed Res. 15: 149-152.
95. Thurston, J.M. 1962. The effect of competition from cereal crops onthe germination and growth of Avena fatua L. in naturally infestedfield. Weed Res. 2: 192-207.

1 1 796. Tisdell, C.A., B.A. Auld, and K.M. Menz. 1984. Crop loss elasticity
in relation to weed density and control. Agric. Syst. 13: 161-166.
97. Trenbath, B.R. 1976. Plant interactions in mixed crop communities.In Papendick, R.I., P.A. Sanchez, and G.B. Triplett, eds. Multiplecropping. American Soc. of Agronomy, Special Publication 27:129-169.
98. Trenbath, B.R. and P.L. Harper. 1973. Neighbour effects in thegenus Avena: I. Comparison of crop species. J. Appl. Ecol. 10:379- 400.
99. Utomo, H. 1981. Weed competition in upland rice. Pages 101-107in Proc. of the Asian-Pacific Weed Sci. Conference. Nov. 22-29.Bangalore, India.
100. Watkinson, A.R. 1980. Density dependence in single-speciespopulations of plants. J. of Theor. Biol. 83: 345-357.
101. Weiner, J. 1982. A neighborhood model of annual-plant inter-ference. Ecology 63: 1237-1241.
102. Welbank, P.J. 1961. A study of the nitrogen and water factors incompetition with Agropyron repens ( L.) Beauv . Ann. Bot. 25(98):116-137.
103. Wells, G.J. 1979. Annual weed competition in wheat. Weed Res.19: 185-192.
104. Weston, L.A. and A.R. Putnam. 1986. Inhibition of legume seedlinggrowth by residues and extracts of quackgrass (Agropyron repens).Weed Sci. 34: 366-372.
105. Wiedman, S.J. and A. P. Appleby. 1972. Plant growth stimulationby sublethal concentrations of herbicides. Weed Res. 12: 65-74.
106. Willey, R.W. and S.B. Health. 1969. The quantitative relationshipsbetween plant population and crop yield. Advances in Agron. 21:281-321.
107. Williams, J.D., R.H. Groves, P.W. Weiss, and A.O. Nicholls. 1984.Competition between wheat and two Emex species. Aust. J. Agric.Res. 35: 453-461.

1 1 8108. Wilson, H.P. and R.H. Cole. 1966. Morningglory competition in
soybeans. Weeds 14: 49-51.
109. Wit, C.T. de. 1960. On competition. Verls. Landbouwkd Onderz.66(8): 1-82.
110. Wit, C.T. de and J.P. van den Bergh. 1965. Competition betweenherbage plants. Neth. J. Agric. Sci. 13: 212-221.
111. Zimdahl, R.L. 1980. Weed competition: a review. InternationalPlant Protection Center, Oregon State University. Corvallis,Oregon.

APPENDIX

1 1 9
Table A.1. Rice tillers (No. plant-1) and yield (Kg ha-1), weed density )No.m-2), and weed dry weight (g m-2) as influenced by time of weeding:weed-free (WF) or unweeded (UNW) for a certain period of time (weeksafter emergence) and then left unweeded or weed-free until harvest.
Replication TimeYield
WF UNWTillers
WF UNWWeed-free
density dry weight
1 0 266.4 1977.6 5 11 248 131.91 2 1188.6 1783.0 5 9 1060 177.41 4 1875.2 1799.4 8 9 160 18.71 6 2029.0 2260.4 10 9 100 5.81 8 2033.0 1578.0 8 7 192 14.11 2+6 1797.4 1797.4 9 9 432 21.31 4+8 1291.2 1291.2 10 10 56 5.4
2 0 862.8 1600.8 4 10 460 15.82 2 1788.0 2557.2 7 7 268 112.62 4 1164.2 1496.8 7 8 204 63.12 6 1465.6 1611.2 9 8 92 5.02 8 1968.8 1788.0 7 7 76 3.52 2+6 1927.2 1927.2 9 9 36 .72 4+8 1964.6 1964.6 9 9 200 50.5
3 0 215.6 2128.6 3 8 228 94.73 2 1224.4 1764.4 8 10 108 9.43 4 768.2 1883.8 10 9 24 1.73 6 1360.4 1733.1 10 8 8 .63 8 1172.0 722.8 10 7 20 1.23 2+6 1295.6 1295.6 9 9 12 .43 4+8 1412.8 1412.8 12 12 8 .4
4 0 711.6 1785.4 6 7 128 32.14 2 701.2 1731.4 5 8 172 54.94 4 1450.4 1479.8 8 8 148 9.74 6 1157.4 2162.0 6 9 56 2.64 8 1743.4 1144.8 4 5 60 4.54 2+6 1695.4 1695.4 9 9 80 4.14 4+8 1214.0 1214.0 8 8 60 1.7

1 20
Table A.2. Rice yield (Kg ha-1) and tillers (No. per linear meter) asinfluenced by time of weeding: weed-free (WF) or unweeded (UNW) for acertain period of time (weeks after emergence) and then left unweeded orweed-free until harvest.
Replication TimeYield
WF UNW WFTillers
UNW
1 0 2192.6 4502.1 78 741 1 1283.4 3647.6 47 801 2 1679.4 3453.5 57 721 4 3778.8 2729.0 79 761 6 4568.5 3046.8 93 701 8 4041.9 2117.1 82 51
2 0 2269.4 7422.5 50 782 1 1833.9 4442.8 76 942 2 3393.3 2943.0 75 942 4 2475.4 3334.9 63 792 6 5299.3 3641.9 62 632 8 5334.0 2386.3 96 72
3 0 2875.8 5643.0 59 963 1 3364.8 4143.8 60 573 2 3204.5 4225.8 87 873 4 4380.6 2658.4 78 723 6 5421.6 2636.4 71 593 8 5507.4 2932.0 70 60

121
Table A.3. Weed density (No.m-2) and dry weight (g m-2) as influenced bytime of weeding: weed-free (WF) or unweeded (UNW) for a certain period oftime (weeks after emergence) and then left unweeded or weed-free untilharvest.
Replication TimeDensity
WF UNWDry weight
WF UNW
1 0 4224 0 451.5 01 1 2352 0 103.6 01 2 3120 0 80.1 01 4 1888 0 45.6 01 6 0 2416 0 91.81 8 0 3273 0 79.2
2 0 4072 0 209.4 02 1 4656 0 255.3 02 2 3120 0 45.2 02 4 2440 0 43.2 02 6 0 4936 0 361.52 8 0 2720 0 367.2
3 0 1352 0 632.8 03 1 448 0 212.8 03 2 1080 0 413.6 03 4 136 0 82.4 03 6 0 776 0 436.03 8 0 568 0 451.5

1 22Table A.4. Growth of rice (R), E. colona (Ec), and E. heterophylla (Eh):Absolute growth (G), leaf area ratio (LAR), and net assimilation rate (NAR)at different growth periods (2, 4, 6, and 8 weeks after emergence).
Replication Species 2Growth period4 6 8
Absolute growth1 R 1.1 2.3 4.1 25.31 Ec 1.1 2.2 11.4 24.71 Eh 1.1 2.2 6.5 16.1
2 R 1.1 2.1 4.7 26.02 Ec 1.0 2.0 12.0 25.32 Eh 1.0 2.0 6.1 14.0
3 R 1.0 2.2 4.5 26.73 Ec 1.0 2.1 11.9 25.13 Eh 1.0 2.1 5.9 15.1
4 R 1.0 2.2 4.7 26.04 Ec 1.0 2.2 12.2 25.14 Eh 1.0 2.1 6.8 15.0
LAR1 R 756.5 269.7 183.9 123.71 Ec 726.0 366.2 132.7 59.41 Eh 333.2 550.7 154.4 84.1
2 R 430.0 257.9 191.8 117.62 Ec 760.0 266.7 141.5 64.42 Eh 310.0 240.0 150.4 115.3
3 R 385.0 322.9 224.5 144.73 Ec 690.5 578.3 113.6 134.93 Eh 230.7 296.0 134.6 91.4
4 R 484.0 266.4 201.0 146.04 Ec 850.0 920.0 134.0 68.44 Eh 335.8 341.3 180.8 73.3
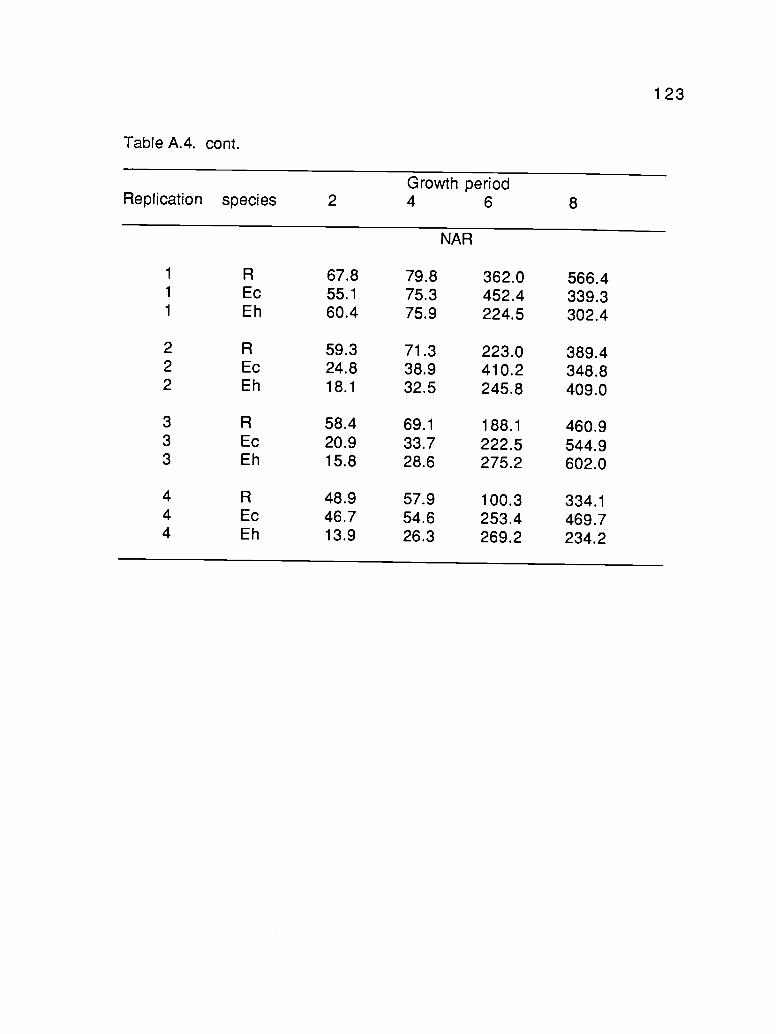
Table A.4. cont.
1
Growth periodReplication species 2 4 6 8
NAR
1 R 67.8 79.8 362.0 566.41 Ec 55.1 75.3 452.4 339.31 Eh 60.4 75.9 224.5 302.4
2 R 59.3 71.3 223.0 389.42 Ec 24.8 38.9 410.2 348.82 Eh 18.1 32.5 245.8 409.0
3 R 58.4 69.1 188.1 460.93 Ec 20.9 33.7 222.5 544.93 Eh 15.8 28.6 275.2 602.0
4 R 48.9 57.9 100.3 334.14 Ec 46.7 54.6 253.4 469.74 Eh 13.9 26.3 269.2 234.2
23

1 24
Table A.5. Plant height (cm) and fresh weight (g /5 plants) of rice grown onsoils collected from sites where E. colona (Ec), E. heterophylla (Eh), C.difformis (Cd), and F. littoralis (Fl) were growing in monocultures, and ongreenhouse soil (Gh), with and without nutrient solution.
Plant heightReplication Treatment With nutrient Without
Fresh weightWith nutrient Without
1 Ec 17.4 17.5 1.28 1.311 Eh 15.9 15.0 1.00 1.091 Cd 18.2 20.0 2.10 1.341 Fl 10.9 11.4 .50 .301 Gh 20.9 21.0 2.78 2.46
2 Ec 16.2 20.9 .90 2.502 Eh 20.6 21.6 2.06 2.172 Cd 20.6 19.0 1.85 1.412 Fl 11.5 10.5 .40 .362 Gh 23.1 21.7 2.77 3.30
3 Ec 19.6 17.2 2.12 1.613 Eh 17.2 19.6 1.75 3.063 Cd 17.4 17.9 1.07 1.423 Fl 10.2 9.7 .41 .283 Gh 21.5 21.9 2.78 3.67
4 Ec 14.7 16.7 1.04 1.544 Eh 18.7 17.8 2.40 1.064 Cd 19.5 15.3 1.94 1.554 Fl 13.5 10.0 .58 .364 Gh 23.4 20.7 3.74 4.78

1 25
Table A.6. Different concentrations of aqueous extracts: 1/10, 1/20, and1/40 (g /ml distilled water) of plant materials of selected weed species onshoot and radicle length (cm) of rice and cowpea. E. colona (Ec), E.heterophylla (Eh), C. difformis (Cd), and F. littoralis (F1). Distilled water (Dw)was used as control.
Replication Treatment 1/10
Rice
1/20Cocentrarion1/40 1/10
Cowpea
1/20 1/40
Shoot length1 Ec 4.2 4.9 5.1 4.0 6.5 10.01 Eh 4.1 4.9 5.6 0 6.5 14.01 Cd 3.8 5.4 4.4 0 6.6 10.51 Fl 3.6 5.1 4.4 5.4 10.5 3.81 Dw 4.5 5.3 5.1 9.5 6.8 9.8
2 Ec 4.4 5.0 4.8 2.8 7.5 7.42 Eh 2.7 4.8 4.8 0 11.0 11.02 Cd 3.2 5.0 5.2 0 7.2 02 Fl 3.8 5.5 5.3 2.9 12.5 5.52 Dw 6.3 4.9 4.7 10.1 5.8 8.3
3 Ec 4.0 5.8 6.0 3.6 8.3 10.73 Eh 0 5.3 5.4 1.5 0 03 Cd 4.1 4.8 5.6 2.4 4.2 03 Fl 4.2 5.0 5.7 2.5 5.8 8.83 Dw 4.6 5.6 5.5 6.4 7.7 9.6
4 Ec 4.9 5.5 5.8 2.8 8.6 8.04 Eh 3.5 5.7 4.9 0 0 04 Cd 3.3 6.2 4.9 0 8.9 12.54 Fl 3.8 4.9 5.6 3.0 3.8 04 Dw 3.9 4.7 5.0 6.5 0 10.0
Radicle length1 Ec 5.6 6.2 6.7 3.4 5.0 6.51 Eh 3.4 8.7 9.5 0 4.6 6.01 Cd 6.4 6.8 6.4 0 5.8 8.21 Fl 5.2 5.8 7.2 7.7 6.0 4.41 Dw 4.5 5.3 5.1 9.5 6.8 9.8

Table A.6. cont.
1
Replication Treatment 1/10Rice1/20 1/40 1/10
Cowpea1/20 1/40
2 Ec 6.9 7.5 7.2 3.8 5.0 6.12 Eh 4.6 8.0 7.0 0 6.5 4.32 Cd 5.3 7.5 5.8 0 5.1 02 Fl 5.5 8.5 6.6 3.6 6.0 5.62 Dw 9.2 9.2 6.3 7.3 7.5 4.4
3 Ec 6.4 7.0 7.8 3.9 5.7 8.53 Eh 0 8.6 8.0 3.1 0 03 Cd 7.3 6.0 7.5 4.5 3.2 7.53 Fl 6.6 6.7 7.4 4.2 7.0 13.33 Dw 6.0 8.2 7.2 5.6 5.9 7.4
4 Ec 6.6 7.3 8.7 4.1 5.2 6.24 Eh 4.6 9.3 9.4 0 0 04 Cd 5.8 8.7 7.7 0 7.4 5.54 Fl 5.5 6.6 7.7 5.0 3.1 04 Dw 5.2 8.8 0 3.5 0 6.0
26

127
Table A/. Tillers (No plant-1) and dry weight (g plant-1) of rice (R) and E.colona (Ec), and branches of E. heterophylla (Eh) grown in pots:monoculture data at harvest. Densities: 1, 2, 3, qnd 4 plants per pot.
Replication Density Species Tillers Branches Dry weight
1 1 R 39 133.61 1 Ec 61 31.91 1 Eh 13 14.71 2 R 20 65.51 2 Ec 21 24.91 2 Eh 8 7.81 3 R 24 48.61 3 Ec 17 18.81 3 Eh 7 7.21 4 R 11 29.41 4 Ec 13 13.11 4 Eh 7 5.6
2 1 R 30 97.82 1 Ec 43 48.12 1 Eh 5 8.42 2 R 19 55.92 2 Ec 22 23.92 2 Eh 7 8.52 3 R 14 38.02 3 Ec 19 17.32 3 Eh 7 7.62 4 R 10 28.32 4 Ec 12 11.12 4 Eh 3 2.1
3 1 R 37 94.53 1 Ec 45 48.43 1 Eh 11 12.93 2 R 35 51.03 2 Ec 29 30.23 2 Eh 8 4.13 3 R 13 37.23 3 Ec 22 18.33 3 Eh 5 4.2
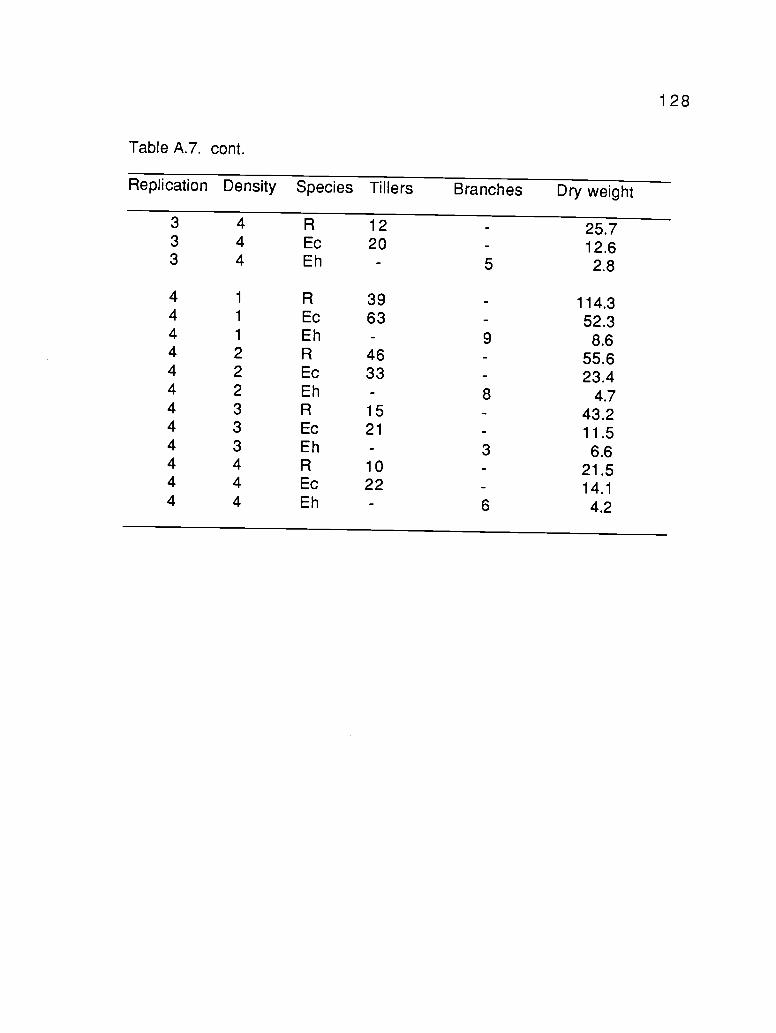
128
Table A/. cont.
Replication Density Species Tillers Branches Dry weight
3 4 R 12 25.73 4 Ec 20 12.63 4 Eh 5 2.8
4 1 R 39 114.34 1 Ec 63 52.34 1 Eh 9 8.64 2 R 46 55.64 2 Ec 33 23.44 2 Eh 8 4.74 3 R 15 43.24 3 Ec 21 11.54 3 Eh 3 6.64 4 R 10 21.54 4 Ec 22 14.14 4 Eh 6 4.2

129
Table A.8. Individual plant weight (g plant-1) of E. colona and E.heterophylla in each plot. Data obtained from monocultures of the additionseries experiment at densities of 10, 20, 40, and 80 plants m-2.
Replication Density E. colona E. heterophylla
1 10 14.7 3.31 20 15.2 2.71 40 13.9 1.61 80 6.0 1.6
2 10 15.7 4.12 20 15.8 2.32 40 11.0 1.72 80 7.4 1.6
3 10 15.7 4.13 20 15.2 1.83 40 7.5 1.93 80 7.9 1.5

130
Table A.9. Reciprocal weight of individual rice plant in the rice-jungle rice(Rvs Ec) and rice-wild poinsettia (R vs Eh) associations. Weeds wereplanted at densities of 10, 20, 40, and 80 plants m-2, and rice at 20, 40, 60,and 80 plants m-2.
Replication Rice density Weed density R vs Ec R vs Eh
1 20 10 .074 .0621 20 20 .076 .0661 20 40 .083 .0541 20 80 .086 .0791 40 10 .060 .0641 40 20 .060 .0621 40 40 .077 .0761 40 80 .079 .0771 60 10 .122 .0891 60 20 .123 .0811 60 40 .141 .0751 60 80 .143 .0861 80 10 .133 .1191 80 20 .143 .1431 80 40 .145 .1411 80 80 .179 .104
2 20 10 .059 .0722 20 20 .054 .0772 20 40 .062 .0832 20 80 .076 .0822 40 10 .062 .0632 40 20 .062 .0662 40 40 .074 .0762 40 80 .076 .0832 60 10 .088 .1322 60 20 .090 .1252 60 40 .102 .1252 60 80 .086 .1392 80 10 .123 .1272 80 20 .139 .1672 80 40 .147 .1692 80 80 .137 .172

131
Table A9. cont.
Replication rice density Weed density R vs Ec R vs Eh
3 20 10 .060 .0713 20 20 .058 .0433 20 40 .083 .0713 20 80 .084 .0723 40 10 .077 .0763 40 20 .060 .0683 40 40 .078 .0723 40 80 .082 .0753 60 10 .128 .0933 60 20 .139 .0993 60 40 .123 .1003 60 80 .141 .1033 80 10 .143 .1393 80 20 .172 .1673 80 40 .145 .1453 80 80 .164 .164

132
Tasble A.10. Dry weight of individual plant of E. colona (Ec) and E.heterophylla (Eh) planted in different proportions (total density of 80 plantsm-2) in different rice background (0, 20, 40, 60, and 80 plants m-2).
EcDensity
Eh Rice EcDry weight
Eh
80 0 0 7.1 040 0 0 10.8 020 0 0 15.4 010 0 0 15.4 00 80 0 0 1.60 40 0 0 1.70 20 0 0 2.30 10 0 0 3.880 0 0 4.9 060 20 0 6.8 2.340 40 0 10.5 2.020 60 0 10.3 1.40 80 0 0 1.580 0 20 4.7 060 20 20 4.5 2.340 40 20 9.2 .620 60 20 13.3 .60 80 20 0 .980 0 40 4.5 060 20 40 5.1 1.540 40 40 5.5 .720 60 40 11.5 1.90 80 40 0 2.080 0 60 3.6 060 20 60 2.6 1.640 40 60 5.3 1.120 60 60 7.7 1.70 80 60 0 1.780 0 80 3.1 060 20 80 2.1 1.540 40 80 5.3 .920 60 80 6.4 1.20 80 80 0 1.4