Embed Size (px)
Citation preview

AN EVALUATION OF THE RISK-RETURN HYPOTHESIS
A STUDY OF SECURITY MARKET PERFORMANCE
by
ROBERT OWEN KIRBY, B.S., M.S.
A DISSERTATION
IN
BUSINESS ADMINISTRATION
Submitted to the Graduate Faculty of Texas Tech University in Partial Fulfillment of the Req[uiramants for
the Degree of
DOCTOR OF BUSINESS ADMINISTRATION
Approved
Accepted
Au^u^t, 197'4 i^uA

Td
fOoXZ
ACKNOWLEDGMENTS
I realize that it would be impossible to thank
everyone who aided ma in the preparation of this disserta
tion. However, I would like to recognize four individuals
who ware especially helpful. Let ma state my sincere
appreciation to Dr. William P. Dukes, my major professor,
for his untiring efforts in directing my research through
two drafts and innumerable corrections. I also am indebted
to Dr. Oswald D. Bowlin and Dr. Virgil T. Dock for thair
helpful criticisms concerning the content and cohasivanass
of the final copy. In addition, I am especially apprecia
tive of my wife, Pat, for her dedicated effort in typing,
editing, and proofreading.
11

TABLE OF CONTENTS
ACKNOWLEDGMENTS ii
LIST OF TABLES V
LIST OF FIGURES vi
I. INTRODUCTION 1
Statement of the Problem 2
Purpose of the Dissertation 3
Need for the Research 5
Organization of tha Study 8
II. REVIEW OF RELATED RESEARCH 10
University of Chicago Canter for Research in Security Prices 10
Closely Related Research 12
Sharpe's Empirical Research 13
Other Related Research 15
III. METHOD OF RESEARCH 26
The Data 26
The Market Index 27
Tha Risk Measure 28
Tha Index Modal of
Portfolio Theory 29
Measures of Return 31
Arithmetic Mean 32
Geometric Mean 33
Pure Yield 34
iii
The Market Periods 36
Tha Risk and Return Classes 39
Test of Hypothesis 40
Portfolio Returns 40 f
Pure Yields 43
rV. THE FINDINGS 45
Relationship Batwaan Risk and Return 45
Summary of tha Relationship
Batwaan Risk and Return 63
Long-Run Relationship 66
Pure Yield Performance 68
Summary of tha Relationship Batwaan Risk and Pura Yields . . . . 77
Relationship of Beta Coefficients 81 Distribution of Beta Coefficients 82
Beta as a Predictor of Return 85
V. SUMMARY, CONCLUSIONS, AND
IMPLICATIONS 90
Summary 90
Conclusions 91
Implications 94
Recommendations for
Future Research 96
BIBLIOGRAPHY 99
APPENDIX 106
iv

LIST OF TABLES
Table Page
1. Comparisons of Arithmetic Mean Portfolio Returns and Beta Coefficients by Market Periods 46
2. Comparison of Arithmetic Mean Portfolio Returns in Which There was a Significant Differanca . . . . 53
3. Performance Comparisons of Geometric Mean Portfolio Returns and Beta Coefficients by Market Periods 56
4. Comparison of Gaomatric Mean Portfolio Returns for Which There was a Significant Difference in Performance 62
5. Performance Comparisons Based on Pura Yields by Market Periods 69
6. Distribution of Sub-Pariod Beta Coefficients for 25 Stock Portfolios 7/6/62-5/22/70 83
7. Correlation Coafficiants of Individual Betas and Returns for 250 Securities by Market Periods 86
8. Correlation Coafficiants of Portfolio Betas and Returns by Market Periods 88

LIST OF FIGURES
Figure Page
1. Standard and Poor's 500 Average 1962-1970 38
2. Performance as Measured by tha Portfolio Possibility Line 72
3. Performance as Measured by tha Portfolio Possibility Line Whan the Borrowing and Landing Rates Differ 81
VI
CHAPTER I
INTRODUCTION
One of tha best documented propositions of invest
ment theory is that investors, on tha average, can realize
a higher rata of return by assuming greater risks. Con
sistent with this thesis is a long standing theory in
economics which hypothesizes that a positive relationship
exists batwaan a security's risk and its return (i.e.,
the greater tha risk or uncertainty of tha return, the
greater tha average return or risk premium). A common
objective of most investors is tha maximization of return,
and many baliava that tha means of acquiring greater returns
is to invest in securities that ara thought to be mora
risky.
Sauvain [61, p. 117] states that maximizing returns
by investing in low grade securities is based on what ha
calls tha "hypothesis of increasing returns." The theory
states that "in tha entire universe of investments the
rates of net return realized by all investors over long
time periods tends to increase with increasing poorness of
grade." Intuitively this type of relationship is expected.
Investors demand high rates of return as an inducement to
invest in risky assets whara lass risky investments ara
acceptable at lower rates of return. Investors who desire

high average returns must incur high risks and, simulta
neously, andura an increased chance of loss.
Investors frequently base thair decisions to buy
on tha supposition that risk and return ara positively
related. A rational investor obviously will not walcoma
risk for its own sake. Thus, tha only economic justifica
tion for an investor to acquire a mora risky asset is that
the return is baliavad to increase as soma function of tha
increase in risk. Tha fact that common stocks have pro
vided investors with a greater rata of return than bonds,
over extended periods of time, would land soma support to
this belief.
Statement of tha Problem
It has generally bean recognized that there is,
or should be, some trada-off batwaan risk and return.
Recently a substantial body of literature has evolved
giving explicit attention to tha assessment of risk and
tha rata of return on equity securities. Tha problem,
however, is that various thaoratical and empirical studies
have uncovered conflicting results. Data can be collactad
to show that risk and return ara related in a positive
manner, high risk securities tending to reward the investor
with higher returns. In similar fashion, empirical avidanca
is available to show that such a relationship does not
exi st.
In tha event that high risk securities do not reward
investors with greater returns, as tha general theory
seams to imply, than individuals who adhere to the thesis
unknowingly make sub-optimal investments. Presumably tha
quality of investment decisions can ba improved if results
from current empirical research ara made available to
investors as to whether or not, or to what extant, the
risk-raturn tradeoff has existed in tha past. Although
tha same relationship between risk and return may not
exist in tha future, it nonathalass can provide insight
pertaining to tha historical presumptions of investors.
Most of tha research in tha literature supports tha risk-
raturn thesis. However, there have bean enough studies
undertaken during tha past tan years which question various
aspects of tha general relationship to kaap tha subject
viable.
Purpose of tha Dissertation
The purpose of this dissertation is to determine
whether or not common stocks charactarizad by a high dagraa
of systematic risk afford an investor a higher rata of
return than securities with low systematic risk under
identifiable market trends.
To determine tha empirical relationship between
risk and return tha analysis is focused on two risk-raturn
evaluations. First, a comparison of returns is made for

securities in tan risk classifications over four different
market periods, tha derivation of which is explained in
Chapter III, to datarmine the pattern of returns relative
to the level of risk. The objective is to datarmina if
there is a diffarance in tha returns of the tan risk
classifications, and if so, batwaan which groups of
securities is the laval of returns different. Second, tha
relationship between risk and return is examined to investi
gate tha incramants in security returns. An explanation
of performance using pura yield as a measure is also
presented in Chapter III. Tha objactive of this procedure
is to examine security performance in terms of tha return
par unit of risk and to datarmina a relative performance
ranking for tha tan risk classes under market conditions
that advance and decline.
This approach is different from the majority of
previous research in that tha risk-raturn relationships
ara examined over market periods that ara charactarizad by
a specific trend. Unlike other studies in which tha
returns from common stocks ara computed over extended
time periods, tha methodology that is employed in this
dissertation examines tha performance of equity securities
in specific market periods that advance or decline. In
addition to tha four specific market periods, a fifth
period is considered in order to examine tha long run
relationship between risk and return for tha total eight
year period.
The major portion of related research has evaluated
security performance over a typical two, thraa, or five
year holding period, disregarding tha parformanca character
istics of securities under specific market trends, while
assuming that tha risk measure remained relatively constant
over time. Any insight, tharafora, relating to tha actual
parformanca of securities under different market conditions
would ba useful information for both tha individual investor
and the professional investment manager attempting tha
construction and maintenance of efficient portfolios. It
is baliavad that a segmented approach, considering security
performance over a specific market trend, provides mora
information for investors than simply knowing tha par
formanca patterns of equity securities over extended periods
of time in tha past.
Naad for tha Research
An opinion held by most writers in the field of
investment theory saams to ba that investors, in general,
have an aversion to risk. In order to avoid a risky
security, investors indirectly pay a premium in tha sansa
of accepting lower returns from securities of low risk.
In this respect, there is an implication that securities
which are charactarizad by a high degree of risk actually

reward the investor with a greater return. Although thara
is a lack of total agreement with this statement, tha
majority of researchers tend to hold this opinion.
A statement by Hirschlaifar [28, p. 117] seems
typical of tha literature on risk and return.
There will ordinarily be a positive premium on risk. That is, expected risky yields will be higher than sura yields. . . . That tha market does pay positive risk premiums is a statement that many people claim has in fact baan rafutad. However, I baliava that tha weight of tha avidanca indicates that risky madias of investment do in fact have higher expectad yields than secure madias.
Qnpirical research has generally shown that tha
actual risk-raturn relationships ara consistent with this
statement. For example, studies by Fisher and Lorie [23]
and Soldofsky and Millar [l2] propose that high quality
fixed income securities typically reward tha investor
with a lower return than mora speculative bonds or common
stocks. When tha comparison is made, however, batwaan
relative degrees of riskiness, vis-a-vis a sura return,
the findings become somewhat incongruous. Consider, for
•example, the following statement by Morton [52, p. 13].
During tha past faw years tha view has baan promulgated that common stocks having tha greatest price fluctuations will produce tha largest gain to tha investor. Academic theories and statistical studies have baan advanced in support of this thesis and soma mutual funds driving at "parformanca" appear to have baan guided by it. Tha basic assumptions of this theory ara: (1) that investors who take tha greater risk will make tha greater profit, and (2) that risk consists of and is measured by

instability, volatility in market price about the average. . . . Thara is simply no ground in reason or axparianca for tha belief that tha industries or companies with tha greater risk actually earn mora than those with lass risk.
Richardson \j>9, p. 99] supprts the findings of Morton in
the following statement.
. . . tha notion that investors, on average, can realize higher returns by taking greater risks can have no practical validity in investment decision-making. As it now stands, tha risk-reward theory must ba regarded as a rather arbitrary, academically inspired concept of what investing is all about.
Although conflicting avidanca can ba found in the
literature regarding tha risk-raturn tradeoff, tha position
taken by Sauvain [ 1, p. 117] might ba more appropriate.
Most theorists in investments and many practical investment managers baliava that in tha entire universe of security investment tha rates of net return realized by all investors over long periods of time tend to increase with increasing riskiness of securities. Thara ara logical reasons why thara should ba such a relationship of risk and returns and thara is good empirical evidence that it exists, but until tha data ara mora conclusive we shall regard it as a hypothesis.
Obviously much of the dissimilarity in tha findings
can be traced to tha specific methodology employed by tha
researcher. Specifically, tha surrogate for risk appears
to be tha most critical consideration. This problem is
unduly complicated since thara is limited agraamant among
both academicians and practitioners as to what measure
constitutes tha bast surrogate for risk. A second variable
that undoubtedly has a bearing on the findings is tha

8
market period used in tha respective analyses. The time
periods vary depending on tha date of the research and may
to some extant bias tha results. For this reason, it
appears that continued research will be required to keep
market participants abreast of the currant tradeoff under
market conditions that ara continually changing.
In addition to tha academic value of continued
research into tha risk-raturn hypothesis, tha findings
should also prove useful for tha practitioner. Investment
managers attempting to construct optimal portfolios through
diversification techniques would surely find tha results
of current empirical research informative. In the avant
that tha actual tradeoff between risk and return is
different from that which is normally expected, or that
certain groups of securities display unique return
characteristics, tha construction and balancing of optimal
portfolios bacoma extremely complicated. In this respect,
it would appear that tha quality of investment decisions
can be improved if tha most currant empirical evidence is
made available to decision makers concerning tha relationship
between risk and return.
Organization of tha Study
In attempting to present empirical evidence relating
to the nature of tha risk-raturn hypothesis, it is necessary
to develop and interpret a large amount of data. For this

reason only summary data related to tha subject of this
dissertation are presented in the main text.
Chapter II presents a concentrated review of
closely related research in the area of security performance
describing tha conclusions and research methodology
employed by the respective authors.
Chapter III describes tha data that ware used in
this analysis and tha related methodology and research
design that was developed to permit an examination of the
risk-return hypothesis for the period of study. Tha
measures of risk and return used in this research ara
introduced along with the determination of tha market
periods and tha development of tha respectiva risk classes.
Chapter IV presents the general findings of tha
analysis as they apply to tha objective of this dissertation.
Information is presented to examine and evaluate security
performance as wall as a summary review of these data
as they applied to tha risk-raturn hypothesis.
Chapter V presents a summary and conclusions with
implications and possible explanations for the findings.

CHAPTER II
REVIEW OF RELATED RESEARCH
During tha past twenty years, an extraordinary
amount of empirical research has bean conducted in tha
area of security performance. Throughout this period
many davalopmants have occurred in tha theory pertaining
to tha stock market and the way in which participants
currently view invastmant theory. Tha modifications have
occurred primarily because of axtansiva empirical research
and theoretical innovations in thraa areas: (1) tha
publication of Harry Markowitz's article on portfolio
theory [45], and tha subsequent work of William F. Sharpa
[62]; (2) tha extensive research and developmant of
efficient market theory and tha related implications for
security analysis; and (3) tha developmant of comprahansiva
data files and computer technology which make extensive
empirical research feasible.
University of Chicago Canter for Research in Security Prices
Tha Canter for Research in Security Prices, which
was established at tha University of Chicago in 1960
through an initial grant from tha brokerage firm of Merrill,
Lynch, Pierce, Fanner & Smith Inc., has become the most
10

11
prolific source of research on the security market since
its inception. Either through direct research effort by
the center itself, and its directors Lawrence Fishar and
James H. Loria, or in tha davalopmant of its data bank,
tha center has become involved either directly or indirectly
in much of tha published research in tha area of security
performance. As an indication of tha significant role
played by tha canter in research activities related to
security market parformanca. Jamas Lorie and Richard
Brealey, while compiling a collection of articles for a
recant publication [43], found that approximately half
of the thirty-savan articles selected for inclusion in
their readings book ware in one way or another connected
with tha canter. Tha articles ware either authored by
persons directly associated with the canter, based on its
data bank, or originally presented in working paper form
at the canter's semiannual meetings.
Over tha years tha number of articles appearing
for publication, dealing with a variety of topics related
to the stock market and security performance, has increased
steadily. This is not surprising since many people ara
interested in tha stock market, and perhaps an even greater
number have aspirations of future invastmant. To review
the literature to data on all related research would be
an insurmountable task; therefore, only tha mora recant
publications and findings, which relate specifically to

12
the topic of this dissertation, ara mentioned in this
review.
Closely Related Research
During tha past faw years a number of studies have
been undertaken to investigate what Morton [Sl] called
tha "performance invastmant strategy." Although consider
able differences exist in tha methodology employed by tha
various studies, such as data samples, time periods,
statistical techniques, and risk surrogates, tha principle
objective of each author was tha same, to investigate soma
aspect of tha risk-raturn hypothesis.
One of tha first major projects undertaken by tha
Center for Research in Security Prices was a comprahansiva
study of tha rates of return on common stock listed on
tha New York Stock Exchange for tha period 1926-1960. Tha
research was coordinated and directed by Fishar and Loria
who later published thair findings [23]. Tha objective of
thair analysis was to compare tha rates of return for
common stocks over twenty-two different time periods
under a variety of invastmant strategies. Return data
were presented for individuals of different tax brackets
under various assumptions concerning the rainvastmant of
dividends. The article was the first comprahansiva study
on the parformanca of securities listed on tha New York
Stock Exchange over an extended period of time. These
13
data indicated that on the average the rates of return on
common stocks have exceeded the average rates of return
on all classes of fixed income securities. According to
the authors the findings of tha research was "news" in
that tha relatively high rates of return on equity securi
ties surprised many investors.
A second article by Fishar and Loria [24] provided
additional information relative to their former study,
and extended their earlier analysis through 1965. Although
minor changes were made in the methodology, mainly the
number and length of time periods, tha results for tha
most part confirmed their earlier findings. A majority
of the original rates of return remained unchanged in tha
second study and provided empirical avidanca to support
the theory that investors seem to require additional
return to compensate for an increased exposure to risk.
Sharpa's Empirical Research
A theoretical modal introduced by William F. Sharpa
[63] in which he davalopad a market equilibrium theory of
asset prices under conditions of risk was tha forerunner
of a number of articles that examined tha risk-return
hypothesis. Sharpe's view was that tha market price of
a security was a function of two variables: (1) tha price
of time, or tha pura rate of interest; and (2) tha price
of risk, i.e., the additional return that is related to

14
the level of risk exposure. The author constructed a market
model which proposed that the relationship between tha
magnitude of tha risk and axpactad return is depicted by
a linear relationship.
In an empirical test of his model, Sharpa [65]
compared tha risk and return measures for thirty-four
mutual funds over the tan year period 1954-1963. Average
holding period returns were computed for each of tha funds
and tha standard deviation of returns was employed as tha
measure of risk. Utilizing a regression technique, Sharpa
concluded that there was significant correlation between
tha risk and return variables, through which ha was able
to depict an "intarmadiata line" as his estimate of the
linear relationship batwaan an asset's laval of risk and
its expected return.
In another study, Sharpa [67] investigated the
relationship batwaan tha rata of return and tha "volatility"
of mutual funds. Using volatility as tha measure of risk,
which is also raprasantad as a rasponsivanass measure, ha
concluded that there appears to be some additional return
for tha investor who held a mora aggressive fund relative
to the investor who dasirad to hold a defensive portfolio.
A secondary conclusion was that tha risk-raturn tradeoffs
which ware computed for various portfolios in ona period
were surprisingly similar in later periods.

15
Other Related Research
In a doctoral dissertation presented at Indiana
University in 1966, Shannon Pratt [ 58] proposed a method
ology to test tha proposition that high risk securities,
as measured by variability of returns in a historic market
period, tend to provide tha investor with a higher return
than did low risk securities. Tha returns on five port
folios of different risk classes, for holding periods of
one to seven years over tha period 1929-1959, ware examined
to determine if investors ware compensated according to
their risk exposure. Tha expected relationship should
show an increase in tha returns for each risk class, or
portfolio, as tha risk increases. Calculating holding
period returns in the conventional way and employing
standard deviation of returns as the measure of risk,
Pratt concluded that those securities which had been
characterized by high risk in tha historic period continued
to remain risky in the future periods. Portfolio returns,
in general, did increase as tha risk became greater;
however, tha returns for tha fifth risk class were lower
than risk class four.
Another interpretation of thasa results by Braalay
[ll, pp. 48-5l] not only raised questions about tha laval
of returns for tha high risk classes, but also pointed out
that the returns did not necessarily increase as a strict

16
linear function of the risk. Investors who have taken
increased risks do seam to have bean compensated, on the
average, by soma increase in return; however, tha question
is raised about whether or not tha increment in return
is sufficient to keep tha "price of risk reduction""^
unchanged.
Support for a similar conclusion is found in a
study by Douglas [20]. Ha examined annual returns and
variance of returns for 616 securities over tha period
1947-1963 in an attempt to datarmina whether or not tha
market places a positive price on risk-bearing. His
findings reveal that investors who take tha greater risk
tend to receive a somewhat higher return, although questions
can again be raised about the level of returns for tha
high risk securities relative to tha returns from securi
ties of low risk.
Sharpa and Cooper [68] proposed a methodology
similar to that of Pratt's in their research to examine
tha risk-raturn relationship. Their objective was to
determine if high risk securities, as measured by high
levels of nondivarsifiabla risk over historic market periods,
tend to exhibit a similar risk in tha subsequent period
and at the same time provide tha investor with high returns.
A risk factor was calculated for each of tha 1,572 securities
For a definition of this term sea Sharpa [ 66, p. 84]

17
in their sample over tha preceding sixty-month period, and
then each security was sorted into risk-return classes on
the basis of thair respective risk. This procedure was
repeated for each year of tha 1931 through 1967 market
period.
The measure of risk employed by tha authors is
"market sensitivity," a term which thay use to denote tha
slope of tha regression equation relating price changes on
a security or a portfolio to a market index. Deviating,
somewhat, from previous research, the measure of parformanca
used in the analysis excluded tha dividend yield as a
determinant of beta for individual securities. In thair
opinion, the major portion of variation in returns is
attributable to changes in price, the dividend yield
remaining relatively constant over time. On this basis
it would make little difference in measuring performance
and calculating beta coafficiants if tha dividend yield
were omitted.
To test tha importance of excluding dividends as
a determinant of parformanca, the return measures for each
security ware calculated by both procedures. Betas ware
computed for both returns and than regressed against each
other. The results ware vary similar and resulted in the
following regression aq[uation:
Beta = .004 + .997 (Market Sensitivity)
The Coefficient of Determination (R^) = .996

18
The results confirmed that as a practical matter,
dividend yield could ba excluded in calculating tha per
formance measure, and that "market sensitivity" was a
suitable substitute for the mora traditional method of
calculating beta.
The conclusions of Sharpa and Cooper's research
indicate that thara is substantial stability in the risk
characteristics of individual stocks, and that securities
believed to ba of tha highest risk in tha historic period
have a tendency to remain tha most risky in future periods,
and to soma extant provide tha investor with greater
returns.
Black, Jensen, and Scholas [6], and Soldofsky [lO]
uncovered a similar relationship between risk and return.
The first study, which dealt mora specifically with testing
the capital asset pricing modal, also constructed risk-
return classes on the basis of beta and monthly returns.
Using historic observations that ranged from twanty-four
to sixty months to determine tha appropriate risk classifi
cation of each security and accepting tha assumption of
beta stability, tha authors proceeded to rank securities
on the basis of thair calculated risk and compared tha
returns for tha various portfolio classifications.
The second study utilizes a classification procedure
based on invastmant advisory service ratings to group
securities and evaluates thair performance. Corporate

19
bonds, preferred, and common stocks ware evaluated and
comparisons made between risk and return for holding periods
of five, eight, and sixteen years. In this study savanty-
five industrial stocks ware classified into six quality
classes for comparison of risk and return.
The general conclusion of the two research efforts
was that high risk securities, on tha average, seam to
reward the investor with high returns, although both
studies tend to question the level of tha increase in
returns relative to the increase in risk.
In related research specifically devised for testing
tha Capital Asset Pricing Modal, Jacob [29], Millar and
Scholas [49], and Blume and Friend [s] concluded that tha
relationship between risk and return appeared linear and
positively related. However, tha question was again raised
about the laval of tha increase in return relative to tha
increase in risk.
Wagner and Lau [77] evaluated tha returns on diver
sified random porfolios of one to twenty securities for
holding periods of five and tan years over tha total market
period of 1960-1970. The major thrust of their research
was to determine how diversification can be used to offset
the individual riskiness of securities. The results of
their study confirmed that high risk portfolios, on tha
average, performed significantly better than low risk
portfolios. However, thair research ravaalad that in some
20
periods, e.g., 1965-1970, the returns from risky portfolios
were not high enough to preserve tha expected linear
relationship that is believed to prevail batwaan risk and
return.
An article published in January of 1974 by Robert A.
Levy [36] examined tha relationship between risk and return
by investigating tha ability of beta coefficients to predict
security returns. Using weakly returns for 500 securities
over tha period 1960-1970, Levy computed a ona year
historical beta to classify securities into deciles or
portfolios for return comparisons over tha following
calendar year.
Portfolio ona was constructed to consist of those
securities with tha 50 lowest betas; tha second portfolio
consisted of the next 50 lowest beta securities, at cetera.
Return comparisons ware made for each of the nine test
periods (calendar years) to datarmine tha relative par
formanca. Levy hypothesized that high risk securities
will return mora than low risk securities whan tha market
trend is up, and will lose more than low risk securities
when tha market trend is down. In other words, betas and
returns should ba positively correlated in bullish markets,
negatively correlated in bearish markets, and uncorralated
in a flat market. Results from tha analysis on the nine
calendar years supported his hypothesis in four periods.
In two periods an opposite hypothesis was supported; two

21
periods show insignificant performance; and one period
depicted negative correlation in a flat market.
In an extension of the analysis Levy examined the
ability of beta to predict single security returns over
specific market periods in which tha Standard and Poor's
500 Index exhibited either bearish or bullish trends.
Tha market periods used in this part of tha analysis ware
as follows:
Bear Market Periods
12/29/61 - 6/22/62
2/11/66 - 10/07/66
11/29/68 - 5/22/70
Bull Market Periods
6/22/62 - 2/11-66
10/07/66 - 11/29/68
5/22/70 - 12/31/70
The results of tha analysis confirmed, for tha
most part, that security returns and betas ara associated
in tha manner expected but not without soma reservations.
The correlation coafficiants for the bear market periods
ware -.31, -.22, and -.40 with a significant "t" statistic
in each case. In tha bull market periods the coafficiants
were .06, .10, and .04 but tha "t" statistic was only
significant in the second period.
22
Results were also tabulated for portfolio returns
and betas in an effort to evaluate the ability of betas
to predict returns. Tha results ware similar to tha former
analysis only much stronger at the portfolio laval. The
correlation coefficients for tha tan portfolios in tha
bear market periods ware -.91, -.93, and -.95 with signifi
cant "t" statistics in all periods. In tha bull market
periods, the coafficiants ware .45, .42, and .29 with only
the second period "t" statistic significant.
The conclusion reached by Levy was that beta
coefficients are axcallant predictors of return when the
market trend was bearish, but tha test results proved
inconclusive during the' bull market periods.
Two authors in particular tend to refute tha
generally accepted proposition of a positive relationship
between risk and return. Morton [52] and Richardson £59]
have concluded that thara is no reason to believe that
investors who take greater risks will necessarily ba
rewarded with higher returns.
Evaluating the returns on Standard and Poor's
industrial stocks for tha years 1956-1968 and using price
volatility as tha measure of risk, Morton concludes that
tha proposition that high volatility means high profits
has no substance in theory or fact. Tha period from
1956-19J65 was used to datarmina the risk of each security

23
which Morton calculates by means of a "market-price ratio."
Yields were determined from tha thraa year holding period
of 1965 through 1968. Each security was grouped according
to its risk, and a regression was performed relating yields
to the market-price ratios. The results indicate that there
was no statistically significant relationship between tha
two variables.
Morton contends that investors ara confused between
the relation of risk to "ax ante" or anticipated return
and the relationship of risk to "ax post" returns. Data
are available to show that tha "ax ante" expectation of a
positive relationship batwaan risk and return is, in fact,
unsupported. Tha actual return on a security that is
realized by tha investor is not necessarily commansurata
with tha associated risk.
Richardson offers a similar conclusion in discussing
soma limitations of tha empirical avidanca offered by
fellow researchers. Richardson, focusing on a lack of
conclusive data and inconsistencies of developing logic
in the risk-raturn hypothesis, developed an interesting
and logically concaivad investment strategy based on how
Tha "markat-prica ratio" is calculated by dividing the highest yearly average market price by tha lowest yearly average in tha 10 year base period (e.g., if a security had an average yearly low price of $10 in 1958 and an average yearly high price of $40 in 1965, tha ratio would be 4).

24
investors should react if the hypothesis had any practical
validity. He contends that if investors, on the average,
can realize higher returns by taking greater risks invest
ment funds would pour increasingly into low quality, high
risk securities. Such a strategy would tend to raise tha
price of low grade high risk securities relative to high
grade low risk securities. Such a strategy has not developed
in tha industry thus far, and thara is no indication that
such a change in investment activities is currently under
way. His conclusion is that tha findings to data in support
of tha risk-raturn hypothesis should ba regarded as
inconclusive.
Although the risk-raturn' hypothesis is not accepted
in total, a preponderance of research generally accepts
the concept. Most studies have concluded that a linear
relationship is an approximation of tha association between
risk and return. With tha exception of Levy, limited
research has been undertaken to datarmina the relationship
between risk and return over market periods of specific
trend. Tha major portion of related research examined tha
risk-raturn relationships over extended time periods dis
regarding market trend considerations. Levy's research
considered specific market trends but was limited, for tha
most part, to an evaluation of tha laval of correlation
between tha two variables for tha purpose of determining
the ability of beta to predict return.
25
The objective of this dissertation is not only to
examine tha pattern of returns for tha ten risk classifi
cations, but also to datarmine the specific origin of any
difference in returns for any two risk classes over
specific market periods that advance and decline. In
addition an investigation is made of tha increase in
returns relative to tha increase in risk. Tha purpose of
this analysis is to examine tha question of whether or not
the risk-return tradeoff is proportionate among tha various
risk classifications. This question has bean raised by
a number of rasaarchars and is unsettled even among those
who currently accept tha risk-raturn hypothesis.

CHAPTER III
METHOD OF RESEARCH
Tha Data
The data examined in this dissertation consisted
of 250 New York Stock Exchange securities for which complete
data were available for tha eight-year period considered
in this analysis. Following an earlier attempt to calculate
the performance data based on monthly returns, it was
believed that the reliability of tha research could be
improved if a greater number of observations was used.
Due in part to tha relatively short length of time covered
by ona of the market periods, a decision was made to base
the research on weekly closing prices and dividend data.
To procure the weakly data tha securities ware
screened from an Investment Statistics Laboratory (ISL)
data tape which, for the most part, was complete through
1969. In order to update tha tape through June, 1970, the
end of the fourth market period, price and dividend data
were manually collected from ISL books and merged into tha
original data sat to fill gaps and extend tha data tape
to cover the eight-year market period that was used for
the research.
26

27
The Market Index
The index of market performance that was used in
the analysis was calculated from tha weakly closing price
of the "Standard and Poor's Composite Stock Index."
Dividends were excluded in computing tha parformanca of tha
index, dua mainly to tha problem of determining tha weak
in which tha dividend should ba included. In measuring
performance, tha most accepted technique is to consider
both aspects of return, price appreciation and dividend
yield. However, Sharpa and Cooper [68, p. 49] state that
most variation in tha return of equity securities is
attributable to changes in price while tha dividend yield
remains relatively constant over time. This would infer
that dividends could ba excluded in tha calculation of
the performance measure and have a minimal affect on tha
results.
The Standard and Poor's Composite Stock Index was
selected as the measure of market performance dua to its
size and tha variety of securities it contains. Although
other indexes could have baan selected, tha decision was
made to use this index on tha basis of its repeated use
in related research throughout tha literature.

28
The Risk Measure
Following tha initial studies of Markowitz [45]
and Tobin [ 75] , literature on tha subject of risk expanded
rapidly. Tha advantage of representing soma element of
risk, as well as returns of an investment alternative,
has by now been widely accepted.
Markowitz and Tobin originally suggested variance
as the appropriate measure of risk in representing tha
undesirable aspect of an investment decision. As port
folio theory davalopad/ most of the authors showed a
preference for variance as tha proxy for risk. Foremost
of thasa was William F. Sharpa, who, while focusing on a
limitation of variance, tha high cost of its derivation,
was able to reduce the complexity of computing tha risk
for a portfolio. By proposing certain assumptions about
securities and thair relationship to tha market, Sharpa
[62] , was able to develop a surrogate for variance that
greatly simplified tha measure of risk for a diversified
portfolio. Tha proposed measure, which has baan referred
to throughout the literature as tha "beta value,"
"systematic risk," "rasponsivanass coefficient,"
"volatility" or "coefficient of non-diversifiabla risk,"
has grown in popularity over tha past tan years.
The measure of risk that was used in this disserta
tion was the coefficient of non-diversifiabla risk, or

29
what is more commonly called tha beta coefficient in
Sharpa' s index modal .•
In recant years academicians have shown a praferanca
for using beta as a measure of portfolio risk.^ It was
for this reason, in part, that beta was used as the proxy
for risk in this dissertation. The other reason was that
tha risk classes, explained later, which ware used in
evaluating tha risk-raturn hypothesis resembled a wall
diversified portfolio and ware constructed from a ranking
of the beta coafficiants of each security.
Tha Index Modal of Portfolio Theory
Sharpa [62], drawing from Markowitz [45], suggested
that tha return from a risky asset can ba represented
through a linear relationship with market factors and the
individual characteristics of the asset. Tha general
relationship can ba stated as follows:
Where: R-jt ~ return on security j in time period t.
a . = constant, tha return axis intercept.
Saa for example the comments of Block [7], and tha articles by Levy [36] , [37] , Sharpa [62] , Black, Jensen, and Scholas [6], Traynor [76], and Sharpa and Cooper [68] .

30
bj = tha slope of tha regression line
relating R.^ to changes in I (defined
as COV (Rj/I) / VAR (I)).
I^ = the value of I (market factor) in
time period t. Generally raprasantad
as the return of a market index,
ejt = a random variable with a mean of
zero and a variance of V ..
It is also assumed that tha a-'s ara independent of tha
level of I^ (i.e., COV (a.,I.) = 0), and is characteristic
of a unique aspect of security j.
By rewriting aquation (1) in terms of expected
returns tha expression becomes.
E(Rj^) = aj + bj (E(I^)) (2)
and the variance of (R.) can ba expressed as:
Vj = bj(I) + Vaj (3)
When tha risk of a security is stated as in
equation (3) it becomes clear that tha measure of total
variability is an additive function of two components.
The first term in (3), bTV(I), represents tha
portion of variability attributable to a security's
relationship with tha market index which cannot ba diversi
fied away, the "systematic risk." The second term in (3),

31
Vej, represents a measure of the unique characteristics
of a security and is independent of market factors, tha
"unsystematic risk." Since V(I) is tha same for all
securities, bj alona will represent tha relative systematic
risk of security (j).
The variance for a portfolio of n securities can
then, be datarminad by tha following equation:
n n V(Rp) = ZX.b.-^^d) + ZlX^a. (4)
^ j=l J J j=l J J
Where: R = tha distribution of portfolio returns.
X. = tha proportion of tha portfolio
invested in tha j security.
Sharpe [66j shows that tha "unsystematic risk"
(Ve .) of a security can ba substantially reduced or
neutralized by diversification to tha point that it can
be omitted in evaluating the riskiness of a well diversified
portfolio. This leads to tha conclusion that tha second
term in (4) can be dropped, leaving tha first term which
will serve as a reasonably good approximation of portfolio
variance. Tha result, tha "beta coefficient," now saams
to be tha most widely discussed measure of portfolio risk.
Measures of Return
The conceptual definition of a security's return
employed in this dissertation is tha holding period return

32
as defined by Latane and Tuttle [ 34, p. 59] . In this
context, the measure is considered to ba a "relative gross
return" calculation. It considers all benefits that are
likely to accrue to the investor over the holding period,
relative to what was originally invested.
The holding period return is calculated as follows:
"PR Pt Pt Pt ^ ^
Where: D. = tha dividend to be received during
period t.
P^ = the price at tha beginning of period t
P.^1 = tha price at tha end of period t+1.
Arithmetic Mean
The return data for each security were annualized
before a comparison of returns was made batwaan different
risk classes. The data were converted on the basis of the
following equation:
n
tir'-j R . = \ \_i -1/ (N) = \ ^ ^ J " / (N) (6) aj
Where: ^aj ~ arithmetic mean annualized HPR for
security (j) in market periods (1-4).
33
n Z HPR . = sum of the weakly holding period t=l -
returns for security (j) in each
market period,
n = number of observations par market
period.
N = number of weeks par year.
Geometric Mean
Performance data ware also computed by using a
geometric mean of tha holding period returns for each
security. Levy and Kripotos [38, p. 28] raised doubt about
tha use of an arithmetic average in dealing with security
performance. The authors questioned tha usa of tha arith
metic mean because:
The arithmetic average of price relatives assumes an equalization of tha amount invested in each component stock every time the average is computed. What is naadad is a measure which reflects continual equalization disregarding time intervals. . . . A geometric average weights each security equally, tha investment in each security is continually evened up, and a given percentage change in the price of ona stock has an identical effect on the average.
The geometric mean is defined as tha "n"^"" root of tha
product of "n" numbers.
GX = V (HPR^) (HPR2)"(HPR^) (7)
Holding period returns were computed in tha conventional
way, and tha geometric mean of these returns was used to
34
compute the individual performance data for each security.
The geometric mean weekly holding period return, minus 1
times (N), annualized returns for this part of tha analysis.
All weakly return data ware converted into annual aqiaiyalants
so that tha HPR's, which ware computed from market periods
of different length, could be stated and compared on a
common annual basis.
Pure Yield
A third measure of return was used in tha analysis
for tha purpose of evaluating the incremental increase in
return par unit of risk. (Questions have baan raised by a
number of researchers about tha increase in return relative
to the increase in risk. In order to investigate this
aspect of the risk-raturn hypothesis, a direct analysis
was made to datarmina if the increase in return was
sufficient to keep tha "price of risk reduction" unchanged.
The return measure that was davalopad to permit an analysis
of this concept was tha "pura yield."
The pure yield was calculated following tha basic
approach of Traynor [76]. Tha following aquation defines
Treynor's index of portfolio parformanca in terms of the
pura yield.
^p - r Py = • \ - (8)

35
Where: R^ = average return on portfolio (p).
r = riskless rate of interest. Represented
by tha average yield on Treasury Bills
for the period of this analysis.
B = beta coefficient of portfolio (p). p
Treynor's parformanca measure is essentially an
adaptation of the Capital Asset Pricing Model (CAPM) and
provides a convenient standard for measuring parformanca.
In equation form tha (CAPM) can be represented as follows:
E(R ) = R^ + B (E(Rm) - R^) P r p r
(9)
Where: E(R ) = expected return on a portfolio.
R- = a riskless rata of interest.
B = beta coefficient on a portfolio.
E(Rm) = expected return on a stock index.
Essentially the modal hypothesizes that tha axpactad return
on a portfolio should exceed tha riskless rate by an amount
proportionate to tha magnitude of beta. If stated in terms
of tha return above tha riskless rata, tha risk premium
on a portfolio should increase proportionately to tha
increase in beta.
Eq[uation (8) states tha return in excess of tha
riskless rata, or the risk premium, in terms of the
associated level of risk. Thus, the pura yield provides
36
a direct comparison for determining performance for
portfolios of different risk.
Pure yields could not be computed for individual
securities because of tha problem encountered in normalizing
whan a security has either a zero or a negative beta. This
problem was not prevalent whan computing a portfolio's
pure yield as tha negative or zero beta of a single stock
would "wash out" whan combined with a group of securities.
Tha Market Periods
The base period for this study encompassed 412
weeks of stock market activity for tha period July, 1962,
through June, 1970. Weakly prices and dividends ware used
in determining tha parformanca data for each security so
that tha number of observations involved in calculating
tha performance variables for tha different market period
could ba increased. This was dona in an effort to generate
reliable measures of risk and return. Because tha ranking
criteria used in this analysis was dependent on tha beta
coefficient of each security, it was important that thair
values ba determined by an adequate number of observations.
This was particularly important to this research since
In an earlier attempt to datarmina tha beta coefficients using monthly observations, it was found that many of the securities in tha shorter market periods had betas that ware not significantly different from zero as measured by a "t" statistic.

37
the second market period included only eight and ona-half
months of stock market activity. Although a required
minimum number of observations is not expressed in tha
literature, most of tha related research employs a range 5
of twanty-four to sixty observations.
To gain an insight as to how securities from
different risk classes perform under advancing and declining
market conditions, tha base period for this research was
segmented into four subpariods. Tha subpariods ware
determined by examining the Standard and Poor's 500 Average
for extended periods of time in which tha general trend of
tha index either advanced or declined (saa Figure 1). This
lad to the determination of the following market periods.
Market Periods
1
2
3
4
Weeks
7/6/62 - 2/11/66
2/11/66 - 10/7/66
10/7/66 - 11/29/68
11/29/68 - 5/22/70
Duration (Weeks)
189
34
112
77
Trend
UP
DOWN
UP
DOWN
Data were also available to examine tha long run relation
ship batwaan risk and return by calculating parformanca over
For example saa tha studies by Black, Jansan, and Scholas [6] , Sharpa and Coopar [68] , Pratt [58] , and Levy [36] .

38
STANDARD & POOR'S 500 AVERAGE
1962-1970
Source : F o r b e s , August 15 , 1973 , p . 96
F igure 1

39
the entire eight year period. This was done as the fifth
market period over tha following inclusive dates.
Market Duration Period Weeks (Weeks) Trend
5 7/6/62 - 5/22/70 412 UP
- Tha Risk and Return Classes
To examine the nature of the risk-raturn hypothesis,
tha performance data used in tha analysis ware divided
into dacilas in each of tha four market periods. Tha
division was accomplished by comparing tha risk measure
of each security. Beta coafficiants were calculated for
all securities in each of the market periods, and than
each security was rank-ordarad from the lowest to tha
highest beta value. The arrays ware partitioned into risk
classes (deciles) such that risk class one contained the
twenty-five securities with tha lowest betas while tha
nine remaining classes became identified with succassivaly
higher betas. Since tha composition of each risk class
was determined solely by tha magnitude of tha beta
coefficients for tha raspactiva securities, and the size of
tha sample was large, each group of securities comprising
the ten risk classifications was analogous to a portfolio
containing twanty-fiva securities.
To datarmina tha returns for each risk class, tha
weekly holding period returns from tha securities within

40
each portfolio ware calculated as described earlier. Tha
mean holding period return for every security in each
market period was calculated and annualized so that for
any risk class there ware twanty-fiva return observations.
A diversified portfolio with a high beta value is
more risky than a portfolio with a low beta value. In
accordance with tha risk-return hypothesis tha high risk
portfolio should also provide a greater return. Portfolios
with varying degrees of risk can easily be constructed
by combining stocks of similar risk as outlined above.
Securities with high betas should have high returns on the
average and ware combined to represent a high risk portfolio
Low beta securities ware similarly combined to represent
a low risk portfolio. This strategy should provide low
returns, on tha average, but with much lass risk exposure.
Test of Hypothesis
Portfolio Returns
Evidence relating to tha actual tradeoff batwaan
the various portfolios in the four market periods was
obtained by examining the test results of tha following
null hypothesis:
(A) There is no significant diffarance between tha
mean returns for tha tan risk classes within
each market period.

41
The ultimate objective in testing the null hypoth
esis was to determine if there ware significant differancas
in tha risk-raturn tradeoffs within market periods, i.e.,
do high risk securities provide higher returns compared to
low risk securities under advancing or declining market
conditions.
To test the null hypothesis an application of
analysis of variance was used. Tests ware conducted to
determine if a significant diffarance existed between tha
mean returns of tha ten risk classes within each market
period. Tha test for hypothesis (A) was repeated five
times, once for each of tha four market periods and once
for tha total eight year period. An F-statistic was
calculated from tha parformanca data of tha tan portfolios
for each market period, and tha differancas ware determined
to be statistically significant if tha computed value of
F exceedad tha F-distribution value in the table for tha
appropriate degrees of freedom. If the computed F-valua
was greater than tha F-distribution value in tha table
than hypothesis (A) was rejected.
In tha avant that tha null hypothesis was rejected
in any or all market periods all that could be proven by
the analysis thus far was that a significant difference
existed batwaan tha mean returns of tha tan portfolios.
No information was available to show which portfolio
returns ware statistically different from all others.

42
To investigate the significant diffarance in port
folio returns tha Duncan Multiple Range Test^ was used to
determine batwaan which portfolios tha differancas occur.
The results of this test allowed conclusions to ba drawn
about significant differancas in tha mean returns of each
portfolio compared to all others for a given market period.
The return comparisons for each portfolio was made as
follows: 1 vs. 2, 3, 4, 10, 2 vs. 3, 4, 5, .... 10,
3 vs. 4, 5, 6, ... 10, at cetera, for a total of tan
replications. Tha test was conducted two times, once when
performance was measured by tha arithmetic mean holding
period return, and again whan parformanca was datarminad
by tha geometric mean return.
Results from tha Duncan Multiple Range Test provided
information to datarmina whether or not there was a
significant diffarance in tha mean returns of large groups
of securities as tha laval of risk increased in market
periods charactarizad by advancing and declining trends.
The Duncan test was selected to compare portfolio par
formanca since it appears frequently throughout tha litera
ture and is considered a good test for describing signifi
cant diffarance batwaan paired data.
For a discussion and explanation of tha Duncan Multiple Range Test, see Hicks [27, p. 31] .

43
Pure Yields
In an attempt to disclose tha full nature of tha
relationship between risk and return for tha period of
study the analysis was extended to consider tha results
of the pure yield performance. The examination of portfolio
pura yields was made through a graphic presentation
following tha basic approach of Traynor [76]. A plot
which related portfolio returns to beta, above tha riskless
rata of interest, produced a relative ranking of tha
performance of each portfolio. Tha slope of tha "portfolio
possibility line" which represented tha measures of risk
and return for each portfolio reflected its relative
performance. Tha portfolio possibility line with tha
greatest slope pointed out tha portfolio whose parformanca
was best in terms of the return par unit of risk. If the
tradeoff between risk and return is identical, or if tha
price of risk reduction remained unchanged, tha portfolio
possibility line of each portfolio would plot tha same.
In subjecting tha data to tha aforamantionad
analysis it was baliavad that information could ba compiled
to provide a basis for determining tha actual relationship
7 Traynor uses tha term "portfolio possibility
line" to represent the risk and return tradeoff available to tha investor by combining different proportions of tha respective portfolio and tha riskless asset.

44
that existed between risk and return for tha period of
study.

CHAPTER IV
THE FINDINGS
Chapter II suggested that there is a lack of total
agreement regarding the relationship between a security's
risk characteristic and its return. Tha majority of
research indicates, however, that the predominant relation
ship is of a positive type. Risk and return ara, to soma
degree, positively correlated and return is expected to
increase as a function of risk. Tha implication of this
relationship is that as the riskiness of a portfolio
increases tha return will increase to compensate investors
for their greater risk exposure.
This chapter presents the research findings as thay
apply to the risk-raturn relationship described above.
The chapter is organized into three major sections:
(1) the relationship batwaan risk and return, (2) the pure
yield performance, and (3) tha relationship of beta
coefficients.
Relationship Between Risk and Return
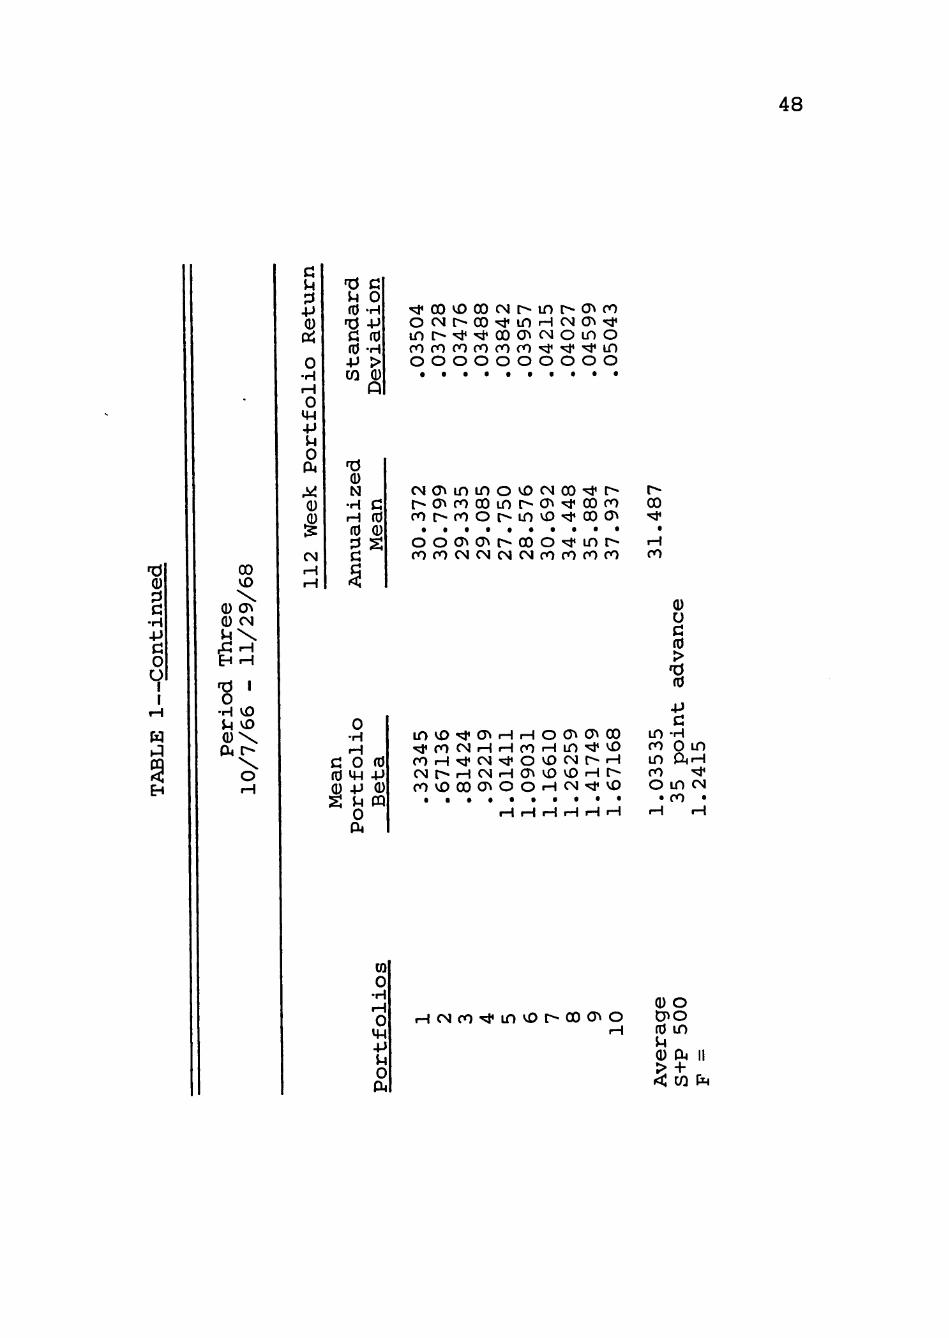
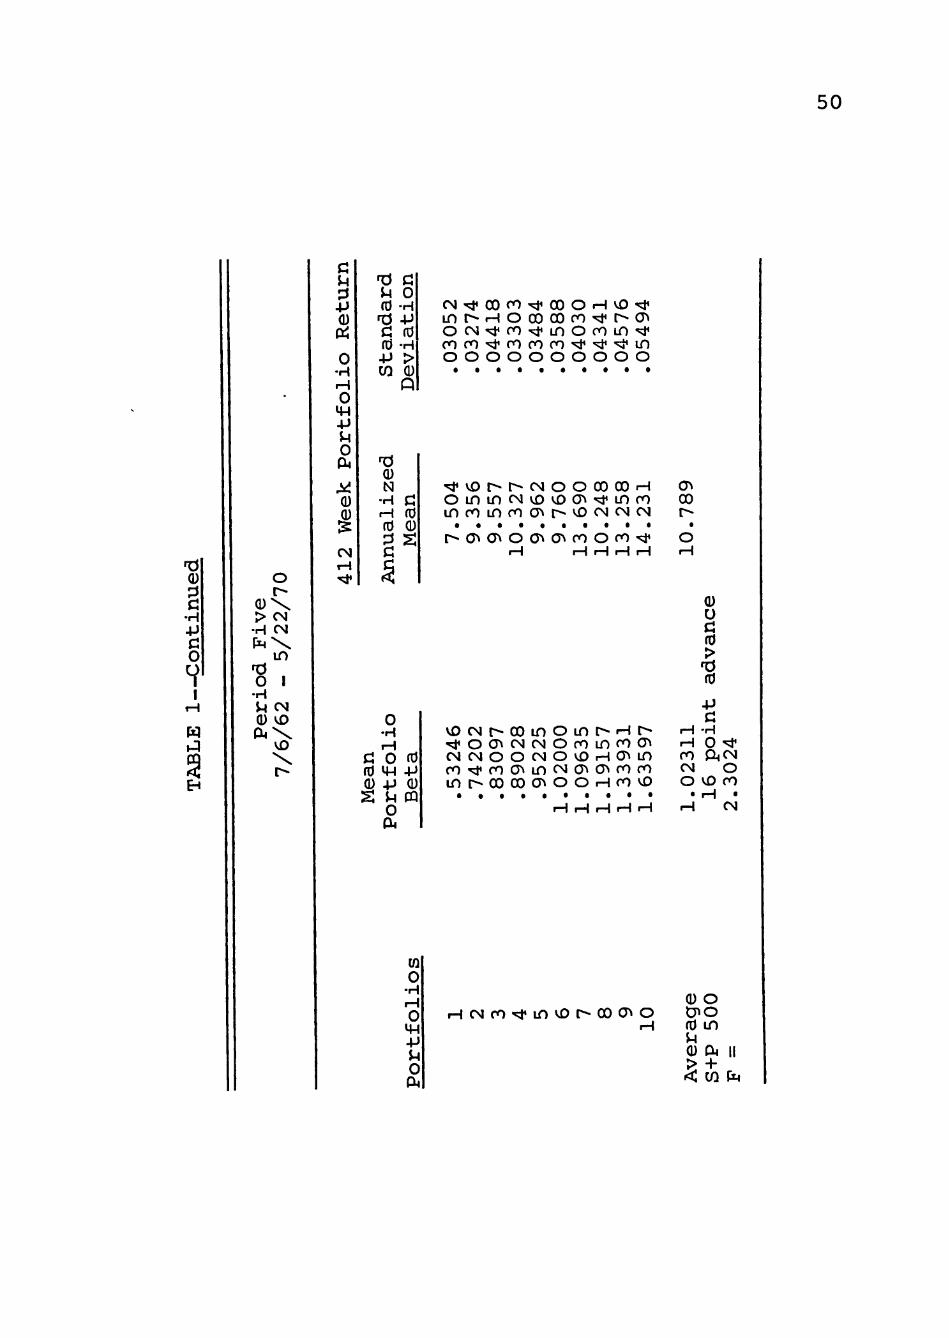
Table 1 presents summary data that describe tha
risk-return relationship for the ten portfolios over the
five market periods. The mean portfolio beta is paired
45

46
(A
Q) G O
vO vD \ rH rH
CVI
O I •H M CN 0 VD a 4 \
VO \
G U 7i 4J Q) Qd
O •H H O M-l +J U O
cu M
OS CX)
'd G u o
(0 4J W 0
Q
13
N
G
o •H iH
c: o fd fd M^ 4-> <D -P Q) X UtA
o a*
m o
• H H 0
o
CM 00 CN CM vD iH • d* in CO cr> iH
r- CM in ro o LD ro 00 in CN CO o a» 00
ro CN 00 (T* vD CMCNCNCNcorororo O O O O O O O O O O
rOCMvOvO<r>(T><T>OOCMO f M r H r O " ^ ( T > C M r H r ^ r H v D C N O O i n r - C N H O v O - ^ C T *
v o c r » r ^ " ^ r O ' s t o i n o o c M r H H i H C N C N C M C N C M C M C O
r o r ^ c N i n ^ v D O O r ^ r o vDlnr^ lncJ^voo^r-r^vD rocT>vDHinincNOCNoo ' ;J 'CNrocoCMOCJ^O^OLn coinvor-oocr><r>rHCNLr)
i H C M r O - ^ i n v O t ^ O O C T ' O
CM 00 CN
• ro CN
0 u G fd >
fd
-p G
• H O ' ^ ftCN
OS
o 00 in 00 00 00
• ro in
0) o
fd in u Q) PK II
< CO P4

47
(D ? G
•H +» G O
I
rH
W
VD
go TJ r o
•H vD J-i VD
CM
G U J3 4J 0
cn o
• H H O
M-l • P U O QH M Q)
i en
-0 G U 0 fd -H TJ -P c fd fd -H 4J > W 0
rOOCT>(T»VDOO"^OOCNCM r - c N v O ' ^ r o i n c N i H C J N i n O O v O H ' ^ H v D H r - C N t H CM CN f O CO r o CO 'si' -^i LT) vO O O O O O O O O O O
0 N
- H C H fd fO 0
o •H iH
C O fd UH 0 4J
^ ^
fd
0
Ui O
• H rH
o MH • P O PU
CT>OvDinCTvCNOrorovD r * - o v D C j \ i n ' > * i n ( T > o o ^ O O O v D i ^ l n C 3 ^ c N ( 3 ^ r - r o
i n c M " ^ " ? t v D r H r o i n i n c N r o r o r O ' s j ' r O ' ^ r o r o c N r o
I I I I I I I i I I
00 CM 00 ^ vD r» CO ro r» ' 00 00 in C3 ro ro CO a> O '* O rH iH "^ ro (T> r^ ro in VD r^ 00 o
CM 00 'l' r^ VD in in -^ vD
ro in "^ ro CM -< r^ CN
• t • t
H rH rH CN
r H C M r O ' s t i n v D r - O O f T ' O
rH vD ro •
in ro I
r-ro '^ 00 o
0 G •H H o 0 'd
4J G •H O O Oicn
i> vD c^ ro •
0 O D^O fd in u 0 PU
< W PM
II
48
0
G •H +J G O U
I I
bH
00 VD
0 CJN 0 CM
Xi H EH H
•H iH 0 04
VD VD
O rH
G U :A • p 0 txi o •H H o
14H 4J O
TJ C J 0
fd -H d -p c fd fd -H •P > W 0
Q
' * O O v D O O C M r ^ i n t ^ C T > r o O C M r - 0 0 ' ^ L n r H C N C 3 ^ ' < * in r - "<* '<*00( r>cNOino r o r o r o r o r o r O ' ^ ' s f ^ i n O O O O O O O O O O
CU
M 0 0 ^
CN rH rH
TJ 0 N
•H C H fd fd 0
2 S c 1
0 -H H
c o fd fd m -p 0 4J 0
m
CO o
• H rH O m -p o Pl4
cNCTkininovDCMoO'^r--t^C3^rooOLn^^CJ^^OOro ro r - roOr - invD 's^OOCT*
oocT>CT»r^ooo - ^ i n r -rorocNCNCNCNrorororo
invO';j'CT>rHrHocrkcy^oo • < ; J < r O C M r H r H r O r H i n " ^ V D r O r H ' ^ C N ' ^ O v D C N r - r H C N t ^ r H C M r H C T v v D v D r H r -r O v D O O < T > O O r H C N ' « * v D
• • • • • • • • • * rH rH rH rH rH rH
rH CN ro "^
00
ro
in ro in ro
0
u G fd > 'd fd
+J G
•H 0 in ftrH
' ^ O in CN
* ro •
vD r^ 00 <3> o rH
0 O D > 0 fd in U 0 QA II
> + < W P4

49
0
G •H 4J G O
I
tA
O
in CN :3 CM 0 \ P4 i n
? •H 00 U VD 0 \
CN \
G U
4J 0
o •H rH o m -p
o
M 0
I
JH fd
f d -P
fd • P W 0
0 N
• H rH (d 0
o •H rH
c o fd fd UH 4J 0 -P 0 S SH ffl
O 04
CO O
•H rH
o ^ o 0*
CM rH VD O ^ o ro St* o o
VD ro 00 VD VD H O H vD r^ ro ro ro O O O
00 -^ (T> O O CN -^ ' ^ "^ ' ^
o o o
in o OS (N OS in •^ vD o o
i n O O O r - r O r H C M r o v D r o rHro in inmvDvDooOnH rHOr*rorHoovDcr»t^ in
• • • • • • . • • * cr>roooinvD"^c^r«cy>oo r H C M r H C N C M C M C N r O C M - « ; i ' I I I i I I I I I i
rHro(T»cr>vD'sj<Lnin<Hr^ rovD(T»rorHoOincNino O C M r - r O C N v D ( T > i n O C N r o v D v D ^ C M c r > O O r - ' * r o inr-oo(j>oorHCM-^cr>
rH rH rH rHrH rH
r H C M r o - ^ i n v D r - O O C ^ O
ro H ro
00* CM
I
VD O vD O
0 G
• H rH U 0
+J G
•H O ro 04O
ro vD O
• rH
0 O CHO fd in U
0 04
< Ui U4
II
M iior."-*. T ""
; : . « ^ L:^siA-:
50
0 :i G
•H 4J G o
vA
0 >
• H P4
O
CN CN
i n
O I •H SH CN 0 VD 04
VD \
G U
0 (Xi
O •H rH o m + j JH O
fd c: 4 0
fd -H fd -p c: fd fd -H •p > W 0
Q
CN">;l*COrO'^OOOrHvD'!;i ' inr-HOooooro-^t^cT* O C N ' ; l * r O " ^ i n O r O i n ' ; } * r o r O " « * r o r o r o ' v f ' ^ ' v i * i n O O O O O O O O O O
04
M Q) 0) 12 CM rH
fd 0 N
•H G rH fd fd 0 3 ^ c 5
o •H H
c o fd MH 0 4J S ^
o 04
fd
0
(0
o •H rH
o MH - P iH O 04
•^vDr^r-cMOOOOOOrH Oin incNvDvDcn ' ; f i n ro inroinro(T>r^vDCNCNCM
t ^ a > < T » O C r > ( T k r o O r O ' ^ r H rH rH rH rH
vDCNt^oo inOinc^rHr^ ' s d ' O C J ^ C N C N O r o i n r o c T * C M C N O O C N O v D r H C J ^ l n r o ^ r o C 7 » i n C M < T » ( 3 > r o r o i n r - o o o o c r > o o H r o v D
rH rH rH rH rH
cMrO'stinvDr-oocJ^O H
OS 00
ro CN
o
0 u G fd >
f d fd
• p G •H O '^J' ftCN
O VD ro
• H CM
0 O d^o fd i n u 0 04
< W PM
II

51
with its respective annualized arithmetic mean return and
standard deviation.
In market period one portfolio returns, in general,
conformed to tha expected relationship presented in tha
literature. These data indicated that high risk port
folios returned more than tha low risk portfolios. Returns,
for the most part, increased as the riskiness of tha
portfolios became greater. Tha exception was tha returns
from portfolios three and seven, which, in both instances,
were lower than tha returns of the preceding portfolios.
Returns differed significantly among tha tan portfolios
and generally in the direction anticipated. The computed
F-statistic was 5.19 for alpha = .05 compared to a critical
table value of 1.88 and, consequently, resulted in rejection
of the corresponding null hypothesis, which stated that
there was no significant diffarance batwaan tha mean returns
for the tan risk classes within each market period.
Results of tha Duncan Multiple Range Test, to
determine the specific origin of the differanca in returns,
yielded the following five homogeneous subsets:
4, 5, 6, 8, 9
2, 3, 5, 6, 7
2, 4, 5, 6, 7, 8
1, 2, 3, 7
9, 10

52
An interpretation of tha subsets is that no pair in each
of the five groups of portfolio returns differ by mora
than tha least significant range. In other words, no
statistically significant diffarance existed batwaan tha
returns of the portfolios comprising each of tha five
subsets. There was, however, a significant difference in
the returns of soma portfolios. It was this interpretation
of the range test with which the analysis was concerned.
Table 2 presents a summary of tha comparisons batwaan
those portfolios in which there was a statistically
significant difference in returns.
In market period two, a down market, returns did
not conform to tha expected relationship in which low
risk portfolios lose lass than high risk portfolios. Tha
highest negative returns ware shown for portfolios four
and six while the loss on the three lowest risk portfolios
averaged slightly mora, on tha average, than tha three
highest risk portfolios. For the period, returns did not
differ significantly among tha ten portfolios as avidancad
by a computed F-statistic of .97. Consacjuantly, tha
corresponding null hypothesis could not ba rejected. Tha
data ware not subjected to tha range test since no
®Tha value for the least significant ranges (LSR's) is found by referencing a Duncan's Table of Significant Ranges at alpha = .05, using N2 dagraas of freedom for tha error mean square (from an analysis of variance table) and p=2, 3, 4, 10.

53
TABLE 2
Market Period
COMPARISON OF ARITHMETIC MEAN PORTFOLIO RETURNS IN WHICH THERE WAS A
SIGNIFICANT DIFFERENCE
Referenca Portfolio
Portfolios That Vary Significantly From Reference Portfolio
-1 2 3 4 5 6 7 8 9 10
4, 5, 6, 8, 9, 10 9, 10 4, 8, 9, 10 1, 3, 10 1, 10 1, 10 9, 10 1, 3, 10 1, 2, 3, 7 1, 2, 3, 4, 5, 6, 7, 8
1 2 3 4 5 6 7 8 9 10
1 2 3 4 5 6 7 8 9 10
8, 10 8, 10 8, 10 10 10 10 10 1, 2, 3 10 1, 2, 3, 4, 5, 6, 7, 9
7, 9, 10 10
1 1, 2

54
significant difference was found between portfolio returns
for tha period.
A similar finding of no significant difference in
returns was found in the third market period, although
these data saamad to indicate that tha returns of tha two
lowest risk portfolios exceeded the return on portfolios
three through six. The computed F-statistic was 1.24
compared to tha table value of 1.88. Onca again, tha null
hypothesis could not ba rejected. Tharafora these data
were not subjected to analysis by the range test since
portfolio returns were not found to differ statistically
for the period.
In market period four, returns conformed, for tha
most part, to tha axpactad relationship whan the market
trend was down. Generally the lower risk portfolios lost
lass than tha higher risk portfolios although tha relation
ship was not totally consistent. Returns ware found to
differ significantly batwaan the ten portfolios, as evi
denced by a computed F-statistic of 4.03, and this fact
resulted in another rejection of tha null hypothesis.
The results of tha range test yielded three homo
geneous subsets within each of which thara was no signifi
cant diffarance in returns.
1, 2, 3, 4, 5, 6, 7, 9
4, 5, 6, 7, 8, 9
8, 10

55
Portfolios batwaan which thara is a significant differanca
in returns for tha period are presented in Table 2.
Results of tha analysis whan performance was
measured by the geometric mean holding period return tended
to support tha previous findings. In all but tha fifth
market period, discussed later, in which returns were
mixed, the high risk portfolios outperformed tha low risk
portfolios whan tha market trend advanced and low risk
portfolios lost lass whan tha market trend declined.
Parformanca was again datarminad to ba statistically
different in market periods ona and four. In addition,
performance in tha fifth market period was found to ba
not statistically different which conflicted with tha
finding in tha preceding analysis whan returns ware based
on tha arithmetic means.
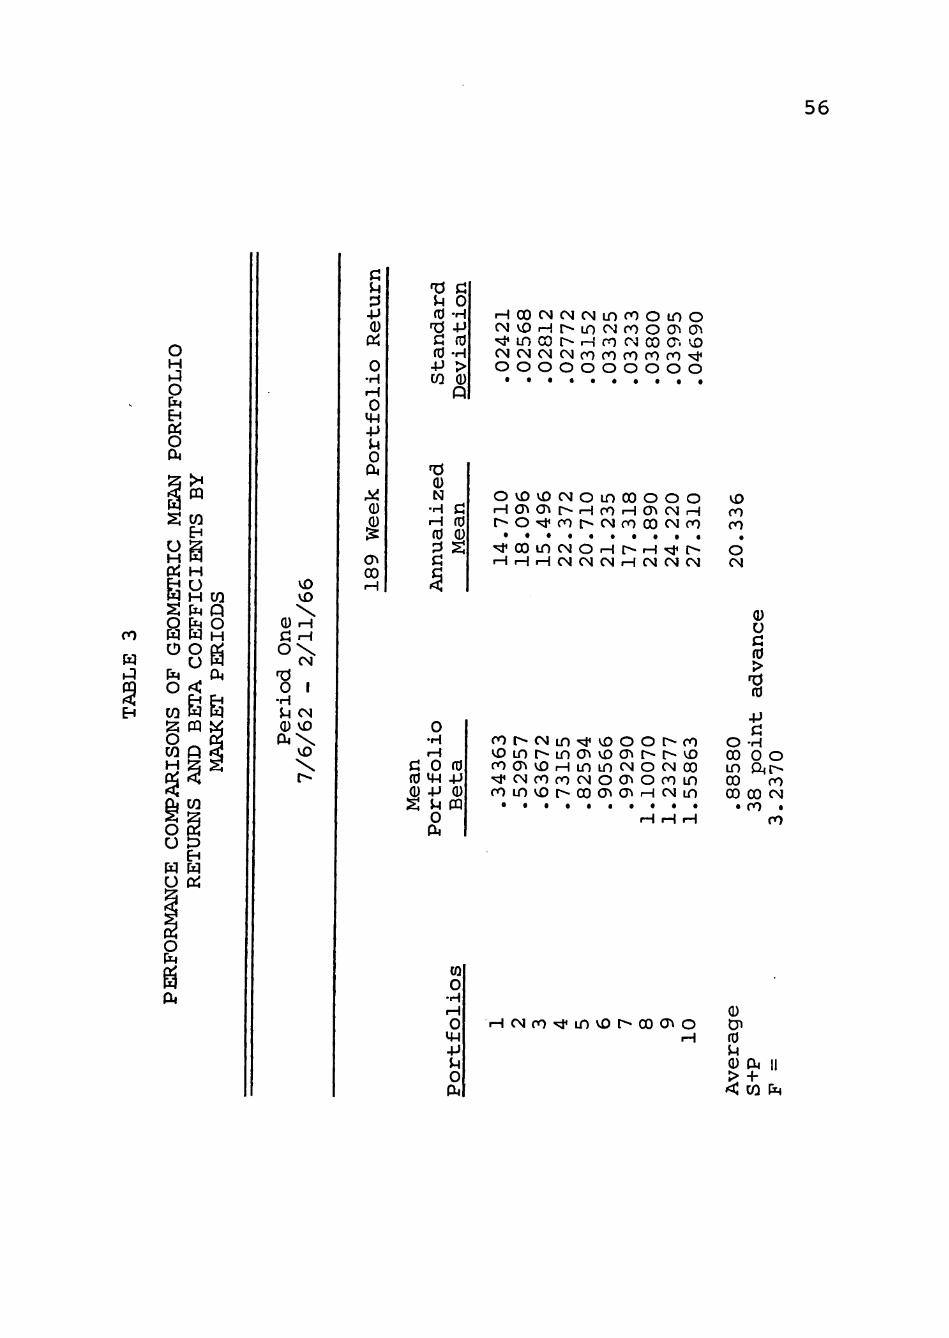
Table 3 presents tha summary statistics that
described the gaomatric mean parformanca data for portfolio
classifications by market periods. If a comparison ware
made between tha arithmetic and gaomatric mean returns
the results would show that the values ware smaller with
the geometric calculations. This relationship is inherent
due to tha way in which a geometric mean is computed.
In market period one parformanca differed signifi
cantly batwaan tha tan portfolios. With tha exception of
the performance on portfolios two, four and seven, returns
increased steadily as tha risk became greater. Tha
56
ro W ^A
W
P (Xi
VD VD \
0 H G rH o\
CN f d o I
•H iH CN 0 VD 0 4 \
VD \
^
•P 0
o •H rH
o MH +) iH O 04
0
I 00
f d ^ fd
f d -p G fd •p W 0
f d 0 N
•H H fd 0
o •H rH
c o fd fd UH 4J 0 4J 0
o 04
Ui o
•H rH o m -p
o 04
r H o o c M C M C M i n r o o i n o cNvDHr^inc^JroocT^cTi "«* i n CO I> rH ro CJ CO a. 'vD CNCvJCMCMrorororOrO"";!* O O O O O O O O O O
O v D v D C M O i n O O O O O rHCTv(Tir^rHrOrHCy»CMrH r ^ O " ^ r o i > C N r o o O C N r o
• • • • • * . . . • " ^ o o i n c M O r H r - r H - ^ r ^ r H r H r H C M C N C N r H C M C N C M
r o r ^ c M L n " ^ v D O o r ^ r o vDinr- incnvDCTir-r-vD r O C T k v D r H i n i n C N O C M O O " 5 t C M r O r o c M O C r > O r o i n ro invDr-oo<7><T>>HCMin
• • • • • • • • • • rH rH rH
i- icNro"<sfinvDr>-oocr»o
VD ro ro .
o CN
0 U G fd > fd fd
-p G •H o o 04l>
ro CO 00 CM • ro •
ro
O 00 in 00
0
fd u 0 04
^
II
CO PM

57
f d 0 13 G •H +J G O
I ro
^A
VD VD \
o rH
vD VD
f d O
-H
04 rH rH \ CM
G U
•P 0
O •H rH o m 4J
0 04 M 0
I ro
f d u fd
f d -p c fd •p W 0
f d 0 N
•H H fd 0
o •H rH
c! o fd fd 4H -P 0 4J 0 S iH ffl
o 04
to o
•H rH O m •p iH o 04
r 0 O 0 ^ C J ^ v D 0 0 ' * 0 0 C M ^ M r ^ c N v D " ^ r o i r > c N r H ( T » i n O O v D H - ' ^ H v D H t ^ C N r H CMCNro ro ro ro^ "<s^LnvD O O O O O O O O O O
O r ^ v D ( T > C 7 > r H O O v D v O i n incNCNOCOrHrovDinr^ C N C O r O r o O ' i ^ l ^ v D v D C y i i n
ooror-r^(j\Lnr^rHCNjvD rororO'vt^ro^rO'^rO'* I I I I I I I I I I
OOCNoo-^vDr^rocNioO""* ror^"^ooooin(y>r^vDin ro ro ro cy> O "^ O
ro rH '^ in VD
ro OS l> 00 o
in " vD ro in •* ro CM r CN
H H H iH CM
rHCMro-^invDr-oocTkO
in o o •
o I
ro " « * 00 o
0 G •H rH O 0 fd
+J G •H o o OiH 00
vD OS en •
0 o d o fd in U 0 04
< Ui P'4

58
fd 0 G
•H 4J G O O
I I
ro
^A
00 VD \
0 OS 0 CN iH
•H iH 0 04
VD VD
G U J3 4J 0 (Xi
O •H rH O
MH 4J U O 04
M 0
fd U fd
fd
fd -P
w 0
fd 0 N
•H G rH fd fd 0
O •H H
C O fd MH 0 4J
04
fd
0
CQ O
•H H 0
MH
iH 0 04
" ^ O O v D O O C N r ^ - ^ t ^ C T ^ r o O C N r ^ 0 0 ' * L n r H C N ( 7 » ' « : t inr-^t>«:j«oocy»cMOino r o r o r o r o r o r o ^ ^ ^ i n O O O O O O O O O O
- " ^ C M v D o o o o j i n r o i n - ^ OCMCJ^^^'^J^^CJ^CJ^O(3^ r H r H ( T » C T » C T > ' s i < 0 0 C N ^ r O
r ^ r - L n i n r o « ^ i n o O r H CMCNCMCMCNCMCMrOrOrO
invD"«*CT>rHrHOCr»CT>00 • ^ r O C N r H r H r O r H i n - ^ v D r O r H ' s J < C M ' ^ O v D C M l > r H C N r * - r H C N r H a > V D V D r H r -r O V D O O C T k O O r H C N ' ^ v D
rH rH rH rH r^rH
r H C N r O ' ^ J ' i n v D t ^ O O C T i O
in
CN
CM
in ro in ro o
0 u G fd > fd fd
+j G •H O r>
in r-ro .
0 o d^o fd in U 0 04 < ui P4

59
f d 0
G •H 4J G O
I ro
W ^A
O r-
iH CM ;3 CM
PM i n
00 VD
f d o
•H iH 0 04 OS
CN \ rH
G u 0 •p
O •H rH 0
MH
O
04 0
I CN H
f d u fd
f d -p c fd fd
W 0 Q
f d 0 N
•H G rH fd fd 0
o •H H
c o fd fd MH 4J 0 4J 0 S iH CQ
O 04
m o
•H rH O
MH - P U O Oi
CM VD
ro O
H O O
O
vD ro O rH VD r-ro ro O O
O
in o
i n VD ^ OS
o o
rH i n rH r ^ cr> CN
CN " ^ (JA I D
o o o VD O
^ r ^ r ^ i n v D i n r o v o o o C N ( y > C N " ^ < T » ( N t ^ H r O V D ' ! i ' O C N O r H H ' « * r H r - C M
C M O O C N C 3 ^ 0 ( J ^ " ^ r o v D O C N C N C M C N r O C M r O - ^ r O V D i I I I i I I i i I
rHrocT»cr»vD"«d^inLnrHr-rovDcurorHOOinrMLno OCMr-«rocNvD(T4inocN r o v D v D ^ C N C T ^ O O ^ ^ " ^ r o inr-oo<7tOOrHCN'; j<a\ • * • • • • . • • •
r-i rH rH rH rH rH
r H C M r O - ' ^ i n v D r - O O C T ' O
OS VD in •
ro ro I
VD o VD o
0 C! •H rH O 0 fd
-p G •H O O 04O ro
vD O rH •
VD
0 O d^o fd in u 0 04
< W P4
II

60
fd 0
G •H •P G O
I ro
W ^A
O r^
0 \ > CN
• H CN f ^ \
i n fd o I
•H iH CN 0 VD 04 VD
\
G U
0
Oi
o • H rH O
MH +J iH O 04 M 0
CN rH
f d in fd
c 0
•H fd -P G (d 4J
w
fd •H > 0 Q
0 N
•H c: rH fd fd 0
o •H rH
c: o fd fd MH -P 0 4J 0
X iH (A
o 04
C N ^ H i n ^ t O O O H v D i n r ^ i n r H o o o o r o c N r -O C N C N r O ' v j ^ i n o r o i n r o r o r o r o r o r o ^ - ' i t O O O O O O O O o
OS
in o
r^ ro 00 o t r^ ro CM "" " CN r^ o r-- o
00 t^ 00 r- r>» ro [ "* CN o VD VD in o r^
i n v D r ^ t ^ r ^ v D C T i i n o o v D
VD CM O
CN CM ro "<;J< in r^
r- 00 in (T» CN CM O O CM ro CT> in 00 00 cr»
o in O ro O VD
r-- H r^ in ro o>
OS in CN (J C3 ro ro O O rH ro vD • • • * •
rH rH rH rH rH
CM
o
rH rH ro CM o
0 u G fd > fd fd
•p G •H
O^rH
VD r^ rH •
0] 0
•H rH 0 M-l -P U 0 04
rHCNro-^invDr^oocT'O H
0 o d io fd i n iH 0 04 II
> + < W Pt4

61
computed F-statistic was 3.24 for alpha = .05 compared to
a critical table value of 1.88 and, consacjuantly, resulted
in rejection of tha null hypothesis.
Results of tha Duncan Multiple Range Test yielded
the following homogeneous subsets:
2, 4, 5, 6, 7, 8, 9
4, 5, 6, 8, 9, 10
2, 3, 4, 5, 6, 7, 8
1, 2, 3, 5, 6, 7
Table 4 depicts tha relationship between portfolios in
which there was a significant difference in performance.
Results of tha analysis on market period two
indicated that security parformanca did not differ signifi
cantly batwaan tha tan portfolios. The F-statistic was
.98 as compared to tha critical table value. Consacjuantly,
the corresponding null hypothesis could not ba rejected.
Thasa data ware not subjected to tha range test since the
difference in performance was datarminad to ba not
statistically significant. Tha pattern of returns, though
more typical than whan measured by the arithmetic mean,
continued to show greater than axpactad losses on tha lower
risk portfolios.
In tha third market period, tha performance of tha
three highest risk portfolios exceeded all others. An
interesting relationship which was depicted by the data,
however, indicated that tha returns of tha thraa lowest

62
TABLE 4
COMPARISON OF GEOMETRIC MEAN PORTFOLIO RETURNS FOR WHICH THERE WAS A SIGNIFICANT
DIFFERENCE IN PERF0m4ANCE
Market Refaranca Portfolios That Vary Significantly Period Portfolio From Raferanca Portfolio
1 2 3 4 5 6 7 8 9 10
1 2 3 4 5 6 7 8 9 10
4, 8, 10 9, 10 1
10 1 1, 3 1/ 2,
8, 10 8, 10 8, 10 10 10 10 10 1. 2, 10 1/ 2,
9,
3,
3,
3,
10
7
10
4, 5, 6, 7, 8, 9
risk portfolios axcaadad tha returns of portfolios four
through seven. Security performance did not differ
significantly, however, as avidancad by an F-statistic
of .78. As a result tha null hypothesis could not ba
rejected, and thasa data were not evaluated by tha range
test.
In market period four performance was datarminad
to be statistically different with tha value of tha

63
F-statistic at 6.03. With tha exception of tha return on
portfolio two, tha magnitude of the loss increased fairly
steadily as the risk increased. Range test data yielded
two homogeneous subsets.
1, 2, 3, 4, 5, 6, 7, 9
4, 5, 6, 7, 8, 9
Table 4 presents tha portfolio classifications batwaan
which thara was a significant difference in parformanca.
Summary of the Relationship Between Risk and Return
The return data permitted a rejection of the null
hypothesis in two of tha four market periods. Portfolio
returns ware datarminad to be statistically different
among risk classes in market periods ona and four, using
both tha arithmetic and gaomatric mean returns. For
market periods two and thraa thara was no statistically
significant diffarance in tha returns of tha tan portfolios,
For both instances in which tha null hypothesis was either
accepted or rejected tha market exhibited an advancing and
a declining trend.
Tha pattern of returns that ware presented in
Tables 1 and 3 conformed, for the most part, to the
expected relationship that was expressed in tha literature
when tha market trend was up. High risk portfolios tended
to provide a higher return than low risk portfolios. This

64
point can be verified by examining the returns in market
periods ona and three, although tha range of returns by
portfolio classifications was smaller whan parformanca
was measured with tha geometric mean. Tha point should
also ba made that only in market period one ware returns
determined to be statistically different among tha tan
portfolios.
Tha belief that high risk portfolios should lose
mora than low risk portfolios whan tha market trend is
down was not confirmed by tha data in tha second market
period. For this period data were available to show that
as a group the low risk portfolios tended to lose mora than
the high risk portfolios whan returns ware measured by tha
arithmetic mean. This relationship did not prevail whan
returns were calculated by the gaomatric mean. (Saa
Tables 1 and 3, pages 46 and 56.) In tha latter analysis
tha three lowest risk portfolios lost lass than tha three
highest risk portfolios. The greatest average loss,
however, was expariencad by portfolios four through seven.
In the fourth market period, tha low risk portfolios lost
less than tha high risk portfolios which would normally
be expected.
Results of tha tests for significant differancas
in returns indicated that in two of tha four market periods
the differanca was not statistically significant. In
period two, a down market, tha data indicated that portfolio
65
returns were not statistically different, as the ten port
folios exhibited similar returns under both mean measures
of return. This relationship was rather unexpected but
was undoubtedly caused by the poor parformanca of tha low
risk portfolios. With tha arithmetic mean return the
actual loss for portfolio ona axcaadad tha loss on port
folio ten. This relationship did not exist, however, when
tha geometric mean was used to datarmina returns.
Portfolio returns in tha third market period ware
also not statistically significant. As a group tha three
low risk portfolios returned an average 30.17% with an
average beta of .60 as compared to tha group of tha three
high risk portfolios whose return averaged 36.09% but
with an average beta of 1.45. Tha range of parformanca
was lass using the gaomatric mean, 26.74% vs. 30.69% for Q
the same values of beta.
Tables 2 and 4 (pages 53 and 62) summarize tha
relationship between portfolios in which there was a
significant diffarance in returns. Comparing tha refaranca
portfolios to tha grouping whose returns vary significantly
revealed an interesting relationship. Tha returns on a
9 For tha investor who desired to know tha approxi
mate confidanca laval at which tha null hypothesis could ba rejected for tha markets in which thara was not a significant diffarance in performance; a cumulative F-Distribution table was raferancad and the returns of tha second, third, and fifth market periods became statistically different at or near tha .50 level of confidanca.

66
number of the low risk portfolios did not differ statis
tically from the returns on tha higher risk portfolios in
both tables, although tha values of beta change consider
ably. This would indicate that similar returns could be
provided by portfolios whose level of risk, as represented
by beta, differed substantially. Consider, for example,
the relationship in Table 2 batwaan portfolios 2 and 8 for
market period ona. Thasa data indicated that there was
no statistically significant difference in tha returns of
tha two portfolios, although tha betas ara .53 and 1.10
respectively. In tha fourth market period tha relationship
was even mora pronounced. Tha returns of portfolios one
through savan differed significantly only from portfolios
8 and 10. Similar relationships ware found in Table 4.
Long-Run Relationship
In addition to tha four specific market periods
used in this analysis, an investigation was also made to
determine tha risk-raturn relationship exhibited over tha
entire time period, referred to herein as tha fifth market
period. By computing returns and betas over tha entire
eight year period it was possible to analyze tha risk-
return hypothesis over succassiva sub-markat periods that
advanced and declined.
Results of the analysis on tha fifth market period
indicated that security returns differed significantly

67
between tha ten portfolios, and in the direction antici
pated, when they were measured by the arithmetic mean.
The exceptions to a steady increase in returns, as tha
level of risk increased, were those of portfolios four
and eight. (Saa Table 1, page 46.) Tha computed F-
statistic of 2.30, when compared to tha critical table
value of 1.88, permitted a rejection of tha null hypothesis,
Range test data yielded tha following homogeneous subsets:
3, 4, 5, 6, 7, 8, 9, 10
2, 3, 4, 5, 6, 7, 8, 9
1, 2, 3, 4, 5, 6, 8
In Table 2 (page 53) data ware available which showed that
tha returns from portfolio ona differed significantly from
those of portfolios seven, nine, and tan, while tha returns
of portfolio two differed only from portfolio tan. All
other portfolios exhibited similar returns for tha period
but with considerable differences in risk.
Whan performance was measured by tha gaomatric
mean return tha results from Table 3 (page 56) ravaalad
that there was not a significant diffarance in tha returns
of tha two portfolios. An F-statistic of .74 would not
permit a rejection of tha null hypothesis. Thasa data
indicated that for tha long run period returns did not
differ significantly batwaan tha tan portfolios as tha
level of risk increased. Evan when returns ware measured
by the arithmetic mean tha significant differancas in

68
portfolio returns was limited, for tha most part, to the
two low and the two high risk portfolios. Tha result of
the analysis, tharafora, would seam to imply that returns
did not increase statistically throughout tha tan portfolios
to compensate the investor for tha increase in risk over
the long run period.
Pura Yield Performance
Table 5 presents summary data that depicts tha
relationship that prevailed batwaan risk and pura yields.
The term "pura yield" as used herein means a measure of
tha return in excess of tha riskless rata per unit of
risk.
Portfolio parformanca indicated that in tha two
up market periods the tradeoff batwaan risk and return
was more favorable for tha low risk portfolios than for
tha high risk portfolios. Declining market periods, how
ever, showed that tha low risk portfolios tended to record
tha greatest loss.
Although return is not normally measured in terms
of a percentage loss, the application of parformanca to
the two declining markets in this analysis is based on
such a principle. Obviously an investor would not hold
a portfolio of ecjuity securities knowing for certain that
tha value of tha portfolio would decline. Tha purpose
of this research, howavar, was to datarmina performance

69
in
W •J
^
0 > •H Pt4
fd o -H 0 04
u o
fd o •H
0 04
0 0 u Xi EH
fd o •H 0 04
fd o •H 0 04
0 G o fd o •H iH
0 04
fd rH 0
•H
0 13 04
fd rH 0 •H
0 U
04
fd rH 0 •H >^
0 iH 0. 04
fd
H 0
-H
0
04 fd iH 0 •H >^
0 iH
04
CQ o -H rH O MH 4J U O Oi
H 00 in VD o
00 rH CN r-o
r-00 vD VD o
r-o H I> o
rH VD CN VD O
t "«* VD in o
00 ro 00 00 o
• *
•^ CN in o
ro rH OS VD O
• ^
in CN VD O
r-00 in ro •^
ro -^ 'f in ro
in
CN
CN
o in in ro
o o
00 in 00 OS CN
OS rH CM VD CM
00 rH
I
ro
I
OS
"^ OS CN
CN rH ro VD CM
00 OS CM 00 CM
00 in 00 CN ro
I I I
00 00 o o VD
CM '^ H in VD
CN in in
ro in
CN
VD CM
o ro
in CN rH CM
OS in ro 00 CN
VD VD ro ro CN
VD CM CM CM CM
ro H vD rH
CM ro in vD
in
ro CM
I
CO OS
OS
rH
CM
"^ ro in rH CO
CO rH OS
a> ro
in rH rH rH ro
CM o CM r-CM
o CM • > *
r*-) CM
o "* in CM CM
o OS CO CM CM
VD rH rH -* CM
ro OS ^ CN CM
H O ro o CM
ro r>--^ r-CM
o r-o r rH
rH in CM VD rH
in OS VD OS rH
en o CO OS rH
o CO in CO H
70
over periods that advanced and declined, and to do so
required a measure of performance for the down markets.
With this in mind, superior performance would ba recorded
for the portfolio that displayed tha lowest loss for the
period. This was tha criteria on which relative par
formanca was measured in market periods two and four.
In tha fifth market period, pura yield performance
appeared mixed, although thara was a slight tendency for
it to decrease as tha laval of risk increased. Tha overall
relationship was not as clear in this time period as it
was in periods ona through four.
In an effort to mora clearly depict tha relative
portfolio parformanca over tha five market periods of this
analysis, tha risk and return data of tha tan portfolios
were plotted to graphically display the pura yield par
formanca for each market period.
An investor has a choice of two basic types of
investments: (1) fixed income securities—for tha most
part, a wide range of bonds, ona of which will be referred
to here as government securities and considered to ba a
"risk free" invastmant and/or (2) variable income
securities—in tha main, raprasantad by common stocks.
Traynor [76] refers to tha two classes of investment assets as: (1) Monay-fixad claims such as checking deposits; savings deposits; govarnmantal, municipal, and corporate bonds; and (2) Ec uity assets which includes acjuity in personal business and partnerships and corporate common stocks.

71
He can hold a portfolio consisting of either ona or both
types of securities. The investor who holds risk-fraa
securities limits his risk, to changes in the laval of
interest rates and tha rising price laval. Generally, he
avoids market risk which is prevalent in variable income
securities. If an investor dasirad to raise his rata of
return above this "riskless rate," ha would have to invest
in ecjuity securities or lower quality fixed income securi
ties. Tha portfolio of equities that would contribute
the greatest return par unit of risk exposure would
undoubtedly be the most desirable.
Figure 2 depicts tha tradeoff between risk and
return, above the riskless rata of 4%, that was obtained
on tha tan portfolios in tha five market periods. - By
plotting tha risk-return data of Table 1 for all portfolio
classifications a relative parformanca comparison was made
for each market. Tha portfolio that had tha greatest
slope to its portfolio possibility line would provide
superior parformanca for tha period.
Pura yield is a statement of parformanca that
relates return, in excess of tha riskless rata, to beta.
{See Ecjuation 8.) Thus, parformanca is a function of both
• Tha average yield on thraa month Treasury Bills for the period 1962-1970 was 4.45. This figure was rounded to 4.0, tha nearest whole percentage, and was used to represent the "riskless rata" in this portion of the analysis.
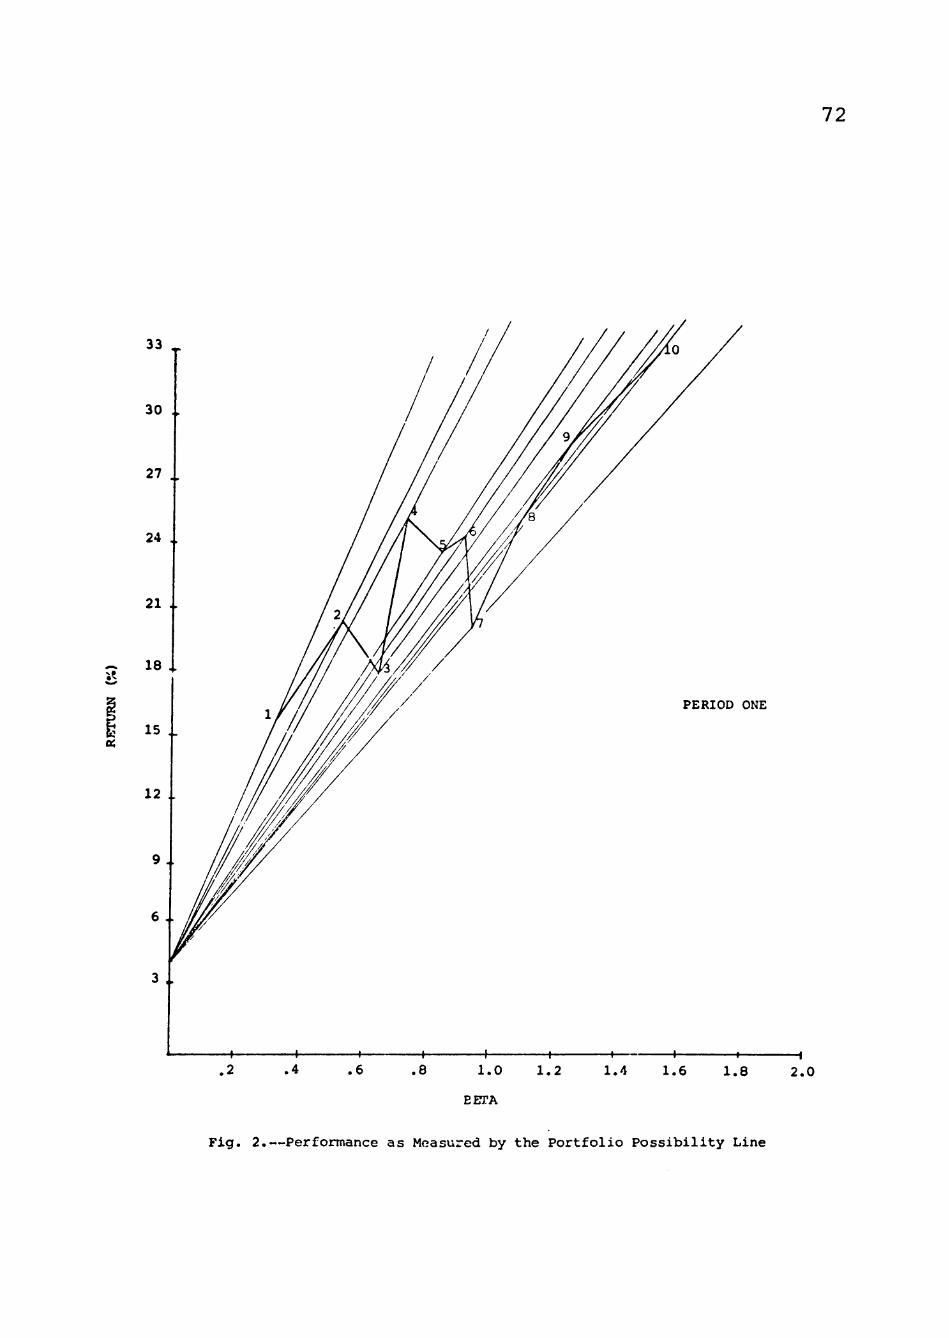
72
.«
Fig. 2.—Performance as Measured by the Portfolio Possibility Line
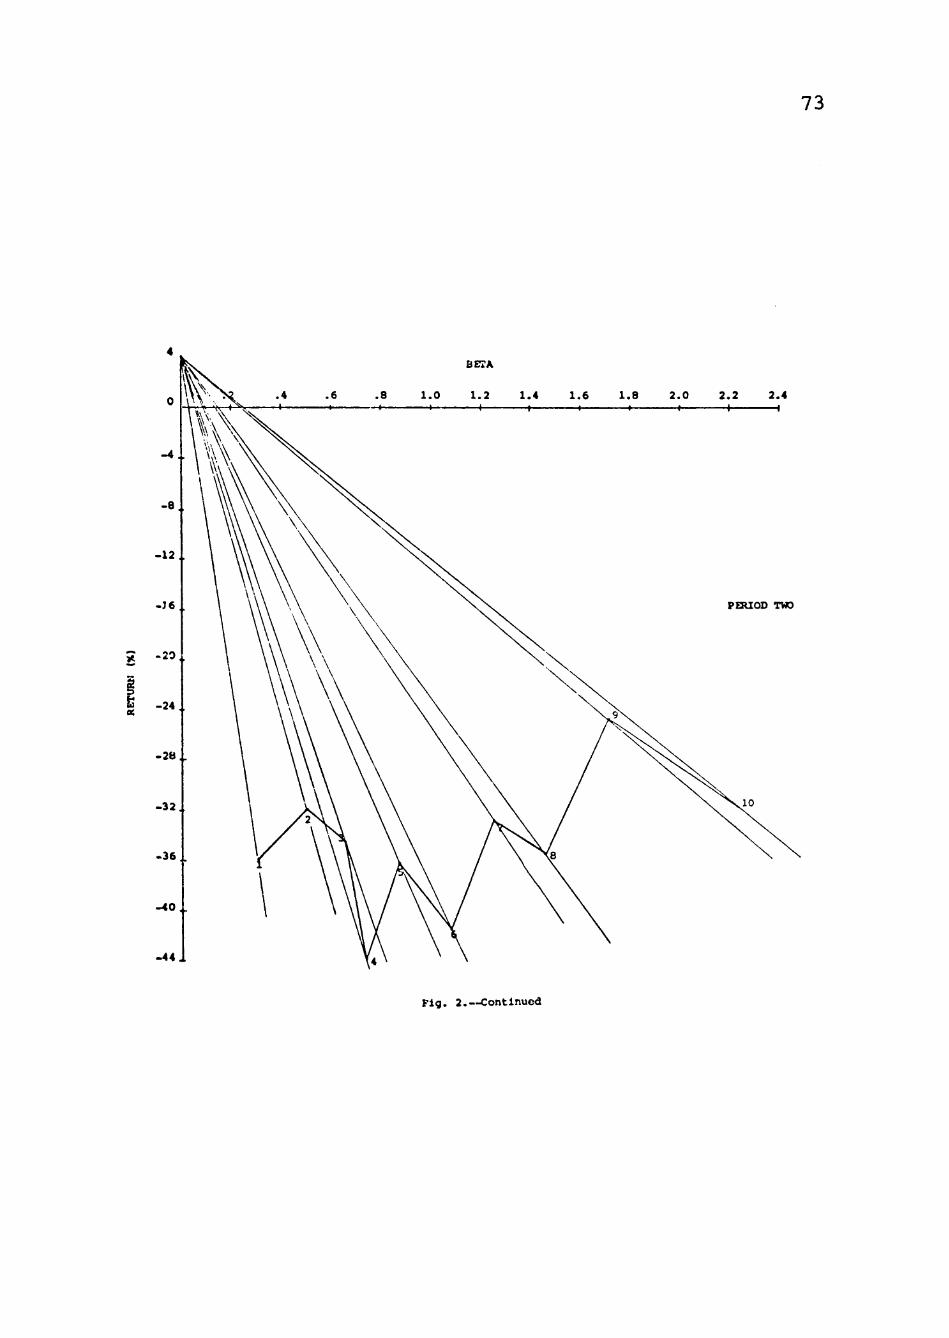
73
-12
-3 6 .
- 2 8 . .
- 32 .
-36 .
•HO ..
-44 i
.6 .8 1.0 1.2 1.4 1.6 1.8 2 .0 2 .2 2.4 I ' 1 ( I I 1 1 1
Fig. 2.—Continued

74
^
Fig . 2.—Continued

75
4
0
- 5
-10 ..
-15
^ - 2 0 ..
oi - 25 ..
- 3 0
-35 ..
- 4 0 ..
-45 .
-50 i
Fig . 2.—Continued

76
Fig . 2.—Continued
77
return and beta, therefore, tha portfolio that provides the
greatest return, in absolute amount, will not necessarily
provide superior performance. For example, consider the
returns of portfolios ona and four in the first market
period. Tha returns and betas for the two portfolios
are 16.22% and .34; 24.75% and .73 raspactivaly. Although
portfolio four earned a greater absolute return, in terms
of aquation (8) portfolio ona provided tha bast parformanca-
35.57% to 28.36%.
The picture of relative parformanca can ba
sharpened if consideration is given to holding any of tha
tan portfolios in combination with tha riskless rata
(borrowing or landing at 4%) . The return will always ba
greater, for any layered combination of tha raspactiva
portfolio and tha riskless rata, on that portfolio whose
portfolio possibility line has tha greatest slope.
Summary of the Relationship Between Risk and Pura Yields
For tha two periods in which tha market trend was
up, market periods ona and three, tha tradeoff batwaan
risk and return consistently favored tha lower risk port
folios. An examination of Figure 2 ravaals that even
though tha pattern of returns was not statistically
different in tha third market period, results from tha
analysis of pura yields indicates that tha lower risk

78
portfolios consistently provided a greater excess return
per unit of risk than tha higher risk portfolios. A
similar relationship prevailed in tha first market period
when thara was a statistically significant differanca in
portfolio returns. Pura yield performance of tha lower
risk portfolios dominated tha portfolios of higher risk.
Tha results of two studies by Friend and Bluma proved
compatabla with these. •' Comparing portfolio returns with
beta for tha period 1929-1969 and 1960-1968, tha authors
concluded that thara was positive association batwaan the
two variables, and, while higher beta portfolios reported
larger returns than low beta portfolios, there was little
difference in tha returns for portfolios of higher risk.
Thair data indicated that thara was little payoff for
assuming additional risk within a group of stocks with
betas greater than ona.
In market periods two and four, the two down
markets in this analysis, tha tradeoff between risk and
return indicated that tha loss par unit of risk on tha
low risk portfolios axcaadad tha loss on high risk port
folios. With respect to pura yield parformanca lower risk
portfolios performed lass favorably than high risk
•'• Irwin Friend and Marshall E. Bluma, "Risk and tha Long Run Rata of Return on NYSE Common Stocks," Working Paper No. 18-72, Wharton School of Commarca and Finance. Summarized in Modigliani and Pogua [50, p. 81] , and [26] .

79
portfolios. In market period two tha atypical pattern
of returns undoubtedly caused tha poor pura yield per
formance of the two lowest risk portfolios. Tha returns
of tha ten portfolios ware not significantly different
for tha period, and whan normalizing similar losses by
betas that ranged from .31 to 2.24 tha result was an
unavoidably high negative pura yield for tha two low risk
portfolios. The pattern of returns in the fourth market
period ware mora typical than those of tha second period,
as low risk portfolios lost lass than high risk portfolios.
Results of tha analysis on tha fifth market period, for
tha most part, favored tha lower risk portfolios. With
the exception of portfolio savan, tha pattern of pura
yields resembled tha relationships in market periods ona
and thraa.
A finding that was consistent in all five market
periods, and ona that was meaningful to this analysis, was
tha fact that tha price of risk reduction changed. Tha
increase in portfolio returns did not keep pace with tha
increase in risk. Tha tradeoff between risk and return
consistently favored tha low risk portfolios in up markets,
while in down markets tha bast parformanca was shown for
high risk portfolios.
An additional comment is required to give con
sideration to tha practical aspect of tha aforamantionad
analysis in comparison to tha theoretical application of
80
tha performance measure. By combining any portfolio with
tha riskless rate (that is, by borrowing or landing at
"r" in equation 8), any risk-raturn combination along a
portfolio possibility line can ba obtained. Tha portfolio
with the greatest slope to its possibility line will, as
shown earlier, also provide tha bast performance. Howavar,
from a practical point of view, it is highly unlikely that
an investor could borrow and land at tha riskless rata
(taken to ba the average yield on Treasury Bills for this
analysis, which was datarminad to ba 4%) . If tha landing
and borrowing rata ware different, which is likely, tha
shape of tha portfolio possibility line becomes dis
continuous (saa Figure 3).
Tha segments ra and rb represent all possible
combinations available to tha investor by combining port
folios A and B with the riskless rata under tha assumption
that tha borrowing and landing rates ara tha same.
Segments Ax and By represent additional combinations
available to tha investor by borrowing at r , assuming
that tha borrowing rata exceeds tha landing rata, and
investing in the raspactiva portfolios. Thus, all combina
tions of portfolio A with r and r ^ ara still dominant
relative to portfolio B. Only tha shape of tha portfolio
possibility lines change.

81
G U
•P 0)
(Xi
(1) 4J U Q)
t
Beta
Fig. 3.—Performance as Measured by tha Portfolio Possibility Line Whan tha Borrowing and Landing Rates Differ
Relationship of Beta Coafficiants
Since the determination and usa of beta coefficients
ware an integral part of this dissertation, an investigation
was made to determine if any unusual characteristic could
ba detected that might have had an impact on tha findings
of this research. As a result, two characteristics of
beta ware examined that ware thought to have had soma impact
on tha results of this analysis: (1) tha distribution
of portfolio beta coafficiants by market periods, and
(2) the ability of beta to predict return. Specifically,
an investigation was made to datarmina tha behavior of

82
beta over market periods that advance and decline, as wall
as the concurrent relationship batwaan beta and return by
market period.
Distribution of Beta Coafficiants
Table 6 presents a distribution of sub-pariod beta
coefficients for 25 stock portfolios for tha period
7/6/62 through 5/22/70. Summary statistics ara presented
for each of tha five periods in terms of high, low, and
mean beta, as wall as tha standard deviation by risk class
over tha four sub-pariods. For the entire eight year
period tha average beta was 1.02, while tha first and
tenth decile betas ware .53 and 1.64 raspactivaly.
Tha most noticeable result of tha beta distribution
analysis was tha variation found in tha average portfolio
betas over tha four specific market periods. Tha greatest
differanca in betas occurred batwaan up periods and down
periods. An example of this variability can ba saan by
examining tha standard deviation of tha portfolio betas
over the four market periods. (Saa Table 6.) Tha greatest
variation occurred in what might ba termed tha high risk
strategies—portfolios 8, 9, and 10. Tha thraa low risk
strategies, portfolios 1, 2, and 3, and tha four inter
mediate risk strategies 4, 5, 6, and 7 indicate lower
variability. With tha exception of portfolio 2, tha

83
VO
r-j
a Wo < cu o
w
H
o u
n o o H
w o H
o « CM O CM
o
fc< in
o>
w
o z o H
CQ H OS
W H Q
EH fS W VO
\ If) VO
o
00
o •H H O
O (X
CO
CM
• c '0 (0
"0
Z M
so*
VO 00 in IT)
in VO
n CN
r* rH
r« VO
H CN ro c
o VO 00 VO
CM
00 CM ro CM
t^ "'I' ^ ' t^
in t^ r-i "<*
in
o •«* "<4'
ro (T> ro ro
r O O r-i
r* in in "^
VO CM VO CM
ro in
r CM
vO <-i a\ •H
a\ (N a\ a\
c o 00 CM
H VO i-i H
VO <T> 00 rH
•* VO CJ O
vO
lO
(0
to
Bet
t^ in
o <j\ •
(T> lO CM 00 •
VO "*
r-« o • •H
(J\ O 0^ 00 •
ro O CJ O •
iH
rH ** rH
o •
00 VO
cr> o • rH
CM CM CM
o • •-i
o o CM O •
H
ro CM in a\ •
VO rH 00
r~ .
r-VO ro VO •
VO ( CM in •
vO ro "^ 00 .
00 in 00 00
00 0^ 00
r •
in ro 'Sl' vO •
t^ ro r-t in •
•«t
ro rH ro •
•«*' •^ 00
o
CM CM CM a\ •
CM "<* >-i 00 •
^ iH
r-VO •
in ro CN 00 •
•^ in 00 O
"* CO 'd* a> •
o 00 VO 00 •
VO CN VO
r~ •
00
o ro in •
r-i VD O •-i
ro O ( 00 •
O iH ro 00 •
o CM •^
r «
in CM ro in t
r-i
ro CM
o
+> • a > 5
00 < ro
+J • Qt O
CN
4J • ft >
in < ro
4J • A CJ
Q) v O Q m
+» • ft > VO < H
CN fO in
CM
00 00
00
(N
in
VO rH
VO o CN
in o
o
00
00
•«1«
VO ro
ro
00
>
Q
(0
I

84
greatest difference batwaan the betas was found batwaan
an up-market and a down-market. Considering the previous
exception, on portfolios 1 through 6 tha greatest differanca
was found between market periods ona and four. In both
periods the change of tha market index was virtually tha
same, only in opposite directions. Tha index advanced
38 points in period ona and declined 36 points in period
four. For portfolios 7 through 10 tha greatest diffarance
was found batwaan market periods ona and two. In thasa
periods tha index declined 21 points in period two relative
to tha 38 point advance of tha first period.
Data ware also available to show that if tha com
parison had baan made between the beta values of individual
securities rather than portfolios, over tha four market
periods, tha differanca among tha up-pariod betas and the
down-pariod betas would have baan even mora pronounced.
Not only was thara a differanca in betas batwaan advancing
and declining markets, but thara was also a number of
instances in which individual betas ware considerably
different batwaan market periods of tha same trend. This
relationship would saam to indicate that thara was a
differanca in tha rasponsivanass of a security's return
to that of an index in market periods that advanced and
declined. If portfolios actually respond differently
in up markets than thay do in down markets, portfolio
theory would require a model that was capable of specifying
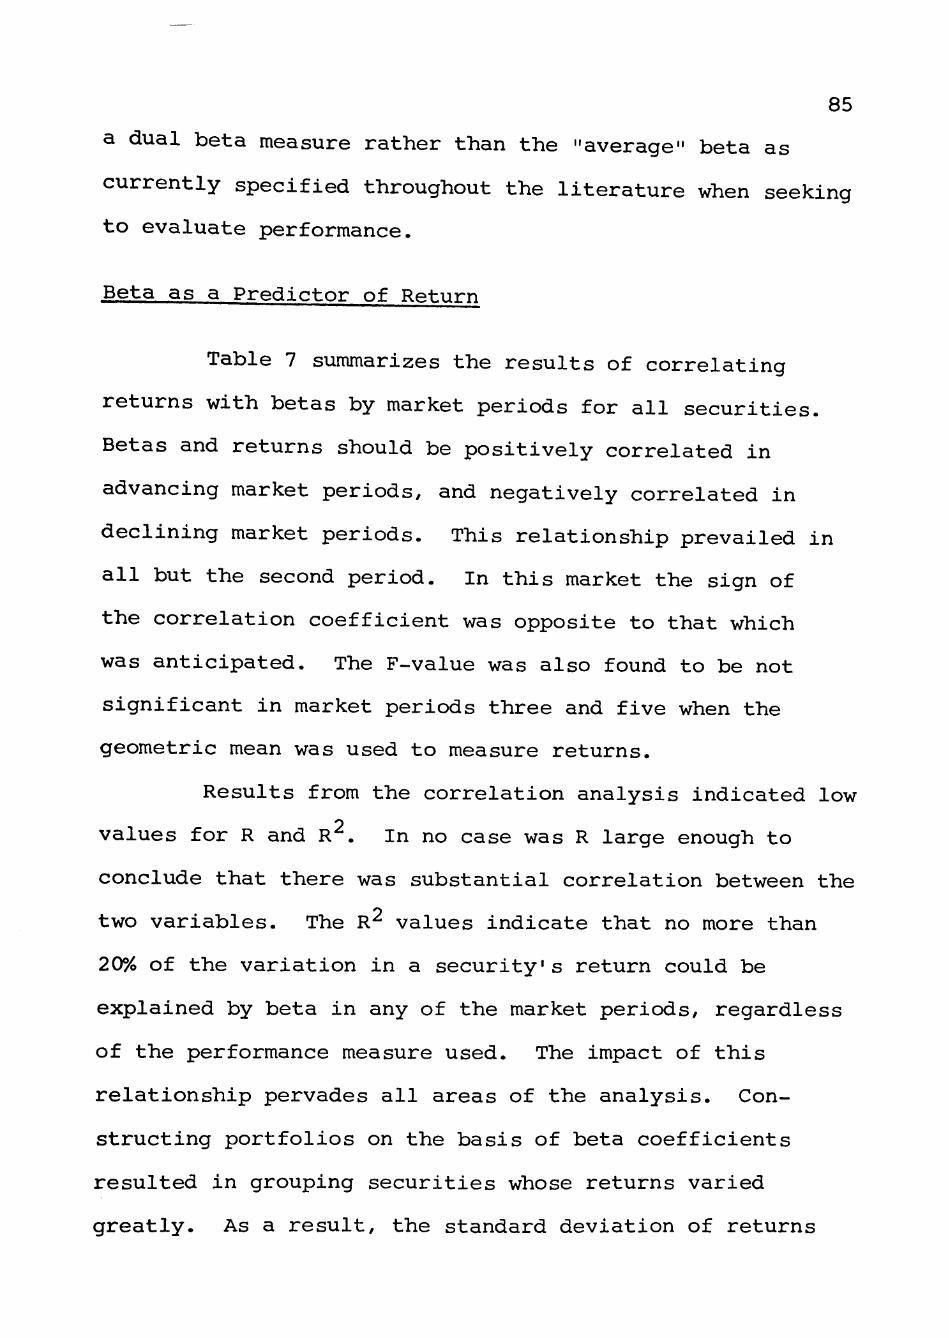
85
a dual beta measure rather than the "average" beta as
currently specified throughout tha literature whan seeking
to evaluate parformanca.
Beta as a Predictor of Return
Table 7 summarizes the results of correlating
returns with betas by market periods for all securities.
Betas and returns should be positively correlated in
advancing market periods, and negatively correlated in
declining market periods. This relationship prevailed in
all but tha second period. In this market the sign of
the correlation coafficiant was opposite to that which
was anticipated. Tha F-valua was also found to ba not
significant in market periods three and five when tha
gaomatric mean was used to measure returns.
Results from tha correlation analysis indicated low
values for R and R''. In no case was R large enough to
conclude that thara was substantial correlation batwaan tha
two variables. Tha R^ values indicate that no mora than
20% of tha variation in a security's return could ba
explained by beta in any of tha market periods, regardless
of tha parformanca measure used. Tha impact of this
relationship pervades all areas of the analysis. Con
structing portfolios on tha basis of beta coefficients
resulted in grouping sacuritias whose returns varied
greatly. As a result, tha standard deviation of returns
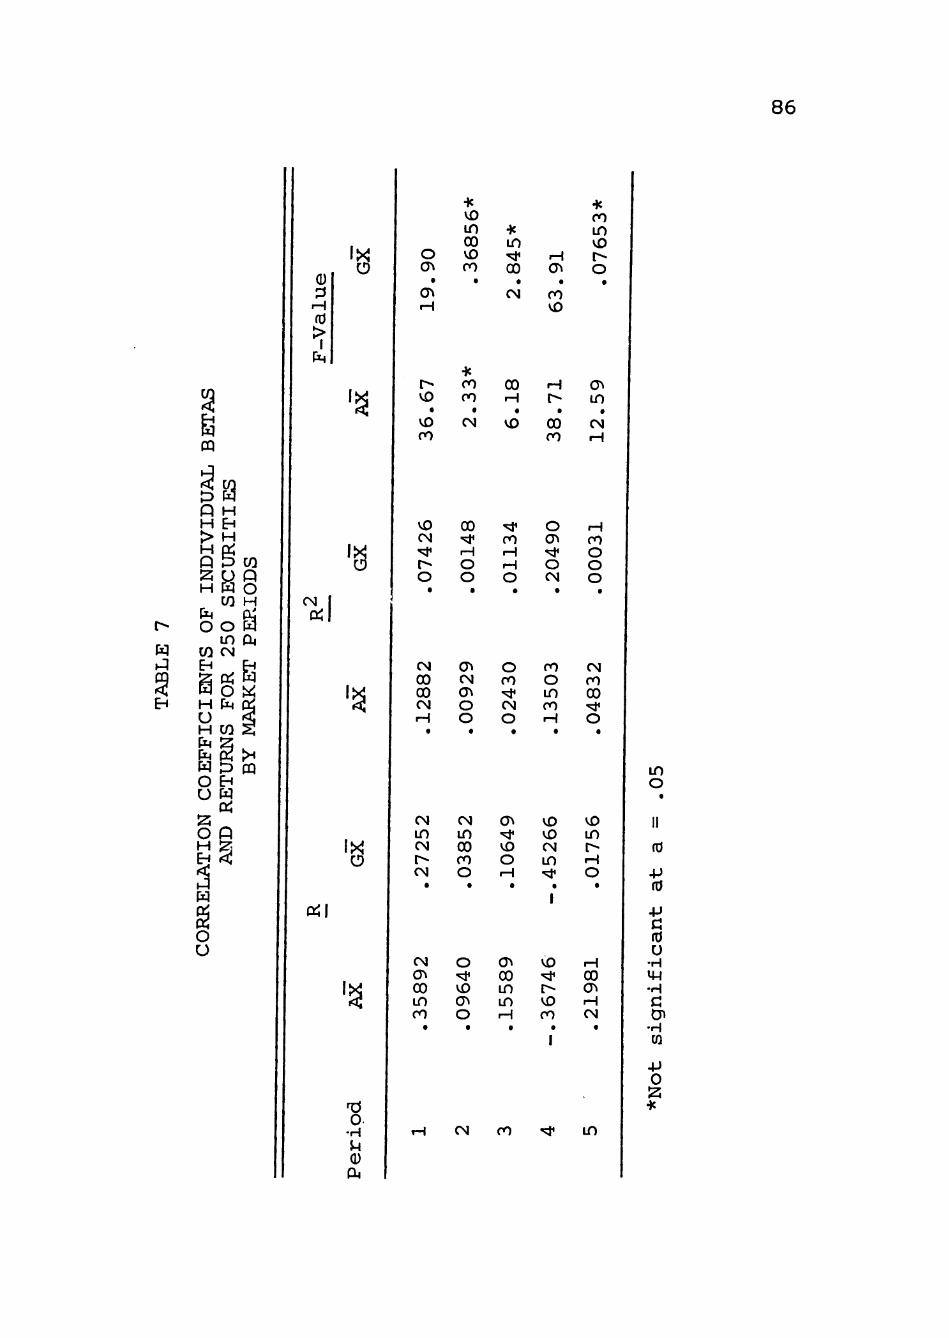
86
w ^A
3 (A
rH CO
IX o
IX o
CN (Xi
IX
P4I
O -H }
0*
o cr» Ok H
•K
VD in CX) VD ro
* lO ''t 00
CN
rH OS
en VD
•K ro lO VD r-o
r VD •
VD ro
•K ro ro t
CN
CO rH «
VD
H r-•
00 ro
OS in •
CM rH
VO CN
o
CN 00 00 CN
CN in
CN
CN
CN o\ 00 in ro
00
rH o o
OS CN o\ o o
CN in 00 ro o
o VD OS
o
CN
ro
o ro
CN
o
OS
VD
o
OS 00 in in
ro
o OS -^ o CM
ro o in ro
VD VD CN in
I
VD
VD ro
I
rH ro o o o
CN ro 00
o
VD in
rH
o
rH 00
rH CN
in
in o
II
+J
(0 •p G (0 u
•H
•H c •H CQ 4J o •K

87
within portfolios was large and contributed to a large
error mean square term within groups for tha analysis of
variance. Tha Duncan Test, which incorporates this term
in tha determination of tha least significant ranges, was
also affacted as avidancad by tha dispersion in tha range
of returns that ara found to ba not significantly different.
To objactivaly evaluate the capability of beta to
predict return additional consideration must ba given to
the relationship between portfolio betas and returns. To
datarmine this relationship portfolio returns ware corre
lated with thair respective betas in each of tha five market
periods. Tha results ara presented in Table 8. The
findings ara similar to those of Table 7 except that tha
R and R^ values ara considerably higher, indicating an
improvement in tha predictive ability of beta at tha port-
folio level. Tha improvement in tha R and R^ values would
ba axpactad at the portfolio laval as tha measurement
error associated with the calculation of individual betas,
and the impact of unsystematic risk on single security
returns can ba neutralized by proper diversification
techniques. Thus, a clearer picture of tha relationship
between return and systematic risk can ba presented. Thasa
results are consistent with the conclusions of Modigliani
and Pogua [50] in thair discussion of tha expected relation
ship between risk and return.

88
00
w tA
P l
CN
C t J l
IX
• H
CD QH
t^ H •
rH CN
CN 00 •
"* ro
•K ^ in •
•Jc CN VD •
rH
* ro ro •
ro
^ O • [
OS ^ •
o in
ro rH •
rH ^
CO VD .
VD in
on CN •
in CN
VD
in CN
CO H ro rH 00
CN OS rH in CO
H
o OS
rH
o ro vD
o
CO 00 CO VD rH
OS
in CN
VD cr> o rH
CN
ro CN OS rH CN
ro CN CO VO
CN
in
00
00 VD
ro
rsj ro V D CO
O CM
ro CO
rH OS CN OS
I
OS OS
OS
I
\> rH VD VD
o
VD VD OS
m
CN
in CN
cr> i n rH
CO
i n
in o
II
(0
-M OJ
• P C fO O
• H
• H
c; • H CQ
+J O iz;

89
The impact of the general dispersion in tha return
data to tha empirical relationship batwaan risk and return
and pura yields for this analysis was explained earlier.
This finding of variability of returns would go a long
way towards a possible explanation for tha conflicting
results of related research found throughout tha literature
regarding tha empirical tests of tha risk-raturn hypothesis

CHAPTER V
SUMMARY, CONCLUSIONS, AND IMPLICATIONS
Summary
The purpose of this research was to datarmine whether
or not common stocks charactarizad by a higher dagraa of
systematic risk afforded an investor higher rates of return
than sacuritias with low systematic risk under identifiable
swings in tha market. Four distinct trends in market
activity for tha period of July, 1962, through June, 1970,
were identified by examining tha price data for Standard
and Poor's Composite Stock Index (S & P Composite).
Weakly returns for 250 securities ware calculated for each
market period. These returns ware regressed against price
relatives for tha S & P Composite, tha results of which
ware used to rank-order all sacuritias from lowest to
highest on tha basis of thair beta coafficiants. The list
of securities was partitioned into tan risk classes or
portfolios so that portfolio ona consisted of tha 25
securities with the lowest beta values. Each of tha nine
remaining portfolios ware similarly constructed to contain
tha next 25 most risky securities.
Returns ware computed using both tha arithmetic
and geometric mean for all sacuritias in each of tha four
90
91
market periods. Tests for significant differences in
portfolio returns ware made to examine tha statistical
significance of any diffarance. Tha analysis of the
arithmetic mean returns was further extended to include an
examination of tha "pura yield," as a measure of parfor
manca, in an effort to evaluate the increase in return par
unit of risk, and to derive a relative parformanca ranking
of tha tan portfolios based on the portfolio possibility
line.
Data ware also available to examine and compare
tha long-run relationship batwaan risk and return. Per
formance was measured over tha entire eight year period
for each portfolio and presented as findings in the fifth
market period.
Conclusions
Findings of tha empirical research discussed in
Chapter IV ravaalad that a positive linear relationship
was only an approximation of tha association between
risk and return in this analysis. It was not possible,
however, on tha basis of tha findings to completely accept
or reject tha risk-return hypothesis as evaluated in this
dissertation. With raspact to tha null hypothesis, which
stated that thara was no significant diffarance batwaan
the mean returns for the ten risk classes within each
market period, a rejection was permitted in two of tha
92
four market periods using both arithmetic and gaomatric
mean returns.
Tha long-run relationship that was described by
the fifth period analysis permitted a rejection of tha
null hypothesis using arithmetic mean returns, but it
could not be rejected, howavar, when performance was
measured by geometric mean returns. In raspact to the
pattern of returns in tha four specific market periods, a
significant differanca was found in market periods one and
four (an up market and a down market) ; while no significant
diffarance in returns was found in market periods two and
three (also an up market and a down market) . With tha
exception of market period two, high risk securities
appeared to return mora than low risk securities in market
periods that advance, and to exhibit greater losses in
market periods that decline; howavar, tha difference in
tha pattern of returns was not statistically significant
in two of the four periods.
Results from tha analysis of pura yields indicated
that tha increase in returns, or decrease in losses, was
not consistent among the ten portfolios in any of tha five
market periods. Relative parformanca among the portfolios
did not increase or decrease proportionately to changes
in beta as presumed in tha theory of tha Capital Asset
Pricing Modal (CAPM). Performance in tha up markets
indicated that the return in excess of tha riskless rata

93
was clearly dominant for the lower risk portfolios. Tha
data implied diminishing marginal returns for tha investor
who assumed additional risk. This finding adds further
avidanca to question tha performance patterns of tha tan
portfolios. If tha increase in returns responded to the
increase in risk, proportionately, as hypothesized by the
CAPM, all portfolio possibility lines would plot with a
common slope. Such was not tha case for any portfolio in
any market period.
In tha two declining market periods, tha best
performance was recorded by tha high risk sacuritias. Tha
loss on tha lower risk portfolios axcaadad tha loss on tha
higher risk portfolios, and would saam to indicate that
under both advancing and declining market trends tha lower
, , risk portfolios ware mora aggressive, proportionately to
their level of risk, than thair higher risk counterparts.
Although tha findings presented here must ba
considered in view of tha information sources utilized, and
tha time period considered, tha avidanca presented clearly
questions tha validity of tha premis that investment
parformanca can ba improved by downgrading tha cjuality of
a portfolio. It was concluded, tharafora, that sufficient
evidence was available to cast doubt on tha pattern of
security returns as prescribed by tha risk-raturn hypoth
esis. Similar research encompassing a different time
period could produce results of a different nature. Tha
94
singular fact that the findings from this analysis were
mixed implies that tha performance tradeoff changes over
time.
Implications
An important implication that surfaced from this
analysis, and ona which undoubtedly had an impact on tha
findings, pertained to tha relationship of beta coafficiants
An examination of many sacuritias that comprised tha port
folios used in tha analysis revealed that beta coafficiants
lacked stability whan computed over market periods that
advance or daclina. Numerous instances ware noted in which
thara was a considerable difference in tha up beta and
tha down beta for individual sacuritias.
Further avidanca of beta variability can be saan
by examining tha specific composition of each portfolio
over tha four periods. In every instance, tha portfolios
consisted of a different combination of sacuritias from
ona market period to another. Numerous instances ware
found in which sacuritias ware positioned four or five
classifications away from thair previous ranking. If
beta coafficiants tend to vary in magnitude and response
to directional changes of tha index than an "average"
beta, as currently specified throughout tha literature,
may misrepresent tha true rasponsivanass of security
returns to changing market conditions. If securities do

95
respond differently in up markets than thay do in down
markets, investors would undoubtedly prefer stocks which
displayed large up betas and small down betas over all
others. In this avant, portfolio theory would require a
model capable of specifying a dual beta measure when
seeking to evaluate parformanca.
Evidence related to tha correlation analysis also
provided information that had additional implications for
this research. Data from tha regression of individual
security returns against beta, for each of tha five market
periods, ravaalad mixed results pertaining to the signifi
cance of tha correlation batwaan the two variables.
Although the relationship was significant in most periods,
in no case could tha R and R^ values ba considered great
enough to indicate a high dagraa of association between
risk and return. Results from correlating portfolio
returns with betas yielded larger R and R^ values and an
improvement in beta's ability to predict returns. Undoubt
edly ona of tha factors that contributed to the limited
ability of beta to predict individual security returns
would have to ba attributed to tha instability noted in
betas over tha five market periods. In numerous instances
individual sacuritias exhibited considerable differancas
in rasponsivanass to market conditions which advanced and
declined.
96
Tha "scatter," which was evident in tha data due
to the variability in return, when coupled with tha
apparent instability in betas suggests that beta coeffi
cients may have savara limitations in predicting return.
Throughout the ten portfolio classifications there ware
numerous securities of all risk levels which exhibited .
both high and low return. Evan in market periods of
similar trend and magnitude, but different time periods,
variability was noted in beta coefficients and returns.
Recommendations for Future Research
Emanating from tha preceding conclusions and
implications of tha present analysis ara some racommanda-
tions for further research. Tha findings of this research
are presented with limitations imposed by tha cjuantity
of data and conceptual framework of analysis. This
approach, unlike tha majority of related research, was
directed at determining tha performance tradeoff among
ecjuity securities over specific market trends. Tha findings
from this analysis suggest several avanuas of future study.
Tha first would logically involve an expansion of the
approach employed in this research. An expanded sample,
for an extended time paricDd could undoubtedly provide
additional information which would contribute to the
currant theory as parcaivad in the risk-raturn hypothesis.
Many research designs, beyond that used in this dissertation.
97
could be employed to test the relationship—expanded tests
of the CAPM or individually contrived methodologies could
be employed to investigate tha empirical relationships.
Additional research and corroborating results would ba
recjuirad before empirical avidanca could ba assembled
to rafuta tha generally accepted tanat of the risk-raturn
hypothesis.
A second possibility for additional research
might ba an inter/intra-industry analysis to determine tha
extant to which tha theory of tha risk-raturn hypothesis
might vary batwaan and within industries. Evidence as
to tha nature and consistency of performance by industries
would saam to ba an approach worth investigating.
Finally, continued research pertaining to further
evaluation of tha stability of tha parameters used in
specifying risk and return should be undertaken. General
avidanca of a lack of stability in tha two variables was
noted throughout this analysis. Research should ba
directed at determining tha currant nature of security
rasponsivanass to changes in tha laval of tha index, and
of tha inherent stability or lack of stability in tha
parameter specifications.
Opportunities for contribution to tha developing
theory of security parformanca ara virtually unlimited.
With continually developing data sources and improved
research capabilities continued research should provide

98
sophisticated and comprahansiva examinations of a variety
of related topics to tha general area of security par
formanca. Tha number of approaches should ba limited only
by the imagination of tha researcher.

BIBLIOGRAPHY
1. Frad Arditti. "Risk and tha Required Return on Equity." Journal of Finance. XXII (March, 1967), 19-36.
2. K. J. Arrow. "Tha Rola of Securities in tha Optimal Allocation of Risk-Bearing." Raviaw of Economic Studies, XXXI (April, 1964), 91-96.
3. Howard L. Balslay. Quantitative Research Methods for Business and Economics^ Naw York: Random House, 1970.
4. W. Scott Bauman. "Investment Experience with Lass Popular Common Stocks." Financial Analysts Journal, XX (March-April, 1964), 79-88.
5. Albert Y. Bingham. "Relative Parformanca—Nonsense." Financial Analysts Journal, XXII (July-August, 1966), 101-4.
6. Fishar Black; Michael C. Jansan; and Myron S. Scholas. "Tha Capital Asset Pricing Modal: Soma Empirical Tests." Studies in the Theory of Capital Markets. Edited by Michael C. Jansan. Naw York: Praegar Publishers, 197 2, 79-112.
7. Frank E. Block. "Risk and Parformanca." Financial Analysts Journal, XXII (March-April, 1966), 65-74.
8. Marshall E. Blume. "On tha Assessment of Risk." Tha Journal of Finance/ XXVI (March, 1971), 1-10.
9. Marshall E. Bluma and Irwin Friend. "A Naw Look at tha Capital Asset Pricing Modal." Journal of Finance, XXVIII (March, 1973), 19-33.
10. Richard S. Bowar and R. Wippern. "Risk and Return Measurement in Portfolio Selection and Parformanca Appraisal Models: Progress Report." Journal of Financial and Quantitative Analysis, IV, No. 4 (Dae, 1969), 417-47.
99

100
11. Richard A. Braalay. An Introduction to Risk and Return from Common Stocks. Cambridge, Mass.: The MIT Press, 1969.
12. G. Brisco; J. M. Samuels; and D. J. Smyth. "Tha Treatment of Risk in tha Stock Market." Journal of Finance, XXIV (Sept., 1969), 707-13.
13. Ya-Lun Chou. Statistical Analysis with Business and Economic Applications. Naw York: Holt, Rinahart and Winston, Inc., 1969.
14. W. C. Cochran. "Some Consecjuencas Whan tha Assumptions for tha Analysis of Variance are not Satisfied." Biometrics, Vol. s (1947), pp. 22-38.
15. Paul H. Cootnar, ad. Tha Random Character of Stock Market Prices. Cambridge, Mass.: The MIT Press, 1964.
16. Patar O. Diatz. "Components of a Measurement Modal: Rate of Return, Risk and Training." Journal of Finance, XXIII (May, 1968), 267-75.
17. . "Pension Fund Invastmant Parformanca— What Method to Usa When." Financial Analysts Journal, XXII (Jan.-Feb., 1966), 83-86.
18. Wilfred Dixon. BMP: Biomedical Computer Programs. Berkeley, Calif.: University of California Press, 1970.
19. and Frank Massay, Jr. Introduction to Statistical Analysis. Naw York: McGraw-Hill Book Co., Inc., 1957.
20. G. W. Douglas. "Risk in tha Equity Markets: An Empirical Appraisal of Market Efficiency." Yala Economic Essays, IX (Spring, 1969), 3-45.
21. Eugana F. Fama. "Risk, Return and Equilibrium." Journal of Political Economy, LXXIX, No. 1 (Jan.-Fab., 1971), 30-55.
22. . "Risk, Return, and Equilibrium: Soma Clarifying Comments." Journal of Finance, XXIII (March, 1968), 29-40.
23. Lawranca Fisher and J. Loria. "Rates of Return on Investments in Common Stocks." The Journal of Business, XXXVII (Jan., 1964), 1-21.

101
24. . "Rates of Return on Investments in Common Stocks: The Year-by-Year Record, 1926-1965." The Journal of Business, XLI (July, 1968), 291-316.
25. John E. Fraund; Paul E. Livarmora; and Irwin Millar. Manual of Experimental Statistics. Naw Jersey: Prantica-Hall, Inc., 1960.
26. Irwin Friend and Marshall Bluma. "Measurement of Portfolio Parformanca Under Uncertainty." The American Economic Raviaw, LX (Sept., 1970), 561-75.
27. Charles R. Hicks. Fundamental Concepts in tha Design of Experiments. Naw York: Holt, Rinahart and Winston, 1964, 21-65.
28. Jack Hirshlaifar. "Risk, tha Discount Rata, and Investment Decisions." The American Economic Review, II, No. 2 (May, 1961), 112-20.
29. Nancy Jacob. "Tha Measurement of Systematic Risk for Securities and Portfolios: Some Empirical Results." Journal of Financial and Quantitative Analysis, VI (March, 1971), 815-34.
30. Palmer O. Johnson. Statistical Methods in Research. Naw York: Prantica-Hall, Inc., 1949.
31. Benjamin King. "Market and Industry Factors in Stock Price Behavior." Journal of Business, XXXIX, No. 1 (Jan., 1966), 139-90.
32. Henry A. Latane. "Criteria for Choice Among Risky Ventures." Journal of Political Economy, LXVII, No. 2 (April, 1959), 144-55.
33. . "Individual Risk Performance in Portfolio Selection." Journal of Finance, XV (June, 1960), 45-52.
34. and Donald C. Tuttle. Security Analysis and Portfolio Management. Naw York: Tha Ronald Press Co., 1970.
35. Eugana Larnar. "Rata of Return on Common Stocks." Financial Analysts Journal (Sept.-Oct., 1960), pp. 47-50. Reprinted in Larnar, Readings in Financial Analysis and Investment Management, pp. 111-17.

102
36. Robert A. Levy. "Beta Coafficiants as Predictors of Return." Financial Analysts Journal, XXX (Jan.-Fab., 1974), 61-69.
^'^' • -• "Ori tha Short Term Stationarity of Beta Coefficients." Financial Analysts Journal, XXVII (Nov., 1969), 55-62.
^^' sn^ Sparc L. Kripotos. "Naw York Stock Exchange Quality Stocks Index." Financial Executive, III, No. 5 (May, 1969), 24-36.
39. Jerome C. R. Li. Introduction to Statistical Inference Ann Arbor, MichTl Edwards Brother Inc., 1961.
40. John Lintnar. "Security Prices, Risk and Maximal Gains from Diversification." Journal of Finance, XX (Dae, 1965), 587-615.
41- . "The Valuation of Risk Assets and tha Selection of Risky Investments in Stock Portfolios and Capital Budgets." Review of Economics and Statistics, XLVII (Fab., 1965), 13-37.
42. Jamas H. Lorie. "Soma Comments on Recant Quantitative and Formal Research on tha Stock Market." Journal of Business, XXXIX (Jan., 1966), 107-10.
43. and Richard Braalay. Modern Davalopmants in Investment Management: A Book of Readings. Naw York: Praagar Publishers, 197 2.
44. Jamas H. Loria and Mary T. Hamilton. Tha Stock Market: Theories and Evidence. Homawood, 111.: Richard D. Irwin, Inc., 1973, 211-28.
45. Harry Markowitz. "Portfolio Selection." Journal of Finance, VII (March, 1952), 77-91.
46. Robert D. Mason. Statistical Techniguas in Business and Economics. Homawood, 111.: Richard D. Irwin, Inc., 1970.
47. J. D. McWilliams. "Prices and Earnings and P-E Ratios." Financial Analysts Journal, XXII (May-Juna, 1966), 137-43.

103
48. Jacob B. Michaelsan and Robert C. Goshay. "Portfolio Selection in Financial Intarmadiarias: A New Approach." Journal of Financial and Quantitative Analysis, II (June, 1967), 166-99.
49. Marton H. Millar and Myron Scholas. "Rates of Return in Relation to Risk: A Reexamination of Soma Recant Findings." Studies in tha Theory of Capital Markets, Naw York: Praagar Publishers, 1971.
50. Franco Modigliani and Gaarld Pogua. "An Introduction to Risk and Return: Concepts and Evidanca." Financial Analysts Journal, XXX (May-June, 1974), 69-86.
51. Walter A. Morton. "High Risks Do Not Mean High Returns." Commercial and Financial Chronicle, CCX (Dae. 4, 1969), 1761+.
52. Walter A. Morton. "Market Price, Risk and Return." Commarcial and Financial Chronicle, CCXIII (June 3, 1971), 13-16.
53. . "Risk and Return: Instability of Earnings as a Measurement of Risk." Land Economics, XLV (May, 1969), 229-61.
54. Byron L. Nawton. Statistics for Business. Chicago: Science Research Associates, Inc., 1973.
55. Barnard Ostla. Statistics in Research. 2nd ad. Amas, Iowa: Iowa State University Press, 1963.
56. Gaorga E. Pinches and William R. Kinnay, Jr. "Tha Measurement of the Volatility of Common Stock Prices." Tha Journal of Finance, XXVI (March, 1971), 119-25.
57. Shannon Pratt. "Bibliography of Risk and Rates of Return for Common Stocks." Financial Analysts Journal, XXrV (May-Juna, 1968), 151-66.
58. . "Relationships Batwaan Risk and Rate of Return for Common Stock." Unpublished DBA dissertation, Indiana University, 1966.
59. Lament K. Richardson. "Do High Risks Lead to High Returns." Financial Analysts Journal, XXVI (March, 1970), 88-92.

104
60. M. Rosenberg. "A Study in tha Risk Factor Implicit in Sacuritias Prices." Journal of Finance, XXVI (Sept., 1971), 999-1000.
61. Harry Sauvain. Invastmant Management. Naw Jersey: Prantica-Hall, Inc., 1967.
62. William F. Sharpa. "A Simplified Modal for Portfolio Analysis." Managam.ant Science, IX (Jan., 1963), 277-93.
63. . "Capital Asset Prices: A Theory of Market Equilibrium Under Conditions of Risk." Journal of Finance, XIX (Sept., 1964), 425-42.
64. . "Discussion—Security Prices, Risk and Maximal Gains from Diversification: Reply." Journal of Finance, XXI (Dec, 1966), 743-44.
65. . "Mutual Fund Performance." Journal of Business, XXXIX (Jan., 1966), 119-38.
66. . Portfolio Theory and Capital Markets. Naw York: McGraw-Hill Book Co., 1970.
67. . "Risk Aversion in tha Stock Market: Soma Empirical Evidanca." Journal of Finance, XX (Sept., 1965), 416-22.
68. and Guy M. Coopar. "Risk-Return Classes of Naw York Stock Exchange Common Stocks, 1931-67." Financial Analysts Journal, XXVIII (March-April, 1972), 46-54.
69. Sidney Siagal. Nonparamatric Statistics. New York: McGraw-Hill Book Co., Inc., 1956.
70. Robert M. Soldofsky. "Yiald-Risk Parformanca Measurements." Financial Analysts Journal, XXIV (Sept., 1968), 130-39.
71. and Roger L. Miller. "Reply." Financial Analysts Journal, XXVIII (Sept., 1972), 940-45.
72. . "Risk Premium Curves for Different Classes of L. T. Securities (1950-1966)." Journal of Finance, XXIV (June, 1969), 429-45.
105
73. Richard A. Stevenson. "Tha Variability of Common Stock Quality Rating." Financial Analysts Journal, XXII (Nov.-Dec, 1966), 97-101.
74. C. W. Thomas. "There's a Simple Way to Measure Risk-Beta Mousetrap. " Barrens, LII (Fab. 7, 1972), 5+.
75. Jamas Tobin. "Liquidity Praferanca as Behaviour Towards Risk." Review of Economic Studies, XXV (Feb., 1958), 65-86.
76. Jack L. Traynor. "How to Rata Management of Investment Funds." Harvard Business Review, XLII (Jan.-Feb., 1965), 63-75.
77. Wayna H. Wagner and Sheila Lau. "Tha Effect of Diversification on Risk." Financial Analysts Journal, XXVII (Nov., 1971), 48-55.
78. D. A. Wast. "Risk Analysis in the 60's." Financial Analysts Journal, XXIII (Nov., 1967), 124-26.
79. J. Patar Williamson. Investments, Naw Analytical Tachnicfuas. Naw York: Praagar Publishers, 1972.
80. B. J. Winer. Statistical Principles in Experimental Design. Naw York: McGraw-Hill Book Co., 1971

APPENDIX

107
LIST OF COMPANIES USED
Security Name No.
1 AMERICAN METAL CLIMAX 2 AM SMELTING & REFINING 3 CERRO CORPORATION 4 FANSTEEL METALLURGICAL 5 FOOTE MINERAL CO 6 INTL NICKEL OF CANADA 7 HUDSON BAY MINING 8 ST JOSEPH LEAD 9 DOME MINES, LTD 10 NORTH AMERICAN COAL 11 PITTSTON CO 12 FREEPORT SULPHUR CO 13 TEXAS GULF SULPHUR CO 14 ALPHA PORTLAND CEMENT 15 GENERAL FOODS CORP 16 STANDAPJ) BRANDS, INC 17 BEATRICE FOODS CO 18 BORDEN CO 19 CARNATION CO 20 CHOCK FULL O NUTS 21 RALSTON PURINA CO 22 NATIONAL BISCUIT CO 23 AMERICAN CRYSTAL SUGAR 24 HERSHEY CHOCOLATE CORP 25 WRIGLEY, WM. JR CO 26 FALSTAFF BREWING CORP 27 NATIONAL DIST & CHEM 28 COCA-COLA CO 29 DR PEPPER CO 30 PEPSI-COLA CO 31 ROYAL CROWN COLA CO 32 LIGGETT & MYERS TOB 33 PHILIP MDRRIS, INC 34 REYNOLDS TOBACCO 35 BAYUK CIGARS INC 36 GENERAL CIGAR CO 37 B ELDING HEMINWAY CO 38 CONE MILLS CORP 39 GRANITEVILLE CO 40 LOWENSTEIN & SONS 41 STEVENS, J.P. & CO 42 BOBBIE BROOKS, INC 43 CLUETT, PEABODY & CO 44 JONATHAN LOGAN INC 45 MUNSINGWEAR INC

108
46 GEORGIA-PACIFIC CORP 47 ARMSTRONG CORK 48 SIMMONS CO 49 CROWN ZELLERBACH 50 HAMMERMILL PAPER CO 51 INTERNATIONAL PAPER CO 52 MEAD CORPORATION 53 ST REGIS PAPER CO 54 SCOTT PAPER CO 55 DIAMOND NATIONAL 56 FEDERAL PAPER BOARD 57 FIBREBOARD PAPER PROD 58 CROWELL-COLLIER PUBL 59 HARCOURT BRACE & WORLD 60 PRENTICE-HALL, INC 61 SIMPLICITY PATTERN CO 62 MC GRAW HILL PUBLISH 63 ALLIED CHEMICAL CORP 64 AMERICAN CYANAI4ID CO 65 CELANESE CORP OF AMER 66 DOW CHEMICAL CO 67 GRACE, W. R. & CO 68 HERCULES POWDER CO 69 MONSANTO CHEMICAL CO 70 COMMERCIAL SOLVENTS 71 ROHM & HAAS CO 72 STAUFFER CHEMICAL CO 73 AIR REDUCTION CO 74 CHEMETRON CORP 75 KOPPERS CO 76 AMERICAN HOME PRODUCTS 77 MERCK & CO 78 PFIZER, CHAS. & CO 79 SCHERING CORP 80 SMITH KLINE & FRENCH 81 UPJOHN CO 82 WARNER-LAMBERT PHARM 83 STERLING DRUG, INC 84 BAXTER LABORATORIES 85 COLGATE-PALMOLIVE 86 CHESEBROUGH-PONDS, INC 87 GILLETTE CO 88 REVLON, INC 89 C I T I E S SERVICE CO 90 CONTINENTAL OIL 9 1 KERR-MC GEE OIL IND 92 MARATHON OIL CO 93 PHILLIPS PETROLEUM 94 SHELL OIL CO 95 SKELLY OIL CO 96 STANDARD OIL, INDIANA

109
97 STANDARD OIL, OHIO 98 SUN OIL CO 99 UNION OIL OF CALIF 100 GULF OIL CORP 101 ROYAL DUTCH PETROLEUM 102 STANDARD OIL OF CALIF 103 TEXACO, INC 104 FLINTKOTE CO 105 JOHNS-MANVILLE CORP 106 NATIONAL GYPSUxM CO 107 U S GYPSUM CO 108 ARMSTRONG RUBBER CO 109 GOODRICH, B.F. CO 110 GOODYEAR TIRE & RUBBER 111 AMERICAN CAN CO 112 ANCHOR HOCKING GLASS 113 CONTINENTAL CAN CO 114 CROWN CORK & SEAL 115 NATIONAL CAN CORP 116 OWENS-ILLINOIS GLASS 117 GENERAL REFRACTORIES 118 LEHIGH PORTLAND CEMENT 119 LONE STAR CEMENT CORP 120 MARQUETT CEMENT MFG 121 PENN-DIXIE CEMENT CORP 122 VULCAN MATERIALS CO 123 ARMCO STEEL CORP 124 BETHLEHEM STEEL CORP 125 INLAND STEEL CO 126 NATIONAL STEEL CORP 127 REPUBLIC STEEL CORP 128 U S STEEL CORP 129 ALLEGHENY LUDLUM STEEL 130 COPPERWELD STEEL 131 WHEELING STEEL CORP 132 ANACONDA CO 133 COPPER RANGE 134 KENNBCOTT COPPER 135 PHELPS DODGE 136 ALUMINUM CO OF AMERICA 137 REYNOLDS METALS CO 138 UNIVERSAL OIL PRODUCTS 139 REVERE COPPER & BRASS 140 SCOVILL MFG CO 141 AMERICAN STANDARD 142 CRANE CO 143 OWENS-CORN FIBERGLAS 144 TRANE COMPANY 145 BABCOCK & WILCOX CO 146 COMBUSTION ENGINEERING 147 ALLIS-CHALMERS MFG

110
1 4 8 BUCYRUS-ERIE CO 149 CATERPILLAR TRACTOR 150 CLARK EQUIPMENT CO 1 5 1 FMC CORPORATION 152 HALLIBURTON CO 153 SCHLUMBERGER, LTD 154 SUNSTRAND CORPORATION 155 WARNER COMPANY 1 5 6 LEESONA CORP 157 MIDLAI^D-ROSS CORP 1 5 8 OTIS ELEVATOR CO 1 5 9 AMERICAN CHAIN & CABLE 160 BRIGGS & STRATTON 1 6 1 CHICAGO PNEUMATIC TOOL 162 COOPER-BESSEMER CORP 163 GARDNER-DENVER CO 164 INGERSOLL-RAND CO 165 MESTA MACHINE CO 166 BURROUGHS CORP 167 NATIONAL CASH REGISTER 1 6 8 PITNEY-BOWES, INC 169 VICTOR COMPTOMETER 170 VENDO COMPANY 1 7 1 GENERAL ELECTRIC CO 17 2 TEXAS INSTRUMENTS, INC 173 WESTINGHOUSE ELECTRIC 174 EMERSON ELECTRIC MFG 175 MC GRAW EDISON 176 CUTLER-HAMMER, INC 177 SQUARE D CO 178 MAYTAG CO 179 SINGER MFG CO 180 WHIRLPOOL CORPORATION 181 MAGNAVOX CO 182 ZENITH RADIO CORP 183 AMP INC 184 AMPEX CORP 185 GENERAL SIGNAL 186 VARIAN ASSOCIATES 187 BURNDY CORPORATION 188 CTS CORPORATION 189 INTERNAT RECTIFIER 190 MALLORY, P.R. 1 9 1 CHRYSLER CORP 192 FORD MOTOR CO 1 9 3 GENERAL MOTORS 194 FREUHAUF CORP 195 WHITE MOTOR CO 1 9 6 BORG-WARNER CORP 197 BUDD CO 198 CHAMPION SPARK PLUG
I l l
199 FEDERAL-MOGUL-BOWER BR 200 LIBBY-0WENS-FORD GLASS 201 RAYBESTOS-MANHATTAN 202 TIMKEN ROLLER BEARING 203 BOEING COMPANY 204 CURTISS-WRIGHT 205 GENERAL DYNAMICS CORP 206 GRUMMAN AIRCRAFT ENGR 207 LOCKHEED AIRCRAFT 208 MARTIN-MARIETTA CORP 209 THIOKOL CHEMICAL CORP 210 UNITED AIRCRAFT CORP 211 AMSTED INDUSTRIES 212 PULLMAN INC 213 STANRAY CORPORATION 214 FOXBORO COMPANY 215 ROBERTSHAW-CONTROL 216 BAUSCH & LOME 217 PERKIN-ELMER CORP 218 BELL Sc HOWELL CO 219 EASTMAN KODAK 220 MINNESOTA MINING & MFG 221 POLAROID CORP 222 NATIONAL CITY LINES 223 AMERICAN AIRLINES 224 GEN TEL & ELECTRONICS 225 WESTN UNION TELEGRAPH 226 AM BROADCAST-PARAMOUNT 227 COLUMBIA BROADCASTING 228 METROMEDIA INC 229 STORER BROADCASTING CO 230 TEXAS GAS TRANSMISSION 231 ASSOCIATED DRY GOODS 232 GIMBEL BROS 233 MERCANTILE STORES CO 234 SEARS, ROEBUCK & CO 235 MURPHY, G.C. CO 236 WOOLWORTH, F.W. 237 BORMAN FOOD STORES 238 FOOD FAIR STORES INC 239 KROGER CO 240 SAFEWAY STORES, INC 241 AM INVESTMENT CO ILL 242 FAMILY FINANCE CORP 243 RYDER SYSTEM, INC 244 MCA INCORPORATED 245 20TH CENTURY-FOX 246 INTL TEL & TEL 247 KAISER ALUMINUM & CHEM 248 LING-TEMCO-VOUGHT 249 TENN GAS TRANSMISSION 250 TEXTRON, INC