Embed Size (px)
Citation preview

An Evaluation of the Fire Support Network Safe and Sound project in Liverpool

Safe and Sound project Evaluation |March 2012
2
Acknowledgments
The authors would like to thank the following for their contributions to this report: Neil Potter, Nicola Leckenby and Rebecca Harrison (North West Public Health Observatory); Val Upton (Centre for Public Health); Karen Lavery and Daniel Steadman (Fire Support Network); and Claire Campbell (Liverpool City Council).
Thanks to all the Fire Safety Network staff and the participating households for giving their time to the interviews; and the Children’s Centre Staff for attending the focus group session.
Safe and Sound project Evaluation |March 2012
3
Contents
1. Summary ........................................................................................................................................................... 6
2. Introduction ..................................................................................................................................................... 10
2.1 The Safe and Sound project ........................................................................................................................... 12
2.2 The evaluation ............................................................................................................................................... 13
3. Methodology ................................................................................................................................................... 14
3.1 Analyses of existing project data (January 2010 to December 2011) ........................................................... 14
3.2 Telephone survey with participating households ......................................................................................... 14
3.3 Interviews with Fire Safety Network staff ..................................................................................................... 14
3.4 Focus group with Children’s Centre staff ...................................................................................................... 15
3.5 Analysis of emergency department (ED) and ambulance service data ......................................................... 15
3.6 Research ethics .............................................................................................................................................. 15
4. Findings ........................................................................................................................................................... 17
4.1 Analyses of existing project data ................................................................................................................... 17
4.1.1 Profile of Liverpool households .............................................................................................................. 17
4.1.2 Safety equipment ................................................................................................................................... 22
4.2 Household Telephone Interviews .................................................................................................................. 23
4.2.1 Equipment .............................................................................................................................................. 23
4.2.2 Views on the service/project .................................................................................................................. 24
4.2.3 Children’s experiences of injuries in the home before/after receipt of equipment .............................. 25
4.2.4 Additional comments ............................................................................................................................. 25
4.3 Fire Safety Network Staff Interviews ............................................................................................................. 26
4.3.1 General perceptions of the project ........................................................................................................ 26
4.3.2 Benefits of the project ............................................................................................................................ 27
4.3.3 Limitations, barriers and potential improvements to the project ......................................................... 28
4.3.4 Additional comments ............................................................................................................................. 30
4.4 Focus group with Children’s Centre staff ...................................................................................................... 31
4.4.1 Role of the Children’s Centres ................................................................................................................ 31
4.4.2 Factors affecting uptake of the Safe and Sound project ........................................................................ 31
4.4.3 Benefits of the Safe and Sound project .................................................................................................. 32
4.4.4 Limitations and suggested improvements ............................................................................................. 33
4.4.5 Additional comments ............................................................................................................................. 34
4.5 Emergency department attendance and ambulance call out data analyses ................................................ 35
4.5.1 Injury attendances to Alder Hey Emergency Department ..................................................................... 35
4.5.2 Ambulance call outs ............................................................................................................................... 36
5. Discussion and Recommendations .................................................................................................................. 38

Safe and Sound project Evaluation |March 2012
4
6. Appendices ...................................................................................................................................................... 42
Appendix 1: Project eligibility criteria ................................................................................................................. 42
Appendix 2a: Form 1a, Liverpool Referral for Home-Safety Equipment ............................................................. 43
Appendix 2b: Form 1b, Liverpool Equipment and Eligibility ............................................................................... 46
Appendix 3: Telephone survey ............................................................................................................................ 50
Appendix 4: Fire Safety Network Staff Interview ................................................................................................ 56
Appendix 5: Supplementary tables - existing project data ................................................................................. 59
Appendix 6: Supplementary tables - telephone interview results ...................................................................... 61
7. References ....................................................................................................................................................... 65
Table of Figures
Figure 1: Total number of participating households by month, January 2010 to December 2011. ........................ 17Figure 2: Number of people living in participating households by year. ................................................................. 18Figure 3: Number of children in participating households by age group of child. .................................................. 18Figure 4: Participating households by Index of Multiple Deprivation Quintile (IMD 2010) and year. .................... 19Figure 5: Ethnic group of participating households by year. ................................................................................... 19Figure 6: Participating households who were in receipt of benefits by year. ......................................................... 20Figure 7: Participating households who were in receipt of benefits, by benefit type and year. ............................. 20Figure 8: Dwelling type of participating households by year. ................................................................................. 21Figure 9: Ownership type of participating households by year. .............................................................................. 21Figure 10: Type and amount of safety equipment installed in participating households. ...................................... 22Figure 11: Proportion of respondents who received selected safety equipment reporting that the equipment was useful/very useful. ................................................................................................................................................... 24Figure 12: Injury attendances aged 0-2 years to Alder Hey ED, patients from Liverpool Safe and Sound project intervention areas only, by month and incident location, January 2008 to December 2011. ................................ 35Figure 13: Injury attendances aged 0-2 years to Alder Hey ED, patients from Liverpool Safe and Sound project intervention areas only, by age and gender, January 2008 to December 2011 combined. .................................... 36Figure 14: Injury attendances for injuries in the home, aged 0-2 years to Alder Hey ED, patients from Liverpool Safe and Sound project intervention areas only, by age and gender, January 2008 to December 2011 combined.
................................................................................................................................................................................. 36Figure 15: Ambulance call outs to patients aged 0-2 years from Liverpool Safe and Sound project intervention areas only, by month, January 2008 to December 2011. ........................................................................................ 37Figure 16: Ambulance call outs to 0-2 year olds, patients from Liverpool Safe and Sound project intervention areas only, by age and gender, January 2008 to December 2011 combined. ......................................................... 37
Table of Tables
Table 1: Participating households by local authority and year. .............................................................................. 17Table 2: Proportion of respondents satisfied/very satisfied with the service received, by service aspect. ............ 24Table 3: Number of people living in participating households by year. ................................................................. 59Table 4: Number of children in participating households by age group and year. ................................................. 59Table 5: Type and amount of safety equipment installed in households receiving the intervention by year. ....... 59Table 6: Safety equipment required, received, in use and overall usefulness. ....................................................... 61Table 7: Additional items of equipment received, use and overall usefulness. ...................................................... 62

Safe and Sound project Evaluation |March 2012
5
Table 8: Satisfaction with the service received. ...................................................................................................... 62Table 9: Would you contact the project again if you needed to? ........................................................................... 62Table 10: Have you recommended the project to someone else? If no, would you recommend the project to someone else? ......................................................................................................................................................... 62Table 11: Is there anything we could improve about the project? ......................................................................... 62Table 12: Has your child (children) been injured in or around the home since you received the equipment? ...... 63Table 13: Had your child (children) been injured in or around the home before you received the equipment? ... 63Table 14: Do you think the equipment has prevented your child from sustaining any injuries? ............................ 64Table 15: Do you have any other comments that you would like to make about the project? .............................. 64
Table of Maps
Map 1: Location of Liverpool Sure Start Children's Centres, 2011. ......................................................................... 16
Safe and Sound project Evaluation |March 2012
6
1. Summary Injuries in the home are a common occurrence. Across Merseyside, over a third of injury attendances to a local emergency department (ED) reported that the injury occurred within the home. 1 Research suggests that children are one of the most at risk groups for home injuries, particularly those living in the most deprived areas.2 There is evidence to suggest that multi-component injury prevention interventions can be successful in preventing injuries among children.3
3
Such interventions can include modifying physical aspects within the home through the provision of safety equipment (e.g. smoke alarms/safety gates). However, evidence on the effectiveness of such interventions alone in reducing injury rates is mixed. Whilst research indicates that they can improve safety behaviours, their effects on preventing injuries are unclear. Where interventions have been shown to be successful, they tend to have been combined with other aspects such as home risk assessments and safety education.4
To address childhood injuries across Merseyside, as part of the national Safe at Home Scheme, the Safe and Sound home safety equipment project (referred to in this report as the Safe and Sound project) was introduced across Merseyside in January 2010 and ran until March 2011. The project involved identifying families at risk of childhood injuries in the home, conducting a home risk assessment with those families and providing safety advice and installing free safety equipment, as required. Funding was secured from Liverpool City Council for the project to continue across the Liverpool Local Authority area from April 2011 to March 2012. The project is delivered by Merseyside Fire and Rescue Service (MFRS) via the Merseyside Fire Safety Network (FSN - the charity arm of the fire service) in partnership with local Sure Start Children’s Centres.
i
The Centre for Public Health at Liverpool John Moores University (LJMU) was commissioned by Merseyside FSN to conduct an evaluation of the effectiveness of the Safe and Sound project in Liverpool. A summary of the methods used for the evaluation is provided in Box A.
It was available to families with children under the age of two years who met some key eligibility criteria. Almost 5,500 families and their homes across Merseyside have received the intervention.
Box A: Summary of evaluation methods
• Analyses of existing project data (as provided by the FSN) for the period January 2010 to December 2012. This data included information on, for example, numbers and characteristics of households accessing the project and details of the equipment provided.
• A short follow-up telephone survey was conducted with 145 households who had taken part in the project to: gather their views on the service provided; determine what items of equipment they received and found useful; and examine the project’s impact on the level of accidents experienced by children in the households.
• Interviews with FSN staff were conducted to: gain an understanding of their views on the project; establish what key safety issues are identified when visiting households; and gather their opinions on what improvements could be made to the project.
• A focus group was held with Children’s Centre staff to gather: their views on the benefits of the project to all those involved; suggestions for improvements; and their opinions on the receptiveness of households and their general attitudes to the project.
• Analyses of ED and ambulance service data was conducted to explore the impact of the project on levels
i Sure Start is a government initiative which provides services for pre-school children (aged five and under) and their families.

Safe and Sound project Evaluation |March 2012
7
“It [the project] does literally do what it says; it keeps them [the children] safe and sound
FSN staff member
of injuries among children for the period January 2008 to December 2011. January 2010 to December 2011 represents the period that the project was running across Liverpool, while January 2008 to December 2009 was the ‘pre-intervention’ comparison period.
Key findings
Participating households
In the two years from January 2010 to December 2011, 5,440 households participated in the Safe and Sound Project, 98% of whom lived in the Liverpool Local Authority area. Over three-quarters of participating households were resident in the most deprived quintile of the population (84.0%) and the majority were of White ethnic origin (87.8%). Due to the eligibility criteria that are in place, the majority of participating households were in receipt of benefits (93.0%), with Tax Credits and Income Support the most commonly received. Participating households were mainly living in terraced homes (66.1%) that were rented from a private landlord (34.9%) or provided by a Housing Association (30.2%).
Safety Equipment
Of the equipment on offer to households, safety gates and bath/shower mats were the most commonly accepted. Across all of the items, over three-quarters of those who had received them reported that they were useful/very useful.
Participants in the evaluation suggested a number of additional items of equipment that they would like to see supplied as part of the project, for example, plug socket covers and bed guards.
Views on the project
The overall feedback about the project was very positive. It was felt that the project brings numerous benefits to children, households, the agencies involved and multi-agency working. Key benefits to the households include:
• The ‘peace of mind’ that it gave to parents to know their child was safe in the moments when they weren’t watching them;
• Reassurance that equipment has been professionally and effectively fitted;
• Improved safety for everyone in the household, for example, bath mats can prevent slips for all of the family, not just the children; and
• The provision of free equipment to households that ordinarily could not afford it.
The general perception was that households are extremely happy with the service offered, as confirmed by the telephone interviews, with almost all of the respondents stating that they were satisfied/very satisfied with the service they received (96.6%) and three-quarters (74.5%) having recommended the project to someone else.
Project limitations
Some examples of limitations to the project as highlighted by the evaluation were:

Safe and Sound project Evaluation |March 2012
8
“It’s a fantastic service….keep it going”
Children’s Centre Representative
• The eligibility criteria, with a general feeling that these should be expanded to allow more families to access the project;
• The type of safety equipment on offer, with a variety of additional items regularly being requested, for example, plug socket covers, bed guards and carbon monoxide alarms;
• Inability to fit some items of safety equipment due to safety guidelines, insurance issues or design (for example of banisters, which prevent some safety gates being fitted); and
• Lack of promotion of the project.
Injury prevention
The majority of respondents (91.7%) thought that the equipment provided had prevented their children from sustaining injuries. Around half (51%) felt that the equipment directly prevented accidents in the home and 37.9% stated that the equipment made them feel safer or gave them peace of mind. Despite this anecdotal evidence, examination of the ED and ambulance data pre-intervention (2008/09) and during the intervention (2010/11) revealed no change in the mean number of ED home injury attendances, and only a small (but not significantly different) decrease in recorded ambulance call-outs. Whilst there were no significant decreases to report, it is positive to note that no increases were observed. Even if a significant decrease had been evident it would be difficult to attribute any change to the Safe and Sound project alone as many other factors could be involved.
Conclusion
This evaluation collates a variety of evidence which highlights the importance of the project and its continuation. The project has reached many deprived families across Liverpool and provided an invaluable service through the fitting of free safety equipment and provision of safety information and advice that they might otherwise not have had access to.
A number of suggestions for improvements to the project have been made through the evaluation process and these have been developed into key recommendations, as detailed in Box B.
Box B: Key recommendations for project development
1. Evaluation The impact of Safe and Sound is likely to continue beyond March 2012. It would be useful to conduct further evaluation in the future to try and capture some of the longer term effects of the intervention.
2. Eligibility criteria Whilst the project cannot be offered to everyone and some limits must be in place, it would be worthwhile reviewing the eligibility criteria, particularly in relation to the age of the child. This would allow more families to be included, for example, revising the age so that families with a child under the age of five are eligible (as was previously the case under the ROSPA scheme).
3. Referral process It may be beneficial for Children’s Centres to share best practice and adopt a more consistent approach to the way in which they make referrals to the project. Clarification should be provided by FSN staff as to the level of discretion that can be used when referring households who do not meet the eligibility criteria to ensure a fair system is in place.

Safe and Sound project Evaluation |March 2012
9
4. Arranging home visits It was suggested that introducing a text service to arrange appointments (rather than the current call-centre based system) might increase the number of successful contacts as it was felt that many people would ignore calls from an unrecognised number.
5. Missed appointments Reducing the number of households who fail to keep their appointments would reduce costs and allow other households to receive a visit. A reminder system may help, for example, telephoning or texting households 24 hours before their appointment to remind them about it.
6. Additional equipment Consideration should be given to expanding the itinerary of equipment offered as part of the project. Small items such as plug socket covers may provide additional reassurance to families.
7. Project promotion It is clear from this evaluation that the current promotion of the project is limited. Whilst a large-scale advertising campaign may not be financially viable, there are actions that could be taken within the Children’s Centres to promote the projects availability. One suggestion was to run a week-long campaign through Children’s Centres to advertise the project and let local people meet the staff and also educate the Children’s Centre staff about the project and the role of the FSN.
8. Installation advice In some cases FSN leave certain items of equipment for households to fit themselves, for example, blind ties. Some households raised concerns that they might not be doing this correctly and therefore placing their child/children at risk. It may be that improved information during home visits may suffice e.g. easy to follow instruction leaflets; alternatively a follow-up service might be beneficial as FSN staff could check that equipment was correctly and safely installed.
9. Feedback process Introducing a formal feedback process whereby FSN staff keep Children’s Centre staff informed about households who fail to allow FSN staff to visit; any additional safety issues that FSN staff identify within a household that are not dealt with by the Safe and Sound project; and a list of families whom the FSN have been unable to contact (for example, if the phone number they provided is no longer correct). This would increase the number of households receiving the service and would also give Children’s Centre staff a greater sense of involvement rather than their role simply ending at point of referral.

Safe and Sound project Evaluation |March 2012
10
2. Introduction In England during 2010/11, there were over 100,000 hospital admissions for accidents among children aged 0-14 years 5 and 172 deaths (2010). 6
5
Falls are the most common cause of hospital admissions for unintentional injury among children aged 0-14 years, accounting for 46% of admissions in 2010/11. However, these figures represent only the most severe cases; many more are treated each year at emergency departments (EDs), walk-in centres, GP practices, or by parents and carers.3 Injuries in children place a large burden on individuals, families and public services. A child who suffers and survives a serious childhood injury may be left permanently disfigured and/or disabled and may require long-term treatment and care. Unintentional injury has wider impacts on society and the economy, for example the costs of hospital admissions, emergency care and treatment; as well as for young people and their families, for example, the social, emotional and financial costs.7,8
Children are at greater risk of accidents than adults because they are still developing the physical and cognitive skills required to co-ordinate movements and to recognise and respond to dangerous situations.9
3
Particular groups of children are at higher risk of experiencing injuries than others, for example, boys are at higher risk than girls, ,10 as are children living in more deprived areas11 or from lower socio-economic groups.12 Other risk factors include lack of safety equipment, age, culture, and ethnicity. 13 Part of the learning and development process for all children is via risk taking and challenging themselves while at play and during other activities. 14
Accidents in the home are common as many areas of the home and activities that take place in the home pose an inherent risk.
15 Falls are the most common type of accident among children, with the kitchen and stairs being the location for the most serious accidents.16
3
The provision and use of safety devices such as cupboard catches, safety gates, window locks, fire guards, electric socket covers, thermometers to test water temperatures, anti-scald devices in hot water taps and smoke alarms can offer protection against injuries occurring in the home. Home safety education is also an important part of helping to keep children safe.
Helping children to stay safe is a Government priority, with actions to reduce death and injuries among children detailed in the 2008 Staying Safe Action Plan.14 As part of the commitments outlined in this plan, the National Safe at Home Scheme was introduced in February 2009. Hosted by the Royal Society for the Prevention of Accidents (ROSPA), the scheme aimed to provide home safety equipment to the most disadvantaged families in areas with the highest accident rates among children under five years of age. An evaluation of the national scheme was published by the University of Nottingham in September 2011.17
Overall, the evaluation noted positive responses in relation to the implementation and value of the scheme. Figures from April 2011 showed that 66,127 families had received equipment and a national survey of these families reported that:
• 92% of respondents found the safety information provided to be useful;
• 96% were satisfied with the scheme; and
• 91% felt their home was safer once the equipment was fitted.
In particular, having the equipment professionally installed was highlighted as one of the most valuable elements of the scheme.ii
ii The full evaluation report can be found at
www.safeathome.rospa.com/info/final-evaluation-report.pdf.

Safe and Sound project Evaluation |March 2012
11
In November 2010, the National Institute for Health and Clinical Excellence (NICE) published three pieces of guidance on the prevention of unintentional injuries among children under the age of 15 years:
• Strategies to prevent unintentional injuries among children and young people aged under 15; 13
• Preventing unintentional injuries in the home among children and young people aged under 15: providing safety equipment and home risk assessments;18
• Preventing unintentional road injuries among under 15s: road design and modification.
and 19
The second of these guidance papers set out five key recommendations for the prevention of unintentional injuries in the home as shown in Box 1.
Box 1: NICE recommendations for preventing unintentional injuries in the home among children 1. Prioritising households at greatest risk
• Identify and prioritise households where children (under 15 years) are at greatest risk of unintentional injury (via surveys, needs assessments and available data) for home safety assessments (HSA) and the supply and installation of home safety equipment.
• Providing practitioners with ways of sharing information about households that might need a HSA and ensuring that these practitioners handle personal information in a secure and confidential manner.
2. Working in partnership
• Establish and develop partnerships with relevant local statutory and voluntary organisations to: help collect information on those households at greatest risk; help identify and tackle barriers to creating a safe home environment; involve the local community; and carry out HSAs and supply/install home safety equipment.
3. Coordinated delivery
• Offer HSAs to identified households and (where appropriate) supply and install suitable, high quality home safety equipment.
• Ensure the assessment, supply and installation of equipment is modified to meet the specific needs and circumstances of each household.
• Ensure education, advice and information is given during a HSA, and during the supply and installation of equipment.
4. Follow-up on home safety assessments and interventions
• Keep a record of households that have been given safety advice or equipment to avoid duplication and to identify when maintenance and follow-up is needed. This can inform strategic planning and the prioritising of future interventions.
• Contact those homes who are in need and offer to revisit them to see if equipment is still appropriate and functional. Identify any additional needs. Use opportunity to reinforce home safety messages.
5. Integrate home safety into other home visits
• Provide child-focused home safety advice. Refer agreeable families/carers to agencies that can undertake a HSA and can supply and install home safety equipment.
• Encourage those living with children and young people aged under 15 (e.g. parents, carers) to perform their own HSA.
NICE, Preventing unintentional injuries in the home among children and young people aged under 15: home safety assessments and providing safety equipment. 2010
In the UK, however, there is limited evidence regarding the effectiveness of home safety equipment schemes in reducing unintentional injuries amongst children. An evaluation of a programme in Burnley,

Safe and Sound project Evaluation |March 2012
12
Pendle and Rossendale Primary Care Trust (Accidents on Children’s Accidents Project – ACAP), which offered home safety advice and equipment to families with children aged under five years and living in deprived areas, found that rates of attendance at EDs among children under five years fell at a faster rate in the wards that had received the intervention compared to the non-intervention wards. 20
2
Overall, however, while systematic reviews have shown that both home safety counselling and education, either alone or in combination with home safety equipment schemes, can enhance usage of some safety equipment and improve safety behaviours (in the short term), their effect on unintentional injuries remains unclear. ,4,21,22,23,24,25 There is little information available on how to transfer knowledge and understanding about injury prevention from research to practice and how to get robust evidence on successful interventions into routine practice.26,27
The main barriers to families implementing advice on home safety are reported to be the high cost of such equipment as well as the difficulties in correctly installing some items.
22A recent systematic review of qualitative studies concluded that the effective provision of safety equipment involves ongoing support with both installation and maintenance. The uptake and success of home safety interventions relies on tailoring interventions to suit parent’s cultural expectations and practical limitations (e.g. inability to alter rented or shared accommodation), 28 as well as building a trusting relationship between families and child health professionals.29
2.1 The Safe and Sound project
To address childhood injuries across Merseyside (see Box 2), as part of the national Safe at Home Scheme, the Safe and Sound home safety equipment project (referred to in this report as the Safe and Sound project) was introduced across Merseyside in January 2010 and ran until March 2011. The project involved identifying families at risk of childhood injuries in the home, conducting a home risk assessment with those families and providing safety advice and free safety equipment, as required. Funding was secured from Liverpool City Council for the project to continue across the Liverpool Local Authority area from April 2011 to March 2012. The project aimed to provide home safety equipment to 1,829 families across Liverpool during this time.
The project is delivered by Merseyside Fire and Rescue Service (MFRS) via the Merseyside Fire Safety Network (FSN - the charity arm of the fire service) in partnership with local Sure Start Children’s Centres.iii
iii Sure Start is a government initiative which provides services for pre-school children (aged five and under) and their families. It works to bring together early education, childcare, health and family support. It provides a wide range of services including advice on health care and child development, parenting classes, play groups, family outreach support and adult education and advice.
Staff at Liverpool Children’s Centres identify families who are eligible for the project (see Appendix 1 for eligibility criteria) and provide their details to the FSN. The FSN then call the family to arrange a visit, conduct a home safety check and provide a personalised home safety session. There are a number of items of free safety equipment on offer to those eligible households which are supplied and fitted by a fully trained FSN professional.
Box 2: Childhood injuries across Merseyside
• In 2009/10 across England, Liverpool Local Authority had the highest rate of hospital admissions for unintentional and deliberate injuries in children at 216.8 per 10,000 population (aged 0-17 years).
• Between July 2010 and June 2011, there were 18,731 attendances to Alder Hey Children’s Hospital Emergency Department for injuries, of which 42.9% occurred in the home.
Safe and Sound project Evaluation |March 2012
13
Equipment provided includes:
• Safety gates;
• Window restrictors;
• Fire guards;
• Cupboard locks;
• Bath/shower mats;
• Corner cushions;
• Smoke alarms; and
• Cord binders.
In addition, a carbon monoxide monitor and smoke alarms may also be provided, if required.
Children’s Centre staff also provide information about the scheme to GPs, health visitors, community midwives and voluntary sector partners who can then refer families to the scheme. The MFRS call centre processes the referrals.
2.2 The evaluation The Centre for Public Health at Liverpool John Moores University (LJMU) was commissioned by Merseyside FSN to conduct an evaluation of the effectiveness of the Safe and Sound project in Liverpool. This evaluation will provide crucial information on the impacts and benefits of the project to inform future development and expansion, and to secure future funding.
The key objectives of this evaluation are to:
• Understand the profile of households accessing the Safe and Sound project in Liverpool;
• Establish the extent, type and nature of injuries experienced by children from households accessing the project;
• Profile the types of interventions accepted by households accessing the project and levels of use;
• Explore the impact of the project on injuries amongst children; and
• Make recommendations for the future development of the project.

Safe and Sound project Evaluation |March 2012
14
3. Methodology A range of methods were adopted as part of the evaluation process as detailed here:
3.1 Analyses of existing project data (January 2010 to December 2011) Since the Safe and Sound project commenced, data on all households accessing the project have been collected by the FSN and MFRS via referral, and equipment and eligibility forms. Data include: household and family characteristics; home risk assessment details; and details of the interventions delivered as part of the project. Details of the referral, and equipment and eligibility forms can be found in Appendices 2a/2b. The FSN project team provided LJMU with two years of postcode level (household) data covering the period 1st January 2010 to 31st December 2011. Data was provided in monthly Excel Sheets. LJMU Research Staff cleaned and anonymised the data and imported it into Access for analysis. A total of 5,629 records were provided, of which 5,440 had a valid postcode and were successfully mapped to a Lower Super Output Area (LSOA)iv
3.2 Telephone survey with participating households
. These records were then linked to Local Authority and Index of Multiple Deprivation lookup files. Data were exported from Access and analysed using SPSS Version 18.
A short follow-up telephone survey was conducted by trained FSN volunteersv
A total of 145 interviews were complete. Survey data was input by FSN staff into an Access database (as provided by LJMU research staff). Data were cleaned and exported to SPSS Version 18 for analysis.
with Liverpool households
who had participated in the project from April to December 2011. This survey aimed to look at the effects of the Safe and Sound project on households accessing the project, particularly its impact on levels of safety and accidents or injuries experienced by children living in the household. It also aimed to gather participants views on how well the scheme is working and if it can be improved. A copy of the survey questionnaire can be found in Appendix 3.
3.3 Interviews with Fire Safety Network staff Interviews were held with FSN staff (n=5) who had been identified as having key roles in implementing the project. These informal face-to-face interviews were conducted by trained LJMU research staff and aimed to understand:
• Their views on the project;
• The key safety issues identified when visiting households;
• The type of engagement with households when delivering the intervention; and
• If and how they think the project can be improved.
The job titles of the five interviewees varied, however, all currently or previously had responsibility for the installation of safety equipment and provision of safety advice. The interviews were recorded and fully transcribed and data were subjected to thematic analysis. Full details of the interview schedule can be found in Appendix 4.
iv Lower Super Output Areas (LSOAs) are relatively small localities that contain an average of about 1,500 residents to give a more detailed picture of social conditions. v LJMU research staff provided training on telephone interviewing skills to FSN volunteers in December 2011.

Safe and Sound project Evaluation |March 2012
15
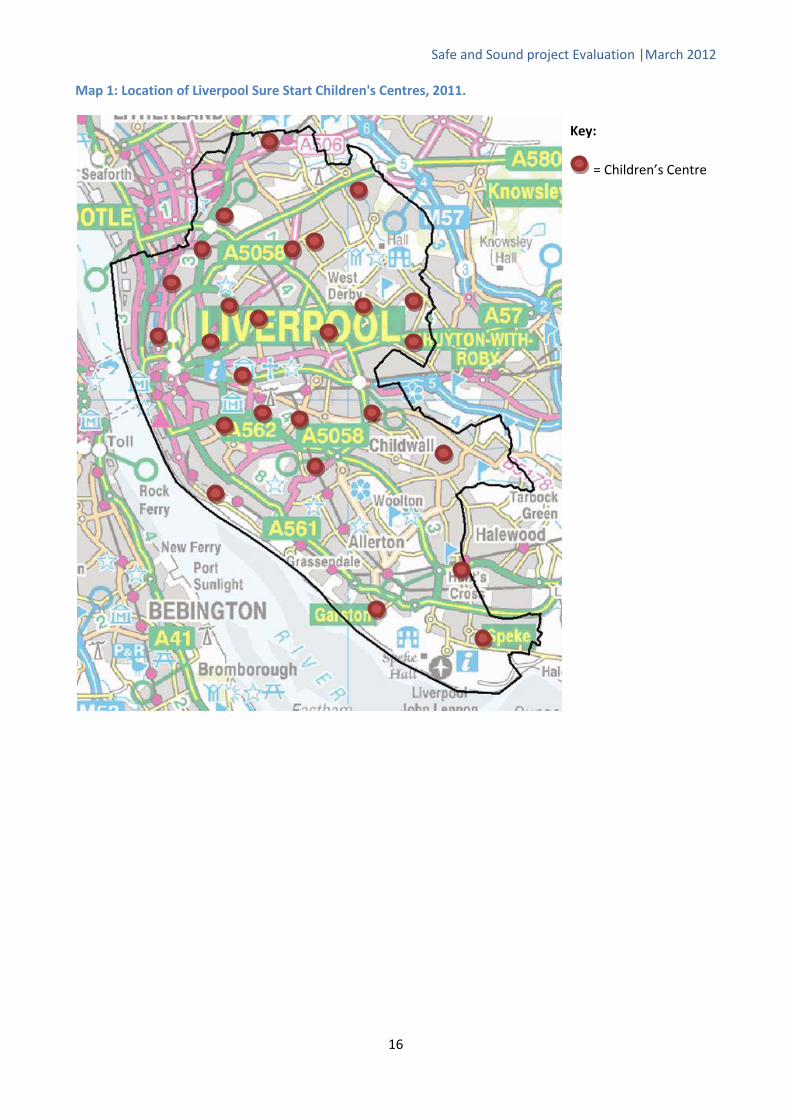
3.4 Focus group with Children’s Centre staff In 2010/11, the Safe and Sound project was promoted via a range of media (e.g. radio), with interested households requested to contact their local Children’s Centre to access the service/intervention. Children’s Centre staff are responsible for referring appropriate households (i.e. those that meet the project’s criteria – see Appendix 1 for details) to the FSN.
There are 26 Children’s Centres across Liverpool (see Map 1). Eight of these centres were selectedvi
Seven staff attended the focus group, representing six different Children’s Centres and a wide range of job roles including:
to be represented at a focus group session to discuss the impact that the promotion had on their centre and their perceived impact of the project on households accessing it.
• Children’s Centre Service Co-ordinators;
• Outreach Community Worker;
• Family Link Worker;
• Health Promotion Worker ; and
• Deputy Co-ordinator / Health Promotion Worker.
Two trained researchers facilitated the focus group which was held at the Centre for Public Health, LJMU. Using a semi-structured approach, the researchers asked a set of open questions to facilitate the 45 minute discussion. These questions centred upon the following themes: the benefits of the Safe and Sound project to everyone involved; suggestions for improvements to the project; and the receptiveness of households and their general attitude to the project. The session was recorded and fully transcribed and data were subjected to thematic analysis.
3.5 Analysis of emergency department (ED) and ambulance service data To explore the impact of the project on levels of injuries amongst children, data from Alder Hey ED and the ambulance service covering the period January 2008 to December 2011 was accessed via the Trauma and Injury Intelligence Group (based in the Centre for Public Health, LJMU). January 2010 to December 2011 represents the period that the project was running across Liverpool. January 2008 to December 2009 is a comparison period prior to the project being implemented. Collected data was analysed to identify any changes in injuries in children that lead to an ED attendance or ambulance call out since the project commenced.
3.6 Research ethics The research study design and materials were developed by researchers at the Centre for Public Health. The research was reviewed and passed as ethical in its design and proposed implementation by the LJMU Research Ethics Committee in December 2011.
vi To ensure the focus group represented a range of views, Children’s Centres were grouped into four categories based on the number of referrals they had made to the project. Two Centres from each category were invited to attend the focus group. Thus the group included a range of staff from Children’s Centres with varying levels of engagement with the project.
Safe and Sound project Evaluation |March 2012
16
Map 1: Location of Liverpool Sure Start Children's Centres, 2011.
Key:
= Children’s Centre

Safe and Sound project Evaluation |March 2012
17
4. Findings
4.1 Analyses of existing project data Between 1st January 2010 and 31st December 2011, 5,440 households participated in the Safe and Sound project and had their home assessed by a member of FSN staff (Figure 1). The majority of participating households were resident in Liverpool Local Authority (98.1%; Table 1). The following analyses focus on Liverpool households only. Supplementary data tables can be found in Appendix 5.
Figure 1: Total number of participating households by month, January 2010 to December 2011.
Table 1: Participating households by local authority and year.
Local Authority Year of installation
Total 2010 2011 n % n % n %
Liverpool 3,286 98.3% 2,050 97.7% 5,336 98.1% Halton * * * * * * Knowsley 37 1.1% 38 1.8% 75 1.4% Sefton 13 0.4% 8 0.4% 21 0.4% St. Helens * * * * * * Wirral * * * * * * Total (100%) 3,342 2,098 5,440
*Numbers less than five have been suppressed
4.1.1 Profile of Liverpool households Across both years, the majority of participating households in Liverpool had three people living within them (35.5% overall; Figure 2, Table 3). The number of children living in participating households was broken down by age group (Figure 3,Table 4). Overall, among the participating households:
• 87.9% had one or more children aged under 2 years;
• 37.6% had one or more children aged 2 to 5 years;
0
1,000
2,000
3,000
4,000
5,000
6,000
Jan-
10
Feb-
10
Mar
-10
Apr
-10
May
-10
Jun-
10
Jul-
10
Aug
-10
Sep-
10
Oct
-10
Nov
-10
Dec
-10
Jan-
11
Feb-
11
Mar
-11
Apr
-11
May
-11
Jun-
11
Jul -
11
Aug
-11
Sep-
11
Oct
-11
Nov
-11
Dec
-11
Num
ber o
f hou
seho
lds
Month and Year of Installation
5,440

Safe and Sound project Evaluation |March 2012
18
• 22.8% had one or more children aged 6 to 11 years; and
• 11.6% had one or more children aged 11 years and over.
Figure 2: Number of people living in participating households by year.
Figure 3: Number of children in participating households by age group of child.
0
200
400
600
800
1,000
1,200
1 2 3 4 5 6 7 8 9 10 11
Num
ber o
f hou
seho
lds
Number in household
2010 2011
0%
10%
20%
30%
40%
50%
60%
70%
80%
90%
under 2 years 2 to 5 6 to 11 11+
Perc
enta
ge
Age group
0
1
2
3
4+
Safe and Sound project Evaluation |March 2012
19
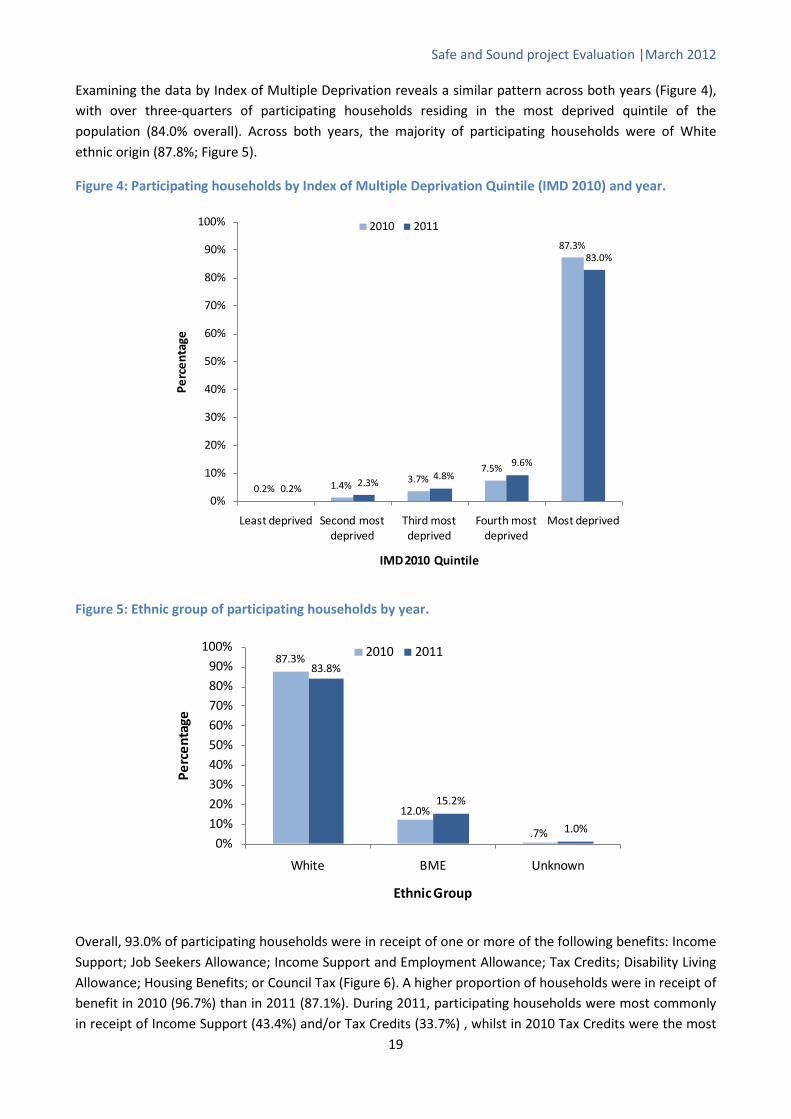
Examining the data by Index of Multiple Deprivation reveals a similar pattern across both years (Figure 4), with over three-quarters of participating households residing in the most deprived quintile of the population (84.0% overall). Across both years, the majority of participating households were of White ethnic origin (87.8%; Figure 5).
Figure 4: Participating households by Index of Multiple Deprivation Quintile (IMD 2010) and year.
Figure 5: Ethnic group of participating households by year.
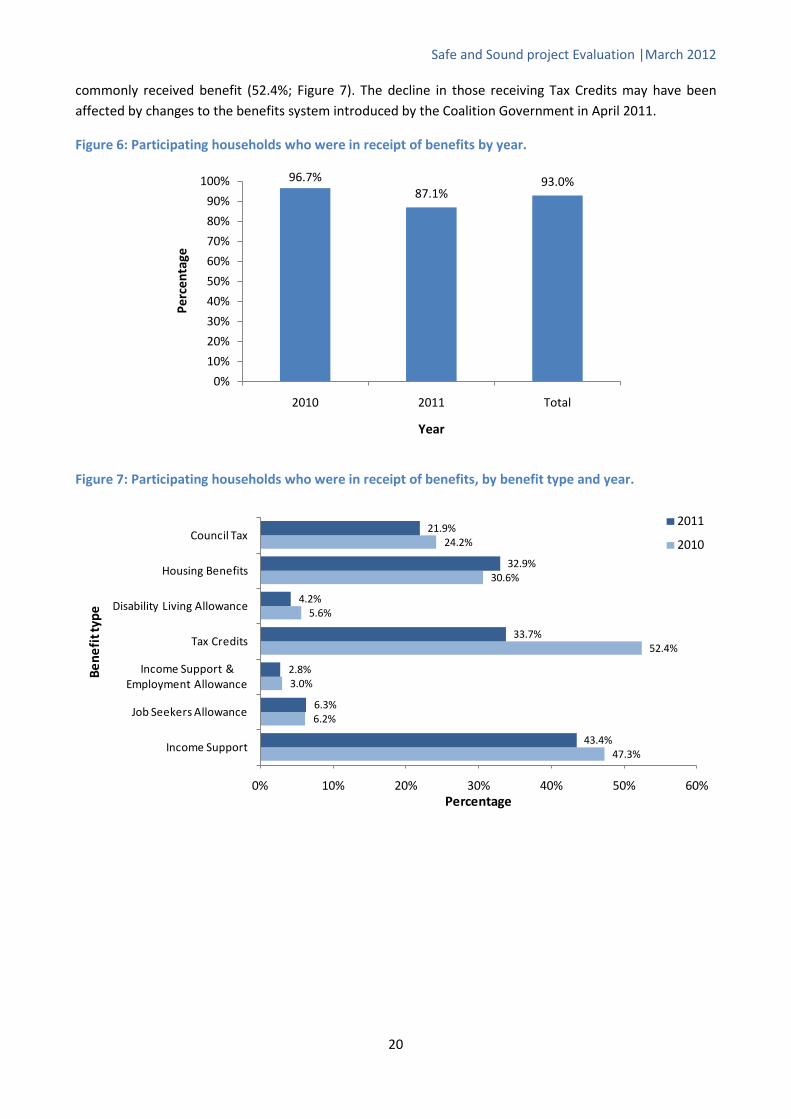
Overall, 93.0% of participating households were in receipt of one or more of the following benefits: Income Support; Job Seekers Allowance; Income Support and Employment Allowance; Tax Credits; Disability Living Allowance; Housing Benefits; or Council Tax (Figure 6). A higher proportion of households were in receipt of benefit in 2010 (96.7%) than in 2011 (87.1%). During 2011, participating households were most commonly in receipt of Income Support (43.4%) and/or Tax Credits (33.7%) , whilst in 2010 Tax Credits were the most
0.2% 1.4%3.7%
7.5%
87.3%
0.2% 2.3%4.8%
9.6%
83.0%
0%
10%
20%
30%
40%
50%
60%
70%
80%
90%
100%
Least deprived Second most deprived
Third most deprived
Fourth most deprived
Most deprived
Perc
enta
ge
IMD 2010 Quintile
2010 2011
87.3%
12.0%
.7%
83.8%
15.2%
1.0%0%
10%20%30%40%50%60%70%80%90%
100%
White BME Unknown
Perc
enta
ge
Ethnic Group
2010 2011
Safe and Sound project Evaluation |March 2012
20
commonly received benefit (52.4%; Figure 7). The decline in those receiving Tax Credits may have been affected by changes to the benefits system introduced by the Coalition Government in April 2011.
Figure 6: Participating households who were in receipt of benefits by year.
Figure 7: Participating households who were in receipt of benefits, by benefit type and year.
96.7%87.1%
93.0%
0%
10%
20%
30%
40%
50%
60%
70%
80%
90%
100%
2010 2011 Total
Perc
enta
ge
Year
47.3%
6.2%
3.0%
52.4%
5.6%
30.6%
24.2%
43.4%
6.3%
2.8%
33.7%
4.2%
32.9%
21.9%
0% 10% 20% 30% 40% 50% 60%
Income Support
Job Seekers Allowance
Income Support & Employment Allowance
Tax Credits
Disability Living Allowance
Housing Benefits
Council Tax
Percentage
Bene
fit t
ype
2011
2010

Safe and Sound project Evaluation |March 2012
21
Across both years, the majority of participating households were residing in terraced houses (66.1% overall; Figure 8) while around a quarter were in semi-detached homes (24.2% overall). Across both years, the majority of households receiving the intervention were living in accommodation that was rented from a private landlord (34.9% overall; Figure 9) or provided by a Housing Association (30.2%). Less than a fifth of participating households owned their own home (17.3%).
Figure 8: Dwelling type of participating households by year.
*Other: Bungalow, caravan or unknown dwelling
Figure 9: Ownership type of participating households by year.
5.2%
67.6%
23.1%
3.2%0.9%
6.4%
63.7%
26.0%
3.3%0.7%
0%
10%
20%
30%
40%
50%
60%
70%
80%
Flat Terrace Semi-Detached Detached Other*
Perc
enta
ge
Dwelling type
2010 2011
8.4%
31.7%
10.2%
33.9%
15.9%
6.9%
27.8%
9.2%
36.6%
19.5%
0% 5% 10% 15% 20% 25% 30% 35% 40%
Other/Unknown
Housing Association
Council
Private Landlord
Client
Percentage
Ow
ners
hip
2011
2010
Safe and Sound project Evaluation |March 2012
22
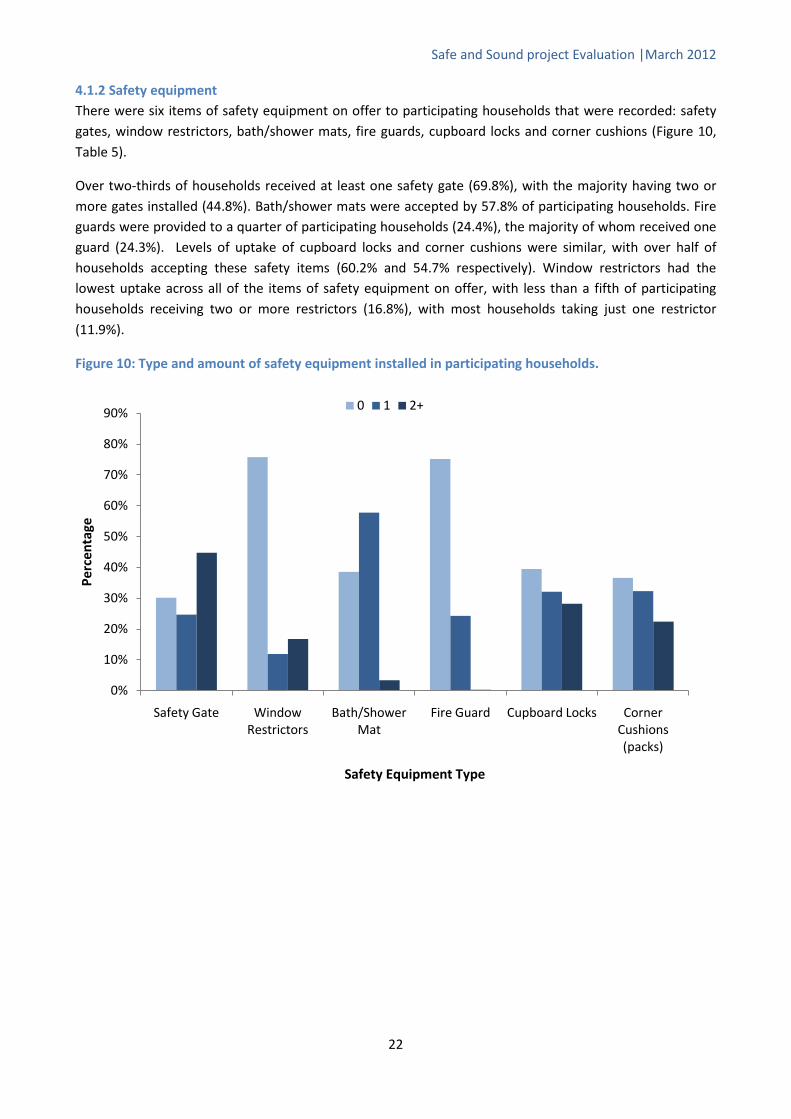
4.1.2 Safety equipment There were six items of safety equipment on offer to participating households that were recorded: safety gates, window restrictors, bath/shower mats, fire guards, cupboard locks and corner cushions (Figure 10, Table 5).
Over two-thirds of households received at least one safety gate (69.8%), with the majority having two or more gates installed (44.8%). Bath/shower mats were accepted by 57.8% of participating households. Fire guards were provided to a quarter of participating households (24.4%), the majority of whom received one guard (24.3%). Levels of uptake of cupboard locks and corner cushions were similar, with over half of households accepting these safety items (60.2% and 54.7% respectively). Window restrictors had the lowest uptake across all of the items of safety equipment on offer, with less than a fifth of participating households receiving two or more restrictors (16.8%), with most households taking just one restrictor (11.9%).
Figure 10: Type and amount of safety equipment installed in participating households.
0%
10%
20%
30%
40%
50%
60%
70%
80%
90%
Safety Gate Window Restrictors
Bath/Shower Mat
Fire Guard Cupboard Locks Corner Cushions (packs)
Perc
enta
ge
Safety Equipment Type
0 1 2+

Safe and Sound project Evaluation |March 2012
23
4.2 Household Telephone Interviews A total of 145 telephone interviews were conducted by FSN staff during December 2011 to February 2012. The results of the interviews are discussed here and full tables of results can be found in Appendix 6.
4.2.1 Equipment Safety gates
During the FSN home assessment, 105 respondents were identified as requiring safety gates (72.4%), of whom 101 (96.2%) received them. Ninety-one respondents reported that they still use the gate(s). The most common reasons given for not using the equipment were that the child was too old or the gate could not be fitted. Of those respondents who received gate(s), the majority (98.0%) felt that they were useful or very useful (Figure 11).
Fire guards
Thirty-two respondents required fire guard(s) and 31 received them. Of these, 27 (87.1%) reported that they still use them. The main reasons given for not using the fire guard(s) were that the respondents had bought a smaller one or that they were not using it yet due to child being too young. Of those who had received a fire guard, 96.8% found them useful.
Bath/Shower mats
Of the 105 respondents who required bath/shower mats, all received them and 81 (77.1%) still used them. The majority (85.7%) found them to be useful. The most common reason given for no longer using the mat(s) was that they had become worn or dirty.
Cupboard locks
Cupboard locks were required by 95 respondents and 96 received them. The majority of these were still using them (87.1%) and found them to be useful (92.7%). The main reasons given by those who were no longer using them were that: the children were older and the locks were no longer required, the locks had broken, or that the child had become able to open them.
Blind ties
Of the 52 respondents who required blind ties, all but one received them. Over three-quarters were still using them (78.4%) and a similar proportion found them to be useful (76.5%). The most common reasons given for no longer using the blind ties were that they hadn’t been fitted, didn’t suit the particular type of blind, or that they simply were not needed.
Corner cushions
Of the 145 respondents, 86 were identified as requiring corner cushions and 87 actually received them. Over two-thirds were still using them (69.0%) and 77.0% felt that they were useful. Common reasons for no longer using corner cushions were that they had broken or fallen off, or the child was older and they were no longer required.
Other items
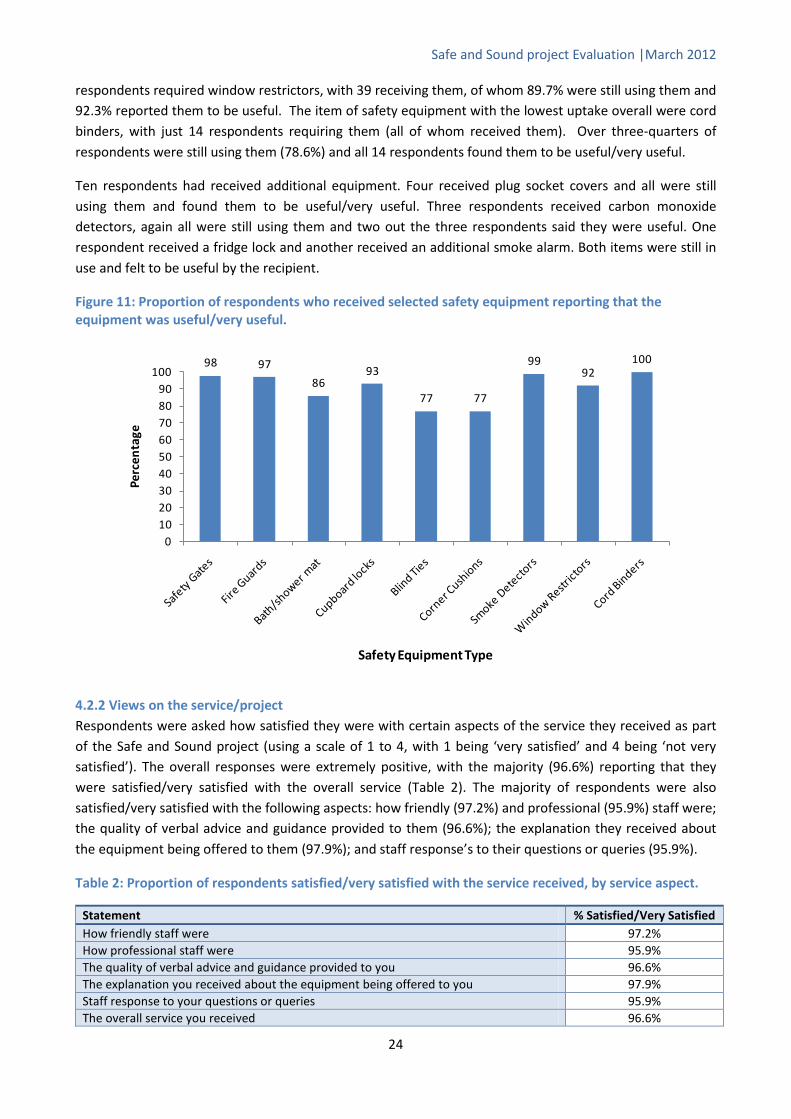
Smoke detectors were required and received by over half of respondents, with 94.9% reporting that they still used them. Almost all (98.7%) of respondents found them to be useful/very useful. Thirty-eight
Safe and Sound project Evaluation |March 2012
24
respondents required window restrictors, with 39 receiving them, of whom 89.7% were still using them and 92.3% reported them to be useful. The item of safety equipment with the lowest uptake overall were cord binders, with just 14 respondents requiring them (all of whom received them). Over three-quarters of respondents were still using them (78.6%) and all 14 respondents found them to be useful/very useful.
Ten respondents had received additional equipment. Four received plug socket covers and all were still using them and found them to be useful/very useful. Three respondents received carbon monoxide detectors, again all were still using them and two out the three respondents said they were useful. One respondent received a fridge lock and another received an additional smoke alarm. Both items were still in use and felt to be useful by the recipient.
Figure 11: Proportion of respondents who received selected safety equipment reporting that the equipment was useful/very useful.
4.2.2 Views on the service/project Respondents were asked how satisfied they were with certain aspects of the service they received as part of the Safe and Sound project (using a scale of 1 to 4, with 1 being ‘very satisfied’ and 4 being ‘not very satisfied’). The overall responses were extremely positive, with the majority (96.6%) reporting that they were satisfied/very satisfied with the overall service (Table 2). The majority of respondents were also satisfied/very satisfied with the following aspects: how friendly (97.2%) and professional (95.9%) staff were; the quality of verbal advice and guidance provided to them (96.6%); the explanation they received about the equipment being offered to them (97.9%); and staff response’s to their questions or queries (95.9%).
Table 2: Proportion of respondents satisfied/very satisfied with the service received, by service aspect.
Statement % Satisfied/Very Satisfied How friendly staff were 97.2% How professional staff were 95.9% The quality of verbal advice and guidance provided to you 96.6% The explanation you received about the equipment being offered to you 97.9% Staff response to your questions or queries 95.9% The overall service you received 96.6%
98 97
8693
77 77
9992
100
0102030405060708090
100
Perc
enta
ge
Safety Equipment Type

Safe and Sound project Evaluation |March 2012
25
When asked ‘would you contact the project again if you need to’, 96.6% of respondents stated that they would. Examples of reasons given by those who said they would not contact the project again were:
• No more children, service no longer required; and
• Wanted to leave the service to lower income families who were more in need.
Three-quarters of respondents (n=108) had recommended the project to someone else. Of the 37 who said that they had not done so, 86.5% said that they would recommend the project in the future.
There were a number of common themes that arose in response to the question ‘is there anything we could improve about the project’. While almost three-quarters of respondents stated that they were happy with the current service or no improvements were required, the remaining respondents made some useful suggestions including:
• Provide additional or alternative equipment;
• Improve the advertisement/marketing of the service;
• Provide a follow up service; and
• Provide better explanation on how to fit some items of equipment e.g. cord blind ties.
4.2.3 Children’s experiences of injuries in the home before/after receipt of equipment Respondents were also asked whether their children had been injured in or around the home before they received the equipment, and 21 respondents (14.5%) reported that they had. Of these, the majority of children sustained bumps (six children, 28.6%), cuts/bruises (five children, 23.8%) or minor injuries (four children, 19.0%). Of these, the majority sustained these injuries via falls (14 children, 66.7%) or walking into something (four children, 19%). The majority of these injuries happened over a year ago or before the FSN visit (12 children, 57.1%).
Respondents were also asked whether their children have been injured in or around the home subsequent to receiving the equipment, and 11 respondents (7.6%) reported that they had. Of these, the majority of children had sustained a minor injury (18.2%) or a cut (18.2%). Of these children, the majority sustained these injuries by falling down the stairs (6 children, 54.5%) – five of these six households had been supplied with safety gates, however, only two reported that they were still using them.
The majority (91.7%) of respondents thought that the equipment provided through their engagement with the Safe and Sound project had prevented their children from sustaining any injuries. When asked why the equipment may have prevented injury, 74 (51%) felt that it directly prevented accidents in the home and 55 (37.9%) felt the equipment made them feel safer or gave them peace of mind.
4.2.4 Additional comments Respondents were given the opportunity to provide further comments about the project. Seventy respondents (48.3%) portrayed that they were happy with the service, staff, and/or project overall, and six respondents (4.1%) suggested additional equipment that would be useful for the project, such as oven guards or bed guards.

Safe and Sound project Evaluation |March 2012
26
4.3 Fire Safety Network Staff Interviews Five members of FSN staff were interviewed by two research staff from the Centre for Public Health, Liverpool John Moores University. Whilst the five respondents had varying job titles, they all had (either current or previous) responsibility for the installation of safety equipment and provision of safety advice.
4.3.1 General perceptions of the project Overall, FSN staff were more than happy to discuss the project and were extremely positive about it and the benefits it brings, not only to the households but also to them personally, in terms of job satisfaction. Respondents all reported that households were very receptive of the project, with the vast majority happy for the installers to visit them and fit equipment.
“They’re really grateful to be honest and they think it’s [the project] really helpful to them because they can’t afford the baby gates and fire guards and window restrictors. Even little things like corner cushions that you have to put on tables because of sharp edges...so little things like that can make a real big difference.”
Respondents reported stairs (falls up and down) as the biggest safety concern for the majority of households they visit. Fires were also commonly reported. Other hazards highlighted were:
• Spills resulting in slips;
• Corners (of fireplace bases, coffee tables etc.);
• Falling out of bed;
• Blind cords;
• Falls from windows;
• Burns from cookers but also items such as hair straighteners; and
• Plug sockets.
One respondent reported that households often want to discuss other issues during their visit, for example, housing issues due to problems with their landlords.
Some respondents mentioned issues relating to their ability to fit equipment. Safety guidelines must be adhered to when fitting equipment, and in some cases this means that households cannot have all of the equipment they would like. For example, the design of some staircases means that safety gates cannot safely be fitted at the top of the stairs. In this circumstance, respondents reported offering alternative solutions, such as fitting the gate to a child’s bedroom (if the room is located near to the stairs).
Design of equipment was also noted as an issue, with some households refusing to have equipment fitted due to potential damage to the interior of their home, for example, safety gates or fire guards that must be screwed into the wall.
“Sometimes the equipment can’t fit. No matter what way you do it you’ve got to stick to the guidelines on safety. Sometimes you look at the stairs and think I could try and squeeze this on but is it worth it because it could be that in a weeks time that baby pushes the gate open and falls down the stairs.”
“….that’s another thing, our equipment is designed to be, not permanent where it’s gonna [sic] be there forever, you can unscrew it, but they are permanent because some people just don’t want to unscrew them and have holes in the walls so, the design of the equipment sometimes people aren’t happy with.”

Safe and Sound project Evaluation |March 2012
27
When questioned as to whether they felt that the project could resolve all issues that are raised, FSN staff varied in their response; some felt that the project could fully resolve all issues, while others were a little more cautious and suggested that most issues, but not all, could be resolved. The main issue related to their inability to provide additional items of safety equipment requested by households, such as plug socket covers (previously included in the ROSPA packs but currently not provided), bed guards, cooker guards and radiator covers (many new build houses do not have traditional fireplaces, rather radiators which also have the potential to cause burns).
“To a degree. I think there’s things [sic] that we could provide that we don’t, like plug socket covers. A lot of households ask do we have them and obviously we don’t provide them at the minute.”
Overall, interviewees were positive that households were very satisfied with, and accepting of, the service provided and the amount of equipment on offer.
“I think they’re [the households] immensely satisfied. Especially the people who genuinely can’t afford this service.”
“…they’re [the households] only entitled to it because they’re on benefits, so we’re dealing with people who haven’t really got a lot of money to be able to buy it themselves, that’s why they do appreciate it a lot more.”
Two respondents noted that the information Children’s Centres provide to households during the referral process as being key to the households satisfaction and acceptance of the service.
Respondents stated that some households request additional equipment (see above), however it was also recognised that the majority of households say the scheme has provided everything they need. Three respondents mentioned the evaluation sheets that they use (see Appendix 2b), asking the household questions in relation to; accidents their child may have had in the previous 12 months; other safety issues such as road safety and home security; and anything that the service could or should supply in the future. One respondent also noted that they refer people on to other appropriate schemes.
“…on some of them [sic] forms one of the questions is, ‘is there anything else we can provide?’ And a lot of them [the households] say no, you’ve provided everything, the odd person will say socket covers and stuff but the majority do say that there’s nothing else that we could provide.”
“We’ve got an evaluation sheet now for our research and funding purposes so we ask them, we do our own bit of research…because we sort of do other things as well, like emergency heating systems as well, we refer people on to like Healthy Homes and things like that. Some people mention problems with landlords so I suggest that they go on the website and have a look at Healthy Homes.”
4.3.2 Benefits of the project Overall, FSN staff felt that the main benefit of the project to children was in protecting them from potential harm through the provision of various items of safety equipment.
“It [the project] does literally do what it says; it keeps them [the children] safe and sound.”
Respondents suggested that the main benefits of the project to households were:
• The ‘peace of mind’ that it gave to parents to know their child was safe in the moments when they weren’t watching them;

Safe and Sound project Evaluation |March 2012
28
• Improved safety for everyone in the household, for example, bath mats can prevent slips for all of the family, not just the children; and
• The provision of free equipment to households that ordinarily could not afford it.
One respondent noted that it was not only the household directly receiving the equipment that would benefit, as many households pass the equipment on when they are finished with it.
“…they [the households] pass the equipment on, so it’s not just going to one house…they either keep it for their next baby, or their neighbour, or their sister.”
The relationship between the Fire Service/FSN and the community was highlighted as a key benefit to the FSN. Being able to target particular groups such as ethnic minorities, and the work the project does to promote the FSN as a charity was seen as positive. Job satisfaction was also cited as a benefit by one respondent.
“If we help one family out, their parents will go and tell another family and it’s nice because we are known in the community.”
The close relationship with the Children’s Centres was noted by the majority of FSN staff as the main benefit to multi-agency working, with the feeling that the Safe and Sound project was mutually beneficial to both parties i.e. Children’s Centres promote FSN by referring households to the project and the FSN staff promote the Children’s Centres to the households they visit.
“…we’ve [the FSN] got a close connection with the Children’s Centres, so hopefully the outcome of Safe and Sound might lead on to bigger and better things.”
The fire service itself and the work the FSN does to fit smoke alarms and conduct fire safety checks was also mentioned, the benefit being that they are gaining access to households that the fire service might not necessarily have. One respondent also noted that the FSN work with job centres to recruit volunteers to the project.
4.3.3 Limitations, barriers and potential improvements to the project FSN staff were asked about any current and future barriers or limitations to the project and how these might be overcome. The following were discussed:
Missed appointments
Respondents reported that a significant number of households fail to keep their appointments and therefore the FSN have a wasted journey. There are costs related to this in terms of staff time and fuel. One respondent suggested that it is often the most vulnerable families who miss appointments; however they do persist in trying to revisit on at least three or four occasions.
“…last week I got [sic] three missed appointments and it was a 30 mile round trip...and if you think about the cost of that 30 mile round trip. I don’t think people realise...they’re probably the most vulnerable families...they’re the ones we really want access to. We would never stop calling at that property but we are a charity and a 30 mile round trip. We’ve knocked three times and they haven’t been in...”
It was suggested that this could be overcome by stressing the importance of the project and also making households aware that the FSN is a charity with many staff working on a voluntary basis. One respondent

Safe and Sound project Evaluation |March 2012
29
stressed that the household should not be made to feel guilty; rather an attempt made to get them to appreciate the affect that missed appointments can have on the project in relation to time, money, and also other households who could have received a visit instead.
Advertisement
It was suggested by some FSN staff that the number of referrals to the project could be improved through better advertisement of the project.
“I can’t count the number of times we’ve been into a house and they’ve said they didn’t know anything about it.”
One respondent noted that the time of year may have been a factor (interviews were held in early December; therefore Christmas may have been having an impact on referrals). Whilst there was recognition that some limited advertisement already takes place in, for example, children’s hospitals, respondents were keen to suggest improvements. Suggestions included; a radio advertisement campaign which would reach a wider audience; targeting new mums via maternity units; or running a week-long campaign through Children’s Centres to advertise the project and let local people meet the staff and also educate the Children’s Centre staff about the project and the role of the FSN.
Eligibility criteria and coverage
The project has a clear set of criteria which are, in themselves, a limitation as only those who meet the criteria can be referred to the project.
“…just because you have a full-time job and you can afford things [it doesn’t mean] that your children don’t deserve to have baby gates and be safe. Maybe the person who is working full-time will be more harassed and running around frantic and would need the gates a bit more.”
The child age limit of two years old was seen as a particular restriction because, although households with a child over the age of two may not benefit from a safety gate, there are other items of safety equipment (for example, a fire guard) that they would find useful.
Widening the coverage of the project beyond Liverpool (and Wirral)vii
One respondent felt that a key issue for the future was that the project could potentially reach saturation point, whereby all eligible households had been visited and received equipment. They suggested this could be overcome if the eligibility criteria were expanded.
, to include areas such as Sefton and Knowsley was also suggested by a number of respondents. It was, however, noted that securing funding for these areas was an issue.
“…when it [the project] was originally open to everyone we used to all work full-time, we used to do seven or eight houses a day and there was [sic] still thousands of people on the list. Now we do five appointments a day and it seems to be that we do a lot more calling and contacting the Sure Start centres to send referrals, whereas they used to just be flooding us with referrals. Now the criteria is coming down really small [sic], it’s a select few that we’re getting as referrals.”
vii The scheme also runs on the Wirral but is funded separately.

Safe and Sound project Evaluation |March 2012
30
Other
One respondent mentioned limitations to what the FSN staff can do in response to problems that households highlight in relation to their landlords failure to complete jobs in their homes. Another suggested that a larger equipment list would be beneficial, providing items such as plug socket covers.
4.3.4 Additional comments FSN staff were given the opportunity to provide additional comments about the project. Overall, they used this as an opening to praise the project and the benefits it brings to vulnerable families. They highlighted that there is a continued need for this type of project across not only Liverpool but all cities and that, if possible, they would like to see the scheme funded again so that it could run indefinitely.
“If you’re skint you’re not gonna [sic] pay £20 for something [safety equipment] or £40 for a fireguard, its expensive stuff…”
“It’s a project that helps children, and every city, every town has children. So it’s one of them [sic] projects that’s not just for Liverpool people.”
“It’s [the project] helping families out and I think it will definitely be a good thing for the future as well, for future children who’ll be coming into this world.”

Safe and Sound project Evaluation |March 2012
31
4.4 Focus group with Children’s Centre staff A focus group was held with representatives (n=7) from six of the 26 Children’s Centres from across Liverpool to explore their views on the impact of the Safe and Sound project on the Centres and the households who access it. A full and interesting discussion was held, with several main themes arising, as detailed below. Despite differences between Children’s Centres in how referrals to the project are made, all participants were very positive about Safe and Sound and wished it to continue. All participants contributed to the discussion and all spoke of the many benefits Safe and Sound brings to those involved.
4.4.1 Role of the Children’s Centres Participants emphasised that the Children’s Centres play a major role in the project as they are the main point of access to children, along with Health Visitors.
Promotion
Variations in levels and type of promotion of the project across the Children’s Centres became apparent during the discussion. A number of the participants felt that they don’t do enough to promote the project and safety issues on the whole, while others use Safe and Sound as a way to get access to households, allowing them to engage families in other safety campaigns and to conduct home safety checks.
Referral differences
There are significant differences between the Children’s Centres in the number of referrals made to the project. A discussion as to the reasons behind this and best practice across the Children’s Centres was held.
Participants explained that they don’t all take the same approach to Safe and Sound referrals; during home visits, some Children’s Centres will include information on Safe and Sound, while others will tailor the information they provide and may exclude the project for some families to avoid ‘bombarding’ them with information. Some Children’s Centres perform home visits as part of the referral process, whilst others complete the forms and pass them to the FSN. In this sense some participants felt that their role was just a ‘paper exercise’. A number of Children’s Centres are targeting certain LSOAs with safety information using Every Child Matters data; they also get a list from eStartviii
4.4.2 Factors affecting uptake of the Safe and Sound project
of those who have registered with a Children’s Centre but are not accessing services. All new families that engage with the Children’s Centres receive a home visit, and as part of that, Safe and Sound is discussed.
Participants suggested that the main factor affecting uptake of the Safe and Sound project was the changes in eligibility criteria, in relation to child’s age (reduced from age five as part of the ROSPA scheme, to age two). Eligibility restrictions focussing on benefit entitlements were regarded as a more important issue than the age of the child. A number of families do not meet the eligibility criteria, however they still need the equipment. Participants raised the point that many working families have less time to consider safety equipment and perhaps less disposable income than those who don’t work and that the children of these families have equal rights to be safe.
“It’s a bit judgemental, I know you are going ‘because they can’t afford it’ but it doesn’t mean they have any less or more knowledge of safety than anybody else does it?”
viii eStart is a software product that securely holds information on the families (children and carers) accessing Children’s Centre services.

Safe and Sound project Evaluation |March 2012
32
“…yeah, they might just be a few quid over the threshold…a lot of the time, you know, you really want to give it them… and they say ‘can’t you just’ but you have to say ‘I can’t’.”
One Children’s Centre offers a home safety pack of equipment (bought before the ROSPA project when they had extra funding), including, for example, plug socket covers and fridge locks, to parents with a child under two, who may not meet Safe and Sound criteria but do have some home safety requirements.
Some confusion arose around eligibility and the Children’s Centres ability to refer to the project. Some participants stated that a member of FSN staff had advised them to ‘use their discretion’ when dealing with families who are just outside of the eligibility criteria but show a real need. One participant stated the instruction to put a note on the referral form highlighting the case as ‘children in need’.
“…I’ve got one on Wednesday, she doesn’t fit the criteria, as far as I know, erm [sic] but when someone spoke to her she hadn’t even got smoke alarms and I went, right I’ll come out on Wednesday.”
However, this instruction has not been given to all Children’s Centres and clarification regarding eligibility is needed.
All participants expressed a strong view that the project should be offered to everyone, but equally they recognised that funding restrictions make this impossible and therefore some changes in criteria are needed as a starting point. The general feeling was that the criteria ought to be expanded to be more inclusive. One participant noted that the criteria have changed in a positive way as Asylum Seekers have now been included (previously not included under the ROSPA scheme).
A number of participants discussed the effect of the transiency of the population on the uptake of Safe and Sound. Some Children’s Centres are located within highly transient communities, whereas others are located among stable communities. Transient areas have a higher numbers of referrals.
“We could go into those streets [of transient communities] on a daily basis and you’d see a new family…”
A key issue for stable communities is their potential to reach ‘saturation point’ with Children’s Centres finding it harder to refer due to lack of new families. In addition, many families who have safety equipment either provided by the scheme or that they have purchased themselves pass this on to families and friends.
“…once they’ve [the families] had it, they’ve all had it.”
A further issue participants raised was a lag time between families asking for equipment and receiving it. Families become ineligible if the child is over two years old at the time of fitting, despite being within the age criteria at application. Again, this links to the fact that all participants expressed the view that the criteria should be more inclusive.
4.4.3 Benefits of the Safe and Sound project Participants felt that the main benefit of the project to the Children’s Centres was that it brings people into the Centres and encourages them to engage in the many available activities (e.g. Baby Massage). Participants were also hopeful that Safe and Sound would reduce the number of accidents in childhood and keep the numbers of accidents down in the coming years.
Safe and Sound project Evaluation |March 2012
33
“We’ve [the Children’s Centre] had families just come in purposely because they’ve been told about it [the project], so it actually gets them into the centre.”
The Safe and Sound project is viewed by the participants as highly beneficial to households as it raises awareness and educates parents on all aspects of safety, highlighting all risks within the home and outside. By encouraging parents to engage with Children’s Centres, they will have access to other prevention and safety courses/schemes provided e.g. First Aid as well as information from the Child Accident Prevention Trust. A main benefit highlighted by participants was the fact that equipment is fitted by professionals and is therefore fitted effectively. In some cases, it was also noted that families are introduced to safety equipment that they were not aware of e.g. blind cord winders.
All participants said they had received very positive feedback from households. Families are generally very happy with the service and very pleased that it has saved them money. Further, participants felt that the project was beneficial to multi-agency working and noted that it aided their strong working partnerships with social care professionals, Health Visitors and with other safety initiatives such as Healthy Homes. They also noted good partnerships with midwives, although this varied according to area.
4.4.4 Limitations and suggested improvements All participants noted the eligibility criteria to be the main limitation of the project. Concern was also raised about the lack of feedback from the FSN to the Children’s Centres. Participants discussed the failure of the FSN to inform them if households have outstanding safety concerns after their Safe and Sound visit. However, some participants felt that this should be the responsibility of Health Visitors rather than the FSN and that more regular liaison with the health visiting team would be advantageous. An inability to contact eligible families due to changing phone numbers was also recognised as a problem.
Safety equipment not on the itinerary and fitting of the equipment
The majority of participants reported that families often ask for safety equipment that is not provided by Safe and Sound. Examples of requests include:
• Bed guards;
• Carbon monoxide alarms (provided by some Children’s Centres in the past); and
• Heatproof covers and mats for hair straighteners (Alder Hey ED provided these to Dingle Children’s Centre as part of a trial scheme).
The fitting of safety gates raised concern amongst all participants. It is not possible to fit safety gates in some households due to the fact that they won’t fit on certain types of banisters. Some participants reported that alternative locations for the safety gates are sought where possible, for example on a baby’s bedroom door. However, much confusion arose regarding the safety guidelines in relation to the fitting of safety gates e.g. cannot impede fire exits and questions around the eligibility of families who had both a child over two years old and a small baby.
“Ours [families who access Children’s Centres] don’t really seem to think of asking for things that aren’t on the list as such, but they’re not happy with the fact that they can’t have the likes of stair gates.”
Safe and Sound project Evaluation |March 2012
34
All participants would like to see a change in the eligibility criteria, with the general feeling that it should be more inclusive, and that the age of eligibility should be applied to the child’s age on the date of fitting the equipment, rather than the date of application. All participants would also like to see a wider range of safety equipment available, particularly carbon monoxide monitors.
Participants felt that regular feedback from the FSN regarding non-admittance at house visits or any further safety issues is imperative. It would be beneficial to all if FSN staff could provide Children’s Centres with a list of all families they have been unable to contact. Participants also noted that contacting eligible families to arrange visits has been a major issue as many families change their telephone numbers. A formalised approach to contacting families is needed. It was suggested that Children’s Centres ask for alternative phone numbers e.g. family members (which some already do) and highlight on the application form that families need to inform centres of any changes in contact details. It was also suggested that a texting service to arrange appointments might a useful alternative to phoning, as many people ignore calls from an unrecognised number. In addition, it was suggested that families should be instructed to contact their Children’s Centre if they have applied but not received a home visit within three weeks. Closer liaison with GPs was also noted as a potential improvement.
4.4.5 Additional comments Many participants expressed concerns regarding the funding of Safe and Sound. One participant reported that their centre had used money from other budgets to ‘top-up’ their Safe and Sound budget, but would be unable to do that in the future as overall funding will reduce further next year. Some participants also expressed the view that the tightening of eligibility criteria and reduction in funding may have meant that not enough people are eligible for Safe and Sound as they are constantly being asked to find more eligible households.
Overall, the focus group provoked thoughtful and interesting debate around the Safe and Sound project. Participants welcomed the opportunity to share their experiences and best practice. The general mood of the focus group was extremely positive and all participants were pleased to be involved and hoped it would continue.
“It’s a fantastic service...keep it going.”
“It’s beneficial to everybody.”

Safe and Sound project Evaluation |March 2012
35
4.5 Emergency department attendance and ambulance call out data analyses
4.5.1 Injury attendances to Alder Hey Emergency Department Data on the number of injuryix
attendances to Alder Hey ED by children aged 0-2 years who were resident within areas receiving the Liverpool Safe and Sound project were accessed from the Trauma and Injury Intelligence Group Injury Surveillance System. Data cover the intervention period (January 2010 to December 2011) and a comparison period before the project was implemented (January 2008 to December 2009).
The monthly trend in ED injury attendances amongst the target group (i.e. patients aged 0-2 years and resident in Liverpool Safe and Sound project areas) from January 2008 to December 2011 is shown in Figure 12. Overall, peak months for injury attendances were May and July. Over half (54%) of injury attendances were male; 22% were under the age of 1 year and 78% were aged 0-2 years (Figure 13). The majority (97%) of injury attendances were recorded as trauma-accidental. Over three quarters (79%) of injury attendances amongst 0-2 year olds from Liverpool Safe and Sound project areas reported that the injury occurred in the home. The majority (96%) of injury attendances reporting the home as the injury location were also recorded as trauma-accidental; 3% were recorded as ingestion-accidental. The demographic profile of these attendances was similar to all injuries attendances; 24% were under the age of 1 and 46% were male (Figure 14). Levels of recorded ED injury attendances amongst the target group, and that were recorded as occurring within the home, for the intervention period (January 2010 to December 2011) were compared to those in the pre-intervention period (January 2008 to December 2009). There was no change in recorded ED home injury attendances, with the monthly mean remaining at 169 during both time periods (p = 0.922).x
Figure 12: Injury attendances aged 0-2 years to Alder Hey ED, patients from Liverpool Safe and Sound project intervention areas only, by month and incident location, January 2008 to December 2011.
ix This includes all ED attendances recorded as the following fields within the patient group field: ingestion-accidental; ingestion-deliberate and trauma-accidental. x Statistics used analyses of variance (ANOVA).
100
120
140
160
180
200
220
240
260
280
300
Janu
ary
2008
Mar
ch 2
008
May
200
8
July
200
8
Sept
embe
r 20
08
Nov
embe
r 20
08
Janu
ary
2009
Mar
ch 2
009
May
200
9
July
200
9
Sept
embe
r 20
09
Nov
embe
r 20
09
Janu
ary
2010
Mar
ch 2
010
May
201
0
July
201
0
Sept
embe
r 20
10
Nov
embe
r 20
10
Janu
ary
2011
Mar
ch 2
011
May
201
1
July
201
1
Sept
embe
r 20
11
Nov
embe
r 20
11
Num
ber o
f ED
att
enda
nces
Time Period
All injury locationsInjuries in the home

Safe and Sound project Evaluation |March 2012
36
Figure 13: Injury attendances aged 0-2 years to Alder Hey ED, patients from Liverpool Safe and Sound project intervention areas only, by age and gender, January 2008 to December 2011 combined.
Figure 14: Injury attendances for injuries in the home, aged 0-2 years to Alder Hey ED, patients from Liverpool Safe and Sound project intervention areas only, by age and gender, January 2008 to December 2011 combined.
4.5.2 Ambulance call outs Data on the number of ambulance call outs to children aged 0-2 years within areas receiving the Liverpool Safe and Sound project were accessed from the North West Ambulance Service. Data cover the intervention period (January 2010 to December 2011) and a comparison period before the project was implemented (January 2008 to December 2009). The monthly trend in ambulance call outs amongst the target group (i.e. children aged 0-2 years within the areas of Liverpool receiving the Safe and Sound project) from January 2008 to December 2011 is shown in Figure 15. Over half (52%) of call outs were to males and 40% of call outs were made to 1 year olds (Figure 16).
0
500
1,000
1,500
2,000
2,500
0 1 2
Num
ber o
f ED
att
enda
nces
Age in years
Male
Female
0
200
400
600
800
1,000
1,200
1,400
1,600
1,800
2,000
0 1 2
Num
ber o
f ate
ndan
ces
Age in years
Male
Female

Safe and Sound project Evaluation |March 2012
37
The most prevalent injury for which ambulances were called to the target group was falls, which accounted for 54% of call outs between January 2008 and December 2011. One in five call outs (20%) were made due to traumatic injuries, and 16% due to choking. Levels of recorded ambulance call outs amongst the target group, and that were recorded for intervention period (January 2010 to December 2011), were compared to those in the pre-intervention period (January 2008 to December 2009). There was a slight decrease in recorded ambulance call outs between the two periods, with the monthly mean decreasing from 30 in 2008-2009 to 27 in 2010-2011 (p = 0.22).x Figure 15: Ambulance call outs to patients aged 0-2 years from Liverpool Safe and Sound project intervention areas only, by month, January 2008 to December 2011.
Figure 16: Ambulance call outs to 0-2 year olds, patients from Liverpool Safe and Sound project intervention areas only, by age and gender, January 2008 to December 2011 combined.
05
101520253035404550
Janu
ary
2008
Mar
ch 2
008
May
200
8
July
200
8
Sept
embe
r 200
8
Nov
embe
r 200
8
Janu
ary
2009
Mar
ch 2
009
May
200
9
July
200
9
Sept
embe
r 200
9
Nov
embe
r 200
9
Janu
ary
2010
Mar
ch 2
010
May
201
0
July
201
0
Sept
embe
r 201
0
Nov
embe
r 201
0
Janu
ary
2011
Mar
ch 2
011
May
201
1
July
201
1
Sept
embe
r 201
1
Nov
embe
r 201
1
Num
ber o
f cal
l out
s
Time period
0
50
100
150
200
250
300
350
0 years 1 year 2 years
Num
ber o
f cal
l out
s
Age
Male
Female
Unknown
Safe and Sound project Evaluation |March 2012
38
5. Discussion and Recommendations Through the Safe and Sound project, the Fire Safety Network (in partnership with Sure Start Children’s Centres) identifies families at risk of childhood injuries in the home, conducting a home risk assessment with those families and providing appropriate safety advice and free safety equipment. This report presents findings of an evaluation of the project, and aims to provide a summary of its effectiveness and recommendations for its development.
Uptake of the Safe and Sound project has been considerable, with almost 5,500 households participating in the project during the two years from January 2010 to December 2011. The project aims to target disadvantaged households, and figures show that over three-quarters of participating households were resident in the most deprived quintile of the population. For households to be eligible to take part in the project they must have a child under the age of two and be in receipt of one of a list of benefits (see Appendix 1 for eligibility criteria). The data supported this, as the majority of participating households were in receipt of benefits and had one or more children under the age of two.
The majority of participating households were residing in terraced houses and most were renting their accommodation from a private landlord or as provided by a Housing Association. Less than a fifth of participating households owned their own home. During interviews with FSN staff it was highlighted that living in rented property can be an issue as people may be unwilling/unable to modify their accommodation and may not therefore be able to have certain items of safety equipment fitted, for example safety gates or fireguards that require screwing into the walls.
During its latest period of funding (April 2011 to March 2012) the project aimed to provide home safety equipment to 1,829 families across Liverpool. Figures for the nine months from April to December 2011 show that almost 1,000 families had been visited by FSN staff during that period. Figures for the final three months were unavailable at the time of report production. There are numerous factors that may have affected the projects ability to reach this target, such as a lack of eligible families or some stable communities reaching ‘saturation point’ with no new eligible families coming into the area. These limitations are discussed in more detail below.
The overall perception of the project was extremely positive, with almost all of the 145 participating households who completed the telephone survey stating that they were satisfied/very satisfied with the overall service they received (96.6%). The project was also highly praised by FSN and Children’s Centre staff, who were keen to highlight that the project brings many benefits not only to the participating households but also to the staff themselves (job satisfaction) and the Children’s Centres (for example, the project was seen to help draw families in to the Centres thus allowing them the opportunity to get families involved in other activities that are on offer).
Overall, FSN and Children’s Centre staff felt that the main benefit of the project to children was in protecting them from potential harm and injury through the provision of various items of safety equipment. A variety of benefits to the household were cited, such as:
• The ‘peace of mind’ that it gave to parents to know their child was safe in the moments when they weren’t watching them;
• Reassurance that equipment has been professionally and effectively fitted;
• Improved safety for everyone in the household, for example, bath mats can prevent slips for all of the family, not just the children; and
• The provision of free equipment to households that ordinarily could not afford it.

Safe and Sound project Evaluation |March 2012
39
Across the various items of safety equipment on offer to participating households, safety gates and bath/shower mats were the most popular with around two-thirds of participating households receiving them. All items of safety equipment were deemed to be useful/very useful by at least three-quarters of those using them. Most participants suggested that they would contact the project again, with three-quarters having already recommended the project to someone else.
Questions were asked in relation to children’s experiences of injuries in the home before/after receipt of equipment in order to gain some insight as to whether the provision of equipment had reduced injuries in the home. The majority (91.7%) of respondents thought that the equipment provided had prevented their children from sustaining injuries. Around half (51%) felt that the equipment directly prevented accidents in the home and 37.9% stated that the equipment made them feel safer or gave them peace of mind. Participating households reported a higher number of injuries among their children prior to installation of equipment (n=21), mostly as a result of falls (67%). Of these, almost a third resulted in a visit to a GP/walk-in centre or to an ED. Following installation of equipment, 11 accidents were reported – a 48% reduction. Around half of these injuries were as a result of a fall, and just one required a visit to a GP surgery (none reported needing to visit a walk-in centre or ED). This may suggest that the equipment has not only reduced the incidence of injuries in the home, but also reduced the severity of the injuries that have occurred since. However, further research is required to assess the long term impact on injuries in the home.
Despite this anecdotal evidence, examination of the ED and ambulance data before (2008/09) and during the intervention (2010/11) revealed no change in the mean number of ED home injury attendances, and only a small (but not significantly different) decrease in recorded ambulance call outs. Whilst there were no significant decreases to report, it is positive to note that no increases were observed. Even if a significant decrease had been evident it would be difficult to attribute any change to the Safe and Sound project alone as many other factors could be involved.
Key recommendation 1 - Evaluation The impact of Safe and Sound is likely to continue beyond March 2012. It would be useful to conduct further evaluation in the future to try and capture some of the longer term effects of the intervention.
One of the key limitations to the project, as highlighted by both FSN and Children’s Centre staff are the eligibility criteria. There was a difference of opinion as to what element of the criteria was the biggest issue. FSN staff suggested that the child age limit of two years old was a greater restriction than the claiming of benefits, for example, it was suggested that although households with a child over the age of two may not need a safety gate, there are other items of safety equipment (such as a fireguard) that they might find useful. Children’s Centre staff, on the other hand, felt that the benefits entitlement criteria were more limiting, reporting that many families have children under two but do not claim the appropriate benefits thus rendering them ineligible, despite having a need for the equipment. Children’s Centre staff stated that many working families may be at greater need than those who don’t work as they have less time to consider safety equipment and possibly less disposable income.
One issue that this evaluation has highlighted is the confusion around the eligibility criteria and who the Children’s Centres are allowed to refer. It seems that some Centres have been given dispensation to refer families that may not necessarily meet the criteria but who display a real need. Whilst these Centres are being allowed to ‘use their discretion’ this does mean that certain areas are at an unfair advantage as not all are receiving this instruction. It is important that the Centres are given a clear and consistent message about the referral process.

Safe and Sound project Evaluation |March 2012
40
Concern was raised both in the FSN staff interviews and the focus group that the project could potentially reach ‘saturation point’ in some areas (particularly in those communities that are stable rather than transient in nature), whereby all eligible households had been visited and received equipment. The general feeling was that this could be overcome if the eligibility criteria were expanded.
Missed appointments were noted as a significant issue by FSN staff. Whilst staff do persist in trying to access referred households, this has an obvious time and cost implication. Reducing these missed appointments might be achieved by stressing the importance of the project at the point of referral and also highlighting with the families that the FSN is a charity, with many staff working on a voluntary basis.
Due to safety guidelines, insurance issues or simply due to issues of design it is not always possible for FSN staff to fit equipment, which can be disappointing for some households. Equally, some households choose not to have equipment fitted due to concerns about damage to the interior of their home or because the equipment is not aesthetically pleasing.
The provision of additional or alternative equipment was highlighted by all three interview groups as an area for improvement. FSN staff named plug socket covers, bed guards, cooker guards and radiator covers as the most commonly requested items (participating households also named most of these items). Children’s Centre staff also mentioned carbon monoxide alarms and heatproof covers/mats for hair straighteners.
Key recommendation 6 - Additional equipment Consideration should be given to expanding the itinerary of equipment offered as part of the project. Small items such as plug socket covers may provide additional reassurance to families.
Key recommendation 2 - Eligibility criteria Whilst the project cannot be offered to everyone and some limits must be in place, it would be worthwhile reviewing the eligibility criteria, particularly in relation to the age of the child. This would allow more families to be included, for example revising the age so that families with a child under the age of five are eligible (as was previously the case under the ROSPA scheme).
Key recommendation 3 - Referral process It may be beneficial for Children’s Centres to share best practice and adopt a more consistent approach to the way in which they make referrals to the project. Clarification should be provided by FSN staff as to the level of discretion that can be used when referring households who do not meet the eligibility criteria to ensure a fair system is in place.
Key recommendation 4 - Arranging home visits It was suggested that introducing a text service to arrange appointments (rather than the current call-centre based system) might increase the number of successful contacts as it was felt that many people would ignore calls from an unrecognised number.
Key recommendation 5 - Missed appointments Reducing the number of households who fail to keep their appointments would reduce costs and allow other households to receive a visit. A reminder system may help, for example, telephoning or texting households 24 hours before their appointment to remind them about it.

Safe and Sound project Evaluation |March 2012
41
Promotion and advertisement of the project was highlighted as a key issue not only by FSN and Children’s Centre staff but by participating households. It was felt that referral numbers would improve if the project had a better advertising campaign, for example, a radio advertisement campaign which would reach a wider audience; targeting new mums via maternity units; or running a week-long campaign through Children’s Centres to advertise the project and let local people meet the staff and also educate the Children’s Centre staff about the project and the role of the FSN.
Key recommendation 7 - Project promotion It is clear from this evaluation that the current promotion of the project is limited. Whilst a large-scale advertising campaign may not be financially viable, there are actions that could be taken within the Children’s Centres to promote the projects availability. One suggestion is to run a week-long campaign through Children’s Centres to advertise the project and let local people meet the staff and also educate the Children’s Centre staff about the project and the role of the FSN.
Some participants also suggested that a follow-up service would be beneficial. This would provide an opportunity to check that households are happy with equipment or that they have correctly installed items not fitted by the FSN professionals. Finally, some participants seemed unsure about how to fit some items of equipment and suggested that a better explanation on how to install these items (such as cord blind ties) would be of use.
Key recommendation 8 - Installation advice In some cases FSN leave certain items of equipment for households to fit themselves, for example, blind ties. Some households raised concerns that they might not be doing this correctly and therefore placing their child/children at risk. It may be that improved information during home visits may suffice e.g. easy to follow instruction leaflets; alternatively a follow-up service might be beneficial as FSN staff could check that equipment was correctly and safely installed.
During the Focus Group it was also noted that improvements in the feedback process between the FSN and Children’s Centre staff would be beneficial. Children’s Centre staff would like to be kept informed about; households who fail to allow FSN staff to visit; any additional safety issues that FSN staff identify within a household that are not dealt with by the Safe and Sound project; and finally a list of families whom the FSN have been unable to contact (for example, if the phone number they provided is no longer correct).
Key recommendation 9 - Feedback process Introducing a formal feedback process whereby FSN staff keep Children’s Centre staff informed about households who fail to allow FSN staff to visit; any additional safety issues that FSN staff identify within a household that are not dealt with by the Safe and Sound project; and a list of families whom the FSN have been unable to contact (for example, if the phone number they provided is no longer correct). This would increase the number of households receiving the service and would also give Children’s Centre staff a greater sense of involvement rather than their role simply ending at point of referral.
This evaluation brings together a variety of evidence that highlights the importance of the project and supports its continuation. The project has reached many deprived families across Liverpool and provided them with information and equipment that they might ordinarily have been unaware of or unable to afford. Across the various elements of the evaluation, key themes for improvement arose which we have developed into several key recommendations for action.

Safe and Sound project Evaluation |March 2012
42
6. Appendices
Appendix 1: Project eligibility criteria
To be eligible for this service:
• All families must have a child under the age of two living in the property
• The family must live in Liverpool
AND one of the following must apply to the family
• Families who are eligible for income support
• Families who are eligible for jobseekers allowance (income based)
• Families who are eligible for disability living allowance or mobility component for a disabled child
• Families who are eligible for housing benefit
• Families who are eligible for council tax benefit (not council tax discounts)
• Parents who are 19 years old and under
• Families who are seeking asylum or refuge (please note discretion must be used by centre staff to ensure the family will be based at the property for a significant period of time)

Safe and Sound project Evaluation |March 2012
43
Appendix 2a: Form 1a, Liverpool Referral for Home-Safety Equipment
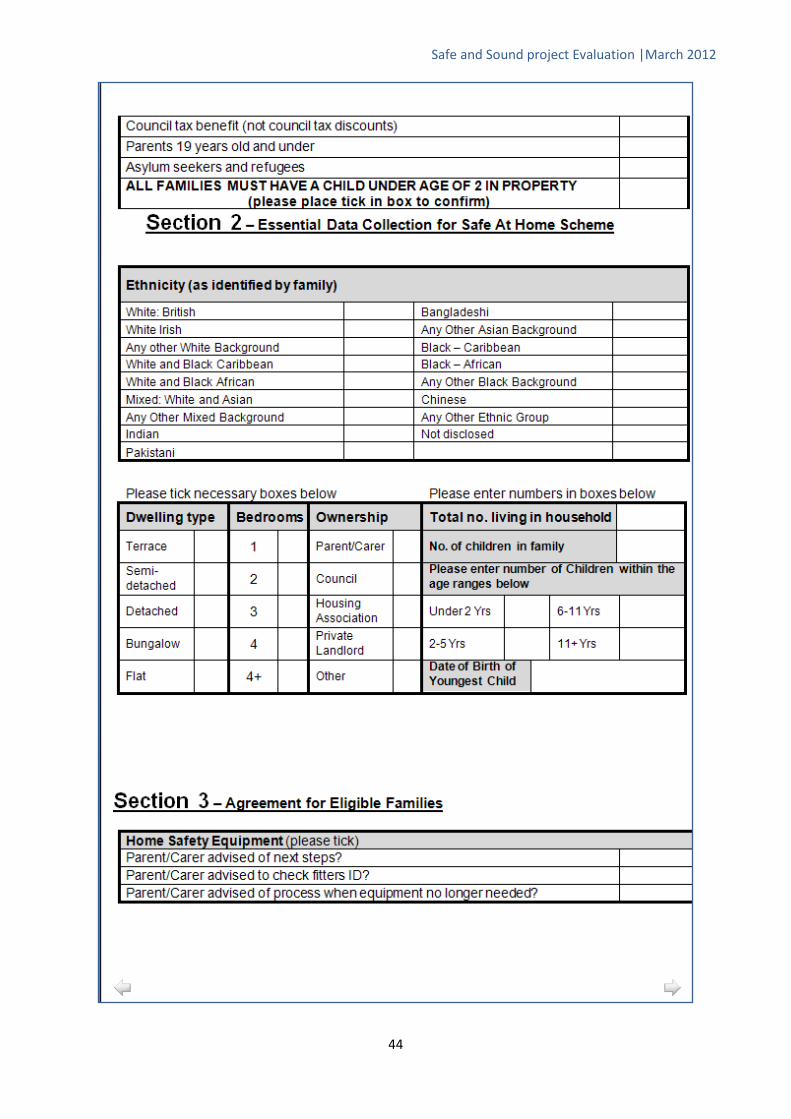
Safe and Sound project Evaluation |March 2012
44
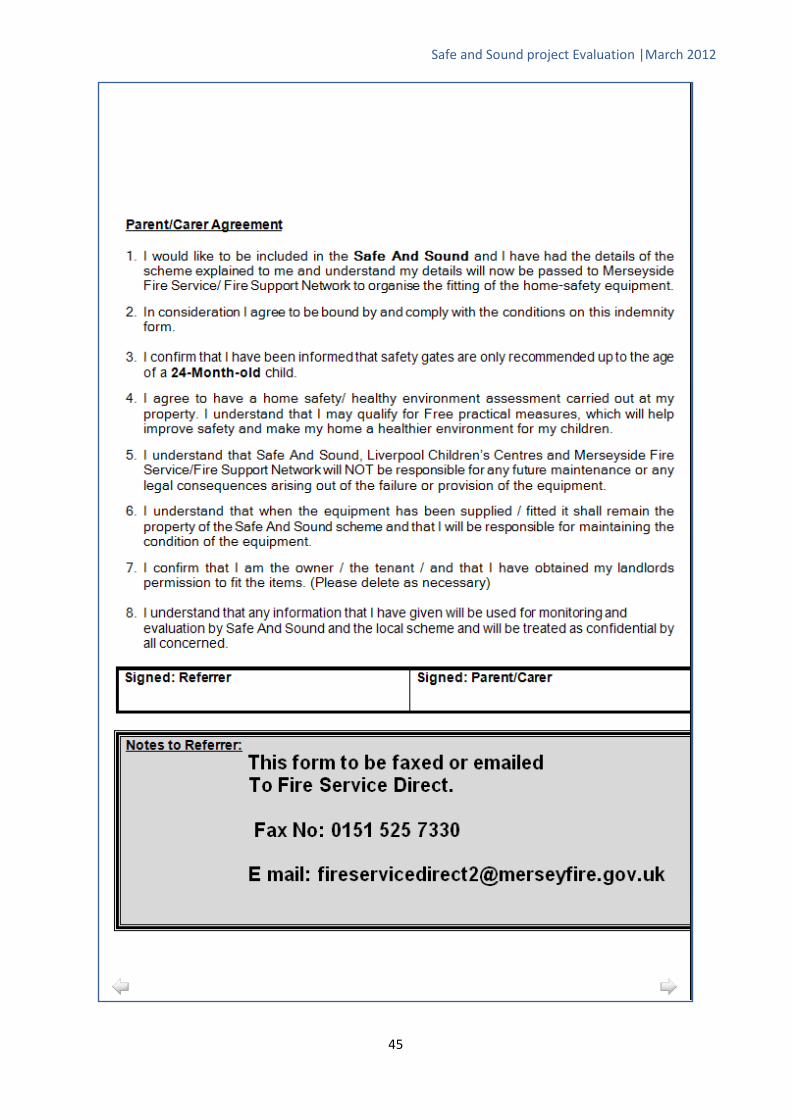
Safe and Sound project Evaluation |March 2012
45

Safe and Sound project Evaluation |March 2012
46
Appendix 2b: Form 1b, Liverpool Equipment and Eligibility

Safe and Sound project Evaluation |March 2012
47
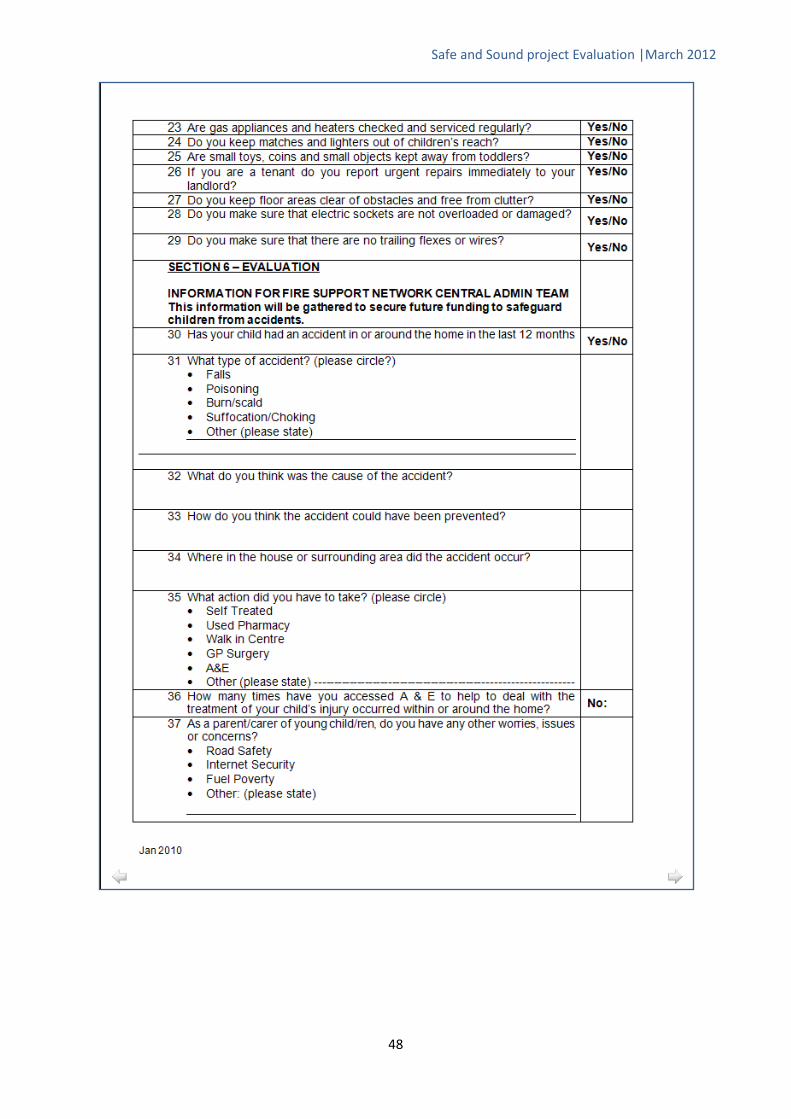
Safe and Sound project Evaluation |March 2012
48
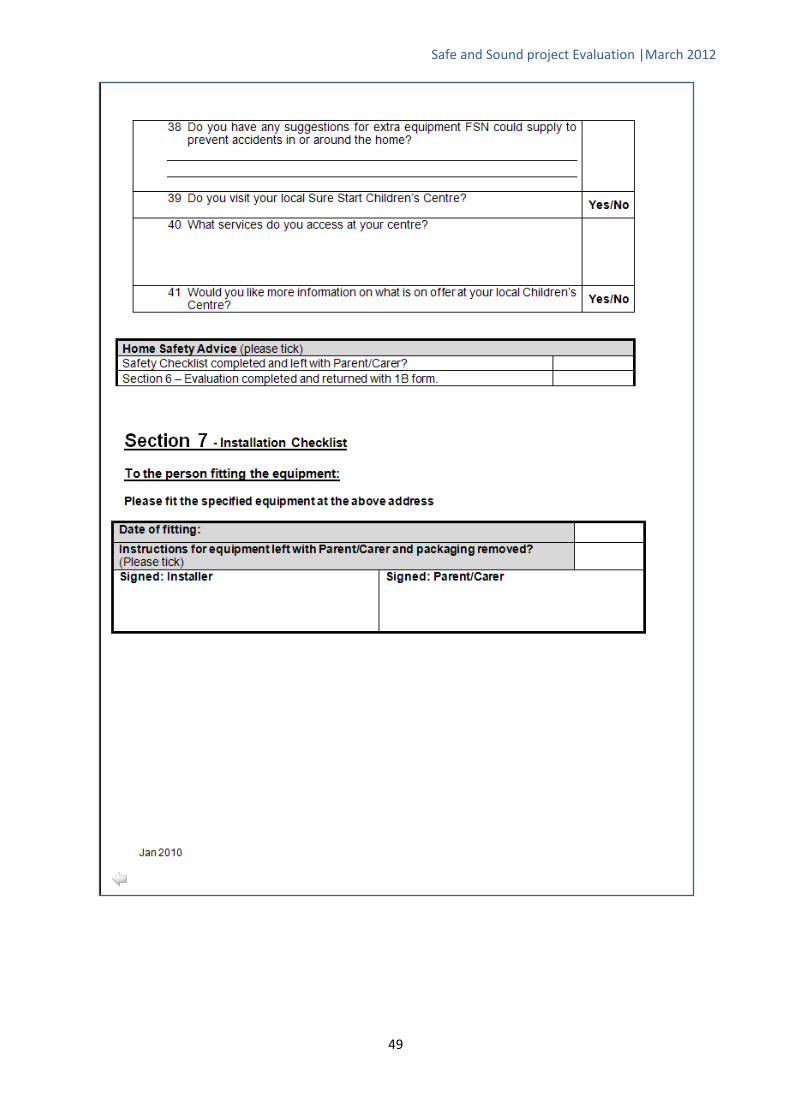
Safe and Sound project Evaluation |March 2012
49
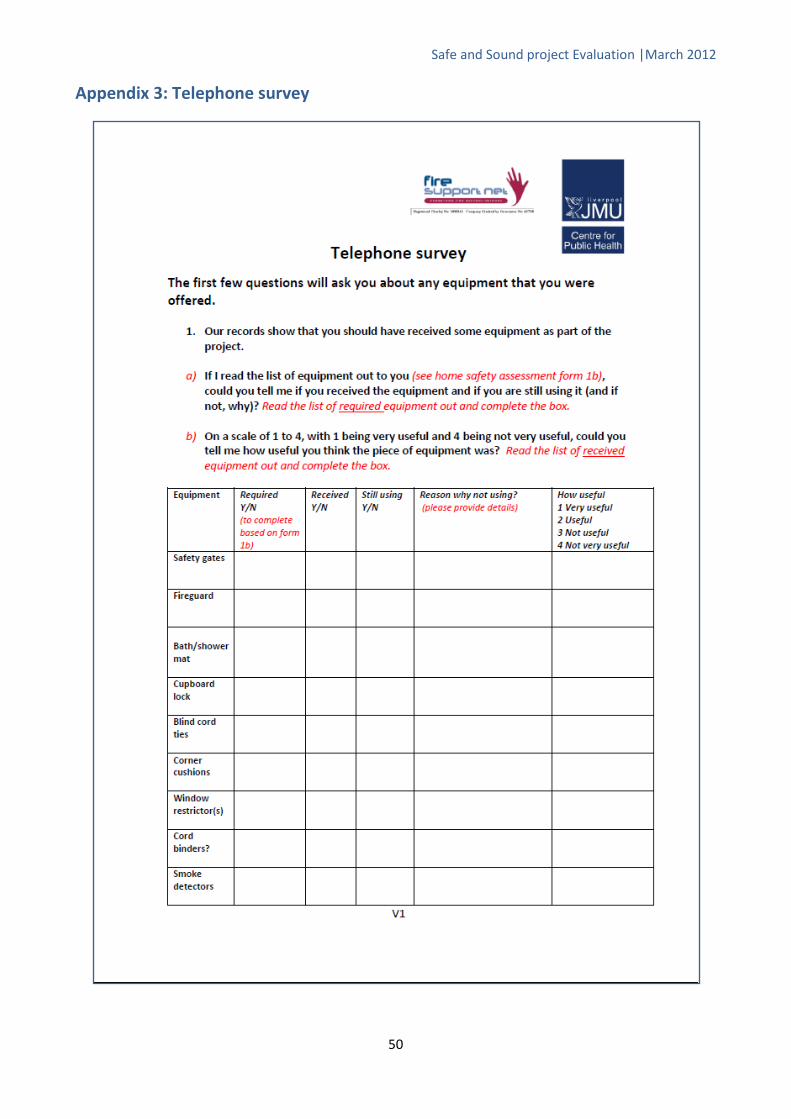
Safe and Sound project Evaluation |March 2012
50
Appendix 3: Telephone survey

Safe and Sound project Evaluation |March 2012
51

Safe and Sound project Evaluation |March 2012
52
Safe and Sound project Evaluation |March 2012
53

Safe and Sound project Evaluation |March 2012
54

Safe and Sound project Evaluation |March 2012
55
Safe and Sound project Evaluation |March 2012
56
Appendix 4: Fire Safety Network Staff Interview

Safe and Sound project Evaluation |March 2012
57
Safe and Sound project Evaluation |March 2012
58

Safe and Sound project Evaluation |March 2012
59
Appendix 5: Supplementary tables - existing project data
Table 3: Number of people living in participating households by year.
Year Number in household
1 2 3 4+ Unknown n % n % n % n % n %
2010 * * 664 20.4 1,164 35.8% 1,420 43.7 33 1.0
2011 6 0.3 482 23.6 715 35.0% 839 41.1 8 0.4
Total 11 0.2 1,146 21.6 1,879 35.5% 2,259 42.7 41 0.8
*Numbers less than five have been suppressed
Table 4: Number of children in participating households by age group and year.
Age Group Year 0 1 2 3 4+ Unknown
n % n % n % n % n % n %
2 years and under
2010 466 14.2 2,608 79.5 198 6.0 7 0.2 * * 7 0.2
2011 169 8.3 1,753 85.7 120 5.9 * * * * * *
Total 635 11.9 4,361 81.9 318 6.0 10 0.2 * * 11 0.2
2 to 5
2010 1,957 59.7 1,052 32.1 248 7.6 20 0.6 * * 9 0.3
2011 1,359 66.4 569 27.8 106 5.2 12 0.6 * * * *
Total 3,316 62.3 1,621 30.5 354 6.7 32 0.6 * * 13 0.2
6 to 11
2010 2,487 75.9 598 18.2 155 4.7 32 1.0 6 0.2 8 0.2
2011 1,620 79.2 329 16.1 83 4.1 13 0.6 * * * *
Total 4,107 77.2 927 17.4 238 4.5 45 0.8 6 0.1 13 0.2
11+
2010 2,875 87.8 264 8.1 98 3.0 28 0.9 9 0.3 12 0.4
2011 1,825 89.2 153 7.5 58 2.8 10 0.5 * * * *
Total 4,700 88.3 417 7.8 156 2.9 38 0.7 9 0.2 16 0.3 *Numbers less than five have been suppressed
Table 5: Type and amount of safety equipment installed in households receiving the intervention by year.
Equipment type Year Items received
0 1 2 Unknown n % n % n % n %
Safety Gates 2010 992 30.2 747 22.7 1,543 47.0 * *
2011 622 30.3 570 27.8 850 41.5 8 0.4
Total 1,614 30.2 1,317 24.7 2,393 44.8 12 0.2
Window Restrictors 2010 2,433 74.0 382 11.6 467 14.2 * *
2011 1,614 78.7 251 12.2 429 20.9 7 0.3
Total 4,047 75.8 633 11.9 896 16.8 11 0.2
Bath/Shower Mats 2010 444 13.5 2,832 86.2 5 0.2 * *
2011 1,614 78.7 251 12.2 178 8.9 7 0.3
Total 2,058 38.6 3,083 57.8 183 3.4 11 0.2
Fireguards 2010 2,359 71.8 910 27.7 11 0.3 6 0.2
2011 1,654 80.7 387 18.9 * * 6 0.3
Total 4,013 75.2 1,297 24.3 14 0.3 12 0.2
Continued overleaf...

Safe and Sound project Evaluation |March 2012
60
Cupboard Locks 2010 1,203 36.6 1,097 33.4 981 29.9 5 0.2
2011 907 44.2 614 30.0 522 25.5 7 0.3
Total 2,110 39.5 1,711 32.1 1,503 28.2 12 0.2
Corner Cushions (packs)
2010 1,123 34.2 1,260 38.3 449 13.7 5 0.2
2011 831 40.5 464 22.6 747 36.4 8 0.4
Total 1,954 36.6 1,724 32.3 1,196 22.4 13 0.2 *Numbers less than five have been suppressed
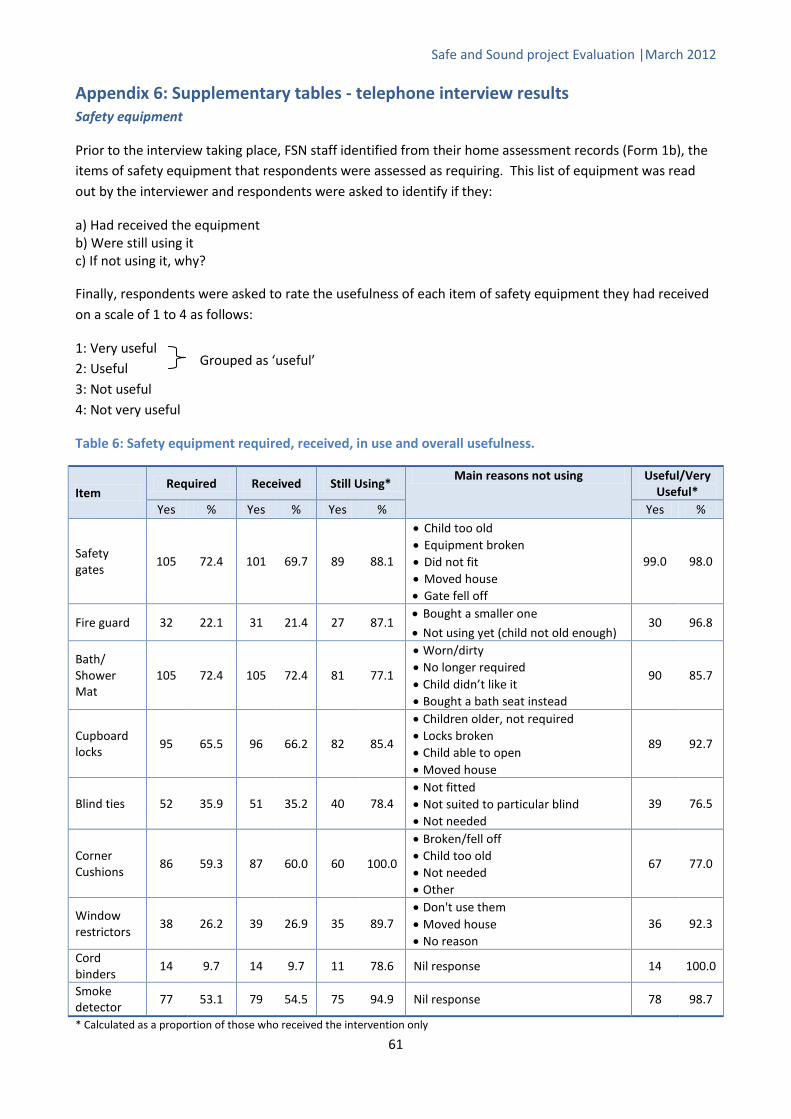
Safe and Sound project Evaluation |March 2012
61
Appendix 6: Supplementary tables - telephone interview results Safety equipment
Prior to the interview taking place, FSN staff identified from their home assessment records (Form 1b), the items of safety equipment that respondents were assessed as requiring. This list of equipment was read out by the interviewer and respondents were asked to identify if they:
a) Had received the equipment b) Were still using it c) If not using it, why?
Finally, respondents were asked to rate the usefulness of each item of safety equipment they had received on a scale of 1 to 4 as follows:
1: Very useful 2: Useful 3: Not useful 4: Not very useful
Table 6: Safety equipment required, received, in use and overall usefulness.
Item Required Received Still Using*
Main reasons not using Useful/Very Useful*
Yes % Yes % Yes % Yes %
Safety gates
105 72.4 101 69.7 89 88.1
• Child too old • Equipment broken • Did not fit • Moved house • Gate fell off
99.0 98.0
Fire guard 32 22.1 31 21.4 27 87.1 • Bought a smaller one
• Not using yet (child not old enough) 30 96.8
Bath/ Shower Mat
105 72.4 105 72.4 81 77.1
• Worn/dirty • No longer required • Child didn’t like it • Bought a bath seat instead
90 85.7
Cupboard locks
95 65.5 96 66.2 82 85.4
• Children older, not required • Locks broken • Child able to open • Moved house
89 92.7
Blind ties 52 35.9 51 35.2 40 78.4 • Not fitted • Not suited to particular blind • Not needed
39 76.5
Corner Cushions
86 59.3 87 60.0 60 100.0
• Broken/fell off • Child too old • Not needed • Other
67 77.0
Window restrictors
38 26.2 39 26.9 35 89.7 • Don't use them • Moved house • No reason
36 92.3
Cord binders
14 9.7 14 9.7 11 78.6 Nil response 14 100.0
Smoke detector
77 53.1 79 54.5 75 94.9 Nil response 78 98.7
* Calculated as a proportion of those who received the intervention only
Grouped as ‘useful’

Safe and Sound project Evaluation |March 2012
62
Table 7: Additional items of equipment received, use and overall usefulness.
Item Received Still Using* Useful/Very
Useful* Yes % Yes % Yes %
Plug socket covers 4 33.3 4 100 4 100 Carbon Monoxide detector 3 25.0 3 100 2 66.6 Fridge lock 1 8.3 1 100 1 100 Additional smoke alarm 1 8.3 1 100 1 100
Respondents were asked to rate a series of six statements in relation to the service they had received on a scale of 1 to 4, with 1 being ‘very satisfied’ and 4 being ‘not very satisfied’. For the purpose of this analysis, responses 1 and 2 (satisfied/very satisfied) have been grouped.
Table 8: Satisfaction with the service received.
Statement Satisfied/Very Satisfied*
Yes %
How friendly staff were 141 97.2
How professional staff were 139 95.9 The quality of verbal advice and guidance provided to you 140 96.6
The explanation you received about the equipment being offered to you 142 97.9
Staff response to your questions or queries 139 95.9 The overall service you received 140 96.6
Table 9: Would you contact the project again if you needed to?
Response Yes % Main reason why not
Would contact project again 140 96.6
• No more children, will not require service
• Wants to leave it for lower income families who need the service more than them
• Did until safety gate came off
• Failed to continue survey
Table 10: Have you recommended the project to someone else? If no, would you recommend the project to someone else?
Response Yes % Have you recommended the project 108 74.5 Would you recommend the project 32 86.5* * of those who said no
Table 11: Is there anything we could improve about the project?
Response n %
No/Satisfied with current service 106 73.0 Provide additional/alternative equipment 23 15.9 Better advertisement 7 4.8 Other/no answer 6 4.1 Provide a follow up service 2 1.4 Better explanation on how to fit equipment e.g. cord blind ties 1 0.7
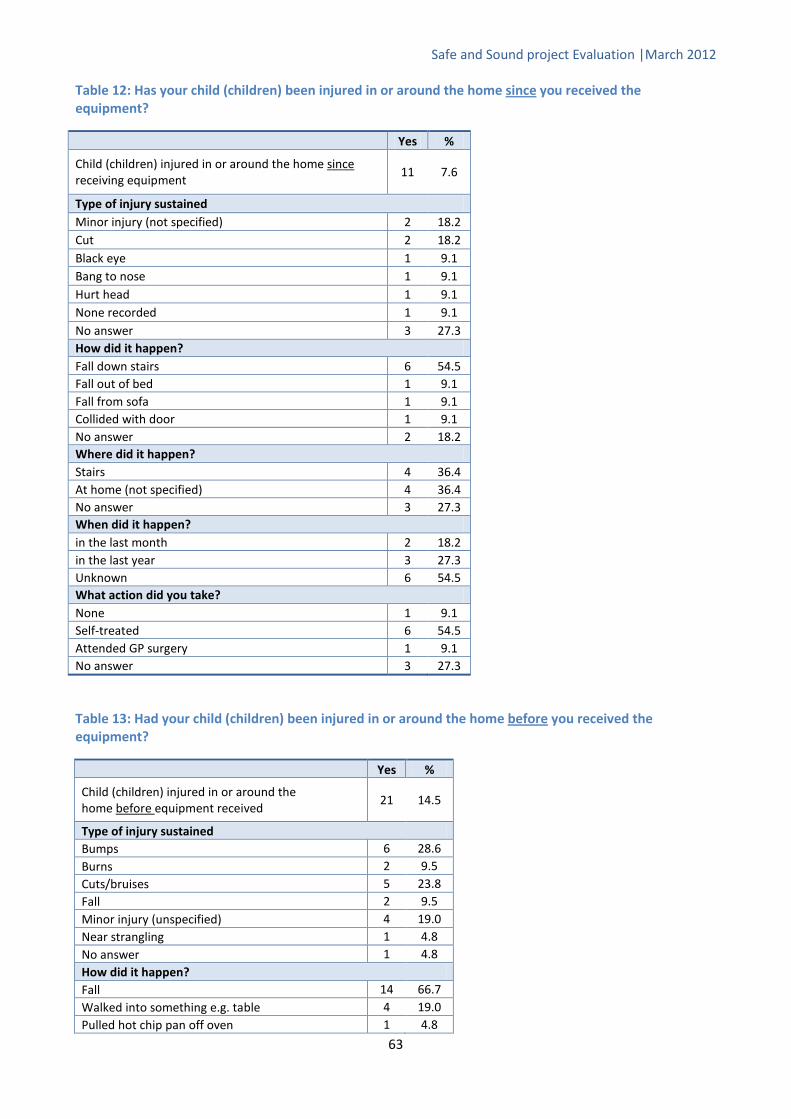
Safe and Sound project Evaluation |March 2012
63
Table 12: Has your child (children) been injured in or around the home since
you received the equipment?
Yes %
Child (children) injured in or around the home since11
receiving equipment
7.6
Type of injury sustained Minor injury (not specified) 2 18.2 Cut 2 18.2 Black eye 1 9.1 Bang to nose 1 9.1 Hurt head 1 9.1 None recorded 1 9.1 No answer 3 27.3 How did it happen? Fall down stairs 6 54.5 Fall out of bed 1 9.1 Fall from sofa 1 9.1 Collided with door 1 9.1 No answer 2 18.2 Where did it happen? Stairs 4 36.4 At home (not specified) 4 36.4 No answer 3 27.3 When did it happen? in the last month 2 18.2 in the last year 3 27.3 Unknown 6 54.5 What action did you take? None 1 9.1 Self-treated 6 54.5 Attended GP surgery 1 9.1 No answer 3 27.3
Table 13: Had your child (children) been injured in or around the home before
you received the equipment?
Yes %
Child (children) injured in or around the home before
21 equipment received
14.5
Type of injury sustained Bumps 6 28.6 Burns 2 9.5 Cuts/bruises 5 23.8 Fall 2 9.5 Minor injury (unspecified) 4 19.0 Near strangling 1 4.8 No answer 1 4.8 How did it happen? Fall 14 66.7 Walked into something e.g. table 4 19.0 Pulled hot chip pan off oven 1 4.8
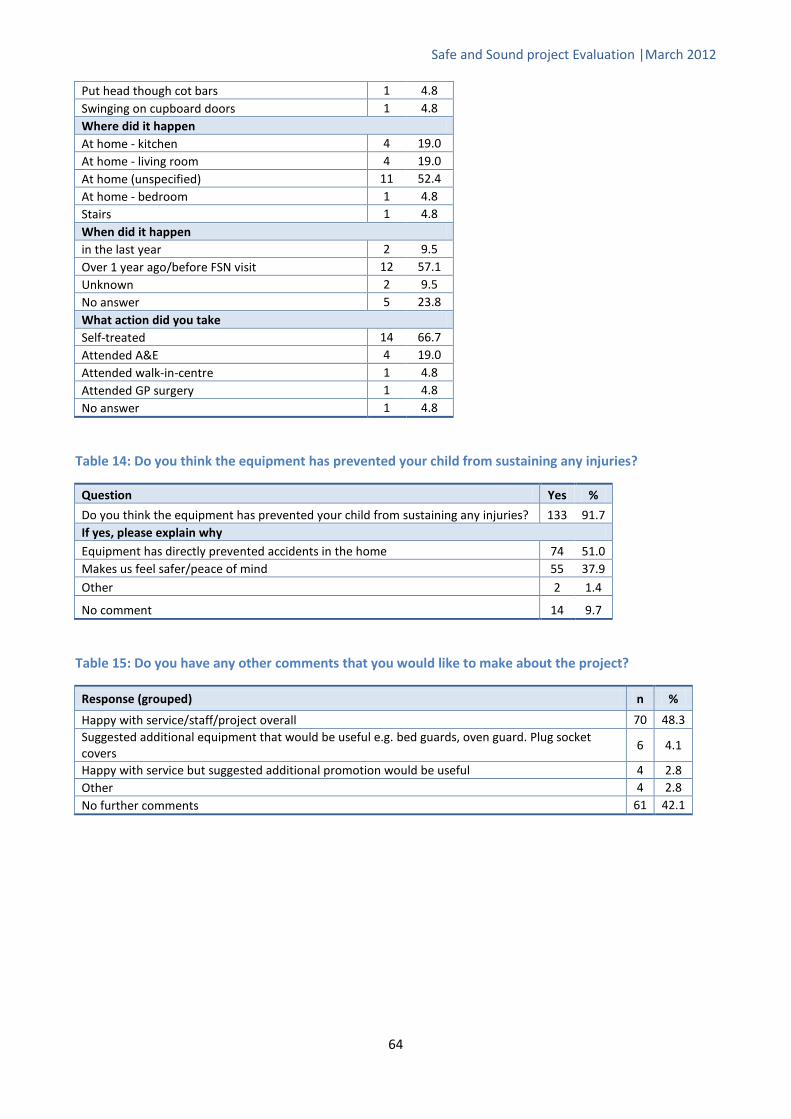
Safe and Sound project Evaluation |March 2012
64
Table 14: Do you think the equipment has prevented your child from sustaining any injuries?
Question Yes %
Do you think the equipment has prevented your child from sustaining any injuries? 133 91.7 If yes, please explain why Equipment has directly prevented accidents in the home 74 51.0 Makes us feel safer/peace of mind 55 37.9 Other 2 1.4
No comment 14 9.7
Table 15: Do you have any other comments that you would like to make about the project?
Response (grouped) n %
Happy with service/staff/project overall 70 48.3 Suggested additional equipment that would be useful e.g. bed guards, oven guard. Plug socket covers
6 4.1
Happy with service but suggested additional promotion would be useful 4 2.8 Other 4 2.8 No further comments 61 42.1
Put head though cot bars 1 4.8 Swinging on cupboard doors 1 4.8 Where did it happen At home - kitchen 4 19.0 At home - living room 4 19.0 At home (unspecified) 11 52.4 At home - bedroom 1 4.8 Stairs 1 4.8 When did it happen in the last year 2 9.5 Over 1 year ago/before FSN visit 12 57.1 Unknown 2 9.5 No answer 5 23.8 What action did you take Self-treated 14 66.7 Attended A&E 4 19.0 Attended walk-in-centre 1 4.8 Attended GP surgery 1 4.8 No answer 1 4.8
Safe and Sound project Evaluation |March 2012
65
7. References 1 Trauma and Injury Intelligence Group, 2011. www.tiig.info 2 Lyons R, Sander L, Weightman A, Patterson J, Jones SK, Rolfe B, et al. Modification of the home environment for the reduction of injuries. Cochrane Database Syst Rev 2003;4:CD003600. 3 Wood S et al. Childhood injuries. A review of the evidence for prevention. Centre for Public Health, Liverpool John Moores University, 2010. 4 Pearson M, Garside R, Moxham T, Anderson R. Preventing unintentional injuries to children in the home: a systematic review of the effectiveness of programmes supplying and/or installing home safety equipment. Health Promotion International 2010;26 (3):376-92. 5 HES online. External cause 2010-11. Available from www.hesonline.nhs.uk, accessed 10th July 2011. 6 Office for National Statistics. Mortality Statistics: Deaths registered in England and Wales (Series DR), 2010. Available from www.ons.gov.uk/ons/publications/re-reference-tables.html?edition=tcm%3A77-230730, accessed 10th January 2012. 7 Audit Commission. Better safe than sorry. Preventing unintentional injury to children. London, Audit Commission, 2007. 8 National SAFE KIDS Campaign, Childhood Injury Fact Sheet. Washington, NSKC, 2004. 9 Peden M et al. World report on child injury prevention. Geneva: World Health Organization, 2008. 10 Information Statistics Division. Unintentional injuries. Available from www.isdscotland.org, accessed 8th July 2011. 11 Edwards P et al. Serious injuries in children: variation by area deprivation and settlement type. Archives of Disease in Childhood, 2008, 93:485-489. 12 Petrou S et al. Social class inequalities in childhood mortality and morbidity in an English population. Paediatric and Perinatal Epidemiology, 2006, 20:14-23. 13 National Institute for Health and Clinical Excellence. Strategies to prevent unintentional injuries among children and young people aged under 15. London, NICE, 2010. 14 Department for Children, Schools and Families. Staying Safe Action Plan. Nottingham, DCSF Publications, 2008. 15 The Royal Society for the Prevention of Accidents. Accidents to children. Available from www.rospa.com/homesafety/adviceandinformation/childsafety/accidents-to-children.aspx#why, accessed 13th February 2012. 16 Department for Children, Schools and Families. Accident prevention amongst children and young people. A priority review. London, DSCF, 2009. 17 Errington G et al. Evaluation of the National Safe at Home Scheme: Final Report for the Royal Society for the Prevention of Accidents. University of Nottingham, 2011. 18 National Institute for Health and Clinical Excellence. Preventing unintentional injuries in the home among children and young people aged under 15: home safety assessments and providing safety equipment. London, NICE, 2010. 19 National Institute for Health and Clinical Excellence. Preventing unintentional injuries among children and young people aged under 15: road design and modification. London, NICE, 2010. 20 Carman J, Friedman E, Lamb D, Lennon K. Evaluating the impact of a child injury prevention project. Community Practitioner 2006; 79,6:188-192. 21 Towner E, Doswell T, Mackereth C, Jarvis S. What works in preventing unintentional injuries in children and young adolescents? An updated systematic review. London: Health Development Agency, 2001. 22 DiGuiseppi C, Roberts IG. Individual-level injury prevention strategies in the clinical setting. Future Child 2000;10:53-82. 23 DiGuiseppi C, Higgins JP. Systematic review of controlled trials of interventions to promote smoke alarms. Arch Dis Child 2000;82:341-8. 24 Watson M, Kendrick D, Coupland C, Woods A, Futers D, Robinson J. Providing child safety equipment to prevent injuries: randomised controlled trial. British Medical Journal Online 2004; doi:10.1136/bmj.38309.66444.8F. 25 Sznajder M, Leduc S, Janvrin MP, Bonnin MH, Aegerter P, Baudier F, Chevallier B. Home delivery of an injury prevention kit for children in four French cities: a controlled randomized trial. Injury Prevention 2003;9:261-265. 26 Brussoni M, Towner E, Hayes M. Evidence into practice: combining the art and science of injury prevention. Injury Prevention 2006;12:373-7. In: Ingram JC, Deave T, Towner E, Errington G, Kay B, Kendrick D. Identifying facilitators and barriers for home injury prevention interventions for pre-school children: a systematic review of the quantitative literature. Health Education Research 2011; doi:10.1093/her/cyr066. 27Roen K, Arai L, Roberts H et al. Extending systematic reviews to include evidence on implementation: methodological work on a review of community-based initiatives to prevent injuries. Soc Sci Med 2006; 63: 1060-71. In: Ingram JC, Deave T, Towner E, Errington G, Kay B, Kendrick D. Identifying facilitators and barriers for home injury prevention

Safe and Sound project Evaluation |March 2012
66
interventions for pre-school children: a systematic review of the quantitative literature. Health Education Research 2011; doi:10.1093/her/cyr066. 28 Smithson J, Garside R, Pearson M. Barriers to, and facilitators of, the prevention of unintentional injury in children in the home: a systematic review and synthesis of qualitative research. Injury Prevention 2011; 17:119-26. 29 Ingram JC, Deave T, Towner E, Errington G, Kay B, Kendrick D. Identifying facilitators and barriers for home injury prevention interventions for pre-school children: a systematic review of the quantitative literature. Health Education Research 2011; doi:10.1093/her/cyr066.

AUTHORS: Alyson Jones, Zara Quigg, Nicola Davenport, Olivia Sharples, Clare Perkins.
Centre for Public Health Research Directorate Faculty of Health and Applied Social Sciences Liverpool John Moores University 2nd Floor, Henry Cotton Campus 15-21 Webster Street Liverpool L3 2ET Tel: +44 (0) 151 231 4535 Fax: +44 (0) 151 231 4552 Email: [email protected] www.cph.org.uk Published: March 2012 ISBN: 978-1-908929-03-7 (web version)