Embed Size (px)
Citation preview

W&M ScholarWorks W&M ScholarWorks
Dissertations, Theses, and Masters Projects Theses, Dissertations, & Master Projects
2014
An Evaluation of a Reduced Bar Spacing Turtle Excluder Device in An Evaluation of a Reduced Bar Spacing Turtle Excluder Device in
the U.S Gulf of Mexico offshore Shrimp Trawl Fishery the U.S Gulf of Mexico offshore Shrimp Trawl Fishery
Michel Anthony Nalovic College of William and Mary - Virginia Institute of Marine Science
Follow this and additional works at: https://scholarworks.wm.edu/etd
Part of the Fresh Water Studies Commons, Ocean Engineering Commons, and the Oceanography
Commons
Recommended Citation Recommended Citation Nalovic, Michel Anthony, "An Evaluation of a Reduced Bar Spacing Turtle Excluder Device in the U.S Gulf of Mexico offshore Shrimp Trawl Fishery" (2014). Dissertations, Theses, and Masters Projects. Paper 1539617946. https://dx.doi.org/doi:10.25773/v5-c71k-dh86
This Thesis is brought to you for free and open access by the Theses, Dissertations, & Master Projects at W&M ScholarWorks. It has been accepted for inclusion in Dissertations, Theses, and Masters Projects by an authorized administrator of W&M ScholarWorks. For more information, please contact [email protected].

An Evaluation of a Reduced bar Spacing Turtle Excluder Device
in the U.S. Gulf of Mexico Offshore Shrimp Trawl Fishery
A Thesis
Presented to
The Faculty of the School of Marine Science
The College of William and Mary in Virginia
In Partial Fulfillment
of the Requirements for the Degree of
Master of Science
by
Michel Anthony Nalovic
2014

ProQuest Number: 10632113
All rights reserved
INFORMATION TO ALL USERS The qua lity o f this rep roduc tion is d e p e n d e n t upon th e qua lity o f the co p y subm itted.
In the unlikely e ve n t th a t the au thor d id no t send a c o m p le te m anuscript and the re are missing pages, these will be no ted . Also, if m ateria l had to be rem oved,
a no te will in d ica te the de le tion .
uestProQuest 10632113
Published by ProQuest LLC (2017). C opyrigh t o f th e Dissertation is held by the Author.
All rights reserved.This work is p ro te c te d aga inst unauthorized copy ing under Title 17, United States C o d e
M icroform Edition © ProQuest LLC.
ProQuest LLC.789 East Eisenhower Parkway
P.O. Box 1346 Ann Arbor, Ml 48106 - 1346

APPROVAL SHEET
This thesis is submitted in partial fulfillment of the requirements for the degree of
Master of Science
Michel A. Nalovic
Approved, by the Committee, July 2014
oy W. Hartley, Ph.D. / Co-Advisor
John E. Graves, Ph.D. v - ' Co-Advisor
ohn M. Brubaker Ph.D.
David Rudders, Ph.D.
in F. Mitchell, M.S.National nic and Atmospheric Administration,
Pascagoula, MS.

TABLE OF CONTENTS
Page
ACKNOWLEDGMENTS................................................................................................................................... iv
LIST OF TABLES................................................................................................................................................. v
LIST OF FIGURES.............................................................................................................................................vii
ABSTRACT.......................................................................................................................................................... ix
CHAPTER 1: INTRODUCTION AND LITERATURE REVIEW......................................................................1
CHAPTER 2: MATERIALS AND METHODS............................................................................................... 30
CHAPTER 3: 2012 GEAR COMPARISONS................................................................................................ 41
CHAPTER 4: 2013 GEAR COMPARISONS................................................................................................59
CHAPTER 5: CONCLUSIONS AND RECOMMENDATIONS.................................................................... 70
APPENDIX - LIST OF ACRONYMS.......................................................................................................... ....73
TABLES.............................................................................................................................................................. 74
FIGURES..........................................................................................................................................................107
LITERATURE CITED......................................................................................................................................132

ACKNOWLEDGMENTS
I wish to acknowledge my friends Captains Boone, Cordosa, Brown, and Gazzier for
hosting me graciously on their trawlers. I wish to extend thanks to my co-advisors Troy
Hartley and John Graves, for their guidance and support, as well as financial assistance,
during my time at VIMS. I would like to thank the other members of my committee, Dave
Rudders for his help in developing the statistical approach, John Brubaker for following me
through this endeavor and John Mitchell for introducing me to the Collaborative Research in
Fisheries Science Fellowship and for providing technical and research support.
A great debt of gratitude is owed to the many people working in shrimp fisheries
who helped me complete this project. Special thanks to Gary Graham, Russel Steiner, Ernie
Anderson, Lisa Liguori, Joe Cope, Wes Hudson, Josh Stone, Brendan Turley, Annie Murphy,
Sunkita Howard, Willy Goldsmith, Mark Startton, Brandon Conroy, Lidia Bienlien, Lucia Safi,
Randy Jones, Jess Lisa, Carissa Gervasi, Ann Arfken, Cassandra Glaspie, Daniel Kaufman,
Danielle McChulloch, Kristene Parsons, G Sweetman, Lela Schlenker, Ryan Schloesser and
Katie Mcmillan.
I want to thank the institutions NOAA Harvesting Systems Branch and Galveston lab,
Gulf and South Fisheries Foundation, University of Georgia Marine Extension Service,
Alabama Seafood Alliance, Virginia Sea Grant. I would like to thank all the VIMS ground
staff, Grace Tisdale, Paul Nichols, Louise, Debbie Galvez and Susan Parks.
Finally I want to recognize and dedicate this work to my mother Diana Evangelista,
my aunt Clair Evangelist and my father Ljubisa Nalovic, my sister Katarina Lequex-Nalovic
and my brother Thomas Nalovic for always nourishing and encouraging my love for the
ocean and its creatures.

LIST OF TABLES
Page
Table 1. Correlation Between Variables..................................................................................................75
Table 2. Dates and Locations of the 2012 Gear Comparison Cruises...............................................76
Table 3. Technical Characteristics of Fishing Vessels and Trawls Used in the 2012 TTED versus
TED Comparisons...........................................................................................................................................77
Cruises occurred off Georgia (GA) in the U.S. South Atlantic Bight and off Texas (TX) and
Mississippi (MS) in the Gulf of Mexico.................................................................................................... 77
Table 4. Tow Characteristics of the 2012 TTED versus TED Comparisons.....................................78
GA refers to the cruise from Georgia, TX refers to the cruise from Texas, MS refers to the
cruise from Mississippi, GOM refers to the Gulf of Mexico.............................................................. 78
Table 5. Total Catch Weights and CPUEs by Cruise............................................................................. 79
Table 6. Shrimp Weights and CPUEs by Cruise..................................................................................... 80
Table 7. Shrimp Weight CPUE T-test by Cruise..................................................................................... 81
Table 8. Species Catch Weights and CPUEs for the Georgia Cruise................................................ 82
Table 9. Species Catch Weights and CPUEs for the Texas Cruise....................................................83
Table 10. Species Catch Weights and CPUEs for the Mississippi Cruise.......................................84
Table 11. Species Catch Numbers (Counts) and CPUEs for the Georgia Cruise................. 85
Table 12. Species Catch Numbers (Counts) and CPUEs for the Texas Cruise..................... 86
Table 13. Species Catch Numbers (Counts) and CPUEs for the Mississippi Cruise........... 87
Table 14. Species Weight CPUE t-test for the Georgia Cruise.......................................................... 88
Table 15. Species Weight CPUE f-test for the Texas Cruise...............................................................89
v

Table 16. Species Weight CPUE t-test for the Mississippi Cruise.....................................................90
Table 17. Species Number (Count) CPUE t-test for the Georgia Cruise......................................... 91
Table 18. Species Number (Count) CPUE t-test for the Texas Cruise............................................. 92
Table 19. Species Number (Count) CPUE t-test for the Mississippi Cruise....................................93
Table 20. Small Fish Weights and CPUEs by Cruise..............................................................................94
Table 21. Small Fish Weight CPUE t-test by Cruise.............................................................................. 95
Table 22. GLMM Specifications for Shark spp. and Red Snapper Relative Capture Efficiency at
Length (TTED versus TED)............................................................................................................................96
Table 23. GLMM Specifications for Relative Capture Efficiency (TTED versus TED) of Numbers
of Individuals by Species..............................................................................................................................97
Table 24. GLMM Results Using Length (unpooled) Data From Catch............................................98
Table 25. Generalized Linear Mixed Model for Lizardfishes............................................................. 99
Table 26. GLMM Results Using Count (unpooled) Data From Catch (intercept only model).
100
Table 27. GLM Results Using Count (unpooled) Data From Catch (intercept only model).
(page 1 0 2 ) .....................................................................................................................................................101
Table 29. Catches of Rare Species.......................................................................................................... 104
Table 30. Summary of 2013 Sampling Cruises.................................................................................... 105
Table 31. Summary of 2013 Field Observations: TTED v. TED Catch Performance.................. 106
LIST OF FIGURES
Page
Figure 1. Gulf of Mexico Offshore Shrimp Trawling Effort and Landings (1960-2011)............108
Figure 2. Gulf of Mexico Offshore Shrimp Trawling CPUE (1960-2011)...................................... 109
Figure 3. Typical Gear Configurations for Vessels Participating in the Southeastern Offshore
Shrimp Fishery..............................................................................................................................................110
Figure 4. Catch and Bycatch Composition of the Gulf of Mexico Offshore Shrimp Fishery. .111
Figure 5. Typical Flat Net Trawl Gear Configuration for a Gulf of Mexico Shrimp Trawler. ..112
Figure 6. Diagram of a Turtle Excluder Device (TED).........................................................................113
Figure 7. Profile View of Super-Shooter TED Grid..............................................................................114
Figure 8. Trash and Turtle Excluder Device (TTED) Front V iew ...................................................... 115
Figure 9. 2012 Gear Comparisons Sampling Stations of the Southeast Atlantic Bight and Gulf
of Mexico....................................................................................................................................................... 116
Figure 10. Relative Carcharhinid Catch at Length in the TTED versus TED (All Trips
Combined)..................................................................................................................................................... 117
Figure 11 Relative Gulf Smoothhound Catch at Length in the TTED versus TED (All Trips
Combined)..................................................................................................................................................... 118
Figure 12. TX Lizardfishes Relative Capture Efficiency (TTED versus TED).................................119
Figure 13. MS Large Sea Robins Relative Capture Efficiency (TTED versus TED).......................120
Figure 14. TX Large Sea Trouts Relative Capture Efficiency (TTED versus TED).........................121
Figure 15. MS Large Crabs (Rooster Crab and Blue Crab species) Relative Capture Efficiency
(TTED versus TED)....................................................................................................................................... 122

Figure 16. TX and MS Atlantic Sharpnose Shark Relative Capture Efficiency (TTED versus
TED)................................................................................................................................................................. 123
Figure 17. GA Bonnethead Shark Relative Capture Efficiency (TTED versus TED)...................124
Figure 18. GA, TX, and MS Rays and Skates group Relative Capture Efficiency (TTED versus
TED)................................................................................................................................................................. 125
Figure 19. TX Blackear Bass Relative Capture Efficiency (TTED versus TED)...............................126
Figure 20. TX Vermillion Snapper Relative Capture Efficiency (TTED versus TED)....................127
Figure 21. MS Whitings Relative Capture Efficiency (TTED versus TED)...................................... 128
Figure 22. Plot of Grouped Small Fish Catch Weight (For All Cruises)..........................................129
Figure 23. Shrimp Catch Weight for All Cruises Relative Capture Efficiency (TTED versus TED).
.......................................................................................................................................................................... 130
Figure 24. Simulated Lizardfishes Relative Capture Efficiency (TTED versus TED) When Tows
with Zero Counts Data from the TTED or TED were removed........................................................131

ABSTRACT
Shrimp are the most economically valuable internationally-traded seafood commodity, and
wild-caught, trawled shrimp make up almost half of the ~6.6 million metric tons of annual
global production. Shrimp trawling is responsible for one-third of the world's total fisheries
bycatch, leading many to consider shrimp trawling to be the single most destructive fishing
practice in the world. Though the bycatch of large marine animals can be significantly
reduced by use of turtle excluder devices (TEDs) on shrimp trawls, current TED designs are
ineffective at reducing the capture of smaller organisms which represent a large portion of
the total bycatch. To further reduce bycatch in the United States Gulf of Mexico shrimp
trawl fleet, a variety of bycatch reduction devices (BRDs) are currently being used in
conjunction with TEDs. I evaluated the efficiency of a new TED design, intended to reduce
bycatch and maintain target shrimp catch. The new TED model is characterized by 5-cm
spacing between flat bars, as opposed to the current industry standard of 10-cm spacing
between round bars. Comparative towing experiments under standard commercial shrimp
trawling operations in waters off of Georgia, Texas and Mississippi during the summer of
2012 demonstrated shrimp losses or gains of -4.32%, +6.07%, -1.58% respectively and an
overall reduction in the capture weight of sharks (41.1-99.9%), rays and skates (76.5-93.4%)
and horseshoe crabs (100%). These experiments were limited in time and space, and
therefore not fully representative of fishing conditions throughout the year, but this study
demonstrates the new TED's effect on the catch rates of target shrimp and bycatch. This
thesis research should lead to a broader understanding of the benefits of using reduced
spacing flat bar TEDs in the U.S. shrimp trawl industry.

CHAPTER 1: INTRODUCTION AND LITERATURE REVIEW
The modern otter trawl was first used in England or Ireland around 1860 to capture
groundfish (Kennelly et al. 2002). Shrimp trawls (STs), a form of otter trawl, were first
developed on the southeast coast of the United States near St. Augustine, Florida in 1906 by
Solicito "Mike" Salvador, an Italian immigrant (FAO 2008). Prior to the introduction of otter
trawls, the U.S. shrimp fishery was seasonal and near shore, and the fishing techniques were
limited to the use of haul seines, cast nets, dip nets and baited traps (Rathbun 1882; Hoar et al.
1992). Over the next three decades there were several developments to STs and the technology
spread throughout the United States and adjacent waters including Mexico and South America
(Iverson et al. 1993; FAO 2008). The use of STs later migrated across the Atlantic to western
Africa in the 1960s (Menard et al. 2002; Chavance 2002) and are now deployed worldwide
(Broadhurst 2000), particularly throughout tropical regions (Vendeville 1990).
At present, STs are responsible for an estimated annual global shrimp catch of 3.1
million metric tons (MMT) (FAO 2011; Asche et al. 2012). When combined with the estimated
annual production of 3.5 M M T from aquaculture, shrimp are the most economically valuable
internationally-traded seafood commodity, accounting for 17 percent of the total value of
traded fishery products (FAO, 2008). U.S. shrimp production amounts to 100 thousand metric
tons (KMT) (Mukherjee et al. 2011; Voorhees et al. 2011). With imports of an additional 500
KMT, the United States is the largest consumer and importer nation of shrimp in the world
(Anderson 2003; FAO 2008). In 2010, annual U.S. consumption of shrimp was 4 pounds (1.8kg)
per capita, compared to 2.7 pounds (1.2kg) of canned tuna and 5.0 pounds (2.3kg) of fillets and
steaks of aggregated fish species (Asche et al. 2012). From 2005-2009, 80% of the total shrimp
landings in the United States were from the Gulf of Mexico (GOM) (Mukherjee et al. 2011;
1

Voorhees et al. 2011) and 1% from the southeast Atlantic (~9KMT) (Voorhees et al. 2011). The
remaining 13% of total landings were attributed to Northern Shrimp Pandolus borealis and
Ocean Pink Shrimp Pandalus jordani that occur in the cold waters of the North Atlantic and
North Pacific, respectively. The GOM ST fishery targets Brown Shrimp Farfantepenaeus aztecus,
White Shrimp Litopenaeus setiferus, and Pink Shrimp Farfantepenaeus duorarum. In 2010, the
GOM shrimp production was led by Texas (34.97 KMT), followed closely by Louisiana (33.66
KMT), the west coast of Florida (4.99 KMT), Alabama (4.54 KMT), and Mississippi (1.86 KMT)
(Voorhees et al. 2011). The ST fishery operates year round in the GOM, with highest effort
occurring May through December (Nance 1993a). The U.S. ST fishery can be separated into two
components with the majority of boats today belonging to the inshore component and the
remaining to the offshore segment. My thesis research focused on the offshore GOM ST fishery
(OGSF) consisting of a variety of shrimp species that varied by geographic location. The majority
of Brown Shrimp catch from offshore waters occurs primarily off the coasts of Texas and
Louisiana in depths between 36.5-73 m (NMFS, 1999). White Shrimp are typically caught in
waters of about 18 m in the same areas. Pink Shrimp are caught in waters of about 64 m,
predominately off southwestern Florida in the winter months.
State agencies manage their respective fisheries that occur within each state's territorial waters.
Federal agencies manage waters starting at the edge of each state's territorial waters out to 200
nautical miles limit of the exclusive economic zone (EEZ) (NMFS 2007a). Under the Magnuson
Stevens Fishery Conservation and Management Act (MSA), eight regional management councils
are given the authority to manage federal fisheries in the EEZ. The Gulf of Mexico Fishery
Management Council (GMFMC), the South Atlantic Fishery Management Council (SAFMC), and
the corresponding states manage the GOM and the South Atlantic Bight (SAB) ST fisheries.
2

The U.S. ST fishery was an open access fishery with historical estimates of up to 20,000
vessels actively capturing shrimp in state and federal waters (NMFS, 1998). No total allowable
catch (TAC) is set on the exploited shrimp species because landings vary mostly as a response to
environmental conditions and shrimp life history that includes short life spans (~1 year) (Nance
1993 a,b). Since December 2002, U.S. vessels have been required to apply for an annual federal
shrimp permit. In 2006 the GMFMC created an Ad Hoc Shrimp Effort Working Group (SEWG) to
explore possible effort targets for the ST fishery of the GOM EEZ (Nance et al. 2008). The SEWG
was directed by the GMFMC to determine the minimum level of fishing effort necessary to
achieve maximum sustainable yield (MSY); and further, the level of fishing effort that would
produce the maximum economic yield (MEY), defined as the level of landings that would
maximize profits to the harvest sector (Nance et al. 2008). This distinction between MSY and
MEY is important since MSY and associated cost of effort at MSY (Emsy) may not represent the
level of effort needed to maximize profits to the fishery.
The economic impact and value of the U.S. ST industry is reflected by the nickname
"pink gold" as shrimp were called in the mid-1990s when U.S. ST fishery profitability peaked.
Diamond (2000) reported that the U.S. ST fisheries of the GOM and the South Atlantic Bight
(SAB) were the most valuable fisheries in the southeastern U.S., generating landings worth
about $500 million annually (NMFS 2003a).
Fishing effort for the GOM ST fishery is reported as number of "days fished", and is
calculated as the number of 24-hour days that a vessel actually fishes (Nance et al. 2008). For
example, if a vessel fished 11 hours one day, 13 hours the next day and 10 hours the third day,
the fished days would be 1.4 [i.e., (llhr+13hr+10hr)/24hr=1.4 days]. ST fishing effort in the
GOM increased markedly in 1976, and remained uniformly high (200,000 nominal days fished
per year) through 2002 (Gallaway et al. 2003). A downward trend began in 2002, and continued
3

through 2005 (Nance et al. 2008), with effort reaching a 40-year low of 63,075 nominal days
fished in 2008 (Figure 1; Nance, personal communication). In 2005 the GMFMC acknowledged
the serious economic problems faced by the U.S. shrimping industry in the northern GOM EEZ.
To limit entry into the overcapitalized fleet, a temporary moratorium on new entries into the
OGSF was proposed by the GMFMC in 2005 and approved by the U.S. Secretary of Commerce in
September 2006 (Nance et al. 2010).
In 2008 the U.S. GOM ST fishery was still in a pronounced economic decline and the
methods used by the fleet to deal with low shrimp prices and high fuel costs varied considerably
(Nance et al. 2008). To minimize costs, in some instances, vessel insurance policies were not
renewed, crew shares were reduced, the number of trips taken was reduced, the duration of
trips and the distances traveled to fishing grounds were reduced, and maintenance was
deferred (Nance et al. 2008). Hart (2008) stated that "the reduced catches of the Tortugas Pink
Shrimp fishery in recent years was purely economical, resulting from reduced fishing effort,
attributed to the financial hardships currently experienced throughout the GOM commercial
shrimp fishery".
The U.S. ST fishery decline resulted from a combination of lower prices for imported
shrimp product and higher operating costs, most notably increasing fuel costs (Nance et al.
2008; Hart 2008). Competition with aquaculture shrimp placed downward pressure on the wild-
caught shrimp prices. With wild shrimp from the GOM comprising only 14% of the domestic
shrimp market, imports of farm raised shrimp from Thailand, China, Vietnam and South America
have heavily impacted U.S. shrimp markets (Haby et al. 2003). In 2002 specifically, competition
was exacerbated when the European Union raised tariffs on imported shrimp from Thailand,
leading to increased exports from Thailand into U.S. markets, and drastic ex-vessel price
reductions for U. S. wild-caught shrimp (Haby et al. 2003). The situation was so severe that in
4

2003 the U.S. government provided emergency disaster relief of $17.5 million to GOM
shrimpers (Diamond 2004).
The reduced ex-vessel price for GOM shrimp was accompanied by increased fuel prices
for STs. This had considerable consequences for the OGSF since the fuel needed to tow the
trawl gear continuously over the seafloor represents a large fraction of operating costs, as
opposed to passive fishing gears such as gill nets, pots, longlines (FAO 2008), which drift in the
current or are stationary. Krampe (2006) reported that the period from 1979 to 1998 was one
of depressed oil prices; then, with global demands increasing from 1998 to 2003, the price of oil
doubled from 15 USD to 30 USD per barrel, and then doubled again to 60 USD by 2005. This
increase of 400% in fuel prices over a 7-year period coincided with the reduced profitability of
the U.S. ST fishery. The results of a MEY sensitivity analysis for the OGSF suggests that for every
$0.25 decrease in the price of shrimp or increase in the price of fuel, the MEY decreases by
between 2.8 and 3.5 million pounds and the associated effort at MSY (Emsy) decreases by
between 5200 and 6400 days fished (Nance et al. 2008).
Environmental disturbances also contributed to the rapid decline of the U.S. GOM ST
industry. Hypoxia, a low oxygen phenomenon that results in a recurring dead zone in the GOM,
can potentially impact shrimp aggregations, production, and size distribution, reducing the
supply of domestic wild-caught shrimp (Nance et al. 2010). In addition to hypoxia, a 2007 report
to the U.S. Congress concluded that hurricanes Katrina (August, 2005), Rita (September, 2005),
and Wilma (October, 2005) caused substantial damages and losses to the harvesting and
processing sectors of the GOM ST industry, which accelerated the reduction in fleet size and
effort (Nance et al. 2010). The observed reductions in effort (Figure 1) coincided with increased
capture per unit effort (CPUE) (Figure 2) for the OGSF (Nance et al. 2008). The increase in CPUE
5

suggested that the shrimp may be available for harvest if shrimpers were financially able to
target them (Hart 2008).
Historically, NMFS has used a virtual population analysis (VPA) model developed by
Nichols (1984) to assess the status of the GOM shrimp stocks. VPA model result indicated that
overfishing was not evident in any of the GOM shrimp stocks from the mid-1980s (Klima et al.,
1990; Nance 1993a) until 2008 (Hart et al. 2010). The NMFS now assesses the GOM Pink Shrimp
stock with Stock Synthesis (SS-3) (Hart 2012 a,b,c), a widely used, peer-reviewed stock
assessment model (Methot 2009; Schirripa et al. 2009; Methot and Wetzel 2013). This new
modeling approach allows for the inclusion of fisheries-independent data into the stock
assessment. Due to the improved output of the SS-3 Pink Shrimp stock assessment in
comparison to VPA output, it was subsequently decided that NMFS should also conduct the
White Shrimp and Brown Shrimp stock assessments using the SS-3 model. The SS-3 model
outputs reveal an increasing spawning biomass and recruitment in recent years for Brown
Shrimp, White Shrimp, and Pink Shrimp, and a decreased trend in fishing mortality (F). Hart et
al. (2012a,b,c) reported that there continues to be no indication that the shrimp stocks of the
GOM are overfished, or that overfishing is occurring.
The vessels and gears used by the OGSF are not homogenous but broad generalizations
can be made about certain gear characteristics used in this fleet. GOM shrimp vessels are
generally larger than 21.3 m, have freezer storage capacity, and are of steel construction (Scott-
Denton et al. 2012). The STs are held open by the drag on large planning surfaces called boards
or doors (Watson et al. 2006), and in this fleet, doors are generally made of wood (Scott-
Denison et al. 2012), with aluminum or steel doors occurring much less frequently (Watson
1999). Primary trawl characteristics (Figure 3) such as headrope length (16.9 m), codend
material (nylon), trawl extension (none), chaffing gear (mesh), and lazy line rigging (elephant
6

ears), are similar throughout the GOM for all target species (Scott-Denton et al. 2012). Typically
the try-net, a small sampling trawl used to test for shrimp abundance in real time (Watson et al.
1999), has a head rope length of 3.66 m (Scott-Denison et al. 2012). Trip length averages (not
days fished per trip) are 13.8 ± 10.7 s.d. days, and average individual tow times are 5.2 hr ± 2.2
s.d. in the GOM (Scott-Denton et al. 2012).
Bycotch
Many authors have defined bycatch and examined its detrimental effects on regional
and global scales (Alverson et al. 1994; Hall 1996, Greenstreet et al. 2000; Hall et al. 2000;
Murawski et al. 2000; NRC 2002; Chuenpagdee et al. 2003; Diamond 2004; Kumar et al. 2006).
Hall et al. (2000) defined bycatch as “the portion of the catch that is discarded at sea dead or
injured to an extent that death is the result". Hall et al. (2005) later redefined bycatch as the
fishing mortality resulting from the catch that is not accounted for in the landed catch. This
definition equates to the discard mortality, a well-publicized consequence of commercial fishing
operations, and represents the focus of the vast majority of the quantitative literature on
bycatch levels. Davies et al. (2009) defined bycatch as catch that is either unused or unmanaged
and noted that in many ST fisheries, much of the catch other than shrimp has traditionally been
considered as bycatch and was usually discarded. Patrick et al. (2013) defined bycatch as fish
that are captured in a fishery but not retained for sale or personal use. Reasons for discarding
catch vary, but some general reasons include: the species is protected by regulation, the fish is
not marketable, lack of storage space onboard the boat, high grading for higher valued species,
or the fisherman's quota has already been reached (Patrick et al. 2013).
In addition to the issue of bycatch fishing mortality are concerns over the more complex
ecological impacts that bycatch motality may have on the trophic structures of communities (De
Groot 1984, Jones 1992, Dayton et al. 1995, Broadhurst 2000). The indirect effects of bycatch
7

may also impact target species population dynamics through changes in predator-prey
relationships which may have economic consequences that are difficult to predict (Hall et al.
2005). Like the majority of trawls, conventional STs are poorly selective fishing gears (Saila
1983; Broadhurst 2000; Diamond 2004) and as a result, many authors have addressed the
detrimental effects of trawling in terms of a reduction in biodiversity, shifts in community
structure, disruption of the food web, waste, user conflicts, and mortality of undersized target
and non-target species (Alverson et al. 1994, Hall 1996, Greenstreet et al. 2000; Hall et al. 2000;
Murawski et al. 2000; NRC 2002; Chuenpagdee et al. 2003; Diamond 2004; Kumar et al. 2006).
Furthermore, STs contact with the seafloor can disrupt benthic ecosystems in shallow as well as
deep-sea waters (Watson et al. 2006).
The capture of bycatch in STs is an important concern for fishermen, fishery managers,
and environmentalists (Warner 2004; Alverson et al. 1996). Fishery managers first noticed
finfish bycatch in the GOM ST fishery in the 1930s, but until the 1980s, most researchers
concluded that ST bycatch had little effect on non-target fish populations (Diamond 2004). This
lack of effect was thought to be because (1) bycatch fishes are mostly juveniles and natural
mortality is so high in the juvenile stage that most bycatch fish would not have survived to
adulthood, (2) bycatch had been occurring for decades without major changes in species
composition or numbers taken, and (3) environmental factors were thought to have a stronger
influence on populations than bycatch mortality. Some authors believed that bycatch could
actually be beneficial to fish stocks by reducing competition for food, thus increasing the sizes of
fish that were left through density-dependent compensation (Lunz et al. 1951; Gunter 1956;
Bryan et al. 1982; Diamond 2004).
By the mid-1980s it was recognized that ST bycatch was extremely large and of genuine
concern. The MSA was amended in 1990 to include a requirement that bycatch be avoided or,
8

where it cannot be avoided, that bycatch mortality be minimized. The amendment also
mandated the creation of a bycatch research program to assess the impact of incidental harvest
by the ST fisheries, including the nature and extent of bycatch, its effects on fish stocks, and
ways to reduce ST bycatch (Hoar et al. 1992; Diamond 2004). Since the 1980s, bycatch in the
GOM ST fishery, first of sea turtles and more recently of finfish, has been one of the most
controversial and intractable fishery management problems in the region (Diamond 2004).
Broadly speaking, the bycatch challenge for ST fishery is threefold: First, ST fisheries are often
prosecuted in areas where sea turtles are present and vulnerable to capture by the trawls (Chan
et al. 1988; NRC 1990; Stobutzki et al. 2001). Second, the weight of the bycatch is often greater
than the weight of shrimp (Warner 2004). Third, there can often be a significant bycatch of
commercially important target species from other fisheries (Gallaway et al. 1999).
The incidental capture of sea turtles by ST fisheries was identified as the most important
anthropogenic source of mortality in juvenile, sub-adult, and breeding sea turtles in U.S. coastal
waters (Caillouet et al. 1996). Sea turtle bycatch falls under two pieces of legislation—the
Endangered Species Act (ESA) and the MSA. All six sea turtle species that occur in U.S. waters
(Green Chelonio mydas, Loggerhead Caretto caretta, Olive Ridley Lepidochelys olivacea, Kemp's
Ridley Lepidochelys kempii, Leatherback Dermochelys coriaceo, and Hawksbill Eretmochelys
imbricoto) are listed as either threatened or endangered under the ESA and afforded federal
protection in all U.S. waters. The MSA specifies that bycatch-related mortality of non-target fish
should be minimized, and sea turtles are protected under the ESA and there capture is
prohibited.
According to Alverson et al. (1994), the top 20 highest discard ratios in the world (the
ratio of target species to discards, by weight) are dominated by bottom trawl fisheries, where
one-fifth or less of the catch is typically retained (Watson et al. 2006). The mortality of large
9
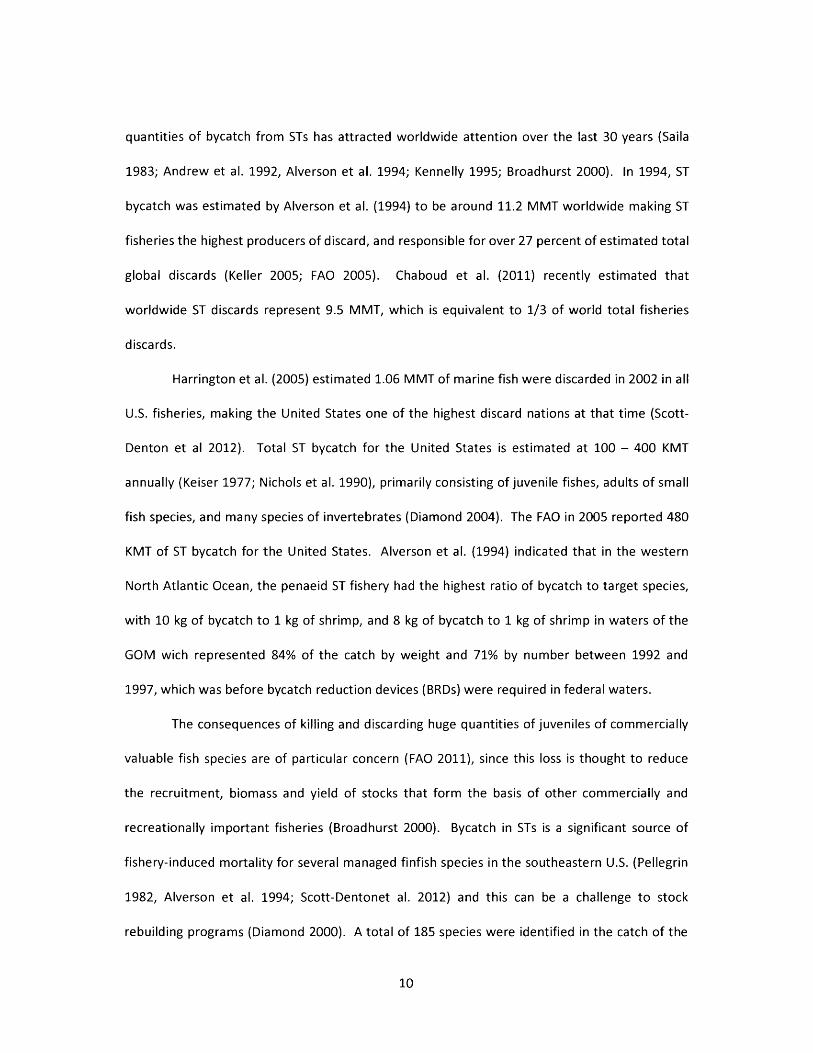
quantities of bycatch from STs has attracted worldwide attention over the last 30 years (Saila
1983; Andrew et al. 1992, Alverson et al. 1994; Kennelly 1995; Broadhurst 2000). In 1994, ST
bycatch was estimated by Alverson et al. (1994) to be around 11.2 M M T worldwide making ST
fisheries the highest producers of discard, and responsible for over 27 percent of estimated total
global discards (Keller 2005; FAO 2005). Chaboud et al. (2011) recently estimated that
worldwide ST discards represent 9.5 MMT, which is equivalent to 1/3 of world total fisheries
discards.
Harrington et al. (2005) estimated 1.06 MMT of marine fish were discarded in 2002 in all
U.S. fisheries, making the United States one of the highest discard nations at that time (Scott-
Denton et al 2012). Total ST bycatch for the United States is estimated at 100 - 400 KMT
annually (Keiser 1977; Nichols et al. 1990), primarily consisting of juvenile fishes, adults of small
fish species, and many species of invertebrates (Diamond 2004). The FAO in 2005 reported 480
KMT of ST bycatch for the United States. Alverson et al. (1994) indicated that in the western
North Atlantic Ocean, the penaeid ST fishery had the highest ratio of bycatch to target species,
with 10 kg of bycatch to 1 kg of shrimp, and 8 kg of bycatch to 1 kg of shrimp in waters of the
GOM wich represented 84% of the catch by weight and 71% by number between 1992 and
1997, which was before bycatch reduction devices (BRDs) were required in federal waters.
The consequences of killing and discarding huge quantities of juveniles of commercially
valuable fish species are of particular concern (FAO 2011), since this loss is thought to reduce
the recruitment, biomass and yield of stocks that form the basis of other commercially and
recreationally important fisheries (Broadhurst 2000). Bycatch in STs is a significant source of
fishery-induced mortality for several managed finfish species in the southeastern U.S. (Pellegrin
1982, Alverson et al. 1994; Scott-Dentonet al. 2012) and this can be a challenge to stock
rebuilding programs (Diamond 2000). A total of 185 species were identified in the catch of the
10

OGSF with finfishes dominating the bycatch. The average composition of the ST catch was fish
bycatch at 57% or 19.5 kg per hour of towing (kg/h), followed by shrimp catch at 29% (9.9 kg/h),
crustaceans bycatch at 7% (2.4 kg/h), invertebrates bycatch at 5% (1.8 kg/h), and debris at 1%
(0.5 kg/h), for an overall (total catch) CPUE of 34.3 kg/h (Scott-Dentonet al. 2012). In terms of
species composition, Atlantic Croaker Micropogonias undulotus represent 16% (5.4 kg/h) of the
total catch, grouped finfish (Black Drum Pogonias cromis; Cobia Rochycentron canadum; King
Mackerel Scomberomorus cavalla; Lane Snapper Lutjanus synagris; Red Drum Sciaenops
ocellatus; snapper Lutjonus spp. (other than Red Snapper Lutjanus campechanus); grouped
sharks (order Selachii); Southern Flounder Paralichthys lethostigma; Spotted Seatrout Cynoscion
nebulosus; Spanish Mackerel Scomberomorus maculatus; Vermilion Snapper Rhomboplites
aurorubens and Gulf Flounder Paralichthys albigutta) account for 27% (9.4 kg/h) of the total
catch, followed by Brown Shrimp at 14% (4.8 kg/h), White Shrimp at 11% (3.7 kg/h), crustaceans
at 7% (2.4 kg/h), sea trouts at 6% (2.0 kg/h), invertebrates at 5% (1.8 kg/h), Longspine Porgy
Stenotomus caprinus at 4% (1.4 kg/h), and Pink Shrimp at 4% (1.3 kg/h). All other species
accounted for 6% (2.0 kg/h) of the total weight (Scott-Denton et al. 2012). GOM catch
proportions are presented graphically in Figure 4.
One of the bycatch fish species of great concern in the OGSF is the Red Snapper, a
species with large directed commercial and recreational fisheries. On average, an estimated 2 5 -
30 million juvenile Red Snapper are caught annually as bycatch in the OGSF (Ortiz et al. 2000).
Red Snapper bycatch is an especially contentious issue because strict regulations on directed
Red Snapper fisheries (commercial and recreational) have been in place since 1990 (Goodyear
1995), when a stock assessment showed that 90% of the mortality on age 0 and 1 Red Snapper
resulted from shrimp trawl bycatch (Goodyear et al. 1990; Diamond 2004; Wells et al. 2008).
Atlantic Croaker is one of the most commonly caught bycatch species in STs, ranking
11

second by number in the GOM and third in the SAB (NMFS 1995). In the GOM; surveys
conducted since 1972 show that Atlantic Croaker density and biomass have significantly
decreased since 1990 (Diamond et al. 1999). Though natural mortality of larvae and juveniles
and not bycatch mortality of late juveniles was considered to be the most important factor
affecting Atlantic Croaker populations, a reduction of about 35% in either the late juvenile or the
adult mortality rate in the Gulf would be enough for this population to recover, or at least to
noticeably slow population declines in the Gulf of Mexico (Diamond 2000). BRDs that are
required in the GOM may also help achieve these reduction targets (Diamond 2000), as Atlantic
Croaker are amenable to release using BRDs (Watson et al. 1993; Diamond 2000).
Some species of fish are more vulnerable to overfishing then others, and sharks are
particularly so. Most sharks have life histories that are characterized by slow growth, late sexual
maturity, few offspring produced per litter, and long life spans (Camhi 1998; Stevens et al. 2000;
Musick et al. 2000). These life history characteristics present special problems for shark fishery
management (Holden 1974). Some U.S. populations of sharks have declined by as much as 85%
since the late 1970s (Camhi 1998). Generally, these declines are attributed to direct fishing
pressure from commercial and recreational fisheries, but effects from other fisheries that
encounter sharks as bycatch also play a role (Barker et al. 2005). On April 26, 1993, NMFS
implemented the nation's first federal fishery management plan (FMP) for sharks, covering U.S.
shark fisheries of the Atlantic Ocean, GOM, and Caribbean Sea (NMFS 1993). The FMP placed 39
species of sharks under management in federal waters and included commercial quotas, closed
seasons, recreational bag limits, and a ban on shark finning (NMFS 1993; Hueter 1994). Hueter
(1994) reported that the 1993 shark FMP did not fully address bycatch issues even though
bycatch by commercial STs had been identified as a large source of sub-adult shark mortality
(Camhi 1998; Stobutzki et al. 2002; Shepherd et al. 2005). At the time it was estimated that
12

three times as many sharks were caught annually as bycatch by STs in the GOM than combined
commercial and recreational shark landings in U.S. GOM and Atlantic waters (Parrack 1990).
The status of small coastal sharks was later evaluated using several stock assessment methods
and results suggest that these populations were generally healthy (Cortes 2002; Simpfendorfer
et al. 2002; Burgess et al. 2005). Of the four species comprising the small coastal shark complex,
only the stock of Blacknose Sharks Carcharhinus ocronotus off the southeastern U.S. and GOM
was determined to be overfished with overfishing occurring, and as much as 45% of the animal
fishing mortality (38,626 individuals) of Blacknose Sharks was attributed to the GOM ST fishery
(NMFS 2007b).
Management Options
There are different options for managing bycatch through the regulatory system, such
as quotas, discard bans, mandatory use of bycatch, fishing effort reductions, spatial
management and the use of BRDs. The use of caps or quotas to reduce bycatch can be classified
under the management strategy of incentive/disincentive programs (Alverson et al. 1994).
Incentives related to the ability to continue fishing, and disincentives including fishery closure,
temporary loss of the right to fish, fines, and expulsion from the fishery and/or reduction of
future quotas, are used to induce fishermen to make operational fishing choices that reduce
bycatch. Oceana, an environmental, non-governmental organization, petitioned the U.S.
Secretary of Commerce to "initiate rulemaking to establish a program to count, cap, and control
bycatch in the nation's fisheries" (Oceana 2002). One of the specific requests detailed in the
petition was to set bycatch caps or quotas, and to close fisheries when either the target species
total allowable catch (TAC) or the bycatch quota is reached.
Other countries have used a variety of management measures to address bycatch issues
in their respective ST fisheries. Namibia, located on the west coast of Africa, has completely
13

banned bycatch in its EEZ (Hampton 2003). This ban requires that all bycatch be landed for
conversion to fishmeal. A surcharge is also levied on the fisheries for fishmeal processing, which
acts as an additional incentive to further reduce bycatch (Hampton 2003). According to Hall et
al. (2005), it is important to recognize the distinction between a discard and bycatch ban.
Whereas the discard ban only applies to species that have commercial value and are either
undersized or for which a fisher does not possess quota, the bycatch ban requires that all
species captured, irrespective of their value, be landed (Hall et al. 2005). It is understandable
that Namibia would adopt such a strategy since, in many cultures, failure to make use of fish
that are already killed is viewed as highly undesirable (Hall et al. 2005). This is particularly true
for developing countries where the supply of adequate protein to the populace is a challenge
and bycatch can provide an important food subsidy to those communities.
Guyana located on the north east coast of South America mandated landing of bycatch
through legislation. All ST fisheries in Guyana are required to land 1 ton of bycatch per trip in
order to obtain exemption from export taxation and a nominal fee payment (Gordon 1981;
Clucas 1997). However, considering the history of overexploitation by fisheries, creating new
markets for bycatch can be problematic. As species become substantially depleted, what was
once bycatch soon becomes new acceptable targets, leading to further depletion and other
ecological consequences (Hall et al. 2005).
Mandatory effort reductions for target species can be used to reduce bycatch. The
International Council for the Exploration of the Sea (ICES) recommended fishing effort
reductions to decrease bycatch in Danish and UK groudfish trawl fisheries (ICES 2002). In 2002
the U.S. National Research Council analysis of the GOM shrimp fishery indicated that effort
could be reduced by almost 50%, while maintaining the same target shrimp catches and greatly
reducing bycatch.
14

Another management option to reduce bycatch is to restrict trawling to locations and
times known to have relatively small amounts of bycatch (time-area closures; Broadhurst 2000,
O'keefe et al. 2013). Although there can be substantial variability in the timing and location of
bycatch, analysis of bycatch records can often identify areas where closure has the potential to
reduce bycatch (Hall et al. 2005). Ye et al. (2000) examined the temporal and spatial patterns in
the catch to bycatch ratios for the Kuwait shrimp fishery. This analysis showed that a seasonal
fishery closure from April/May to August, that was originally established to prevent overfishing
and increase the size and market value of the target shrimp, also reduced bycatch. A more
dynamic approach than closing areas permanently is hotspot reporting (Hall et al. 2005). Bering
Sea fishers, for example, have voluntarily developed and implemented a real-time monitoring
and information-sharing system to tell the fishing fleet about bycatch rates and hotspots for
prohibited species (Gauvin et al. 1996). Observer data on catch and bycatch are transmitted
electronically from participating vessels to a private contractor who analyzes the submitted data
and provides estimates to participating vessels and companies of the spatial distribution of
average catch rate per vessel for each 24-h period (Hall et al. 2005). These data allow individual
vessels or company fleets to rapidly respond and avoid areas where bycatch of protected
species is expected to be high (Hall et al. 2005).
In addition to using the regulatory system as a means to reduce bycatch, regulations can
inadvertently create incentives to generate bycatch and discards (Hall et al. 2005). There are
many cases where regulations enacted to try and ensure that target species were not
overexploited led to discarding of the very species they were trying to protect. For example,
when trip limits are imposed for one species, discards of other species can increase because
fishers catch the limited species while fishing for others (NMFS 1998). Similarly, discarding
occurs when a fisher does not possess quota for a particular species that is inadvertently caught
15

(Hall et al. 2005). Thus, the mixture of incentives and disincentives that are put in place with
particular legislation may not be easily foreseen and may impact bycatch levels (Hall et al. 2005).
Bycatch reduction can also be achieved through gear selectivity. After decades of
attention to maximize effectiveness and efficiency of fishing gear, technologists started to focus
on more conservation-orientated goals during the last few decades (Kennelly et al. 2002). This
focus began as a response to concerns over bycatch of large charismatic species (dolphins,
turtles), but quickly broadened to address concerns over the discarding of less charismatic
species, such as juvenile fish killed by STs (Kennelly et al. 2002). Fishing gear modifications to
reduce bycatch have been a major focus of fisheries research since the 1990s, and these gear
modifications have been a major approach to address bycatch issues throughout the world's ST
fisheries (Broadhurst 2000; Diamond 2004). In the U.S., the efficacies of BRD designs have been
evaluated by NMFS, state fishery agencies, Sea Grant agents, and university biologists using
controlled comparison studies (e.g. modified nets versus unmodified nets) aboard research and
commercial vessels (Diamond 2004). The successful development of BRD devices has led to
mandatory use of both TEDs and other BRDs in U.S. shrimp fisheries. As stated previously,
bycatch by ST fisheries can be broken down into 3 categories: turtle bycatch, finfish bycatch of
non-commercially important species, and bycatch of commercially important species. Gear has
been developed to address these three bycatch issues.
The directed harvest of all sea turtles was made illegal in U.S. federal waters with the
passing of the ESA in 1973 (Moore et al. 2009). Efforts were made to reduce the incidental
capture of sea turtles through the development and introduction of both hard and soft TEDs to
the U.S. ST fishery on a voluntary basis during the 1980s (Watson et al. 1980; Tucker et al. 1997).
The concept of the TED entails a physical barrier that prevents the turtle from entering the
16

codend and facilitates subsequent release through a trap door (Tucker et al. 1997; Broadhurst
2000).
The V type vertical separator trawl, a form of soft TED was found to be effective in
removing turtles but had limited acceptance amongst commercial fishermen because of
reductions in shrimp catches of up to 60% (Broadhurst 2000). Due to multiple problems
associated with soft versions of these designs, in particular fish and weed entanglement, the
utility of hard grid TED designs was tested (Tucket et al. 2008). Hard TEDs (hereafter referred to
as TEDs) generally consist of a metal separator grid that is installed in the trawl at an inclined
angle (Figure 6; Tucker et al. 1997). Hard TEDs have been more successful when compared to
soft TEDs (Broadhurst 2000) and their use has persisted through time. TEDs have been effective
in reducing catches of turtles by up to 97% (Tucker et al. 1997; Broadhurst 2000), and their use
on shrimp and flounder trawlers has been required since 1987 (Federal Register 1987) and 1996,
respectively (Moore et al. 2009).
Watson et al. (1986) developed an early model TED called the 'NMFS trawl efficiency
device' which consisted of a solid inclined grid placed anterior to strategically located side-
escape windows, all encompassed within a steel frame. Although many fishers objected to its
weight (40 kg) and size (91 x 114 x 76 cm), some voluntarily used this TED as a BRD in certain
areas because of its ability to reduce catches of jellyfish (Broadhurst 2000). One of the most
successful TED designs developed in the GOM was a declined, bottom-opening grid termed the
'super shooter' (Figure 7). It is effective in almost completely eliminating catches of turtles with
minimal reductions of shrimp catch (Renaud et al. 1993; Broadhurst 2000). By 1990, TEDs were
in widespread use throughout the ST fishery of the southeastern U.S. (Crowder et al. 1995;
Raborn et al. 2012).
17

TEDs have now existed for over 30 years and there have been continual improvements
to the design required for use by U.S. ST fisheries. Of particular importance was the 2002
regulation to increase the opening size of the escape hole of TEDs. Epperly et al. (2002a)
suggested that roughly 62,300 loggerheads may have been killed each year, along with 2,300
leatherbacks, 20,000 Kemp's Ridley turtles, and 1,400 green turtles, prior to the 2002
regulations (Federal Register 2003). Interestingly, Epperly et al. (2002b) suggested that even
with new TED size regulations, anticipated sea turtle mortality by U.S. STs may be on the order
of 25,000 individuals per year. Mitchell et al. (2002) found no significant difference in shrimp
catches in nets equipped with the new, larger-opening TEDs.
Though capable of significantly reducing turtle bycatch, the use of TEDs has historically
been resisted by many in the fishing industries due to the associated costs, negative effects on
gear performance and handling, and some loss of targeted shrimp (Tucker et al.1997;
Broadhurst 2000). Estimates of shrimp loss (1%) associated with the use of the Super Shooter
TED, a model commonly used in the OGSF, were derived from a study conducted by Renaud et
al. (1993) from 1988 to 1990. A reanalysis of these data, in which the try-net effect was
excluded, suggested that TED use could result in a 6% shrimp loss (Gallaway et al. 2008). The
low finfish bycatch reduction (5% to 13%) associated with TEDs (Raborn et al. 2012), further
contributed to TEDs not being fully embraced by industry. Early TEDs were bulky and
cumbersome, and few shrimpers accepted the research findings of minimal shrimp loss (Tucker
et al. 1997).
The nature by which TEDs were imposed also contributed to the initial rejection of TEDs
by the U.S. shrimp trawling industry. The voluntary adoption strategy for an innovation such as
TEDs allowed fishermen to mitigate the potential negative effect (e.g., shrimp loss) by altering or
adjusting the TED, adjusting the adoption rate or even rejecting the TED all together (Morberg et
18

al. 1994). In 1987, when TED use became mandatory on all commercial shrimp trawlers
operating in U.S. federal waters (Moore et al. 2009), shrimpers no longer had control over the
potential for negative impacts and they felt TEDs were harming their livelihood (Moberg et al.,
1994). Consequently, suspicion and even hostility arose (Margavio et al. 1993, Tucker et al.
1997).
Since then, technological advancements for the prevention of turtle captures has not
only improved the efficiency of the TED but also contributed to fish bycatch reduction. The use
of various TEDs in the southeastern U.S. ST fishery has reduced the bycatch of sharks, rays
(Watson et al. 1986; Mitchell et al. 1995; Eng ass et al. 1999, Raborn et al. 2012) and large fish
(Tucker et al. 1997; Broadhurst 2000).
In 1990, concerns over ST bycatch on four key species of finfish, Red Snapper, Weakfish
Cynoscion regolis, King Mackerel, and Spanish Mackerel, led to a large co-operative program
between several research agencies to evaluate gear modification options (Hoar et al. 1992;
Rulifson et al. 1992; Watson 1996). Watson (1996) reported that a total of 96 BRDs were
considered and evaluated. Seventeen years later Scott-Denton et al. (2012) report that more
than 150 BRD styles were developed by industry, scientists and gear specialists and evaluated
through cooperative multi-year efforts. Due to the variety of fishing conditions and bycatch
species, there is no single solution to achieve bycatch reduction and maintain target catches in
the ST fishery (Robins-Troeger et al. 1995; Tucker et al. 1997). BRD research continues as an
ongoing strategy to mitigate bycatch in the U.S. ST fishery.
BRD development for trawls has nearly always involved different types of physical
modifications to improve gear selectivity (Kennelly et al. 2002). Depending on the species to be
excluded and retained, these modifications range from simple changes of mesh sizes and
materials (Broadhurst 2000; Gray et al. 2000; Kennelly et al. 2000) to the application of unique
19
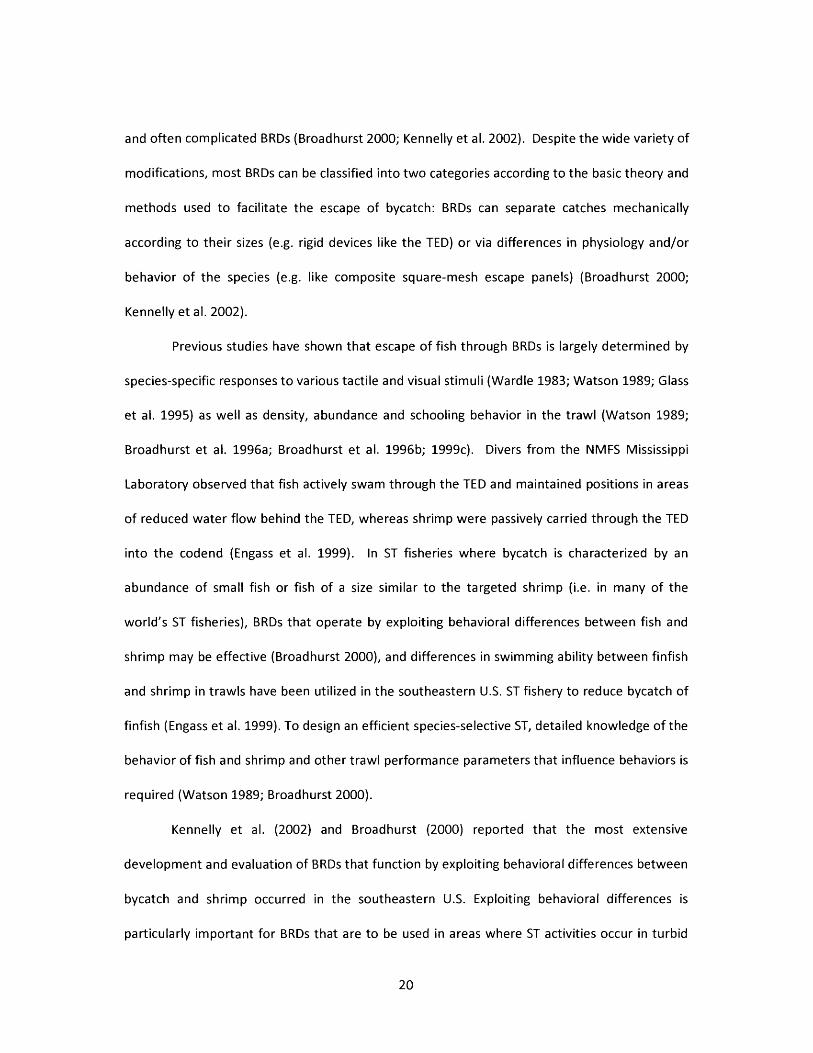
and often complicated BRDs (Broadhurst 2000; Kennelly et al. 2002). Despite the wide variety of
modifications, most BRDs can be classified into two categories according to the basic theory and
methods used to facilitate the escape of bycatch: BRDs can separate catches mechanically
according to their sizes (e.g. rigid devices like the TED) or via differences in physiology and/or
behavior of the species (e.g. like composite square-mesh escape panels) (Broadhurst 2000;
Kennelly et al. 2002).
Previous studies have shown that escape offish through BRDs is largely determined by
species-specific responses to various tactile and visual stimuli (Wardle 1983; Watson 1989; Glass
et al. 1995) as well as density, abundance and schooling behavior in the trawl (Watson 1989;
Broadhurst et al. 1996a; Broadhurst et al. 1996b; 1999c). Divers from the NMFS Mississippi
Laboratory observed that fish actively swam through the TED and maintained positions in areas
of reduced water flow behind the TED, whereas shrimp were passively carried through the TED
into the codend (Engass et al. 1999). In ST fisheries where bycatch is characterized by an
abundance of small fish or fish of a size similar to the targeted shrimp (i.e. in many of the
world's ST fisheries), BRDs that operate by exploiting behavioral differences between fish and
shrimp may be effective (Broadhurst 2000), and differences in swimming ability between finfish
and shrimp in trawls have been utilized in the southeastern U.S. ST fishery to reduce bycatch of
finfish (Engass et al. 1999). To design an efficient species-selective ST, detailed knowledge of the
behavior of fish and shrimp and other trawl performance parameters that influence behaviors is
required (Watson 1989; Broadhurst 2000).
Kennelly et al. (2002) and Broadhurst (2000) reported that the most extensive
development and evaluation of BRDs that function by exploiting behavioral differences between
bycatch and shrimp occurred in the southeastern U.S. Exploiting behavioral differences is
particularly important for BRDs that are to be used in areas where ST activities occur in turbid
20

water conditions where visibility is reduced (Engass et al. 1999). Most BRDs rely on active
exclusion, using the behavioral reactions of bycatch species to actively swim out of the net via
escape windows or funnel openings (Tucker et al. 1997). While recognizing that solutions to
bycatch often need to be tailored to specific fisheries and may differ between regions of the
world (Alverson 1999; Bache 2002; Hall et al. 2005), efforts to improve ST selectivity have led to
the development of a variety of BRDs. Some of these are discussed below.
Many ST BRDs are relatively simple in concept and design. One such BRD consists of a
horizontal opening cut out in the top of the codend. Experiments with this BRD demonstrate
reduced total bycatch although mean target catches were reduced with no statistically
significant loss of shrimp, (Wallace et al. 1994). Another option to reduce bycatch is to
strategically position a square-mesh panel in the trawl. The use of the square-mesh panel BRD
in North American fish-trawls led to the transfer and evaluation of similar designs across a
number of ST fisheries throughout the world (Averill 1989; Larsen 1989; Karlsen et al. 1989;
Valdemarsen 1986; Thorsteinsson 1992; Hickey et al. 1993; Broadhurst et al. 1994; Broadhurst
et al. 1999; Broadhurst 2000). Species that are relatively fusiform and tend to occur in large
schools (e.g. Sciaenidae and Sillagidae) may be successfully excluded using simple panels of
square-mesh or other BRDs that incorporate small openings in the top or sides of the trawl
(Broadhurst 2000). In a series of experiments conducted under commercial conditions,
Broadhurst et al. (1994, 1995, 1996a, 1996b, 1997) tested a variety of square-mesh designs at
different locations in the codend and examined the effects of operational factors on their
performance (Broadhurst et al. 1999b). These studies showed that very small panels of square
mesh strategically located in the tops of the anterior sections of codends significantly reduced
large quantities of bycatch that included non-target individuals and juveniles of commercially
21

and recreationally important species with no significant reduction in catches of King Shrimp
Penaeus plebejus (Broadhurst 2000).
The Fisheye is another simple BRD design, which consists of a welded steel, pyramid
shaped frame that is inserted in the top anterior section of the codend. It was designed to allow
fish to orient into an area of reduced water flow (inside the fisheye) and escape through an
opening at the base of the BRD (Harrington 1992; Harrington et al. 1995; Watson 1996; Watson
et al. 1996; Rogers et al. 1997; Broadhurst 2000). The Fisheye BRD shrimp loss was estimated to
range between 3% and 7% depending on its location in the trawls (GMFMC 1997), while bycatch
reduction was estimated to be 28% (Wallace et al. 1994).
The BRDs discussed above are simple in design while others involve significant and often
complicated alterations to the geometry of the trawl, such as the inclusion of various guiding
funnels combined with additional openings, panels of mesh, and/or rigid components
(Broadhurst 2000). As previously noted, more than 150 BRDs have been described in the
literature (Scott-Denton et al. 2012), below I discuss a few of the more complex BRDs that were
evaluated since the 1980s (Watson et al. 1986).
Watson et al. (1990) developed and assessed several BRDs characterized by guiding
funnels and small-mesh panels located immediately anterior to the codend. These BRDs
directed water and slower-moving shrimp into the codend and allowed fish to swim forward and
out through strategically located escape exits. In 1984, researchers with NMFS at the Mississippi
Laboratory developed the first BRD that employed a funnel with escape openings positioned
around it (Broadhurst 2000). The principle was to provide a stream of fast flowing water
through the funnel to carry shrimp back into the codend and reduce flow around the funnel,
guiding fishes into the area of the escape opening. One modification, termed the 'finfish
separator device' (FSD) consisted of two funnels sewn inside the codend, terminating anterior to
22

a 'deflector grid'. This latter device was designed to generate visual and tactile stimuli for fish,
directing them to large, radially located openings separated by lateral supports (Watson et al.
1990). The FSD was effective in reducing the numbers of fish with no significant reduction in
catches of shrimp. However, its performance varied greatly among different geographic areas,
the size of individual species encountered, and their swimming abilities. In addition, the size of
the BRD, combined with a potential for large objects to become meshed in the funnels, meant
that few fishers were willing to adopt it as part of their normal commercial operations
(Broadhurst 2000).
Another popular BRD that uses a funnel is the Jones/Davies BRD, which has four
windows to provide an escape path for fish while a funnel keeps shrimp away from the
windows. The reduced water flow around the windows acts as a physical cue to guide fish out
of the trawl. Experiments with the Jones/Davies BRD have achieved reduction in juvenile Red
Snapper bycatch mortality ranging from 52 to 67%, (Watson et al. 1999). Other funnel-type
BRDs include the 'expanded mesh design' and 'extended funnel design'. These BRDs are similar
to each other and comprise guiding funnels surrounded by larger square-shaped mesh located
anterior to the codend (Harrington et al. 1995; Watson 1996; Watson et al. 1996). These two
BRD designs were based on the original FSD and developed to direct shrimp into the codend
while allowing fish to swim forward and escape through the larger, radially located square mesh
(Broadhurst 2002). Variations of these designs were evaluated in areas throughout the
southeastern U.S. (Rulifson et al. 1992; Wallace et al. 1994; Harrington et al. 1995). Rulifson et
al. (1992) tested three BRDs similar in concept to the extended/expanded mesh funnel designs
off the south Atlantic coast. While these BRDs were effective in facilitating the escape of some
individuals of particular species, only one design significantly reduced total bycatch biomass,
and the authors concluded that the designs needed to be refined on a species-specific basis
23

(Broadhurst 2000). The composite mesh panel (CMP) is a variant of a funnel-type BRD which is
less complicated in design and is the newest addition to the suite of approved BRDs in U.S.
federal waters. Fishery-dependent data collected during certification trials of the CMP in
combination with a cone fish deflector attained a total fish bycatch reduction of 51.3% with an
8.2% shrimp reduction rate (Foster 2011). Similarly the CMP in combination with the square
mesh panels placed in the codend showed a total fish reduction of 49.9% with a 1% shrimp
reduction rate (Foster 2010). Both CMP gear combinations with either the cone fish deflector or
the square mesh panel showed reducd captures of Atlantic Croaker (64.3%, 56.4%) and
Longspine Porgy (22.2%, 14.1%), respectively.
The last BRD design discussed here that relies on funnels and escape panels is the 'radial
escape section' (RES), which is based on the FSD design, and was modified and tested in several
ST fisheries (Valdemarsen 1986; Averill 1989; Conolly 1992; Schick 1992). Variations of the RES
design were successful in reducing the bycatch of individual species by up to 100% in Norway
(Valdemarsen 1986), 77% in New England (Averill 1989) and 48% in Brazil (Conolly 1992), with
shrimp losses of 53%, 14% and 27%, respectively (Broadhurst 2000). Although these results for
bycatch and shrimp were comparable to those from other BRDs developed for these fisheries,
Averill (1989) suggested that in addition to a loss of commercial shrimp, the main limiting factor
of the RES was the complexity involved in its rigging (Broadhurst 2000).
Beyond alterations to the trawl body, a novel gear modification to reduce bycatch was
the design of a trawl that included electric arrays in the footrope and lower belly which
produced pulses of current (3 V at a rate of 4 -5 pulses per second) (Seidel 1969; Seidel et al.
1978). These electric stimuli resulted in shrimp contracting their abductor muscles, propelling
them vertically into the net, and some fish exhibiting a fright reaction horizontally away from
the trawl. While the concept of electric trawls was considered technically feasible, high costs
24

and practical limitations meant that the design was not fully developed for commercial testing
or application (Watson et al. 1990; Broadhurst 2000).
BRDs were required in the late 1990s by NMFS to reduce the finfish bycatch, especially
for overfished species such as Red Snapper in the GOM (GMFMC 1997), and Weakfish and
Spanish Mackerel in the SAB (SAFMC 1996). BRDs have been required in Federal waters of the
SAB since 1997, the western GOM since 1998, and the eastern GOM since 2004 (Federal
Register 2004). Potential BRD designs are certified by NMFS, based on criteria set forth in the
revised and consolidated BRD testing manuals and certification requirements for the GOM and
SAB ST fisheries (NOAA 2008b). Once certified, effectiveness of BRD designs are periodically
evaluated using observer data (Scott-Denton et al. 2012). Only three BRDs were found to be
appropriate for development and testing under commercial ST conditions prior to 1996 (Watson
1996). Today four BRD designs are currently certified (or provisionally certified) for use in
federal waters of the GOM and SAB ST fisheries: the composite panel, the extended funnel, the
fish-eye, and the Jones/Davis (and modified Jones/Davis) (NOAA 2008a). An additional design,
the expanded mesh BRD, is certified for use in the SAB ST fishery only.
BRDs have been beneficial in reducing bycatch in the GOM and SAB ST fisheries, but
there are substantial drawbacks associated with their use. First, the use of BRDs has imposed
additional costs on shrimp vessel owners due mainly to a loss of shrimp from their trawls (Gillig
et al. 2001). Most studies found that bycatch reduction using BRDs was variable and depended
not only on BRD design, but also on the placement of BRDs in the trawl, individual fishing
practices, and fishing conditions (Broadhurst 2000).
For example, the Jones/Davis BRD exhibits variable bycatch reduction efficiency, which
is affected by the manner in which the captain operates the vessel. One variable that
contributes to these different results is net surge, which occurs when the vessel's velocity is
25

reduced and the forward motion of the bag continues with water flowing forward towards the
opening of the trawl (Engass et al. 1999). When this happens, fish that are positioned near the
openings of the BRD are displaced. When the net is pulled forward again, the flow into the trawl
increases and fish that escaped the BRD fail to regain position back inside the trawl (Engass et al.
1999). With the area around the opening now free of fish, others typically moved into the space
previously occupied by the displaced fish. Therefore multiple surge events tend to increase the
efficiency of the Jones Davis BRD. Furthermore, movements of fish through the escape
openings were generally low and random during towing, except for catfish, which always
showed a strong escape response (Engass et al. 1999). Haul back procedures can vary between
vessels, which may in part explain the documented vessel-dependent escape rates for different
BRDs. It is preferable that escapement occurs as soon as fish enter the escape area during
towing. Such continuous escapement may reduce the possibility of extra bycatch mortality
attributed to predation and displacement (Workman 1999). As previously noted, escapement
was mainly observed during slowdown prior to haul back, i.e. in situations when water flow
inside and outside the escape opening was nearly equal.
Bycatch reduction of juvenile Red Snappers has been a major focus in guiding the
development of BRDs. Originally, certification for BRD designs in the GOM required a reduction
of age-0 and age-1 Red Snapper bycatch mortality of 44% relative to the total ST fishing
mortality evaluated for the period 1984 to 1989 (Federal Register 1998). Studies have shown
that Red Snapper, which orient to structure (i.e. align themselves to rocks piles and reefs and
maintain that position), are very difficult to remove passively from nets with BRDs because of
this behavior (i.e., they align themselves to the net) (Engass et al. 1999). Based on the 1998
NMFS observer program aboard commercial vessels, it was estimated that about 23% of juvenile
Red Snapper escaped from nets with certified BRDs, compared to control nets (Nichols 1999;
26

Diamond 2004). It was hoped that further reductions would occur as fishermen became more
familiar with BRDs, so a projected 50% overall reduction of Red Snapper bycatch was assumed in
1999 to set the TAC of Red Snapper directed fisheries at 4.13 MT annually between 2000 and
2005 (RFSAP 1999). This estimate included data from Fisheye BRD placement in a particular
section of the codend that has since been disallowed (Diamond 2004). Red Snapper bycatch
reduction improved to 41% when those particular Fisheye BRD data were removed from the
analysis (Diamond 2004). Still, BRDs have not achieved the 50% reduction of juvenile Red
Snapper bycatch anticipated by the NMFS (1995) (Engass et al. 1999; Woodward et al. 2003).
The 2001-2003 ST onboard observer program showed that bycatch reduction levels
have declined over time, and averaged only 11.7% for Red Snapper and 16.5% for all finfish
species combined (Foster et al. 2004). The reason for the observed decrease in bycatch
reduction is thought to be that fishermen modify their nets or change their practices to reduce
loss of shrimp, which also reduces the efficiency of BRDs (Foster et al. 2004). An additional
problem with current TEDs and other BRDs used in the U.S. ST fleet may be the inefficiency of
these devices to reduce small elasmobranch bycatch. Brewer et al. (2006) concluded that BRDs
had limited effect on bycatch of elasmobranches in an Australian ST fishery. Similarly, in the
United States, an evaluation of a 30.5 cm x 12.7 cm fisheye BRD found that it was ineffective in
reducing the number of sharks captured (Belcher et al. 2010).
Today there are only four BRDs that are certified for use in the OGSF and innovations in
technological designs that further improve the selectivity of OGSF are necessary. Reducing the
bycatch mortality of both large and small fishes through the gear development continues to be a
priority for not only managers of this industry but for the industry itself. The objective of my
thesis research was to evaluate a new TED design, the trash and turtle excluder device (TTED,
Figure 8) in the OGSF.
27

The TTED is based on the super-shooter TED design but there are two major differences
between the gears: (1) decreased spacing between the deflector bars in the TTED (5 cm) (Figure
8) relative to the TED (10.2cm) and (2) use of flat bars (6 mm width) instead of round bars (12.6
mm diameter). The reduced bar spacing of the TTED, as compared to the TED, may exclude
more fish from entering the codend and result in reduced bycatch. Flat bars may improve water
flow through the TED, towards the codend, since it encounters less resistance from the 6.3mm
wide flat bars then it does from the 16mm wide round bars. Increased turbulence ahead of the
TED can lead to deflection of water towards the opening, blowing open the flaps of the TED and
resulting in shrimp loss.
The main advantage of the TTED is that it may considerably reduce the capture of large
organisms. In preliminary work conducted in French Guiana, the TTED resulted in a 20-30% total
bycatch reduction without significant target shrimp loss for the ST industry (Nalovic et al. 2010).
Indeed the shrimp to bycatch ration in French Guiana is 1 to 10 and approximately two tons of
bycatch species ranging from small invertebrates to large pelagic fish are thrown back to sea by
each trawler daily (Leopold 2004). Experiments with the TED showed small reductions in total
bycatch and the industry sought improvements in the TED performance (Duffaud et al. 2011)
Based on this the French Guiana Regional Fisheries Committee in partnership with the WWF
began experimenting with reduced bar spacing TEDs, including the Trash and Turtle Excluder
Devise (TTED)—"trash" is a common term for bycatch in French Guiana. The TTED improved the
selectivity of the original TED and was voluntarily adopted by the industry in March 2008,
becoming mandatory by government decree in January 2010 (Duffaud et al. 2011). The TTED
design may contribute to improved selectivity of the OGSF. The goal of my thesis research was
to compare the shrimp and bycatch capture of a TTED to a standard TED under typical fishing
operations onboard commercial ST vessels in the GOM and SAB using the sampling method
28

described by the NMFS BRD evaluation protocol (NOAA 2008a).
I tested the following hypotheses:
Target (shrimp) catch:
H0: The shrimp retention of the TTED is not different to the shrimp retention of a TED
Ha: The TTED shrimp retention is not equal to the shrimp retention of the TED
Fish bycatch:
H0: The fish bycatch retention of the TTED is not different from the fish bycatch
retention of the TED
Ha: The fish bycatch retention of the TTED is less than the fish bycatch retention of the
TED
29

CHAPTER 2: MATERIALS AND METHODS
Data Collection Methodology
Comparative tows of the TTED and TED were conducted during the summer of 2012
(May-August) and continued in the fall of 2013 (September-December), allowing me to collect
data from seasons with potentially different bycatch compositions. Data were collected using
the NMFS U.S. Gulf of Mexico and Southeastern Atlantic Otter Trawl and Bottom Reef Fish
Fisheries Observer Training Manual, which I will refer to as the NMFS observer protocol. Data
collection occurred on five fishing trips, one of which was in waters of the U.S. South Atlantic
Bight (in 2012), two in offshore waters of the northeastern GOM (one in 2012, one in 2013), one
in offshore waters of the northwestern GOM (in 2012) and finally, one in waters in and around
Key West, FL (2013). Consistent with past gear research in the GOM, the mouth of the
Mississippi River was used as a dividing line between the eastern and western GOM (Gallaway et
al. 2008). Trips left from and returned to fishing ports of Darien GA, Freeport TX, and
Pascagoula MS (Figure 9).
Shrimp trawl vessels equipped to tow two pairs (Figure 3) of twin trawls (image of single
pair, (Figure 5) simultaneously, were used as these allow for an experimental trawl (with TTED
and no BRD) to be compared directly to a control trawl (with TED and no BRD). While variability
in fishing conditions between tows may affect catch and size distribution of catch from the
trawls being compared, the pairing of the trawls tends to control, to a large extent, between-
haul variability and also variability resulting from alterations to the normal trawl configuration.
The trawls used in the experiment were the two outboard trawls following Mitchell et al. (2002)
since both vessel wash and the try-net may influence catches of the inboard trawls (Watson et
al. 1999).
30

The TED design selected for the control trawl was the bent-bar pipe grid style super
shooter TED (Figure 7), one of the commonly used TEDs in the OGSF. The experimental trawl
was equipped with the TTED (Figure 8). Though the webbing in which the TTED and TED are
mounted may be of different brands, many configuration characteristics of the TTED and TED
were comparable including: construction (aluminum), model (super-shooter), dimensions
(approximately 129.5 cm high, by 107 cm wide), opening (double flap), chaffing gear, mesh size,
and angle. The TTED and TED used in this study were set in the extension at 55° degrees of
inclination relative to the water flow through the trawl, which is the maximum angle allowed by
U.S. regulations. U.S. regulations also define the minimum inclination angle of the TED to be
35°. If the TED is set at less than 35° inclination, shrimp loss typically occurs; if the inclination is
set higher than 55°, turtles may not be able to escape because the current could pin them
against the four inch spaced bars, resulting in drowning. Even if the TED and TTED used in the
experiment sometimes changed angle, all tows were included in the analysis regardless of angle,
though angle may affect shrimp and bycatch retention. All comparisons used TEDs and TTEDs
that were bottom opening, though the TTED and TED orientation of the escape opening (up or
down) and the presence or absence of an accelerator funnel was dependent on the captain's
preferred TED and TTED configuration. Only in GA did the captain prefer to not use funnels in
the TED and TTED and in TX, MS and AL funnels were used.
All of the TTEDs were purchased new from Tide Marine Incorporated, in Bayou La Batre,
AL. The TTEDs were bought pre-installed into stretch-resistant Sapphire webbing. Stretch-
resistant webbing is believed to help prevent TEDs from losing optimal angle configuration so
that less maintenance is required.. One difference between experimental and control tows was
that the TTED weighed 27 kg when inserted in its tube of webbing with five hard floats,
compared to the the four inch round bar TED and equivalent gear with only two hard floats
31

which weighed about 20kg. Five hard floats were used with the TTED to ensure that it was
positively buoyant in seawater. This did not make it noticeably harder to handle by crew.
Prior to beginning the comparative tows, it was necessary to determine if the trawl nets
were fishing with the same efficency. If both experimental trawls were catching similar
quantities of shrimp (less than 5% difference between both trawls) then the trawls were
considered tuned. Therefore, I conducted standardization tows to compare catch rates
between trawls. This also provided the captain with an opportunity to adjust the nets before
the experiment began. Calibration of the trawls minimized, to the extent practicable, any
trawl/side bias in catch prior to beginning a test series. Once the nets were 'tuned' and the
experiment had begun, no changes or alterations to gear configuration and design were
performed. If major changes were required, the test series was restarted following the change.
Minor repairs to the gear (e.g., sewing holes in the webbing or replacing a broken tickler chain
with a new one of the same configuration) were not considered a major gear alteration and the
test series was continued. If a major gear change (i.e., changing nets, doors, or rigging) was
required, the new trawl configuration would be re-tuned before a new test series began.
The primary assumption in assessing the shrimp catch and bycatch reduction efficiency
of the TTED during these paired-trawl tests was that the experimental gear design (in this case
the TTED) was the factor responsible for difference in catch from the control trawl equipped
with a standard gear (in this case the TED). Consistent with past comparative towing
experiments (Mitchell et al. 2002), I sought to further reduced potential side bias, resulting in
differences in production from one side of the vessel to the other, by exchanging gear positions
to collect data for an equal number of tows with the TTED and TED positioned in the outside
port and starboard trawls. These changes occurred every two or three days so as to not hinder
the vessel's shrimp production. Exchanging gear positions involved the removal of the TED
32

extension still attached to its codend and the reinstallation of this gear in the outboard net
located on the opposite side of the vessel.
Data collected during each tow included tow duration (hours), fishing depth (feet),
vessel GPS position (start/stop locations), vessel speed (nautical miles along the ground), and
gear operation observations (TED problems, non TED problems). The decisions on where
(depth, location), when (day/night, duration) and at what speeds to trawl were at the captain's
discretion. Fishing operations were interrupted only to maintain uniform fishing performance
and to allow maintenance of the trawls. During these selectivity experiments, the captain
performed tows that were typical of commercial fishing operations.
Tows that occurred with no apparent technical problems to the ship or trawl gear were
considered "successful" and used in the final analyses. Data collected from tows with non-TED
or TTED related problems were coded as unsuccessful and were not included in the analyses.
Potential non-TED related problems included loose bag lines, obstruction of the trawl with large
debris, fouled tickler chains, torn nets, twisted bags, and "mud tows". If it was apparent the
TTED or TED caused a problem, (i.e. clogging of the TED or TTED by debris or animals) then the
tow was recorded as 'TED clogged' and the data were used in the analysis.
Data were collected to compare catches of small finfish, large finfish, crustaceans,
sharks, rays, and jellyfish from the TTED and TED trawls. Catches from the trawls were kept
separate on the back deck using wooden structures that were adapted to fit the dimensions of
each boat participating in the study. Following each tow, total catch weight and total shrimp
weight were determined for the TTED and TED trawls. To calculate total catch weight after each
tow the total number of standard baskets of bycatch from the TTED and TED trawls was
determined and this number was multiplied this by the weight of one randomly selected basket
from each respective trawl. If the catch was deemed too large to be measured (>14 baskets) the
33

total number of baskets was estimated, and recorded as an "estimate" and therefore could not
be used in bycatch reduction analysis.
To obtain a total shrimp weight from each TTED and TED trawl, crewmembers and the
researcher removed all shrimp from the catch, which was then weighed. Select bycatch species
such as Red Snapper and all sharks were individually measured and weighed for the entire catch
from TTED and TED trawls. When possible, these species were released alive and venting of the
red snapper swim bladder was conducted to increase the chance of survival of these fish.
To evaluate the species composition of the total catch from each TTED and TED trawl, a
subsample of one basket (approximately 32 kg) was sorted into predetermined taxonomic
categories (species, family, etc). Shrimp were separated from the subsample, individuals were
counted and the total was weighed to determine average shrimp size. In accordance with the
NMFS observer protocol, non-penaeid crustaceans (crustaceans), non-crustacean invertebrates
and debris (rocks, logs, trash, dead seashells, sea grass) were grouped and weighed. The
weights and counts of fish species of commercial, recreational and/or ecological importance
were also recorded from the subsamples individually. These included: Atlantic Croaker, Black
Drum, Cobia, King Mackerel, Lane Snapper, Longspine Porgy, Red Drum, Sea Trout, other
snapper (other than Red Snapper), Southern Flounder, Spotted Sea Trout, Spanish Mackerel,
Vermilion Snapper, and Gulf Flounder. Gulf Flounder and King Mackerel found in the subsample
were individually weighed and measured. The remaining finfish species from the subsample
were grouped into the "other" finfish category (Scott-Denton et al. 2012).
A concern with the NMFS observer protocol raised in the literature has been the lack of
randomness of sub-samples. Based on the NMFS observer protocol, observers are required to
mix the catch with a shovel to ensure a random sample, but this is sometimes difficult to do
because of the weight of the catch, the position of the culling tray, the size of the boat and/or
34

weather conditions (Diamond 2004). In addition, some species such as crabs may redistribute
themselves after the catch is mixed by simply walking away, making it difficult to get a truly
random sample. Nonetheless, I attempted to collect a random sample as soon as the catch was
culled on the back deck to reduce the amount of time that the crabs had to escape the catch.
Due to the low abundance of sharks relative to other finfish species captured in trawls,
ensuring that shark species are adequately accounted for in a subsample may be difficult
(Belcher et al. 2010). To address this issue I collected information from all sharks captured in
both the TTED and TED trawls. In comparison with data collection in 2012, where I sometimes
recorded grouped weights of sharks in an attempt to release as many as possible alive, in 2 0 1 3 ,1
measured the length of each individual shark encountered, a practice that likely increased shark
mortality. If there was any uncertainty regarding the species identity of a shark, pictures of the
individual's mouth, head (top, bottom and profile) were taken so that a specialist could be
consulted to confirm species identity.
Statistical Analysis
Catch data from the paired tows were used to estimate the efficiency of the TTED
relative to the TED. Data from the TED and TTED-equipped trawls were analyzed to determine if
there was a difference in the retention of particular species or species grouping (groups). Two
approaches were used to analyze the data from this study. The first one is commonly used by
the National Marine Fisheries Service scientists and consists of comparing CPUEs of
experimental and control gears for individual species or group weights for every tow in the data
set. Additionally, a CPUE analysis on numbers of individuals was conducted. Paired t-tests of
CPUEs based on numbers and weights of animals were used to determine if differences were
significant. To run the t-test I used the PROC TTEST procedure in SAS/STAT* v 9.2 software. To
35

satisfy the assumptions of the statistical test, the data were tested for normality with SAS/STAT*
PROC UNIVARIATE. In addition to the paired t-test approach, a generalized linear mixed model
(GLMM) was constructed to evaluate the differences in relative efficiency of the TED compared
to the TTED for species and groups (Holst et al. 2009).
Fishing operations in Georgia (GA), Texas (TX), and Mississippi (MS) varied by vessel size,
trawl design, trawl area, fishing time, catch composition, TED design, etc., and this prevented
pooling of the data from these regions. Therefore modeling of CPUE and General Linear Mixed
Models (GLMM) analyses were conducted on an area by area basis. For GLMMs the analytical
approach was based on the method described in Cadigan et al. 2006. I assumed that the
differences in the designs of the TED and TTED were the only two differences between the
trawls for each cruise. The hypothesis tested posits that both gears have a unique catchability
(q) where qr represents the q of the TTED and qf represents the q of the TED. The efficiency of
the TTED relative to the TED is equivalent to the ratio of the two qs:
A = — w« /
The q of each gear was not measured directly, but the random effects model accounts
for the differences in animal density encountered by both gears and therefore the differences in
observed catches, for all trips, reflected the difference in qs of the TED and TTED.
C(V represent the species or grouping catch at station /' by gear v, where v=r denotes
TTED and v=f denotes TED. Air represent the species or grouping density for the /th station by the
TTED and Ajf represents the densities encountered by the TED. I treated station as a random
variable since I assumed that animal volume and gear performance, at tow /, are subject to
variations in animal patch size (i.e. abundance) and coverage (i.e. door spread) during a paired
tow. The probability that an animal was captured during a tow is given as qr and qf. These
36

probabilities may differ for each vessel, but are expected to be constant across stations.
Assuming that capture follows a Poisson distribution where the mean is equal to variance, then
the TTED and TED catch is given by:
where <5, =log (Air/ Alf) and A is the animal density (count). For each station, if the standardized
density of animals encountered was the same for the TED and TTED then <5,-0. If the TED and
TTED encountered the same animal density for a given tow (i.e. Air= A,/), then p can be estimated
via a Poisson generalized linear model (GLM). The GLM approach is complicated because n can
be very large if many tow stations and length classes are sampled (i.e. n > 1000), which means
that there are many g parameters to estimate. This also complicates constructing confidence
intervals for p (Cadigan et al. 2006). Though this was not the case for my data (no single species
with n>1000), I chose to use the conditional distribution of the catch by the TTED at station /,
given the total non-zero catch of both gears at that station, c, represents the observed value of
the total catch. The conditional distribution of Cir given C,-c, is binomial with:
where p=p/{l+p) is the probability that an animal is captured by the TTED. In this approach, the
only unknown parameter is p and the requirement to estimate p for each station is eliminated,
which is a condition otherwise required by the GLM approach (equations 2 & 3). For the
binomial distribution, £(Cjr)=c,p and Var{Cjr)-Cip/(l-p), therefore:
(2 )
and:
ElPir)=qrK = PH™ p(3) (3)
(4)
log - 1 = log(p) = PU - p )
(5)
37

However, the model in equation 5, does not account for spatial heterogeneity in animal
densities encountered by the TED and TTED for a given tow. If such heterogeneity does exist
then the model becomes:
/ \log 7^ — = P + S, (6)
v - p )
where <5, is a random effect assumed to be normally distributed with a mean=0 and v a ria n ce ^ .
This model is used to estimate the gear effect exp(60) when catch per tow is pooled over
lengths.
In general, TEDs and selective grids are engineered to exclude (select) animals based on
their size, of which length is a proxy. For this study, due to the differences in bar spacing, the
expectation is that the TED will capture animals at different lengths (/) than the TTED. Models
that account for length effects are extensions of the models described previously, which are
used to define the relative efficiency of the total number of animals captured per tow. Again,
assuming differences in standardized animal density exist between tows, a binomial logistic
regression GLMM for a range of length groups would be:
1 - P i
= J30 + S, + & l ,S , ~ N (0 ,c r 2) , i = (7)
For this model, the intercept (60) can vary randomly with each station.
Adjustments fo r sub-sompling of the catch
38

Due to large catch volume, all tows were subsampled and model adjustments were
required to account for this. Analysis must account for subsampling to ensure that common
units of effort are compared. Let qir equal the sub-sampling fraction of the catch at station /' for
the r (TTED). This adjustment results in a modification to the logistic regression model defined as
an offset in logistic regression to give a statistical frame of reference:
My analysis of the efficiency of the TED relative to the TTED consisted of multiple levels
of examination. For animals with length measurements the full model consisted of unpooled
(by length) catch data. Model fit was assessed by Akaike's Information Criterion (AIC). If AIC
and factor significance indicated that length was not significant in predicting relative efficiency,
shark, hammerheads and Red snapper data were pooled over length. For all other species, the
full model consisted of pooled (numbers of individuals) catch data. The random intercept model
was evaluated for all species and species groups to assess the relative differences in total catch
of individuals (see equation 6). I then determined percent difference in relative efficiency based
on the results of the intercept estimate at the mean value for the variables determined to be
significant predictors of relative efficiency. To fit the GLMM I used the SAS/STAT* PROC
GLIMMIX routine.
I used General Linear Models (GLMs) when the GLMM did not converge to yield
parameter estimates to evaluate the shrimp and some rare species catch efficiency in the TTED
relative to the TED-equipped trawl. To create this GLM I simply reduced the GLMM described
( P )log -— = /30 + 8t + (/?, */,.) + logU + a J
39

above by removing the random effect. To fit a GLM, I used the SAS/STAT* PROC MIXED routine
of the v. 9.2 software.
Before running GLMM or GLM, I conducted a correlation analysis on all variable for all
cruises to insure that my variables where independent from one another (Table 1) using the
SAS/STAT* PROC CORR routine.
40

CHAPTER 3: 2012 GEAR COMPARISONS
Introduction
Bycatch of turtles and finfish is a serious problem in the shrimping industry. The use of
turtle exclusion devices (TED) in shrimp trawls has greatly reduced sea turtles bycatch; however,
their effectiveness in excluding fishfish bycatch has not been successful (GMFMC 2007). The
trash and turtle excluder device (TTED) is a new approach to decrease finfish bycatch on shrimp
vessels. The TTED differs from the TED in that it has five centimeters of spacing between the
bars of the grid rather than the 10.2 centimeters of spacing between the bars of the TED. The
objective of this research was to compare the capture efficiency of the TTED-equipped trawl
relative to the TED-equipped trawl in reducing bycatch and maintaining shrimp catch.
Comparisons of the TTED and TED were conducted in the summer of 2012 on three
cruises in the offshore shrimp fishery of the South Atlantic Bight and Gulf of Mexico. This
chapter describes the results of those comparisons including the number of days at sea, tow
times, tow depths, number and weight of each species or species group caught for each cruise.
Fork length measurements were obtained for sharks (all species) and Red Snapper, two groups
with important management implications associated with their bycatch by the offshore shrimp
fishery.
Catch per unit effort (CPUE) was estimated for each tow, both by weight and numbers
of individuals. The t-tests were conducted on these data as described in Chapter 2 to compare
CPUEs of the TTED and TED for all three cruises. Models were developed to provide insight into
factors influential in describing the observed trends in the relative capture efficiency of species
and species groups between the TTED and TED equipped trawls.
41

Materials and Methods
Captains of shrimp fishing vessels in Georgia (GA), Mississippi (MS), Louisiana (LA) and
Texas (TX) were offered the opportunity to participate in this TTED study. One GA captain was
willing to volunteer his time and vessel for the study. With the help of the Gulf and South
Atlantic Fisheries Foundation (GSFF) and the NOAA Southeast Fisheries Science Center's (SEFSC)
Pascagoula Lab, two more captains, one from TX and on from MS, volunteered to participate.
Cruise dates were then coordinated.
During the 2012 field season, the NMFS shrimp observer protocol was followed (see
Chapter 2). However, a few procedures were modified to accommodate the short time intervals
between tows on the GA cruise. For example, when a large number of Atlantic Sharpnose Sharks
were caught during the GA cruise, individuals of similar sizes were placed into baskets and
weighed. Sharks were then counted for each size category and immediately released
overboard. Since the TTED-equipped trawl did not catch many adult sharks relative to the TED-
equipped trawl, sampling of sharks started with adults on the TED side and then moved on to
the TTED-equipped trawl side. Weights of individuals were estimated by dividing the basket
weight by the number of individual Atlantic Sharpnose Sharks in the basket. This sampling
procedure prevented exposing the sharks to air for extended periods of time, and most were
released alive. When sharks were less abundant, all individuals were measured.
A length-weight conversion was used to estimate lengths of all individual Atlantic
Sharpnose Sharks that were not measured individually. The length-weight relationship is
presented in the 2013 coastal shark stock assessment (SEDAR 34):
Fork length (cm)=exp ((ln(weight (kg)/ 5.56 * 10“6))/3.074)
This conversion was only conducted for the GA cruise, when shark lengths were not
directly measured to minimize shark mortality during sampling.
42

During the MS cruise, sea robins Triglidae spp., lizardfishes Synodontidoe spp., and
larger crabs (Rooster Crab Calappa flam m ea and blue crabs Collinectes spp.) were separated
into large and small size categories within each group to better quantify observed differences in
the capture of these species groups between the TTED-equipped trawl and the TED-equipped
trawl. Large sea robins were defined as weighing more than 0.175 kg, large lizardfishes were
defined as weighing more than 300 g, and large crabs (unclassified) were defined as weighing
more than 200 g. These designations were made based on my observation that large individuals
were less frequent, but not absent, in the TTED-equipped trawl catch. Large individuals were
counted and weighed, while small individuals were only weighed. Separating sea robins,
lizardfishes and crabs into large and small size categories was only conducted on the MS cruise.
The comparative towing studies were completed during three cruises over the course of
71 days. The GA, TX and MS cruises lasted 13, 32, and 27 days at sea, respectively (Table 2). All
three vessels were steel-hulled, and each had a different length, engine power and make,
headrope length, trawl shape, and door type. Door type is an important factor since the
hydrodynamic effects from the doors spread open the trawl. When water is accelerated around
the backside of the doors, it creates a negative pressure, generating lift, or a spreading force in
the case of trawl doors. The doors used on the TX cruise were cambered, vented, oval in shape,
and were much shorter horizontally and taller vertically than the wood and aluminum doors
from the GA and MS cruises, respectively. The doors from the GA and MS cruises were flat,
rectangular boards. Other components of the shrimp trawl gear that were measured in this
study, such as trawl shape, bridle length, and cable are summarized in Table 3. The technical
differences between these vessels reflect but are not fully representative of the heterogeneity
of the shrimp-fishing fleet.
43

Initially, t-tests on CPUE were conducted by cruise for each group of bycatch species to
determine whether catch differences between TTED-equipped trawls and TED-equipped trawls
were significant. General linear mixed models (GLMM) and general linear models (GLM) were
used to calculate differences in catch efficiency and also to determine those parameters which
best predicted catch efficiencies.
Results
On the GA cruise, fishing occurred off the coasts of South Carolina and Georgia (Figure
9). On the TX cruise, fishing began offshore of Cameron, LA, and then moved into TX offshore
waters for the opening of the shrimping season on July 15th. For the MS cruise, fishing occurred
from the MS state line south to the mouth of the Mississippi River in Louisiana. For the GA, TX,
and MS cruises, there were 35, 71, and 43 comparative tows of which 31, 44 and 35 were valid
(as defined in Chapter 2), respectively. Valid tows from each cruise were partitioned so that the
TTED was installed in the port and the starboard nets almost equally. Tow characteristics,
including tow depth, tow times, and time of fishing, are summarized in Table 4.
CPUE Total Catch - The total catch weights (target catch and all bycatch) of the TTED-
equipped trawl and the TED-equipped trawl on the GA cruise were 3,159 kg and 5,201 kg,
respectively (Table 5). The total catch weight for the TTED-equipped trawl and the TED-
equipped trawl on the TX cruise were 10,584 kg and 10,716 kg, respectively. The total catch
weight for the TTED-equipped trawl and TED-equipped trawl on the MS cruise were 7,657 kg
and 8,238 kg, respectively. The total catch reduction of the TTED-equipped trawl relative to
TED-equipped trawl was 39.27%, 1.27% and 7.05% for GA, TX, and MS, respectively. CPUE
calculations and t-tests were not conducted on total catch weight.
44
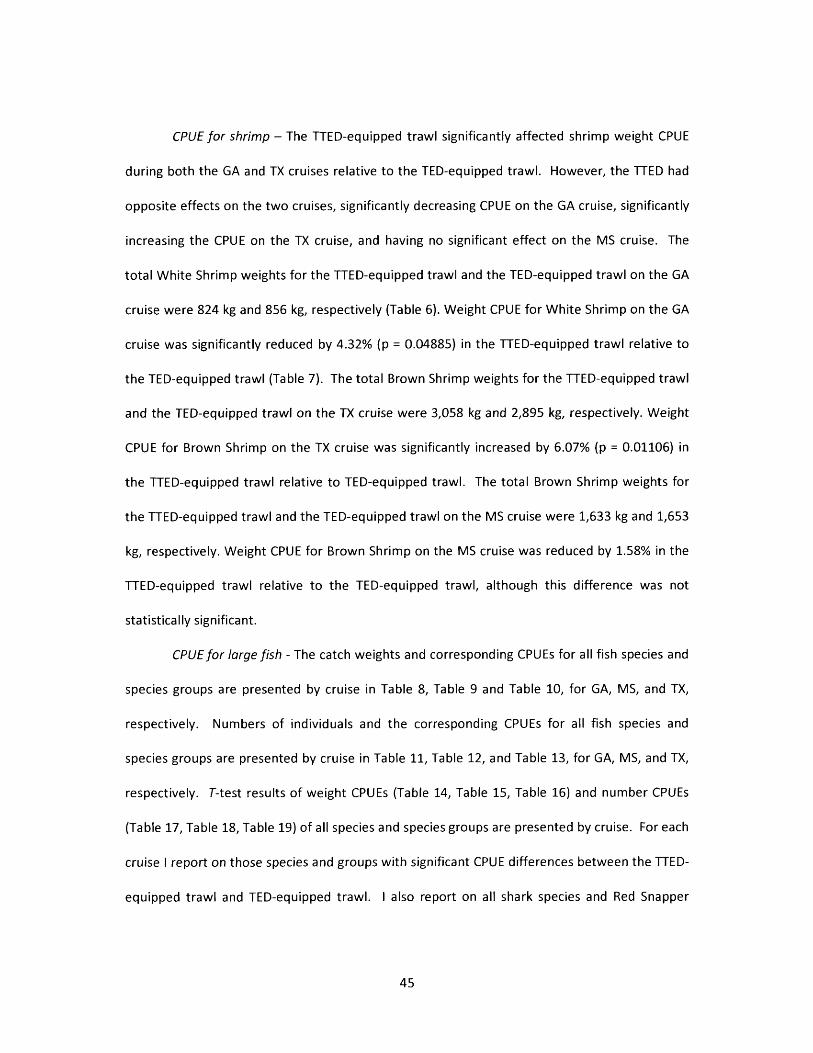
CPUE for shrimp - The TTED-equipped trawl significantly affected shrimp weight CPUE
during both the GA and TX cruises relative to the TED-equipped trawl. However, the TTED had
opposite effects on the two cruises, significantly decreasing CPUE on the GA cruise, significantly
increasing the CPUE on the TX cruise, and having no significant effect on the MS cruise. The
total White Shrimp weights for the TTED-equipped trawl and the TED-equipped trawl on the GA
cruise were 824 kg and 856 kg, respectively (Table 6). Weight CPUE for White Shrimp on the GA
cruise was significantly reduced by 4.32% (p = 0.04885) in the TTED-equipped trawl relative to
the TED-equipped trawl (Table 7). The total Brown Shrimp weights for the TTED-equipped trawl
and the TED-equipped trawl on the TX cruise were 3,058 kg and 2,895 kg, respectively. Weight
CPUE for Brown Shrimp on the TX cruise was significantly increased by 6.07% (p = 0.01106) in
the TTED-equipped trawl relative to TED-equipped trawl. The total Brown Shrimp weights for
the TTED-equipped trawl and the TED-equipped trawl on the MS cruise were 1,633 kg and 1,653
kg, respectively. Weight CPUE for Brown Shrimp on the MS cruise was reduced by 1.58% in the
TTED-equipped trawl relative to the TED-equipped trawl, although this difference was not
statistically significant.
CPUE fo r large fish - The catch weights and corresponding CPUEs for all fish species and
species groups are presented by cruise in Table 8, Table 9 and Table 10, for GA, MS, and TX,
respectively. Numbers of individuals and the corresponding CPUEs for all fish species and
species groups are presented by cruise in Table 11, Table 12, and Table 13, for GA, MS, and TX,
respectively. T-test results of weight CPUEs (Table 14, Table 15, Table 16) and number CPUEs
(Table 17, Table 18, Table 19) of all species and species groups are presented by cruise. For each
cruise I report on those species and groups with significant CPUE differences between the TTED-
equipped trawl and TED-equipped trawl. I also report on all shark species and Red Snapper
45

regardless of significance in difference of CPUE in the TTED-equipped trawl relative to the TED-
equipped trawl.
GA Large Elasmobranchs CPUE - Weight CPUEs for adult Atlantic Sharpnose Sharks,
neonate Atlantic Sharpnose Sharks, Bonnethead Sharks, Blacknose Sharks, rays and skates group
were reduced by 99.9% (p <0.0001), 41.1% (p = 0.0206), 99.3% (p = 0.0103) and 93.4% (p
<0.0001) in the TTED-equipped trawl relative to the TED-equipped trawl, respectively. Weight
CPUEs of Blacktip Shark, Smooth Hammerhead, Scalloped Hammerhead, Spanish Mackerel, and
Southern Flounder were reduced by 100%, 96%, 91.1%, 74.3% and 100%, in the TTED-equipped
trawl relative to the TED-equipped trawl, respectively. These reductions were not statistically
significant due to low frequency of occurrence of these animals. In comparison with weight
CPUE, the number CPUE indicated a reduction of 100% for Blacktip Sharks in the TTED-equipped
trawl relative to the TED-equipped trawl, and this difference was statistically significant (p =
0.0026).
TX Large Fish and Elasmobranches - For the TX cruise, the weight CPUE for adult Atlantic
Sharpnose Sharks was reduced by 93.4% (p = 0.0009) in the TTED-equipped trawl relative to the
TED-equipped trawl. The weight CPUEs of Dusky Shark, Blacknose Shark, Southern Flounder,
Atlantic Angel Shark, and the rays and skates group were reduced in the TTED-equipped trawl
relative to the TED-equipped trawl by 100%, 100%, 100%, 85.7%, and 76.5%, , respectively.
These reductions were not statistically significant. In comparison with weight CPUE, the number
CPUE indicated a reduction of 100% for Southern Flounder in the TTED-equipped trawl relative
to the TED-equipped trawl, and this was significant (p = 0.0492). Catches of Gulf Smoothhound
were reduced by 32.2% in weight and 28.24% in number in the TTED-equipped trawl relative to
the TED-equipped trawl. These reductions were not statistically significant. Four large Red
46

Snapper measuring 67cm, 70cm, 73.5cm, 74cm and 88.3cm were caught on this cruise, all by
the TED-equipped trawl.
MS Large Fish and Elasmobranchs - Weight CPUEs for large sea robins, Southern
Flounder, rays and skates group, large lizardfishes, and Red Snapper were reduced in the TTED-
equipped trawl relative to the TED-equipped trawl by 86.6% (p = 0.0001), 91.1% (p = 0.0051),
86.8% (p = 0.0055), 100% (p = 0.0057), and 61.3% (p = 0.0383), respectively. Catch weight
CPUEs for Spanish Mackerel, Louisiana Redfish, and Gulf Smoothhound were reduced in the
TTED-equipped trawl relative to the TED-equipped trawl by 100%, 100% and 95.2%,
,respectively. These reductions were not statistically significant. In comparison with weight
CPUE, the number CPUE indicated a reduction of 85.26% for Gulf Smoothounds in the TTED-
equipped trawl relative to the TED-equipped trawl, and this difference was significant (p =
0.0144).
CPUE small fish - In comparison with large fish, only a few small fish species on any
cruise exhibited significantly different weight CPUEs between the TTED-equipped and TED-
equipped trawls. Weight CPUEs for lizardfishes on the TX cruise and Spot on the MS cruise
showed increases of 26.3% (p = 0.0459) and 38.6% (p = 0.0304) in the TTED-equipped trawl
relative to the TED-equipped trawls respectively. Weight CPUEs for combined small fishes are
presented for each cruise in Table 20. Weight CPUE for small fishes on the GA cruise was
reduced by 37% (p < 0.0001) in the TTED-equipped trawl relative to the TED-equipped trawl
(Table 21). For the TX and MS cruises, weight CPUEs for small fishes were reduced in the TTED-
equipped trawl relative to the TED-equipped trawl by 5.8% and 2.9%, respectively, but these
reductions were not statistically significant.
CPUE crustaceans - On the GA cruise, weight CPUE for Horseshoe Crabs was reduced by
100% (p <0.0001) in the TTED-equipped trawl relative to the TED-equipped trawl. On the TX
47

cruise, weight CPUE for crustaceans (grouped) was reduced by 20.4% (p = 0.0012) in the TTED-
equipped trawl relative to the TED-equipped trawl. On the MS cruise, weight CPUE of large
crabs was reduced by 89.6% (p = 0.0008) in the TTED-equipped trawl relative to the TED-
equipped trawl. Additional analyses using General Linear Mixed Models (GLMM) further
supported these findings. In some cases the GLMM helped identify additional variables that
were significant predictors of the capture efficiency of certain species and species groups in the
TTED-equipped trawl relative to the TED-equipped trawl.
Generalized Linear Mixed Models - Generalized Linear Mixed Models (GLMM) were used
to evaluate the capture efficiency of the TTED-equipped trawl relative to the TED-equipped
trawl for different species and species groups. The variables evaluated by the model for the
different species and species groups are described in Chapter 2. The choice of the best-fit
model was determined by AIC. Table 22 summarizes the best model fit for the sharks and Red
Snapper length measurement (unpooled) data. When length was not identified as a significant
factor in the best-fit model for a species or species group, count (pooled) data were used to
determine the best-fit model (Table 23). Only the cruise/species combinations with significant
catch differences in the TTED-equipped trawl relative to the TED-equipped trawl are shown
graphically. Graphical representations of the observed catches, for pooled or unpooled data,
were based on the best-fit model. Model outputs provided estimates of the capture efficiency in
the TTED-equipped trawl relative to the TED-equipped trawl. For shark species, graphical
representations of catch in the TTED-equipped trawl relative to the TED-equipped trawl, even
when the differences in catch were not statistically significant, are shown in Figures 16 and 17.
For Atlantic Sharpnose Sharks on the GA cruise, and grouped carcharhinids (grouped for
all cruises), the best-fit model indicated that length was a significant predictor of the capture
efficiency of the TTED-equipped trawl relative to the TED-equipped trawl (Table 24). For other
48

shark species or species groups with length measurements, there were not enough data and/or
frequent zero observations that prevented the model from converging. Parameter estimates
from the length-based model for grouped carcharhinids was used to graph the differences in the
capture efficiency in the TTED-equipped trawl relative to the TED-equipped trawl for captures of
carcharhinids of various length (Figure 10). As illustrated in the graph, the TTED-equipped trawl
captured fewer carcharhinids of all size categories than the TED-equipped trawl. The graph also
indicated that the TTED excluded all carcharhinids above 65 cm in length whereas the TED-
equipped trawl captured individuals up to one meter long. Though length was not a predictor of
the capture efficiency for Gulf Smoothhound, the data show a general trend of fewer individuals
captured for all sizes in the TTED-equipped trawl relative to the TED-equipped trawl (Figure 11).
Small fish bycatch - The pooled model (number of individuals) for lizardfishes of the TX
cruise indicated a significant decrease of catch in the TTED-equipped trawl relative to the TED-
equipped trawl (Table 25). The lizardfishes model for the TX cruise also indicates that tow depth
was a predictor for the capture of the lizardfishes by the TTED-equipped trawl relative to the
TED-equipped trawl. Figure 12 shows, the model results for lizardfishes of the TX cruise. The
intercept model without variables is the best-fit model for large sea robins of the MS cruise, sea
trouts of the TX cruise, and large crabs of the MS cruise (Table 26). This model indicates that
there was a significant decrease in catches of large sea robins of the MS cruise, sea trouts of the
TX cruise, and large crabs on the MS cruise in the TTED-equipped trawl relative to the TED-
equipped trawl. Figure 13 shows catch data for large seas robins on the MS cruise, sea trouts on
the TX cruise (Figure 14), and large crabs (rooster and blue crab) (Figure 15) on the MS cruise for
the TTED-equipped trawl relative to the TED-equipped trawl. The majority of the models that
used count data (pooled) (Table 26) indicate a reduction in catch efficiency, although not
statistically significant, for small fish species in the TTED-equipped trawl relative to the TED-
49

equipped trawl. Many models for species and groups analyzed in the GLMM framework could
not calculate parameter estimates of relative efficiency as they failed to converge. This
occurred because small numbers of paired tows and/or frequent zero observations for these
infrequently encountered species or species groups did not provide enough data for the more
complex GLMM. I therefore removed the random variables of the full GLMM, transforming it
into a general linear model (GLM) capable of analyzing data from these 'rarer7 species.
General Linear Model - The GLMs for comparing the capture efficiencies of the
infrequently encountered species in the TTED-equipped trawl relative to the TED-equipped trawl
were generally able to return parameter estimates of relative efficiency (the models converged)
(Table 27). Catches of Atlantic Sharpnose Sharks on the TX and MS cruises (Figure 16),
Bonnethead Sharks on the GA cruise (Figure 17), rays and skates group on the GA and MS
cruises (Figure 18), Blackear Bass Serranus atrobranchus on the TX cruise (Figure 19), Vermillion
Snapper Rhomboplites aurorubens on the TX cruise (Figure 20), and whitings Merluccius spp. on
the GA cruise (Figure 21) all showed significant reductions in capture efficiency in the TTED-
equipped trawl relative to the TED-equipped trawl. All other species modeled using the GLM
had negative signs for the intercept parameter estimates, which indicated a reduction, although
not statistically significant, in the capture efficiency of the TTED-equipped trawl relative to the
TED-equipped trawl for small fish species (Figure 22). Only Red Porgy Pagrus sedecim on the TX
cruise had a positive parameter intercept, which indicated an increase, although not statistically
significant, in the capture efficiency of the TTED-equipped trawl relative to the TED-equipped
trawl (Table 27). GLMs for Blacknose Sharks, Dusky Sharks and Spot on the TX cruise did not
converge, since these species were encountered only once during this cruise (Table 27).
Shrimp catch (weight) retention was directly measured for the TTED-equipped trawl and
the TED-equipped trawl for every tow. Shrimp catch weights from the TTED-equipped trawl and
50

TED-equipped trawl on the GA, TX and MS cruises were compared using GLMs. The best-fitting
model for shrimp catch on the GA cruise was the intercept model (Table 28). The best-fit model
for Brown Shrimp for both the TX and MS cruises indicated that total bycatch reduction (kg) was
a predictor for catch efficiency in the TTED-equipped trawl relative to the TED-equipped trawl
(Figure 23). This indicates that total bycatch weight reduction and shrimp catch weight
decreased when bycatch was reduced. Model results provided estimates for catch efficiency of
the TTED-equipped trawl relative to the TED-equipped trawl. The catch of White Shrimp on the
GA cruise was reduced by 3.77%, in the TTED-equipped trawl relative to the TED-equipped
trawl, but this reduction was not statistically significant. The catch of Brown Shrimp on the TX
cruise was increased by 5.3% (p = 0.0277) in the TTED-equipped trawl relative to the TED-
equipped trawl. The catch of Brown Shrimp on MS cruise was reduced by 1.26% in the TTED-
equipped trawl relative to the TED-equipped trawl, but this reduction was not statistically
significant.
Discussion
The 2012 sampling season provided an opportunity to compare shrimp retention and
bycatch reduction between TTED-equipped trawls and TED-equipped trawls. The results of
these experiments clearly indicate that size is a factor in determining which animals will be
captured or excluded by the TTED-equipped trawl. The TTED captured fewer elasmobranchs
than the TED-equipped trawl for all size classes encountered during the cruises, while catches of
small animals, such as shrimp and small fishes, were not drastically reduced in the TTED-
equipped trawl relative to the TED-equipped trawl. Analytical modeling techniques suggest that
bycatch reduction is a significant predictor of TTED shrimp retention efficiency: when more
bycatch is evacuated by the TTED or the TED, shrimp catch is also reduced by the TTED or TED
51

respectively. Modeling results indicating substantial small fish bycatch reduction efficiencies and
the results indicating that carcharhinids and lizardfishes catches on the TX cruise were affected
by tow depth, require further attention.
Maintaining target catch rates is essential to the shrimp industry and will ultimately
determine the acceptance of innovative fishing gears. Commercial shrimp boats participating in
this study were not compensated, and there was an understanding that if shrimp losses were
caused by the TTED, then use of the experimental gear would cease. In Georgia, I did not
experience shrimp loss for the first nine tows. However, consistent shrimp losses by the TTED-
equipped trawl were observed between tows 9 - 22. When hauling tow 21, the angle of the
TTED was observed to have decreased. Unfortunately, the duration for which the TTED angle
was altered is not known and while the angle of inclination of the TTED after tow 21 was not
measured, the captain estimated it at well below 45°. This observed change of angle may have
been caused by meshes stretching or because the grid was not properly secured in the webbing.
After readjustment of the TTED angle, which was executed under less than ideal conditions (a
moving sea with no angle measurement), shrimp loss was no longer observed for tows 22 - 32.
Upon returning to port, the TTED angle was measured to be 60°, or 5° more than the mandated
maximum angle of 55°. TTED angle was maintained at 55°-50° throughout the TX and MS
cruises and both CPUE and GLMs did not indicate shrimp loss by the TTED-equipped trawl
relative to the TED-equipped trawl. Interestingly, GLM models for TX and MS shrimp weight
data indicated that total bycatch weight reduction was a predictor of the shrimp capture
efficiency of the TTED-equipped trawls relative to the TED-equipped trawl. Based on models for
TX and MS, I expected that total bycatch weight reduction would also be a predictor of the
shrimp capture efficiency of the TTED-equipped trawl relative to the TED-equipped trawl for the
GA cruise, since shrimp loss occurred and bycatch was reduced by 37%. However, the shrimp
52

model for the GA cruise did not identify total bycatch reduction as a predictor of catch efficiency
as there was little contrast between bycatch reduction and shrimp catch data. Indeed, total
bycatch weight reduction in the TTED-equipped trawl relative to the TED-equipped trawl
occurred for every tow regardless of shrimp loss or gain, which may explain the GA model
results. The GA cruise shrimp weight CPUE t-test indicated significant shrimp loss of 3.7% by the
TTED-equipped trawl relative to the TED-equipped trawl but, as noted above, some tows from
this cruise may have been impacted by the TTED-equipped trawls reduced angle.
Examining the parameter estimates from the pooled GLM as well as the scatter plots of
shrimp catches, it is clear that the catch efficiency of shrimp in the TTED-equipped trawl relative
to the TED-equipped trawl was not reduced. Based on a combination of results from the three
cruises in which the TX cruise had a significant gain of shrimp and the MS cruise had a non
significant loss, the null hypothesis that the TTED shrimp retention is not different from the
shrimp retention of a TED, cannot be rejected. To this I add the caveat that results may be
dependent on the inclination angle of the TTED since this seems to be a factor that alters the
shrimp capture efficiency in the TTED-equipped trawl relative to the TED-equipped trawl.
Shark Bycatch - Shark data from the GA cruise included the majority of the observations
for shark species in the entire study. The TTED was effective in reducing the capture of large
quantities of Atlantic Sharpnose Sharks on the GA cruise. Length-weight conversion factors
were used to estimate lengths of all individual Atlantic Sharpnose Sharks that were not
individually measured on the GA cruise. Carcharhinid sharks were grouped across cruises to plot
relative efficiency of TTED-equipped trawls and TED-equipped trawls as a function of length for
as many individuals and lengths as possible. Triakiad sharks (smoothhounds) were excluded
from the carcharhinid group based on difference in body shape: Carcharhinids are characterized
as having flattened bodies with extended heads, while triakiads have slender bodies and non-
53

laterally expanded heads (Castro 2011). Driven primarily by the reduction of large fish by the
TTED-equipped trawl, the null hypothesis that the fish bycatch retention of the TTED is not
different from the fish bycatch retention of the TED was rejected. The alternative hypothesis,
that the fish bycatch retention of the TTED is less than the fish bycatch retention of the TED was
supported by the data.
Small Fish - For the GA cruise, t-tests of CPUEs of grouped small fishes indicated
significant reductions in capture efficiency of the TTED-equipped trawl relative to the TED-
equipped trawl. For the TX and MS cruises, the small fishes group included all the small fishes
except for Red Snapper, while on the GA cruise this group included both small fishes and
Cannonball Jellyfish Stomolophus meleagris, which sometimes contributed over half the weight
of TED-equipped trawl catches. For the GA cruise, the subsampling procedures described in
Chapter 2 were not completed and the small fishes weight in the GA cruise included jellyfish. I
therefore suggest a cautious interpretation of the significance in reduction of small fishes
bycatch on the GA cruise and propose that other factors may have contributed to the observed
difference in small fishes for this cruise. These factors include escapement of small fishes during
large fish bycatch exclusion, small fishes escaping with low TTED angle, and finally, the active
use of BRDs in both cod-ends. Small fish might have escaped more from the TTED-equipped
trawl relative to the TED-equipped trawl because the TTED's flap was probably more affected by
evacuated large animals (i.e., jellyfish, sharks and horseshoe crabs). The TED side caught many
more large animals than the TTED-equipped trawl side. This indicates that the TTED-equipped
trawl evacuated large animals and therefore the flap was likely opened more frequently,
permitting the escape of small fishes from the TTED-equipped trawl more frequently than the
TED-equipped trawl. In addition to the effect of large animal bycatch reduction on small fishes
54

bycatch, the TTED's reduced angle may have contributed to high levels of bycatch reduction
observed on the GA cruise.
Another factor that may have contributed to observed small fishes bycatch reduction
was the active use of BRDs on the GA cruise since a Letter of Authorization (LOA) from NOAA
SEFSC to deactivate mandatory BRDs for the trip was not procured. Fisheye BRDs used during
the GA cruise may have confounded the effects of bycatch reduction of small fishes in the TTED-
equipped trawl relative to the TED-equipped trawl. Both fisheye BRDs were identical in
dimensions, located top central position, behind the TED extension and directly in front of the
chafing gear of the cod-end. Given that the BRDs were identical for both trawls, their effect on
small fishes bycatch may have been similar. However, it is also possible that the reduced catch
of large animals by the TTED on the GA cruise may have improved the efficiency of the fisheye
to reduce bycatch of small fishes in the TTED-equipped trawl relative to the TED-equipped trawl.
If, for example, the catch reaching the codend was 'cleaner' (i.e. fewer large animals) in the
TTED-equipped trawl relative to the TED-equipped trawl, then the small fishes may have had a
better opportunity to school and orient themselves towards the fisheye and escape. Again, the
many variables that were part the GA experiments do not allow for a meaningful conclusions
regarding small fishes bycatch when compared to the TX and MS cruises. In comparison with
the TTED catch from the GA cruise, the TTED catches from the TX and MS cruises were not
affected by reduced angle of the TTED or jellyfish. Driven primarily by lack of small fish bycatch
reduction by the TTED in TX and MS, the null hypothesis that the fish bycatch retention of the
TTED is not different from the fish bycatch retention of the TED was not rejected.
Intercept parameter estimates and resulting percent differences in the catches of
lizardfishes from the TX cruise, Butterfish, from the TX and MS cruise, sea robins from the TX
cruise, and Rock Seabass Centropristis philodelphico, from the TX cruise were reduced. In fact,
55
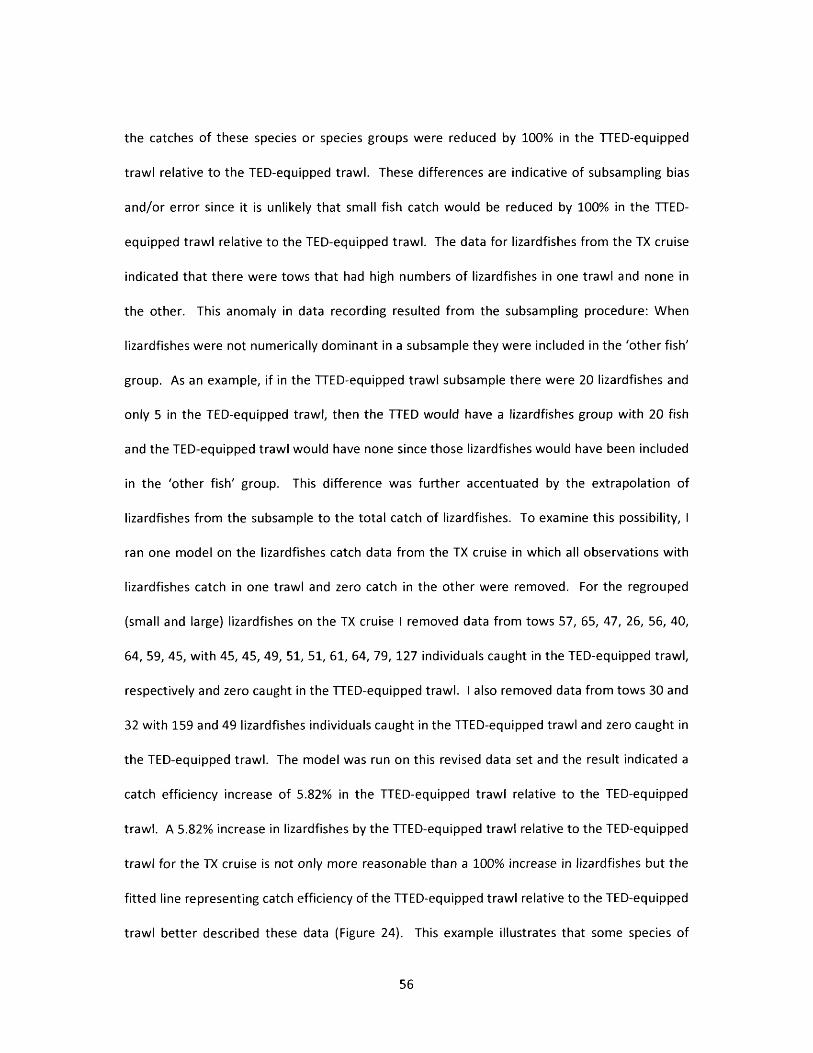
the catches of these species or species groups were reduced by 100% in the TTED-equipped
trawl relative to the TED-equipped trawl. These differences are indicative of subsampling bias
and/or error since it is unlikely that small fish catch would be reduced by 100% in the TTED-
equipped trawl relative to the TED-equipped trawl. The data for lizardfishes from the TX cruise
indicated that there were tows that had high numbers of lizardfishes in one trawl and none in
the other. This anomaly in data recording resulted from the subsampling procedure: When
lizardfishes were not numerically dominant in a subsample they were included in the 'other fish'
group. As an example, if in the TTED-equipped trawl subsample there were 20 lizardfishes and
only 5 in the TED-equipped trawl, then the TTED would have a lizardfishes group with 20 fish
and the TED-equipped trawl would have none since those lizardfishes would have been included
in the 'other fish' group. This difference was further accentuated by the extrapolation of
lizardfishes from the subsample to the total catch of lizardfishes. To examine this possibility, I
ran one model on the lizardfishes catch data from the TX cruise in which all observations with
lizardfishes catch in one trawl and zero catch in the other were removed. For the regrouped
(small and large) lizardfishes on the TX cruise I removed data from tows 57, 65, 47, 26, 56, 40,
64, 59, 45, with 45, 45, 49, 51, 51, 61, 64, 79, 127 individuals caught in the TED-equipped trawl,
respectively and zero caught in the TTED-equipped trawl. I also removed data from tows 30 and
32 with 159 and 49 lizardfishes individuals caught in the TTED-equipped trawl and zero caught in
the TED-equipped trawl. The model was run on this revised data set and the result indicated a
catch efficiency increase of 5.82% in the TTED-equipped trawl relative to the TED-equipped
trawl. A 5.82% increase in lizardfishes by the TTED-equipped trawl relative to the TED-equipped
trawl for the TX cruise is not only more reasonable than a 100% increase in lizardfishes but the
fitted line representing catch efficiency of the TTED-equipped trawl relative to the TED-equipped
trawl better described these data (Figure 24). This example illustrates that some species of
56

small fishes, and in particular those that are not listed as species of interest in the NMFS
observer protocol, may not have accurate count or weight data for every tow. Other species
that were not considered as species of particular interest but were analyzed here include sea
robins, Rock Seabass, Blackear Bass, Oscillated Flounder, and Red Porgy.
The GLMM model on grouped carcharhinids indicated that tow depth was a significant
variable for predicting catch efficiency in the TTED-equipped trawl relative to the TED-equipped
trawl. In this case however, sampling artifact is likely the reason tow depth was determined to
be a significant predictor. Neonate Atlantic Sharpnose Sharks were captured on the GA cruise
only, where tows occurred in much shallower waters than those sampled on the TX and MS
cruises. Based on the GA cruise depth and neonate Atlantic Sharpnose shark catch, the model
determined that tow depth was a factor in determining the capture efficiency of the TTED-
equipped trawl and the TED-equipped trawl for grouped carcharhinids. For some larger fish
species such as Blacknose, Blacktip, Smoothhounds, Scalloped Hammerhead and Bonnethead
sharks, rays and skates, Southern Flounder, and Spanish Mackerel, the parameter estimates
were high and resulted in high bycatch reduction estimates (30-100%) because there were only
one to three individuals in the TTED-equipped trawl relative to the TED-equipped trawl, which
had two to ten times as many animals (Table 29). In cases where there was only one individual
captured by the TED-equipped trawl and none captured by the TTED-equipped trawl, such as for
Blacknose and Dusky sharks on the TX cruise, the models did not converge.
Some of the differences in fishing and experimental procedures that occurred on the
GA, TX and MS gear evaluations in 2012 were considered for the planning the 2013 field season.
After having conducted my 2012 comparative towing study on the east coast and the GOM in
2012, I learned that the GOM may be better suited for collecting data in accordance with the
NMFS observer protocol. Difficulties with the research protocol in the field were encountered
57

predominantly during the GA cruise. In addition to the differences in sampling procedures
conducted on the GA cruise, there were also major differences in fishing strategies between this
cruise and the other 2012 GOM cruises. On the GA cruise, four to five tows were conducted per
day, and in TX and MS, generally two tows per night were completed. Cruises in GA lasted a
maximum of six days since the shrimp were preserved on ice, but the TX and MS vessels had
freezing capacity onboard, allowing for cruises of 25-30 days.
On the GA cruises, calibration tows were not conducted and thus it was not possible to
evaluate if the two trawls were fishing similarly before beginning the gear evaluations. Bias
between paired tows (i.e. port versus starboard trawls) can be controlled by conducting the
same number of tows with the TTED on both sides of the boat (Mitchell et al. 2002). Though it is
acceptable to proceed with comparative towing evaluations without calibration tows, these can
help to quickly identify if the experimental gear results in catch loss. Further, when calibration
tows are performed and a trawl-side bias is observed, trawl gear can be adjusted before the
comparisons begin. If comparisons begin after a trawl-side bias has been identified, the bias is
expected to continue when experimental gear is tested. Thus when conducting evaluations with
the TTED, the use of calibration tows are recommended.
For the reasons discussed above, it was not possible to fully adhere to research
protocols on the GA cruise where shrimp trawl vessels operate under a rapid succession of day
light tows, driven in part by the need to maximize shrimp production in trips of shorter duration.
Based on discussions with captains and crew, it was suggested that I focus my 2013 field season
in the GOM, specifically concentrating my effort in the fall when large fish are more abundant in
the bycatch.
58

CHAPTER 4: 2013 GEAR COMPARISONS
Introduction
The summer 2012 gear comparisons (Chapter 3) in Georgia (GA), Texas (TX), and
Mississippi (MS) demonstrated the potential of the trash and turtle excluder device (TTED) to
reduce bycatch in the offshore shrimp trawl fishery. These comparisons provided critical
insights for the planning of future TTED research, such as targeting areas and seasons with an
abundance of large fish bycatch. As a result, the 2013 comparisons were focused on longer
duration fishing trips in the Gulf of Mexico (GOM) during the fall season, which was chosen to
increase the likelihood of interactions between the experimental gear and large fishes.
The 2013 sampling season was generally a success; however, due to an unfortunate
incident, all of the data, photographs, and notes from the fall 2013 cruises were destroyed. A
quantitative treatment of the results is thus not possible. Consequently, this chapter describes
modifications that were made to the protocols during 2013 and presents a qualitative account
of the results, including information on catches of fishes, invertebrate species, as well as
targeted shrimp species.
The 2012 comparisons confirmed that the TTED-equipped trawl reduced the capture of
carcharhinids relative to the TED-equipped trawl. As noted in Chapter 1, Red Snapper and
Blacknose Shark bycatch reduction is of particular concern to the shrimping industry. Though we
encountered many sharks during the comparisons in GA, we did not encounter many large bony
fishes of any species during the 2012 GOM comparisons. During those cruises, some shrimp
fishermen suggested that the ideal season for conducting a new series of comparisons with the
TTED-equipped trawl would be during the fall, when catches tend to include greater numbers of
59

large bony fishes. As a result, the 2013 comparisons were focused between mid-September and
mid-December in the GOM.
Materials and Methods
I contacted captains of shrimp fishing vessels in Alabama (AL), Louisiana (LA), and MS to
determine if their boats could provide an appropriate sampling platform and if they would be
willing to participate in the research. I met with several captains and although interested in my
research, none were willing to accept me on board without financial compensation. With the
help of the Alabama Seafood Alliance, I was introduced to one captain who was willing to host
my comparisons on his boat free of charge. We agreed that I would embark for one trip to test
the TTED, with the stipulation that if shrimp losses were observed we would switch the
experimental gear to a TED with a wider bar spacing of 2.25 in.
Once the captain felt that his gear was set such that the fishing configuration was
optimal, I used calibration tows to determine if the trawls were fishing similarly. Based on the
results of eight calibration tows, the captain and I both felt comfortable with starting the
comparisons.
In addition to the subsampling protocol procedure described in Chapter 2, I elected to
perform additional procedures that would allow more accurate quantification of catch
characteristics. Adaptations to the sampling protocol were adopted for the crab, lobster and
sponge bycatch categories. Large crabs in the subsample were separated from small individuals.
Small individuals of different species were weighed together in the group "Crustaceans,"
whereas large individuals were separated by species, counted and weighed. For spiny lobsters,
which were frequently captured in 2013, I recorded the total number of large individuals and
their total weight from both trawls. Small lobsters from the subsample were included in the
60

Crustaceans group. Sponges, which were only encountered in 2013, were treated separately
from the rest of the bycatch to ensure that the high volume-to-weight ratio did not affect
extrapolations of total bycatch weight from the TED-equipped trawl. Separating all visible
sponges from the total TED-equipped trawl catch and recording their weight separately from the
rest of the bycatch accomplished this. I systematically photographed the fish bycatch baskets
and sponge bycatch baskets from the TED-equipped trawl and TTED-equipped trawl to show the
effect on catch volume caused by the capture of sponges. Any remaining sponge fragments in
the subsample were separated from other debris in order to extrapolate the sponge fragment
weight to the total bycatch weight. I was then able to add the total small catch weight of
sponge fragments to the catch of large sponges to obtain an accurate measurement of total
sponge bycatch from each experimental trawl.
Results
I spent a total of 55 days at sea during the fall 2013 sampling season, which extended
from September 23 to December 7 (Table 30). During this period, an additional 29 days were
lost due to two tropical storms, one main engine problem, one generator problem, one
autopilot compass problem, the passing of a crew's family member, and the typical one week
break between trips.
During the 55 days at sea, I completed eight comparative calibration tows in which the
two trawls had a typical TED and 85 comparative tows between the TTED and the TED. Of the
85 tows comparing the TTED and TED, 67 tows were successful (i.e., tows that occurred with no
apparent technical problems to the ship or trawl gear). Of the 67 successful tows, 20 tows
targeted Brown Shrimp Species, 29 tows targeted Pink Shrimp Species, 10 tows targeted Royal
Red Shrimp Hymenoppenoeus robustus, and 8 tows targeted White Shrimp.
61

The first trip was conducted in waters between the MS state line and Tiger Pass, LA, just
west of the Mississippi River Channel. During this trip, we encountered incidental delays, which
extended the trip until October 27 for a total of 35 days, of which only 21 days were actually
spent at sea. I embarked for my second voyage on November 4 for a 36-day fishing trip. We
traveled to fishing grounds located four days away, west of St. Petersburg FL, and steadily fished
south towards Key West and the Dry Tortugas. We spent four days targeting Royal Red Shrimp
in areas south of the Florida Keys, after which we resumed targeting Pink Shrimp. On December
2, we returned north after hearing reports of large White Shrimp catches closer to AL. We
reached waters offshore of AL on December 5 and returned to port on December 9. On the
morning of December 10, my vehicle was stolen and destroyed along with all of its contents.
Though I do not have data for analysis, I do have a good recollection of what I observed at sea.
Research Protocol and Gear - During some tows, the inclination of the TTED changed
from 55° to 45°. When the TTED was fishing at low angle of inclination, there was a reduction of
shrimp catch and small fish bycatch. These losses occurred when the TTED grid reached an
inclination of 45°. When the inclination of the TTED angle was increased to the original angle of
55°, the catches of shrimp and small fish bycatch were comparable to those from the TED.
Though this occurred only twice during the 2012 and 2013 sampling seasons (121 days at sea),
the results appeared to indicate an increased sensitivity of the TTED to inclinations at or below
45°. Unfortunately, I was not able to continue observations of reduced shrimp and small fish
catches at reduced TTED angle since the boat was trying to maximize shrimp production and
therefore needed to maintain optimal gear configuration. I also checked to confirm that the TED
angle of inclination was set to 55° every time I moved the gear to the opposite trawl, to reduce
catch rate bias. In one instance I observed a TTED from one of the experimental trawls warp
into a concave shape (similar to a Pringles potato chip). This occurred when the catch from that
62

trawl was composed predominantly of shells. These issues did not undermine the results of the
2013 comparisons, which were promising with regard to the effect of the TTED to reduce the
catch of non-target species of sharks, snappers, flounders, lobsters, sponges, jellyfish and of, the
target species shrimp.
Elasmobranch Bycatch - The 2013 comparisons confirmed the observations from 2012
regarding the TTED's ability to reduce shark bycatch. In 2013, the TTED-equipped trawl
captured only a few small sharks (excluding deep water sharks), while the TED-equipped trawl
captured over 250 sharks of several species (Table 31). Most of these sharks were captured
while on the Key West fishing grounds. During the four days of fishing for Royal Red Shrimp in
deep waters off Key West, Fringefin Lanternshark Etmopterus schultzi and the Marbled Catshark
Galeus arae were frequent in the bycatch of both the TTED-equipped trawl and TED-equipped
trawl. Fringefin Sharks larger than 40 cm were equally abundant in the TTED-equipped trawl
relative to the TED-equipped trawl catch.
While fishing north of the Key West, one tow contained 67 sharks. This was the highest
number of sharks encountered in a single tow during the 2013 comparisons. These were mostly
Atlantic Sharpnose Sharks and a few Blacknose Sharks. These sharks were all caught in the TED-
equipped trawl, and on this particular tow, while no sharks were captured by the TTED-
equipped trawl. In a few tows the TED-equipped trawl catch contained four to seven Blacknose
Sharks, with none in the TTED-equipped trawl. The fork length of individuals captured by the
TED-equipped trawl ranged from 60-80 cm, with a majority of individuals in the upper size
range. During the entire Key West portion of the trip (24 days and ~45 tows) there were over 40
Blacknose Sharks caught by the TED-equipped trawl, while the TTED-equipped trawl caught
none. In this same area we captured seven Butterfly Rays Gymnura micrura and 15 other rays
(Raja spp.) in the TED-equipped trawl, with no rays captured in the TTED-equipped trawl.
63

Fish Bycatch - Large snappers (>30 cm) were less frequent in the TTED-equipped trawl
catch in the 2013 field season. During the 2013 trip, we encountered Red Snapper in the
northern GOM, while in the Key West area we encountered Mutton Snapper Lutjanus analis.
The TTED-equipped trawl and the TED-equipped trawl captured individuals of both species
smaller than 25 cm, but the TTED-equipped trawl captured few that measured greater than 25
cm, and none that were greater than 35 cm. The largest Red Snapper caught in the TED-
equipped trawl was an individual of 10.5 kg whereas the largest Red Snapper caught on the
TTED-equipped trawl weighed ~450 g. On a few occasions, we caught 20 to 30 large (>35 cm)
snappers in the TED-equipped trawl with none in the TTED-equipped trawl. In most tows with
numerous small snappers present, there were comparable numbers in both experimental
trawls.
Other fishes were also caught less frequently in the TTED-equipped trawl then in the
TED-equipped trawl catch (Table 31). These included Cobia, Hognose Wrasse Lachnolaimus
maximus, Gafftop Catfish Bargus marinus, Gulf Flounder, large sea robins, large lizardfishes and
large Spanish Mackerel. For these fishes, specimens that were captured by the TED-equipped
trawl were generally larger than those captured by the TTED-equipped trawl.
Invertebrate Bycatch - I observed a noticeable reduction in the capture of several
invertebrates for the TTED-equipped trawl relative to the TED-equipped trawl. In both the
northern GOM and near Key West, catches of crabs, lobsters, sponges, and jellyfish were less
prevalent in the TTED-equipped trawl relative to the TED-equipped trawl. In the northern GOM,
larger Rooster Crabs, Blue Crabs and Slipper Lobsters Scyllarides nodifer were less frequently
observed in the catch of the TTED-equipped trawl relative to the TED-equipped trawl. In the Key
West area, I observed that both the TTED-equipped trawl and TED-equipped trawl captured
small spiny lobster; whereas larger individuals were excluded from the TTED-equipped trawl.
64

Over the course of the trip, at least 150 large spiny lobsters (cephalothoracic length greater than
three inches) were retained by the TED-equipped trawl, whereas the TTED-equipped trawl did
not seem to retain them.
Sponges were frequently encountered in and around the Key West fishing grounds and
2013 observations indicated that the TTED was effective at reducing their capture. There were
occasions on which the TED-equipped trawl captured large mounds of sponges whereas the
TTED-equipped trawl catch contained only small fragments of sponge. There were manyl tows
with several kilograms of sponge contained in the TED-equipped trawl subsample relative to a
few hundred grams in the TTED-equipped trawl subsample.
While large sponge catches in the TED-equipped trawl did not appear to affect shrimp
retention, the same cannot be said about Moon Jellyfish Aurelia aurita which, when abundant,
seemed to contribute to shrimp loss. During a ten-day period near Key West, we observed very
high densities of Moon Jellyfish, which led to substantial operational challenges for the crew.
Jellyfish can become stuck in the trawl codend and block water from filtering through the mesh.
This causes the doors, which would normally spread out keeping the mouth of the trawl open,
to be pulled together, reducing the width of the area covered by the trawl and inevitably
reducing the number of shrimp captured by the TED-equipped trawl. In contrast, there were
few jellyfish in the TTED-equipped trawl, presumably because they could not pass into the
codend through the two-inch bar spacing. Jellyfish did not appear to collect in front of the TTED
or TED and damage to the gear was not observed even when Moon Jellyfish catches in the TED-
equipped trawl codend were very large.
Shrimp Catch. During the 2013 comparisons, shrimp production seemed to fluctuate
without obvious trends between the TED-equipped trawl and TTED-equipped trawl, although
small but statistically significant differences would be hard to notice in the field. However, at
65

the captain's request while at sea I compiled data from the first 20 tows targeting Brown
Shrimp. At that time, I had data from eleven tows with the TTED on one side of the boat and
nine with the TTED on the other side. This preliminary analysis showed a 0.8% difference in
shrimp production in favor of the TED. In contrast, during the ten-day portion of the
comparisons in which many jellyfish were encountered the TTED-equipped trawl clearly caught
more shrimp than did the TED-equipped trawl.
Discussion
Qualitative observations between the TED-equipped trawl and TTED-equipped trawl
indicated that the bycatch retention of large animals (sharks, rays, big fishes) was greatly
reduced with the TTED-equipped trawl due to a physical restriction— as the smaller bar spacing
on the TTED did not allow an animal wider than two inches to pass through the grid. Very few
sharks and snappers longer than 50 cm and 35 cm, respectively, were observed in the TTED-
equipped trawl. When large fish did manage to pass through the TTED-equipped trawl, distinct
scrape marks and missing scales were observed on these animals, presumably the consequence
of squeezing through the 50 mm bar spacing. In contrast to large fish, small fish bycatch was
not effectively reduced by the TTED-equipped trawl. Other animals that were excluded from
the TTED-equipped trawl were invertebrates, including sponges. Though sponges were
sometimes numerous in the catch, and were time-consuming for the crew to sort through, they
did not seem to affect the shrimp catch from the TED-equipped trawl. Encounters with Moon
Jellyfish, however, were both devastating to the shrimp production and very time-consuming for
the crew.
Of particular interest to the fishermen was the TTED's capacity to drastically reduce
jellyfish bycatch. When numerous jellyfish were found in the try net (a small sampling trawl
66

used to infer what is caught by the larger trawls), the captain would generally elect to haul in
the trawls, and move to a new location, to prevent the codends from ripping off from the weight
of too many jellyfish. At times the captain elected to 'fish through' the jellyfish, which resulted
in considerable shrimp loss for the TED-equipped trawl in comparison with the TTED-equipped
trawl. Since jellyfish were evacuated from the trawl by the TTED they did not accumulate in the
codend, allowing the trawl to maintain optimal fishing configuration. These observations
indicated that TTEDs could have allowed the captain to fish normally even at times were large
volumes of moon jellyfish were present, potentially allowing full-length tows.
In addition, the large volumes of jellyfish, once on the back deck, were very hard to
handle. When the boat would tilt with the waves, all of the catch would slosh back and forth
and it was practically impossible to separate the sorted portion of the catch from the unsorted
portion of the catch. Crew would often elect to open a gunnel and pick out shrimp as best they
could as the jellyfish oozed off the back deck. This precarious technique resulted in a
considerable volume of shrimp lost overboard with the jellyfish from the TED-equipped trawl.
Small fish bycatch did not seem to be reduced by the TTED-equipped trawl except in
situations where the TTED angle was reduced. The results of this study suggests that the TTED's
effectiveness at retaining shrimp and reducing bycatch may be sensitive to the angle at which
the TTED hangs in the trawl during the fishing operations (as noted in Chapter 2). When the
TTED was at the optimal angle setting (50°- 55°), the gear performed very well, and in some
cases outperformed the TED in terms of commercial shrimp catch. When the TTED was inclined
to 45° or less, however, shrimp catches decreased. W ater passing between bars can experience
interference when the spacing it narrow or approaching critical gap (Harichandan et al. 2010,
Zhou et al. 2000). I speculate that flow interference of the TTED may increase at low angles, in
turn hindering flow through the device. This flow interference may cause a diversion of water
67

flow toward the TTED opening, eventually forcing the TTED exit hole covering open and allowing
a portion of the catch, including shrimp and small fish, to escape. Though TTEDs incorporating
stretch-resistant webbing were purchased new, there were three separate instances in which
the TTED angle had to be adjusted, twice while at sea (GA and AL) and once before starting the
MS experiment. The TED used in MS was bought with an angle that measured 49°, highlighting
the importance of checking TED angles regularly even when purchased new from the
manufacturer.
Another incident that may be an important consideration was the observed warping of
one TTED when the catch was mainly composed of shells. After consultation with the captain
and crew, they explained that the shells captured in the codend indicated that during the fishing
process the trawl had dug into the substrate and a large volume of sediment-containing shells
was forced through the TTED. While towing, the soft substrate washed out of the codend
leaving only the shells. I have heard oral accounts but have not encountered written reports
describing trawls digging into substrate to this degree. Therefore, I do not know if this is a
tendency that could reduce the TTED's, TED's or both gears' effectiveness under commercial
shrimping operations.
The 2013 fall comparisons were very rich in results. The TTED was evaluated in a variety
of GOM offshore shrimping conditions and was tested on four commercially targeted shrimp
species. Overall, there appeared to be a dramatic decrease in the number of elasmobranchs
caught by the TED-equipped trawl relative to the TTED-equipped trawl, confirming observations
from the 2012 field season. For sharks, specifically Blacknose Sharks, the TTED-equipped trawl
showed a much higher rate of exclusion from capture than did the TED-equipped trawl.
As predicted by captains, many more sharks and larger fishes were encountered in the
fall. The TTED-equipped trawl seemed to be more effective than the TED-equipped trawl for the
68

reduction of sharks and snappers larger than 30 cm. The TTED also seemed to be very useful
when large quantities of sponges and jellyfish were encountered.
69

CHAPTER 5: CONCLUSIONS AND RECOMMENDATIONS
The 2012 and 2013 TTED and TED comparisons were conducted in a variety of offshore
shrimping conditions; being tested once on the U.S. Atlantic east coast and three times in the
Gulf of Mexico, on four commercially targeted shrimp species. My research indicated that TTED-
equipped trawls largely reduced elasmobranch catch and maintained shrimp catch when
compared to TED-equipped trawls in the Gulf of Mexico. The TTED may be a good BRD
candidate for reducing bycatch of larger fishes. This has implications for management of U.S.
Shrimp Trawl (ST) fisheries since the stock assessment for Blacknose Sharks suggests the species
is overfished and concurrently experiencing high bycatch mortality from shrimp trawls (SEDAR
21). If it becomes possible to predict times and areas where Blacknose Sharks are vulnerable to
ST bycatch, the TTED could serve as a BRD capable of reducing the capture of this species. This
would help fulfill the NMFS Highly Migratory Species Management Division's obligations to
implement actions to reduce the bycatch of Blacknose Sharks by U.S. shrimp trawls.
Though small fish bycatch was not reduced by the TTED, this gear may represent a
better option for the shrimp trawl industry than the TED, since comparisons under commercial
situations suggest that the TTED catches equivalent shrimp weight and reduced more bycatch
than the TED.
Though catches of larger fish including Red Snapper, sharks, rays and skates, in addition
to jellyfish and debris, were reduced by the TTED relative to the TED, continued bycatch
research is necessary to confirm these findings. The TTED serves as an example of how a simple
innovation in bycatch technology may improve the efficiency of an already well-established
device. The potential for interest and application of this device within U.S. shrimp fisheries is
70

demonstrated by the adoption of the TTED or a modification of it (i.e. reduced bar spacing) by 3
of the captains who participated in this study.
This study indicated that the TTED is similar to the TED in its efficiency or lack there of
reducing small fish bycatch. According to Raborn et al. 2012, TEDs reduced 5-13% of small fish
bycatch. This study also indicated that the TTED, like the TED was effective at not catching
turtles and caused minimal reductions in shrimp catches (Renaud et al. 1993 and Broadhurst
2000). Concerning Red Snapper, studies by Engass et al 1999 showed that red snapper are
difficult to remove passively from the trawls with BRDs but the TTED seems to be more effective
than the TED at reducing individuals larger then 30cm and this may have implications for the
recovery of this species. Finally this study addressed the problem raised by Raborn et al. 2012
concerning current TEDs and other BRDs inability to significantly reduce small elasmobranch
bycatch. In contrast, the TTED seems to be effective at reducing small elasmobranch bycatch.
The results of this study helped to identify factors that require further investigation, and
several questions have been developed to guide future reduced bar spacing TED research. The
following recommendations are based on discussions with participating shrimp fishery captains,
and at-sea observations during the TTED study.
Research questions with ecological considerations:
• Do TEDs with 2.25-inch (5.7cm) or 2.5-inch (6.3cm) bar spacing reduce shark bycatch equal
to or greater than the TTED?
• How can TTED use influence projected Blacknose Shark population recovery?
• What is the range of Red Snapper length caught by the TTED, and how can TTED use
influence projected Red Snapper population recovery?
• How does TTED angle affect catches of small fish bycatch? What are the associated
influences on target shrimp catch at reduced TTED angles?
71

• Can the TTED be used at a 60° or 65° angle of inclination and still effectively evacuate
turtles from the trawl?
Research questions with economic considerations:
• Does a 2-inch TTED have greater drag than the 2.5-inch, 3-inch or 4-inch TED? How do
these changes in drag affect fuel usage and operating costs?
• Does the lower drag from the TTEDs "cleaner" catch compensate for the increased drag
from the reduced bar spacing as compared to the TED?
• Does the TTED systematically lose shrimp at an of inclination angle of 45°?
• How often would shrimpers need to readjust their TTED to maintain optimal angle
configuration, as compared to a TED? What additional costs would this incur?
My final recommendation would be to repeat the fall TTED and TED comparison study in the Key
West Pink Shrimp fishery because of the promise that the TTED demonstrated in simultaneously
reducing bycatch of multiple species, which largely reduced the crew's work load and therefore
increased efficiency in this fishery.
72

APPENDIX
LIST OF ACRONYMS
BRD Bycatch Reduction DeviceCPUE Catch Per Unit EffortEEZ Exclusive Economic ZoneEmsy Cost of effort at MSYFAO Food and Agricultural AdministrationFSD Finfish Separator DeviceGA GeorgiaGLMM Generalized Linear Mixed ModelGMFMC Gulf of Mexico Fishery Management CouncilGOM Gulf of MexicoGSFF Gulf and South Atlantic Fisheries FoundationKMT Thousand Metric TonMEY Maximum Economic YieldM M T Million Metric TonMS MississippiMSA Magnuson Stevens Fishery Management ActMSY Maximum Sustainable YieldNMFS National Marine Fisheries ServiceNOAA National Oceanic and Atmospheric AdministrationOGSF Offshore Gulf of Mexico Shrimp Trawl FisheryRES Radial Escape SectionSAB South Atlantic BightSAFMC South Atlantic Fishery Management CouncilSEFSC South East Fisheries Science CenterSEWG Shrimp Effort Working GroupST Shrimp TrawlTAC Total allowable catchTED Turtle Excluder DeviceTTED Trash and Turtle Excluder DeviceTX TexasVPA Virtual Population Analysis
73

TABLES
74

Table 1. Correlation Between VariablesVariables were tested for correlation for Georgia (GA), Texas (TX) and Mississippi (MS). X marks correlated variables as determined by significant p-values. Tow time is the duration of a tow in minutes, Tow depth is the average tow depth for a given tow, Big fish bycatch (#) is the number of all big animals caught in the TTED-equipped trawl minus the number of all big animals caught in the TED-equipped trawl. Big Fish bycatch & debris reduction (kg) is the weight of all big animal bycatch plus the weight of debris from the TTED-equipped trawl minus the weight of all big animal bycatch plus the weight of debris from the TED-equipped trawl, Total croaker reduction (kg) is the total croaker weight from the TTED-equipped trawl minus the total croaker weight from the TED-equipped trawl.
GA Model variables Towtime
Towdepth Big fish bycatch (#) Big fish bycatch &
debris reduction (kg)Total croaker reduction (kg'
TX
Tow depth
Big fish bycatch reduction (#)
X
Big fish bycatch and debris reduction (kg)
X X
Total croaker reduction (kg)Total bycatch reduction (kg)
X X
Model variables Towtime
Towdepth Big fish bycatch (#) Big fish bycatch and
debris reduction (kg)Total croake reduction (kg’
MS
Tow depthBig fish bycatch and debris reduction (#)Big fish bycatch and debris reduction (kg)
X
Total croaker reduction (kg)Total bycatch reduction (kg)
Model variables Towtime
Towdepth Big fish bycatch (#)
Big fish bycatch and debris reduction (kg)
Total croake reduction (kg]
Tow depthBig fish bycatch and debris reduction (#)Big fish bycatch and debris reduction (kg)
1BSI8MPSKTotal croaker reduction (kg)Total bycatch reduction (kg)
X
75

Table 2. Dates and Locations of the 2012 Gear Comparison Cruises.Port Dates Days-at-Sea Valid Tows
Darien, GA May 14-27 13 31
Freeport, TX June 27-July 28 32 44
Pascagoula, MS August 2-27 26 35
TOTAL 71 110
76

Table 3. Technical Characteristics of Fishing Vessels and Trawls Used in the 2012 TTED versus TED Comparisons.Cruises occurred off Georgia (GA) in the U.S. South Atlantic Bight and off Texas (TX) and Mississippi (MS) in the Gulf of Mexico.
Gear Differences GA TX MS
Vessel length (m) 24.4 25 32
Main engine power (Hp) 365 540 855
Main engine make General Motors Caterpillar Caterpillar
Doors type Wood Cambered Steel Aluminum
Door Length & width (m) 2.44, 1.02 3.35, 1.06 1.49, 1.22
Bridal length (m) and type 76 Steel 109.44 Dynema 109.44 Steel
Head rope length 15.24 17.07 18.9
Trawl type and tow speed (kn) Bib, 2.9 Balloon, 2.8 Flat 2.9
BRD active Yes (Fisheye) No No
Control TED shape Oval Square bottom Oval
Accelerator funnel No Yes Yes
77

Table 4. Tow Characteristics of the 2012 TTED versus TED Comparisons.GA refers to the cruise from Georgia, TX refers to the cruise from Texas, MS refers to the cruise from Mississippi, GOM refers to the Gulf of Mexico.
Tow Characteristics GA TX MS
Day or night fishing day night night
Maximum tow depth (m) 12.19 72.24 86.56
Average tow depth (m) 7.8 54.5 37.3
Minimum tow depth (m) 3.35 38.59 25.6
Number of tows 35 71 43
Number of valid tows 31 44 35
Tow# on port vs starboard 17,14 21, 23 17, 18
Total hours towed 100h54min 212hl2min 118h 24min
Maximum tow time (hr) 5:05 8:25 5:25
Average tow time (hr) 3:21 4:55 3:23
Minimum tow time (hr) 1:31 1:58 2:40
Number of tows per day 4 2 2 or 3
Number of tows per day 4 2 2 or 3
Area fished (in fig #) East Coast East GOM LA/MS West GOM LA, TX
78

Table 5. Total Catch Weights and CPUEs by Cruise.Data are presented as the sum of the target and bycatch weights for all valid tows for the TED- equipped trawl (kg TED) and TTED-equipped trawl (kg TTED) by cruise. The two CPUE (kg/hr) columns refer to the total catch weight from the TED-equipped trawl (total catch TED /tota l hours towed) and the TTED-equipped trawl (total catch TTED/total hours towed). Kg diff is the difference in total catch weight of the TED-equipped trawl relative to the TTED-equipped trawl (kg TTED minus kg TED). % diff is the percent difference in total catch weight of the TED- equipped trawl relative to the TTED-equipped trawl.
Cruise kg TED kg TTED CPUE TED CPUE TTED Kg diff % diff
GA 5200.85 3158.62 51.5616 31.3148 -2042.23 -39.27%
TX 10716.49 10584.38 49.3128 48.7049 -132.11 -1.23%
MS 8238.01 7657 71.4485 66.4094 -581.01 -7.05%
79

Table 6. Shrimp Weights and CPUEs by Cruise.Data are presented as the number of tows in which the species was encountered (Freq). The sum of the shrimp weight for all valid tows for the TED-equipped trawl (kg TED) and TTED- equipped trawl (kg TTED) by cruise. The two CPUE (kg/hr) columns refer to the total shrimp weight from the TED-equipped trawl (total species' weight TED/total hours towed) and the TTED-equipped trawl (total species' weight TTED/total hours towed). Kg diff is the difference in total shrimp weight of the TED-equipped trawl relative to the TTED-equipped trawl (kg TTED minus kg TED). % diff is the percent difference in total shrimp weight of the TED-equipped trawl relative to the TTED-equipped trawl.
Cruise Species freq Kg TED Kg TTED CPUE TED CPUE TTED kg diff % diff
GA White Shrimp 31 856.3 824 8.342 7.982 -0.36 -4.32%
TX Brown Shrimp 44 2895.22 3058.46 13.628 14.455 0.827 6.07%
MS Brown Shrimp 34 1653.35 1633 14.582 14.352 -0.23 -1.58%
80

Table 7. Shrimp Weight CPUE T-test by Cruise.Data are presented as estimates of the mean CPUE (kg/hr) difference in shrimp weight from the TTED-equipped trawl relative to the TED-equipped trawl, standard error (StdErr) of the mean, standard deviation (StdDev) from the mean, t-value, degrees of freedom (DF), and p-value. Significant differences of species weight CPUEs (p<0.05) are in bold.
Cruise Species Mean StdDev StdErr t-value DF p-value
GA White Shrimp 0.360 0.976 0.175 2.053 30 0.0489
TX Brown Shrimp -0.827 2.066 0.311 -2.655 43 0.0111
MS Brown Shrimp 0.230 1.801 0.309 0.746 33 0.4611
81

Table 8. Species Catch Weights and CPUEs for the Georgia Cruise.Data are presented as the number of tows in which the species was encountered (Freq). The sum of the species' weight for all valid tows for the TED-equipped trawl (kg TED) and TTED- equipped trawl (kg TTED) by cruise. The two CPUE (kg/hr) columns refer to the total species' weight from the TED-equipped trawl (total species' weight TED /tota l hours towed) and the TTED-equipped trawl (total species' weight TTED/total hours towed). Kg diff is the difference in total species' weight of the TED-equipped trawl relative to the TTED-equipped trawl (kg TTED minus kg TED). % diff is the percent difference in total species' weight of the TED-equipped trawl relative to the TTED-equipped trawl. Atlantic Sharpnose (small) refers to neonate Atlantic Sharpnose Sharks that were kept separate from adult Atlantic Sharpnose Sharks (Atlantic Sharpnose).
Common Name Freq TED kg TTED kg CPUE TED CPUE TTED kg diff % diff
Atlantic Sharpnose 26 481.8 0.45 5.69 0.00 -5.68 -99.9%
Atlantic Sharpnose (Small) 19 104.6 62.7 1.71 1.00 -0.70 -41.1%Blacknose Shark 9 5.5 0.4 0.18 0.01 -0.17 -93.4%
Bonnethead Shark 14 54.55 0.4 1.23 0.01 -1.22 -99.3%Blacktip Shark 3 7.35 0 0.61 0.00 -0.61 -100.0%
Scalloped Hammerhead 5 2.6 0.2 0.18 0.02 -0.16 -91.1%Smoothed Hammerhead 2 3.7 0.25 0.78 0.03 -0.75 -96.1%
Ray & Skate 11 20.1 2 0.63 0.04 -0.59 -93.4%W inter Flounder 1 0.4 0 0.18 0.00 -0.18 -100.0%
Spanish Mackerel 4 1.25 0.42 0.11 0.03 -0.08 -74.3%Horseshoe Crab 19 121 0 1.97 0.00 -1.97 -100.0%Fishes (unclassified) and jellyfish
30 3541.7 2267.8 36.86 23.23 -13.63 -37.0%
82

Table 9. Species Catch Weights and CPUEs for the Texas Cruise.Data are presented as the number of tows in which the species was encountered (Freq). The sum of the species' weight for all valid tows for the TED-equipped trawl (kg TED) and TTED- equipped trawl (kg TTED) by cruise. The two CPUE (kg/hr) columns refer to the total species' weight from the TED-equipped trawl (total species' weight TED /total hours towed) and the TTED-equipped trawl (total species' weight TTED/total hours towed). Kg diff is the difference in total species' weight of the TED-equipped trawl relative to the TTED-equipped trawl (kg TTED minus kg TED). % diff is the percent difference in total species' weight of the TED-equipped trawl relative to the TTED-equipped trawl.
Species Freq Kg TED Kg TTED CPUE TED CPUE TTED kg diff % diffAtlantic Sharpnose 16 48.65 2.9 0.68 0.04 -0.63 -93.36%
Blacknose Shark 1 2.1 0 0.41 0.00 -0.41 -100.00%Dusky Shark 1 1.55 0 0.37 0.00 -0.37 -100.00%
Gulf Smoothhound 39 35.8 23.85 0.19 0.13 -0.06 -32.24%Atlantic Angle Shark 5 2.35 0.35 0.12 0.02 -0.10 -85.89%
Rays & Skates 7 10.1 2.15 0.29 0.07 -0.22 -76.52%Red Snapper 36 69.7 56.6 0.42 0.33 -0.09 -21.00%
Vermillion Snapper 4 12.9 9.95 0.59 0.44 -0.15 -24.65%Wenchman Snapper 44 362.8 356.79 1.71 1.67 -0.04 -2.41%
Lane Snapper 2 1.72 1.51 0.17 0.14 -0.02 -13.48%Southern Flounder 2 1.15 0 0.10 0.00 -0.10 -100.00%
Atlantic Croaker 44 819.63 791.35 3.95 3.81 -0.14 -3.49%Blackear Bass 9 71.52 23.24 1.50 0.47 -1.03 -68.72%
Butterfish 17 247.02 341.41 3.06 4.34 1.28 41.99%Cutlas Fish 4 19.53 20.39 0.87 1.10 0.23 26.88%
Sea Trouts 40 137.84 136.47 0.72 0.71 -0.01 -1.45%Lizardfishes 30 288.43 360.74 1.85 2.34 0.49 26.34%
Longspine Porgy 44 1419.17 1433.63 7.08 6.98 -0.10 -1.47%Oscillated Flounder 2 8.69 15.26 0.71 1.80 1.08 52.73%
Rock Seabass 21 149.57 155.81 1.42 1.47 0.05 3.69%Rough Scad 34 610.52 653.95 4.04 4.27 0.22 5.56%
Sea Robins 11 66.26 61.91 1.26 1.17 -0.09 -7.00%Spot 1 53.51 48.34 10.92 9.87 -1.06 -9.66%
Fishes (unclassified) 44 1668.27 1532.03 7.87 7.22 -0.65 -8.27%Crustaceans (unclassified) 44 966.52 773.63 4.39 3.49 -0.89 -20.39%
Shrimp Discard 43 25.67 21.35 0.12 0.10 -0.02 -12.87%Invertebrates (unclassified) 44 672.94 665.96 3.05 3.01 -0.04 -1.28%
Debris 36 41.74 36.35 0.23 0.22 -0.01 -6.35%
83

Table 10. Species Catch Weights and CPUEs for the Mississippi Cruise.Data are presented as the number of tows in which the species was encountered (Freq). The sum of the species' weight for all valid tows for the TED-equipped trawl (kg TED) and TTED- equipped trawl (kg TTED) by cruise. The two CPUE (kg/hr) columns refer to the total species' weight from the TED-equipped trawl (total species' weight TED /to ta l hours towed) and the TTED-equipped trawl (total species' weight TTED/total hours towed). Kg diff is the difference in total species' weight of the TED-equipped trawl relative to the TTED-equipped trawl (kg TTED minus kg TED). % diff is the percent difference in total species' weight of the TED-equipped trawl relative to the TTED-equipped trawl. Lizardfishes (large) includes individuals that weighed 300g or more. Lizardfishes (small) included individuals that weighed less than 300g. Sea Robins (large) includes individuals that weighed 175g or more. Sea Robins (small) includes individuals that weighed less than 175g. Crabs (large) includes individuals that weighed more 200g of more.
Species Freq Kg TED Kg TTED CPUE TED CPUE TTED kg diff % diffAtlantic Sharpnose 3 15 3 1.52 0.31 -1.22 -79.81%Gulf Smoothhound 4 9.81 0.5 0.59 0.03 -0.56 -95.22%Rays & Skates 10 6.6 0.8 0.20 0.03 -0.17 -86.84%Red Snapper 25 36.32 13.34 0.46 0.18 -0.28 -61.31%Wenchman Snapper 5 15.63 10.27 0.85 0.57 -0.28 -33.26%Whitings 5 6.92 0.93 0.46 0.05 -0.40 -88.70%Louisiana Redfish 1 9.75 0 3.25 0.00 -3.25 -100.00%Southern Flounder 7 4.09 0.29 0.17 0.02 -0.16 -91.14%Spanish Mackerel 2 0.9 0 0.14 0.00 -0.14 -100.00%Atlantic Croaker 34 2842.33 2769.94 25.08 24.73 -0.36 -1.43%Butterfish 7 47.32 39.51 1.94 1.62 -0.33 -16.76%Sea Trouts spp 34 221.3 166.58 1.92 1.44 -0.48 -24.94%Lizardsfishes spp (small) 16 151.79 172.25 2.76 3.11 0.36 12.90%Lizardsfishes spp (large) 7 22.65 0 0.82 0.00 -0.82 -100.00%Longspine Porgy 34 911.02 885.57 7.87 7.69 -0.17 -2.21%Red Porgy 2 0 1.41 0.00 0.19 0.19 100.00%Sea Robins (large) 13 75.19 10.13 1.71 0.23 -1.48 -86.63%Sea Robins (small) 16 191.98 188.33 3.46 3.35 -0.12 -3.38%Spot 28 170.7 239.17 1.86 2.58 0.72 38.55%Fishes (unclassified) 34 993.51 904.03 8.96 8.23 -0.73 -8.13%Crabs (large) 15 54.08 6.05 1.04 0.11 -0.93 -89.63%Crustaceans (unclassified) 34 620.8 513.7 5.40 4.46 -0.94 -17.45%Shrimp Discard 27 6.65 7.87 0.07 0.08 0.01 20.05%Invertebrates (unclassified) 26 45.63 64.16 0.54 0.79 0.25 46.65%Debris 21 120.64 26.17 1.97 0.40 -1.57 -79.71%
84

Table 11. Species Catch Numbers (Counts) and CPUEs for the Georgia Cruise.Data are presented as the number of tows in which the species was encountered (Freq). The sum of the species' number (count) for all valid tows for the TED-equipped trawl (# TED) and TTED-equipped trawl (# TTED) by cruise. The two CPUE (number of individuals caught/hr) columns refer to the total species' number (count) from the TED-equipped trawl (total species' number TED /tota l hours towed) and the TTED-equipped trawl (total species' number TTED/total hours towed). # diff is the difference in total species' number (count) of the TED- equipped trawl relative to the TTED-equipped trawl (# TTED minus kg # TED). % diff is the percent difference in total species' number (count) of the TED-equipped trawl relative to the TTED-equipped trawl. Atlantic Sharpnose (small) refers to neonate Atlantic Sharpnose Sharks that were kept separate from adult Atlantic Sharpnose Sharks (Atlantic Sharpnose).
Species Freq # TED # TTED CPUE TED CPUE TTED # diff % diff
Atlantic Sharpnose 26 172 1 2.04 0.01 -2.03 -99.46%
Atlantic Sharpnose (small) 19 743 459 12.06 7.32 -4.74 -39.34%
Blacknose Shark 9 10 1 0.32 0.03 -0.29 -90.79%
Blacktip Shark 3 3 0 0.24 0.00 -0.24 -100.00%
Bonnethead Hammerhead 14 30 1 0.69 0.02 -0.67 -97.02%
Horseshoe Crab 19 81 0 1.30 0.00 -1.30 -100.00%
Rays & Skates 11 15 1 0.47 0.02 -0.45 -95.56%
Scalloped Hammerhead 5 6 1 0.40 0.08 -0.32 -79.77%
Smoothed Hammerhead 2 2 1 0.35 0.12 -0.23 -65.24%
Spanish Mackerel 4 4 2 0.34 0.13 -0.21 -61.56%
Winter Flounder 1 1 0 0.45 0.00 -0.45 -100.00%
Fishes (unclassified) and
jellyfish 30 NA NA
85

Table 12. Species Catch Numbers (Counts) and CPUEs for the Texas Cruise.Data are presented as the number of tows in which the species was encountered (Freq). The sum of the species' number (count) for all valid tows for the TED-equipped trawl (# TED) and TTED-equipped trawl (# TTED) by cruise. The two CPUE (number of individuals caught/hr) columns refer to the total species' number (count) from the TED-equipped trawl (total species' number TED /tota l hours towed) and the TTED-equipped trawl (total species' number TTED/total hours towed). # diff is the difference in total species' number (count) of the TED- equipped trawl relative to the TTED-equipped trawl (# TTED minus kg # TED). % diff is the percent difference in total species' number (count) of the TED-equipped trawl relative to the TTED-equipped trawl.
Species Freq #TED # TTED CPUE TED CPUE TTED # diff % diffAtlantic Sharpnose 16 28 3 0.36 0.05 -0.32 -87.02%
Blacknose Shark 1 1 0 0.20 0.00 -0.20 -100.00%Dusky Shark 1 1 0 0.24 0.00 -0.24 -100.00%Gulf Smoothhound 39 62 43 0.34 0.24 -0.09 -28.24%Atlantic Angle Shark 5 5 1 0.23 0.05 -0.19 -79.73%Rays & Skates 7 14 11 0.40 0.34 -0.06 -15.08%Red Snapper 36 424 426 2.58 2.49 -0.09 -3.51%Vermillion Snapper 4 415 299 18.79 13.46 -5.33 -28.35%Wenchman Snapper 44 11164 11116 52.71 52.04 -0.67 -1.28%Lane Snapper 2 35 10 3.41 0.95 -2.45 -72.04%Shrimp Discard 43 8214 6119 37.37 28.25 -9.12 -24.40%
Atlantic Croaker 44 11393 11208 54.91 53.92 -0.99 -1.80%Blackear Bass 9 11159 3291 229.97 66.82 -163.15 -70.94%Butterfish 17 3613 5085 44.86 64.82 19.96 44.49%Cutlass Fish 4 273 272 12.15 14.43 2.28 18.75%
Spot 1 561 501 114.49 102.24 -12.24 -10.70%Lizardfishes 30 2300 3099 15.07 20.24 5.17 34.30%
Longspine Porgy 44 29790 30544 149.51 149.63 0.11 0.08%Oscillated Flounder 2 111 40 9.07 4.71 -4.37 -48.14%
Rock Seabass 21 2676 3340 25.60 30.73 5.13 20.05%Rough Scad 34 24738 27587 166.72 180.05 13.33 7.99%Sea Robins 11 1715 1643 32.19 30.62 -1.57 -4.87%
Southern Flounder 2 2 0 0.17 0.00 -0.17 -100.00%
86

Table 13. Species Catch Numbers (Counts) and CPUEs for the Mississippi Cruise.Data are presented as the number of tows in which the species was encountered (Freq). The sum of the species' number (count) for all valid tows for the TED-equipped trawl (# TED) and TTED-equipped trawl (# TTED) by cruise. The two CPUE (number of individuals caught/hr) columns refer to the total species' number (count) from the TED-equipped trawl (total species' number TED /tota l hours towed) and the TTED-equipped trawl (total species' number TTED/total hours towed). # diff is the difference in total species' number (count) of the TED- equipped trawl relative to the TTED-equipped trawl (# TTED minus kg # TED). % diff is the percent difference in total species' number (count) of the TED-equipped trawl relative to the TTED-equipped trawl. Lizardfishes (large) include individuals that weighed 300g or more. Lizardfishes (small) included individuals that weighed less than 300g. Sea Robins (large) includes individuals that weighed 175g or more. Sea Robins (small) includes individuals that weighed less than 175g. Crabs (large) includes individuals that weighed more 200g of more.
Species Freq # TED # TTED CPUE TED CPUE TTED # diff % diffAtlantic Sharpnose 3 5 1 0.51 0.10 -0.41 -79.81%
Gulf Smoothhound 4 6 1 0.38 0.06 -0.33 -85.26%Rays & Skates 10 12 2 0.35 0.06 -0.29 -81.65%
Red Snapper 25 101 82 1.25 1.01 -0.24 -19.37%Wenchman Snapper 5 551 326 30.01 18.01 -12.00 -40.00%
Whitings 5 41 9 2.62 0.48 -2.14 -81.77%Louisiana Redfish 1 1 0 0.33 0.00 -0.33 -100.00%
Southern Flounder 7 8 1 0.35 0.05 -0.30 -85.13%Spanish Mackerel 2 2 0 0.31 0.00 -0.31 -100.00%
Atlantic Croaker 34 61320 59129 541.22 529.21 -12.01 -2.22%Butterfish 7 502 326 20.63 13.01 -7.62 -36.94%
Sea Trouts 34 2446 1800 21.22 15.58 -5.64 -26.57%Lizardsfishes (small) 16 NA NA NA NA NA NA
Lizardsfishes (large) 7 59 0 2.10 0.00 -2.10 -100.00%Longspine Porgy 34 24669 24118 213.31 209.76 -3.56 -1.67%
Red Porgy 2 0 14 0.00 1.94 1.94 100.00%Sea Robins (large) 13 234 42 5.31 0.94 -4.37 -82.32%
Sea Robins (small) 16 NA NA NA NA NA NASpot 28 2879 4068 31.26 43.94 12.68 40.58%
Fishes (unclassified) 34 NA NA NA NA NA NACrabs (large) 15 225 35 4.40 0.65 -3.75 -85.28%
Crustaceans (unclassified) 34 NA NA NA NA NA NAShrimp Discard 27 1661 1974 16.39 19.78 3.38 20.63%Invertebrates(unclassified)
26 NA NA NA NA NA NA
Debris 21 NA NA NA NA NA NA
87

Table 14. Species Weight CPUE t-test for the Georgia Cruise.Data are presented as estimates of the mean CPUE (kg/hr) difference in shrimp weight CPUEs from the TTED-equipped trawl relative to the TED-equipped trawl, standard error (StdErr) around means, standard deviation (StdDev) from the mean, t-value, degrees of freedom (DF), and p-value. Significant differences of species weight CPUEs (p<0.05) are in bold. Atlantic Sharpnose (small) refers to neonate Atlantic Sharpnose Sharks that were kept separate from adult Atlantic Sharpnose Sharks (Atlantic Sharpnose). N/A indicates that data were unavailable due to the model not converging.
Species Mean StdDev StdErr t-value DF p-value
Winter Flounder 0.179 N/A N/A N/A 0 N/A
Atlantic Sharpnose 5.683 4.568 0.896 6.344 25 <0.0001
Florseshoe Crab 1.973 1.251 0.287 6.875 18 <0.0001
Fishes (unclassified) 13.628 15.258 2.786 4.892 29 <0.0001
Blacknose Shark 0.169 0.063 0.021 8.019 8 <0.0001
Bonnethead Hammerhead 1.224 1.216 0.325 3.767 13 0.0023
Rays & Skates 0.590 0.621 0.187 3.151 10 0.0103
Atlantic Sharpnose (small) 0.702 1.205 0.276 2.538 18 0.0206
Blacktip Shark 0.609 0.341 0.197 3.090 2 0.0907
Spanish Mackerel 0.080 0.082 0.041 1.932 3 0.1488
Scalloped Hammerhead 0.163 0.214 0.096 1.703 4 0.1638
Smoothed Hammerhead 0.748 0.901 0.637 1.174 1 0.4492
88

Table 15. Species Weight CPUE t-test for the Texas Cruise.Data are presented as estimates of the mean CPUE (kg/hr) difference in shrimp weight CPUEs from the TTED-equipped trawl relative to the TED-equipped trawl, standard error (StdErr) around means, standard deviation (StdDev) from the mean, t-value, degrees of freedom (DF), and p-value. Significant differences of species weight CPUEs (p<0.05) are in bold. N/A indicates that data were unavailable due to the model not converging.
Species Mean StdDev StdErr t-value DF p-valueDusky Shark 0.373 N/A N/A N/A 0 N/A
Spot 1.055 N/A N/A N/A 0 N/A
Blacknose Shark 0.413 N/A N/A N/A 0 N/A
Atlantic Sharpnose 0.632 0.617 0.154 4.099 15 0.0009Crustaceans (unclassified) 0.894 1.709 0.258 3.471 43 0.0012Fishes (unclassified) 0.651 2.051 0.309 2.107 43 0.0410Lizardfishes -0.487 1.279 0.233 -2.086 29 0.0459
Rays & Skates 0.220 0.239 0.090 2.433 6 0.0510Gulf Smoothhound 0.063 0.204 0.033 1.925 38 0.0617
Blackear Bass 1.031 1.531 0.510 2.019 8 0.0781Atlantic Angle Shark 0.101 0.133 0.059 1.699 4 0.1646
Southern Flounder 0.101 0.041 0.029 3.450 1 0.1796Butterfish -1.284 3.930 0.953 -1.347 16 0.1966
Shrimp Discard 0.016 0.101 0.015 1.005 42 0.3206Red Snapper 0.088 0.579 0.097 0.907 35 0.3707
Vermillion Snapper 0.146 0.293 0.147 0.992 3 0.3944Atlantic Croaker 0.138 1.985 0.299 0.461 43 0.6472
Rough Scad -0.225 3.066 0.526 -0.427 33 0.6720Wenchman Snapper 0.041 0.743 0.112 0.368 43 0.7146
Ocellated Flounder -1.085 3.544 2.506 -0.433 1 0.7399Longspine Porgy 0.104 2.265 0.341 0.305 43 0.7616
Cutlass Fish -0.233 1.569 0.784 -0.297 3 0.7859Debris 0.015 0.444 0.074 0.200 35 0.8423
Sea Robins 0.088 1.467 0.442 0.199 10 0.8461Invertebrates (unclassified) 0.039 1.416 0.213 0.182 43 0.8563
Rock Seabass -0.052 1.415 0.309 -0.170 20 0.8667Lane Snapper 0.022 0.207 0.146 0.153 1 0.9032
Sea Trouts 0.010 0.749 0.118 0.088 39 0.9305
89

Table 16. Species Weight CPUE t-test for the Mississippi Cruise.Data are presented as estimates of the mean CPUE (kg/hr) difference in shrimp weight CPUEs from the TTED-equipped trawl relative to the TED-equipped trawl, standard error (StdErr) around means, standard deviation (StdDev) from the mean, t-value, degrees of freedom (DF), and p-value. Significant differences of species weight CPUEs (p<0.05) are in bold. Lizardfishes (large) include individuals that weighed 300g or more. Lizardfishes (small) include individuals that weighed less than 300g. Sea Robins (large) include individuals that weighed 175g or more. Sea Robins (small) include individuals that weighed less than 175g. Crabs (large) includes individuals that weighed more 200g of more. Crabs (small) includes individuals that weighed less than 200g. N/A indicates that data were unavailable due to the model not converging.
Species Mean StdDev StdErr t-value DF p-valueLouisiana Redfish 3.250 N/A N/A N/A 0 N/A
Sea Robins (large) 1.478 0.977 0.271 5.454 12 0.0001Crabs (large) 0.932 0.849 0.219 4.252 14 0.0008
Southern Flounder 0.155 0.095 0.036 4.299 6 0.0051Rays & Skates 0.171 0.149 0.047 3.637 9 0.0054Large Lizardfish 0.817 0.514 0.194 4.204 6 0.0057Spot -0.717 1.661 0.314 -2.284 27 0.0304Red Snapper 0.280 0.638 0.128 2.192 24 0.0383Crustaceans (unclassified) 0.942 2.925 0.502 1.879 33 0.0691
Spanish Mackerel 0.135 0.026 0.018 7.337 1 0.0862Sea Trouts spp 0.480 1.719 0.295 1.627 33 0.1132
Gulf Smouthhound 0.563 0.515 0.258 2.186 3 0.1167Red Porgy -0.194 0.073 0.052 -3.752 1 0.1658
Shrimp Discard -0.014 0.053 0.010 -1.377 26 0.1801Whiting spp 0.404 0.585 0.262 1.545 4 0.1973
Invertebrates (unclassified) -0.250 0.982 0.193 -1.299 25 0.2057Debris 1.573 5.649 1.233 1.276 20 0.2166
Wenchman Snapper 0.284 0.453 0.203 1.401 4 0.2338Lizardfish spp -0.356 1.224 0.306 -1.163 15 0.2630
Fishes (unclassified) 0.728 4.037 0.692 1.052 33 0.3007Atlantic Sharpnose 1.216 1.874 1.082 1.124 2 0.3779
Butterfish 0.326 1.306 0.494 0.660 6 0.5338Sea Robins (small) 0.117 1.288 0.322 0.364 15 0.7212
Atlantic Croaker 0.360 7.027 1.205 0.298 33 0.7673
Longspine Porgy 0.174 4.706 0.807 0.215 33 0.8308
90
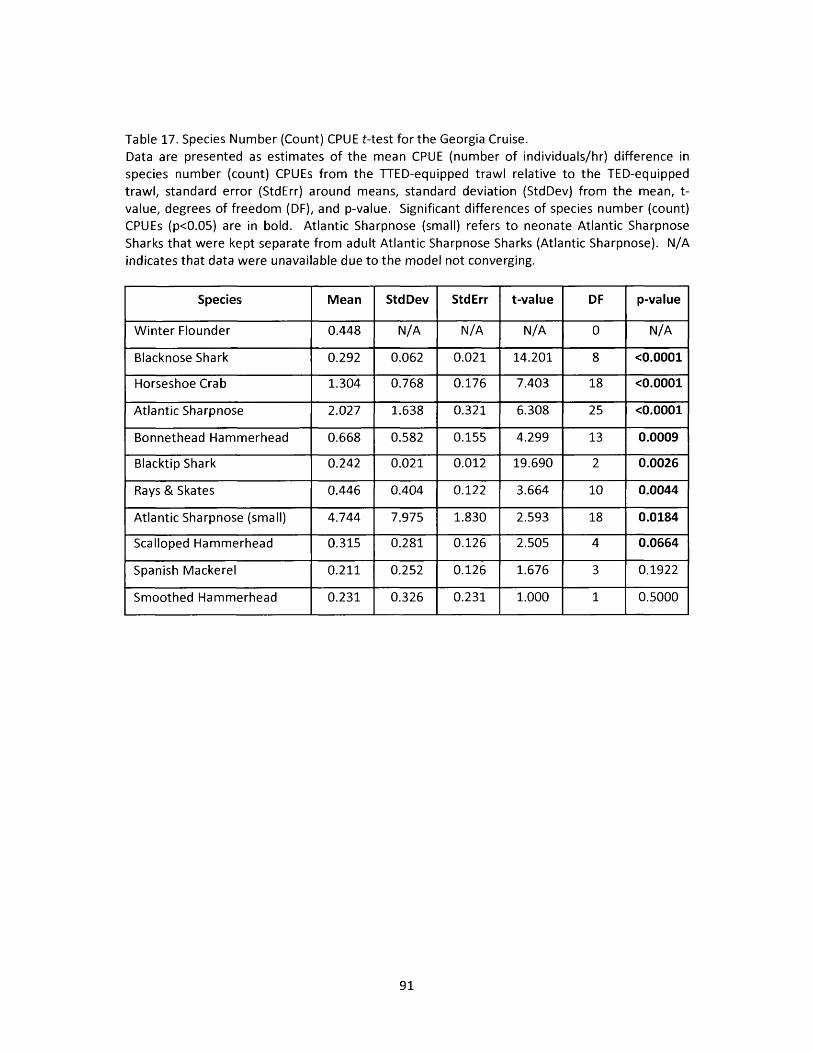
Table 17. Species Number (Count) CPUE t-test for the Georgia Cruise.Data are presented as estimates of the mean CPUE (number of individuals/hr) difference in species number (count) CPUEs from the TTED-equipped trawl relative to the TED-equipped trawl, standard error (StdErr) around means, standard deviation (StdDev) from the mean, t- value, degrees of freedom (DF), and p-value. Significant differences of species number (count) CPUEs (p<0.05) are in bold. Atlantic Sharpnose (small) refers to neonate Atlantic Sharpnose Sharks that were kept separate from adult Atlantic Sharpnose Sharks (Atlantic Sharpnose). N/A indicates that data were unavailable due to the model not converging.
Species Mean StdDev StdErr t-value DF p-value
Winter Flounder 0.448 N/A N/A N/A 0 N/A
Blacknose Shark 0.292 0.062 0.021 14.201 8 <0.0001
Horseshoe Crab 1.304 0.768 0.176 7.403 18 <0.0001
Atlantic Sharpnose 2.027 1.638 0.321 6.308 25 <0.0001
Bonnethead Hammerhead 0.668 0.582 0.155 4.299 13 0.0009
Blacktip Shark 0.242 0.021 0.012 19.690 2 0.0026
Rays & Skates 0.446 0.404 0.122 3.664 10 0.0044
Atlantic Sharpnose (small) 4.744 7.975 1.830 2.593 18 0.0184
Scalloped Hammerhead 0.315 0.281 0.126 2.505 4 0.0664
Spanish Mackerel 0.211 0.252 0.126 1.676 3 0.1922
Smoothed Hammerhead 0.231 0.326 0.231 1.000 1 0.5000
91

Table 18. Species Number (Count) CPUE t-test for the Texas Cruise.Data are presented as estimates of the mean CPUE (number of individuals/hr) difference in species number (count) CPUEs from the TTED-equipped trawl relative to the TED-equipped trawl, standard error (StdErr) around means, standard deviation (StdDev) from the mean, t- value, degrees of freedom (DF), and p-value. Significant differences of species number (count) CPUEs (p<0.05) are in bold. N/A indicates that data were unavailable due to the model not converging.
Species Mean StdDev StdErr t-value DF p-value
Dusky Shark 0.241 N/A N/A N/A 0 N/A
Spot 12.245 N/A N/A N/A 0 N/A
Blacknose Shark 0.197 N/A N/A N/A 0 N/A
Atlantic Sharpnose 0.316 0.381 0.095 3.316 15 0.0047
Shrimp Discard 9.116 21.441 3.270 2.788 42 0.0079
Southern Flounder 0.173 0.019 0.013 12.926 1 0.0492
Lizardfish spp -5.169 15.542 2.838 -1.822 29 0.0789
Gulf Smouthhound 0.095 0.341 0.055 1.736 38 0.0906
Blackear Bass 163.145 270.301 90.100 1.811 8 0.1078
Butterfish -19.960 58.067 14.083 -1.417 16 0.1756
Atlantic Angle Shark 0.187 0.273 0.122 1.530 4 0.2009
Vermillion Snapper 5.326 9.561 4.780 1.114 3 0.3464
Rock Seabass -5.132 26.735 5.834 -0.880 20 0.3895
Lane Snapper 2.454 3.740 2.644 0.928 1 0.5238
Rough Scad -13.325 130.938 22.456 -0.593 33 0.5570
Red Snapper 0.091 1.328 0.221 0.409 35 0.6850
Ocellated Flounder 4.368 19.487 13.779 0.317 1 0.8046
Atlantic Croaker 0.986 28.160 4.245 0.232 43 0.8175
Cutlass Fish -2.279 18.918 9.459 -0.241 3 0.8251
Wenchman Snapper 0.673 20.776 3.132 0.215 43 0.8308
Rays & Skates 0.061 0.835 0.316 0.192 6 0.8538
Sea Robins 1.569 40.498 12.211 0.128 10 0.9003
Sea Trouts -0.101 6.074 0.960 -0.105 39 0.9167
Longspine Porgy -0.113 45.667 6.885 -0.016 43 0.9870
92

Table 19. Species Number (Count) CPUE t-test for the Mississippi Cruise.Data are presented as estimates of the mean CPUE (number of individuals/hr) difference in species number (count) CPUEs from the TTED-equipped trawl relative to the TED-equipped trawl, standard error (StdErr) around means, standard deviation (StdDev) from the mean, t- value, degrees of freedom (DF), and p-value. Significant differences of species number (count) CPUEs (p<0.05) are in bold. Lizardfishes (small) include individuals that weighed less than 300g. Sea Robins (large) include individuals that weighed 175g or more. Sea Robins (small) includes individuals that weighed less than 175g. Crabs (large) include individuals that weighed more 200g of more. Crabs (small) includes individuals that weighed less than 200g. N/A indicates that data were unavailable due to the model not converging.
Species Mean StdDev StdErr t-value DF p-value
Louisiana Redfish 0.333 N/A N/A N/A 0 N/A
Southern Flounder 0.297 0.061 0.023 12.911 6 <0.0001
Sea Robins (large) 4.368 3.736 1.036 4.215 12 0.0012
Crabs (large) 3.751 3.702 0.956 3.924 14 0.0015
Rays & Skates 0.289 0.249 0.079 3.671 9 0.0051
Lizardfishes (large) 2.105 1.325 0.501 4.204 6 0.0057
Spot -12.685 24.005 4.537 -2.796 27 0.0094
Gulf Smoothhound 0.327 0.128 0.064 5.125 3 0.0144
Spanish Mackerel 0.306 0.038 0.027 11.286 1 0.0563
Butterfish 7.619 8.624 3.259 2.337 6 0.0580
Wenchman Snapper 12.005 11.106 4.967 2.417 4 0.0730
Sea Trouts 5.640 19.909 3.414 1.652 33 0.1081
Whitings 2.142 2.379 1.064 2.013 4 0.1144
Shrimp Discard -3.382 13.029 2.419 -1.398 28 0.1731
Red Porgy -1.942 0.826 0.584 -3.327 1 0.1859
Red Snapper 0.243 1.304 0.261 0.931 24 0.3609
Atlantic Sharpnose 0.405 0.625 0.361 1.124 2 0.3779
Atlantic Croaker 12.015 168.481 28.894 0.416 33 0.6802
Longspine Porgy 3.559 107.493 18.435 0.193 33 0.8481
93

Table 20. Small Fish Weights and CPUEs by Cruise.Data are presented as the sum of the small fish bycatch weight for all valid tows for the TED- equipped trawl (kg TED) and TTED-equipped trawl (kg TTED) by cruise. The two CPUE (kg/hr) columns refer to the small fish bycatch weight from the TED-equipped trawl (total small fish bycatch TED /to ta l hours towed) and the TTED-equipped trawl (total small fish bycatch TTED/total hours towed). Kg diff is the difference in total small fish bycatch weight of the TED- equipped trawl relative to the TTED-equipped trawl (kg TTED minus kg TED). % diff is the percent difference in total small fish bycatch weight of the TED-equipped trawl relative to the TTED-equipped trawl.
Cruise Kg TED Kg TTED CPUE TED CPUE TTED kg diff % diff
GA 3541.7 2267.8 36.86 23.22 -13.64 -37.03%
TX 6929.57 6737.76 33.06 32.09 -191.81 -5.8%
MS 6189.7 5899.56 54.44 52.21 -290.14 -5.3%
94

Table 21. Small Fish Weight CPUE t-test by Cruise.Data are presented as estimates of the mean CPUE (kg/hr) difference in small fish weight CPUEs from the TTED-equipped trawl relative to the TED-equipped trawl, standard error (StdErr) around means, standard deviation (StdDev) from the mean, t-value, degrees of freedom (DF), and p-value. Significant differences of small fish weight CPUEs (p<0.05) are in bold.
Cruise Mean StdDev StdErr t-value DF p-value
GA 1.274 1.406 0.256693 4.962061 29 0.00002
TX 0.038 0.178 0.02688 1.429313 43 0.16014
MS 0.109 0.592 0.10147 1.071552 33 0.291696
95

Table 22. GLMM Specifications for Shark spp. and Red Snapper Relative Capture Efficiency at Length (TTED versus TED).Generalized linear mixed models for evaluating length (unpooled) as a predictor of capture efficiency of the TTED-equipped trawl (REtted) relative to the TED-equipped trawl. Model building results for the capture efficiency of the TTED-equipped trawl (REtted) relative to the TED-equipped trawl by species or species group and cruise combination examined in the analysis. The fixed effects included in the Model Specification column were those that resulted in the lowest AIC value for that particular species. A random station effect [bracketed] was included for every model. Species where the intercept only model did not provide estimates of relative efficiency are indicated as failed to converge.
Cruise Date Species Model Specification
ALL Carcharhinids grouped REtted ~ intercept + length + tow depth + [station]
GA Mai Carcharhinids grouped REtted ~ intercept + length + [station]
TX July Carcharhinids grouped Did not converge
MS August Carcharhinids grouped Did not converge
GA Mai Sharpnose Shark REtted ~ intercept + length + [station]
TX July Sharpnose Shark Did not converge
MS August Sharpnose Shark REtted ~ intercept + [station]
TX July Gulf Smoothhound REtted ~ intercept + tow depth [station]
MS August Gulf Smoothhound Did not converge
GA Mai Hammerheads grouped Did not converge
TX July Red Snapper REtted ~ intercept + [station]
MS August Red Snapper REtted ~ intercept + [station]
96

Table 23. GLMM Specifications for Relative Capture Efficiency (TTED versus TED) of Numbers of Individuals by Species.General linear mixed model building results for the capture efficiency of the TTED-equipped trawl (REtted) relative to the TED-equipped trawl by species or species group and cruise combination examined in the analysis. The fixed effects included in the Model Specification column were those that resulted in the lowest AIC value for that particular species. A random station effect [bracketed] was included for every model. Species where the intercept only model did not provide estimates of relative efficiency are indicated as failed to converge. Sea Robins (large) include individuals that weighed 175g or more. Crabs (large) includes individuals that weighed more 200g of more.
Cruise Species Model Specification
ALL Carcharhinids grouped REtted ~ intercept + length + tow depth + [station]
GA Carcharhinids grouped REtted ~ intercept + length + [station]
TX Carcharhinids grouped Did not converge
MS Carcharhinids grouped Did not converge
GA Sharpnose Shark REtted ~ intercept + length + [station]
TX Sharpnose Shark Did not converge
MS Sharpnose Shark REtted ~ intercept + [station]
TX Gulf Smoothhound REtted ~ intercept + tow depth + [station]
MS Gulf Smoothhound Did not converge
GAHammerheadsgrouped Did not converge
TX Red Snapper REtted ~ intercept + [station]
MS Red Snapper REtted ~ intercept + [station]
97

Table 24. GLMM Results Using Length (unpooled) Data From Catch.Results are from the models that provided the best fit to the data as supported by model comparison (minimum AIC value). LCL (lower confidence limits) and UCL (upper confidence limits) are Wald type. Parameter estimates are on the logit scale and the Exp(Est) is the estimated relative efficiency of the TTED-equipped trawl relative to the TED-equipped trawl on the probability scale. Significant of length as a predictor variable of catch efficiency of the TTED- equipped trawl relative to the TED-equipped trawl (p<0.05) are in bold.
Cruise Species Effect Estimate StdErr DF t-value p-value LCI UCI Exp(Est)
ALL Carcharhinids Intercept 2.6753 0.7480 47 3.58 0.0008 1.1705 4.1802 14.5167
Length -0.0133 0.0030 73 -4.46 <0.0001 -0.1931 -0.0074 0.9867
Tow Depth 0.0577 0.0211 73 2.73 0.0079 0.0156 0.0998 1.0594
GA Carcharhinids Intercept 4.0675 1.6242 27 2.5 0.0186 0.7349 7.4001 58.4108
Length -0.0171 0.0059 55 -2.89 0.0055 0.0051 0.0290 0.9831
GA Atlantic sharpnose Intercept 3.3188 1.2180 26 2.71 0.0114 0.8152 5.8225 27.6272
Length -0.0143 0.0044 39 -3.25 0.0024 -0.0232 -0.0054 0.9858
TX Gulf Smoothhound Intercept 2.4493 1.5476 36 1.58 0.1223 -0.6894 5.5879 0.7271
Tow Depth -0.0501 0.0277 63 -1.81 0.0749 -0.1054 0.0052 0.9511
98

Tabl
e 25
. G
ener
aliz
ed
Line
ar
Mix
ed
Mod
el f
or
Liza
rdfis
hes.
Estim
atin
g th
e ca
ptur
e ef
ficie
ncy
of TT
ED-e
quip
ped
(REt
ted)
tr
awl
rela
tive
to th
e TE
D-e
quip
ped
traw
l us
ing
the
pool
ed
(cou
nt)
catc
h da
ta.
Resu
lts
are
from
the
mod
el t
hat
prov
ided
th
e be
st
fit (in
terc
ept
and
tow
dept
h) t
o the
da
ta
as su
ppor
ted
by m
odel
com
paris
on
(min
imum
A
IC
valu
e),
with
W
ald
type
co
nfid
ence
in
terv
als.
Pa
ram
eter
es
timat
es
are
on
the
logi
t sc
ale
and
the
exp(
Estim
ate)
is
the
estim
ated
re
lativ
e ef
ficie
ncy
on
the
prob
abili
ty
scal
e.
Perc
ent
chan
ge
repr
esen
ts
the
aver
age
perc
enta
ge
chan
ge
in the
ca
tch
of TT
ED-E
quip
ped
Traw
l Re
lativ
e to
the
TED
-
o-Q
>-ucCD
LOOOVQ.
Copoo
- aCDa .a .dc r
% C
hang
e
-100
-2.7
0
Exp(
Est)
1.97
7E-1
1
1.26
82
0.97
301
1.00
24
UCI
-3.0
315
0.39
41
0.07
35
0.00
35
LCI
-20.
0190
0.08
12
-0.0
115
0.00
14
p-va
lue 96000 0.
0043
0.14
67
<0.0
001
t-va
lue
-2.7
8
3.11
1.49
4.91
DF 28 28 32 32
SE
4.14
650.
0764
0.02
09
0.00
05
Est
imat
e
-1.5
253
0.23
76
o iCOoo 0.
0024
Mod
elS
peci
ficat
ion
Inte
rcep
tTo
w de
pth
Inte
rcep
tTo
tal
byca
tch
redu
ctio
n (k
g)
Spec
ies
Liza
rdfis
hes
Spot
Dat
e
July
Aug
ust
Cru
ise X
I MS
CDCD

Tabl
e 26
. GL
MM
Resu
lts
Using
Co
unt
(unp
oole
d)
Data
Fro
m Ca
tch
(inte
rcep
t on
ly m
odel
).Es
timat
ing
the
capt
ure
effic
ienc
y of
TTED
-equ
ippe
d (R
Ette
d)
traw
l re
lativ
e to
the
TED
-equ
ippe
d tr
awl
using
th
e po
oled
(c
ount
) ca
tch
data
. Re
sults
are
fro
m th
e m
odel
tha
t pr
ovid
ed
the
best
fit
(inte
rcep
t on
ly)
to th
e da
ta
as su
ppor
ted
by m
odel
com
paris
on
(min
imum
AI
C va
lue)
, wi
th
Wal
d ty
pe
conf
iden
ce
inte
rval
s.
Para
met
er
estim
ates
are
on
th
e lo
git
scale
an
d th
e ex
p(Es
timat
e)
is th
e es
timat
ed
rela
tive
effic
ienc
y on
th
e pr
obab
ility
sc
ale.
Pe
rcen
t ch
ange
re
pres
ents
th
e av
erag
e pe
rcen
tage
ch
ange
in
the
catc
h of
TTED
-Equ
ippe
d Tr
awl
% C
hang
e
-0.8
1
-10.
82
-99.
48 0m00 -2
.87
8.61
11.1
5
31.1
0 LO('■-OM
468.
54
272.
10
981- -39.
34
-34.
26
-18.
54
-95.
86
+■*LUQ.
cnT—1cnCn
00rHcn00CMLOOO
0r-~T—1cn
onT—1cn
rHLO000
uOrHrHrHOrHrHcn
•a-OMn-OMLf)00LD
OrHfN<3-rH00cn
LDLOOLDr>-unLD
LOrH00
rHOXLU 0 0 O 0 0 rH rH rH 0 LO m 0 O 0 0 O
UCI fN
cm
CDLDmmT—I rHO
onCM00CMT-1rH0
OMLOrH
mLOfN
mCDcn0onLOOM
LOonLDT—trHO<D00
cnCOmrH
*—1 LD 00 O
fMunm000LD00rH
<DOCMCMO 0 T—1 0 0 O 0 rH OM T—1rH m O O o O rH
LCI
LOOLDCM
cnLOLOLO
LOLOOLO0dcn
a-cnOMrHOrHrHO
cnrHO
n-LDfN
OMLD00
00n-.LO
fNCMCOCMrHrH
00000
unnn0cncnLDcnun
CO00rH
O 0 cn T—( O O O rH rH O rH p p LO
p-va
lue
0.94
79
0.60
55
0.01
94
0.37
69
0.55
82
0.08
21
0.15
47
0.71
16 LD0*a-d
LDcn00LDd 0.
2945
0.80
56
0.07
66
0.03
32
0.29
48
0.00
37
-do-Q t-v
alue r--0
0 -0.5
2
-2.7
680
-0.5
9
1.78
1.46
0.38
60- 0.41 00p
rH -0.2
5
-2.3
7
-2.2
1 90T- -3.4
8
CO) DF 35 24 12 43 33 43 33 16 CD 10 20 43 *3" 39 33 14
to>•u SE
roCMrH
r--00rHCMr-.00*a-cn
0cn0
oncn0
LDO
LOOMO'-O
LOcnrHO'-
rsjun
00LO(NfN
DOCMCMun0
0rHCMcncn00rH
LDCMcnrHLOrHcn
<u O 0 rH 0 0 O O O rH rH 0 O O O 0uL4—M—o>-Cu4->TO<_>
Estim
ate fN0000
0 -0.1
145
-5.2
576
-0.0
866
-0.0
292
0.08
26
0.10
57
0.27
08
-1.3
006
1.73
79
1.31
40
-0.0
187
-0.4
999
-0.4
194
-0.2
050 CD
00rHon
M—oLO c0 CO CO CO CO CO CO CO CO CO CO CO CO CO c0 c00 V Q.4->cTOUM—"copLo
1 TOl_1—
Mod
el S
peci
ficat
ion
REtte
d ~
inte
rcep
t +
[sta
ti
REtte
d ~
inte
rcep
t +
[sta
ti
REtte
d ~
inte
rcep
t +
[sta
ti
REtte
d ~
inte
rcep
t +
[sta
ti
REtte
d ~
inte
rcep
t +
[sta
ti
REtte
d ~
inte
rcep
t +
[sta
ti
REtte
d ~
inte
rcep
t +
[sta
ti
REtte
d ~
inte
rcep
t +
[sta
ti
REtte
d ~
inte
rcep
t +
[sta
ti
REtte
d ~
inte
rcep
t +
[sta
ti
REtte
d ~
inte
rcep
t +
[sta
ti
REtte
d ~
inte
rcep
t +
[sta
ti
REtte
d ~
inte
rcep
t +
[sta
ti
REtte
d ~
inte
rcep
t +
[sta
ti
REtte
d ~
inte
rcep
t +
[sta
ti
REtte
d ~
inte
rcep
t +
[sta
ti
■DCDQ.CL
dcrLU1QLU1—<D-CH->O4-> Sp
ecie
s
Red
snap
per
Red
Snap
per
Sea
Robin
s (la
rge)
Atla
ntic
Cro
aker
Atla
ntic
Cro
aker
Long
spin
e
Long
spin
e
But
terfi
sh
But
terfi
sh
Sea
Rob
in
Rock
Se
abas
s
Wen
chm
an
Snap
per
Wen
chm
an
Snap
per
Sea
Trou
ts
Sea
Trou
ts
Crab
(la
rge)
O)>4->_ro Cr
uise
TX MS
MS
TX MS
TX MS
TX MS
TX TX TX MS
TX MS
MS
100

Table 27. GLM Results Using Count (unpooled) Data From Catch (intercept only model), (page 102)General Linear Models (GLM) were used when General Linear Mixed Models did not provide results, GLM were used the Pooled (Count) Catch Data to Estimate the Capture Efficiency of TTED-Equipped Trawl Relative to the TED-Equipped Trawl. Results are for from the model that provided the best fit (intercept only) to the data as supported by model comparison (minimum AIC value). Confidence limits are Wald type confidence intervals. Parameter estimates are on the logit scale and the exp(Estimate) is the estimated relative efficiency on the probability scale. Percent change represents the average percentage change in the catch of TTED-Equipped Trawl Relative to the TED-Equipped Trawl. Significance of difference of catch efficiency of the TTED-equipped trawl relative to the TED-equipped trawl (p<0.05) are in bold. Lizardfishes spp (large) includes individuals that weighed 300g or more.
101

% Ch
ange
-89.
29 ooo00 -9
0.00
OO
'OO
I-000
-100
.00
-30.
64-8
3.33
-83.
33-9
6.67
-50.
00
oooorH -9
3.33 00
CDCO -8
3.33 o
in
00 -50.
00
OO'OOT- -70.
51
OO'OOT-
100
-81.
56-6
4.40
-27.
95
mo00
Exp(
Est)
0.10
71 ooo<No
OO
OI'O
ooooo
0000'T
0.69
360.
1667
0.16
670.
0333
0.50
00 ooooo 0.
0667
0.63
160.
1667
0.12
500.
5000 oooo
o 0.29
49 ooooo
3692
447.
20.
3603 LO00
CMo 0.
7205
0.21
95
UCI 0000on
cnd 3.
1039
09X10
2506
.52
0.03
581.
6457
-4.7
907
-1.2
051
14.8
687
1299
.730
-0.4
068
0.35
200.
0640
0.51
592.
0629
4546
.910
-1.1
753
4546
.910
6540
.660
1.32
263.
3033
0.08
64-0
.494
3
LCI
-3.5
284
-6.3
227
-4.7
211
-253
4.21
0
-0.7
677
-5.2
292
0.05
00-5
.597
3-1
6.25
50-1
333.
030
-5.0
093
-1.2
711
-3.5
195
-4.6
748
3.44
92
co00tHin -1
.266
8
-457
1.83
-651
0.42
0-3
.363
9 0000o00in
-569
2.00
0-2
.538
4
p-va
lue z
zo
oo 0.
2795
0.05
940.
9833 co
r-oo 0.
1957
0.17
250.
0053
0.67
210.
9763
0.02
550.
2386
0.04
360.
0976
Z8fr'0
cn
cno
rHOoooV
cnC"n*cno 0.
9813
0.11
380.
1775
00CMfMoo 0.
0146
t-val
ue
-3.6
8-1
.47
-2.2
-0.0
2
-1.8
4-1
.66
-1.6
6-3
.35
-0.5
7-0
.03
-2.6
2-1
.25
-2.3
5-1
.96 00
d -0.0
3-6
1.56
-0.0
3 moo -5
.53
-3.4
9-4
.32
DF 15 CM 00 CM 38 CO rotH T—1 CD 10 11 cn CD co T—1 00 rH T““1 T—1 rH m
SE
0.60
751.
0954
1.04
8858
5.77
0
0.19
85
r -1o00ot—i 1.
0801
1.01
651.
2247
537.
980
1.03
280.
3687
0.76
381.
0607
0.86
60
OnoGO00mCO 0.
0198
oco0000inco 51
3.57
00.
1844
0.35
60
cninf "Oo 0.
3681
Estim
ate
-2.2
336
-1.6
094
-2.3
026
-13.
8445
-0.3
659
-1.7
918
-1.7
918
-3.4
012
-0.6
931
-16.
6532
-2.7
081
-0.4
595
-1.7
918
-2.0
795
-0.6
931
-12.
4588
-1.2
211
-12.
4588
15.1
218
-1.0
207
-1.2
528
-0.3
278
-1.5
163
Mod
elSp
ecifi
catio
nRE
tted
~ in
terc
ept
REtte
d ~
inte
rcep
tRE
tted
~ in
terc
ept
REtte
d ~
inte
rcep
tDid
no
t co
nver
geDid
no
t co
nver
geRE
tted
~ in
terc
ept
REtte
d ~
inte
rcep
tRE
tted
~ in
terc
ept
REtte
d ~
inte
rcep
tRE
tted
~ in
terc
ept
REtte
d ~
inte
rcep
tRE
tted
~ in
terc
ept
REtte
d ~
inte
rcep
tRE
tted
~ in
terc
ept
REtte
d ~
inte
rcep
tRE
tted
~ in
terc
ept
REtte
d ~
inte
rcep
tRE
tted
~ in
terc
ept
Did
not
conv
erge
REtte
d ~
inte
rcep
tRE
tted
~ in
terc
ept
REtte
d ~
inte
rcep
tRE
tted
~ in
terc
ept
REtte
d ~
inte
rcep
tRE
tted
~ in
terc
ept
Spec
ies
Atla
ntic
Sh
arpn
ose
Shar
kAt
lant
ic
Shar
pnos
e Sh
ark
Blac
knos
e Sh
ark
Blac
ktip
Sh
ark
Blac
knos
e Sh
ark
Dusk
y Sh
ark
Gul
fsm
outh
ound
Gul
fsm
outh
ound
Scal
oped
ha
mm
erhe
adBo
nnet
head
H
amm
erhe
adSm
ooth
ed
Ham
mer
head
Liza
rdfis
hes
(larg
e)Ra
ys
and
skat
esRa
ys
and
skat
esRa
ys
and
skat
esSo
uthe
rn
Flou
nder
Span
ish
Mac
kere
lSp
anish
M
acke
rel
Blac
kear
ba
ssS
pot
Sout
hern
Fl
ound
erRe
d Po
rgy
Oce
llate
d Fl
ound
erLa
ne
Sna
pper
Ver
milli
on
snap
per
Whi
ting
spp
Date
July
Aug
ust
May
May
I Jul
yJu
lyJu
lyA
ugus
tM
ayM
ayA
ugus
tA
ugus
tM
ayJu
lyA
ugus
tA
ugus
tM
ayJu
lyJu
lyJu
lyJu
lyJu
lyJu
lyJu
lyJu
lyA
ugus
t
Crui
se
TX MS
GA
GA X
i - TX
XI M
SG
AG
A MS
MS
GA
TX MS
MS
GA MS
TX Xi -
Xi - TX TX TX TX M
S
102

CP00rsiq j
_Qro
£ QJ QJ_C
TOQJ
roC_4-4
C.JOE
COQ .CL
T 3 ____ 0
QJ QJ O 'CL -Q 4-> LUQ -
' 3■OQJ
ro
E
1OLU
O 'QJ
44i_O
4->CO
LU 1 =
6Q . <4—CL ' q . 0LU X
1— 00 QJ JC
QJ 000
a> 4-»_C ro _ c ro4-4 ro 4-> 0
O +-<ro ■O QJ
4-4
a j■a c
roJ Z4-4
> QJJ Z _QJ c
ro +-> ro QJa jc_
04-4
uCO 00
c' - +-> ro
1-C4—1 ’cuo -C
ro CL _o 0
4-4 aj■ 0 QJ
aj00
$-C4-'
ro4-4
QJ4-44-4LU
04-4
T 3
c0
cajui_
Cd C QJ QJ" ' ro 1—ro Cl
"O 4-4 QJa> CL COQ_CL
QJUl_
QJ4->ro
00roi_ n 1zs a»
c r £ a> .E ro O
QLU
1=
a> qj
>4_ a>O -Q > -u JZc +->0) "O
'u qj 3 T3
“ 8c- Q . 3 ^
q j q j4—' 00 l_q j ■ £ ro
<u > ■CO °Eroroo.
co
00 r - ^ 2 s - QJQ- u QJ £
M—— aj QJro clo <—^ £Z CJ
TO ■£ (— rou u
roj z
3 -C
CLroo _aj QJ
" o o
u 00 E CO
<QJ O•3
i— ro 4—' QJ00|— E E
Q_> -
4->szop
4->COQJ
0c_4—
+-•
[O
‘qj
< :
c_00|—
QJi_ro
ro
JZ CO4-> CO4-4 _c
u4-> O 13 Iro 00 COCP a j 0)CL DC *0?
E QJTO
ro4->
0ro‘i— O ro >
-C l ni—OC|_
E
T 3OJ
TO-C04-4
U
<
00 X rou E4-4
E 4-> 0000 I— -C
op EQJ ro c
DC QJ QJ
* aQJ
CL
E
>C_CD4->c
• E ? c S gD i - o
!2 a ! o — Q _ v
Q .
" + - ro c u roCO (_)
f= cuo■S '*>ro2 ^ Q. 2QJ |—
_d - a+ - i QJ
c § .2-u ^ c ^QJ Q
' U LU M— I—4—QJ QJ
j zQJ 4->• > O4-> 4->
— QJ QJ > * - ’- 3 ro
2 00 QJ 0 0c c Q> *55 CP 3
cO - Q >0)
~ QJ O)1- 4-4 — .ro rot i l3 4-j roO co i— U QJ I—
QJ0 0cro
- Cu -3
.77
5.30
-1.2
6
\ P0 4
Exp(
Est)
0.96
23
1.05
2988
592
1.00
15
0.98
7382
781
1.00
15
UCI rsi
T—lCOO
0CMt-HT—1
rsinoOO
CD00Or - l
LOnoOO
O O O O O
LCI
-0.1
381
0.00
68
-0.0
001
-0.0
623 LO
O0OO
p-va
lue
0.43
69
0.02
77
0.06
3
0.58
52
0.13
72
OJ_ 3
ro> -0
.79
2.28
T6
I 0.55
1.52
4->
DF 30 42 42 32 32
SE
00000
T—1CDrs iO
000000fN*0"O
0T—1OO
0 O 0 O O
Estim
ate
-0.0
385
0.05
94
0.00
15
0.02
31
0.00
15
Mod
el S
peci
ficat
ion
Inte
rcep
t
Inte
rcep
t
Tota
l by
catc
h re
duct
ion
(kg)
Inte
rcep
t
Tota
l by
catc
h re
duct
ion
(kg)
Spec
ies
Whi
te
Shr
imp
Brow
n S
hrim
p
Brow
n S
hrim
p
a;CO
3i—
U GA X
I MS
103

Tabl
e 29
. Ca
tche
s of
Rare
Sp
ecie
s.M
odel
spe
cific
atio
ns
and
num
ber
of an
imal
s ca
ught
in
the
TED
-equ
ippe
d tr
awl
and
TTED
-equ
ippe
d tr
awl
and
perc
ent
chan
ge
in nu
mbe
r (c
ount
) fo
r sp
ecie
s th
at
were
no
t fr
eque
ntly
en
coun
tere
d in
the
catc
h.
<u00c o o o 0 0(0 <T> o o o o ro no o o no <3- ro o o 0 rH 0 O
O-C CM o o o o o LD no no LD o d no oo ro LO o d LO0
u cn d o o o o o no no LD d o no LD ro o 0 d 0 Os°©s °o 00 cn rH
dT—1 ro oo op cn LO rH cni
noi00
i00 LO rH rH O
t-H
toM—
cu QJ tHT3 •------to to _>-
in Q O cLU LU 0
(0 1— I - LO to0
x :4-4
5
cuE
'cro
"q>
oLU
1=C
3o4—•-3003
3o4->s z003
QLU
1=3
oLU
_3
oLU
t=3o
O-C4—*
>to
QLU
t=3 O Q
QLU
3
-Uto
QLU
1=
OM—toc0
rot_
<4-o<uu
QLU
1=3
rHto3tok_QJ
OJ
rou
"roE
’3
rou
"roE
’3
QLU
3
OLU
t=3
rHto3tot_QJ
rHto3tov_QJ>
rHto3toI—Q)>
3o4-4ro£QJ
rHto3toI—QJ>
LU
t=C
rHrH
LU
_3
rsi
rHto3to1_QJ>
toroE
’3ro
00
roE
’3ro
to3O4-4ro>QJto
X !O
$QJti
3O
toroE
'3ro
c<uk-3uuO
T—1
QLU1 -3
>OLU1 -3
'toOLU1—3
ro0J3o>3
ro0J3o
_>■3
T—1QLU1 -3
rH
QLU1 -3
>OLU1-3
oLU1 -3
O
□LU1 -3O
to_QO
QJ<4-
QLU1 -3
LO
QLUJ—3
OLU1—3
rsi
ClLU1 -3
o
CMto300t_QJ>
Oto3to1—QJ>
+-*roQJto
XLO
Oto3tot-QJ>
4-»ro
QJto
X IO
~ a LO rH ro o o LO LD LD no rsi ro rH rH rH rH CM ro rH rsi rsicro * * * * * * * * * * * * * * * * * * * * *c Qo LU ! ■ 4-> 4-4 4—1 4-> 4-> 4-> 4-4 4-> 4-4 4-4 4-4 4-4 4-> 4—1 4-4 4-44->roy
c*—u
t=3
no
Q.QJUk_0J4—*
Clojut_cu4-4
CL0Juk_0J4-*
QJ00k_0J>
0)00k_0J>
Q.0JUk_QJ4-4
CLQJUi_OJ4-»
Q.QJUi_QJ4->
CLQJUt_QJ4->
CLOJuQJ4-4
Q_CUU
(U
Q_QJUt_QJ4-4
CLOJUt_0J4-4
CLCUUt_OJ4-4
CLQJ<_>t_QJ4-4
ClOJ(_jt_QJ4->
ClQJut_0J4-4
Q_QJ<_>1—QJ4-4
QJttf)l_OJ>
CLQ)O
QJ4-4
CLQ>Ut_QJ4-4
QJA Q 3 _3 3 3o
3o
3 3 3 3 3 c 3 3 3 3 3 3 C“ 3O
3 3Uto
LU 2 2 2 u <_> 2 2 2 2 2 2 2 2 2 2 2 2 2 U 2 2h - 4-> 4—* 44
"qjto TO T3 O o -o TO TO TO TO “D TO TO TO TO TO TO TO O TO TOQJ QJ 0J 3 3 QJ QJ QJ QJ 0J CU QJ QJ 0J QJ QJ QJ QJ 3 QJ QJ"O
oo4-4 4—* 4-> 4-4 4—* 4-* 4-> 4-4 4-' 4-4 4-4 4-4 4-4 4-4 4-4 4-4 4-4 4-4
o 4-> 4-> 4-> -0 -0 4-4 4-* 4-4 4-> 4-4 4-* 4-4 +4 4-4 4-4 4-4 4-4 4-4 -Q 4-4 4-4rsi LU LU LU LU 0J LU LU LU LU QJ LU 0J LU 0J QJ LU QJ LU
0C cn 0C Q i5 cn oc cn oc cn QC cn cn cn cn cn cn OC 5 cn cn
TOroQJ TO
TO -3 roro t_ QJ0) QJ -3
QJtoO3Q.
QJtOO3Q.
XLk_ro XL
t_ro
to33
TO33
QJE
EEroX
0JEECD
L0CU
_cLO
inQJ4-4
toQJ4-4
toQJ4-4
t_QJ
TO33
"qjt_QJ
"qj
QJZiC
*to
t_QJ
TO33k_
rok_ro
.3to ro
XLLO
O.3
OXL
t—ro TO X
4—”D
roJXL
rozn
ro o <_>ro
uro
toro
O.ci/>u
_3toy
0JtoO
JZLOQ.
QJtoO
ro.3LO
4->3o
4->3o
.3TOQJ
roQJ
x z4—>
TOQJ
-3CDrsi
toTO3
toTO3
toTO3
Ll_3t_QJ
XL
ro
Ll_3t_Q)
> -00k—
0J 4-* c 4-4 3 > . E E Cl QJ 4-4 ro ro ro to to aj 0
‘u0JQ.
c_ro4->
3_ro4-4
u_ro
X Lu
_roU
_roXto3
tot4—3
toM—3
Oroo
33o
ooE
CUDO
CO
to> -ro
to> -ro
to> -ro
4-43o
'3roCL
’3roCL
XLu
_ro4->0CL
-34-43O
Q.TOQJ
to < < co CO cQ Q C9 e? LO CD 00 __1 cn cn cn LO LO LO CD LO LO cn
Cru
ise
TX MS
GA
GA X
I TX
TX MS
GA
GA MS
MS
GA
TX MS
MS
GA
MS X
I
XI T
X
TX
104

Table 30. Summary of 2013 Sampling Cruises.Dates, days at sea, locations, target species for the Gulf of Mexico (GOM) offshore cruise.
Location & Species Dates Days-at-Sea ValidTows
Northern GOM (Mississippi—Louisiana)
• Brown Farfantepenaeus aztecusSept 23-Oct 27 21 20
SE GOM (Florida)
• Pink Farfantepenaeus duorarum 29
• Royal Red Hymenoppenaeus robust us Nov 4-Dec 9 36 10
Northern GOM (Alabama)
• White Litopenaeus setiferus 8
TOTAL 57 67
105

Table 31. Summary of 2013 Field Observations: TTED v. TED Catch Performance. Qualitative comparison of species encountered during comparative towing experiments.
ELASMOBRANCHBycatch Reduction
PerformanceComments
Atlantic Sharpnose TTED > TED +100 individuals caught with TED
Bonnethead Shark TTED > TED
Gulf Smoothhounds TTED > TED 20 ind. caught by TEDButterfly rays TTED > TED 7 ind. caught with TEDRaja spp. TTED > TED Noticeable difference
FISHESSnapper (small) < 25cm TTED = TED No noticeable differenceSnapper (large) > 30cm TTED > TED Noticeable differenceCobia (large) 60-80cm TTED > TED 3 ind. Caught with TED
Hognose Wrasse (large) > 30cm TTED > TED
Gaffltop Catfish TTED > TED Noticeable difference
Sea Robins TTED > TED Larger ind. caught by TEDLizardfishes TTED > TED Larger ind. caught by TED
King Mackerel TTED > TED Not frequent but noticeable
INVERTEBRATESRooster Crab (large TTED > TED Noticeable difference
blue crabs spp (large) TTED > TEDNoticeable difference Northern
GOM
Slipper Lobster (large) TTED > TED150 caught in TED versus O in TTED
in Northern GOM
Slipper lobsters (small) TTED > TEDLess in TTED the TED but still
present in TTED
Sponges TTED > TED Drastic difference in SE GOM
JELLYFISHMoon jellyfish TTED > TED Drastic difference in SE GOM
SHRIMPTarget Species
Catch
Brown Shrimp TTED = TEDSub-sample showed 0.8% less shrimp with TTED
Pink Shrimp TTED > TEDIncrease production with jellyfish
present
Royal Red Shrimp TTED = TED No difference in catch measured
W hite Shrimp TTED = TED No difference in catch measured
106

FIGURES
107

Figure 1. Gulf of Mexico Offshore Shrimp Trawling Effort and Landings (1960-2011).Total days fished (24 hour days) per year and total shrimp production (MT of shrimp tails) in the Gulf of Mexico. Data provided by NOAA Galveston Lab.
300,000
250,000
200,000
| 150,000
o"g 100,000.e
50,000
Days Fished Per Year Shrimp Production ' Tails
T T T T T T T "I I1 "I1 "I"
1960 1964 1969■pi —r-.r-T- 1—1 , m 7-T-T-T-T-r-T-T-T-r-T-l r 1 T 11 1 f"I P T T T T T T T i
1974 1979 1984 1989 1994 1999 2004 2009Year
108
63

Figure 2. Gulf of Mexico Offshore Shrimp Trawling CPUE (1960-2011).CPUE measured as MT of shrimp tails per day fished (24 hour day). Data provided by NOAA Galveston Lab.
0.70CPUE (M T o f Tailes/Days Fished)
0.60
0.50c£•c 0.40
0.30
0.20
0.101960 1970 1980 20101990 2000
Year
109

Figure 3. Typical Gear Configurations for Vessels Participating in the Southeastern Offshore Shrimp Fishery.This drawing depicts a shrimp vessel equipped with quad trawls (two pairs of twin-trawls). From Scott-Denton et al. (2012).
\ Net #2
Net #1
110

Figure 4. Catch and Bycatch Composition of the Gulf of Mexico Offshore Shrimp Fishery. Catch and bycatch composition as reported by Scott-Denton et al. (2012) for the years 2007- 2010.
GOM Catch CompositionAll other species
Pink Shrimp 4%
Longspine Porgy 4%
Atlantic Croaker 15%Other
invertebrates7%
Sea Trout (Cynosion spp.)
6%Grouped finfish
26%Crustaceans
White Shrimp
Brown Shrimp 14%
111

Figure 5. Typical Flat Net Trawl Gear Configuration for a Gulf of Mexico Shrimp Trawler.Top: Configuration of a single trawl, Bottom: Configuration of a single twin-trawl. From: Scott-Denton et al. (2012).
Hearing
C od endtxterscsfi
Top no knt
»r«
D o n ? c h a r s^ Trawl ikK f
EXjrwnif doerUHPSflifc
Tetter cr«an
Foci rope (Lead lns| i cu
< H a r i l i f c s g r i )t
Tse cfl nn^s an; lie rape
112

Figure 6. Diagram of a Turtle Excluder Device (TED).The TED consists of a metal separator grid that is installed in the trawl at an inclined angle. This particular TED has an accelerator funnel installed ahead of the TED grid. Image: NOAA Internet database.
113

Figure 7. Profile View of Super-Shooter TED Grid.This is side view of the TED super-Shooter Grid at 45° of inclination. In this case the front of the trawl would be to the left and the codend to the right. Refer to fig. 8 for front view. Image: NOAA Internet database.
SUPER SHOOTER TED
114

Figure 8. Trash and Turtle Excluder Device (TTED) Front View.This is a front view of the TTED. The aluminum pipe of the frame (A) has an inside diameter of 2.54cm while the outside diameter of the pipe is 3.5cm There is 5cm of spacing between the bars (B). The flat bars of the grid (C) have 6.3mm in width and 3.8cm in depth. The structural support pipe (D) has the same diameter as the frame. The height and width of the frame are 130cm and 107cm, respectively. For a side view of the TTED see fig. 7. Image: NOAA Internet database.
A
D
115
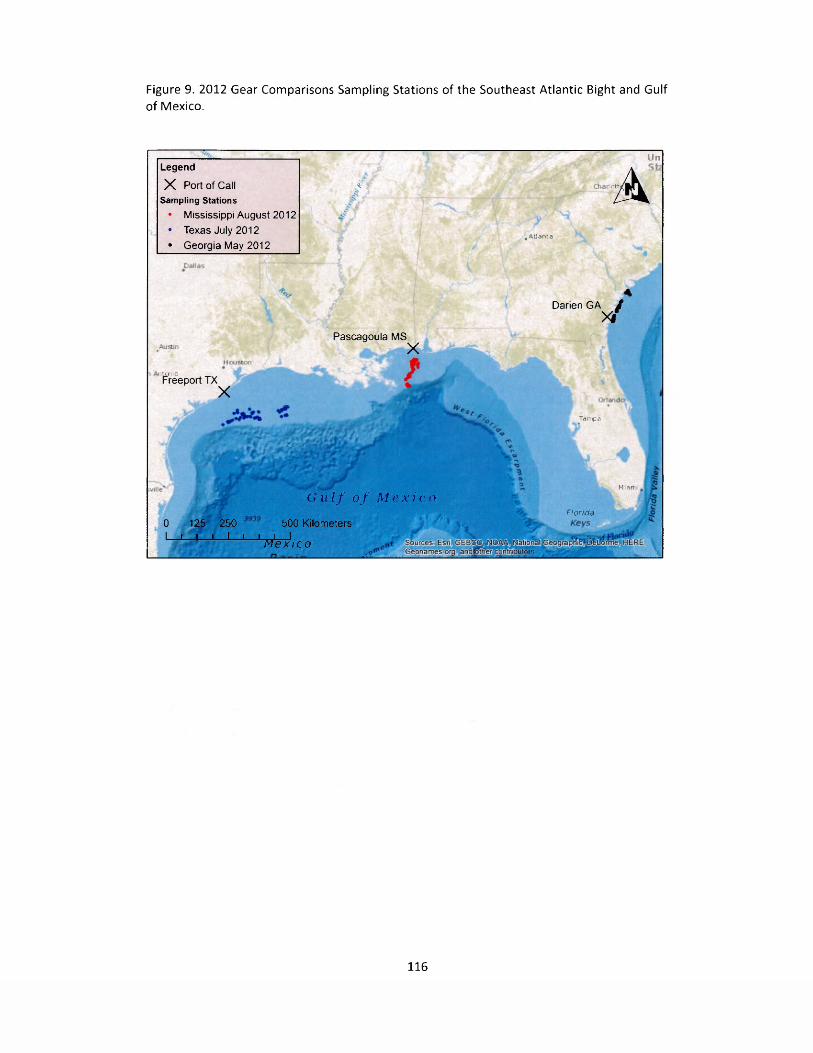
Figure 9. 2012 Gear Comparisons Sampling Stations of the Southeast Atlantic Bight and Gulf of Mexico.
Legend
X Port of CallSampling Stations
• Mississippi August 2012• Texas July 2012• Georgia May 2012
£
Un
A.A tla n ta
n tan icFreeport TX
Xll
tm
Pascagoula MSX
0 125 250I— I— I— I— I I L_J— I.Mexico
G u I f o f Mexico500 Kilometers
Darien GA /y f
Tampa
Miann
Florida
butors
116

Figure 10. Relative Carcharhinid Catch at Length in the TTED versus TED (All Trips Combined).The triangles represent the observed proportion at length (Catch TTED/(CatchTTED + CatchTED), w ith a proportion <0.5 representing more animals at length captured by the TED- equipped traw l. The solid black line represents the modeled predicted proportion of carcharhinid sharks at length that would be captured by the TTED-equipped traw l relative to the TED-equipped trawl.
800
TED Carcharhinid Catch
700TTED Carcharhinid Catch
0.75600
to _Q
0.5 9P
Q_
CL
0.25
100
A A A J r f r A A A 0* * * * * * * * * * *
425 , 625 , , x 825Fork Length (mm)
225
117

Figure 11 Relative Gulf Smoothhound Catch at Length in the TTED versus TED (All Trips Combined).The triangles represent the observed proportion at length (Catch TTED/(CatchTTED + CatchTED), w ith a proportion <0.5 representing more animals at length captured by the TED- equipped trawl. For this species, the model determined that length was not a significant predictor of catch efficiency by the TTED-equipped trawl relative to the TED-equipped trawl.
TED Gulf Smoothhound Catch
TTED Gulf Smoothhound Catch
A Proportion Caught by TTED
0.75
LUCJto
0.5
Q.
Q_
0.25
175 375 575 775Fork Length (mm)
118

Figure 12. TX Lizardfishes Relative Capture Efficiency (TTED versus TED).Results from the 2012 Texas cruise. Analysis of the pooled data indicated tha t the intercept and tow depth model was the most appropriate. The estimated relative efficiency fo r lizardfishes (Synodontidea) is shown as the blue line. The gray line has a slope of one to simulate equal relative efficiency of the TTED-equipped traw l relative to the TED-equipped traw l.
Relative EfTicency TTED vs.TED (Count Data) Lizardfishes (Synodontidea)
350 -
300 -
250 -
200 -OLU
150 -
100 -
50 -
350200 250 3000 50 100 150TED
• TX Catch EQUIVALENCY LINE- TX Efficency LINE
119

Figure 13. MS Large Sea Robins Relative Capture Efficiency (TTED versus TED).Results from the 2012 Mississippi cruise. Analysis of the pooled data indicated that the intercept only model was the most appropriate. The estimated relative efficiency for large sea robins (Triglidae) is shown as the blue line. The gray line has a slope of one to simulate equal relative efficiency of the TTED-equipped trawl relative to the TED-equipped trawl.
Relative Efficency TTED vs.TED (Count Data) Large Sea Robins (Triglidae) > 175g
30 -
25 -
20 -
oLU
25 300 5 10 15 20
TED|e MS Catch ----------- EQUIVALENCY LINE MS TTED Efficiency |
120

Figure 14. TX Large Sea Trouts Relative Capture Efficiency (TTED versus TED).Results from the 2012 Texas cruise. Analysis of the pooled data indicated that the intercept only model was the most appropriate. The estimated relative efficiency for sea trouts (Cynoscion spp.) is shown as the blue line. The gray line has a slope of one to simulate equal relative efficiency of the TTED-equipped trawl relative to the TED-equipped trawl.
Relative Efficency TTED vs. TED (Count Data) Sea Trout (Cynoscion spp.)
0 25 50 75 100 125TED
| ♦ TX Catch ------------TX TTED Efficiency EQUIVALENCY LINE |
121

Figure 15. MS Large Crabs (Rooster Crab and Blue Crab species) Relative Capture Efficiency (TTED versus TED).Results from the 2012 Mississippi cruise. Analysis of the pooled data indicated that the intercept only model was the most appropriate. The estimated relative efficiency for large crab (Rooster Crab and blue crab spp.) is shown as the blue line. The gray line has a slope of one to simulate equal relative efficiency of the TTED-equipped trawl relative to the TED- equipped trawl.
Relative Efficency TTED vs.TED (Count Data)Large Crabs Grouped (Rooster Crab and Blue Crab) Ind. > 200g
50 -
45 -
40 -
35 -
30 -oLU
20 -
0 5 2510 15 20 30 35 40 45 50
TEDI • MS Catch ----------- EQUIVALENCY LINE MS TTED Efficiency |
122

Figure 16. TX and MS Atlantic Sharpnose Shark Relative Capture Efficiency (TTED versus TED). Results from the 2012 Texas and Mississippi cruises. Analysis of the pooled data indicated that the intercept only model was the most appropriate. The estimated relative efficiency for Atlantic Sharpnose Shark is shown as the blue line. The gray line has a slope of one to simulate equal relative efficiency of the TTED-equipped trawl relative to the TED-equipped trawl.
Relative Efficency TTED vs. TED (Count Data) Atlantic Sharpnose Shark
10
8
6
4
2
0106 80 2 4
TED• TX Catch • MS Catch EQUIVALENCY LINE TX TTED Efficiency ............. MS TTED Efficiency________________________
123

Figure 17. GA Bonnethead Shark Relative Capture Efficiency (TTED versus TED).Results from the 2012 Georgia cruise. Analysis of the pooled data indicated that the intercept only model was the most appropriate specification. The estimated relative efficiency for Bonnethead Shark is shown as the blue line. The gray line has a slope of one to simulate equal relative efficiency of the TTED-equipped trawl relative to the TED-equipped trawl.
Relative EfFicency TTED vs. TED (Count Data) Bonnethead Shark
6
5
4
3
2
1
00 2 3 5 61 4
TED| • GA Catch ---------- EQUIVALENCY LINE GA TTED Efficiency |
124

Figure 18. GA, TX, and MS Rays and Skates group Relative Capture Efficiency (TTED versus TED).Results from the 2012 Georgia, Texas and Mississippi cruises. Analysis of the pooled data indicated that the intercept only model was the most appropriate. The estimated relative efficiency for the rays and skates group is shown as the blue line. The gray line has a slope of one to simulate equal relative efficiency of the TTED-equipped trawl relative to the TED- equipped trawl.
Relative Efficency TTED vs.TED (Count Data) Rays and Skates Grouped
8
6
4
2
0
0 6 82 4
TED• GA Catch • TX Catch • MS Catch GA TTED Efficiency ------------TX TTED Efficiency MS TTED Efficiency EQUIVALENCY LINE
125

Figure 19. TX Blackear Bass Relative Capture Efficiency (TTED versus TED).Results from the 2012 Texas cruise. Analysis of the pooled data indicated that the intercept only model was the most appropriate. The estimated relative efficiency for Blackear Bass is shown as the blue line. The gray line has a slope of one to simulate equal relative efficiency of the TTED-equipped trawl relative to the TED-equipped trawl.
Relative Efficency TTED vs.TED (Count Data) Blackear Bass
5000
4000
3000QLU
2000
1000
0 1000 3000 4000 50002000
TED• TX Catch EQUIVALENCY LINE TXTTED Efficency LINE
126

Figure 20. TX Vermillion Snapper Relative Capture Efficiency (TTED versus TED).Results from the 2012 Texas cruise. Analysis of the pooled data indicated that the intercept only model was the most appropriate. The estimated relative efficiency for Vermillion Snapper is shown as the blue line. The gray line has a slope of one to simulate equal relative efficiency of the TTED-equipped trawl relative to the TED-equipped trawl.
Relative Efficency TTED vs.TED (Count Data) Vermillion Snapper
20
15
10
5
0
0 5 10 15 20
TED• TX Catch EQUIVALENCY LINE TX TTED Efficency LINE
127

Figure 21. MS Whitings Relative Capture Efficiency (TTED versus TED).Results from the 2012 Mississippi cruise. Analysis of the pooled data indicated that the intercept only model was the most appropriate. The estimated relative efficiency for Whitings is shown as the blue line. The gray line has a slope of one to simulate equal relative efficiency of the TTED-equipped trawl relative to the TED-equipped trawl.
Relative Efficency TTED vs.TED (Count Data) Whitings (Merluccius)
20 -
oLU
1=
0 5 10 15 20
TED• MS Catch EQUIVALENCY LINE MS TTED Efficency LINE________________________
128

Figure 22. Plot of Grouped Small Fish Catch Weight (For All Cruises).Plot of small fish weight from the 2012 Georgia, Texas and Mississippi cruises. The gray line has a slope of one to simulate equal small fish catch weight of the TTED-equipped trawl relative to the TED-equipped trawl. The total small fish bycatch reduction efficiency for grouped small fish is shown as the blue, red and black lines for the Georgia, Texas and Mississippi cruises, respectively.
Relative Efficency TTED vs. TED (kg) Small Fish
500 -
400 -
300 -oUJ
200 -
100 -
500300 4000 100 200
TED• GA Catch • TX Catch • MS Catch GA TTED Efficiency ------------TX TTED Efficiency MS TTED Efficiency EQUIVALENCY LINE
129

Figure 23. Shrimp Catch Weight for All Cruises Relative Capture Efficiency (TTED versus TED). The 2012 Georgia cruise analysis of the shrimp catch weight data indicated that for the intercept only model was the most appropriate. For the Texas and Mississippi cruises analysis of the shrimp catch weight data indicated that for the intercept plus the variable total bycatch reduction (kg) was the most appropriate. The shrimp catch weight capture efficiency is shown as the blue, red and black lines for the Georgia, Texas and Mississippi cruises, respectively. The gray line has a slope of one to simulate equal relative efficiency of the TTED-equipped trawl relative to the TED-equipped trawl.
Relative Efficency TTED vs. TED (kg) Shrimp
120 -
100 -
• r80 -
□ILIl=
60 -
40 -
20 -
1200 20 40 60 80 100
TED• GA Catch • TX Catch • MS Catch GA White Shrimp -TX Brown Shrimp -------------------------MS Brown Shrimp EQUIVALENCY LINE
130

Figure 24. Simulated Lizardfishes Relative Capture Efficiency (TTED versus TED) When Tows with Zero Counts Data from the TTED or TED were removed.Results from the 2012 TX cruise. Analysis of the pooled data indicated that the intercept plus tow depth model was the most appropriate. The estimated relative efficiency for lizardfishes is shown as the blue line. The estimated relative efficiency for lizardfish when tows with zero count data from the TTED and TED are removed is shown as the red line. The gray line has a slope of one to simulate equal relative efficiency of the TTED-equipped trawl relative to the TED-equipped trawl.
Relative Efficency TTED vs.TED (Count Data) "Subsampling Error Example Lizardfishes (Synodontidea)
350
300
250
200OUJt=
150
100
50 200 250 300 3500 100 150
TED• TX Catch -----------NO 0s TX Efficency LINE TX Efficency LINE ----------- EQUIVALENCY LINE
131

LITERATURE CITED
Alverson, D. L. 1999. Some observations on the science of bycatch. Marine Technology
Society Journal 33, 6 -1 2 .
Alverson, D. L., M . H. Freeburg, S. A. Murawski, and J.G. Pope. 1994. A Global Assessment of
Fisheries Bycatch and Discards. FAO Fisheries Technical Paper 339.
Alverson, D. L. and S.E. Hughes. 1996. Bycatch: from emotion to effective natural resource
management. In: Solving Bycatch: Considerations for Today and Tomorrow. Alaska Sea Grant
College Program Report No. 96-03, pp. 13-28 . University of Alaska Fairbanks, Fairbanks.
Anderson, J. L. 2003. The international Seafood Trade. Cambridge: Woodhead Publishing.
Andrew, N. L. and J. G. Pepperell. 1992. The bycatch of shrimp trawl fisheries. Oceanography
and Marine Biology. An Annual Review 30, 527-565.
Asche, F., L. S. Bennear, A. Oglend, and M. D. Smith. 2012. U.S. shrimp market integration.
Marine Resource Economics 27(2), 181-192.
Averill, P. H. 1989. Shrimp/fish separator trawls for northern shrimp fishery. In: Proceedings
of the World Symposium on Fishing Gear and Fishing Vessels. Editor: Campbell, C.M. Marine
Institute, St Johns, Canada, pp. 42 -47 .
Bache, A.J. 2002. Turtles, tuna and treaties: strengthening the links between International
Fisheries Management and Marine Species Conservation. Journal of International Wildlife
Law and Policy 5, 4 9 -64 .
Barker M. J. and V. Schluessel. 2005. Managing global shark fisheries: suggestions for
prioritizing management strategies. Aquatic Conservation: Marine and Freshwater
Ecosystems 15, 325-347 .
Belcher, C. N., and C. A. Jennings. 2010. Identification and evaluation of shark bycatch in
Georgia's commercial shrimp trawl fishery with implications for management. Fisheries
Management and Ecology 18(2), 104-112.
Brewer, D., D. Heales, D. Milton, Q. Dell, G. Fry, B. Venables, and P. Jones. 2006. The impact
of turtle excluder devices and bycatch reduction devices on diverse tropical marine
communities in Australia's northern prawn trawl fishery. Fisheries Research 81:176-188.
Broadhurst, M. K. 2000. Modifications to reduce bycatch in prawn trawls: A review and
framework for development. Reviews in Fish Biology and Fisheries 10: 27 -60 , 2000.
132

Broadhurst, M. K. and S. J. Kennelly. 1994. Reducing the bycatch of juvenile fish (mulloway
Argyrosomus hololepidotus) using square-mesh panels in codends in the Hawkesbury River
prawn-trawl fishery, Australia. Fisheries Research 19, 321-331.
Broadhurst, M . K. and S. J. Kennelly. 1995. A trouser-trawl experiment to assess codends that
exclude juvenile mulloway (Argyrosomus hololepidotus) in the Hawkesbury River prawn-
trawl fishery. Marine and Freshwater Research 46, 953-958 .
Broadhurst, M . K. and S. J. Kennelly. 1996a. Effects of the circumference of codends and a
new design of square-mesh panel in reducing unwanted by-catch in the New South Wales
oceanic prawn-trawl fishery, Australia. Fisheries Research 27, 203-214 .
Broadhurst, M. K. and S. J. Kennelly. 1996b. Rigid and flexible separator-panels in trawls that
reduce the by-catch of small fish in the Clarence River prawn-trawl fishery, Australia. Marine
Freshwater Research 47, 991-998 .
Broadhurst, M . K. and S. J. Kennelly. 1997. The composite square-mesh panel: a modification
to codends for reducing unwanted bycatch and increasing catches of prawns throughout the
New South Wales oceanic prawn-trawl fishery. Fisheries Bulletin 95, 6 5 3 - 664.
Broadhurst, M. K., S. J. Kennelly and S. Eayrs. 1999b. Flow-related effects in prawn-trawl
codends: potential for increasing the escape of unwanted fish through square-mesh panels.
Fisheries Bulletin 9 7 ,1 -8 .
Broadhurst, M . K., R. B. Larsen, S.J. Kennelly, and P.E. McShane. 1999c. Use and success of
composite square-mesh codends in reducing bycatch and in improving size-selectivity of
prawns in Gulf St. Vincent, South Australia. Fisheries Bulletin 97, 434 -448 .
Bryan, C. E., T. J. Cody and G. C. Matlock. 1982. Organisms captured by the commercial
shrimp fleet on the Texas brown shrimp grounds. Texas Parks and Wildlife Department,
Technical Series No. 31, 26 pp.
Burgess, G. H., L. R. Beerkircher, G. M. Cailliet, J. K. Carlson, E. Cortes, K. J. Goldman, R. D.
Grubbs, J. A. Musick, M. K. Musyl and C. A. Simpfendorfer. 2005. Is the collapse of shark
populations in the Northwest Atlantic Ocean and Gulf of Mexico real? Fisheries 30:10,19-26.
Cadigan, N. G., S.J. Walsh, and W. Brodie. 2006. Relative efficiency of the Wilfred Templeman and Alfred Needier research vessels using a Campelen 1800 shrimp trawl in NAFO Subdivision 3Ps and Divisions 3LN. Fisheries and Oceans Canada 2006/085
Caillouet, C. W., D. L. Shaver, W. G. Teas, D. B. Revera, and A. C. Cannon. 1996. Relationship between sea turtle stranding rates and shrimp fishing intensities in the northwestern Gulf of Mexico: 1986-1989 versus. Fishery Bulletin 94(2), 237-249.
Camhi M. 1998. Sharks on the Line: A State-by-State Analysis of Sharks and Their Fisheries.
Islip, NY: National Audubon Society, 156 pp.
133

Chaboud, C., and P. Vendeville. 2011. Interactions between industrial shrimp fisheries with
other fisheries and the environment. Biological and bio-economic aspects, the examples of
Madagascar and French Guyana. In : Proceedings of How minimizing the footprint of
aquaculture and fisheries on the ecosystem? E d itor: F. Poisson. French-Japanese
Symposium, Ifremer, Sete, France , 1-3 September 2010.
Chan, E. H., H. C. Liew, and A. G. Mazlan. 1988. The incidental capture of sea turtles in fishing
gear in Terengganu, Malaysia. Biological Conservation 4 3 ,1 -7 .
Chavance, P. 2002. Pour une reconstruction d'un demi-siecle devolution des pecheries en
Afrique de I'Oust, in : Actes du symposium international, Dakar (Senegal), 24-28 juin 2002
113-130p.
Chuenpagdee, R., L. E. Morgan, S. M. Maxwell, E. A. Norse, and D. Pauly. 2003. Shifting gears:
assessing collateral impacts of fishing methods in U.S. waters. Frontiers in Ecology and the
Environment 2003:1:515-24.
Clucas, I. 1997. A study of the options for utilization of bycatch and discards from marine
capture fisheries. FAO Fisheries Circular No. 928, 59 pp.
Conolly, P. C. 1992. Bycatch activities in Brazil. In: International Conference on Shrimp
Bycatch. Editor: Jones, R.P. May, 1992, Lake Buena Vista, Florida. Southeastern Fisheries
Association, Tallahassee, FL, pp. 291-302.
Cortes, E. 2002b. Stock assessment of small coastal sharks in the U.S. Atlantic and Gulf of
Mexico. National Oceanic and Atmospheric Administration, NMFS, SEFSC, Sustainable
Fisheries Division Contribution SFD-01/02-152.
Crowder, L. B., S. R. Hopkins-Murphy, and J. A. Royle. 1995. Effects of turtle excluder devices
(TEDs) on loggerhead sea turtle strandings with implications for conservation. Copeia
1995:773-779.
Dayton, P. K., S. F. Thrush, M . T. Agardy, and R. J. Hofman. 1995. Environmental effects of
marine fishing. Aquatic Conservation. Marine and Freshwater Ecology 5, 205-232.
Davies, R. W. D., S. J. Cripps, A. Nickson, and G. Porter. 2009. Defining and estimating global
marine fisheries bycatch. Marine Policy, 33(4), 661-672 .
De Groot, S. J. 1984. The impact of bottom trawling on benthic fauna of the North Sea.
Ocean Management 9 ,1 7 7 -1 9 0 .
Diamond, S. L. 2004. Bycatch quotas in the Gulf of Mexico shrimp trawl fishery: can they
work? Reviews in Fish Biology and Fisheries 14:207-237.
134

Diamond, S. L., L. G. Cowell, and L. B. Crowder. 2000. Population impacts of shrimp trawl
bycatch on Atlantic croaker. Canadian Journal of Fisheries and Aquatic Sciences 57, 2 0 1 0 -
2021.
Diamond, S. L., L. B Crowder, and L. G. Cowell. 1999. Catch and bycatch: the qualitative
effects of fisheries on population vital rates of Atlantic Croaker. Transactions of the American
Fisheries Society 128 :1085-1105 .
Duffaud, M .H., L. Kelle, M. Nalovic, and G. Feuillet. 2011. Le plan de restauration des tortues
marines de Guyane Frangaise: bilan et perspectives. Bulletin de la Societe Herpetologique de
France.139-140: 71-83 p.
Engaas, A., Foster, D., Hataway, B.D., Watson, J.W. and I. Workman. (1999) The behavioral
response of juvenile red snapper (Lutjanus campechanus) to shrimp trawls that utilize water
flow modifications to induce escapement. Marine Technology Society Journal 33(2), 43 -50 .
Epperly, S. P., L. Avens, L. Garrison, T. Henwood, W. Hoggard, J. Mitchell, J. Nance, J.
Poffenberger, C. Sasso, E. Scott-Denton, and C. Yeung. 2002a. Analysis of sea turtle bycatch
in the commercial shrimp fisheries of southeast U.S. waters and the Gulf of Mexico. U.S.
Dep. Commerce, NOAA Technical Memorandum NMFS-SEFSC-490, 88 p.
Epperly, S. P. and W. G. Teas. 2002b. Turtle excluder devices-are the escape opening large
enough?. Fisheries Bulletin 100:466-474.
FAO. 2005. Fisheries Technical Paper. No. 470. Food and Agriculture Organization of the
United Nations, Rome. 131p.
FAO. 2008. Global study of shrimp fisheries. Food and Agriculture Organization of the United
Nations, Rome.
FAO. 2011. The State of World Fisheries and Aquaculture 2010. Food and Agriculture
Organization of the United Nations, Rome, 1-218.
Federal Register. 1987. Sea Turtle Conservation, Shrimp Trawling Requirements. Federal
Register 52(124):24244-24262 (June 29).
Federal Register. 1998. Fisheries of the Caribbean, Gulf of Mexico, and South Atlantic;
Shrimp Fishery of the Gulf of Mexico. Federal Register, Amendment 9. 63(71): 970523122-
8022-02. (April 14).
Federal Register. 2003. Endangered and threatened wildlife: sea turtle conservation
requirements. Federal Register 68(35):8456-8471 (February ).
135

Foster, D., 2010. Update on the results of shrimp trawl bycatch reduction device certification
tests conducted in the Gulf of Mexico. Technical Report. NOAA Fisheries Service, Southeast
Fisheries Science Center, Mississippi Laboratories, P.O. Drawer 1207, Pascagoula, MS 39568.
Foster, D. 2011. Results of shrimp trawl bycatch reduction device certification tests conducted for a composite panel BRD with a cone fish deflector. NOAA Fisheries Service, Southeast Fisheries Science Center, Mississippi Laboratories, P.O. Drawer 1207, Pascagoula, MS 39568.
Foster, D. and E. Scott-Denton. 2004. Status of bycatch reduction device performance and
research in North-Central and Western Gulf of Mexico. Working paper to the Red Snapper
Stock Assessment Data Workshop, April, 2004. Document No. SEDAR7-DW-38. Gulf of
Mexico Fishery Management Council, The Commons at Rivergate, Tampa, FL.
Gallaway, B. J., J. G. Cole, L. R. Martin, J. M. Nance, and M . Longnecker. 2003. An evaluation
of an electronic logbook as a more accurate method of estimating spatial patterns of
trawling effort and bycatch in the Gulf of Mexico shrimp fishery. North American Journal of
Fisheries Management 23:787-809.
Gallaway, B. J., J. G. Cole, R. Meyer, and P. Roscigno. 1999. Delineation of essential habitat
for juvenile red snapper in the northwestern Gulf of Mexico. Transactions of the American
Fisheries Society 128:4, 713 -726 .
Gallaway B. J., J. G. Cole, J. M . Nance, R. A. Hart, G. L. Graham. 2008. Shrimp Loss associated
with turtle excluder devices: Are the historical estimates statistically biased?. North
American Journal of Fisheries Management 28:203-211.
Gauvin, J. R., K. Haflinger, and M . Nerini. 1996. Implementation of a voluntary bycatch
avoidance program in the flatfish fisheries of the eastern Bering Sea. In: Solving Bycatch:
Considerations for Today and Tomorrow. Alaska Sea Grant College, Fairbanks, Alaska, pp.
79-86 .
Gillig, D., W.L. Griffin and T. Ozuna, Jr. 2001. A Bio-Economic Assessment of Gulf of Mexico
Red Snapper Management Policies. Transaction of the American Fisheries Society 30:117-
129.
Glass, C. W., and C.S. Wardle. 1995. Studies on the use of visual stimuli to control fish escape
from codends. II. The effect of black tunnels on the reaction behavior of fish in otter trawl
codends. Fisheries Research 23,165-174.
Goodyear, C. P. 1995. Red snapper in U.S. waters of the Gulf of Mexico. National Oceanic and
Atmospheric Administration, SEFSC, Miami, Florida, 171 pp.
Goodyear, C. P. and P. Phares. 1990. Status of red snapper stocks of the Gulf of Mexico
report for 1990. SEFSC, Miam i, Florida, CRD 89/90- 05, 72 p.
136

Gordon, R. M. 1981. Guyana. In: Fish Bycatch. Bonus from the Sea: Technical Consultation on
Shrimp By-catch Utilization, 2 7 -30 October, Georgetown, Guyana. IDRC, Ottowa, p. 131.
Greenstreet, S. P. R., and S. I. Rogers. 2000. Effects of fishing on non-target fish species. In:
Effects of fishing on non-target species and habitats: biological, conservation and socio
economic issues. Editors: M. J. Kaiser and S. de Groot p. 217-234 . Blackwell Sci, Oxford.
GMFMC. 1997. Amendment number 9 to the Fisheries Management Plan for the shrimp
fishery of the Ulf of Mexico, U. S. waters, with supplemental environmental impact
statement, regulatory impact review, initial regulatory flexibility analysis, and social impact
assessment. GMFMC, The Commons at Rivergate, 3018 U.S. Highway 301 North, Suite 1000,
Tampa, FL 33619-2815.
GMFMC. 2007. Amendment number 27 to the Ref Fish Fishery Management Plan and
amendment 14 to the Shrimp Fishery Management Plan including supplemental
environmental impact statement, regulatory impact review, and regulatory flexibility act
analysis. GMFMC, 2203 North Lois Avenue, Suite 1100, Tampa, Florida 33607
Gray, C. A., R. B. Larsen, and S. J. Kennelly. 2000. Use of transparent netting to improve size
selectivity and reduce by-catch in fish seine nets. Fisheries Research 45,155-166.
Gunter, G. 1956. Should fish and game fishes become more or less abundant as pressure
increases in the trash fish fishery of the Gulf of Mexico? LA Dept, of Wildlife and Fisheries,
New Orleans, LA, LA Conservancy 1 1 ,1 4 -1 5 ,1 9 .
Haby, M . G., R. J. Miget, L.L. Falconer, and G. L. Graham. 2003. A review of current conditions
in the Texas shrimp industry, an examination of contributing factors, and suggestions for
remaining competitive in the global shrimp market. TAMU-SG-03-701. Texas A&M
Agricultural Research and Extension Center, Agnes St., Corpus Christi.
Hall, M. A. 1996. On bycatches. Reviews in Fish Biology and Fisheries. 6, 3 1 9 - 352.
Hall, M. A., D. L. Alverson, and K. I. Metuzals. 2000. Bycatch: problems and solutions. Marine
Pollution Bulletin 41(1-6), 204-219 .
Hall, S. J. and B. M. Mainprize. 2005. Managing by-catch and discards: how much progress
are we making and how can we do better? Fish and Fisheries 6:134-155.
Hampton, I. 2003. Harvesting the sea. In: Namibia's Marine Environment. Editors: F. Molloy
and T. Reinikainen. Directorate of Environmental Affairs of the Ministry of Environment and
Tourism, Namibia, Windhoek, Namibia, pp. 31-69 .
137

Harichandan, A. B., and A. Roy. 2010. Numerical investigation of low Reynolds number flow
past two and three circular cylinders using unstructured grid CFR scheme. International
Journal of Heat and Fluid Flow 31. P.154-171.
Hart, R. A. 2008. A biological review of the Tortugas Pink Shrimp Fishery 1960 through 2007.
NOAA Technical Memorandum NMFS-SEFSC-573.
Hart, R. A. 2012a. Stock assessment of the W hite Shrimp (Litopenoeus setiferus) in the U.S.
Gulf of Mexico for 2011a. NOAA Technical Memorandum NMFS-SEFSC-637.
Hart, R. A. 2012b. Stock assessment of the Brown Shrimp (Farfantepenaeus oztecus) in the
U.S. Gulf of Mexico for. NOAA Technical Memorandum NMFS-SEFSC-638.
Hart, R. A. 2012c. Stock assessment of the Pink Shrimp (Farfantepenaeus duorarum) in the
U.S. Gulf of Mexico for. NOAA Technical Memorandum NMFS-SEFSC-639.
Hart, R. A., and J. M. Nance. 2010. Gulf of Mexico pink shrimp assessment modeling update:
from a static VPA to an integrated assessment model, Stock Synthesis. NOAA Technical
Memorandum NMFS-SEFSC-604. 32 pp.
Harrington, D. 1992. A sea grant perspective on reducing bycatch. In: International
Conference on Shrimp Bycatch. May, Editor: Jones, R.P. 1992, Lake Buena Vista, Florida.
Southeastern Fisheries Association, Tallahassee, FL, pp. 291-302 .
Harrington, J. M ., R. A. Myers, and A. A. Rosenberg. 2005. Wasted fishery resources:
discarded by-catch in the USA. Fish and Fisheries 6:350-361.
Harrington, D. and R. A. Vendetti. 1995. Shrimp trawl bycatch reduction in the Southeastern
United States. In Solving Bycatch: Considerations for Today and Tomorrow. Fairbanks, AL:
Alaska Sea Grant College Program Report No. 96-03
Hoar, P., J. Hoey, J. Nance, and C. Nelson. 1992. A research plan addressing finfish bycatch in
the Gulf of Mexico and south Atlantic shrimp fisheries. Tampa, FL: Gulf and South Atlantic.
Fisheries Development Foundation, Inc., 4 pp.
Holden, M . J. 1974. Problems in the rational exploitation of elasmobranch populations and
some suggested solutions. In Sea Fisheries Research. Editor: F.R. Harden J. Logos Press,
London, pp. 117-137.
Holst, R., and A. Revill. 2009. A simple statistical method for catch comparison studies.
Fisheries Research 95, 254 -259
Hickey, W. M., G. Brothers, and D. L. Boulos. 1993. By-catch reduction in the northern shrimp
fishery. Canadian Journal of Fisheries and Aquatic Science No. 1964, 41 pp.
138

Hueter, R. E. and C. A. Manire. 1994. Bycatch and catch-release mortality of small sharks in
the Gulf coast nursery grounds of Tampa Bay and Charlotte Harbor. M ote Marine Technical
Report No. 368 (Final report to NOAA/NMFS, MARFIN Project NA17FF0378-01):183 pp.
ICES (International Council for the Exploration of the Sea). 2002. Report of the Working
Group on Marine Mammal Population Dynamics and Habitats (W GMMPH)." ICES CM
2002/ACE:02.
Iverson, E., D. Allen, and J. Higman. 1993. Shrimp capture and culture fisheries of the United
States. Oxford, United Kingdom, Fishing News Books, Blackwell Science.
Jones, J. B. 1992. Environmental impact of trawling on the seabed: a review. New Zealand
Journal of Marine and Freshwater Research 26, 59-67 .
Karlsen, L. and R. Larsen. 1989. Progress in the selective shrimp trawl development in
Norway. In: Proceedings of the World Symposium on Fishing Gear and Fishing Vessels.
Editor: Campbell, C.M. Marine Institute, St. Johns, Canada, pp. 30-38 .
Keiser, R. K. Jr. 1977. The incidental catch from commercial shrimp trawlers of the South
Atlantic states. Technical Report No. 26, South Carolina Wildlife and Marine Resources
Department, Charleston, SC, 38 pp.
Kelleher, K. 2005. Discards in the world's marine fisheries: an update. FAO Fisheries
Technical Paper 4 70 ,13 1 p.
Kennelly, S. J. 1995. The issue of bycatch in Australia's demersal trawl fisheries. Reviews in
Fish Biology and Fisheries. 5, 213-234.
Kennelly, S. J. and M. K. Broadhurst. 2002. By-catch begone: changes in the philosophy of
fishing technology. Fish and Fisheries 2, 340-355.
Kennelly, S. J. and C. A. Gray. 2000. Reducing the mortality of discarded undersize sand
whiting sillago ciliata in an estuarine seine fishery. Marine and Freshwater Research 51, 749-
753.
Kilma, E. F., J. M. Nance, E. X. Martinez, and T. Leary. 1990. Workshop on definition of shrimp
recruitment overfishing. NOAA Technical Memorandum , NMFS. SEFC-264. 21pp.
Krampe, P. 2006. Rising fuel prices and its impact on the tuna industry. Paper presented at
the INFOFISH World Tuna Trade Conference, 25-27 May, Bangkok, Thailand.
Kumar, A. B., and G. R. Deepthi. 2006. Trawling and bycatch: Implications on marine
ecosystem. Current Science India 90(7):992-931.
139

Larsen, R. B. 1989. A review on the application and selectivity of square mesh netting in
trawls and seines. In: Proceedings of the Square Mesh Workshop, Held at the World
Symposium on Fishing Vessel and Fishing Gear Design. Editor: H. A. Carr. Department of
Fisheries and Oceans, St John's, Newfoundland.
Leopold M. 2004. Guide des poisson de mer de Guyane. Ed. Ifremer. 216p.
Lunz, G. R., J. L. McHugh, E. W. Roelofs, R.E. Tiller, and C. E. Atkinson. 1951. The destruction
of small fish by the shrimp trawlers in Pamlico Sound, North Carolina. Report to the
Chesapeake and South Atlantic Sections, Atlantic States Marine Fisheries Commission,
November 1 ,1 9 5 1 ,1 3 pp.
Menard, F., V. Nordstrom, J. Hoepffner, and J. Konan. 2002. A database for the trawl
fisheries of Cote d'Ivoire: Structure and use. Large Marine Ecosystems, 11, 275-287.
M ethot, R.D. 2009. Stock assessment: operational models in support of fisheries
management. The Future of Fishery Science. In: Proceedings of the 50th Anniversary
Symposium of the American Institute of Fishery Research Biologists, Editors: Beamish and
Rothschild. Seattle, WA. Springer. Fish and Fisheries Series, Vol. 31: Pg. 137-165.
M ethot, R. D., Jr., and C. R. Wetzel. 2013. Stock synthesis: A biological and statistical
framework for fish stock assessment and fishery management. Fisheries Research, 142, 8 6 -
99.
Mitchell, J. F., and D. Foster. 2002. A technical description of enlarged escape openings and
results from comparative tests for shrimp retention in the southeast U.S. shrimp fishery.
NMFS, SEFSC, Pacagoula, Mississippi.
Mitchell, J. F., J. W. Watson, D. G. Foster and R. E. Caylor. 1995. The turtle excluder device
(TED) : A guide to better performance. NOAA Technical Memorandum NMFS-SEFSC-366.
35pp.
Moore, J. E., B. P. Wallace, R. L. Lewison, R. Zydelis, T. M. Cox, and L. B. Crowder. 2009. A
review of marine mammal, sea turtle and seabird bycatch in USA fisheries and the role of
policy in shaping management. Marine Policy 33(3), 435-451 .
Mukherjee, Z., and K. Segerson. 2011. Turtle excluder device regulation and shrimp harvest:
the role of behavioral and market responses. Marine Resource Economics 26(3), 173-189.
Murawski, S., R. Brown, H. Lai, P. Rago, and L. Hendrickson. 2000. Large-scale closed areas as
a fishery-management tool in tem perate marine systems: The Georges's Bank experience.
Bulletin of Marine Science 66:775-798.
Musick, J. A., G. H. Burgess, M. Camhi, G. Cailliet, and S. Fordham. 2000a. Management of
sharks and their relatives (Elasmobranch Fisheries) (3):9-13.
140

Nance, J. M., C. W. Caillouet, Jr, and R. A. Hart. 2010. Size-composition of Annual Landings in
the W hite Shrimp, Litopenaeus setiferus, Fishery of the Northern Gulf of Mexico, 1960-2006:
Its Trend and Relationships with Other Fishery-dependent Variables. Marine Fisheries
Review 72(2), 1.
Nance J., W. Keithly, C. Caillouet, J. Cole, W. Gaidry, B. Gallaway, W. Griffin, R.A. Hart, M.
Travis. 2008. Estimates of efforts, maximum sustainable yield, and maximum economic yield
in the shrimp fishery of the golf of Mexico. NOAA Technical Memorandum NMFS-SEFSC-570.
Nance, J.M. 1993a.. Gulf of Mexico Shrimp Fishery Recruitment Overfishing Definition -
Workshop 2. NOAA Technical Memorandum , NMFS-SEFSC-323,12 pp.
Nance, J.M. 1993b. Effort trends for the Gulf of Mexico shrimp fishery. NOAA Technical
Memorandum NMFS- SEFSC-337, 37 pp.
Nalovic, M . A., and A. Bardiot. 2010. Reduction des Effets du Chalutage des Crevettes sur
L'ecosysteme Marin du Plateau des Guyanes . Proceedings of the Gulf and Caribbean
Fisheries Institute 62: 90-97 .
National Research Council. 1990. Decline of the Sea Turtles: Causes and Prevention. National
Academy Press, Washington DC, 259 pp.
National Research Council. 2002. The Effects of Trawling and Dredging on the Seabed.
National Academy of Sciences, Washington DC, 125 pp.
National Oceanic and Atmospheric Administration. 2008 a. Fisheries of the Caribbean, Gulf
of Mexico, and South Atlantic; Shrimp fishery of the Gulf of Mexico; Revisions to bycatch
reduction devices and testing protocols. 73 Federal Register 30 (13 Feb. 2008), p. 6 8 ,3 55 -
68,361.
National Marine and Fisheries Service. 1995. Cooperative research program addressing
finfish bycatch in the Gulf of Mexico and South Atlantic shrimp fisheries: a report to
Congress, April 1995. USDOC, NOAA, NMFS. NMFS, 9721 Executive Center Drive, St.
Petersburg, FL 33702, 19
National Marine and Fisheries Service. 1999. Our living oceans: report on the status of U.S.
living marine resources, 1999. U.S. Department of Commerce, NOAA. Technical
Memorandum . NMFS-F/SPO-41, 301 p.
National Marine and Fisheries Service. 1998. Managing the Nation's Bycatch: Programs,
Activities, and Recommendations for the NMFS. NOAA, U.S. Department of Commerce,
Washington, DC, 174 pp.
141

National Marine and Fisheries Service. 2007a. Magnuson-Stevens Fishery Conservation and
Management Act. NMFS. Silver Spring, Maryland. 178 pp.
National Marine and Fisheries Service. 1995. Cooperative research program addressing
finfish bycatch in the Gulf of Mexico and South Atlantic shrimp fisheries. A report to
Congress. NMFS/SER. NMFS, St. Petersburg, Florida.
National Marine and Fisheries Service. 2007b. SEDAR 13 Stock Assessment Report: Small
Coastal Sharks, Atlantic Sharpnose, Blacknose, Bonnethead, and Finetooth Shark. NMFS.
Silver Springs, Maryland, 375 pp.
National Marine and Fisheries Service. 1993. Fishery Management Plan for sharks of the
Atlantic Ocean. U.S. Department of Commerce, NOAA/NMFS, Silver Spring, Maryland 167 pp.
National Marine and Fisheries Service. 2003a. Commercial fisheries database (Internet
database). Available from the internet URL: http://www.st.NMFS.gov/pls/webpls/FT_
HELP.SPECIES Accessed November 11, 2003.
Nichols, S. 1984. Updated assessments of brown, white and pink shrimp in the U.S. Gulf of
Mexico. Paper presented at the SEFC Stock Assessment Workshop. Miami, FI., May 1984.
Nichols, S., A. Shah, G. Pellegrin, and K. Mullin. 1990. Updated estimates of shrimp fleet
bycatch in the offshore waters of the Gulf of Mexico. Report to the Gulf of Mexico Fishery
Management Council, NMFS, SEFSC, Pascagoula Laboratory, Pascagoula, MS, 25 pp.
Nichols, S. 1999. Overall effectiveness of BRDs. Final Report on the Red Snapper/Shrimp
Research Program Summer 1998 Project, NMFS, SEFSC, Pascagoula Laboratory, Pascagoula,
MS.
Oceana. 2002. Petition for rulemaking, letter addressed to Donald L. Evans, U.S. Secretary of
Commerce. February 28, 2002.
O'Keefe, C. E., Cadrin S. X., and Stokesbury, K. D. E., 2013. Evaluating effectiveness of time/area closures, quotas/caps, and fleet communications to reduce fisheries bycatch. - ICES J. Mar. Sci.
Ortiz, M ., C.M. Legault, and N. M . Ehrhardt. 2000. An alternative method for estimating
bycatch from the U.S. shrimp trawl fishery in the Gulf of Mexico, 1972-1995. Fisheries
Bulletin 98, 583-599.
Parrack, M.L. 1990. A preliminary study of shark exploitation during 1986-1989 in the U.S.
FCZ. NOAA/NMFS Contrib. No. M IA-90-493.
Patrick, W. S., and L.R. Benaka. 2013. Estimating the economic impacts of bycatch in U.S.
commercial fisheries. Marine Policy 38(C), 470-475 .
142

Pellegrin, G., Jr. 1982. Fish discards from the southeastern United States shrimp fishery. In
Fish-bycatch...Bonus from the sea: a report of a technical consultation on shrimp by-catch
utilization held in Georgetown, Guyana, 27 -30 October 1981, p. 51 -54 . FAO Int. Dev. Res.
Cent., Ottawa, Ont.
Pettovello, A.D. 1999. By-catch in the Patagonian red shrimp (Pleoticus muelleri) fishery.
Marine and Freshwater Research. 50, 123-127.
Raborn, S. W., B. J. Gallaway, J. G. Cole, W. J. Gazey, and K. I. Andrews. 2012. Effects of Turtle
Excluder Devices (TEDs) on the Bycatch of Three Small Coastal Sharks in the Gulf of Mexico
Penaeid Shrimp Fishery. North American Journal of Fisheries Management, 32(2), 333-345 .
Rathbun, R. 1883. Notes on the shrimp and prawn fisheries of the United States. Bulletin of
the United States Bureau of Fisheries 2 ,1 3 9 -1 5 2 .
Renaud, M ., G. Gitschlag, E. Klima, A. Shah, D. Koi, and J. Nance. 1993. Loss of shrimp by
turtle excluder devices (TEDs) in coastal waters of the United States, North Carolina to Texas,
March 1988-M arch 1990. U.S. NMFS Fishery Bulletin 91:129-137.
RFSAP (Reef Fish Stock Assessment Panel) (1999) September 1999 report of the Reef Fish
Stock Assessment Panel. Gulf of Mexico Fishery Management Council, The Commons at
Rivergate, Tampa, FL.
Robins-Troeger, J.B., R. C. Buckworth, and M. C. L. Dredge. 1995. Development of a trawl
efficiency device (TED) for Australian prawn fisheries. II. Field evaluations of the AusTED.
Fisheries Research 2 2 ,1 0 7 -1 1 7
Rogers, D.R., B. D. Rogers,J. A. De Silva, and V. L. Wright. 1997. Effectiveness of four
industry-developed bycatch reduction devices in Louisiana's inshore waters. Fisheries
Bulletin 95, 5 5 2 -5 6 5 .
Rulifson, R.A., J. D. Murray, and J. J. Bahen. 1992. Finfish catch reduction in South Atlantic
shrimp trawls using three designs of by-catch reduction devices. Fisheries 17, 9 -19 .
SAFMC. 1996. Final amendment 2 (bycatch reduction) to the fishery management plan for
the shrimp fishery of the south Atlantic region. South Atlantic Fishery Management Council
1, Southpark Circle Charleston, South Carolina 29407-4699.
Saila, S.B. 1983. Importance and assessment of discards in commercial fisheries. FAO
Fisheries Circular No. 765, 62 pp.
Schick, D.F. 1992. Fishing with traps for pandalid shrimp/bycatch reduction with large mesh
panels. In: International Conference on Shrimp Bycatch. Editor: Jones, R.P. May, 1992, Lake
Buena Vista, Florida. Southeastern Fisheries Association, Tallahassee, FL, pp. 245-278 .
143

Schirripa, M. J., C. P. Goodyear, and R. D. Methot. 2009. Testing different methods of
incorporating climate data into the assessment of U.S. West Coast sablefish. ICES Journal of
Marine Science: Journal du Conseil 66(7):1605-1613.
Scott-Denton, E., P. F. Cryer, M . R. Duffy, J. P. Gocke, M. R. Harrelson, D. L. Kinsella, J. M.
Nance, J. R. Pulver, R. C. Smith, and J. A. Williams. 2012. Characterization of the U.S. Gulf of
Mexico and South Atlantic penaeid and rock shrimp fisheries based on observer data. Marine
Fisheries Review 74(4): 1-26.
Southeast Data, Assessment and Review (SEDAR). 2011. September 2011 SEDAR 21 Stock
assessment report HMS Gulf of Mexico Blacknose Shark. SEDAR, 4055 Faber Place Drive,
Suite 201, North Charleston, SC 29405.
Seidel, W.R. 1969. Design, construction and field testing of the BCF electric shrimp trawl
system. Fish. Ind. Res. 4, 2 1 3 - 231.
Seidel, W.R. and Watson, J.W. 1978. A trawl design employing electricity to selectively
capture shrimp. Mar. Fish. Rev. 40, 2 1 - 23.
Shepherd T.D. and R. A. Myers. 2005. Direct and indirect fishery effects on small coastal
elasmobranches in the northern Gulf of Mexico. Ecology Letters 8, 1095-1104.
Simpfendorfer C,. A., and G. H. Burgess. 2002. Assessment of the status of the Atlantic
sharpnose shark (Rhizoprionodon terraenovoe) using an age-structured population model.
Northwest Atlantic Fisheries Organization SCR Doc. 02/116.
Stevens J.D., R. Bonfil, N. K. Dulvy, and P. A. Walker. 2000. The effects of fishing on sharks,
rays, and chimaeras (chondrichthyans), and the implications for marine ecosystems. ICES
Journal of Marine Science 55(Suppl. 4), 476-494 .
Stobutzki, I.C., M. J. Miller, and D. T. Brewer. 2001. Sustainability of fishery bycatch: a
process for assessing highly diverse and numerous bycatch. Environmental Conservation 28,
167-181.
Stobutzki I.C., M. J. Miller, D. S. Heales, and D. T. Brewer. 2002. Sustainability of
elasmobranchs caught as bycatch in a tropical prawn (shrimp) fishery. Fishery Bulletin 100,
800-821 .
Thorsteinsson, G. 1992. The use of square mesh codends in the Icelandic shrimp (Pandolus
borealis) fishery. Fisheries Research 13, 2 5 5 -2 6 6 .
Tucker, A.D., J. B. Robbins, and D. P. McPhee. 1997. Adopting turtle excluder devices in
Australia and the United States: W hat are the differences in technology transfer, promotion
and acceptance?. Coastal Management 25, 405-421.
144

Valdemarsen, J.W. 1986. Radial escape section (RES) as a sorting device in a shrimp trawl.
Presented at FAO Expert Consultation on Selective Shrimp Trawl Development.
Van Voorhees, D., and A. Lowther. 2011. Fisheries of the United States 2010. Silver Spring.
MD : U.S. Department of Commerce.
Vendeville, P. 1990. Tropical shrimp fisheries: types of fishing gear used and their selectivity.
FAO Fisheries Technical Paper 261 (Rev. 1). Rome, FAO.
Wallace, R.K. and C. L. Robinson. 1994. Bycatch and bycatch reduction in recreational
shrimping. Northeast Gulf Science 1 3 ,1 3 9 -1 4 4 .
Warner, D. A., A. L. McMillen-Jackson, T. M. Bert, and C. R. Crawford. 2004. The Efficiency of
a Bycatch Reduction Device Used in Skimmer Trawls in the Florida Shrimp Fishery. North
American Journal of Fisheries Management, 24(3), 853-864 .
Watson, J.W. 1989. Fish behavior and trawl design: Potential for selective trawl
development. In: Campbell, C.M., Proceedings of the World Symposium on Fishing Gear and
Fishing Vessels. Marine Institute, St Johns, NF, Canada, pp. 25-29 .
Watson, J.W. 1996. Summary report on the status of bycatch reduction devices
development. NOAA, MS Lab. P.O. Drawer 1207, Pascagoula, MS 39567.
Watson, J., D. Foster, S. Nichols, A. Shah, E. Scolloenlon, and J. Nance. 1999. The
development of bycatch reduction technology in the southeastern United States shrimp
fishery. Marine Technology Society Journal, 33(2), 51-56 .
Watson, J.W., D. W . Kerstetter. 2006. Pelagic longline fishing gear: a brief history and review
of research efforts to improve selectivity. Marine Technology Society Journal 40(Fall):6—10.
Watson, J. W ., J. F. Mitchell, A. K. Shah. 1986. Trawling efficiency device : a new concept for
selective shrimp trawling gear. Marine Fisheries Review 48(1) :l-9 .
Watson J. W., and W. R. Seidel. 1980. Evaluation of techniques to decrease sea turtle
mortalities in the southeastern United States shrimp fishery. International Counsel for the
Exploration of the Seas Fish Capture Committee CM 1 98 0 /B 3 1 ,1-8.
Watson, J.W., and C. W. Taylor. 1986. General contribution on research on selective shrimp
trawl designs for penaeid shrimps in the United States. Presented at FAO Expert Consultation
on Selective Shrimp Trawl Development, Mazatlan, Mexico, 24 -28 November 1986.
Watson, J.W., and C. W. Taylor. 1990. Research on selective shrimp trawl designs for penaeid
shrimp in the United States. In: Proceedings of the Fisheries Conservation Engineering
Workshop. Editors: DeAlteris, J.T. and Grady, M. Narragansett, Rhode Island, April 4 -5 , 1990.
Rhode Island Sea Grant, pp. 50-59 .
145

Watson, J.W. and C. W. Taylor. 1996. Technical specifications and minimum requirements for
the extended funnel, expanded mesh and fisheye BRDs. NOAA, MS Lab. P.O. Drawer 1207,
Pascagoula, MS 39567.
Watson, J., I. Workman, D. Foster, C. Taylor, A. Shah, J. Barbour, and D. Hataway. 1993.
Status report on the potential of gear modifications to reduce finfish bycatch in shrimp
trawls in the southeastern United States, 1990-1992. NOAA Tech. Mem o. NMFS-SEFSC-327.
NMFS, SEFSC, Mississippi Laboratories, Pascagoula, Miss.
Wardle, C.S. 1983. Fish reactions to towed fishing gears. In:, Experimental Biology at Sea.
Editors: Mac- Donald, A. and Priede, I.G. Academic Press, New York, pp. 167-195.
Wells, R. J. D., J. H. Cowman Jr., W. F. Patterson. III., and C. J. Walters. 2008. Effect of
trawling on juvenile red snapper (Lutjanus campechanus) habitat selection and life history
parameters. Canadian Journal of Fisheries and Aquatic Science 65: 2399-2411 (2008).
Wileman, D.A., R. S. T. Ferro, R. Fonteyne, and R. B. Millar. 1996. Manuel of Methods of
Measuring the Selectivity of Towed Fishing Gears. International Council for the Exploitation
of the Sea.
Woodward, R. T.,W.L. Griffin and Y. Wui. 2003. An Integrated Economic Analysis of
Alternative Bycatch, Commercial, and Recreational Policies for the Recovery of Gulf of
Mexico Red Snapper. Department of Agricultural Economics, Texas A&M University, College
Station, TX. Marfin Project #NA87FF0420, 2003.
Workman, I.K. 1999. Fate of juvenile red snapper, Lutjanus campechanus, that escape from
shrimp trawls. Final Report on the Red Snapper/Shrimp Research Program Summer 1998
Project. NMFS, SEFSC, Pascagoula Laboratory, Pascagoula, MS.
Zhou, Y., So, R.M.C., Liu, M.H., Zhang, H.J., 2000. Complex turbulent wakes generated by two
and three side-by-side cylinders. International Journal of Heat and Fluid Flow 2 1 ,1 25 -13 3 .
Ye, Y., A. H. Alsaffar, and H. M. A. Mohammed. 2000. Bycatch and discards of the Kuwait
shrimp fishery. Fisheries Research 45, 9 -1 9 .
146