Embed Size (px)
Citation preview

364 VOLUME 46 | NUMBER 4 | APRIL 2014 Nature GeNetics
TheidentificationofactivatingNOTCH1mutationsinTcellacutelymphoblasticleukemia(T-ALL)ledtoclinicaltestingofg-secretaseinhibitors(GSIs)thatpreventNOTCH1activation1–4.However,responsestotheseinhibitorshavebeentransient5,suggestingthatresistancelimitstheirclinicalefficacy.HerewemodeledT-ALLresistance,identifyingGSI-tolerant‘persister’cellsthatexpandintheabsenceofNOTCH1signaling.RarepersistersarealreadypresentinnaiveT-ALLpopulations,andthereversibilityoftheirphenotypesuggestsanepigeneticmechanism.RelativetoGSI-sensitivecells,persistercellsactivatedistinctsignalingandtranscriptionalprogramsandexhibitchromatincompaction.Aknockdownscreenidentifiedchromatinregulatorsessentialforpersisterviability,includingBRD4.BRD4bindsenhancersnearcriticalT-ALLgenes,includingMYCandBCL2.TheBRD4inhibitorJQ1downregulatesexpressionofthesetargetsandinducesgrowtharrestandapoptosisinpersistercells,atdoseswelltoleratedbyGSI-sensitivecells.Consistently,theGSI-JQ1combinationwasfoundtobeeffectiveagainstprimaryhumanleukemiasin vivo.Ourfindingsestablisharoleforepigeneticheterogeneityinleukemiaresistancethatmaybeaddressedbyincorporatingepigeneticmodulatorsincombinationtherapy.
T-ALL is an aggressive malignancy frequently associated with activat-ing mutations in NOTCH1, a critical oncogene in this disease1. GSIs that prevent NOTCH1 cleavage and activation have been tested in clinical trials and mouse models, but responses have been modest and
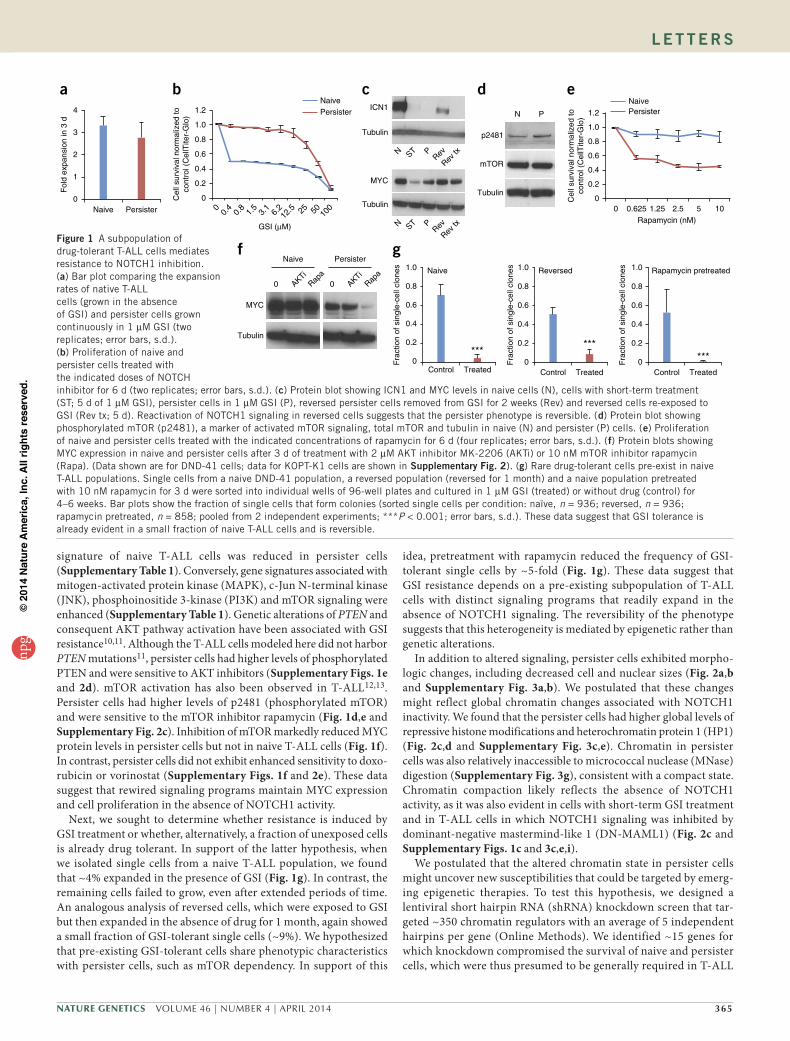
transient5. To understand the mechanisms by which T-ALL cells over-come NOTCH1 inhibition, we modeled GSI resistance in vitro and in vivo and investigated the functional and molecular characteris-tics of resistant cells. By chronically exposing NOTCH1-dependent human T-ALL cells to a GSI (compound E) in vitro, we isolated a population of persister cells that tolerated GSI concentrations more than 50-fold higher than the concentrations tolerated by naive cells (Fig. 1a,b and Supplementary Figs. 1a and 2a).
To characterize these drug-tolerant cells, we first examined the active intracellular form of NOTCH1 (ICN1)6. ICN1 was present at high levels in naive T-ALL cells but was essentially undetect-able in persister cells (Fig. 1c, top and Supplementary Fig. 2b, top). Expression of NOTCH1 target genes, including DTX1 and HES4, was also downregulated in persister cells (Supplementary Figs. 1b,c and 3i). The phenotype was reversible, as persister cells rapidly re-expressed ICN1 and NOTCH1 target genes after removal of the GSI (Fig. 1c and Supplementary Figs. 1b,d and 2b). Re-exposure of these ‘reversed’ cells to GSI led to downregulation of the expression of NOTCH1 target genes and growth arrest, as in the original naive T-ALL population (Supplementary Fig. 1b). This reversibility sug-gests that the resistance phenotype is mediated epigenetically.
Induction of MYC is thought to be a major mechanism whereby constitutive NOTCH1 activation results in leukemic T cell transfor-mation7–9. Although MYC protein levels were dramatically reduced by short-term GSI treatment, moderate levels were maintained in the persister cells, despite continued GSI treatment (Fig. 1c and Supplementary Fig. 2b). Consistently, the strong MYC transcriptional
An epigenetic mechanism of resistance to targeted therapy in T cell acute lymphoblastic leukemiaBirgit Knoechel1–4,16, Justine E Roderick5,16, Kaylyn E Williamson1,2,6,7, Jiang Zhu1,2,6,7, Jens G Lohr2,8, Matthew J Cotton1,2,6,7, Shawn M Gillespie1,2,6,7, Daniel Fernandez2,9, Manching Ku1,2,6, Hongfang Wang10, Federica Piccioni2, Serena J Silver2, Mohit Jain2,11,12, Daniel Pearson4,13, Michael J Kluk10, Christopher J Ott8, Leonard D Shultz14, Michael A Brehm15, Dale L Greiner15, Alejandro Gutierrez3,4, Kimberly Stegmaier3,4, Andrew L Kung3,4, David E Root2, James E Bradner2,8, Jon C Aster10, Michelle A Kelliher5 & Bradley E Bernstein1,2,6,7
1Department of Pathology, Massachusetts General Hospital and Harvard Medical School, Boston, Massachusetts, USA. 2Broad Institute of MIT and Harvard, Cambridge, Massachusetts, USA. 3Department of Pediatric Oncology, Dana-Farber Cancer Institute, Boston, Massachusetts, USA. 4Division of Hematology/Oncology, Boston Children’s Hospital and Harvard Medical School, Boston, Massachusetts, USA. 5Department of Cancer Biology, University of Massachusetts Medical School, Worcester, Massachusetts, USA. 6Center for Cancer Research, Massachusetts General Hospital, Boston, Massachusetts, USA. 7Howard Hughes Medical Institute, Chevy Chase, Maryland, USA. 8Department of Medical Oncology, Dana-Farber Cancer Institute, Boston, Massachusetts, USA. 9Biostatistics Graduate Program, Harvard University, Cambridge, Massachusetts, USA. 10Department of Pathology, Brigham and Women’s Hospital and Harvard Medical School, Boston, Massachusetts, USA. 11Center for Human Genetic Research, Massachusetts General Hospital, Boston, Massachusetts, USA. 12Department of Molecular Biology, Massachusetts General Hospital, Boston, Massachusetts, USA. 13Biological and Biomedical Sciences Graduate Program, Harvard Medical School, Boston, Massachusetts, USA. 14Jackson Laboratory, Bar Harbor, Maine, USA. 15Program in Molecular Medicine, University of Massachusetts Medical School, Worcester, Massachusetts, USA. 16These authors contributed equally to this work. Correspondence should be addressed to B.E.B. ([email protected]) or M.A.K. ([email protected]).
Received 12 August 2013; accepted 6 February 2014; published online 2 March 2014; doi:10.1038/ng.2913
l e t t e r snp
g©
2014
Nat
ure
Am
eric
a, In
c. A
ll rig
hts
rese
rved
.
Nature GeNetics VOLUME 46 | NUMBER 4 | APRIL 2014 365
signature of naive T-ALL cells was reduced in persister cells (Supplementary Table 1). Conversely, gene signatures associated with mitogen-activated protein kinase (MAPK), c-Jun N-terminal kinase (JNK), phosphoinositide 3-kinase (PI3K) and mTOR signaling were enhanced (Supplementary Table 1). Genetic alterations of PTEN and consequent AKT pathway activation have been associated with GSI resistance10,11. Although the T-ALL cells modeled here did not harbor PTEN mutations11, persister cells had higher levels of phosphorylated PTEN and were sensitive to AKT inhibitors (Supplementary Figs. 1e and 2d). mTOR activation has also been observed in T-ALL12,13. Persister cells had higher levels of p2481 (phosphorylated mTOR) and were sensitive to the mTOR inhibitor rapamycin (Fig. 1d,e and Supplementary Fig. 2c). Inhibition of mTOR markedly reduced MYC protein levels in persister cells but not in naive T-ALL cells (Fig. 1f). In contrast, persister cells did not exhibit enhanced sensitivity to doxo-rubicin or vorinostat (Supplementary Figs. 1f and 2e). These data suggest that rewired signaling programs maintain MYC expression and cell proliferation in the absence of NOTCH1 activity.
Next, we sought to determine whether resistance is induced by GSI treatment or whether, alternatively, a fraction of unexposed cells is already drug tolerant. In support of the latter hypothesis, when we isolated single cells from a naive T-ALL population, we found that ~4% expanded in the presence of GSI (Fig. 1g). In contrast, the remaining cells failed to grow, even after extended periods of time. An analogous analysis of reversed cells, which were exposed to GSI but then expanded in the absence of drug for 1 month, again showed a small fraction of GSI-tolerant single cells (~9%). We hypothesized that pre-existing GSI-tolerant cells share phenotypic characteristics with persister cells, such as mTOR dependency. In support of this
idea, pretreatment with rapamycin reduced the frequency of GSI-tolerant single cells by ~5-fold (Fig. 1g). These data suggest that GSI resistance depends on a pre-existing subpopulation of T-ALL cells with distinct signaling programs that readily expand in the absence of NOTCH1 signaling. The reversibility of the phenotype suggests that this heterogeneity is mediated by epigenetic rather than genetic alterations.
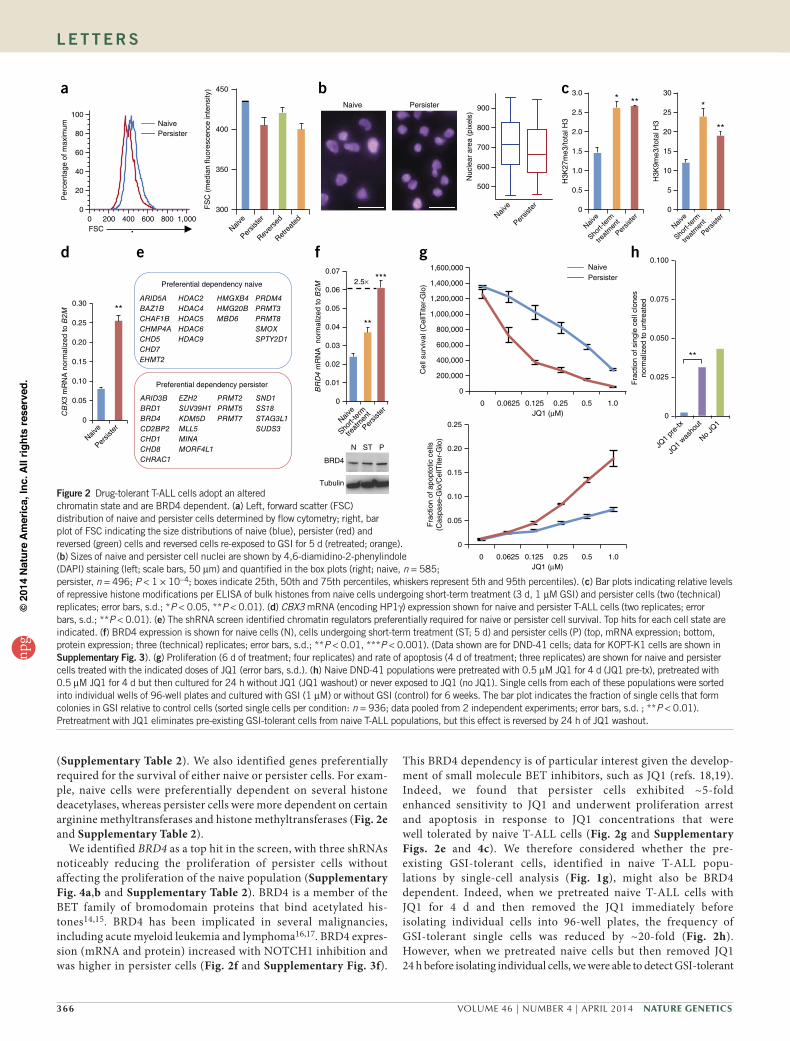
In addition to altered signaling, persister cells exhibited morpho-logic changes, including decreased cell and nuclear sizes (Fig. 2a,b and Supplementary Fig. 3a,b). We postulated that these changes might reflect global chromatin changes associated with NOTCH1 inactivity. We found that the persister cells had higher global levels of repressive histone modifications and heterochromatin protein 1 (HP1) (Fig. 2c,d and Supplementary Fig. 3c,e). Chromatin in persister cells was also relatively inaccessible to micrococcal nuclease (MNase) digestion (Supplementary Fig. 3g), consistent with a compact state. Chromatin compaction likely reflects the absence of NOTCH1 activity, as it was also evident in cells with short-term GSI treatment and in T-ALL cells in which NOTCH1 signaling was inhibited by dominant-negative mastermind-like 1 (DN-MAML1) (Fig. 2c and Supplementary Figs. 1c and 3c,e,i).
We postulated that the altered chromatin state in persister cells might uncover new susceptibilities that could be targeted by emerg-ing epigenetic therapies. To test this hypothesis, we designed a lentiviral short hairpin RNA (shRNA) knockdown screen that tar-geted ~350 chromatin regulators with an average of 5 independent hairpins per gene (Online Methods). We identified ~15 genes for which knockdown compromised the survival of naive and persister cells, which were thus presumed to be generally required in T-ALL
a
0
1
2
3
4
Naive Persister
Fol
d ex
pans
ion
in 3
d
e
Cel
l sur
viva
l nor
mal
ized
toco
ntro
l (C
ellT
iter-
Glo
)
Rapamycin (nM)
0
0.2
0.4
0.6
0.8
1.0
1.2
0 0.625 1.25 2.5 5 10
NaivePersister
g
Fra
ctio
n of
sin
gle-
cell
clon
es Naive
0
0.2
0.4
0.6
0.8
1.0
Control Treated
***
Fra
ctio
n of
sin
gle-
cell
clon
es Reversed
0
0.2
0.4
0.6
0.8
1.0
Control Treated
***
Fra
ctio
n of
sin
gle-
cell
clon
es Rapamycin pretreated
0
0.2
0.4
0.6
0.8
1.0
Control Treated
***
d
Tubulin
N P
p2481
mTOR
f
MYC
Naive
0 AKTiRap
a
Tubulin
Persister
0 AKTiRap
a
Cel
l sur
viva
l nor
mal
ized
toco
ntro
l (C
ellT
iter-
Glo
)
00.
40.
81.
53.
16.
212
.5 25 50 100
0
0.2
0.4
0.6
0.8
1.0
1.2Naive Persister
b
GSI (µM)
cICN1
Tubulin
Tubulin
MYC
STN PRev
Rev tx
STN PRev
Rev tx
Figure 1 A subpopulation of drug-tolerant T-ALL cells mediates resistance to NOTCH1 inhibition. (a) Bar plot comparing the expansion rates of native T-ALL cells (grown in the absence of GSI) and persister cells grown continuously in 1 µM GSI (two replicates; error bars, s.d.). (b) Proliferation of naive and persister cells treated with the indicated doses of NOTCH inhibitor for 6 d (two replicates; error bars, s.d.). (c) Protein blot showing ICN1 and MYC levels in naive cells (N), cells with short-term treatment (ST; 5 d of 1 µM GSI), persister cells in 1 µM GSI (P), reversed persister cells removed from GSI for 2 weeks (Rev) and reversed cells re-exposed to GSI (Rev tx; 5 d). Reactivation of NOTCH1 signaling in reversed cells suggests that the persister phenotype is reversible. (d) Protein blot showing phosphorylated mTOR (p2481), a marker of activated mTOR signaling, total mTOR and tubulin in naive (N) and persister (P) cells. (e) Proliferation of naive and persister cells treated with the indicated concentrations of rapamycin for 6 d (four replicates; error bars, s.d.). (f) Protein blots showing MYC expression in naive and persister cells after 3 d of treatment with 2 µM AKT inhibitor MK-2206 (AKTi) or 10 nM mTOR inhibitor rapamycin (Rapa). (Data shown are for DND-41 cells; data for KOPT-K1 cells are shown in supplementary Fig. 2). (g) Rare drug-tolerant cells pre-exist in naive T-ALL populations. Single cells from a naive DND-41 population, a reversed population (reversed for 1 month) and a naive population pretreated with 10 nM rapamycin for 3 d were sorted into individual wells of 96-well plates and cultured in 1 µM GSI (treated) or without drug (control) for 4–6 weeks. Bar plots show the fraction of single cells that form colonies (sorted single cells per condition: naïve, n = 936; reversed, n = 936; rapamycin pretreated, n = 858; pooled from 2 independent experiments; ***P < 0.001; error bars, s.d.). These data suggest that GSI tolerance is already evident in a small fraction of naive T-ALL cells and is reversible.
l e t t e r snp
g©
2014
Nat
ure
Am
eric
a, In
c. A
ll rig
hts
rese
rved
.
366 VOLUME 46 | NUMBER 4 | APRIL 2014 Nature GeNetics
l e t t e r s
(Supplementary Table 2). We also identified genes preferentially required for the survival of either naive or persister cells. For exam-ple, naive cells were preferentially dependent on several histone deacetylases, whereas persister cells were more dependent on certain arginine methyltransferases and histone methyltransferases (Fig. 2e and Supplementary Table 2).
We identified BRD4 as a top hit in the screen, with three shRNAs noticeably reducing the proliferation of persister cells without affecting the proliferation of the naive population (Supplementary Fig. 4a,b and Supplementary Table 2). BRD4 is a member of the BET family of bromodomain proteins that bind acetylated his-tones14,15. BRD4 has been implicated in several malignancies, including acute myeloid leukemia and lymphoma16,17. BRD4 expres-sion (mRNA and protein) increased with NOTCH1 inhibition and was higher in persister cells (Fig. 2f and Supplementary Fig. 3f).
This BRD4 dependency is of particular interest given the develop-ment of small molecule BET inhibitors, such as JQ1 (refs. 18,19). Indeed, we found that persister cells exhibited ~5-fold enhanced sensitivity to JQ1 and underwent proliferation arrest and apoptosis in response to JQ1 concentrations that were well tolerated by naive T-ALL cells (Fig. 2g and Supplementary Figs. 2e and 4c). We therefore considered whether the pre-existing GSI-tolerant cells, identified in naive T-ALL popu-lations by single-cell analysis (Fig. 1g), might also be BRD4 dependent. Indeed, when we pretreated naive T-ALL cells with JQ1 for 4 d and then removed the JQ1 immediately before isolating individual cells into 96-well plates, the frequency of GSI-tolerant single cells was reduced by ~20-fold (Fig. 2h). However, when we pretreated naive cells but then removed JQ1 24 h before isolating individual cells, we were able to detect GSI-tolerant
e
PRMT2PRMT5PRMT7
SND1SS18STAG3L1SUDS3
EZH2SUV39H1KDM5DMLL5MINAMORF4L1
ARID3BBRD1BRD4CD2BP2CHD1CHD8CHRAC1
Preferential dependency persister
HMGXB4HMG20BMBD6
HDAC2HDAC4HDAC5HDAC6HDAC9
PRDM4PRMT3PRMT8SMOXSPTY2D1
ARID5ABAZ1BCHAF1BCHMP4ACHD5CHD7EHMT2
Preferential dependency naive
d
0
0.05
0.10
0.15
0.20
0.25
0.30
Naive
Persis
ter
CB
X3
mR
NA
nor
mal
ized
to B
2M
**
500
600
700
800
900
Nuc
lear
are
a (p
ixel
s)
Naive
Persis
terF
SC
(m
edia
n �u
ores
cenc
e in
tens
ity)
300
Naive
Retre
ated
Rever
sed
Persis
ter
350
400
450
0
0.05
0.10
0.15
0.20
0.25
0 0.0625 0.125 0.25 0.5 1.0
Fra
ctio
n of
apo
ptot
ic c
ells
(Cas
pase
-Glo
/Cel
lTite
r-G
lo)
JQ1 (µM)
0
200,000
400,000
600,000
800,000
1,000,000
1,200,000
1,400,000
1,600,000
0 0.0625 0.125 0.25 0.5 1.0
Cel
l sur
viva
l (C
ellT
iter-
Glo
)JQ1 (µM)
NaivePersister
g h
Fra
ctio
n of
sin
gle
cell
clon
esno
rmal
ized
to u
ntre
ated
0
0.025
0.050
0.075
0.100
JQ1
pre-
tx
JQ1
washo
ut
No JQ
1
**
bNaive Persister
a
0 200 400 600 800 1,0000
20
40
60
80
100
Per
cent
age
of m
axim
um
FSC
NaivePersister
Naive
Short-
term
treat
men
t
Persis
ter
0
5
10
15
20
25
30
H3K
9me3
/tota
l H3
*
**
c
0
0.5
1.0
1.5
2.0
2.5
3.0
Naive
Short-
term
treat
men
t
Persis
ter
H3K
27m
e3/to
tal H
3
* **
f
0
0.01
0.02
0.03
0.04
0.05
0.06
0.07
Naive
Short-
term
treat
men
t
Persis
ter
BR
D4
mR
NA
nor
mal
ized
to B
2M**
***2.5×
BRD4
Tubulin
N ST P
Figure 2 Drug-tolerant T-ALL cells adopt an altered chromatin state and are BRD4 dependent. (a) Left, forward scatter (FSC) distribution of naive and persister cells determined by flow cytometry; right, bar plot of FSC indicating the size distributions of naive (blue), persister (red) and reversed (green) cells and reversed cells re-exposed to GSI for 5 d (retreated; orange). (b) Sizes of naive and persister cell nuclei are shown by 4,6-diamidino-2-phenylindole (DAPI) staining (left; scale bars, 50 µm) and quantified in the box plots (right; naive, n = 585; persister, n = 496; P < 1 × 10⁻⁴; boxes indicate 25th, 50th and 75th percentiles, whiskers represent 5th and 95th percentiles). (c) Bar plots indicating relative levels of repressive histone modifications per ELISA of bulk histones from naive cells undergoing short-term treatment (3 d, 1 µM GSI) and persister cells (two (technical) replicates; error bars, s.d.; *P < 0.05, **P < 0.01). (d) CBX3 mRNA (encoding HP1γ) expression shown for naive and persister T-ALL cells (two replicates; error bars, s.d.; **P < 0.01). (e) The shRNA screen identified chromatin regulators preferentially required for naive or persister cell survival. Top hits for each cell state are indicated. (f) BRD4 expression is shown for naive cells (N), cells undergoing short-term treatment (ST; 5 d) and persister cells (P) (top, mRNA expression; bottom, protein expression; three (technical) replicates; error bars, s.d.; **P < 0.01, ***P < 0.001). (Data shown are for DND-41 cells; data for KOPT-K1 cells are shown in supplementary Fig. 3). (g) Proliferation (6 d of treatment; four replicates) and rate of apoptosis (4 d of treatment; three replicates) are shown for naive and persister cells treated with the indicated doses of JQ1 (error bars, s.d.). (h) Naive DND-41 populations were pretreated with 0.5 µM JQ1 for 4 d (JQ1 pre-tx), pretreated with 0.5 µM JQ1 for 4 d but then cultured for 24 h without JQ1 (JQ1 washout) or never exposed to JQ1 (no JQ1). Single cells from each of these populations were sorted into individual wells of 96-well plates and cultured with GSI (1 µM) or without GSI (control) for 6 weeks. The bar plot indicates the fraction of single cells that form colonies in GSI relative to control cells (sorted single cells per condition: n = 936; data pooled from 2 independent experiments; error bars, s.d. ; **P < 0.01). Pretreatment with JQ1 eliminates pre-existing GSI-tolerant cells from naive T-ALL populations, but this effect is reversed by 24 h of JQ1 washout.
npg
© 2
014
Nat
ure
Am
eric
a, In
c. A
ll rig
hts
rese
rved
.
Nature GeNetics VOLUME 46 | NUMBER 4 | APRIL 2014 367
l e t t e r s
clones in a proportion similar to that found in control naive T-ALL cells. Thus, pre-existing GSI-tolerant cells in naive T-ALL popula-tions are highly BRD4 dependent, like persister cells, and exist in dynamic equilibrium with the more prevalent GSI-sensitive cells.
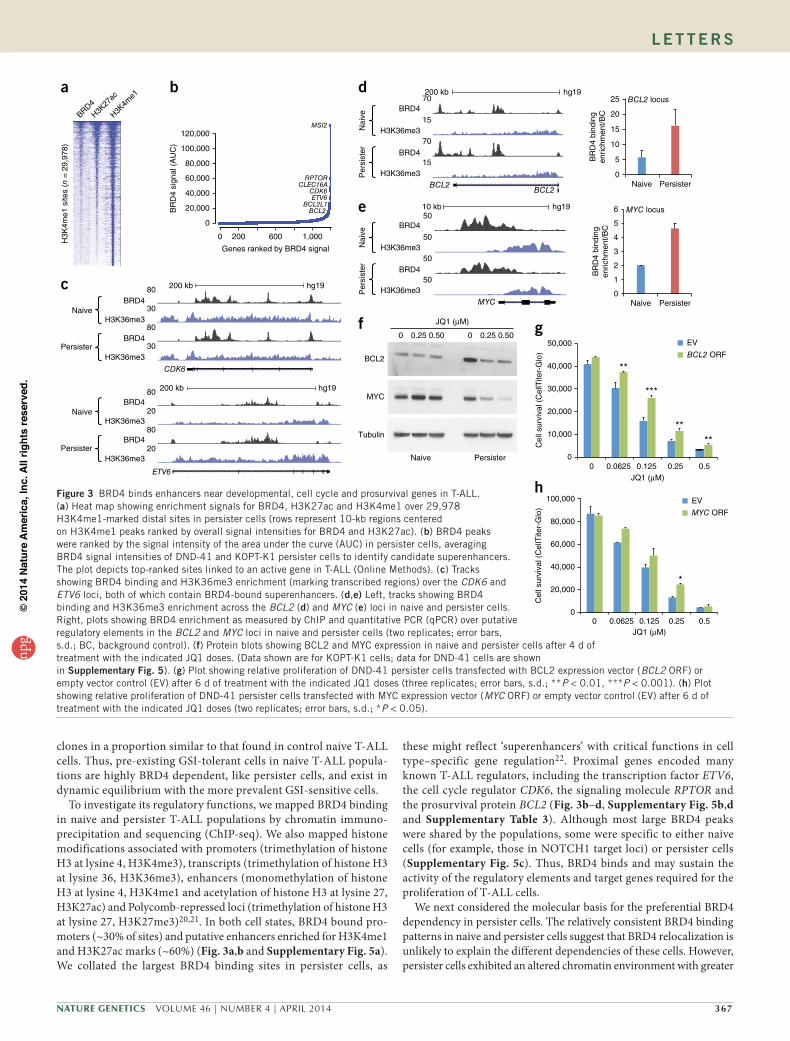
To investigate its regulatory functions, we mapped BRD4 binding in naive and persister T-ALL populations by chromatin immuno-precipitation and sequencing (ChIP-seq). We also mapped histone modifications associated with promoters (trimethylation of histone H3 at lysine 4, H3K4me3), transcripts (trimethylation of histone H3 at lysine 36, H3K36me3), enhancers (monomethylation of histone H3 at lysine 4, H3K4me1 and acetylation of histone H3 at lysine 27, H3K27ac) and Polycomb-repressed loci (trimethylation of histone H3 at lysine 27, H3K27me3)20,21. In both cell states, BRD4 bound pro-moters (~30% of sites) and putative enhancers enriched for H3K4me1 and H3K27ac marks (~60%) (Fig. 3a,b and Supplementary Fig. 5a). We collated the largest BRD4 binding sites in persister cells, as
these might reflect ‘superenhancers’ with critical functions in cell type–specific gene regulation22. Proximal genes encoded many known T-ALL regulators, including the transcription factor ETV6, the cell cycle regulator CDK6, the signaling molecule RPTOR and the prosurvival protein BCL2 (Fig. 3b–d, Supplementary Fig. 5b,d and Supplementary Table 3). Although most large BRD4 peaks were shared by the populations, some were specific to either naive cells (for example, those in NOTCH1 target loci) or persister cells (Supplementary Fig. 5c). Thus, BRD4 binds and may sustain the activity of the regulatory elements and target genes required for the proliferation of T-ALL cells.
We next considered the molecular basis for the preferential BRD4 dependency in persister cells. The relatively consistent BRD4 binding patterns in naive and persister cells suggest that BRD4 relocalization is unlikely to explain the different dependencies of these cells. However, persister cells exhibited an altered chromatin environment with greater
0
5
10
15
20
25
Naive Persister
BR
D4
bind
ing
enric
hmen
t/BC
BCL2 locus
0
1
2
3
4
5
6
Naive Persister
BR
D4
bind
ing
enric
hmen
t/BC
MYC locus
b
0 200 600 1,000
0
20,000
40,000
60,000
80,000
100,000
120,000
BR
D4
sign
al (
AU
C)
Genes ranked by BRD4 signal
MSI2
RPTORCLEC16A
CDK6ETV6
BCL2BCL2L1
g
JQ1 (µM)
0
Cel
l sur
viva
l (C
ellT
iter-
Glo
)
EV
BCL2 ORF
10,000
20,000
30,000
40,000
50,000
0 0.0625 0.125 0.25 0.5
****
***
**
d
Nai
veP
ersi
ster
BRD4
BRD4
H3K36me3
H3K36me3
200 kb hg19
BCL2BCL2
70
70
15
15
e
Nai
veP
ersi
ster
BRD4
BRD4
H3K36me3
H3K36me3
10 kb hg19
MYC
50
50
50
50c 200 kb hg19
CDK6
80
80
30
30
Naive
Persister
BRD4
BRD4
H3K36me3
H3K36me3
200 kb hg19
ETV6
80
80
20
20
Naive
Persister
BRD4
BRD4
H3K36me3
H3K36me3
JQ1 (µM)
Cel
l sur
viva
l (C
ellT
iter-
Glo
)
EV
MYC ORF
0
20,000
40,000
60,000
80,000
100,000
0 0.0625 0.125 0.25 0.5
*
h
f
Naive Persister
0 0.25 0.50
JQ1 (µM)
Tubulin
MYC
BCL2
0 0.25 0.50
a
BRD4
H3K27
ac
H3K4m
e1
H3K
4me1
site
s (n
= 2
9,97
8)
Figure 3 BRD4 binds enhancers near developmental, cell cycle and prosurvival genes in T-ALL. (a) Heat map showing enrichment signals for BRD4, H3K27ac and H3K4me1 over 29,978 H3K4me1-marked distal sites in persister cells (rows represent 10-kb regions centered on H3K4me1 peaks ranked by overall signal intensities for BRD4 and H3K27ac). (b) BRD4 peaks were ranked by the signal intensity of the area under the curve (AUC) in persister cells, averaging BRD4 signal intensities of DND-41 and KOPT-K1 persister cells to identify candidate superenhancers. The plot depicts top-ranked sites linked to an active gene in T-ALL (Online Methods). (c) Tracks showing BRD4 binding and H3K36me3 enrichment (marking transcribed regions) over the CDK6 and ETV6 loci, both of which contain BRD4-bound superenhancers. (d,e) Left, tracks showing BRD4 binding and H3K36me3 enrichment across the BCL2 (d) and MYC (e) loci in naive and persister cells. Right, plots showing BRD4 enrichment as measured by ChIP and quantitative PCR (qPCR) over putative regulatory elements in the BCL2 and MYC loci in naive and persister cells (two replicates; error bars, s.d.; BC, background control). (f) Protein blots showing BCL2 and MYC expression in naive and persister cells after 4 d of treatment with the indicated JQ1 doses. (Data shown are for KOPT-K1 cells; data for DND-41 cells are shown in supplementary Fig. 5). (g) Plot showing relative proliferation of DND-41 persister cells transfected with BCL2 expression vector (BCL2 ORF) or empty vector control (EV) after 6 d of treatment with the indicated JQ1 doses (three replicates; error bars, s.d.; **P < 0.01, ***P < 0.001). (h) Plot showing relative proliferation of DND-41 persister cells transfected with MYC expression vector (MYC ORF) or empty vector control (EV) after 6 d of treatment with the indicated JQ1 doses (two replicates; error bars, s.d.; *P < 0.05).
npg
© 2
014
Nat
ure
Am
eric
a, In
c. A
ll rig
hts
rese
rved
.

368 VOLUME 46 | NUMBER 4 | APRIL 2014 Nature GeNetics
l e t t e r s
compaction, higher levels of repressive histone modifications and lower levels of the enhancer-associated H3K27ac mark (Fig. 2c and Supplementary Fig. 3c–e,g). Consistently, ChIP-seq data showed that persister cells had modestly higher levels of repressive histone modifica-
tions in potential regulatory regions (Supplementary Fig. 3h). BRD4 is believed to have an important role as a ‘bookmark’ of active regulatory elements, maintaining their chromatin state as cells progress through mitosis15,23. Thus, we suggest that generalized chromatin repression in
a b
d
c
f
Cel
l sur
viva
l (C
ellT
iter-
Glo
)
T-ALL-x-9
0
10,000
20,000
30,000
40,000
50,000
60,000
70,000
80,000
90,000
100,000
0 GSI JQ1 GSI +JQ1
**
****
Cel
l sur
viva
l (C
ellT
iter-
Glo
)
T-ALL-x-11
0
20,000
40,000
60,000
80,000
100,000
120,000
140,000
Veh GSI JQ1 GSI +JQ1
***
**
Cel
l sur
viva
l (C
ellT
iter-
Glo
)
T-ALL-x-14
0
1,000
2,000
3,000
4,000
5,000
6,000
7,000
8,000
9,000
0 GSI JQ1 GSI +JQ1
**
0
0.005
0.010
0.015
0.020
0.025
V LT
DTX
1 m
RN
A e
xpre
ssio
n no
rmal
ized
to B
2M
HE
S4
mR
NA
exp
ress
ion
norm
aliz
ed to
B2M
0
0.0005
0.0010
0.0015
0.0020
0.0025
V LT
***
BC
L2 (
mea
n flu
ores
cenc
e in
tens
ity)
0
1,000
2,000
3,000
4,000
5,000
6,000
V LT
*
CB
X3
mR
NA
epx
ress
ion
norm
aliz
ed to
B2M
0
0.01
0.02
0.03
0.04
0.05
0.06
0.07
0.08
0.09
V LT
*
e
1 × 10⁶
cells Monitor fordiseaselatency
Primaryleukemia
25% leukemicblasts in the
periphery
Administertreatment
for 3 weeks
JQ1
Vehicle
DBZ
DBZ + JQ1
NSG mice
ICN1
H&E
V ST LT
MYC
T-ALL-x-9
Per
cent
sur
viva
l
0 20 40 60 80 100 120 140 1600
20
40
60
80
100
TreatmentDays after transplantation
Vehicle
DBZ
JQ1
DBZ + JQ1
T-ALL-x-14
0 20 40 60 80 1000
20
40
60
80
100
TreatmentDays after transplantation
Per
cent
sur
viva
l
T-ALL-x-11
0 100
20
40
60
80
100
110 130 150 170 190
TreatmentDays after transplantation
Per
cent
sur
viva
l
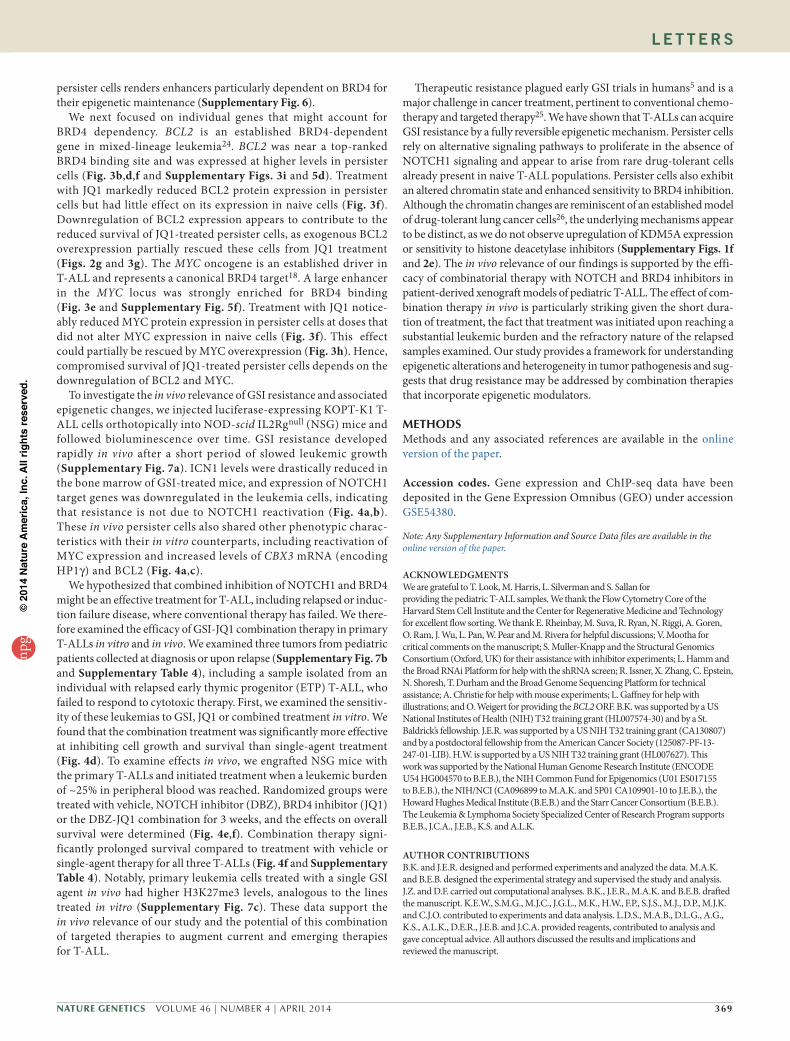
Figure 4 Combination therapy targeting NOTCH1 and BRD4 in primary T-ALL. (a) NSG mice were injected with luciferase-expressing KOPT-K1 T-ALL cells, and leukemic mice were treated with NOTCH inhibitor DBZ for 5 d (ST; three doses), DBZ for 3 weeks (LT; dosing every other day) or vehicle (V) (five mice per group). DBZ-treated mice were sacrificed when bioluminescence had plateaued and then significantly increased (Online Methods and supplementary Fig. 7a). Images show hematoxylin and eosin (H&E) staining and immunohistochemistry for ICN1 and MYC in bone marrow from the respective leukemic mice. Scale bar, 100 µm. (b) NOTCH1 target gene expression shown for leukemia cells sorted from the spleen of mice treated with vehicle (V) or with long-term treatment (LT). Data points reflect averages for 2 mice (2 replicates; error bars, s.d.; ***P < 0.001). (c) Left, CBX3 expression shown for leukemia cells as in b (two replicates; error bars, s.d.; *P < 0.05). Right, intracellular BCL2 expression measured by flow cytometry shown for leukemia cells as in b (two replicates; error bars, s.d.; *P < 0.05). (d) Proliferation of three primary T-ALLs grown in vitro for 6 d in the presence of 1 µM GSI, 0.25 µM JQ1 or both compounds (T-ALL-x-9 and T-ALL-x-14: two replicates; T-ALL-x-11: three replicates; error bars, s.d.; *P < 0.05, **P < 0.01). (e) Experimental design for primary T-ALL xenotransplantation trials. Primary T-ALL samples from three primary pediatric T-ALLs (T-ALL-x-9, T-ALL-x-11 and T-ALL-x-14; supplementary table 4) were transplanted into NSG mice. Once leukemic burden reached 25% in peripheral blood by human CD45 staining, mice were randomized into four treatment groups (vehicle, JQ1, DBZ or DBZ-JQ1 combination). Mice were treated for three consecutive weeks and were then monitored for disease and sacrificed when they became moribund. (f) Kaplan-Meier survival curves for samples T-ALL-x-9, T-ALL-x-11 and T-ALL-x-14 (P < 0.01 as assessed by the log-rank test; for details see supplementary table 4; T-ALL-x-9: vehicle n = 5, DBZ n = 5, JQ1 n = 5, DBZ and JQ1 n = 4; T-ALL-x-11: vehicle n = 4, DBZ n = 5, JQ1 n = 5, DBZ and JQ1 n = 4; T-ALL-x-14: vehicle n = 5, DBZ n = 5, JQ1 n = 5, DBZ and JQ1 n = 4). Combination treatment significantly prolonged survival compared to single-agent treatment and treatment with vehicle in all three trials.
npg
© 2
014
Nat
ure
Am
eric
a, In
c. A
ll rig
hts
rese
rved
.
Nature GeNetics VOLUME 46 | NUMBER 4 | APRIL 2014 369
l e t t e r s
persister cells renders enhancers particularly dependent on BRD4 for their epigenetic maintenance (Supplementary Fig. 6).
We next focused on individual genes that might account for BRD4 dependency. BCL2 is an established BRD4-dependent gene in mixed-lineage leukemia24. BCL2 was near a top-ranked BRD4 binding site and was expressed at higher levels in persister cells (Fig. 3b,d,f and Supplementary Figs. 3i and 5d). Treatment with JQ1 markedly reduced BCL2 protein expression in persister cells but had little effect on its expression in naive cells (Fig. 3f). Downregulation of BCL2 expression appears to contribute to the reduced survival of JQ1-treated persister cells, as exogenous BCL2 overexpression partially rescued these cells from JQ1 treatment (Figs. 2g and 3g). The MYC oncogene is an established driver in T-ALL and represents a canonical BRD4 target18. A large enhancer in the MYC locus was strongly enriched for BRD4 binding (Fig. 3e and Supplementary Fig. 5f). Treatment with JQ1 notice-ably reduced MYC protein expression in persister cells at doses that did not alter MYC expression in naive cells (Fig. 3f). This effect could partially be rescued by MYC overexpression (Fig. 3h). Hence, compromised survival of JQ1-treated persister cells depends on the downregulation of BCL2 and MYC.
To investigate the in vivo relevance of GSI resistance and associated epigenetic changes, we injected luciferase-expressing KOPT-K1 T-ALL cells orthotopically into NOD-scid IL2Rgnull (NSG) mice and followed bioluminescence over time. GSI resistance developed rapidly in vivo after a short period of slowed leukemic growth (Supplementary Fig. 7a). ICN1 levels were drastically reduced in the bone marrow of GSI-treated mice, and expression of NOTCH1 target genes was downregulated in the leukemia cells, indicating that resistance is not due to NOTCH1 reactivation (Fig. 4a,b). These in vivo persister cells also shared other phenotypic charac-teristics with their in vitro counterparts, including reactivation of MYC expression and increased levels of CBX3 mRNA (encoding HP1γ) and BCL2 (Fig. 4a,c).
We hypothesized that combined inhibition of NOTCH1 and BRD4 might be an effective treatment for T-ALL, including relapsed or induc-tion failure disease, where conventional therapy has failed. We there-fore examined the efficacy of GSI-JQ1 combination therapy in primary T-ALLs in vitro and in vivo. We examined three tumors from pediatric patients collected at diagnosis or upon relapse (Supplementary Fig. 7b and Supplementary Table 4), including a sample isolated from an individual with relapsed early thymic progenitor (ETP) T-ALL, who failed to respond to cytotoxic therapy. First, we examined the sensitiv-ity of these leukemias to GSI, JQ1 or combined treatment in vitro. We found that the combination treatment was significantly more effective at inhibiting cell growth and survival than single-agent treatment (Fig. 4d). To examine effects in vivo, we engrafted NSG mice with the primary T-ALLs and initiated treatment when a leukemic burden of ~25% in peripheral blood was reached. Randomized groups were treated with vehicle, NOTCH inhibitor (DBZ), BRD4 inhibitor (JQ1) or the DBZ-JQ1 combination for 3 weeks, and the effects on overall survival were determined (Fig. 4e,f). Combination therapy signi-ficantly prolonged survival compared to treatment with vehicle or single-agent therapy for all three T-ALLs (Fig. 4f and Supplementary Table 4). Notably, primary leukemia cells treated with a single GSI agent in vivo had higher H3K27me3 levels, analogous to the lines treated in vitro (Supplementary Fig. 7c). These data support the in vivo relevance of our study and the potential of this combination of targeted therapies to augment current and emerging therapies for T-ALL.
Therapeutic resistance plagued early GSI trials in humans5 and is a major challenge in cancer treatment, pertinent to conventional chemo-therapy and targeted therapy25. We have shown that T-ALLs can acquire GSI resistance by a fully reversible epigenetic mechanism. Persister cells rely on alternative signaling pathways to proliferate in the absence of NOTCH1 signaling and appear to arise from rare drug-tolerant cells already present in naive T-ALL populations. Persister cells also exhibit an altered chromatin state and enhanced sensitivity to BRD4 inhibition. Although the chromatin changes are reminiscent of an established model of drug-tolerant lung cancer cells26, the underlying mechanisms appear to be distinct, as we do not observe upregulation of KDM5A expression or sensitivity to histone deacetylase inhibitors (Supplementary Figs. 1f and 2e). The in vivo relevance of our findings is supported by the effi-cacy of combinatorial therapy with NOTCH and BRD4 inhibitors in patient-derived xenograft models of pediatric T-ALL. The effect of com-bination therapy in vivo is particularly striking given the short dura-tion of treatment, the fact that treatment was initiated upon reaching a substantial leukemic burden and the refractory nature of the relapsed samples examined. Our study provides a framework for understanding epigenetic alterations and heterogeneity in tumor pathogenesis and sug-gests that drug resistance may be addressed by combination therapies that incorporate epigenetic modulators.
MeTHODSMethods and any associated references are available in the online version of the paper.
Accession codes. Gene expression and ChIP-seq data have been deposited in the Gene Expression Omnibus (GEO) under accession GSE54380.
Note: Any Supplementary Information and Source Data files are available in the online version of the paper.
ACKnOWLEDGMEntSWe are grateful to T. Look, M. Harris, L. Silverman and S. Sallan for providing the pediatric T-ALL samples. We thank the Flow Cytometry Core of the Harvard Stem Cell Institute and the Center for Regenerative Medicine and Technology for excellent flow sorting. We thank E. Rheinbay, M. Suva, R. Ryan, N. Riggi, A. Goren, O. Ram, J. Wu, L. Pan, W. Pear and M. Rivera for helpful discussions; V. Mootha for critical comments on the manuscript; S. Muller-Knapp and the Structural Genomics Consortium (Oxford, UK) for their assistance with inhibitor experiments; L. Hamm and the Broad RNAi Platform for help with the shRNA screen; R. Issner, X. Zhang, C. Epstein, N. Shoresh, T. Durham and the Broad Genome Sequencing Platform for technical assistance; A. Christie for help with mouse experiments; L. Gaffney for help with illustrations; and O. Weigert for providing the BCL2 ORF. B.K. was supported by a US National Institutes of Health (NIH) T32 training grant (HL007574-30) and by a St. Baldrick’s fellowship. J.E.R. was supported by a US NIH T32 training grant (CA130807) and by a postdoctoral fellowship from the American Cancer Society (125087-PF-13-247-01-LIB). H.W. is supported by a US NIH T32 training grant (HL007627). This work was supported by the National Human Genome Research Institute (ENCODE U54 HG004570 to B.E.B.), the NIH Common Fund for Epigenomics (U01 ES017155 to B.E.B.), the NIH/NCI (CA096899 to M.A.K. and 5P01 CA109901-10 to J.E.B.), the Howard Hughes Medical Institute (B.E.B.) and the Starr Cancer Consortium (B.E.B.). The Leukemia & Lymphoma Society Specialized Center of Research Program supports B.E.B., J.C.A., J.E.B., K.S. and A.L.K.
AUtHOR COntRIBUtIOnSB.K. and J.E.R. designed and performed experiments and analyzed the data. M.A.K. and B.E.B. designed the experimental strategy and supervised the study and analysis. J.Z. and D.F. carried out computational analyses. B.K., J.E.R., M.A.K. and B.E.B. drafted the manuscript. K.E.W., S.M.G., M.J.C., J.G.L., M.K., H.W., F.P., S.J.S., M.J., D.P., M.J.K. and C.J.O. contributed to experiments and data analysis. L.D.S., M.A.B., D.L.G., A.G., K.S., A.L.K., D.E.R., J.E.B. and J.C.A. provided reagents, contributed to analysis and gave conceptual advice. All authors discussed the results and implications and reviewed the manuscript.
npg
© 2
014
Nat
ure
Am
eric
a, In
c. A
ll rig
hts
rese
rved
.
370 VOLUME 46 | NUMBER 4 | APRIL 2014 Nature GeNetics
COMPEtInG FInAnCIAL IntEREStSThe authors declare competing financial interests: details are available in the online version of the paper.
Reprints and permissions information is available online at http://www.nature.com/reprints/index.html.
1. Weng, A.P. et al. Activating mutations of NOTCH1 in human T cell acute lymphoblastic leukemia. Science 306, 269–271 (2004).
2. Ellisen, L.W. et al. TAN-1, the human homolog of the Drosophila notch gene, is broken by chromosomal translocations in T lymphoblastic neoplasms. Cell 66, 649–661 (1991).
3. Pui, C.H. & Evans, W.E. Treatment of acute lymphoblastic leukemia. N. Engl. J. Med. 354, 166–178 (2006).
4. Rao, S.S. et al. Inhibition of NOTCH signaling by γ secretase inhibitor engages the RB pathway and elicits cell cycle exit in T-cell acute lymphoblastic leukemia cells. Cancer Res. 69, 3060–3068 (2009).
5. Palomero, T. & Ferrando, A. Therapeutic targeting of NOTCH1 signaling in T-cell acute lymphoblastic leukemia. Clin. Lymphoma Myeloma 9 (suppl. 3), S205–S210 (2009).
6. Guruharsha, K.G., Kankel, M.W. & Artavanis-Tsakonas, S. The Notch signalling system: recent insights into the complexity of a conserved pathway. Nat. Rev. Genet. 13, 654–666 (2012).
7. Weng, A.P. et al. c-Myc is an important direct target of Notch1 in T-cell acute lymphoblastic leukemia/lymphoma. Genes Dev. 20, 2096–2109 (2006).
8. Palomero, T. et al. NOTCH1 directly regulates c-MYC and activates a feed-forward-loop transcriptional network promoting leukemic cell growth. Proc. Natl. Acad. Sci. USA 103, 18261–18266 (2006).
9. Sharma, V.M. et al. Notch1 contributes to mouse T-cell leukemia by directly inducing the expression of c-myc. Mol. Cell. Biol. 26, 8022–8031 (2006).
10. Gutierrez, A. et al. High frequency of PTEN, PI3K, and AKT abnormalities in T-cell acute lymphoblastic leukemia. Blood 114, 647–650 (2009).
11. Palomero, T. et al. Mutational loss of PTEN induces resistance to NOTCH1 inhibition in T-cell leukemia. Nat. Med. 13, 1203–1210 (2007).
12. Chan, S.M., Weng, A.P., Tibshirani, R., Aster, J.C. & Utz, P.J. Notch signals positively regulate activity of the mTOR pathway in T-cell acute lymphoblastic leukemia. Blood 110, 278–286 (2007).
13. Kalaitzidis, D. et al. mTOR complex 1 plays critical roles in hematopoiesis and Pten-loss-evoked leukemogenesis. Cell Stem Cell 11, 429–439 (2012).
14. Dawson, M.A. & Kouzarides, T. Cancer epigenetics: from mechanism to therapy. Cell 150, 12–27 (2012).
15. Zhao, R., Nakamura, T., Fu, Y., Lazar, Z. & Spector, D.L. Gene bookmarking accelerates the kinetics of post-mitotic transcriptional re-activation. Nat. Cell Biol. 13, 1295–1304 (2011).
16. Blobel, G.A., Kalota, A., Sanchez, P.V. & Carroll, M. Short hairpin RNA screen reveals bromodomain proteins as novel targets in acute myeloid leukemia. Cancer Cell 20, 287–288 (2011).
17. Zuber, J. et al. RNAi screen identifies Brd4 as a therapeutic target in acute myeloid leukaemia. Nature 478, 524–528 (2011).
18. Filippakopoulos, P. et al. Selective inhibition of BET bromodomains. Nature 468, 1067–1073 (2010).
19. Nicodeme, E. et al. Suppression of inflammation by a synthetic histone mimic. Nature 468, 1119–1123 (2010).
20. Zhou, V.W., Goren, A. & Bernstein, B.E. Charting histone modifications and the functional organization of mammalian genomes. Nat. Rev. Genet. 12, 7–18 (2011).
21. ENCODE Project Consortium. An integrated encyclopedia of DNA elements in the human genome. Nature 489, 57–74 (2012).
22. Whyte, W.A. et al. Master transcription factors and mediator establish super-enhancers at key cell identity genes. Cell 153, 307–319 (2013).
23. Voigt, P. & Reinberg, D. BRD4 jump-starts transcription after mitotic silencing. Genome Biol. 12, 133 (2011).
24. Dawson, M.A. et al. Inhibition of BET recruitment to chromatin as an effective treatment for MLL-fusion leukaemia. Nature 478, 529–533 (2011).
25. Haber, D.A., Gray, N.S. & Baselga, J. The evolving war on cancer. Cell 145, 19–24 (2011).
26. Sharma, S.V. et al. A chromatin-mediated reversible drug-tolerant state in cancer cell subpopulations. Cell 141, 69–80 (2010).
l e t t e r snp
g©
2014
Nat
ure
Am
eric
a, In
c. A
ll rig
hts
rese
rved
.
Nature GeNeticsdoi:10.1038/ng.2913
ONLINeMeTHODSCell culture. The human T cell leukemia cell lines DND-41 and KOPT-K1 were a kind gift of A.T. Look (Dana-Farber Cancer Institute). Cells were grown in RPMI-1640 containing 10% FCS at 37 °C with 5% CO2 , tested for mycoplasma at regular intervals and maintained at a density of between 5 × 10⁵ and 2 × 10⁶ cells/ml. Persister cells were established by treating DND-41 or KOPT-K1 cells with 1 µM GSI for at least 7 weeks, replenishing the inhibitor every 3–4 d (Compound E, EMD4 Biosciences). Reversed cells were generated from persister cells by cul-turing without GSI for a minimum of 2 weeks. Cell numbers were determined using the Nexcelom Bioscience Cellometer Auto T4. Single cells were sorted into 96-well round-bottom plates and continuously treated with 1 µM Compound E or control. The number of clones that grew out after 4–6 weeks of culture was determined using a Zeiss Observer.Z1 with AxioCam MRm with a 2.5× objective imaging system. At least 500 wells were analyzed per condition in 2 independent experiments. Primary T-ALL cells obtained from pediatric patients with T-ALL with institutional review board (IRB) approval were passaged through NOD-scid IL2Rgnull (NSG) mice and maintained in MEMα containing 10% FCS, 10% heat-inactivated human AB+ serum, 10 ng/ml human interleukin (IL)-7, 50 ng/ml human stem cell factor (SCF), 20 ng/ml human FLT3 ligand, 20 nM insulin and 100 ng/ml IL-2 at 37 °C with 5% CO2.
Cell proliferation and apoptosis assays. Viable T-ALL cell lines were plated in 2–4 replicates in black or white opaque flat-bottom 96-well tissue culture plates. For proliferation assays, cells were titrated to allow log-phase growth for a period of 4 to 9 d before readout (5,000 to 15,000 cells per well). Viable primary T-ALL cells were plated in 2–3 replicates in black opaque flat-bottom 96-well tissue culture plates at 50,000–100,000 cells per well and were cultured for 6 d. Cell proliferation was measured using the CellTiter-Glo Luminescent Cell Viability Assay from Promega as described by the manufacturer. Apoptosis was measured as a function of caspase 3 and caspase 7 cleavage using the Caspase-Glo 3/7 Luminescent Assay from Promega as described by the manu-facturer. End-point luminescence was measured on a SpectraMax M5 plate reader (Molecular Diagnostics). Statistical analyses were performed using Student’s t tests, assuming equal variance. A two-sided P value of <0.05 was considered to indicate statistical significance. Error bars reflect s.d.
In vitro inhibitor assays, protein blots and ELISAs. GSI (Compound E) was obtained from EMD4 Biosciences. Rapamycin and the AKT inhibitor MK-2206 were purchased from Selleck Chemicals. Stock aliquots (1–100 mM) were prepared in DMSO (Sigma-Aldrich) and diluted in appropriate medium before use. Matching DMSO concentrations were used for control treatment. For protein blots, cells were collected after treatment and processed as described previously27. Total protein amount in each sample was determined using the SDS-compatible Bio-Rad DC Protein Assay. Membranes were developed using Amersham ECL Plus Western Blotting Detection Reagents (GE Healthcare, Life Sciences) and visualized using photographic film. Protein blots used antibodies against α-tubulin (ab7291), BCL2 (ab18210), BRD4 (ab75898) and total histone H3 (ab1791), all from Abcam; cleaved NOTCH1 (ICN1; 4147), total mTOR (5536), phospho-mTOR 2481 (9964), total PTEN (9552), phospho-PTEN (9551) and HP1γ (2616), all from Cell Signaling Technology; MYC from Cell Signaling Technology (9402) and Santa Cruz Biotechnology (sc-764); H3K27ac from ActiveMotif (39133); and β-actin from Sigma (A5441). All primary antibodies were used at 1:1,000 dilutions, except for the antibodies to α-tubulin (1:10,000 dilution), β-actin (1:5,000 dilution) and total histone H3 (1:25,000 dilution). Histone ELISAs for H3K27me3, H3K9me3 and total histone H3 were obtained from ActiveMotif. Signal for H3K27me3 and H3K9me3 for each sample was determined as a fraction of total histone H3, following the protocol described by the manufacturer. Statistical analyses were performed using Student’s t tests, assuming equal variance. A two-sided P value of <0.05 was considered to indicate statistical significance. Error bars reflect s.d.
Quantitative RT-PCR analyses. Total RNA was extracted with the RNeasy Mini kit (Qiagen) and reverse transcribed into cDNA using the SuperScript III First-Strand Synthesis system for RT-PCR. qPCR was performed with FastStart Universal SYBR Green Master (Roche) on an ABI 7500 (primer sequences are listed in Supplementary Table 5). Gene expression was measured by determining
the log2 (Ct) value of the desired transcript compared to either GAPDH or B2M (encoding β2-microglobulin) transcript. Statistical analyses were performed using Student’s t tests, assuming equal variance. A two-sided P value of <0.05 was considered to indicate statistical significance. Error bars reflect s.d.
Flow cytometry and cell sorting. Flow cytometric analysis and sorting were performed on a BD FACSCalibur or BD LSR II (analysis) and BD FACSAriaII or MoFLo (sorting), using FITC-, PE- and APC-conjugated anti-bodies against CD45 (2.5 µl) and BCL2 (5 µl) and appropriate isotype controls (all from BD Pharmingen). Intracellular staining was performed according to the manufacturer’s instructions. For flow cytometric analysis of spleens, single-cell solutions were generated, and red blood cell lysis was performed before staining. Cell sorting for CD45-positive and mCherry-positive cells was carried out on a FACSAria II. Single cells were sorted into 96-well round-bottom plates using the FACSAria II.
DAPI staining. For DAPI staining, 5 × 10⁷ cells were fixed in 4% paraformal-dehyde (PFA) in PBS and permeabilized with 1% Triton X-100. Cells were mounted on slides using Vectashield mounting medium with 1.5 µg/ml DAPI (Vector Laboratories). Slides were imaged on an Olympus IX51 microscope with a QCapture ×65 camera (400×) and QImaging software. Nuclear size was quanti-fied using ImageJ software.
MNase digestion. Mononucleosome isolation was performed as described with modifications28. Naive and persister cells were incubated with 0.5% Triton X-100 in buffer 1 (10 mM 2-(N-morpholino)ethanesulfonic acid, pH 6.5, 10 mM sodium butyrate, 60 mM KCl, 15 mM NaCl, 5 mM MgCl2, 0.25 M sucrose) on ice. Nuclei were then layered onto 2.5 volumes of 30% sucrose in buffer 1 and centrifuged at 3,720g. Purified nuclei were resuspended in buffer 2 (20 mM HEPES, pH 7.8, 10 mM KCl, 1.5 mM MgCl2, 0.34 M sucrose, 10% glycerol, 2 mM CaCl2, 1 mM dithiothreitol) with 200 U of micrococcal nuclease (Roche Diagnostics) at room temperature for 5 min, 10 min or 15 min, and reactions were then quenched by the addition of EGTA to a final concentration of 1 mM. Digested DNA was phenol-chloroform extracted and run on an agarose gel.
Chromatin immunoprecipitation assays. We performed ChIP-qPCR and ChIP-seq analysis in naive and persister DND-41 and KOPT-K1 cells as described27. Chromatin from formaldehyde-fixed cells (1–5 × 10⁶ cells per histone mark, 1 × 10⁷ cells for BRD4 binding) was fragmented to a size range of 200–700 bases with a Branson 250 Sonifier. Solubilized chromatin was immunoprecipitated with antibody against H3K4me3 (Millipore, 07-473CA), H3K36me3 (Abcam, ab9050), H3K27me3 (Millipore, 07-449), H3K27ac (ActiveMotif, ab4729), H3K4me1 (Abcam, ab8895) and BRD4 (Bethyl, A301-985A), using 2.5 µl for H3K36me3, H3K4me3 and H3K27ac; 5 µl for H3K4me1 and H3K27me3; and 10 µl for BRD4. Each of these antibodies was validated by protein blot and dot blot as described29. Antibody-chromatin complexes were pulled down with Protein A–Sepharose, washed and then eluted. After cross-link reversal and proteinase K treatment, immunoprecipi-tated DNA was extracted with phenol-chloroform, precipitated with ethanol and treated with RNase. ChIP DNA was quantified with PicoGreen.
ChIP enrichments were assessed by qPCR analysis on an ABI 7500 with 0.2 ng of ChIP DNA and an equal amount of unenriched input DNA (whole-cell extract and background control). Enrichment was calculated by determining the log2 (Ct) value for the ChIP DNA relative to that of the whole-cell extract. Primer sequences are listed in Supplementary Table 5.
For ChIP-seq, libraries were prepared according to Illumina’s instruc-tions. ChIP DNA and input controls were sequenced with the HiSeq Illumina Genome Analyzer. ChIP-seq reads were aligned to the reference genome (hg19) using SOAP2 (ref. 30), allowing at most two mismatches. Positions were randomly selected for reads with multiple hits. Reads aligned to the same position and strand were only counted once. We extended aligned reads by 250 bp to approximate fragment sizes and then derived a 25-bp resolu-tion density map by counting the number of fragments overlapping each position. We calculated H3K27me3 density across 10-kb regions centered on distal elements marked by H3K4me1 only to analyze the local dynamics of H3K27me3 modification and normalized enrichment to the background level as described31.
npg
© 2
014
Nat
ure
Am
eric
a, In
c. A
ll rig
hts
rese
rved
.
Nature GeNetics doi:10.1038/ng.2913
Intervals enriched for BRD4 binding and H3K27ac and H3K4me1 marks were identified by scanning the genome for enriched 1-kb windows and then merging overlapping enriched windows to define enriched inter-vals as described31. Candidate distal regulatory elements were assigned from enriched intervals that did not overlap the 4-kb region centered on an annotated transcriptional start site. Heat maps for BRD4, H3K27ac and H3K4me1 signals were plotted over 10-kb regions surrounding all distal H3K4me1-marked intervals. Heat maps are ranked by the average signal intensities of BRD4 binding and H3K27ac modification. A list of genes near large BRD4 peaks was collated by (i) calculating the AUC for BRD4 peaks; (ii) assigning intergenic peaks to the nearest expressed promoter within 100 kb; and (iii) summing for each expressed gene the total AUC of its intra-genic BRD4 peaks and the BRD4 peaks assigned to its promoter.
Gene expression analyses. RNA from biological replicates of naive and per-sister DND-41 and KOPT-K1 cells was isolated using TRIzol. Gene expression profiles were generated with Affymetrix Human Genome U133 Plus 2.0 arrays. Data were analyzed using Genepattern and gene set enrichment analysis (with gene sets containing at least 50 genes per set)32–34.
Lentiviral and retroviral knockdown and overexpression. shRNA target sequences against BRD4 and control hairpin sequences are listed in Supplementary Table 5. Lentiviral particles were generated with the use of standard procedures35. Infection efficiency was greater than 80% after 3 d of puromycin selection. The BCL2 ORF was cloned into a lentiviral expression system with puromycin resistance sites using the Gateway cloning system. Cells were spin infected with virus and selected with puromycin. Cell viability was monitored with CellTiter-Glo (Promega), and cells were collected after 6–8 d of selection in puromycin. Overexpression was confirmed by measuring BCL2 protein expression by protein blot analysis (Supplementary Fig. 5g).
The retroviral constructs MigR1 (EV) and MigR1-DN-MAML1 (DN-MAML) and MigR1-myc (MYC) have been described1,7. Pseudotyped retro-virus was produced by transfection of 293T cells (obtained from the American Type Culture Collection (ATCC)) as described36. DND-41 and KOPT-K1 cells were infected with retrovirus by spinoculation. GFP-positive cells were isolated by cell sorting. Overexpression of MYC was confirmed by RT-PCR (Supplementary Fig. 5f). Persister cells were cultured in the presence of 1 µM GSI throughout the entire experiment.
shRNA screen. shRNA screens were performed in naive and persister DND-41 cells in an arrayed format using CellTiter-Glo (Promega) to assess pro-liferation and viability phenotypes as described37,38. Screening included three replicates per cell line (one replicate without puromycin treatment, two replicates treated with 1 µg/ml puromycin). Hairpins with an infection efficiency of greater than 50% were used for analysis. Screening data were normalized using the statistical z score as described39. Riger analysis was used to identify hairpins that selectively affected survival in either naive cells only or persister cells only40.
Cell line xenograft experiments. Xenograft experiments were performed as pre-viously described41. In brief, a total of 2 × 10⁶ mCherry–KOPT-K1–LucNeo cells that had been engineered to stably express firefly luciferase and mCherry were injected intravenously into the lateral tail vein of male NSG mice (8–16 weeks of age). Mice were imaged after injection with 75 mg/kg d-luciferin (Promega) using a Xenogen IVIS Spectrum (Caliper Life Sciences). Bioluminescence was quantified using the Living Images software package (Caliper Life Sciences). Mice with established disease were divided into treatment groups (n = 5 mice per group, randomized; investigator was not blinded). Mice were treated every other day with either GSI ((S)-2-[2-(3,5-difluorophenyl)-acetylamino]-N-((S)-5-methyl-6-oxo-6,7-dihydro-5H-dibenzo[b,d]azepin-7-yl)-propionamide, DBZ) at 10 µM/kg intraperitoneally or with vehicle (PBS) control. Vehicle-treated mice and those with short-term treatment were sacrificed after 5 d (3 doses of DBZ), and mice with long-term treatment were sacrificed after 3 weeks (11 doses of DBZ), once slowed tumor growth was no longer observed by bioluminescence. Studies were performed under the auspices of protocols approved by the Dana-Farber Cancer Institute Institutional Animal Care and Use Committee.
Primary human T-ALL xenograft studies. Primary human T-ALL cells were obtained from children with T-ALL enrolled on clinical trials of the Dana-Farber Cancer Institute (for details, see the Supplementary Note). Samples were collected with informed consent and with approval of the IRB. Patient consent forms were required from all patients or their legal guard-ians (if minors) for all samples collected for the study. Leukemic blasts were isolated from peripheral blood or bone marrow samples by Ficoll-Hypaque centrifugation and were cryopreserved in FBS containing 10% DMSO and stored in liquid nitrogen. NSG mice from in-house colonies were maintained on a regimen of acidified antibiotic water. Fresh or frozen leukemic blasts were expanded in NSG mice (8–16 weeks of age) by transplanting 0.5–5 × 10⁶ cells via intravenous injection. Human engraftment in the spleen and bone marrow was greater than 80% by staining for human CD45 (BD Bioscience).
For in vivo xenograft studies, NSG mice were injected with 1 × 10⁶ leukemic blasts via intravenous injection and bled weekly to determine the percent-age of circulating human CD45-positive cells in the peripheral blood. Once the leukemic burden reached 25% in the periphery, mice were randomized (investigator was not blinded) to receive vehicle, JQ1 (50 mg/kg daily, diluted in 10:90 DMSO:10% hydroxypropyl-β–cyclodextrin), DBZ (10 µM/kg on a 3-d on, 4-d off regimen, diluted in 0.5% methocel E4M/0.1% Tween-80), or both DBZ and JQ1 for 3 weeks by intraperitoneal injection. Mice were monitored and weighed daily and were sacrificed when determined to be moribund. Kaplan-Meier survival curves and statistical analyses were performed using GraphPad Prism software, Version 5.0. A two-sided P value of <0.05 was considered to indicate statistical significance. All mouse procedures used in this study were approved by the University of Massachusetts Medical School Institutional Animal Care and Use Committee.
For assessment of global histone levels, NSG mice engrafted with T-ALL-x-9 at 25% disease burden were treated with vehicle or DBZ for 3 weeks. Mice were sacrificed 2 h after GSI dosing, and leukemia cells were isolated from the spleens (purity of 86% in vehicle-treated mice and 85% in GSI-treated mice by staining for human CD45).
Immunohistochemical detection of ICN1 and MYC. Standard 4-µm paraffin-embedded tissue sections were stained using the Ventana Benchmark XT platform (Ventana Medical Systems) with extended heat-induced epitope retrieval (CC1 Buffer). Slides were incubated for 1 h at room temperature with rabbit monoclonal antibody to ICN1 (clone D3B8, Cell Signaling Technology; final concentration of 8.5 µg/ml) that is specific for the neoepitope that is created by γ-secretase cleavage of NOTCH1 or rabbit monoclonal antibody to MYC (Epitomics; final concentration of 0.56 µg/ml)42. Signals were then amplified (Ventana Amplification kit) and visualized (Ventana Ultraview Universal DAB detection kit) according to the manufacturer’s instructions. All staining runs included two positive control samples (xenografted REC-1 tumor cells, a mantle cell lymphoma with an activating rearrangement of NOTCH1 and tonsillar mucosa)43.
27. Ku, M. et al. Genomewide analysis of PRC1 and PRC2 occupancy identifies two classes of bivalent domains. PLoS Genet. 4, e1000242 (2008).
28. Sarcinella, E., Zuzarte, P.C., Lau, P.N., Draker, R. & Cheung, P. Monoubiquitylation of H2A.Z distinguishes its association with euchromatin or facultative heterochromatin. Mol. Cell. Biol. 27, 6457–6468 (2007).
29. Ernst, J. et al. Mapping and analysis of chromatin state dynamics in nine human cell types. Nature 473, 43–49 (2011).
30. Li, R. et al. SOAP2: an improved ultrafast tool for short read alignment. Bioinformatics 25, 1966–1967 (2009).
31. Zhu, J. et al. Genome-wide chromatin state transitions associated with developmental and environmental cues. Cell 152, 642–654 (2013).
32. Reich, M. et al. GenePattern 2.0. Nat. Genet. 38, 500–501 (2006).33. Mootha, V.K. et al. PGC-1α–responsive genes involved in oxidative phosphorylation are
coordinately downregulated in human diabetes. Nat. Genet. 34, 267–273 (2003).34. Subramanian, A. et al. Gene set enrichment analysis: a knowledge-based approach
for interpreting genome-wide expression profiles. Proc. Natl. Acad. Sci. USA 102, 15545–15550 (2005).
35. Root, D.E., Hacohen, N., Hahn, W.C., Lander, E.S. & Sabatini, D.M. Genome-scale loss-of-function screening with a lentiviral RNAi library. Nat. Methods 3, 715–719 (2006).
36. Pear, W.S., Scott, M.L. & Nolan, G.P. in Methods in Molecular Biology: Methods in Gene Therapy (ed. Robbins, P.) 41–58 (Humana Press, Tonawa, NJ, 1997).
37. Boehm, J.S. et al. Integrative genomic approaches identify IKBKE as a breast cancer oncogene. Cell 129, 1065–1079 (2007).
npg
© 2
014
Nat
ure
Am
eric
a, In
c. A
ll rig
hts
rese
rved
.

Nature GeNeticsdoi:10.1038/ng.2913
38. Moffat, J. et al. A lentiviral RNAi library for human and mouse genes applied to an arrayed viral high-content screen. Cell 124, 1283–1298 (2006).
39. Malo, N., Hanley, J.A., Cerquozzi, S., Pelletier, J. & Nadon, R. Statistical practice in high-throughput screening data analysis. Nat. Biotechnol. 24, 167–175 (2006).
40. Luo, B. et al. Highly parallel identification of essential genes in cancer cells. Proc. Natl. Acad. Sci. USA 105, 20380–20385 (2008).
41. Choi, Y.J. et al. The requirement for cyclin D function in tumor maintenance. Cancer Cell 22, 438–451 (2012).
42. Kluk, M.J. et al. Immunohistochemical detection of MYC-driven diffuse large B-cell lymphomas. PLoS ONE 7, e33813 (2012).
43. Kluk, M.J. et al. Gauging NOTCH1 activation in cancer using immunohistochemistry. PLoS ONE 8, e67306 (2013).
npg
© 2
014
Nat
ure
Am
eric
a, In
c. A
ll rig
hts
rese
rved
.