Embed Size (px)
Citation preview

An Epigenetic Blockade of Cognitive Functions in the Neurodegenerating Brain
CitationGräff, Johannes, Damien Rei, Ji-Song Guan, Wen-Yuan Wang, Jinsoo Seo, Krista M. Hennig, Thomas Nieland, et al. 2012. An epigenetic blockade of cognitive functions in the neurodegenerating brain. Nature 483(7388): 222-226.
Published Versiondoi:10.1038/nature10849
Permanent linkhttp://nrs.harvard.edu/urn-3:HUL.InstRepos:10579390
Terms of UseThis article was downloaded from Harvard University’s DASH repository, and is made available under the terms and conditions applicable to Other Posted Material, as set forth at http://nrs.harvard.edu/urn-3:HUL.InstRepos:dash.current.terms-of-use#LAA
Share Your StoryThe Harvard community has made this article openly available.Please share how this access benefits you. Submit a story .
Accessibility

An epigenetic blockade of cognitive functions in theneurodegenerating brain
Johannes Gräff1,2,3, Damien Rei1,2, Ji-Song Guan1,2,3, Wen-Yuan Wang1,2,3, Jinsoo Seo1,2,Krista M. Hennig3,4, Thomas J.F. Nieland3, Daniel M. Fass3,4, Patricia F. Kao5, MartinKahn1, Susan C. Su1,2, Alireza Samiei1, Nadine Joseph1,2,3, Stephen J. Haggarty3,4, IvanaDelalle5, and Li-Huei Tsai1,2,3,*
1Picower Institute for Learning and Memory, Department of Brain and Cognitive Sciences,Massachusetts Institute of Technology, Cambridge, MA, 02139, USA2Howard Hughes Medical Institute, Massachusetts Institute of Technology, Cambridge, MA,02139, USA3Stanley Center for Psychiatric Research, Broad Institute of Harvard University andMassachusetts Institute of Technology, Cambridge, MA, 02142, USA4Center for Human Genetic Research, Massachusetts General Hospital, Harvard Medical School,Boston, MA 02114, USA5Department of Pathology and Laboratory Medicine, Boston University School of Medicine,Boston, MA, 02118, USA
AbstractCognitive decline is a debilitating feature of most neurodegenerative diseases of the centralnervous system, including Alzheimer’s disease (AD)1. The causes leading to such impairment areonly poorly understood and effective treatments are slow to emerge2. Here, we show thatcognitive capacities in the neurodegenerating brain are constrained by an epigenetic blockade ofgene transcription that is potentially reversible. This blockade is mediated by histone deacetylase(HDAC) 2, which is increased by AD-related neurotoxic insults in vitro, in two mouse models ofneurodegeneration, and in AD patients. HDAC2 associates with and reduces the histoneacetylation of genes important for learning and memory, which show a concomitant decrease inexpression. Importantly, reversing the buildup of HDAC2 by shRNA-mediated knockdownunlocks the repression of these genes, re-instates structural and synaptic plasticity, and abolishesneurodegeneration-associated memory impairments. These findings advocate for the developmentof HDAC2-selective inhibitors, and suggest that cognitive capacities following neurodegenerationare not entirely lost, but merely impaired by this epigenetic blockade.
Correspondence and requests for materials should be addressed to L-HT ([email protected]).. *corresponding author: [email protected].
AUTHOR CONTRIBUTION This study was designed by JG and L-HT, and directed and coordinated by L-HT. JG planned andperformed the in vitro, CK-p25, 5xFAD and Cdk5cKO mouse and human in vivo biochemical characterization, and the behavioralexperiments. DR planned and contributed to the in vitro and CK-p25 in vivo experiments, generated the GR526 and the shRNAconstructs, and contributed to the stereotaxic injections. JSG initiated and contributed to the CK-p25 and the 5xFAD biochemicalcharacterization, and performed the HDAC2-/- experiments. WYW generated the luciferase constructs. JS performed theelectrophysiological experiments. KMH, TJFN, DF, and SJH characterized the shRNA constructs. MK contributed to the qRT-PCRexperiments and performed the quantification of the human data. SCS performed the site-directed mutagenesis. AS contributed to theimmunohistochemistry and the qRT-/qPCR experiments. NJ contributed to the behavioral and qRT-/qPCR experiments. PFK and IDprovided the human samples and contributed to the optimization of their staining. The manuscript was written by JG and L-HT, andcommented on by all authors.
The authors declare no competing financial interests.
NIH Public AccessAuthor ManuscriptNature. Author manuscript; available in PMC 2012 November 15.
Published in final edited form as:Nature. ; 483(7388): 222–226. doi:10.1038/nature10849.
$waterm
ark-text$w
atermark-text
$waterm
ark-text
Long-lasting forms of memories require stable gene expression changes3, which are in partorchestrated by chromatin-templated epigenetic processes4. Of the epigenetic modificationsidentified to date in the nervous system, histone acetylation has been unequivocallyassociated with facilitating learning and memory4. Acetylation diminishes the electrostaticaffinity between neighboring histones and the DNA and, as a consequence, can promote amore open chromatin structure that allows for memory-related gene transcription5.
Over the past decade, several studies have reported sporadic cases of reduced histoneacetylation in animal models of neurodegeneration that are characterized by cognitivedecline, including models of AD4. Accordingly, pharmacological treatments aimed atincreasing histone acetylation have shown promising results in reversing cognitive deficitsin some of these models, predominantly by the use of non-selective HDAC inhibitors6.However, the causative agent of such memory-impairing histone acetylation changes, and,hence, the best targets for pharmacological strategies, remain unknown. One likelycandidate is HDAC2, a class I HDAC that negatively regulates memory and synapticplasticity in the healthy mouse brain7, 8.
To investigate whether HDAC2 mediates cognitive deficits associated withneurodegeneration, we measured its abundance in CK-p25 mice9, 10, which inducibly andforebrain-specifically overexpress p25, a truncated version of p35. p25 aberrantly activatescyclin-dependent kinase 5 (Cdk5), and is implicated in various neurodegenerativediseases11, including AD12. Following six weeks of p25 induction, CK-p25 mice displayAD-related pathologies such as neuronal loss9, β-amyloid accumulation10, reactiveastrogliosis9, and reduced synaptic density13, most prominently in the hippocampus and thecortex, two brain areas important for memory formation and storage, respectively14.Accordingly, six-week-induced CK-p25 (hereafter referred to as CK-p25) mice also displayspatial and associative memory deficits13.
Using immunohistochemistry and western blot analysis (WB), we found that HDAC2 wassignificantly increased in neuronal nuclei in hippocampal area CA1 in CK-p25 micecompared to control littermates (Fig. 1a, d, e; see Supplementary Fig. 2a for a specificitycontrol for the HDAC2 signal). No changes in HDAC2 were observed in hippocampal areaCA3 or the dentate gyrus (Supplementary Fig. 3a, b), explaining the overall marginalincrease in the entire hippocampus. Interestingly, this effect appears to be non cell-autonomous, as both p25-positive and p25-negative cells displayed elevated HDAC2. Incontrast, levels of the structurally highly-related HDAC1, and of HDAC3, another class IHDAC involved in memory formation15, were not changed (Fig. 1b, c). Furthermore,HDAC2 was also increased in the prefrontal cortex of CK-p25 mice (Supplementary Fig. 4),whereas in the amygdala, a brain area not affected by neurodegeneration in the CK-p25mice, its levels remained unchanged (Supplementary Fig. 3c). This neurodegeneration-associated increase of HDAC2 was confirmed in another mouse model of AD-relatedpathologies and cognitive decline, the 5xFAD mouse16, 17 (Supplementary Fig. 5).
Next, we aimed to determine the functional consequences of elevated HDAC2. SinceHDAC2 has been shown to associate with the promoter region of genes involved in memoryand synaptic plasticity7, we hypothesized that it is enriched at these genes followingneurodegeneration. Of the known HDAC2 targets7, we focused on those that, in severalindependent studies, had been demonstrated to be downregulated in the human AD brain(Supplementary Table 1). These include the immediate-early genes Arc, Bdnf exons I, II,and IV, Egr1, Homer1, and Cdk5, implicated in learning and memory, and genes related tosynaptic plasticity such as the glutamate receptor subunits GluR1, GluR2, NR2A, andNR2B, as well as Nfl (neurofilament light chain), Svp (synaptophysin) and Stg(synaptotagmin). Using chromatin immunoprecipitation (ChIP, for primers see
Gräff et al. Page 2
Nature. Author manuscript; available in PMC 2012 November 15.
$waterm
ark-text$w
atermark-text
$waterm
ark-text
Supplementary Table 2), we found that HDAC2 is significantly enriched at these genes inthe CK-p25 hippocampus, the exception being the promoter regions of the activity-dependent Bdnf exons I and II18, and the housekeeping genes β-actin, β-globin and β-tubulin (Fig. 1f). In contrast, binding of HDAC1 and HDAC3 was unaltered (SupplementaryFig. 6a, b). Interestingly, HDAC2 binding was not restricted to the promoter, as we alsofound HDAC2 more abundantly bound to the coding sequence of the same genes(Supplementary Fig. 7 and Supplementary Table 3 for primer sequences), in agreement withprevious reports showing that HDAC2 can also bind to a gene’s coding region19.
We next assessed the acetylation of several histone (H) residues in the promoter region ofthese genes, for which acetylation has been shown to be important for learning, memory,and synaptic plasticity, such as H2B lysine (K) 5, H3K14, H4K5, and H4K124. ChIPanalyses revealed a hypoacetylation for all residues at the neuroplasticity genes, (Fig. 1g,Supplementary Fig. 6c-e), albeit to different extents. Importantly, the acetylation ofhousekeeping genes was not altered. The effects of elevated HDAC2 levels appear to berestricted to histones, as we found no acetylation changes on other proteins regulated by thismodification, such as tau, p53, and tubulin, nor in overall nuclear or cytoplasmic proteinacetylation (Supplementary Fig. 8).
Next, to determine the functional consequences of promoter hypoacetylation, we assessedthe binding of activated (i.e., phosphorylated) RNA Polymerase II (RNA Pol II), and foundit to be markedly reduced (Fig. 1h). This prompted us to measure the mRNA expression ofthese genes by quantitative RT-PCR (primers in Supplementary Table 4). We found reducedexpression for all genes with elevated HDAC2 binding and a concomitant decrease inhistone acetylation and RNA Pol II binding (Fig. 1i). Of note, HDAC2 likely acts togetherwith the transcriptional repressor complexes CoREST, NuRD, and Sin3, as we foundincreased association of HDAC2 with these complexes in hippocampal CK-p25 extracts byco-immunoprecipitation (Supplementary Fig. 9). Taken together, these results indicate thatHDAC2 mediates a local chromatin compaction of neuroplasticity genes, which decreasestheir expression and may contribute to cognitive decline during neurodegeneration.
To causally examine such a scenario, we generated adeno-associated viral (AAV) vectorscarrying either short-hairpin RNAs (shRNAs) directed against HDAC2 or scrambled controlshRNAs (Supplementary Fig. 10a, b). The knockdown efficiency of the shRNAs in culturewas about 25 - 30% (Supplementary Fig. 10c-f), ideally suited for the targeted normalizationof the 20 - 50% increase of HDAC2 in the CK-p25 mice. We injected these vectorsbilaterally into hippocampal area CA1 of two-week-induced CK-p25 and control mice, andassessed HDAC2 levels four weeks following viral injection (Supplementary Fig. 10g). CK-p25 animals injected with an shRNA against HDAC2 (CK-p25, shHDAC2) showed reducedHDAC2 levels compared to CK-p25 animals injected with control scrambled shRNA (CK-p25, scr), indistinguishable from control mice injected with scrambled shRNA (CON, scr)(Fig. 2a, b). Protein levels of HDAC1 and HDAC3 remained unchanged (SupplementaryFig. 11). We observed transduction efficiencies of 53 - 61% (mean ± s.e.m., 57.4 ± 2.5;n=3-4 mice per group) and comparable infection rates in both control and CK-p25hippocampi (Supplementary Fig. 10h).
Next, we sought to determine whether reducing HDAC2 would alter the promoter histoneacetylation and mRNA expression of neuroplasticity genes. We found that H4K12acetylation was significantly enhanced on most of these genes, the majority of which alsoshowed increased expression (Fig. 2c, d). Importantly, most of these genes showedcomparable, or even higher, expression in CK-p25, shHDAC2 mice compared to CON, scranimals.
Gräff et al. Page 3
Nature. Author manuscript; available in PMC 2012 November 15.
$waterm
ark-text$w
atermark-text
$waterm
ark-text

Based on these findings, we investigated whether such regained chromatin andtranscriptional plasticity might translate into morphological and physiological changes in thesurviving neurons. To this end, we measured synaptic density by Svpimmunohistochemistry, labeling the presynaptic terminals of functional synapses, anddendritic abundance by microtubule-associated protein 2 (MAP2) immunoreactivity. Wefound that, whereas Svp and MAP2 were reduced in the stratum radiatum of CK-p25, scranimals (as previously described for CK-p25 mice13, 20), their abundance was markedlyincreased in CK-p25, shHDAC2 animals, to levels comparable to CON, scr animals (Fig.2e-g). Interestingly, however, the number of surviving neurons, as evidenced by NeuNimmunohistochemistry, was not altered by HDAC2 reduction (Supplementary Fig. 12).Then, we measured synaptic plasticity by electrophysiological recordings and observed thatlong-term potentiation (LTP) in CA1 neurons was undistinguishable between CK-p25,shHDAC2 and CON, scr animals, but significantly improved over CK-p25, scr animals. Asimilar effect was observed for basal synaptic plasticity (Supplementary Fig. 13). Together,these data indicate that, although HDAC2 normalization did not impact neuronal survival, itdid reinstate morphological and synaptic plasticity in the surviving neurons.
We hypothesized that the reduction of HDAC2 would also counteract the cognitive deficitsassociated with neurodegeneration. For this, we assessed associative and spatial memory ona fear-conditioning and water maze task, respectively, two types hippocampus-dependentmemory that are severely perturbed in CK-p25 animals13. We observed that associativememory of CK-p25, shHDAC2 animals returned to levels of CON, scr animals (Fig. 2h).Likewise, CK-p25, shHDAC2 animals showed significantly reduced escape latenciescompared to CK-p25, scr animals during training in the water maze (Fig. 2i) and, 24h later,they spent significantly more time in the target quadrant, indistinguishable from theperformance of CON, scr mice (Fig. 2j). Overall, swimming behavior was similar betweenthe different groups (Supplementary Fig. 14a, b), and altering HDAC2 levels per se did notaffect locomotor activity or anxiety as assessed by an open field test (Supplementary Fig.14c-f). Together, these results suggest that elevated HDAC2 levels are causally involved inthe cognitive decline associated with neurodegeneration in CK-p25 mice, but that theprevention of HDAC2 upregulation rescues memory capacities.
To gain insight into the mechanisms underlying the increase in HDAC2, we exposedprimary hippocampal neurons to neurotoxic stimuli characteristic of AD-relatedneurodegeneration, hydrogen peroxide (H2O2) and amyloid-β (Aβ) oligomers21, 22. Asrevealed by immunocytochemistry and WB, treatment with either H2O2 or Aβ1-42, but notcontrol Aβ42-1, oligomers was sufficient to increase HDAC2 (Fig. 3a-d, left panels;Supplementary Fig. 15a-d). Importantly, both neurotoxic stimuli increased Hdac2 at themRNA level (Fig. 3e), and increased Hdac2 transcription was also evident in the CK-p25hippocampus (Fig. 3f), suggesting the involvement of transcriptional mechanisms.
This prompted us to screen the Hdac2 promoter for potential binding sites of transcriptionalregulators. Using transcription factor binding databases23, we found a well-conservedrecognition element for the glucocorticoid receptor 1 (GR1) in the proximal promoter regionof Hdac2 (Fig. 3g). GRs are activated by phosphorylation following behavioral or cellularstress and, upon binding to the glucocorticoid responsive element (GRE) in a gene’spromoter region, GRs can act as transcriptional activators or repressors, depending, in part,on the residue phosphorylated24. Of the known phosphorylation sites, serine (S) 211 hasbeen robustly associated with activated forms of GR125.
Based on this knowledge, we examined whether S211 phosphorylation on GR1 wasincreased following neurotoxic insults in vitro, and in the CK-p25 brain in vivo.Immunocytochemical labeling and WB of cultured hippocampal neurons following H2O2
Gräff et al. Page 4
Nature. Author manuscript; available in PMC 2012 November 15.
$waterm
ark-text$w
atermark-text
$waterm
ark-text
and Aβ1-42 treatment revealed a significantly increased phosphorylation of GR1 on S211(PGR1) compared to control conditions (Fig. 3a-d, right panels, Supplementary Fig. 15a-d,see Supplementary Fig. 2b for anti-PGR1S211 specificity). Furthermore, the CK-p25hippocampus showed similarly increased PGR1 levels (Fig. 3h, i, Supplementary Fig. 16).Remarkably, we observed that the increase of PGR1 occurred concurrently with that ofHDAC2 following neurotoxicity (Fig. 3a, c, i, j) and, using forebrain extracts of conditionalCdk5 knock-out (Cdk5cKO) and control mice26, we identified Cdk5 as a PGR1 kinase invivo (Fig. 3k).
We then sought to determine whether GR1 phosphorylation increases Hdac2 transcription.We first examined the binding of PGR1 to the Hdac2 promoter by PGR1-ChIP and primerpairs (Supplementary Table 2) spanning a region from −1000bp to +300bp around theHdac2 transcriptional start site (Fig. 3l, top). We found that PGR1 binding to the Hdac2-GRE was significantly increased in the CK-p25 hippocampus (Fig. 3l, bottom). Similarresults were obtained following Aβ1-42 treatment of primary hippocampal cultures(Supplementary Fig. 15e). Second, to determine whether GR1 is directly capable oftranscriptionally activating Hdac2, we cloned the Hdac2 promoter with and without the GREinto a luciferase construct and tested its activity in CAD cells, a primary neuron-like cellline. We found that the presence of the GRE alone increased the luciferase activity byapproximately 3-fold but that, upon the addition of a constitutively active form of GR,GR526 (see Methods), this activity was further doubled. However, without the Hdac2-GRE,the addition of GR526 had no effect (Supplementary Fig. 17). Importantly, we found that theHdac2-GRE also responds to neurotoxic stimuli. When CAD cells were treated with eitherH2O2 or Aβ1-42, luciferase activity was significantly increased, but only with the GREpresent (Fig. 3m, orange bars). Furthermore, the capability of GR to activate Hdac2critically depends upon its phosphorylation. When S211 was mutated to alanine(GRS211A), GR was no longer capable of activating Hdac2 in vitro (Fig. 3n). Thisdependency on S211 phosphorylation also occurs in vivo, as Cdk5cKO forebrain extracts26
had reduced PGR1 and HDAC2 levels (Fig. 3k). Taken together, these results suggest thatAD-related neurotoxic stimuli lead to an increase in Hdac2 gene transcription bymechanisms involving GR activation and interaction with the Hdac2-GRE.
Lastly, to assess the relevance of these findings in humans, we compared HDAC2abundance in post-mortem brain samples from patients with varying degrees of non-familialAD, the most common form of neurodegeneration-associated dementia worldwide27. Thecases used here (Supplementary Table 5) are defined by the Braak and Braak (BB) stages28,which are characterized by the accumulation of hyperphosphorylated tau protein in thecortices (Supplementary Fig. 18), and by increasing neurodegeneration28 and cognitiveimpairment29. We found that, in all AD-related BB stages, HDAC2 was significantlyelevated in hippocampal area CA1 (Fig. 4a, d) and the entorhinal cortex (SupplementaryFig. 19a, d), which are the earliest and most affected brain areas in AD2 and crucial formemory formation and storage14. HDAC2 accumulation was visible beginning at BB stageI/II, implicating it as an early event in the progress of AD. In contrast, levels of HDAC1 andHDAC3 were not altered (Fig. 4b, c, e, f; Supplementary Fig. 19b, c, e, f). Thus, elevatedlevels of HDAC2 may also accompany the cognitive decline of the humanneurodegenerating brain.
The findings presented in this study describe that epigenetic mechanisms substantiallycontribute to the cognitive decline associated with AD-related neurodegeneration. While it iswell documented that neuronal loss and Aβ- or tau-induced neurotoxicity acutely disablesynaptic functions, in turn leading to cognitive deficits1, 2, 30, the HDAC2-mediatedepigenetic blockade of neuroplasticity-related gene expression could delineate a process bywhich memory functions become permanently impaired in the AD brain (Supplementary
Gräff et al. Page 5
Nature. Author manuscript; available in PMC 2012 November 15.
$waterm
ark-text$w
atermark-text
$waterm
ark-text

Fig. 1a). This blockade appears to be induced by GR1; thus, GRs may function as molecularmediators between neurodegeneration-associated neurotoxic stressors and cognitiveimpairment (Supplementary Fig. 1b).
Intriguingly, our findings may also provide a potential explanation, at least in part, as towhy, in some clinical trials, cognitive impairments in AD patients persist despite successfulAβ clearance27: Once the epigenetic blockade is in place, reducing Aβ generation anddeposition alone may not be sufficient to rescue against cognitive dysfunction. A moreefficacious strategy may therefore lie in the combination of Aβ reduction with the inhibitionof HDAC2. By extension, these findings pinpoint HDAC2 as the likely target of non-selective HDAC inhibitors that counteract cognitive decline in AD mouse models6 and, as aresult, strongly advocate for the development of HDAC2-selective inhibitors. Finally, ourfinding that HDAC2 inhibition likely re-instates transcriptional, morphological, and synapticplasticity in the surviving neurons of the neurodegenerating brain raises hope that suchplasticity is not irrevocably lost, but merely constrained by the epigenetic blockade.
METHODSHuman material
Human material was obtained from the Massachusetts Alzheimer Disease Research Centerat Massachusetts General Hospital (protocol number 2004-P-001613/4) and from the BostonMedical Center (H-24454) with informed consent by all donors. Hippocampal blocks (at thelevel of the lateral geniculate nucleus) were fixed in paraformaldehyde, paraffin-embeddedand sectioned at 10μm thickness. Following antigen retrieval (Biogenex), brain slices wererehydrated using xylene/ethanol, blocked with 5% milk serum in TBS (pH 7.4) at roomtemperature and incubated at 4°C overnight in TBS containing 5% milk-serum in thefollowing antibodies: amyloid-β, tau (Dako), HDAC1, HDAC2 (Abcam), or HDAC3 (CellSignaling). Next, they were washed in PBS (pH 7.4), incubated in HRP-conjugatedsecondary antibodies (Biogenex) and visualized with DAB (Biogenex). Slides werecounterstained with hematoxylin and dehydrated with ethanol/xylene. Images werequantified by an experimenter blind to BB stages using ImageJ 1.42q.
Animal modelsAll mouse work was approved by the Committee for Animal Care of the Division ofComparative Medicine at MIT. Adult (3-6 months old) male double transgenic CK-p25mice9, 10, 13, 6-month old male transgenic 5xFAD mice16, and 3-4 month-old Cdk5cKOmice26 and their respective control littermates were used for the experiments unlessotherwise noted; for CK-p25 mice, all behavioral experiments took place between 6-8 weeksof p25 induction, the time when cognitive deficits are first visible13. Behavioral experimentswere conducted blindly and essentially as described13. Open field behavior was monitoredusing the VersaMax system (Accuscan) during 20min. For fear conditioning, mice were putin the conditioning chamber (TSE systems) for 3min, after which they received a one-time2s footshock (0.8mA). Animals were then left in the box for another 30s. 24h later, the micewere put into the same box and their freezing behavior was scored during 3min. For thewater maze that took place in a round tank (1.2m in diameter) filled with white opaquewater, mice were first habituated to the task with the platform being visible for two trials.During habitation and the acquisition phase, mice were allowed to swim for 60s or until thereached the platform (monitored by HVS Image). Animals that did not reach the platformafter 60s were gently guided towards it; all animals were allowed to remain on the platformfor 15s. For testing, mice were put back into the water without the platform 24h after thatlast training session, from a starting position different of the last starting position during theacquisition phase, and their time spent in each quadrant was recorded (HVS Image).
Gräff et al. Page 6
Nature. Author manuscript; available in PMC 2012 November 15.
$waterm
ark-text$w
atermark-text
$waterm
ark-text

ElectrophysiologyTo record field excitatory postsynaptic potentials, transverse hippocampal slices wereprepared from CON, scr, CK-p25, scr and CK-p25, shHDAC2 mice. In brief, the brain wasrapidly removed and transferred to ice-cold, oxygenated (95% O2 and 5% CO2) cuttingsolution containing 211mM sucrose, 3.3mM KCl, 1.3mM NaH2PO4, 0.5mM CaCl2, 10mMMgCl2, 26mM NaHCO3 and 11mM glucose. Hippocampal slices were cut with a VT1000Svibratome (Leica) and transferred for recovery to a holding chamber containing oxygenatedartificial cerebrospinal fluid consisting of 124mM NaCl, 3.3mM KCl, 1.3mM NaH2PO4,2.5mM CaCl2, 1.5mM MgCl2, 26mMNaHCO3 and 11mM glucose at 28-30°C for at least 1hbefore recording. CA1 field potentials evoked by Schaffer collateral stimulation weremeasured. After recording of a stable baseline (at least 20 min), LTP was induced by fourepisodes of theta burst stimulation (TBS) with 10s intervals. TBS consisted of ten bursts(each with four pulses at 100Hz) of stimuli delivered every 200ms. Recordings wereperformed using an AM-1800 Microelectrode amplifier (A-M systems) and a Digidata1440A A-D converter (Axon Instruments). All data were digitized and analyzed by the useof pClamp10 software (Axon Instruments). Basal synaptic input/output relationship wasobtained by plotting fEPSP slopes against stimulation intensities. All experiments wereperformed by an experimenter blind to treatment groups.
In vitro studiesPrimary mouse hippocampal neuronal cultures (DIV 14-17) were treated with sense andantisense Aβ oligomers (1μM, Bachem) for 24h or H2O2 (50μM, Mallinckrodt Chemicals,removed after 5min, and assessed 8h later) unless otherwise noted and mRNA and proteinsextracted using Qiagen’s Allprep kit. For ChIP experiments, cortical cultures (DIV10-14)were used.
Dual luciferase assays were conducted on CAD cells31 (ATCC) that were transfected usinglipofectamine (Invitrogen) with 0.5μg of the proximal promoter region of HDAC2containing the GRE consensus sequence (CAAGAAGAAAGTGGCTAC) or with theproximal promoter region without the GRE sequence subcloned into the pGL3 reportervector (Promega) according to the manufacturer’s instructions. Cells were cotransfectedwith 0.05μg of the constitutively active form of GR32, GR526, or GRS211A, and treatedwith 1μM Aβ1-42 oligomers or with 50μM H2O2.
For site-directed mutagenesis, the cDNA for the full-length human glucocorticoid receptor(Addgene) was used and serine 211 was replaced by alanine using the QuickChangeLightning Kit (Agilent Technologies) as per the manufacturer’s instructions. All constructswere verified by sequencing (Genewiz). The following mutagenesis primers were used:
5′-GTAAAGAGACGAATGAGGCTCCTTGGAGATCAGACC-3′ (forward)
5′-GGTCTGATCTCCAAGGAGCCTCATTCGTCTCTTTAC-3′ (reverse).
Immunohistochemistry (IHC) and immunocytochemistry (ICC)ICC and mouse IHC were performed as described7. ICC and IHCs on different experimentalconditions were performed with the same antibody solution at the same time to assureidentical staining conditions. A negative (i.e., no antibody) control was includedsimultaneously. In brief, for IHC, mice were perfused with 10% paraformaldehyde underdeep anesthesia (ketamine, xylazine) and their brains sectioned at 0.35μm thickness using avibratome (Leica). For ICC, cells were fixed using 4% paraformaldehyde. Slices/cells werepermeabilized with 0.1% Triton X-100, blocked and incubated overnight with 0.1% TritonX-100/10% fetal bovine serum in PBS containing primary antibodies: HDAC1, HDAC2
Gräff et al. Page 7
Nature. Author manuscript; available in PMC 2012 November 15.
$waterm
ark-text$w
atermark-text
$waterm
ark-text

(Abcam), HDAC3 (Cell Signaling), phospho-GR1 (S211) (Cell Signaling), GR (Abcam), orGFP (Aves Labs). Primary antibodies were visualized with Alexa-Fluor 488, Cy3 and Cy5antibodies (Molecular Probes), neuronal nuclei with Hoechst 33342 (Invitrogen). Note thatfor staining of shRNA-injected animals, mCherry was visualized without staining, and onlyCy2 and Cy5 secondary antibodies were used. Images were acquired using a confocalmicroscope (LSM 510, Zeiss) at identical settings at the highest intensity for each of theconditions. Images were quantified using ImageJ 1.42q by an experimenter blind totreatment groups, whenever possible. Per experimental condition, 20-40 representative cellswere analyzed, and the mean signal intensity was measured. To assess the specificity of theHDAC2 immunostaining, adult HDAC2-/- mice were used as previously described7. For aspecificity control of the PGR1 antibody, Calf Intestine Phosphatase (CIP) (New EnglandBiolabs) treatment on ICC slides was performed as described previously33. CIP or H2O wereapplied for 40min in Buffer 3 (New England Biolabs).
Molecular analysesWestern blots, co-immunoprecipitation (Co-IP), chromatin immunoprecipitation (ChIP), andgene expression analyses were performed as described elsewhere34 with the followingmodifications, and expressed as fold change of the respective control conditions. ForWestern blots, proteins were extracted using 1x RIPA buffer containing proteinase(complete, Roche) and phosphatase inhibitors (1mM β-glycerophosphate, 10mM NaF,0.1mM Na3VO4), transferred onto PVDF membranes (Biorad) and stripped using strippingbuffer (Thermo Scientific). The following primary antibodies were used: Acetyl-K (CellSignaling), α- and β-tubulin, β-actin (Sigma), Cdk5 (Santa Cruz), HDAC1, HDAC2(Abcam), HDAC3, Phospho-GR1 (S211) (Cell Signaling), GR1 (Abcam), p53 (CellSignaling), or tau (Invitrogen). Secondary antibodies were HRP-linked (GE Healthcare).Signal intensities were quantified using ImageJ 1.42q and normalized to values of β-actin,α- or β-tubulin. Phospho-GR1 was first normalized to GR1. 3-8 animals were used percondition. Cytoplasmic and nuclear fractionation was performed as described elsewhere34.
For Co-IP, hippocampal lysates were incubated with HDAC2 (Abcam) or IgG (Sigma) andthe immunoprecipitated extracts probed for mSin3A, MTA2 (Abcam), CoRest (Millipore),LSD1 (Cell Signaling), or HDAC2. Signal intensities were quantified using ImageJ 1.42q,and normalized to input. 3-4 animals were used per condition.
For ChIP, tissue samples were homogenized in cell lysis buffer containing proteinase(complete, Roche) and phosphatase inhibitors (1mM β-glycerophosphate, 10mM NaF,0.1mM Na3VO4) and chromatin was sonicated using a Branson Digital Sonifier with 10rounds of 15s at 25% power per sample on ice to 200-400bp in length. For ChIP of primarycortical cultures, approximately 1×10⁶ cells were crosslinked in 37% formaldehyde (Sigma),quenched with 20× glycine (Sigma), washed with PBS and cell lysis buffer containing bothphosphatase and proteinase inhibitors (Roche) and sonicated in nuclear lysis buffer using aVibra Cell Sonifier with 3× 3 pulses of 5s at 35% power (50% duty) on ice. Shearedchromatin was immunoprecipitated with antibodies against HDAC1, HDAC2 (Abcam),HDAC3 (Santa Cruz), acetyl H2BK5, acetyl H3K14 (Abcam), acetyl H4K5, acetyl H4K12(Millipore), phospho-GR1 (S211) (Cell Signaling), or phospho-RNA Pol II (Abcam). DNAwas extracted by phenol/chloroform/isoamyl alcohol (American Bioanalytical) andsubjected to quantitative PCR (Biorad Thermal Cycler) using primers specific to thepromoter regions of the genes assayed (see Supplementary Table 2 and 3 for primersequences). The fluorescent signal of the amplified DNA (SYBR green, Biorad) wasnormalized to input. 4-8 samples were used per condition.
For gene expression analysis, mRNA was extracted (Qiagen), reverse-transcribed(Invitrogen) and quantitatively amplified on a thermal cycler (Biorad) using SYBR green
Gräff et al. Page 8
Nature. Author manuscript; available in PMC 2012 November 15.
$waterm
ark-text$w
atermark-text
$waterm
ark-text

(Biorad) and gene-specific primers (see Supplementary Table 4). The comparative Ctmethod35 was used to examine differences in gene expression. Values were normalized toexpression levels of Gapdh. 4-8 samples were used per condition.
Experimental manipulationsFor validation of the knockdown efficacy of HDAC2 RNAi in neurons, short hairpinstargeting the open reading frame of mouse Hdac2 mRNA from the Broad Institute’s RNAiconsortium shRNA library (www.broadinstitute.org/rnai/trc/lib) were packaged intolentiviral vectors36 and used to infect dissociated primary mouse embryonic (gestation day18) cortical cultures, prepared as described7. Primary cultures were infected at DIV4. Cellswere harvested ten days after infection, and protein levels were measured by westernblotting. The target sequences for the two effective shRNAs areCCCAATGAGTTGCCATATAAT (HDAC2 shRNA 2-1, TRCN0000039395) andCGAGCATCAGACAAACGGATA (HDAC2 shRNA 2-4, TRCN0000039397).
After validation, scramble shRNA37 or HDAC2-shRNA constructs were subcloned underthe CaMKII-U6 promoter into the pAAV entry vector fused to mCherry, tested again inmouse primary hippocampal cultures (DIV7), and high titer (1-4×10¹² viral particles) adeno-associated viruses (AAV, serotype 2.5) were produced at the University of North CarolinaVector Core facility. 1μl of shRNA-containing AAV was stereotaxically injected intohippocampal area CA1 (anterior-posterior position −2.0mm, medial-lateral position±1.6mm, dorso-ventral −1.5mm from Bregma) of both hemispheres at 0.1μl/min. Injectionneedles were left in place 5min after injection to assure even distribution of the virus.Injections were performed 4 weeks before behavioral testing. All infusion surgeries wereperformed under aseptic conditions and anesthesia (ketamine/xylazine) in accordance withthe Massachusetts Institute of Technology’s Division of Comparative Medicine guidelines.
StatisticsStatistical analyses were performed using GraphPad Prism 5. One-way ANOVAs followedby Tukey post-hoc tests, or one-tailed Student’s t-tests were used unless otherwise indicated.All data are represented as mean ± s.e.m. Statistical significance was set at p≤0.05.
Supplementary MaterialRefer to Web version on PubMed Central for supplementary material.
AcknowledgmentsWe thank Alison Mungenast, Stephanie Jemielity, Ram Madabushi, Froylan Calderon de Anda, and Meryl Horn forcareful reading of the manuscript, A.M. for manuscript editing, Mali Eichler for mouse colony maintenance,Karlotta Fitch for sectioning the human brain samples, and M.H. for quantification of Fig. 2a. This work waspartially supported by the Stanley Medical Research Institution (SJH, L-HT), NIH/NIDA (RO1DA028301, SJH)and NIH/NINDS (RO1NS078839, L-HT). JG was supported by a Bard Richmond fellowship and by the SwissNational Science Foundation, WYW by the Simons Foundation, MK by the Theodor und Ida Herzog-Eglifoundation. L-HT is an investigator of the Howard Hughes Medical Institute.
REFERENCES1. Walsh DM, Selkoe DJ. Deciphering the molecular basis of memory failure in Alzheimer’s disease.
Neuron. 2004; 44:181–93. [PubMed: 15450169]
2. Holtzman DM, Morris JC, Goate AM. Alzheimer’s disease: the challenge of the second century. SciTransl Med. 2011; 3:77sr1. [PubMed: 21471435]
3. Kandel ER. The molecular biology of memory storage: a dialogue between genes and synapses.Science. 2001; 294:1030–8. [PubMed: 11691980]
Gräff et al. Page 9
Nature. Author manuscript; available in PMC 2012 November 15.
$waterm
ark-text$w
atermark-text
$waterm
ark-text
4. Gräff J, Kim D, Dobbin MM, Tsai LH. Epigenetic regulation of gene expression in physiologicaland pathological brain processes. Physiol Rev. 2011; 91:603–49. [PubMed: 21527733]
5. Brownell JE, Allis CD. Special HATs for special occasions: linking histone acetylation to chromatinassembly and gene activation. Curr Opin Genet Dev. 1996; 6:176–84. [PubMed: 8722174]
6. Kazantsev AG, Thompson LM. Therapeutic application of histone deacetylase inhibitors for centralnervous system disorders. Nat Rev Drug Discov. 2008; 7:854–68. [PubMed: 18827828]
7. Guan JS, et al. HDAC2 negatively regulates memory formation and synaptic plasticity. Nature.2009; 459:55–60. [PubMed: 19424149]
8. Akhtar MW, et al. Histone deacetylases 1 and 2 form a developmental switch that controlsexcitatory synapse maturation and function. J Neurosci. 2009; 29:8288–97. [PubMed: 19553468]
9. Cruz JC, Tseng HC, Goldman JA, Shih H, Tsai LH. Aberrant Cdk5 activation by p25 triggerspathological events leading to neurodegeneration and neurofibrillary tangles. Neuron. 2003;40:471–83. [PubMed: 14642273]
10. Cruz JC, et al. p25/cyclin-dependent kinase 5 induces production and intraneuronal accumulationof amyloid beta in vivo. J Neurosci. 2006; 26:10536–41. [PubMed: 17035538]
11. Cruz JC, Tsai LH. A Jekyll and Hyde kinase: roles for Cdk5 in brain development and disease.Curr Opin Neurobiol. 2004; 14:390–4. [PubMed: 15194121]
12. Patrick GN, et al. Conversion of p35 to p25 deregulates Cdk5 activity and promotesneurodegeneration. Nature. 1999; 402:615–22. [PubMed: 10604467]
13. Fischer A, Sananbenesi F, Pang PT, Lu B, Tsai LH. Opposing roles of transient and prolongedexpression of p25 in synaptic plasticity and hippocampus-dependent memory. Neuron. 2005;48:825–38. [PubMed: 16337919]
14. Frankland PW, Bontempi B. The organization of recent and remote memories. Nature ReviewsNeuroscience. 2005; 6:119–130.
15. McQuown SC, et al. HDAC3 is a critical negative regulator of long-term memory formation. JNeurosci. 2011; 31:764–74. [PubMed: 21228185]
16. Oakley H, et al. Intraneuronal beta-amyloid aggregates, neurodegeneration, and neuron loss intransgenic mice with five familial Alzheimer’s disease mutations: potential factors in amyloidplaque formation. J Neurosci. 2006; 26:10129–40. [PubMed: 17021169]
17. Kimura R, Devi L, Ohno M. Partial reduction of BACE1 improves synaptic plasticity, recent andremote memories in Alzheimer’s disease transgenic mice. J Neurochem. 2010; 113:248–61.[PubMed: 20089133]
18. Lauterborn JC, et al. Differential effects of protein synthesis inhibition on the activity-dependentexpression of BDNF transcripts: evidence for immediate-early gene responses from specificpromoters. J Neurosci. 1996; 16:7428–36. [PubMed: 8922398]
19. Sun JM, Chen HY, Davie JR. Differential distribution of unmodified and phosphorylated histonedeacetylase 2 in chromatin. J Biol Chem. 2007; 282:33227–36. [PubMed: 17827154]
20. Fischer A, Sananbenesi F, Wang XY, Dobbin M, Tsai LH. Recovery of learning and memory isassociated with chromatin remodelling. Nature. 2007; 447:178–82. [PubMed: 17468743]
21. Markesbery WR, Carney JM. Oxidative alterations in Alzheimer’s disease. Brain Pathol. 1999;9:133–46. [PubMed: 9989456]
22. Yankner BA. Mechanisms of neuronal degeneration in Alzheimer’s disease. Neuron. 1996;16:921–32. [PubMed: 8630250]
23. Sandelin A, Alkema W, Engstrom P, Wasserman WW, Lenhard B. JASPAR: an open-accessdatabase for eukaryotic transcription factor binding profiles. Nucleic Acids Res. 2004; 32:D91–4.[PubMed: 14681366]
24. Chrousos GP, Kino T. Glucocorticoid signaling in the cell. Expanding clinical implications tocomplex human behavioral and somatic disorders. Ann N Y Acad Sci. 2009; 1179:153–66.[PubMed: 19906238]
25. Kino T, et al. Cyclin-dependent kinase 5 differentially regulates the transcriptional activity of theglucocorticoid receptor through phosphorylation: clinical implications for the nervous systemresponse to glucocorticoids and stress. Mol Endocrinol. 2007; 21:1552–68. [PubMed: 17440046]
Gräff et al. Page 10
Nature. Author manuscript; available in PMC 2012 November 15.
$waterm
ark-text$w
atermark-text
$waterm
ark-text

26. Guan JS, et al. Cdk5 Is Required for Memory Function and Hippocampal Plasticity via the cAMPSignaling Pathway. PLoS One. 2011; 6:e25735. [PubMed: 21984943]
27. Citron M. Alzheimer’s disease: strategies for disease modification. Nat Rev Drug Discov. 2010;9:387–98. [PubMed: 20431570]
28. Braak H, Braak E. Diagnostic criteria for neuropathologic assessment of Alzheimer’s disease.Neurobiol Aging. 1997; 18:S85–8. [PubMed: 9330992]
29. Grober E, et al. Memory and mental status correlates of modified Braak staging. Neurobiol Aging.1999; 20:573–9. [PubMed: 10674422]
30. Palop JJ, Mucke L. Amyloid-beta-induced neuronal dysfunction in Alzheimer’s disease: fromsynapses toward neural networks. Nat Neurosci. 2009; 13:812–8. [PubMed: 20581818]
31. Qi Y, Wang JK, McMillian M, Chikaraishi DM. Characterization of a CNS cell line, CAD, inwhich morphological differentiation is initiated by serum deprivation. J Neurosci. 1997; 17:1217–25. [PubMed: 9006967]
32. Li L, Lindquist S. Creating a protein-based element of inheritance. Science. 2000; 287:661–4.[PubMed: 10650001]
33. Xie Z, Sanada K, Samuels BA, Shih H, Tsai LH. Serine 732 phosphorylation of FAK by Cdk5 isimportant for microtubule organization, nuclear movement, and neuronal migration. Cell. 2003;114:469–82. [PubMed: 12941275]
34. Koshibu K, et al. Protein phosphatase 1 regulates the histone code for long-term memory. JNeurosci. 2009; 29:13079–89. [PubMed: 19828821]
35. Livak KJ, Schmittgen TD. Analysis of relative gene expression data using real-time quantitativePCR and the 2(-Delta Delta C(T)) Method. Methods. 2001; 25:402–8. [PubMed: 11846609]
36. Moffat J, et al. A lentiviral RNAi library for human and mouse genes applied to an arrayed viralhigh-content screen. Cell. 2006; 124:1283–98. [PubMed: 16564017]
37. Sarbassov DD, Guertin DA, Ali SM, Sabatini DM. Phosphorylation and regulation of Akt/PKB bythe rictor-mTOR complex. Science. 2005; 307:1098–101. [PubMed: 15718470]
Gräff et al. Page 11
Nature. Author manuscript; available in PMC 2012 November 15.
$waterm
ark-text$w
atermark-text
$waterm
ark-text

Figure 1. Elevated HDAC2 levels epigenetically block the expression of neuroplasticity genesduring neurodegenerationa-c, Representative immunohistochemical images depicting HDAC1-3 levels in area CA1 ofCK-p25 mice and control littermates (n=3-6 slices from 3-4 mice each), scale bar, 20μm. d,Quantitative assessment of (a-c). e, Representative WB images and quantification ofHDAC1-3 protein in the CK-p25 and control hippocampus (n=6-9 mice each). f-h,Quantitative PCR results of (f) HDAC2-, (g) AcH4K12-, and (h) RNA Pol II-immunoprecipitated chromatin at the promoter of neuroplasticity and housekeeping genes inthe CK-p25 and control hippocampus. (i), Quantitative RT-PCR results of the same genes (f-i, n=4-8 animals each). Note that for (i) Bdnf “1”, “2” and “4” represent Bdnf exons I, II andIV, respectively. *p≤0.05; **p≤0.01; ***p≤0.001, values are mean ± s.e.m.
Gräff et al. Page 12
Nature. Author manuscript; available in PMC 2012 November 15.
$waterm
ark-text$w
atermark-text
$waterm
ark-text
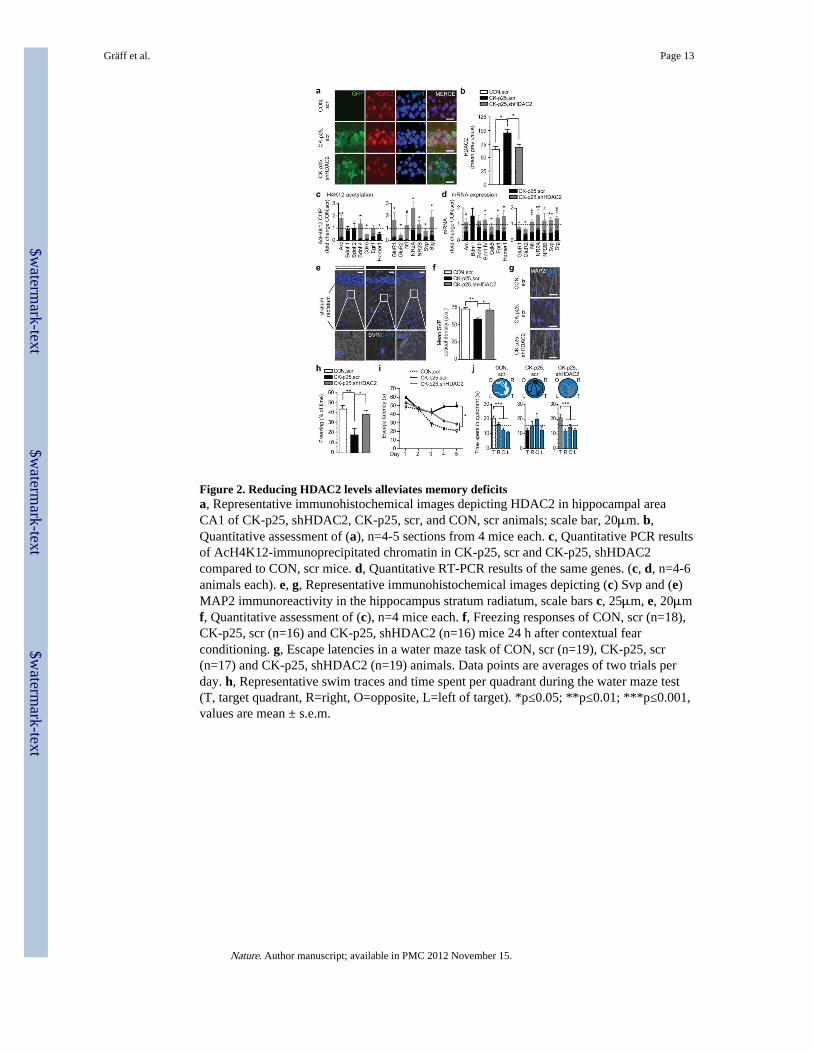
Figure 2. Reducing HDAC2 levels alleviates memory deficitsa, Representative immunohistochemical images depicting HDAC2 in hippocampal areaCA1 of CK-p25, shHDAC2, CK-p25, scr, and CON, scr animals; scale bar, 20μm. b,Quantitative assessment of (a), n=4-5 sections from 4 mice each. c, Quantitative PCR resultsof AcH4K12-immunoprecipitated chromatin in CK-p25, scr and CK-p25, shHDAC2compared to CON, scr mice. d, Quantitative RT-PCR results of the same genes. (c, d, n=4-6animals each). e, g, Representative immunohistochemical images depicting (c) Svp and (e)MAP2 immunoreactivity in the hippocampus stratum radiatum, scale bars c, 25μm, e, 20μmf, Quantitative assessment of (c), n=4 mice each. f, Freezing responses of CON, scr (n=18),CK-p25, scr (n=16) and CK-p25, shHDAC2 (n=16) mice 24 h after contextual fearconditioning. g, Escape latencies in a water maze task of CON, scr (n=19), CK-p25, scr(n=17) and CK-p25, shHDAC2 (n=19) animals. Data points are averages of two trials perday. h, Representative swim traces and time spent per quadrant during the water maze test(T, target quadrant, R=right, O=opposite, L=left of target). *p≤0.05; **p≤0.01; ***p≤0.001,values are mean ± s.e.m.
Gräff et al. Page 13
Nature. Author manuscript; available in PMC 2012 November 15.
$waterm
ark-text$w
atermark-text
$waterm
ark-text
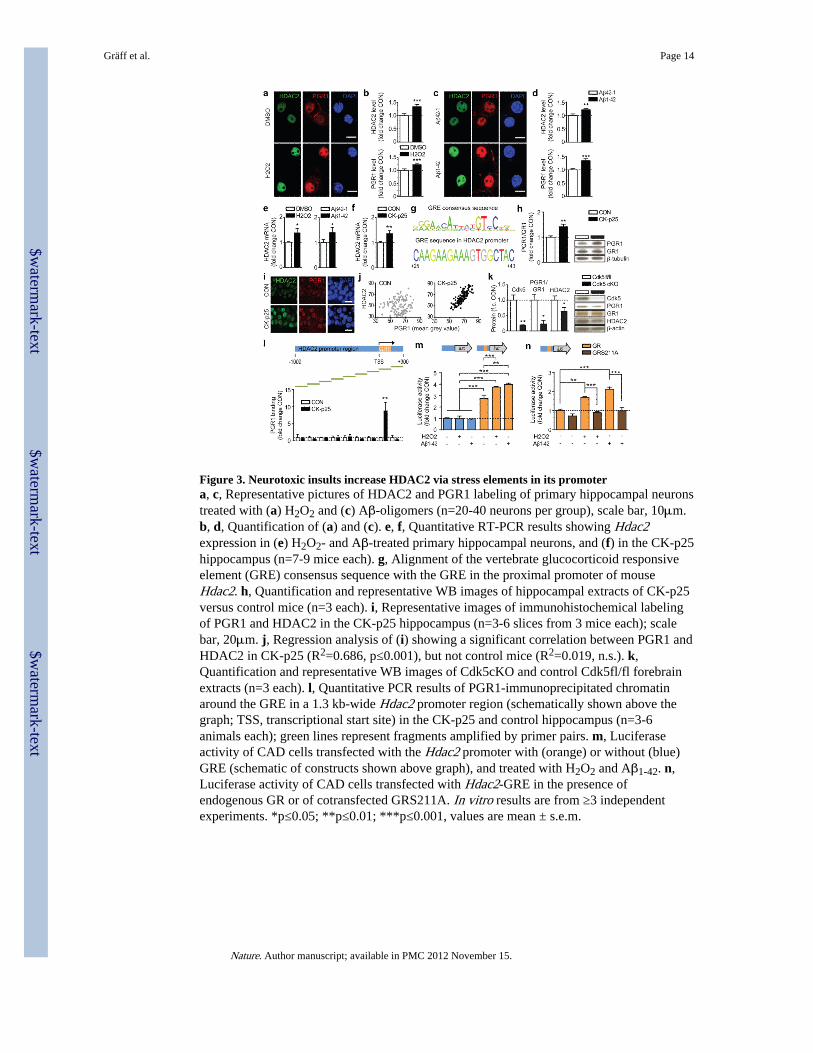
Figure 3. Neurotoxic insults increase HDAC2 via stress elements in its promotera, c, Representative pictures of HDAC2 and PGR1 labeling of primary hippocampal neuronstreated with (a) H2O2 and (c) Aβ-oligomers (n=20-40 neurons per group), scale bar, 10μm.b, d, Quantification of (a) and (c). e, f, Quantitative RT-PCR results showing Hdac2expression in (e) H2O2- and Aβ-treated primary hippocampal neurons, and (f) in the CK-p25hippocampus (n=7-9 mice each). g, Alignment of the vertebrate glucocorticoid responsiveelement (GRE) consensus sequence with the GRE in the proximal promoter of mouseHdac2. h, Quantification and representative WB images of hippocampal extracts of CK-p25versus control mice (n=3 each). i, Representative images of immunohistochemical labelingof PGR1 and HDAC2 in the CK-p25 hippocampus (n=3-6 slices from 3 mice each); scalebar, 20μm. j, Regression analysis of (i) showing a significant correlation between PGR1 andHDAC2 in CK-p25 (R2=0.686, p≤0.001), but not control mice (R2=0.019, n.s.). k,Quantification and representative WB images of Cdk5cKO and control Cdk5fl/fl forebrainextracts (n=3 each). l, Quantitative PCR results of PGR1-immunoprecipitated chromatinaround the GRE in a 1.3 kb-wide Hdac2 promoter region (schematically shown above thegraph; TSS, transcriptional start site) in the CK-p25 and control hippocampus (n=3-6animals each); green lines represent fragments amplified by primer pairs. m, Luciferaseactivity of CAD cells transfected with the Hdac2 promoter with (orange) or without (blue)GRE (schematic of constructs shown above graph), and treated with H2O2 and Aβ1-42. n,Luciferase activity of CAD cells transfected with Hdac2-GRE in the presence ofendogenous GR or of cotransfected GRS211A. In vitro results are from ≥3 independentexperiments. *p≤0.05; **p≤0.01; ***p≤0.001, values are mean ± s.e.m.
Gräff et al. Page 14
Nature. Author manuscript; available in PMC 2012 November 15.
$waterm
ark-text$w
atermark-text
$waterm
ark-text

Figure 4. HDAC2 expression is increased in Alzheimer’s disease patientsa-c, Representative immunohistochemical images depicting nuclear HDAC1-3 levels (whitedotted circles) in neurons (arrow points to magnified neuron in inset) of hippocampal areaCA1 from patients with Braak and Braak (BB) stages I/II (n=4), III/IV (n=7) and V/VI (n=8)compared to healthy BB0 control brains (CON, n=7); scale bar, 100μm. d-e, Quantitativeassessment of (a-c). **p≤0.01, values are mean ± s.e.m.
Gräff et al. Page 15
Nature. Author manuscript; available in PMC 2012 November 15.
$waterm
ark-text$w
atermark-text
$waterm
ark-text