Embed Size (px)
Citation preview

An Epidemiological Analysis of the
2009 H1N1 Swine Influenza “Pandemic”
James (Jim) Chin, MD, MPH
Public Health Epidemiologist (retired)
Formerly
Chief, Bureau of Communicable Disease Control, California State Department of Health Services,
1971-1987
Chief, Surveillance, Forecasting, and Impact Assessment Unit, Global Programme on AIDS, WHO, Geneva, 1987-
1992
Clinical Professor of Epidemiology, School of Public Health, UC Berkeley, 1992-2009

The Faces of the 2009 H1N1 Swine Flu “Pandemic”
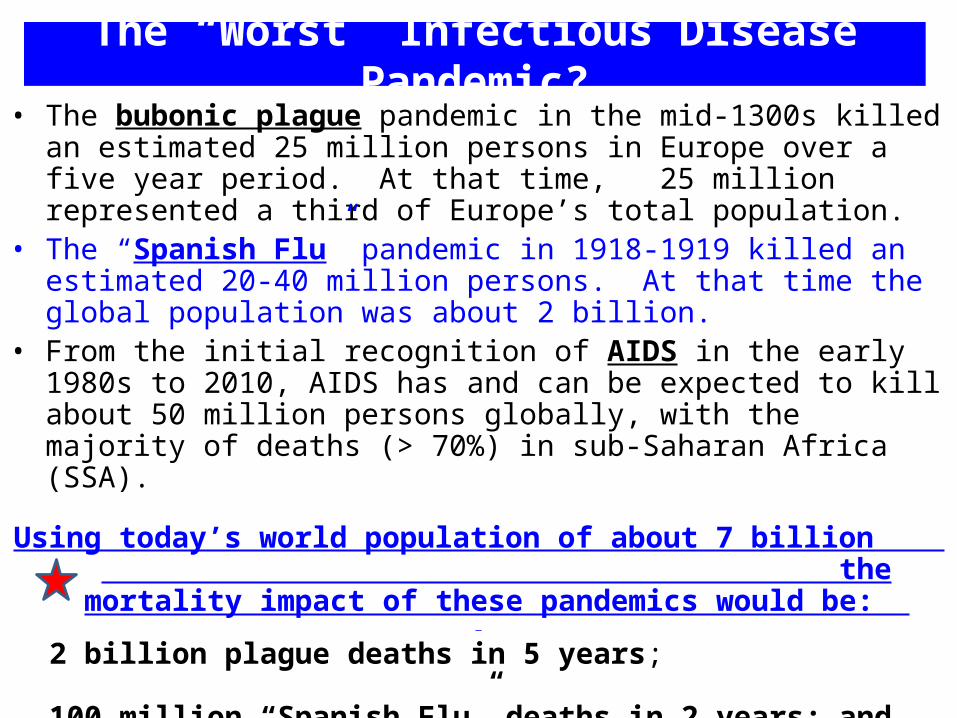
The “Worst” Infectious Disease Pandemic?• The bubonic plague pandemic in the mid-1300s killed an estimated
25 million persons in Europe over a five year period. At that time, 25 million represented a third of Europe’s total population.
• The “Spanish Flu” pandemic in 1918-1919 killed an estimated 20-40 million persons. At that time the global population was about 2 billion.
• From the initial recognition of AIDS in the early 1980s to 2010, AIDS has and can be expected to kill about 50 million persons globally, with the majority of deaths (> 70%) in sub-Saharan Africa (SSA).
Using today’s world population of about 7 billion the mortality impact of these pandemics would be:
2 billion plague deaths in 5 years; 100 million “Spanish Flu” deaths in 2 years; and
50 million AIDS deaths in 30 years.
However, the tuberculosis (TB) pandemic which has been hyper-endemic in most human populations for many
millennia, has killed more persons than any other infectious disease!

Origin of Human Influenza A Viruses
• Influenza A viruses are found in many different animals, including ducks, chickens, pigs, whales, horses, and seals.
• Wild birds are the primary natural reservoir for all subtypes of influenza A viruses and are thought to be the source of influenza A viruses to all other animals.
• Pigs can be infected with both human and avian influenza viruses in addition to swine influenza viruses.
• Because pigs are susceptible to avian, human and swine influenza viruses, they potentially may be infected with influenza viruses from different species (e.g., ducks and humans) at the same time. If this happens, it is possible for the genes of these viruses to mix and create a new virus.

Origin of Human Influenza A Viruses• While it is unusual for humans to get influenza virus
infection directly from animals, sporadic human infection and limited outbreaks can be found in persons in close contact with sick animals.
• However, the emergence of a new influenza virus that “jumps” from animals to humans does not guarantee that a human pandemic will occur.
• The prime example of “emergence” of a non-pandemic influenza A type is the 1976 “Swine flu” outbreak!
• Over the past decade, there has been a marked increase in the detection of “new” influenza viruses infecting humans, but it is likely that hundreds may have emerged and then “vanished” or died out totally undetected.
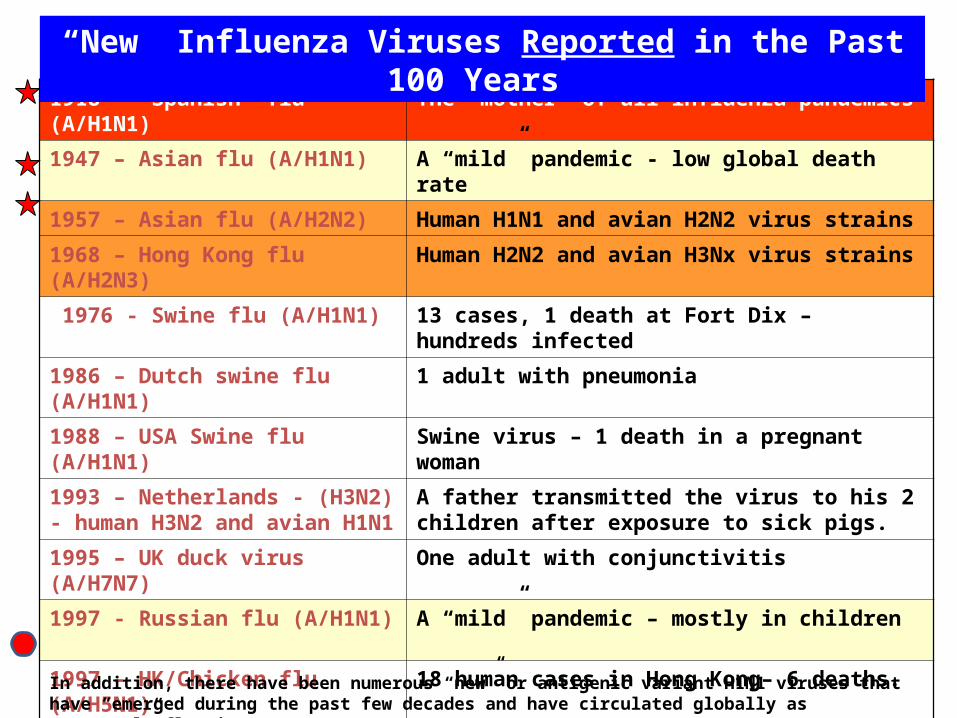
1918 – “Spanish” flu (A/H1N1) The “mother” of all influenza pandemics
1947 – Asian flu (A/H1N1) A “mild” pandemic - low global death rate
1957 – Asian flu (A/H2N2) Human H1N1 and avian H2N2 virus strains
1968 – Hong Kong flu (A/H2N3) Human H2N2 and avian H3Nx virus strains
1976 - Swine flu (A/H1N1) 13 cases, 1 death at Fort Dix – hundreds infected
1986 – Dutch swine flu (A/H1N1) 1 adult with pneumonia
1988 – USA Swine flu (A/H1N1) Swine virus – 1 death in a pregnant woman
1993 – Netherlands - (H3N2) - human H3N2 and avian H1N1
A father transmitted the virus to his 2 children after exposure to sick pigs.
1995 – UK duck virus (A/H7N7) One adult with conjunctivitis
1997 - Russian flu (A/H1N1) A “mild” pandemic – mostly in children
1997 – HK/Chicken flu (A/H5N1) 18 human cases in Hong Kong– 6 deaths.
1999 – HK/Avian flu (A/H9N2) 2 children in Hong Kong - few infections in China
2003 – Dutch/Avian flu (A/H7N7) Up to 100 infections – mostly in poultry workers
2003 – China/Chicken flu (A/H5N1) 2 cases (1 death) in a Hong Kong family
2009 – Mexico/Swine flu (A/H1N1) Mortality rate less than “seasonal” flu viruses
“New” Influenza Viruses Reported in the Past 100 Years
In addition, there have been numerous “new” or antigenic variant H1N1 viruses that have “emerged during the past few decades and have circulated globally as “seasonal” flu viruses.
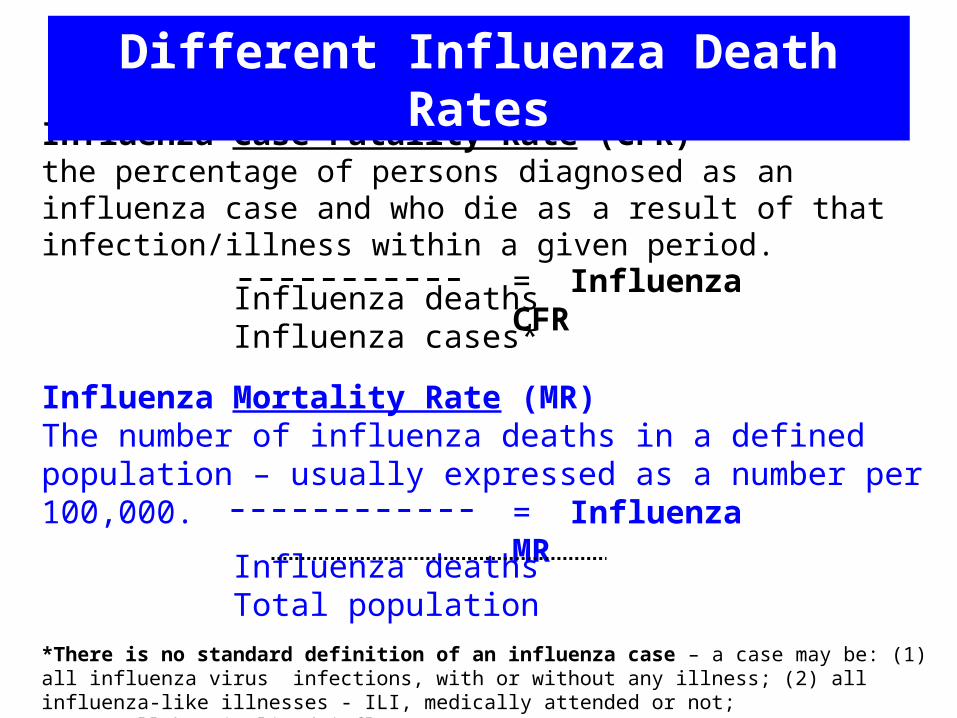
Influenza Case Fatality Rate (CFR)the percentage of persons diagnosed as an influenza case and who die as a result of that infection/illness within a given period.
Influenza deathsInfluenza cases*
Influenza Mortality Rate (MR)The number of influenza deaths in a defined population – usually expressed as a number per 100,000.
Influenza deathsTotal population
*There is no standard definition of an influenza case – a case may be: (1) all influenza virus infections, with or without any illness; (2) all influenza-like illnesses - ILI, medically attended or not; (3) all hospitalized influenza cases. CDC has assumed that in all influenza pandemics, 30% of the total population have an ILI due to influenza and they are the denominator “cases” in CDC’s estimates of the
influenza CFR.
= Influenza CFR
= Influenza MR
Different Influenza Death Rates

Influenza mortaIlity rates per 100,000 by region*
500 in Europe and North America
900 in Central & South America
1,500 in Africa
2,000-3,400 in Asia, with highest rates in India (estimated 12-17 million deaths in India)
**********
Worldwide impact of the 1918 influenza pandemic
* Estimation of influenza deaths is at best, an inexact science. Even if carefully and accurately carried out, the estimated influenza mortality rate (IMR) can vary by several folds within local areas and regions of any country. Globally, IMRs varied from lows of about 0.5% of the total population (500/100,000) up to 2-3% (2-3,000/100,000) for a global average of about 1.5% (1,500/100,000).
0
500
1000
1500
2000
2500
1900 1920 1940 1960 1980
Year
Mo
rta
lity
rate
pe
r 1
00
,00
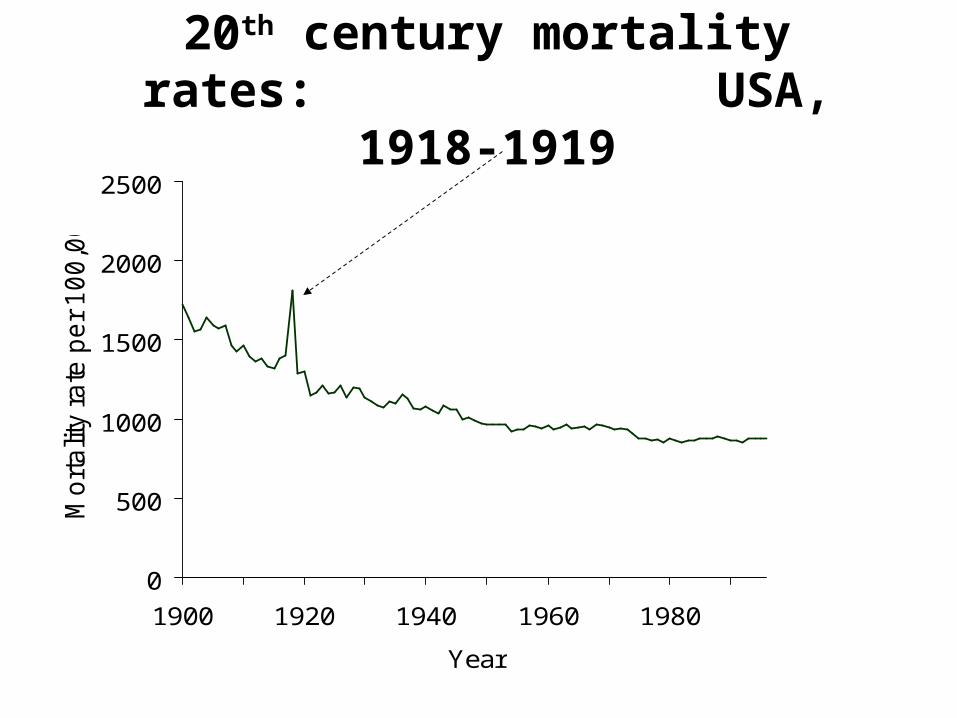
020th century mortality rates:
USA, 1918-1919

Influenza
Viruses
Dates
Estimated flu deaths (millions)
World population (billions)
flu mortality rate (IMR) (100,000)
Influenza severity index*
`Asiatic - H2N2? 1889-90 1
1.5 70 7
Spanish - H1N1 1918-20 25 [10-100] 1.8 1,500 150
A “prime” - H1N1 1947-48 “low” 2.4 <5? <1?
Asian - H2N2 1957-58 1.75 2.9 60 6
Hong Kong - H3N2 1968-69 1 3.6 30 3
Russian - H1N1 1977-78 “mild” 4.3 <5? <1?
“Swine” - H1N1 2009-10 <0.3 ? 6.8 <5 ? <1?
Seasonal influenza viruses
recent years
USA: 0.36 World: 0.375
0.3 6.8
CDC -12 WHO - 6
Estimated Global Influenza Mortality Rates (MR)
*
*Influenza case fatality rates (CFR) have been used to estimate the severity of influenza viruses, but since there is no uniform definition of an influenza case, the estimated influenza mortality rate (IMR) is a more reliable measurement. For past influenza pandemics, an “average” number of deaths were calculated from historical reviews. WHO’s estimates of global deaths due to recent seasonal influenza viruses range from 250,000 to 500,000 for an average annual IMR of 6 per 100,000 population. CDC’s estimates of deaths due to recent seasonal influenza viruses in the USA have ranged from 17,000 to 52,000 for an average of 36,000 or an average IMR of 12/100,000. ^An IMR of 10/100,000 may be considered as the average severity of recent seasonal influenza viruses and can be used as a yardstick to estimate the relative severity of past or new pandemic or seasonal influenza viruses.
IMR of 10 = 1^
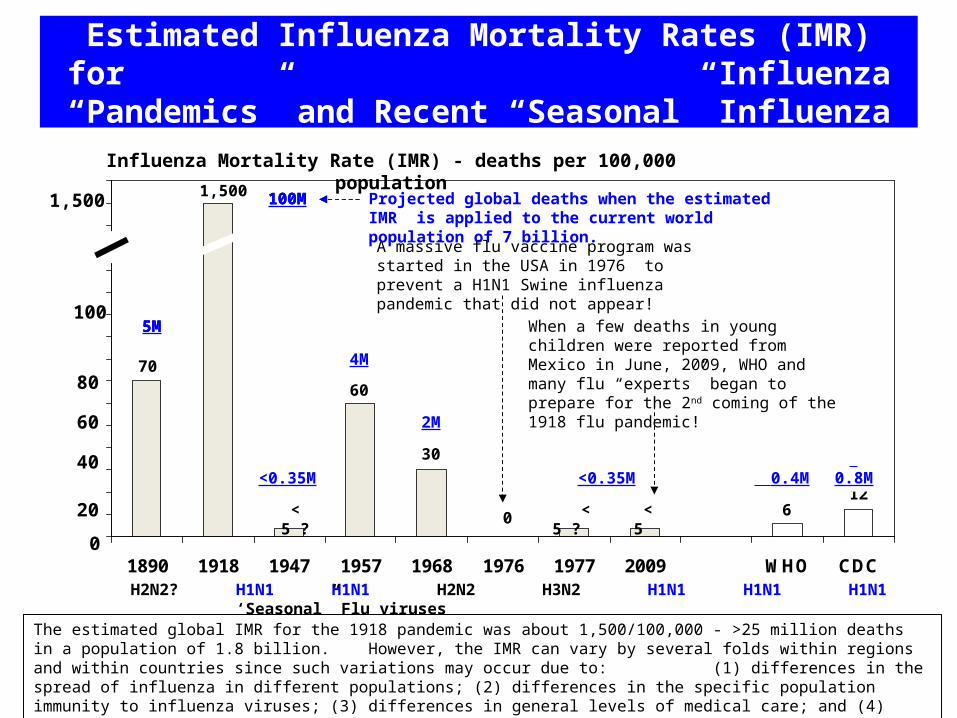
Estimated Influenza Mortality Rates (IMR) for Influenza “Pandemics” and Recent “Seasonal”
Influenza
0102030405060708090
100110120130140150160
1890 1918 1947 1957 1968 1976 1977 2009 WHO CDC
East Column 2 Column 3 H2N2? H1N1 H1N1 H2N2 H3N2 H1N1 H1N1 H1N1 ‘Seasonal” Flu viruses
Influenza Mortality Rate (IMR) - deaths per 100,000 population
0
100
70
12 < 5 6
100M
5M
40
1,500
<0.35M 0.4M 0.8M
80
20
60
< 5 ?
30
60
4M
2M
< 5 ? 0
A massive flu vaccine program was started in the USA in 1976 to prevent a H1N1 Swine influenza pandemic that did not appear!
The estimated global IMR for the 1918 pandemic was about 1,500/100,000 - >25 million deaths in a population of 1.8 billion. However, the IMR can vary by several folds within regions and within countries since such variations may occur due to: (1) differences in the spread of influenza in different populations; (2) differences in the specific population immunity to influenza viruses; (3) differences in general levels of medical care; and (4) estimation of influenza deaths is not an exact science!
When a few deaths in young children were reported from Mexico in June, 2009, WHO and many flu “experts” began to prepare for the 2nd coming of the 1918 flu pandemic!
1,500
<0.35M
100M
5M
Projected global deaths when the estimated IMR is applied to the current world population of 7 billion.
100M
5M

WHO’s 2005 Definition of an Influenza Pandemic
“An influenza pandemic occurs when a new influenza virus appears against which the human population has no immunity, resulting in several, simultaneous epidemics worldwide with enormous numbers of
deaths and illness.”*
*[The last underlined phrase was deleted by WHO on May 4, 2009]

In 2005 WHO also developed a phased alert system to prepare and respond to influenza pandemics
Alert phases (AP) 1-3 monitors the emergence of new/novel influenza viruses that are capable of human-to-human (H-H) transmission. [Reached in February-March, 2009]
AP-4 is reached when H-H transmission of a “new” animal or human-animal influenza virus, able to sustain community outbreaks, has been verified. [April 27, 2009]
AP-5 (the pre-pandemic phase) is reached when H-H spread of the virus is reported in two or more countries in one WHO region. [April 29, 2009] and the highest
AP-6 (the pandemic phase) is reached when in addition to AP-5, the same virus spreads from H-H in at least one other country in another WHO region [June 11, 2009].

50 100 200 400 7501340
530 310 270 200 25
5920
5920
0
5000
10000
15000
20000
MAR APR MAY JUN JUL AUG SEP OCT NOV DEC JAN FEB MAR APR MAY JUN JUL AUG SEP
Line 3
An Epidemiological Time Line for the 2009 H1N1 Swine Influenza “Pandemic”
Influenza pandemic (alert level 6)
declared by WHO and this triggered an unprecedented global response to an assumed global health emergency
No excess influenza deaths were found in Australia and NZ during
their 2009 flu season with the 2009 H1N1 pandemic virus
Estimated deaths in the USA due to the
2009 H1N1 virus peaked in Oct-Nov. Total deaths were
about 15,000 and MR was low – 5/100,000
By late 2009, it was clear that the 2009
H1N1 pandemic was very mild , but WHO continued to warn about possible mutations that could lead to potentially
severe 2nd, 3rd, and even 4th “waves”
No evidence of a severe 2010 flu season with the 2009 H1N1
virus in Australia and NZ
When WHO officially declared the emergence of an influenza pandemic in June, 2009, its mortality rate was unknown, but the 2005 IHR revision considered the detection of a new influenza virus subtype that can spread in human communities as a global health emergency of international
concern.The 2009 H1N1 vaccine was initially available in Australia only after its 2009 flu season
was over and in the USA when
H1N1 infections were peaking
The usual peak months of influenza activity in the USA
2009
“Novel” H1N1 cases reported
from Mexico
2010
2500WHO declares pandemic over
All available data and estimates indicate that the 2009 H1N1 pandemic was not a global health
emergency of international concern, and most of the expanded public health measures, i.e., routine
hand washing, etc., had no measurable impact on the scope or severity of the pandemic!
Mexico revises death estimates markedly lower, but WHO also
revises its definition of an influenza pandemic by deleting the phrase
“with enormous numbers of deaths and
illnesses”
CDC declares public health emergency over1
7
6
4
23
9
8
5
A
B
Estimated H1N1 virus deaths in the USA
5a

Influenza Prevention/Control Programs
Over the past few decades, annual influenza programs have provided influenza vaccines primarily to two priority groups:
1.persons who are at the highest risk of severe complications from influenza, particularly the elderly; 2.personnel who provide essential services: health care workers, fire fighters, police, and the military.
The vaccine developed for the 2009 H1N1 “pandemic” was recommended for essentially the total population, but was not available until the influenza season was over in the Southern hemisphere and was peaking or had peaked in the Northern hemisphere.
Influenza Prevention/Control Programs
• Public health measures for preventing community transmission of influenza are largely ineffectual and therefore have not been major components of most annual influenza programs. In recognition of this, WHO in April, 2009 advised against placing restrictions on international travel and urged increased surveillance and strengthening of infection control measures in health facilities. As a result, routine hand washing, in and out of health facilities, was strongly promoted to the point that it became the cornerstone of public health prevention/control measures for preventing the community spread of influenza.
David Morens – “I can’t fully accept that contact/fomite transmission plays NO role (It may under certain circumstances play a role), I also doubt that hand washing does much good other than as a reminder to be sanitary.”
Edwin Kilbourne – “The pathogenesis of influenza is initiated by the inhalation of influenza virus – usually in the form of aerosols of small droplet nuclei… Hand washing does nothing to curtail the spread of influenza but it may be a good substitute for hand wringing.”
Senior public health expert comments on hand washing to prevent the
community spread of influenza

Michael Osterholm – “hands and fomites play a role in the transmission of some respiratory viruses [but] the case for this as a major mode of transmission for influenza cannot be supported ... responsible hand washing can never be a bad thing, [but] we’ve oversold it for preventing influenza transmission.”
Donald A Henderson – “Will hand washing be effective in altering the course of the pandemic (dream on!) and what in heavens name could "disinfecting" health facilities do?... The CDC responses that we have had have generally been: One simply can't stand by; we have to advise something…”
Senior public health expert comments on hand washing to prevent the
community spread of influenza

Influenza mortality rate similar to:
Estimated Influenza deaths in 2009-10
1918 “Spanish” H1N1 4-5 million*
1957 “ Asian” H2N2 190,000
1968 “Hong Kong” H3N2 95,000
2009 “Swine” H1N1 ?<20,000?**
Recent “Seasonal” Influenza viruses
WHO model
CDC model
>15,000
>30,000
Influenza Deaths in USA Based on Estimated Influenza Mortality Rates
* Based on the global average of 1,500/100,000 for the IMR in the 1918 pandemic – if the estimated IMR for the USA of about 600/100,000 is used the toll of influenza deaths would be about 2 million! ** As of early 2010, CDC estimated based on death data and viral surveillance data that there may have been about 15,000 deaths due to the 2009 H1N1 virus.

Total US population 310
million18-64 age group
190 million0-17 age group
80 million
65+ age group 40 million
2009 H1N1 virus
Seasonal flu viruses
60
20 20
40
60
40
Estimated Influenza Mortality Rates* by Age Groups - USA
* Influenza mortality rate (IMR) per 100,000 population
4.8
11.6
3.61.9
58.5
6.1 5.1 4.9
Conclusions• Conflict of interest charges against WHO
influenza advisors, and an evaluation of WHO’s handling of the 2009 “pandemic” as proportionate and effective were both wrong!
• The problem with WHO’s response to the 2009 H1N1 “Swine” influenza virus were assuming: the “new” influenza virus would be very severe; and that there are effective public health measures to limit the spread and impact of a “new” influenza virus. Both assumptions were wrong!
• Use of case fatality rates (CFR) for estimating the relative severity of influenza viruses is not reliable since there is no standard definition of what an influenza “case” may be and the numbers of reported “cases” can be greatly increased due to news media hype! A more objective rate for estimating the severity of influenza viruses is the mortality rate (IMR) i.e., number of specific influenza deaths per 100,000 population.
• The severity of the 2009 “pandemic” in children has been overestimated due to intense media coverage of deaths in children, which have led to: more children seeking medical care for influenza-like-illness [ILI]; more children hospitalized with moderately severe ILI; and increased reporting of ILI in children rather than under reporting!
Conclusions

• The estimated mortality rate (MR) of the 2009 H1N1 “pandemic” in the USA was very low (5/100,000) - less than half of the MR in an “average” influenza season, primarily because the MR in the 65+ population was more than an order of magnitude less than in recent influenza seasons. Similar low influenza MR were reported from countries with well developed influenza surveillance systems.
• The unprecedented global response to the 2009 influenza “pandemic” had very little impact on the scope and severity of the “pandemic” since the 2009 H1N1 vaccine was generally not available until the “pandemic” peaked and measures for limiting the community spread of influenza, including routine hand washing, may have, at best, only slowed the spread of the H1N1 virus in some populations.
Conclusions

• The primary reason for the relative “mildness” of the 2009 influenza “pandemic” was that most persons over the age of 10, especially the elderly (65+), had some immunity to H1N1 influenza viruses.
• Without pre-existing population immunity, the 2009 flu “pandemic” might have been very severe, but the unprecedented global response would still have been ineffective!
Conclusions
Recommendations • International Health Regulations (IHR) shouldn’t
consider the spread of a new influenza virus subtype as a global health emergency without some indication of the severity of the new virus.
• WHO needs to clarify what constitutes a new pandemic virus, since there was ample population immunity to the 2009 H1N1 virus.
• WHO should also clearly acknowledge the major limitations of public health programs for the prevention and control of influenza and critically evaluate the cost effectiveness of recommended measures to limit the community spread of influenza viruses.

Development of a graded response to an influenza pandemic based on its estimated mortality rate (MR) seems reasonable, but the MR can’t be well estimated until a pandemic has peaked! - therefore, future global response to any new influenza pandemic should be similar to that developed for seasonal influenza - with some increased vaccine coverage, when possible or warranted.
WHO should advocate for increased global support for the timely provision of updated influenza vaccines to resource poor countries.
Recommendations


![swine flu kbk-1.ppt [Read-Only]ocw.usu.ac.id/.../1110000141-tropical-medicine/tmd175_slide_swine_… · MAP of H1 N1 Swine Flu. Swine Influenza (Flu) Swine Influenza (swine flu) is](https://img.dokumen.tips/doc/110x75/5f5a2f7aee204b1010391ac9/swine-flu-kbk-1ppt-read-onlyocwusuacid1110000141-tropical-medicinetmd175slideswine.jpg)