Embed Size (px)
Citation preview

Energy Plan March 2014 Appendices
PPaatthhwwaayy 22005500::
AAnn EEnneerrggyy PPllaann ffoorr
JJeerrsseeyy
AAPPPPEENNDDIICCEESS

2
Energy Plan March 2014 Appendices
Appendix 1 – Carbon accounting .......................................................................................... 5
1.1 The Kyoto Protocol ..................................................................................................... 5 1.2 Jersey's carbon emissions .......................................................................................... 5
Appendix 2 Predicting energy growth to 2050 & projecting carbon emissions..................... 11
Energy demand under a ’business as usual’ scenario ..................................................... 12 Carbon emissions under a ’business as usual’ scenario ................................................. 13
Appendix 3 The Energy Partnership ................................................................................... 17
Appendix 4: Impact Assessments ....................................................................................... 21
Appendix 5 Resource assessments to deliver energy efficiency in the domestic sector ...... 27
Appendix 6: Interpretation of Emissions savings by Sector to support Chapter 3. ............... 29

4

5
Appendix 1 – Carbon accounting
1.1 The Kyoto Protocol
It is recognised that there are limitations to the methods employed to account for carbon under Kyoto; some would argue that they are not stringent enough. Nevertheless, it is the internationally adopted methodology by which Jersey must demonstrate its progress and should be the first level against which we measure progress.
In April 2007, the UK’s ratification of the Kyoto Protocol was extended to Jersey at the request of the Chief Minister. Jersey was not awarded binding carbon reduction targets in the 2008 to 2012 period (carbon reduction is measured against the 'baseline year' of 1990). Despite not having an ‘allocated allowance’ under the Kyoto Protocol, at the time of the extension of the ratification, Jersey was asked by the Department of Constitutional Affairs:-
‘to introduce, where possible, and having taken into account local circumstances, policies in line with the objectives of the UK Climate Change Programme. In relation to any subsequent commitment periods, Her Majesty’s Government agrees that any obligation upon the Government of Jersey for the reduction of emissions shall be as determined by the Government of Jersey, in conjunction with Her Majesty’s Government, to be what Jersey can reasonably deliver’
Extending the ratification of the Kyoto Protocol signalled Jersey's intent to set challenging carbon dioxide reduction targets. These will be implemented alongside energy reduction targets.
Current EU and UK carbon emission reduction targets are an 80% reduction on the 1990 baseline year by 2050.
1.2 Jersey's carbon emissions
The Island has reported its emissions information to the agency that collates the UK’s information where the historical and current data was aggregated into the total UK carbon emissions1. Because until 2009, the data Jersey provided was not available separately, the States of Jersey Statistics Unit made provisional carbon estimates based on the carbon emitted from imported energy and published these annually in the Jersey Energy Trends Report.
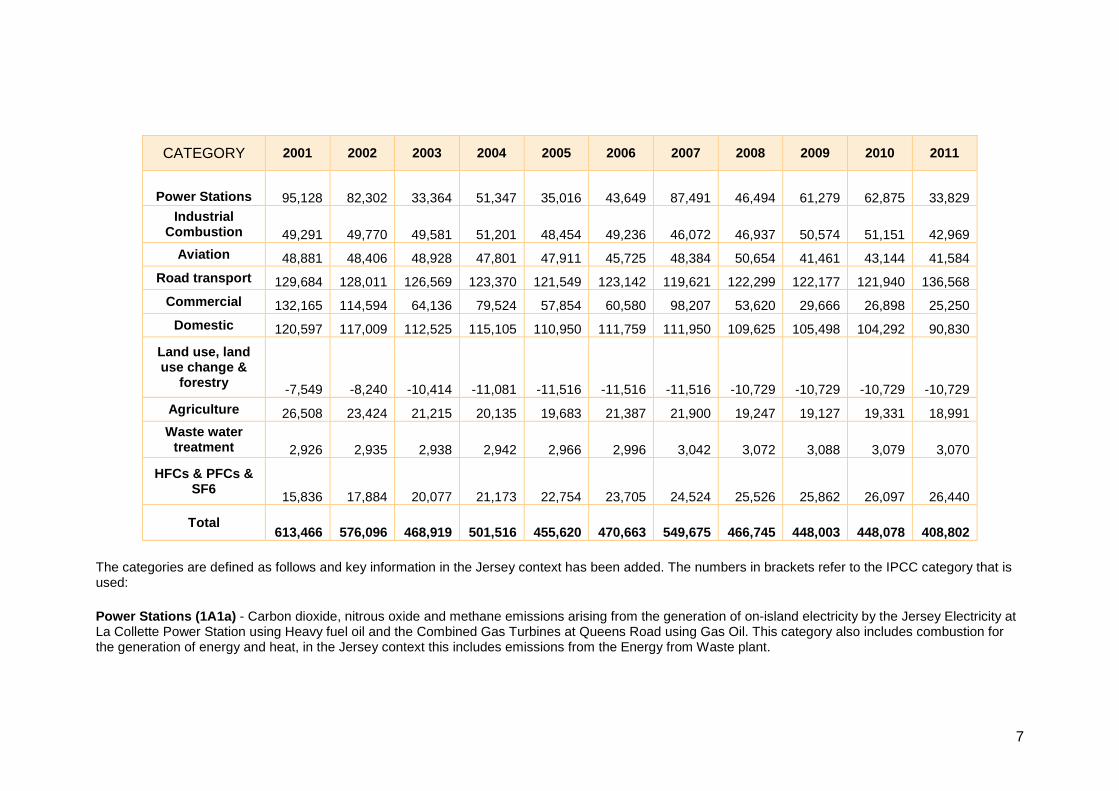
However, in late 2009 Jersey's emissions data was disaggregated and made available to the Island. The data is very similar to the provisional estimates made by the Statistics Unit but is more comprehensive and categorised in source and sink categories according to the International Panel on Climate Changes Guidelines for National Greenhouse Gas Inventories. Table A1 below shows the source data used to construct Graph 1, Section 2.1 of the Plan.
1 http://www.ipcc-nggip.iges.or.jp/public/2006gl/vol2.html (Source AEA Technology on behalf of the Department for Energy and Climate Change)

6
Table A1 Green house gas inventory for Jersey expressed in tonne of carbon dioxide equivalents 1990-2011
CATEGORY 1990 1991 1992 1993 1994 1995 1996 1997 1998 1999 2000
Power Stations 211,765 212,841 331,095 272,826 287,991 293,356 280,243 215,570 240,143 232,516 124,369
Industrial Combustion 36,549 36,549 36,549 33,921 39,144 39,792 45,353 63,652 60,414 44,071 51,632
Aviation 44,710 43,037 41,408 40,793 39,776 39,364 38,898 38,384 40,648 41,891 48,046
Road transport 122,445 122,445 124,529 128,271 133,582 133,599 130,596 126,326 130,458 118,709 128,894
Commercial 62,231 62,251 54,597 59,639 63,681 62,239 69,514 76,631 95,568 61,810 62,940
Domestic 113,144 113,144 98,313 101,863 103,429 104,254 115,400 142,373 159,835 112,001 119,871 Land use, land use change &
forestry 280 280 -632 568 -1,280 -4,928 -1,374 -139 546 -641 -3,342
Agriculture 26,037 26,027 26,155 26,243 26,203 26,212 26,512 26,631 26,614 26,599 27,200
Waste water treatment
2,728 2,667 2,779 2,774 2,825 2,780 2,814 2,860 2,902 2,878 2,917 HFCs & PFCs & SF6* (see footnote for info on data from
1990 to 1995 51 67 101 570 1,481 2,755 4,434 6,539 9,140 10,581 13,417
Total 619,940 619,307 714,893 667,467 696,833 699,425 712,392 698,827 766,268 650,415 575,943
7
CATEGORY 2001 2002 2003 2004 2005 2006 2007 2008 2009 2010 2011
Power Stations 95,128 82,302 33,364 51,347 35,016 43,649 87,491 46,494 61,279 62,875 33,829
Industrial Combustion 49,291 49,770 49,581 51,201 48,454 49,236 46,072 46,937 50,574 51,151 42,969
Aviation 48,881 48,406 48,928 47,801 47,911 45,725 48,384 50,654 41,461 43,144 41,584
Road transport 129,684 128,011 126,569 123,370 121,549 123,142 119,621 122,299 122,177 121,940 136,568
Commercial 132,165 114,594 64,136 79,524 57,854 60,580 98,207 53,620 29,666 26,898 25,250
Domestic 120,597 117,009 112,525 115,105 110,950 111,759 111,950 109,625 105,498 104,292 90,830
Land use, land use change &
forestry -7,549 -8,240 -10,414 -11,081 -11,516 -11,516 -11,516 -10,729 -10,729 -10,729 -10,729
Agriculture 26,508 23,424 21,215 20,135 19,683 21,387 21,900 19,247 19,127 19,331 18,991 Waste water
treatment 2,926 2,935 2,938 2,942 2,966 2,996 3,042 3,072 3,088 3,079 3,070
HFCs & PFCs & SF6
15,836 17,884 20,077 21,173 22,754 23,705 24,524 25,526 25,862 26,097 26,440
Total 613,466 576,096 468,919 501,516 455,620 470,663 549,675 466,745 448,003 448,078 408,802
The categories are defined as follows and key information in the Jersey context has been added. The numbers in brackets refer to the IPCC category that is used:
Power Stations (1A1a) - Carbon dioxide, nitrous oxide and methane emissions arising from the generation of on-island electricity by the Jersey Electricity at La Collette Power Station using Heavy fuel oil and the Combined Gas Turbines at Queens Road using Gas Oil. This category also includes combustion for the generation of energy and heat, in the Jersey context this includes emissions from the Energy from Waste plant.

8
Carbon emissions arising from Energy from Waste plants are dealt with very specifically under the Kyoto Protocol. Only the proportion of carbon emitted from non-biogenic material is accounted for since that which arises from 'recently photosynthesised' or 'non-fossil carbon' is not counted as a greenhouse gas for the purposes of the protocol. AEA have advised that there have been recent changes in the way emissions are calculated from Jersey (and the other Crown Dependencies and Overseas Territories) to make it more integrated with the UK system. This led to a change in the emission factor for carbon from MSW combustion and the emissions factor used is 75kt carbon/Mt waste.
It must be noted that the updated figure provided by AEA is much lower than that advised in 2006 by the National Inventory for Greenhouse Gas Emissions and was used in Energy Policy Green Paper. That is why EfW emissions appear as a lesser proportion of GHGs emissions than have been previously described.
Whilst in policy terms we must adapt to the external advice given to us in respect of international reporting mechanisms, it is recognised that Energy from Waste contributes to carbon emissions even if Kyoto does not recognise it all for the purposes of the convention. Thus, there is significant overall benefit in fully investigating alternatives to EfW technology at the end of the replacement plant's life. In addition, ongoing work with AEA and an on-island project to more fully categorise the local waste stream is expected to lead to Jersey-specific MSW emissions factors being available in the future.
Industrial Combustion (1A2f) - Carbon dioxide, nitrous oxide and methane emissions arising from the combustion of kerosene (burning oil) fuels in the commercial sector. Jersey’s kerosene emissions are partly attributed to this category since the overall accounting methodology finds it difficult to account for in the way our small jurisdiction burns heating oil in the commercial sector. We are advised that he emissions from this category are essentially from kerosene in the commercial sector and it is acceptable to combine emissions from the ‘Commercial (1A4a) category and this category.
Aviation (1A3a) - Carbon dioxide, nitrous oxide and methane emissions arising from national but not international flights (which are reported separately).
Road transport (1A3b) - Carbon dioxide, nitrous oxide and methane emissions arising from all road vehicles.
Commercial (1A4a) - Carbon dioxide, nitrous oxide and methane emissions from fuel combustion in commercial and institutional buildings. It includes kerosene for space heating as well as gas oil and fuel oil which power larger scale heating plant in sectors such as retail, agricultural and
Domestic (1A4a) - Carbon dioxide, nitrous oxide and methane emissions from fuel combustion in residential buildings (i.e. space heating from kerosene & LPG gas)
Land use change and forestry (5G) - Carbon dioxide, nitrous oxide and methane emissions and removals from forest and land use change activities. This sector shows a net sink between 1991 and 2004 although the size of the sink is variable over time, depending on the land use change to grassland and there is no clear trend. Activity data on land use is available since 1990: only land use change between cropland and grassland and liming contribute to the inventory.

9
Agriculture (4b14)- Carbon dioxide, nitrous oxide and methane emissions from agriculture including the carbon dioxide and methane emissions from the enteric fermentation from cattle (4A1), sheep (4A3), goats (4A4), horses (4A6) and pigs (4A5). Also includes carbon dioxide, and methane arising from the wastes from cattle (4B1), sheep (4B3), goats (4B4), horses (4B6), pigs (4B8) and poultry (4B9)
Waste water treatment (6B2) - The methane and nitrous oxide emissions arising from the handling of liquid wastes and sludge from housing and commercial sources (including human waste).
HFCs, PFCs & SF 6 - Emissions from the potent greenhouse gases, hydrofluorocarbons (HFCs), perfluorocarbons (PFCs) (these two being used mainly as refrigerants and air conditioning units) and sulphur hexafluoride (SF6 - particularly from high voltage electric switch gear where SF6 is used as a thermal insulator). *SF6 was not used in the early part of the reporting periods but becomes a more significant portion of this category as its use increased replacing CFCs in aerosols. For this reason 1995 is taken as the baseline year for this category not 1990.

10

11
Appendix 2 Predicting energy growth to 2050 & projecting carbon emissions
A simple energy growth model has been used to show how the Island's energy demand (expressed in tonnes of oil equivalents - toe) is likely to change into the future if we continue in a ‘business as usual’2.
This model is helpful to understand how energy use is likely to rise under a 'do-nothing' or 'business as usual' scenario and makes a number of key assumptions as follows:
1. Immigration – using a scenario of net nil immigration per annum. The population projections are calculated by the Statistics Unit3 in 2009 and have been adjusted to take into account the 2011 census figure which demonstrated a higher population than predicted in the between census periods.
2. Motor Fuel - Continuing trend of improved energy efficiency and small growth in the use of diesel for cars. Growth assumes a current near-saturation of car use on Island. Lead replacement fuel declines to residual figures by 2010.
3. Gas oil - Continuing trend of decline with an assumed switch to gas and electricity
4. Heavy Fuel Oil - Assumed use for electricity generation at 32% efficiency and comprising 3% of total electricity supply until 2015 falling to 2% of supply post 2015
5. Kerosene - Continued use as heating oil with a slight decline in use post 2011 as new builds continue to be smaller apartments and more likely to be powered by electric heating (the trend to date)
6. Electricity - Continued increasing use in all sectors because of the ability to fix long term price contracts with more certainly and ease compared to hydrocarbon fuels which are expected to become significantly more expensive as a result of developments in global fossil fuel prices
7. Gas - Bottled and mains gas remains an important part of fuel mix for existing customers, whilst small growth potential is expected for industry as a result of Combined Heat and Power
8. Aviation - Small long-term increase in aviation traffic to and from the Island. The energy model assumes growth in air travel in line with Jersey airport policy based on an increasing population of +350 per annum. Whilst the growth in air travel does result in an increase in emissions, in real terms there is a reduction compared to a business as usual scenario, due to improved aircraft standards.
2 This model is available as an Excel Worksheet (Supporting document A) 3 http://www.gov.je/ChiefMinister/Statistics/Population/ (2009 population model)

12
Energy demand under a ’business as usual’ scenario A 'business as usual' scenario predicts the following trends in each energy sector as measured by tonnes of oil equivalents (Table A1 below). NB The sectors comprise demand as a result of all the different energy products. For example ‘road fuel’ comprises toe of petrol (leaded and unleaded) and diesel and ‘domestic’ comprises coal, and LPG, kerosene and electricity for the domestic market. All the details are available in Supporting Document A
YEAR Population Road Fuel Aviation Commercial
& Industrial Domestic
On-Island Electricity Generation
Total Energy Demand
2000 88,400 46,161 14,806 36,078 47,052 34,395
144,098
2005 91,000 43,116 17,225 57,016 68,387 3,779
185,744
2010
97,100
42,950 8,853 50,343 65,817 5,453 167,963
2015 100,033 43,923 9,693 53,146 60,675 5,620 167,436
2020 102,804 45,172 10,731 55,640 62,859 5,620 174,402
2025 105,387 46,275 11,851 57,592 64,477 5,620 180,194
2030 107,730 47,165 13,050 59,675 66,177 5,620 186,067
2035 109,783 48,064 13,977 60,603 67,444 5,620 190,088
2040 111,522 48,825 14,923 61,500 68,597 5,620 193,846
2045 112,944 49,448 15,884 62,361 69,625 5,620 197,318
2050 114,108 49,932 16,950 63,488 70,677 5,620 201,048
Table A1 Historic and projected energy demand by sector based on an energy model that assumes growth of +350 per annum. Data is shown in tonnes of oil equivalents (toe)
The data shown above is also presented in the Figure A1 (below). Overall between 2000 and 2050 there is a projected c.39% rise in energy demand (of 56,950 toe from 144,098 toe to 201,048 toe). This is based on an increasing population of +350 people per annum which brings the total population to 114,108 people by 2050.s

13
Figure A1 Illustration of patterns of future energy demand using a simple ‘business as usual’ model.
Carbon emissions under a ’business as usual’ scenar io
The ‘business as usual’ energy growth model allows an estimation to be made of the overall trend in energy use to 2050. Using this information, the impact on emissions each decade to 2050 can be forecast. There are differences in the carbon intensities of the different products comprising the categories so this must be accounted for during this calculation (see Spread sheet for full details).
Table A2 shows a summary of the forecast emissions under a business as usual model and Figure A2 below it shows the same information graphically.
CATEGORIES 1990 2010 2020 2030 2040 2050 Target 20% of
1990 levels
Power stations 211,765 62,875 29,438 32,299 5,789 5,789 42,353 Industrial
combustion 36,549 51,151 46,145 41,107 35,794 30,922 7,310
Aviation 44,710 43,144 52,295 63,599 72,726 82,604 8,942
Road transport 122,445 121,940 128,249 133,907 138,620 141,762 24,489
Commercial 62,231 26,898 24,265 21,616 18,822 16,260 12,446
Domestic 113,144 104,292 98,761 93,598 91,112 87,570 22,629 Land use, change & forestry 280 -10,729 -10,729 -10,729 -10,729 -10,729 56
Agriculture 26,037 19,331 19,331 19,331 19,331 19,331 5,207

14
Waste water treatment 2,728 3,079 3,260 3,416 3,536 3,618 546
HFCs, PFCs & SF6 2,755 26,097 27,630 28,954 29,973 30,668 5,2194
TOTAL 622,645 448,078 418,645 427,098 404,974 407,796 129,197
Table A2 Pattern of carbon emissions per decade as predicted by a simple ‘business as usual’ scenario of energy demand with the target amount of emissions illustrated in the far column. This information is shown graphically in Graph 2 Section 2.3 of the main Plan.
What is clear is that without comprehensive action across all sectors, a ‘business as usual’ scenario means that emissions in all sectors are far above the target. Graph 3, Section 2.3 of the main Plan shows graphically what emissions across all sectors must do if the Island is to achieve its reduction target.
Figure A2
4 F Gas calculations based on 2010 baseline.

15
A number of assumptions were made in order to predict the carbon growth figures as well as those made in respect of population growth in Table A3:
CATEGORIES Assumptions underpinning each sector’s carbon emiss ions
Power stations Assumed growth in emissions from EfW according to predicted levels of municipal solid waste to 2030. Retained on-island power generation at 2009 levels into future (standby levels only)
Industrial combustion Applied sector growth per decade as predicted from the energy demand model
Aviation Applied sector growth per decade as predicted from the energy demand model
Road transport Applied sector growth per decade as predicted from the energy demand model
Commercial Applied sector growth per decade as predicted from the energy demand model
Domestic Applied sector growth per decade as predicted from the energy demand model
Land use, change & forestry
Remains static at 2009 level since little scope for significant scale landscape / agricultural changes
Agriculture Remains static at 2009 level since assumed present levels of agriculture and livestock levels
Waste water treatment Calculated as a function of population change per decade
HFCs, PFCs & SF6 Calculated as a function of population change per decade on 1995 baseline
Table A3 Assumptions underpinning forecasts of carbon emissions to 2050. For further detail see supporting worksheet.

16

17
Appendix 3 The Energy Partnership
Government, industry and the third sector will monitor, review and work towards a low carbon Jersey in line with the actions outlined in Pathway 2050. The Partnership will comprise of two parts;
• Ministerial energy executive, • Multi stakeholder energy forum.
The energy executive will be responsible for the ongoing monitoring of the work streams as outlined in the action statements. The executive will also review the Plan and will develop or commission either new policy interventions or work streams, as appropriate according to review findings. The executive will include representation from the Ministers for the Department of the Environment, Economic Development, Transport and Technical Services and Social Security Departments; secretariat will be provided by the Department of the Environment. The executive will present the 5 year review to the States Assembly and will provide an annual progress update to the Environment Scrutiny Panel. The energy executive will receive reports from project teams and also relevant research studies commissioned to support the energy Plan. The energy executive will also receive, for consideration, reports from the Statistics Unit including the annual GHG inventory data. The energy forum, with a Chair elected on an annual basis, will include representatives from the energy industry, businesses and the third sector, and will provide an opportunity for key stakeholders to input on the progress of the Energy Plan and raise areas of concern and identify changing or future priorities. Project teams, which will include officers and key stakeholders who may also be participants on the forum, will work together to deliver individual action statements and will report progress against KPI’s to the energy executive annually. The draft terms of reference of the whole Energy Partnership will be confirmed at the first meeting of the executive.

18
Draft terms of reference Terms of Reference for the Energy Executive : 1. Objectives 1.1 Oversee the implementation of the Action Statements and work streams as identified in
the adopted Pathway 2050:Energy Plan, with the aim of ensuring that Jersey meets its international obligations.
1.2 Report progress annually on implementation of the Plan to the Council of Ministers to ensure energy considerations are incorporated into long term strategy.
2. Operational
2.1 Receive monitoring information of progress of implementation against the key
performance indicators set out in the Energy Plan. 2.2 Provide guidance if performance is ‘off target’ 2.3 Report to the Council of Ministers performance against KPIs and highlight any areas at
risk.
3. Development
3.1 To review new opportunities and works streams for projects that are proposed by the Energy Forum which meet the aims and objectives of the Energy Plan.
3.2 Receive annual reports from project teams 3.3 Undertake annual review of progress of implementation of the Energy plan to identify any
gaps in delivery.
4. Governance
4.1 The Minister for Planning and the Environment will Chair the Energy Executive. 4.2 The Membership of the Executive will comprise those Ministers with major responsibilities
in terms of Energy. 4.3 Quarterly meetings will take place. 4.4 Should a vote be taken, the casting vote of the Chair will be binding. 4.5 Minutes from the meetings will be circulated within 7 working days.

19
4.6 The Department of the Environment will provide the secretariat service for the Energy Executive.
Terms of reference for the Energy Forum : 1. Objectives
1.1 Assist with the identification of stakeholders and partnership working opportunities. 1.2 Act as an ambassador for Pathway 2050 and provide introductions where possible. 1.3 Act as a source of inspiration and as sounding board for the development of new projects 1.4 Propose new projects to the Energy Executive Group to influence strategy.
2. Governance
2.1 The Energy forum is a non-political body 2.2 Meetings will be held every 6 months. 2.3 A Chair will be nominated and elected from the group for a term of 12 months. 2.4 Members of the Energy forum may participate in Action Statement project teams. 2.5 The Department of the Environment will provide the secretariat service for the Energy
Forum.

20

21
Appendix 4: Impact Assessments
All of the Proposed Action Statements have been assessed against the following criteria for their contribution to the goals of the Energy Plan (i.e. to provide secure, affordable and sustainable energy):
Sustainability
Sustainability means that activities associated with energy and energy use meet the needs of the present without compromising the ability of future generations to meet their needs. Specifically this means not causing environmental harm and moving away from diminishing sources of energy and towards renewable sources.
Likely to be achieved by:
• Reducing emissions of GHGs in line with our international commitments to reduce emissions to 20% of 1990 levels by 2050, an 80% reduction.
• Moving towards renewable sources of energy where it can be justified on grounds of economics, security and sustainability
• Bringing forward other environmental benefits (e.g. improved biodiversity)
Affordability
Affordability means:
• Ensuring that the most vulnerable groups in society do not struggle to pay for an acceptable level of energy i.e. adequate heating, electricity and hot water and;
• Efficient mix and use of energy to keep the cost of energy to a minimum given sustainability and security objectives.
Could be achieved by:
• Redistribution to these vulnerable groups from some other source (be it other energy customers, taxpayers, or other)
• A reduction in energy demand so reducing consumer’s future exposure to increased global energy costs than might be the case without action;
• The delivery of energy at best value to the consumer.
Security
Security of energy supply means the uninterrupted physical availability at a price which is affordable.
Could be achieved by:
• Prevention: o A reduction in energy demand and thus reducing imported energy and
lengthened lifespan of existing energy infrastructure and need for infrastructure upgrades to cope with increased demand;
o More diverse sources of energy; o Increased potential for locally generated energy, where appropriate

22
• Planning: More effective resilience planning.
However energy security is about balancing the risks and costs of threats to the energy supply with the cost of reducing them. At present the risks to energy security in Jersey are not well understood. It is proposed that work is undertaken to gain a better of the potential threats to the availability of energy to Jersey, the costs that these threats could impose on the Island should they materialise, and the specific actions that could be taken to mitigate them.

23
ACTION STATEMENT SECURITY AFFORDABILITY SUSTAINABILITY
Reduction in energy demand & so reduction
in imported energy
More diverse sources of
energy
More effective resilience planning
Reduction in energy demand
Increased competition
in the marketplace
Reducing emissions of
GHGs
Other benefits
1 The formation of an Energy Partnership √ √ √ √ √ √ √
2
Introducing a low-carbon standard through Building
ByeLaws
√ √ √ √ √ √
3
Energy efficiency measures applied to
pre-1997 stock of properties
√ √ √ √ √
4 Implement micro-renewables in the domestic sector
√ √ √
5 Assisting the uptake of microgeneration √ √ √
6
Improved energy efficiency through behaviour change
programme
√ √ √
7 Energy Efficiency
improvements in the public sector
√ √ √
8 Energy Efficiency
improvements in the private sector
√ √ √
9 Reducing emissions
from ruminants √ √
10 The implementation √ √

24
of Anaerobic Digestion systems for waste management of
livestock slurry by 2020
11
The effect of improved EU
emissions standards for cars
√ √ √
12
The effect of improved EU
emissions standards for vans
√ √ √
13
The effect of an increase in the
number of ultra low emission vehicles
(ULEVs)
√ √ √
14
Achieving Sustainable Transport Policy 2010
congestion management targets
√ √
15 Achieve a 5% shift to sustainable modes transport by 2020
√ √ √
16
The effect of improved international operating standards
for aircraft
√ √ √ √
17 Liquid Waste
Treatment Options √ √ √ √
18
Working to negate unavoidable residual
carbon emissions after CO2 targets
have been achieved
√ √
19 Understanding energy
security in the local √

25
context
20 Contingency planning and stock holding for liquid hydrocarbons
√
21 Working with Jersey
Electricity to set supply standards
√ √ √
22 Preparing the way for utility scale renewable
energy √ √ √
23 Minimising residual
waste √ √ √ √
24
Investigating district heating from the
energy from waste plant
√ √ √ √
25 Investigating and
supporting the use of biofuels
√ √ √ √
26 Understanding
affordable energy in the Jersey context
√ √
27
Understanding how competition in the
local energy market affects prices paid by
consumers
√

26

27
Appendix 5 Resource assessments to deliver energy efficiency in the domestic sector
Action Statements 3 to 8 apply to the domestic and business sector and are based on the delivery of a series of energy efficiency interventions. The delivery mechanism will be the extended activity of the Eco-Active Energy Efficiency Service which receives revenue funding of approx £900,000 per annum. The direct costs for implementation of the action statements, where known, are included within the main Energy Plan document. This appendix provides an overview of the budget for the provision of the Energy Efficiency Service in recognition of the interdependent nature of the work to deliver the actions to both the domestic and commercial sector. The table below provides an illustrative re-profiled budget for the Energy Efficiency Service for the next 5 years. If additional resources were made available, the implementation of the programmes outlined could be accelerated and the reach extended to a wider section of the community. The costs outlined represent the direct delivery costs, for the first 5 years only, based on the actions as outlined in the Energy Plan, they do not include external costs such as skills based training for the construction sector.
Year 1 Year 2 Year 3 Year 4 Year 5
Energy efficiency measures applied to pre-1997 stock of properties
627,000 637,000 598,000 620,000 654,100
Implement micro-renewables in the domestic sector
0 0 20,000 20,000 20,000
Assisting the uptake of microgeneration
0 10,000 50,000 50,000 50,000
Improved energy efficiency through behaviour change
programme
75,000 75,000 75,000 75,000 75,000
Energy efficiency improvements in the
Private Sector 80,000 80,000 80,000 80,000 80,000
Running the Energy Efficiency Service
131,000 131,000 131,000 131,000 131,000
SUBTOTAL (excluding Energy partnership)
£908,000 £928,000 £949,000 £971,000 £1,005,160
TOTAL (including Energy partnership)
£913,000 £933,000 £954,000 £976,000 £1,010,160
Note: Revenue figures based on medium term financial plan limits for years 1-2 and forecasts for years 3-5 based on 2.5% growth and 1% increase in staffing costs.

28

29
Appendix 6: Interpretation of Emissions savings by Sector to support Chapter 3.
This illustration shows how to read the information on the tables on the following pages.

30
Emissions Pathway for each sector The following pages present the cumulative emissions savings for the interventions for each sector. Domestic Sector
Domestic BAU 1990 2009 2020 2030 2040 2050
2050 Target 80%
reduction on 1990 levels
Emissions under a business as usual scenario (t/CO 2eq)
113,144 104,292 98,761 93,598 91,112 87,570 22,629
Table above: Forecast of GHG emissions under a ‘business as usual’ scenario compared to the target emissions in 2050 of an 80% reduction on 1990 levels. With no interventions there is an estimated shortfall of 90,515 t/CO2eq.
Domestic Sector Interventions GHG emissions pathway (cumulative) from interventions by decade (t/CO 2eq)
Impact on total CO 2eq
savings
2020 2030 2040 2050 %
Energy efficiency measures applied to pre-1997 stock of properties
83,407 54,780 49,867 46,913 22%
Introducing a low-carbon standard through Building Bye-Laws (by 2014 60% more efficient homes and 2018 carbon neutral for space heating)
78,745 50,118 45,205 42,251 3%
Implement micro-renewables in the domestic sector (solar thermal)
78,745 50,066 32,052 29,098 4%
Improved energy efficiency through behaviour change programme
73,981 45,303 29,670 26,716 2%
Final emissions pathway after all interventions and % reduction 73,981 45,303 29,670 26,716
(76%)
Table above: The emissions pathways as a result of the each intervention in the domestic sector. Note that after the interventions emissions can be reduced by 76% as illustrated in the graph below

31
Industrial and Commercial
Industrial and Commercial
BAU 1990 2009 2020 2030 2040 2050
Target 20% of
1990 levels
Emissions under a business as usual scenario (t/CO2eq)
98,780 78,049 47,858 36,408 27,247 19,918 19,756
Table above: Forecast of GHG emissions from the industrial and commercial sector under a ‘business as usual’ scenario compared to the target emissions in 2050 of an 80% reduction on 1990 levels. With no interventions there is an estimated shortfall of 79,024 t/CO2eq.
Industrial and Commercial Interventions GHG emissions pathway (cumulative) from interventions by decade (t/CO 2eq)
Impact on total CO 2eq
savings
2020 2030 2040 2050 %
Energy efficiency improvements in the Public Sector (States of Jersey). 10% reduction to 2010-2015 and then a 15% reduction to 2020 and a further 10% per decade thereafter)
70,410 62,723 54,616 47,182 6%
Energy efficiency improvements in the Private Sector (15% by 2020 and a further 10% per decade thereafter)
61,014 53,327 45,220 37,786 10%
Final emissions pathway after all interventions and % reduction 47,858 36,408 27,247 19,918
(80%)
Table above: The emissions pathways as a result of the each intervention in the industrial and commercial sector. Note that after the interventions emissions can be reduced by 80% as illustrated in the graph below.

32
Agriculture
Agriculture BAU 1990 2009 2020 2030 2040 2050 Target 20% of
1990 levels
Emissions under a business as usual scenario (t/CO2eq)
26,037 19,331 19,331 19,331 19,331 19,331 5,207
Table above: Forecast of GHG emissions from the agricultural sector under a ‘business as usual’ scenario compared to the target emissions in 2050 of an 80% reduction on 1990 levels. With no interventions there is an estimated shortfall of 20,830 t/CO2eq
Agriculture Interventions GHG emissions pathway (cumulative) from interventions by decade (t/CO 2eq)
Impact on total CO 2eq
savings
2020 2030 2040 2050 %
Reduction in emissions from ruminants (30% by 2030)
19,331 19,331 15,910 15,910 1
Implementation of Anaerobic Digestion systems for waste management of livestock slurry by 2020
15,368 11,405 7,984 7,984 4
Final emissions pathway after all interventions and % reduction 15,368 11,405 7,984 7,984
(69%)
Table above: The emissions pathways as a result of the each intervention in the Agriculture sector. Note that after the interventions emissions can be reduced by 69% as illustrated in the graph below.

33
Road Transport
Road Transport BAU 1990 2009 2020 2030 2040 2050
Target 20% of 1990
levels Emissions under a business as usual scenario (t/CO 2eq)
122,445 121,940 128,249 133,907 138,620 141,762 24,489
Table above: Forecast of GHG emissions from the Road Transport sector under a ‘business as usual’ scenario compared to the target emissions in 2050 of an 80% reduction on 1990 levels. With no interventions there is an estimated shortfall of 97,956 t/CO2eq
Road Transport Interventions GHG emissions pathway (cumulative) from interventions by decade (t/CO 2eq)
Impact on total CO 2eq
savings
2020 2030 2040 2050 %
Savings from improved EU standards for car emissions (fleet turns over and emissions reduced by 32% on BAU by 2030)
128,249 110,473 114,362 116,954 12
5% Modal shift i.e. Mileage redn of 5% 122,638 109,302 113,149 115,714 2
Savings as a result of low emission cars - ULEVs replace EU compliant vehicles
114,642 90,789 74,820 42,219 22
Emissions accounting for STP measures by 2020 110,463 86,610 70,641 38,039 3
Forecast emmissions from vans and lorries (accounting for fleet change & Eu redn)
107,898 83,932 67,869 35,204 1
Final emissions pathway after all interventions and % reduction 107,898 83,932 67,869 35,204
(71%)
Table above: The emissions pathways as a result of the each intervention in the Road Transport sector. Note that after the interventions emissions can be reduced by 71% as illustrated in the graph below.

34

35
Aviation
Aviation BAU 1990 2009 2020 2030 2040 2050
Target 20% of 1990
levels Emissions under a business as usual scenario (t/CO2eq)
44,710 43,144 52,295 63,599 72,726 82,604 8,942
Table above: Forecast of GHG emissions from the aviation sector under a ‘business as usual’ scenario compared to the target emissions in 2050 of an 80% reduction on 1990 levels. With no interventions there is an estimated shortfall of 35,768 t/CO2eq
Aviation Interventions GHG emissions pathway (cumulative) from interventions by decade (t/CO 2eq)
Impact on total CO2eq
savings
2020 2030 2040 2050 %
Improved international operating standards for aircraft (By 2050 reduce emissions by 50% on 2005 levels)
44,100 63,010 65,120 74,998 4%
Final emissions pathway after all interventions and % reduction 44,100 63,010 65,120 74,998
(+68%)
Table above: The emissions pathways as a result of the each intervention in the aviation sector. Note that after interventions emissions will increase by approximately 68% as illustrated in the graph below.

36
F-gases
F-gases BAU 1990 2009 2020 2030 2040 2050
Target 20% of 1990
levels Emissions under a business as usual scenario (t/CO2eq)
2,755 26,097 27,630 28,954 29,973 30,668 5,219
Table above: Forecast of GHG emissions from the aviation sector under a ‘business as usual’ scenario compared to the target emissions in 2050 of an 80% reduction on 1990 levels. With no interventions there is an estimated shortfall of 20,878 t/CO2eq
Aviation Interventions GHG emissions pathway (cumulative) from interventions by decade (t/CO 2eq)
Impact on total CO2eq
savings
2020 2030 2040 2050 %
Improved international operating standards for aircraft (By 2050 reduce emissions by 50% on 2005 levels)
10,439 5,219 5,219 5,219 3%
Final emissions pathway after all interventions and % reduction 10,439 5,219 5,219 5,219
(80%)
Table above: The emissions pathways as a result of the each intervention in the F-gas sector. Note that the intervention of the F-gas regulation reduces emissions by 80% as illustrated in the graph below. It is assumed that market availability and compliance of producers with the regulation will drive this intervention. It is anticipated that there will be a small legacy amount of material which will decline over time as products and equipment is replaced following the phase out.