Embed Size (px)
Citation preview
Journal of Modern Applied StatisticalMethods
Volume 14 | Issue 2 Article 7
11-1-2015
An Empirical Study on Different Ranking Methodsfor Effective Data ClassificationIlangovan SangaiahK.L.N. College of Engineering, Madurai, India, [email protected]
A. Vincent Antony KumarPSNA College of Engineering and Technology, Dindigul, India, [email protected]
Appavu BalamuruganK.L.N. College of Information Technology, Tamil Nadu, India, [email protected]
Follow this and additional works at: http://digitalcommons.wayne.edu/jmasm
Part of the Applied Statistics Commons, Social and Behavioral Sciences Commons, and theStatistical Theory Commons
This Regular Article is brought to you for free and open access by the Open Access Journals at DigitalCommons@WayneState. It has been accepted forinclusion in Journal of Modern Applied Statistical Methods by an authorized editor of DigitalCommons@WayneState.
Recommended CitationSangaiah, Ilangovan; Antony Kumar, A. Vincent; and Balamurugan, Appavu (2015) "An Empirical Study on Different RankingMethods for Effective Data Classification," Journal of Modern Applied Statistical Methods: Vol. 14 : Iss. 2 , Article 7.DOI: 10.22237/jmasm/1446350760Available at: http://digitalcommons.wayne.edu/jmasm/vol14/iss2/7
Journal of Modern Applied Statistical Methods
November 2015, Vol. 14, No. 2, 35-52.
Copyright © 2015 JMASM, Inc.
ISSN 1538 − 9472
Ilangovan Sangaiah is a PhD candidate Department of Information and Communication Engineering at Anna University and faculty at KLN College of Engineering. Dr. A. Vincent Antony Kumar is Professor and head of Information technology. Dr. Appavu
Alais Balamurugan S. is head of Information Technology. Email him at: [email protected] .
35
An Empirical Study on Different Ranking Methods for Effective Data Classification
Ilangovan Sangaiah K.L.N. College of
Engineering
Madurai, India
A. V. Antony Kumar PSNA College of
Engineering and Technology
Dindigul, India
Appavu Balamurugan K.L.N. College of
Information Technology
Tamil Nadu, India
Ranking is the attribute selection technique used in the pre-processing phase to emphasize the most relevant attributes which allow models of classification simpler and easy to understand. It is a very important and a central task for information retrieval, such as web search engines, recommendation systems, and advertisement systems. A
comparison between eight ranking methods was conducted. Ten different learning algorithms (NaiveBayes, J48, SMO, JRIP, Decision table, RandomForest, Multilayerperceptron, Kstar) were used to test the accuracy. The ranking methods with different supervised learning algorithms give different results for balanced accuracy. It was shown the selection of ranking methods could be important for classification accuracy.
Keywords: Feature selection, Ranking Methods, Classification algorithms, Classification accuracy
Introduction
Ranking is a crucial part of information retrieval. It is able to compute sorted
score when given document as objects. Ranking is a central issue in information
retrieval, in which, given a set of objects (e.g., Documents), a score for each of
them is computed and the objects are sorted according to the scores. Depending
on the applications the scores may represent the degrees of relevance, preference,
or importance. Ranking is a very important topic in feature selection. Although
algorithms for learning ranking models have been intensively studied, this is not
the case for feature selection, despite of its importance. The reality is that many

SANGAIAH ET AL.
36
feature selection methods used in classification are directly applied to ranking.
Because of the striking differences between ranking and classification, it is better
to develop different feature selection methods for ranking.
Feature selection has emerged as a successful mechanism in many machine
learning applications. Feature selection is also desirable for learning to rank. First,
as the numbers of useful features for ranking are continuously growing, the time
of extracting such high-dimensional features has become a bottleneck in ranking.
High-dimensional features may be redundant or noisy, which results in poor
generalization performance. Also, a ranking model with only a small set of
features has less computational cost in prediction. Recently, considerable efforts
have been made on feature selection for ranking. The main aim of this paper was
to experimentally verify the impact of different ranking methods on classification
accuracy.
The only way to be sure that the highest accuracy is obtained in practical
problems is testing a given classifier on a number of feature subsets, obtained
from different ranking indices. Diverse feature ranking and feature selection
techniques have been proposed in the machine learning literature. The purpose of
these techniques is to discard irrelevant or redundant features from a given feature
vector. The usefulness of the following commonly used ranking methods in
different datasets are considered:
1. Relief.
2. Gain Ratio (GR).
3. Information Gain (IG).
4. One-R.
5. Symmetrical Uncertainty (SU).
6. Chi-Squared.
7. Support Vector Machine (SVM).
8. Filter.
The results were validated using different algorithms for classification. A
wide range of classification algorithms is available, each with its strengths and
weaknesses. There is no single learning algorithm that works best on all
supervised learning problems.

STUDY ON DIFFERENT RANKING METHODS FOR CLASSIFICATION
37
Review of the literature
A ranking is a task that applies machine learning techniques to learn good ranking
predictors. It is a relationship between a set of items and a unit that refer to
different values. Many learning-to-rank algorithms have been proposed. The two
prime functions of ranking are to deliver highly relevant search results and to be
fast in ranking results. Many feature selection and feature ranking methods have
been proposed. Fuhr and Norbert (1989) introduced a Ranking OPRF method
which uses the idea of Polynomial regression. Cooper, Gey and Dabney (1992)
proposed a point wise SLR (Staged logistic regression ranking) method. A
RELIEF ranking algorithm was proposed by Kira and Rendell (1992).
The strengths of relief is that, it is not dependent on heuristics, it requires
only linear time in the number of given features and training instances, and it is
noise-tolerant and robust to feature interactions, as well as being applicable for
binary or continuous data. However, it does not discriminate between redundant
features, and low numbers of training instances fool the algorithm. Robnik-
Sikonja and Kononenko (2003), proposed some updates to the algorithm
(RELIEF-F) in order to improve the reliability of the probability approximation,
make it robust to incomplete data, and generalizing it to multi-class problems.
Then the original Support Vector Machine algorithm (SVM) was invented by
Vladimir N. Vapnik in 1992 (Cortes & Vapnik, 1995). This SVM is supervised
learning models with associated learning algorithms that analyze data and
recognize patterns, used for classification and regression analysis. SVMs are
based on the concept of decision planes that define decision boundaries. A
decision plane is one that separates between a set of objects having different class
memberships. SVMs deliver state-of-the-art performance in real-world
applications such as text categorization, hand-written character recognition, image
classification, bio sequences analysis, etc., and are now established as one of the
standard tools for machine learning and data mining.
Information Gain Another ranking method called as Information Gain (IG)
evaluates the worth of an attribute by measuring the information gain with respect
to the class. An attribute selection measure, based on pioneering work by Claude
Shannon on information theory, which studied the value of the information
content of messages. It is given by
Y X
IG H Y H H X HX Y

SANGAIAH ET AL.
38
IG is a symmetrical measure. The information gained about Y after
observing X is equal to the information gained about X after observing Y. A
weakness of the IG criterion is that, it is biased in favour of features with more
values even when they are not more informative.
The attribute has the best score for the measure is chosen as the splitting
attribute for the given tuple. Depending on the measure, either the highest or
lowest score is chosen as the best attribute. The IG measure is biased toward tests
with many outcomes. That is, it prefers to select attributes having large number of
values.
Gain Ratio But Gain Ratio is the extension of IG which attempts to overcome
this bias. It evaluates the worth of an attribute by measuring the gain ratio with
respect to the class. The Gain Ratio is the non-symmetrical measure that is
introduced to compensate for the bias of the IG (Hall & Smith, 1998). Gain Ratio
is given by
G R IG H X
When the variable Y has to be predicted, we normalize the IG by dividing by
the entropy of X, and vice versa. Due to this normalization, the GR values always
fall in the range [0, 1]. A value of GR = 1 indicates that the knowledge of X
completely predicts Y, and GR = 0 means that there is no relation between Y and X.
In opposition to the IG, the GR favours variables with fewer values.
Symmetrical Uncertainty The Symmetrical Uncertainty criterion compensates
for the inherent bias of IG by dividing it by the sum of the entropies of X and Y
(Hall & Smith, 1998). It is given by
2IG
SUH Y H X
SU takes values, which are normalized to the range [0, 1] because of the
Correction factor 2. A value of SU = 1 means that the knowledge of one feature
completely predicts, and the other SU = 0 indicates, that X and Y are uncorrelated.
Similar to GR, the SU is biased toward features with fewer values.

STUDY ON DIFFERENT RANKING METHODS FOR CLASSIFICATION
39
Chi-squared Feature Selection via chi square test is another very
commonly used method (Liu & Setiono, 1995). Chi-squared attribute evaluation
evaluates the worth of a feature by computing the value of the chi-squared
statistic with respect to the class. The initial hypothesis H0 is the assumption that
the two features are unrelated, and it is tested by chi squared
Formula:
2
2
1 1
r cij ij
i j ij
O Ex
E
where Oij is the observed frequency and Eij is the expected (theoretical) frequency,
asserted by the null hypothesis. The greater the value of χ2, the greater the
evidence against the hypothesis H0 is.
One-R OneR is a simple algorithm proposed by Holte (1993). It builds
one rule for each attribute in the training data and then selects the rule with the
smallest error. It treats all numerically valued features as continuous and uses a
straightforward method to divide the range of values into several disjoint intervals.
It handles missing values by treating "missing" as a legitimate value. This is one
of the most primitive schemes. It produces simple rules based on feature only.
Although it is a minimal form of classifier, it can be useful for determining a
baseline performance as a benchmark for other learning schemes.
A pairwise RankSVM (Herbrich, Graepel & Obermayer, 2000) method was
devised that out performs more naive approaches to ordinal regression such as
Support Vector Classification and Support Vector Regression in the case of more
than two ranks. In the year 2003, 2005 and 2006 a pairwise RankBoost, RankNet
(Burges et al., 2005) and IR-SVM, Lambda Rank methods were developed.
Subsequently, in 2007, the ranking methods Frank, GB Rank, ListNet, McRank,
QBRank, RankCosine, RankGP, and RankRLS were innovated. In the year 2007
a listwise ranking methods ListNet, RankCosine, RankGPand, SVMmap (Yue,
Finley, Radlinski, & Joachims, 2007) were introduced. Ranking Refinement
method (2008) is a semi-supervised approach to learning to rank that uses
Boosting. Then a list wise ranking methods LambdaMART (Wu, Burges, Svore,
& Gao 2008), ListMLE, PermuRank, SoftRank and a pairwise ranking methods
Ranking Refinement (Rigutini, Papini, Maggini, & Scarselli, 2008) SSRankBoost
(Amini, Troung, & Goutte, 2008), SortNet (Rigutini et al., 2008) were developed
in 2008. In 2009 MPBoost, BoltzRank and BayesRank (Kuo, Cheng, & Wang,
SANGAIAH ET AL.
40
2009) later in 2010 NDCG Boost (Valizadegan, Jin, Zhang, & Mao, 2010),
Gblend, IntervalRank (Moon, Smola, Chang, & Zhen, 2010) and CRR (Sculley,
2010) were discovered.
Point wise approach It is assumed that each query-document pair in the
training data has a numerical or ordinal score. Then learning-to-rank problem can
be approximated by a regression problem-given a single query-document pair,
predict its score.
Pairwise approach The learning-to-rank problem is approximated by a
classification problem- learning a binary classifier that can tell which document is
better in a given pair of documents. The goal is to minimize the average number
of inversions in ranking.
List wise approach These algorithms try to directly optimize the value
of one of the above evaluation measures, averaged over all queries in the training
data. This is difficult because most evaluation measures are not continuous
functions with respect to ranking model's parameters, and so continuous
approximations or bounds on evaluation measures have to be used.
Proposed work and experimental results
Weka tool Data mining or “Knowledge Discovery in Databases” is the
process of discovering patterns in large data sets with artificial intelligence,
machine learning, statistics, and database systems. The overall goal of a data
mining process is to extract information from a data set and transform it into an
understandable structure for further use. In its simplest form, data mining
automates the detection of relevant patterns in a database, using defined
approaches and algorithms to look into current and historical data that can then be
analyzed to predict future trends. A data mining tools predict future trends and
behaviours by reading through databases for hidden patterns; they allow
organizations to make proactive, knowledge-driven decisions and answer
questions that were previously too time-consuming to resolve.
With Weka, Open Source software, patterns can be discovered in large data
sets and extract all the information. It is a comprehensive tool for machine
learning and data mining for predictive analytics. Weka is a collection of machine
learning algorithms for data mining tasks. The algorithms can either be applied
directly to a data set or called from your own JAVA code. It is also well suited for

STUDY ON DIFFERENT RANKING METHODS FOR CLASSIFICATION
41
developing new machine learning schemes. It also brings great portability, since it
was fully implemented in the JAVA programming language, plus supporting
several standard data mining tasks. It contains tools for data pre-processing,
classification, regression, clustering, association rules, and visualization. Different
ranking methods can also be implemented using the data pre-processing tool
which is available in Weka. It is also well-suited for developing new machine
learning schemes.
Methodology
Datasets used in experiments
Five datasets are used: diabetes, segment-challenge, soybean, vote and ionosphere
from the UCI data repository (Lichman, 2013). The first dataset is the diabetes
data which has 768 instances and 9 attributes. The second data set segment-
challenge has 1500 instances and 20 attributes. Similarly soybean, vote and
ionosphere datasets have 683,435,351 instances and 36, 17, 35 attributes
respectively. In Weka a wide range of classification algorithms is available for
data analysis. From this wide range of learning algorithms, eight different
algorithms are chosen and applied on all the five datasets for our study. Table 1. Datasets used in the Experiment.
Sl.No Name of the Dataset No. of attributes No. of Instances
1 Diabetes 9 768
2 segment-challenge 20 1500
3 soybean 36 683
4 vote 17 435
5 ionosphere 35 351

SANGAIAH ET AL.
42
Table 2. Classification accuracy of different Classification algorithm without Ranking.
S. No. Dataset NB J48 SMO JRIP DT Rd.Frt Mul.pr Kstar
1 Diabetes 76.3 73.82 77.34 76.04 71.22 73.82 75.39 69.14
2 Segment-challenge 81.06 95.73 91.93 93.73 87.4 96.93 96.73 96.6
3 soybean 92.97 91.5 93.85 91.94 84.33 92.09 93.41 87.99
4 vote 90.11 96.32 96.09 95.4 94.94 95.63 94.71 93.33
5 ionosphere 82.62 91.45 88.6 89.74 89.45 92.87 91.16 84.61
Classification Average 84.61 89.76 89.56 89.37 85.47 90.27 90.28 86.33
Table 3. Processing Time of different Classification algorithm without Ranking.
S. No. Dataset NB J48 SMO JRIP DT Rd.Frt Mul.pr Kstar
1 Diabetes 0.02 0.04 0.26 0.06 0.09 0.13 1.96 0.0
2 Segment-challenge 0.02 0.09 1.85 0.55 0.49 0.26 17.06 0.0
3 soybean 0.0 0.03 4.77 0.11 0.81 0.33 97.25 0.0
4 vote 0.0 0.0 0.04 0.01 0.09 0.07 2.41 0.0
5 ionosphere 0.01 0.04 0.08 0.07 0.15 0.01 6.59 0.0
Average Processing Time 0.01 0.04 1.4 0.16 0.32 0.16 25.05 0
STUDY ON DIFFERENT RANKING METHODS FOR CLASSIFICATION
43
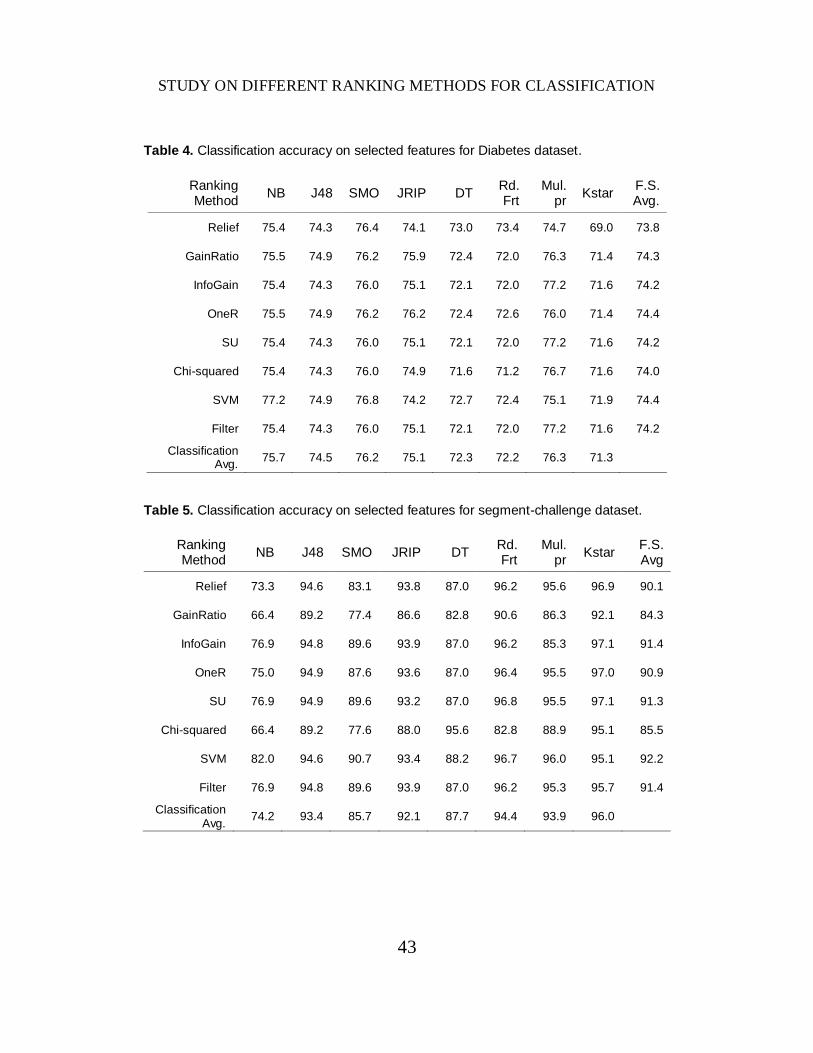
Table 4. Classification accuracy on selected features for Diabetes dataset.
Ranking Method
NB J48 SMO JRIP DT Rd. Frt
Mul. pr
Kstar F.S. Avg.
Relief 75.4 74.3 76.4 74.1 73.0 73.4 74.7 69.0 73.8
GainRatio 75.5 74.9 76.2 75.9 72.4 72.0 76.3 71.4 74.3
InfoGain 75.4 74.3 76.0 75.1 72.1 72.0 77.2 71.6 74.2
OneR 75.5 74.9 76.2 76.2 72.4 72.6 76.0 71.4 74.4
SU 75.4 74.3 76.0 75.1 72.1 72.0 77.2 71.6 74.2
Chi-squared 75.4 74.3 76.0 74.9 71.6 71.2 76.7 71.6 74.0
SVM 77.2 74.9 76.8 74.2 72.7 72.4 75.1 71.9 74.4
Filter 75.4 74.3 76.0 75.1 72.1 72.0 77.2 71.6 74.2
Classification Avg.
75.7 74.5 76.2 75.1 72.3 72.2 76.3 71.3
Table 5. Classification accuracy on selected features for segment-challenge dataset.
Ranking Method
NB J48 SMO JRIP DT Rd. Frt
Mul. pr
Kstar F.S. Avg
Relief 73.3 94.6 83.1 93.8 87.0 96.2 95.6 96.9 90.1
GainRatio 66.4 89.2 77.4 86.6 82.8 90.6 86.3 92.1 84.3
InfoGain 76.9 94.8 89.6 93.9 87.0 96.2 85.3 97.1 91.4
OneR 75.0 94.9 87.6 93.6 87.0 96.4 95.5 97.0 90.9
SU 76.9 94.9 89.6 93.2 87.0 96.8 95.5 97.1 91.3
Chi-squared 66.4 89.2 77.6 88.0 95.6 82.8 88.9 95.1 85.5
SVM 82.0 94.6 90.7 93.4 88.2 96.7 96.0 95.1 92.2
Filter 76.9 94.8 89.6 93.9 87.0 96.2 95.3 95.7 91.4
Classification Avg.
74.2 93.4 85.7 92.1 87.7 94.4 93.9 96.0

SANGAIAH ET AL.
44
Table 6. Classification accuracy on selected features for soybean dataset.
Ranking Method
NB J48 SMO JRIP DT Rd. Frt
Mul.Pr
Kstar F.S. Avg.
Relief 89.5 88.6 92.8 87.8 80.1 89.0 92.1 88.3 88.5
GainRatio 85.8 85.2 86.2 84.9 82.7 87.4 87.4 86.1 85.7
InfoGain 89.9 88.3 93.0 88.7 80.1 86.8 93.3 88.9 88.6
OneR 83.6 85.4 87.1 84.8 83.9 86.5 87.3 86.4 85.6
SU 89.8 90.3 93.4 89.8 82.4 88.3 93.6 90.5 89.8
Chi-squared 89.2 89.8 93.9 89.6 81.3 91.4 93.7 90.0 89.8
SVM 0.0 0.0 0.0 0.0 0.0 0.0 0.0 0.0 0.0
Filter 89.9 88.3 93.0 89.9 80.1 86.8 93.3 88.9 88.8
Classification Avg.
88.2 88.0 91.3 87.9 81.5 88.0 91.5 88.4
Table 7. Classification accuracy on selected features for vote dataset.
Ranking Method
NB J48 SMO JRIP DT Rd. Frt
Mul Pr
Kstar F.S. Avg.
Relief 90.3 96.3 95.6 95.9 95.9 95.9 93.8 94.9 94.8
GainRatio 91.3 95.2 95.6 95.6 95.6 94.5 95.2 92.9 94.5
InfoGain 91.3 95.2 95.6 95.6 95.6 94.5 95.2 92.9 94.5
OneR 90.6 94.7 95.6 95.4 95.4 95.2 94.0 92.9 94.2
SU 91.3 95.2 95.6 95.6 95.6 94.1 95.2 92.9 94.4
Chi-squared 91.3 95.2 95.6 95.6 95.6 93.6 94.0 92.9 94.2
SVM 91.5 96.3 95.9 96.3 94.7 95.9 94.9 94.0 94.9
Filter 91.3 95.2 95.6 95.6 95.6 94.3 95.2 92.9 94.5
Classification Avg.
91.1 95.4 95.7 95.7 95.5 94.7 94.7 93.3

STUDY ON DIFFERENT RANKING METHODS FOR CLASSIFICATION
45
Table 8. Classification accuracy on selected features for ionosphere dataset.
Ranking Method
NB J48 SMO JRIP DT Rd. Frt
Mul Pr
Kstar F.S. Avg.
Relief 86.3 92.9 87.7 90.9 89.5 93.2 90.9 84.6 89.5
GainRatio 87.5 90.3 87.7 91.7 89.5 93.4 92.6 85.2 89.7
InfoGain 88.0 92.0 87.7 90.9 89.5 93.4 94.0 86.6 90.3
OneR 88.0 92.0 87.7 90.9 89.5 93.4 91.5 84.6 89.7
SU 88.0 92.0 87.7 90.9 89.5 93.4 92.0 86.3 90.0
Chi-squared 88.0 92.0 87.7 90.9 89.5 93.4 94.6 86.6 90.3
SVM 88.0 92.0 87.7 90.9 89.5 93.4 91.1 87.2 90.0
Filter 88.0 92.0 87.7 90.9 89.5 93.4 94.0 86.6 90.3
Classification Avg.
87.7 91.9 87.7 91.0 89.5 93.4 92.6 86.0
Table 9. Average Classification accuracy on Full set with ranking.
Ranking Method
NB J48 SMO JRIP DT Rd. Frt
Mul. Pr
Kstar F.S. Avg
Relief 84.51 89.65 89.56 89.06
2 85.65 89.89 72.53 86.82 85.96
GainRatio 84.61 89.65 89.53 88.77 85.08
4 91.00 90.52
87.082
88.28
InfoGain 84.61 89.70 89.37 89.46 85.22 90.62 90.33 86.82 88.27
OneR 84.61 89.76 89.55 88.91 85.38 90.91 90.25 85.16 88.07
SU 84.61 89.71 89.53 88.92 85.25 90.48 90.41 86.82 88.22
Chi-squared 84.61 89.71 89.56 89.19 85.35 90.55 90.47 86.38 88.23
SVM 82.52 89.33 88.49 88.60 85.81 90.45 89.39 85.81 87.55
Filter 84.61 89.71 89.56 89.46 85.22 90.62 90.34 86.56 88.26
Classification average
84.34 89.65 89.39 89.05 85.37 90.57 88.03 86.43

SANGAIAH ET AL.
46
Table 10. Average Classification accuracy on selected features with Ranking.
Ranking Method
NB J48 SMO JRIP DT Rd. Frt
Mul. Pr
Kstar F.S
Avg.
Relief 84.77 89.25 86.33 88.68 84.82 89.44 89.34 86.83 87.43
GainRatio 81.34 86.95 84.82 86.57 84.33 87.29 88.06 85.52 85.61
InfoGain 83.84 88.81 88.24 88.46 84.76 88.63 91.00 87.42 87.65
OneR 82.68 88.70 86.31 87.61 85.52 88.90 88.52 86.66 86.86
SU 84.10 89.30 88.55 88.70 85.23 88.79 90.70 87.68 87.88
Chi-squared 81.71 88.11 85.91 87.91 84.25 87.72 89.58 86.74 86.49
SVM 84.17 88.67 87.86 87.69 86.45 88.86 89.32 87.27 87.54
Filter 83.84 88.81 88.24 88.46 84.76 88.63 91.00 87.42 87.65
Classification average
83.31 88.58 87.03 88.01 85.02 88.53 89.69 86.94
Table 11. Average processing time with ranking on Full set.
Ranking Method
NB J48 SMO JRIP DT Rd. Frt
Mul. Pr
Kstar F.S. Avg
Relief 0.02 0.06 2.67 0.22 0.34 0.19 24.90 0.00 3.55
GainRatio 0.00 0.04 1.25 0.18 0.32 0.18 24.93 0.00 3.36
InfoGain 0.01 0.04 1.39 0.16 0.33 0.18 24.99 0.00 3.39
OneR 0.01 0.04 1.05 0.17 0.37 0.17 25.02 0.00 3.35
SU 0.01 0.04 1.16 0.21 0.33 0.18 24.96 0.00 3.36
Chi-squared 0.01 0.04 1.15 0.22 0.36 0.17 24.97 0.00 3.37
SVM 0.01 0.03 0.41 0.18 0.17 0.11 5.61 0.00 0.82
Filter 0.00 0.04 0.88 0.19 0.35 0.17 24.87 0.00 3.31
Classification average
0.01 0.04 1.25 0.19 0.32 0.17 22.53 0.00

STUDY ON DIFFERENT RANKING METHODS FOR CLASSIFICATION
47
Table 12. Average processing time with on selected features.
Ranking Method
NB J48 SMO JRIP DT Rd. Frt
Mul. Pr Kstar F.S. Avg
Relief 0.00 0.02 1.45 0.13 0.13 0.10 12.15 0.00 1.75
GainRatio 0.00 0.04 0.93 0.13 0.12 0.10 9.36 0.00 1.34
InfoGain 0.00 0.02 0.99 0.12 0.17 0.14 13.06 0.00 1.81
OneR 0.00 0.02 0.98 0.12 0.17 0.10 10.72 0.00 1.51
SU 0.00 0.02 1.23 0.11 0.14 0.13 13.04 0.00 1.83
Chi-squared
0.00 0.02 1.00 0.13 0.13 0.11 12.59 0.00 1.75
SVM 0.00 0.02 0.30 0.08 0.07 0.09 2.55 0.00 0.39
Filter 0.00 0.02 0.80 0.11 0.13 0.11 12.99 0.00 1.77
Classification average
0 0.0225 0.96 0.11625 0.1325 0.11 10.8075 0
Table 13. Average Classification Accuracy and Processing Time for classification Algorithms.
Classification Algorithms
Without Ranking on Full set
With Ranking On Full set
With ranking On selected set
F.S Avg.
Processing Time(S)
F.S Avg.
Processing Time(S)
F.S Avg.
Processing Time(S)
NaiveBayes 84.61 00.01 84.34 0.01 83.31 00.00
J48 89.76 00.04 89.65 0.04 88.58 00.02
SMO 89.56 01.40 89.39 01.25 87.03 00.96
JRIP 89.37 00.16 89.05 00.19 88.01 00.11
Decision Tree
85.47 00.32 85.37 00.32 85.02 00.13
Random Forest
90.27 00.16 90.57 00.17 88.53 00.11
Multilayer Perceptron
90.28 25.05 88.03 22.53 89.69 10.80
Kstar 86.33 00.00 86.43 00.00 86.94 00.00

SANGAIAH ET AL.
48
Figure 1. Performance of Classification Algorithms.
Figure 2. Performance of Ranking based on feature selection Algorithms
Performance of Classification Algorithms
78
80
82
84
86
88
90
92
NB J48 SMO JRIP DT RF Mul.Pern Kstar
Classification Algorithms
Perfo
rm
an
ce (
%)
Without Ranking With Ranking With Selected Features
Performance of Ranking Methods
84
85
86
87
88
89
Relief GR IG OneR SU Chi-Sq SVM Filter
Ranking Methods
Perf
orm
an
ce (
in %
)
With ranking With Selected features

STUDY ON DIFFERENT RANKING METHODS FOR CLASSIFICATION
49
Figure 3. Processing Speed of Classification Algorithms.
Figure 4. Processing Speed of Ranking Methods.
Time Comparition of Classification Algorithms
0
5
10
15
20
25
30
NB J48 SMO JRIP DT RF Mul.Pern Kstar
Classification Algorithms
Perf
orm
an
ce(%
)
Without Ranking With Ranking With Selected Features
Time comparion of Ranking Methods
0
1
2
3
4
Relief GR IG OneR SU Chi-Sq SVM Filter
Ranking Methods
Pro
cessin
g T
ime (
in
Sec)
With ranking With selected features

SANGAIAH ET AL.
50
Results
Ranking from datasets is indeed a very important problem from both the
algorithmic and performance perspective in data mining. Ranking methods with
different classification algorithms gives different accuracy. Hence selection of
ranking method is an important task for improving the classification accuracy.
Not choosing the right ranking method for a dataset introduces bias towards
selecting the best features. Furthermore predictive accuracy is not a useful
measure when evolutionary classifies learned on datasets. In this study, out of
eight ranking methods SVM scores the maximum accuracy for three datasets
(vote, segment-challenge and diabetes) Chi-square scores for two datasets
(ionosphere and soybean) and Filter, OneR, InfoGain scores for one datasets
(ionosphere, diabetes). But it was found that Symmetrical Uncertainty (SU) which
does not scores the maximum accuracy for any datasets give the maximum
accuracy of 87.88 percentages comparing with other conventional ranking
methods. The overall time taken by SU is higher when comparing with other
ranking methods.
Conclusion
From this study, the following observations can be made:
1. Multilayer Perceptron, Random Forest, J48, SMO and JRIP perform
better than other classification algorithms with and without ranking
and also on selected features.
2. SVM ranking method will take a minimal processing time period
with reasonable classification accuracy in comparison to other
ranking methods.
3. The selected features by Relief ranking method provides better
performance compared with ranking with full dataset.
4. With selected features, the performance of Gain Ratio is poorer than
other ranking methods.
5. SU based ranking method reduces the number of initial attributes
with maximum time period, and increases the classification
performance, in comparison with other methods.

STUDY ON DIFFERENT RANKING METHODS FOR CLASSIFICATION
51
References
Amini, M.-R., Truong, T.-V., Goutte, C. (2008). A boosting algorithm for
learning bipartite ranking functions with partially labeled data. In Proceedings of
the 31st Annual International ACM SIGIR Conference on Research and
Development in Information Retrieval, SIGIR 2008, 99-106.
doi:10.1145/1390334.1390354
Burges, C., Shaked, T., Renshaw, E., Lazier, A., Deeds, M., Hamilton, N.,
& Hullender, G. (2005). Learning to rank using gradient descent. In Proceedings
of the 22nd International Conference on Machine Learning, 89-96.
doi:10.1145/1102351.1102363
Cooper, W. S., Gey, F. C., & Dabney, D. P. (1992). Probabilistic retrieval
based on staged logistic regression. In Proceedings of the 15th annual
international ACM SIGIR conference on research and development in
information retrieval, SIGIR '92 (198-210). doi:10.1145/133160.133199
Cortes, C., & Vapnik, V. (1995). Support-vector networks. Machine
Learning, 20(3), 273-297. doi:10.1007/BF00994018
Fuhr, N. (1989). Optimum polynomial retrieval functions based on the
probability ranking principle. ACM Transactions on Information Systems, 7(3),
183-204. doi:10.1145/65943.65944
Hall, M.A., & Smith, L.A. (1998). Practical feature subset selection for
machine learning. In Proceedings of the 21st Australian Computer Science
Conference, 181–191.
Herbrich, R., Graepel, T., & Obermayer, K. (2000). Large Margin Rank
Boundaries for Ordinal Regression. Advances in Large Margin Classifiers,
115-132.
Holte, R.C. (1993). Very simple classification rules perform well on most
commonly used datasets. Machine Learning, 11(1), 63-91.
doi:10.1023/A:1022631118932
Kira, K., & Rendell, L. (1992). A practical approach to feature selection. In
ML92: Proceedings of the ninth international workshop on Machine learning
(249-256). Morgan Kaufmann Publishers Inc.
Kuo, J.-W., Cheng, P.-J., & Wang, H.-M. (2009). Learning to rank from
bayesian decision inference. In Proceedings of the 18th ACM Conference on
Information and Knowledge Management, CIKM’09,
doi:10.1145/1645953.1646058

SANGAIAH ET AL.
52
Kuramochi, M., & Karypis, G. (2005). Gene classification using expression
profiles: A feasibility study. International Journal on Artificial Intelligence Tools,
14(4), 641-660. doi:10.1142/S0218213005002302
Lichman, M. (2013). UCI Machine Learning Repository
[http://archive.ics.uci.edu/ml]. Irvine, CA: University of California, School of
Information and Computer Science.
Liu, H., & Setiono, R. (1995). Chi2: Feature selection and discretization of
numeric attributes. In Tools with Artificial Intelligence, 1995. Proceedings,
Seventh International Conference on, 338-391. doi:10.1109/TAI.1995.479783
Moon, T., Smola, A., Chang, Y., & Zhen, Z. (2010). IntervalRank: Isotonic
regression with listwise and pairwise constraint. In Proceedings of the Third Acm
International Conference on Web Search and Data Mining, WDSM “10, 151-160.
doi:10.1145/1718487.1718507
Rigutini, L., Papini, T., Maggini, M., & Scarselli, F. (2008). SortNet:
learning to rank by a neural-based sorting algorithm. SIGIR 2008 workshop:
Learning to Rank for Information Retrieval.
Robnik-Sikonja, M., & Kononenko, I. (2003). Theoretical and empirical
analysis of ReliefF and RReliefF. Machine Learning, 53(1/2), 23-69.
doi:10.1023/A:1025667309714
Sculley, D. (2010) Combined regression and ranking. In KDD '10:
Proceedings of the 16th ACM SIGKDD International Conference on Knowledge
Discovery and Data Mining, 979-988. doi:10.1145/1835804.1835928
Valizadegan, H., Jin, R., Zhang, R., & Mao, J. (2009). Learning to rank by
optimizing NDCG measure. Advances in Neural Information Processing Systems,
22, 1883-1891.
Wu, Q., Burges, C. J. C., Svore, K. M., & Gao, J. (2008). Ranking, boosting,
and model adaptation. Microsoft Research Technical Report MSR-TR-2008-109.
Redmond, WA: Microsoft Research.
Yue, Y., Finley, T., Radlinski, F., & Joachims, T. (2007). A support vector
method for optimizing average precision. In SIGIR '07 : 30th annual International
ACM SIGIR Conference on Research and Development in Information Retrieval :
July 23-27, 2007, Amsterdam, the Netherlands, 271.
doi:10.1145/1277741.1277790