Embed Size (px)
Citation preview
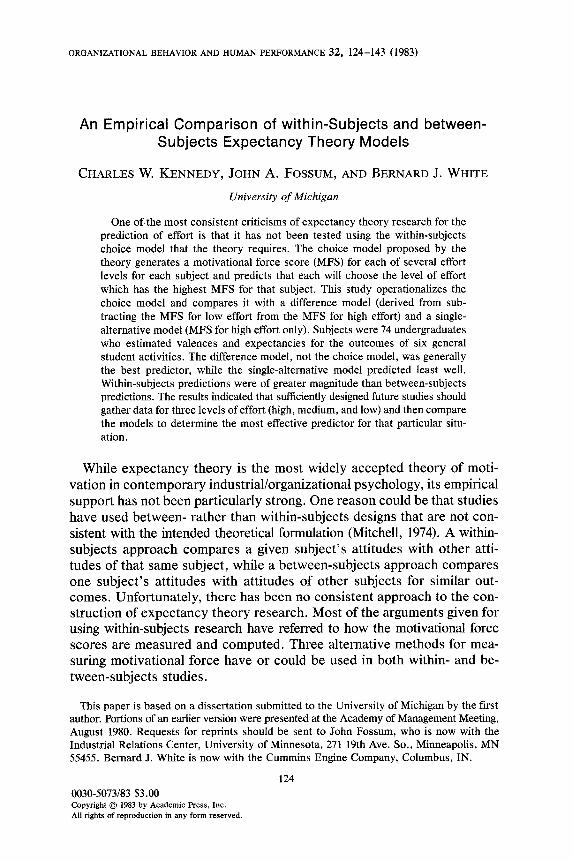
ORGANIZATIONAL BEHAVIOR AND HUMAN PERFORMANCE 32, 124-143 (1983)
An Empirical Comparison of within-Subjects and between- Subjects Expectancy Theory Models
CHARLES W. KENNEDY, JOHN A. FOSSUM, AND BERNARD J. W H I T E
University of Michigan
One of the most consistent criticisms of expectancy theory research for the prediction of effort is that it has not been tested using the within-subjects choice model that the theory requires. The choice model proposed by the theory generates a motivational force score (MFS) for each of several effort levels for each subject and predicts that each will choose the level of effort which has the highest MFS for that subject. This study operationalizes the choice model and compares it with a difference model (derived from sub- tracting the MFS for low effort from the MFS for high effort) and a single- alternative model (MFS for high effort only). Subjects were 74 undergraduates who estimated valences and expectancies for the outcomes of six general student activities. The difference model, not the choice model, was generally the best predictor, while the single-alternative model predicted least well. Within-subjects predictions were of greater magnitude than between-subjects predictions. The results indicated that sufficiently designed future studies should gather data for three levels of effort (high, medium, and low) and then compare the models to determine the most effective predictor for that particular situ- ation.
While expectancy theory is the most widely accepted theory of moti- vation in contemporary industrial/organizational psychology, its empirical support has not been particularly strong. One reason could be that studies have used between- rather than within-subjects designs that are not con- sistent with the intended theoretical formulation (Mitchell, 1974). A within- subjects approach compares a given subject's attitudes with other atti- tudes of that same subject, while a between-subjects approach compares one subject's attitudes with attitudes of other subjects for similar out- comes. Unfortunately, there has been no consistent approach to the con- struction of expectancy theory research. Most of the arguments given for using within-subjects research have referred to how the motivational force scores are measured and computed. Three alternative methods for mea- suring motivational force have or could be used in both within- and be- tween-subjects studies.
This paper is based on a dissertation submitted to the University of Michigan by the first author. Portions of an earlier version were presented at the Academy of Management Meeting, August 1980. Requests for reprints should be sent to John Fossum, who is now with the Industrial Relations Center, University of Minnesota, 271 19th Ave. So., Minneapolis, MN 55455. Bernard J. White is now with the Cummins Engine Company, Columbus, IN.
124 0030-5073/83 $3.00 Copyright © 1983 by Academic Press, Inc. All rights of reproduction in any form reserved.
EXPECTANCY THEORY MODELS 125
Models for Computing Motivational Force Scores The single-alternative model computes a motivational force score (MFS)
for each respondent by multiplying each outcome valence by the expec- tancy of its attainment given the single-alternative "high effort" and then summing the products across outcomes. Persons with higher MFS's are predicted to put forth higher effort.
The difference model obtains the same information as the single-aler- native model and, in addition, the respondents are asked their expectan- cies of receiving those same outcomes if they put forth low effort. The MFS for low effort is then subtracted from the MFS for high effort and persons with larger differences are predicted to put forth higher effort.
The choice model obtains MFS's for several effort levels. Each re- spondent is predicted to choose that effort level which has the highest MFS. This approach is consistent with Vroom's (1964) original formu- lation.
The Choice Model as the Model o f Choice
Several reasons support the use of the choice model in expectancy theory research.
(1) Theoretical accuracy. Vroom (1964) clearly intended a choice model, as shown in his following example. One individual has high-expected payoffs for both high and low effort, the second has high-expected payoffs for only high effort, and the third has high-expected payoffs for neither high nor low effort. The second person is the only one predicted to choose high effort, because only he benefits from putting forth high effort. Choice and single-alternative (high effort) model predictions would be contra- dictory, since the single-alternative model would have had the first person also choosing high effort.
(2) Ipsative orientation. A person's score for one level of effort can only be meaningful when compared to that same person's scores for other levels of effort (Dachler & Mobley, 1973; Kopelman, 1977; and Mobley & Meglino, 1977).
(3) Varied relationships between effort level and motivational force score. Testing for only a single level of effort assumes that there is a similar pattern between effort and MFS for all levels of effort (Mitchell & Pollard, 1973). In fact there could be a nonlinear or nonmonotonic relationship.
(4) Amount o f information. The choice model research method pro- vides more information for changes in employment situations, because it obtains information about several levels of effort (Nebeker & Mitchell, 1974).
The difference model could be considered along with the choice model as fulfilling some of the above needs, but the difference model has po-

126 KENNEDY, FOSSUM, AND WHITE
tential problems of lower reliability and spurious correlation (Cohen & Cohen, 1975; Cronbach & Furby, 1970).
Between- and within-Subjects Approaches
Motivational force scores (MFS's) can either be compared for effort levels between subjects for a given activity or across activities within a given subject. It is clear from Vroom's (1964) formulation of expectancy theory that the force to perform an act requires a comparison of the probabilities of obtaining certain outcomes from that act and the proba- bilities of obtaining the outcomes from other acts before a choice is made. The individual is not seen as comparing outcomes to acts with others.
Thus a within-subjects approach is necessary to test adequately the theory as it was formulated. A within-subjects approach also mitigates the following possible difficulties.
(1) Response bias. Individual response biases are eliminated. (2) Between-individual variation. Individual differences on aspects such
as ability, wealth, opportunity costs, personality traits, and total energy available which introduce potential measurement error, are eliminated (Kopelman, 1977).
(3) Lack of ratio scale. Schmidt (1973) and Arnold and Evans (1979) pointed out that expectancy and valence measures lack a rational zero point, which means they are not true ratio scales, giving doubt as to whether it is logically meaningful to multiply them. Mitchell (1974), while recognizing the validity of the argument, noted that to the extent that the variances from the true score are constant, "then a within-subjects anal- ysis will again help to remedy the problem" (p. 1067).
This study compares predictions made by the single-alternative, dif- ference, and choice models in both within- and between-subjects modes. It tests Vroom's (1964) formulation of expectancy theory as previously called for by Behling and Starke (1973), Campbell and Pritchard (1976), Connolly (1976), Hollenback (1979), House, Shapiro, and Wahba (1974), Kopelman (1977), Korman, Greenhause, and Badin (1977), Mitchell (1974), Mitchell and Beach (1979), and Muchinsky (1977).
It is hypothesized that (1) correlations between choice model predic- tions and effort will be of greater magnitude than correlations between difference model predictions and effort, which in turn will be of greater magnitude than correlations between single-alternative model predictions and effort; and (2) within-subjects correlations between the various model formulations and effort will be of greater magnitude than the corre- sponding between-subjects correlations.
METHOD Sample
This study was part of a time allocation feedback study conducted among dormitory residents at a nondenominational Christian university.
EXPECTANCY THEORY MODELS 127
The time allocation feedback study was designed to run for 10 weeks. Of 180 potential participants, 95 volunteered to record each day how much of their discretionary time they had spent in six different activities. At the beginning of each week the records for the previous week were col- lected and individual computer-generated feedback sheets were given to students summarizing how they had spent their time and how the study group as a whole had spent its time. Of the 95 volunteers, 74 who had been involved in the study for at least 2 weeks completed an expectancy theory questionnaire at the end of the semester, after some experience had been gained about effort effects and outcomes.
Data Collection
The questionnaire was administered in small groups. Each subject was given a copy of his/her semester's time allocations along with the ques- tionnaire so that they would not have to rely on memory. Participation in the time allocation feedback study and completion of the questionnaire was entirely voluntary and all results were kept strictly confidential. A small monetary donation was made for participation to each participating student's dormitory unit.
As a result of feedback the students involved in the study knew how they and others had spent their discretionary time in the six activities: studies, athletics, social activities, spiritual activities, service toward others, and leisure. These activities were defined to the students to be mutually exclusive. Athletics was included as an activity because all stu- dents were required to take physical education classes each term, earn 30 aerobic athletic points per week, and run 11/2 miles under 12 min. to qualify for graduation. Spiritual and service towards others activities were very actively engaged in by students in this Christian university.
Asking the respondents to complete a questionnaire after they knew how they said they had spent their time raises the possibility that the respondents might have attempted to answer the questions in such a way as to be consistent with their actual behavior. However, their experiences may have made them better estimators of the actual effort levels neces- sary to achieve valent outcomes.
Measures
Effort. Effort was operationally defined as the amount of discretionary time spent in that activity. Vroom (1964) first suggested the use of hours to measure effort, and many research studies have since used time spent as an effort measure (Kopelman, 1977; Kopelman & Thompson, 1976; Mitchell & Nebeker, 1973; Mitchell & Pollard, 1973; Peters, 1977). Sub- jects were asked to observe their behavior and record it, while in most past studies subjects were asked to recollect how much time they spent in certain activities, without consciously observing themselves before-

128 KENNEDY, FOSSUM, AND WHITE
hand. Subjects also received feedback about how they and others spent their time, meaning that they could more intelligently answer time allo- cation questions and that the effort measure more closely approximated a "concrete observable" (Campbell & Pritchard, 1976). Reported effort was obtained by asking students, "How many hours per day on the av- erage do you estimate that you actually spend on each of the general activities?" The concept of preferred effort was introduced by Turney (1974; Turney & Cohen, 1976), who referred to it as desired effort. To measure preferred effort, students were asked, "How many hours per day on the average do you estimate that you would reasonably like to spend on each of the six general activities?"
Outcomes. Keeney and Raiffa (1976) suggest that outcomes should meet the following criteria: (a) completeness, (b) operationality, (c) nonredun- dancy, and (d) parsimony. The outcomes chosen were judged as best meeting those criteria, and were taken from Constantinople (1967) and Mitchell and Nebeker (1973), as well as from careful discussion and per- sonal experience with the students. The 10 outcomes finally selected were (1) Getting accepted into graduate school, (2) Starting a good career, (3) Obtaining a feeling of accomplishment, (4) Enjoying whatever activity you are doing, (5) Having good friends of the same sex, (6) Having good friends of the opposite sex, (7) Having a good relationship with God, (8) Being in good shape physically, (9) Being a significant help to others, and (10) Obtaining a scholarship.
Valence. Valence was measured by asking respondents to state how desirable each of the outcomes were to them, assuming that they could achieve any possibility that they attempted. Anchors ranged from ex- tremely desirable to extremely undesirable and were scored from + 3 to - 3.
Expectancy. Expectancy was interpreted to be a conditional proba- bility, which is both common and theoretically justified (Campbell & Prit- chard, 1976). Expectancies were conditional in the sense that students were asked to state the perceived probability of attaining a certain out- come, given that they put forth a specific amount Of effort.
Instrumentality and expectancy were combined, because most of the activities had no clearly defined separation between first- and second- level outcomes. Omitting the instrumentality measure is common (e.g., Lawler & Porter, 1967; Lawler & Suttle, 1973) as well as theoretically justified in situations where clear intermediate outcomes are lacking (Mitchell & Pollard, 1973), such as with the athletic, social, spiritual, service, and leisure activities. An example of the expectancies requested from subjects for just one level of effort (1 hr) for one activity (studying) follows. Since there were five levels of effort for six activities, this ques- tion format was asked of each student 30 times.

EXPECTANCY THEORY MODELS 129
If you spend an average of o n e hour studying per day, what is the probability that this will result i n . . . Getting accepted into graduate school--
0 . .1 .2 .3 .4 .5 . 6 . 7 . 8 .9 1. Starting a good career- -
0. .1 .2.3 . 4 . 5 . 6 . 7 . 8 . 9 1. Obtaining a feeling of accomplishment--
0. .1 .2.3 . 4 . 5 . 6 . 7 . 8 . 9 1. Enjoying what you are doing--
0. .1 .2.3 . 4 . 5 . 6 . 7 . 8 . 9 1. Obtaining a scholarship----
0. .1 .2.3 . 4 . 5 . 6 . 7 . 8 . 9 1.
The expectancy question used specific hour levels instead of vague terms, such as "high effort," meeting the need for a "specific referent" (Dachler & Mobley, 1973). Subjects were asked to rate expectancies for only some of the 10 outcomes for every activity (e.g., subjects were not asked to rate the likelihood that 1 hr of studying would result in being in good shape physically). What might be lost in terms of accuracy is com- pensated for by the significant reduction in the length of the question- naire. In addition, Connolly and Vines (1977), Leon (1979), and Matsui and Ikeda (1976) have found that relatively few outcomes explain most of the variance.
Computations
For the choice model, a motivational force score was computed for each of the five hour levels by multiplying the expectancies for each hour level with the valences of their respective outcomes and then summing the products. The numerical value of the choice model predictor variable was that hour level (1-5) which had the highest computed motivational force score, with a tie going to the lower hour level, because it was assumed that, other things being equal, people seek to avoid the expendi- ture of effort (Vroom, 1964, p. 195). For the difference model, the nu- merical value was obtained by subtracting the computed motivational force score for low effort from the computed motivational force score for high effort. (Low effort was assumed to be 1 hr and high effort was assumed to be 5 hr.) For the single-alternative model, the numerical value was simply the motivational force score for high effort (assumed to be 5 hr).
Once numerical values were obtained a within-subjects correlation and a between-subjects correlation could be computed for each model. To obtain a within-subjects correlation, for each subject the computed force scores for all six activities were correlated with their respective effort measures. This resulted in 74 correlations (one correlation for each sub- ject), each correlation having an n of 6. These 74 correlations were av-

130 K E N N E D Y , F O S S U M , A N D W H I T E
eraged to obtain a within-subjects average correlation. 1 To obtain a be- tween-subjects correlation, for each activity the computed force scores for all 74 subjects were correlated with their respective effort measures. This resulted in six correlations (one correlation for each activity), each with an n of 74. These 74 correlations were averaged to obtain a between- subjects average correlation.
Data Analysis
The hypotheses were tested by comparing average correlations. The test for Hypothesis One compared all four average correlations for the choice model to predict preferred effort and reported effort (two within- subjects correlations and two between-subjects correlations) against their four respective counterparts using the difference model and the single- alternative model. The test for Hypothesis Two compared all six within- subjects average correlations using the three models to predict the two dependent measures of effort against their respective between-subjects correlations.
Average correlations were tested to determine if the differences be- tween the correlations were statistically significant. Since the average correlations were taken from the same sample, the Hotelling test for comparing dependent correlations was used (Cohen & Cohen, 1975). 2 For the comparisons between the within-subjects and the between-subjects correlation methods (Hypothesis 2) the more common comparison test using r to z transformations was used, because some of the intercorre- lations required for the Hotelling test could not be computed.
RESULTS
Independent and Dependent Measures
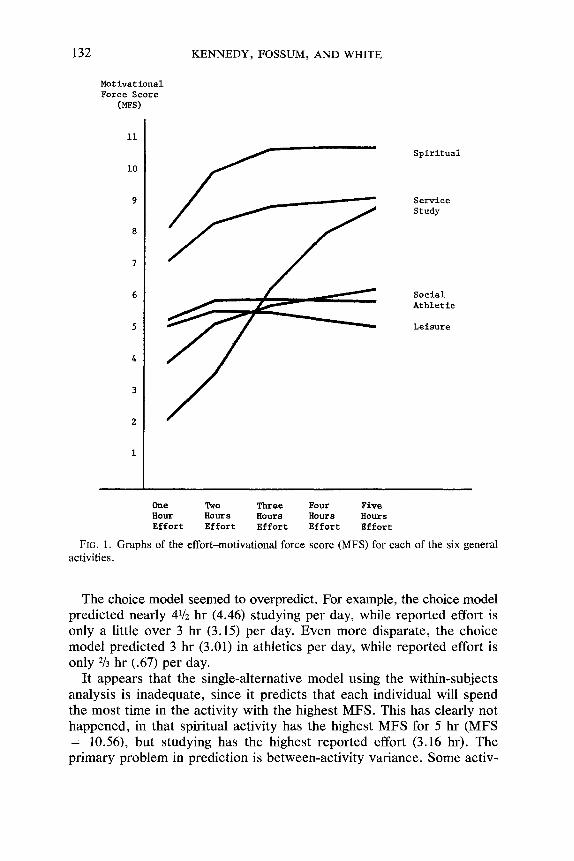
The motivational force scores listed in Table 1 and graphed in Fig. 1 show the differences between the MFS-effort relationships for the var- ious activities. As an activity, studying demonstrates a highly positive and nearly linear relationship between effort and motivational force scores, while spiritual, social, and service activities have monotonically de-
1 The process of comput ing the average of a set of correlations is clearly descr ibed by Snedecor and Cochran (1967, p. 186). The first step is to run a special chi-square tes t of the hypothes is that the set of correlations are f rom the same population. If the result of the chi-square tes t permits the assumpt ion of homogenei ty, then the correlations can be aver- aged. This averaging is an iterative process and uses the r to z t ransformat ion as well as specified changes in the degrees of freedom. The result ing average correlation has fewer df than the sum of the n ' s of the correlations.
2 This tes t is not to be confused with the Hotelling T test .

EXPECTANCY THEORY MODELS
TABLE 1 MOTIVATIONAL FORCE SCORES FOR EACH EFFORT LEVEL BY ACTIVITY a
131
Effort Activity
level Study Athletic Social Spiritual Service Leisure
One hour Mean 2.13 5.17 3.92 8.14 7.10 5.03 SD 1.85 2.01 1,96 3.36 2.56 2.20
Two hours Mean 3.59 5.84 5.08 9.89 8.18 5.32 SD 2.30 1.93 2.06 3.21 2.23 2.17
Three hrs. Mean 6.10 5.83 5.76 10.62 8.73 5.21 SD 2.76 1.94 2.01 3.02 2.02 2.09
Four hours Mean 7.85 5.87 5.96 10.65 8.95 5.11 SD 2.82 2.05 2. t3 3.02 1.96 2.26
Five hours Mean 8.75 5.84 6.15 10.56 9.16 4.95 SD 3.04 2.25 2.33 3.43 2.29 2.53
on = 74.
creasing relationships. Athletic and leisure activities have essentially flat relationships over the effort levels measured. The shape of the MFS- effort relationship is important, since the single-alternative model would be inadequate if the MFS-effort relationship is not positive and linear.
Examining the within-subjects analysis, Fig. 1 shows that marginal ben- efits seem potentially important, since for studying there appears to be substantial additional expected gains during the 2nd, 3rd, 4th, and 5th hr. For service, spiritual, and social activities there appears to be additional expected gain only for the 2nd and 3rd hr, for athletic activities only for the 2nd hr, and for leisure activities no additional expected gain past the 1st hr. Since the difference model takes into account additional (or mar- ginal) gains, the difference model would predict that studying would re- ceive the most effort and that leisure would receive the least. In contrast, the single-alternative model looks only at the relative rankings for the single-effort level of 5 hr, and therefore would predict that the most effort will go toward spiritual activities.
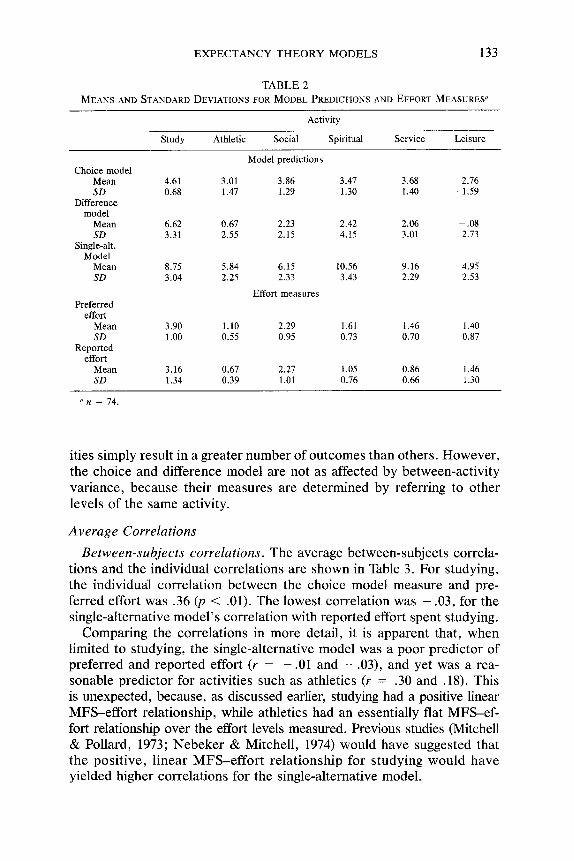
Table 2 presents the means and standard deviations for the three model predictions (choice, difference, and single-alternative models) and the two effort measures (preferred effort, and reported effort). Preferred ef- fort was how much time the subject would reasonably like to spend in each of the activities. Reported effort was the time students said they actually spent in the various activities.
132 K E N N E D Y , F O S S U M , A N D W H I T E
Motivational Force Score
( ~ s )
l i
10
9
8
7
6
5
4
3
2
1
Spiritual
Service Study
Social Athletic
Leisure
One Two Three Four Five Hour Hours Hours Hours Hours Effort Effort Effort Effort Effort
FIG. 1. Graphs of the effort-motivational force score (MFS) for each of the six general activities.
The choice model seemed to overpredict. For example, the choice model predicted nearly 41/2 hr (4.46) studying per day, while reported effort is only a little over 3 hr (3.15) per day. Even more disparate, the choice model predicted 3 hr (3.01) in athletics per day, while reported effort is only 2/3 hr (.67) per day.
It appears that the single-alternative model using the within-subjects analysis is inadequate, since it predicts that each individual will spend the most time in the activity with the highest MFS. This has clearly not happened, in that spiritual activity has the highest MFS for 5 hr (MFS = 10.56), but studying has the highest reported effort (3.16 hr). The primary problem in prediction is between-activity variance. Some activ-
E X P E C T A N C Y T H E O R Y M O D E L S 133
T A B L E 2
MEANS AND STANDARD DEVIATIONS FOR MODEL PREDICTIONS AND EFFORT MEASURES a
Activity
Study Athletic Social Spiritual Service Leisure
Choice model Mean 4.61 3.01 SD 0.68 1.47
Difference model
Mean 6.62 0.67 SD 3.31 2.55
Single-alt. Model
Mean 8.75 5.84 SD 3.04 2.25
Model predictions
3.86 3.47 3.68 2.76 1.29 1.30 1.40 1.59
2.23 2.42 2.06 - .08 2.15 4.15 3.01 2.73
6.15 10.56 9.16 4.95 2.33 3.43 2.29 2.53
Effort measures Preferred
effort Mean 3.90 1.10 2.29 1.61 1.46 1.40 SD 1.00 0.55 0.95 0.73 0.70 0.87
Reported effort
Mean 3.16 0.67 2.27 1.05 0.86 1.46 SD 1.34 0.39 1.01 0.76 0.66 1.30
an = 74.
ities simply result in a greater number of outcomes than others. However, the choice and difference model are not as affected by between-activity variance, because their measures are determined by referring to other levels of the same activity.
Average Correlations
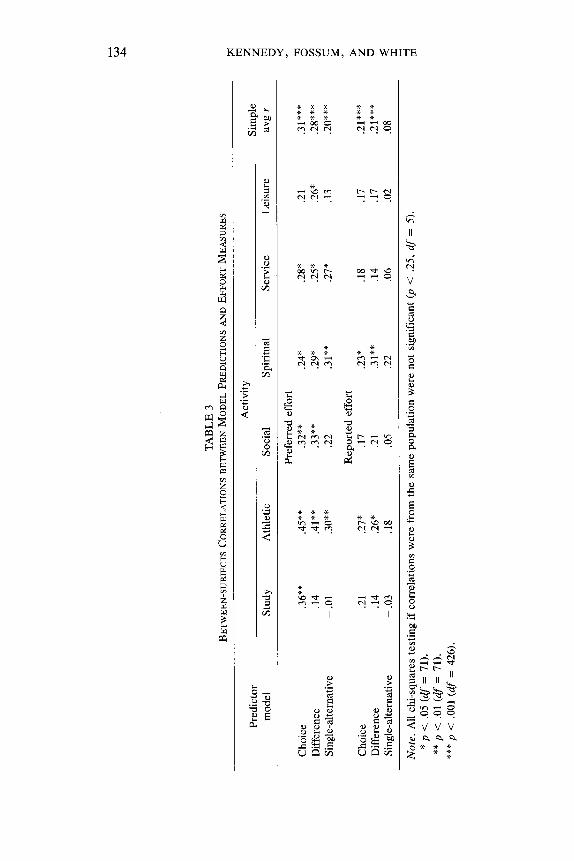
Between-subjects correlations. The average between-subjects correla- tions and the individual correlations are shown in Table 3. For studying, the individual correlation between the choice model measure and pre- ferred effort was .36 (p < .01). The lowest correlation was - . 03 , for the single-alternative model's correlation with reported effort spent studying.
Comparing the correlations in more detail, it is apparent that, when limited to studying, the single-alternative model was a poor predictor of preferred and reported effort (r = - . 01 and - .03) , and yet was a rea- sonable predictor for activities such as athletics (r = .30 and. 18). This is unexpected, because, as discussed earlier, studying had a positive linear MFS-effort relationship, while athletics had an essentially flat MFS-ef- fort relationship over the effort levels measured. Previous studies (Mitchell & Pollard, 1973; Nebeker & Mitchell, 1974) would have suggested that the positive, linear MFS-effort relationship for studying would have yielded higher correlations for the single-alternative model.
4~
TA
BL
E 3
B
ET
WE
EN
-SU
BJE
CT
S
CO
RR
EL
AT
ION
S B
ET
WE
EN
M
OD
EL
PR
ED
ICT
ION
S A
ND
EF
FO
RT
M
EA
SU
RE
S
7~
Pre
dic
tor
Act
ivit
y
mo
del
S
tud
y
Ath
leti
c S
oci
al
Sp
irit
ual
S
erv
ice
Lei
sure
S
imp
le
avg
r
Z
Z
~7
Pre
ferr
ed e
ffo
rt
Ch
oic
e .3
6**
.45*
* .3
2**
.24*
.2
8*
.21
.31"
**
Dif
fere
nce
.1
4 .4
1"*
.33*
* .2
9*
.25*
.2
6*
28**
* •
r~
Sin
gle-
alte
rnat
ive
- .0
1 .3
0**
.22
.31"
* .2
7*
.13
.20*
**
Rep
ort
ed e
ffo
rt
Ch
oic
e .2
1 .2
7*
.17
.23*
.1
8 .1
7 .2
1"**
7~
D
iffe
ren
ce
.14
.26*
.2
1 .3
1"*
.14
.17
•21"
**
Sin
gle-
alt
ern
ativ
e -.
03
.18
.05
.22
.06
.02
.08
Not
e. A
ll c
hi-
squ
ares
tes
tin
g i
f co
rrel
atio
ns
wer
e fr
om
th
e sa
me
po
pu
lati
on
wer
e n
ot
sig
nif
ican
t (p
<
.25,
df
=
5).
* p
<
.05
(df
=
71).
**
p
<
.01
(df
=
71).
**
* p
<
.001
(df
=
426)
.
EXPECTANCY THEORY MODELS 135
The average between-subjects correlations are also listed in Table 3 and were derived by averaging the correlations of the six activities. 3 All the average between-subjects correlations were significant at the .01 level, except for the single-alternative model's prediction of reported effort (avg r = .08).
With in - sub jec t s corre la t ions . Turning now to within-subjects correla- tions, Table 4 shows the six average within-subjects correlations? The method used to average correlations was to transform each individual correlation to a corresponding Fisher's z, average the z's, and then trans- form the average z to obtain an average r. 5 The z transformation had the effect of weighting the extreme correlations more heavily, and this ex- plains why the average z's in the fourth column of Table 4 were signifi-
3 The statistically correct method of averaging correlations (Snedecor & Cochran, 1967) was not used for the between-subjects data, because the requirement that the correlations be from different samples of subjects was not met. However, because the individual cor- relations had large sample sizes (n = 74), the simple average correlations listed in Table 3 are virtually identical to what would have been the statistically correct average correlations. Because the average correlations were a pooling of individual correlations, their degrees of freedom were larger (df = 426), though it must be remembered that the assumption of independence was not met.
4 The standard deviations of the sample average correlations were large because the n of each individual correlation was only 6, there being only six activities to correlate for each individual. Not all of the average correlations had an n of 74, since for some individuals the predictor value was the same for all six activities and it was not possible to compute a correlation when one of the variables was a constant. This was only a problem with the choice model, since for 5 respondents the choice model predicted that they would spend five hours in all six activities.
5 This transformation was necessary because repeated correlations taken from the same sample do not form a normal distribution, unless the population correlation is zero. For example, if a population correlation were .8, repeated sample correlations would form a distribution that is skewed toward 0.0. But if the correlations were transformed to Fisher's z's, then the distribution would become normal. The impact that this had when averaging the correlations was that the positive correlations were made more positive (an r of .99 becomes a z of 2.647), the correlations near zero remained unchanged, and the negative correlations were made more negative.
Snedecor and Cochran (1967) point out that there is a small bias in each z. They rec- ommend that if the individual correlations have small n 's a correlation factor be subtracted from each z before it is averaged with the others. With the within-subjects correlations listed in Table 4, subtracting the correction factor had the effect of reducing somewhat the increase that resulted from the z transformations, but even the corrected average correla- tions (listed in the last column) were somewhat higher than their respective simple average correlation. For example, the simple average correlation between the choice model and preferred effort was .53 (column 1), the z transformation then increased the average cor- relation to .75, and subtracting the correction factor reduced the average correlation to .60 (last column). So when dealing with a large number of correlations, with each correlation having a small sample size, both the z transformation and the correction factor can have a noticeable effect on the size of the average correlation.

136 KENNEDY, FOSSUM, AND WHITE
TABLE 4 WITHIN-SUBJECTS CORRELATIONS BETWEEN MODEL PREDICTIONS AND EFFORT MEASURES
Predictor Simple Chi Corrected model avg r SD n Avg z square avg r
Preferred effort Choice .53 .35 69 .75 84.08 .60*** Difference .68 .29 74 1.02 68.33 .74*** Single-alternative .26 .41 74 .34 70.60 .30***
Reported effort Choice .39 .43 69 .52 107.63"* .44*** Difference .48 .41 74 .68 86.81 .55*** Single-alternative .05 .43 74 .07 62.10 .07
**p < .01 (df = 73). ***p < .001 (dr = 222).
cantly higher than their respective simple average r's in column 1. For example, the average z of the choice model's predictions of preferred effort (row 1) was .75, and was larger than the simple average correlation of .53.
The first of two tests of statistical significance to be run on the within- subjects average correlations was the chi-square test of the assumption that the individual correlations came from the same population. Only the chi-square test of the choice model's prediction of reported effort is sig- nificant at the .01 level, which means averaging that correlation is not statistically appropriate. However, for purposes of comparison, the choice model-reported effort average correlation is still used in the hypothesis tests, but it is with the understanding that the homogeneity assumption has not been met. The second statistical significance test concerned the probability that the average correlation was significantly different from zero, and the last column of Table 4 shows that all but one of the corre- lations (the single-alternative model prediction of reported effort) were significant at the .001 level. 6
Testing the Hypotheses
Hypothesis 1 predicted that correlations between the choice model formulations and effort would be stronger than correlations between the difference model formulations and effort, which in turn would be stronger
6 The df of the average correlation was obtained by subtracting 3 from the n of each individual correlation and then adding the remainders. Thus, 6 minus 3 equals 3, which is added 74 times to obtain a degrees of freedom for the average within-subjects correlation of 222 (Snedecor & Cochran, 1967).
E X P E C T A N C Y T H E O R Y M O D E L S 137
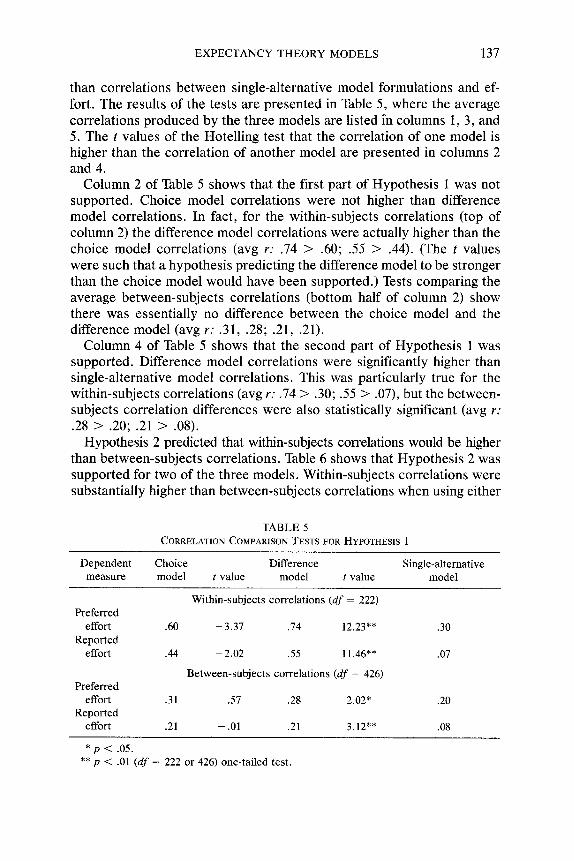
than correlations between single-alternative model formulations and ef- fort. The results of the tests are presented in Table 5, where the average correlations produced by the three models are listed in columns 1, 3, and 5. The t values of the Hotelling test that the correlation of one model is higher than the correlation of another model are presented in columns 2 and 4.
Column 2 of Table 5 shows that the first part of Hypothesis 1 was not supported. Choice model correlations were not higher than difference model correlations. In fact, for the within-subjects correlations (top of column 2) the difference model correlations were actually higher than the choice model correlations (avg r : .74 > .60; .55 > .44). (The t values were such that a hypothesis predicting the difference model to be stronger than the choice model would have been supported.) Tests comparing the average between-subjects correlations (bottom half of column 2) show there was essentially no difference between the choice model and the difference model (avg r : .31, .28; .21, .21).
Column 4 of Table 5 shows that the second part of Hypothesis 1 was supported. Difference model correlations were significantly higher than single-alternative model correlations. This was particularly true for the within-subjects correlations (avg r : .74 > .30; .55 > .07), but the between- subjects correlation differences were also statistically significant (avg r :
.28 > .20; .21 > .08). Hypothesis 2 predicted that within-subjects correlations would be higher
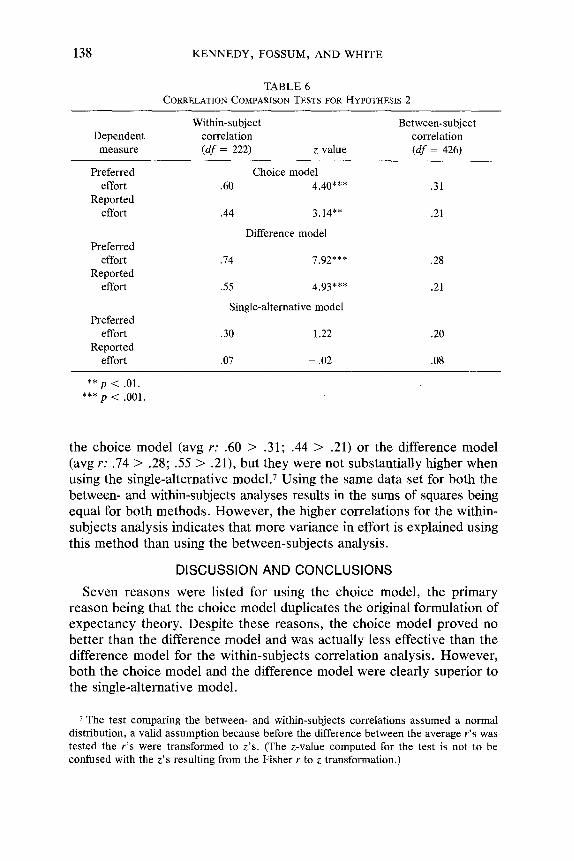
than between-subjects correlations. Table 6 shows that Hypothesis 2 was supported for two of the three models. Within-subjects correlations were substantially higher than between-subjects correlations when using either
TABLE 5 CORRELATION COMPARISON TESTS FOR HYPOTHESIS 1
Dependent Choice Difference Single-alternative measure model t value model t value model
Within-subjects correlat ions (df = 222) Preferred
effort .60 - 3.37 .74 12.23"* .30 Repor ted
effort .44 - 2.02 .55 11.46** .07
Between-subjects correlat ions (df = 426) Preferred
effort .31 .57 .28 2.02 * .20 Repor ted
effort .21 - .01 .21 3.12"* .08
* p < .05.
** p < .01 (df = 222 or 426) one-tai led test.
138 K E N N E D Y , FOSSUM, AND WHITE
TABLE 6 CORRELATION COMPARISON TESTS FOR HYPOTHESIS 2
Within-subject Between-subject Dependent correlation correlation
measure (df = 222) z value (df = 426)
Preferred Choice model effort .60 4.40*** .31
Reported effort .44 3.14"* .21
Difference model Preferred
effort .74 7.92*** .28 Reported
effort .55 4.93*** .21
Single-alternative model Preferred
effort .30 1.22 .20 Reported
effort .07 - .02 .08
** p < .01. *** p < .001.
the choice model (avg r : .60 > .31; .44 > .21) or the difference model (avg r : .74 > .28; .55 > .21), but they were not substantially higher when using the single-alternative model, v Using the same data set for both the between- and within-subjects analyses results in the sums of squares being equal for both methods. However, the higher correlations for the within- subjects analysis indicates that more variance in effort is explained using this method than using the between-subjects analysis.
DISCUSSION AND CONCLUSIONS
Seven reasons were listed for using the choice model, the primary reason being that the choice model duplicates the original formulation of expectancy theory. Despite these reasons, the choice model proved no better than the difference model and was actually less effective than the difference model for the within-subjects correlation analysis. However, both the choice model and the difference model were clearly superior to the single-alternative model.
7 The test comparing the between- and within-subjects correlations assumed a normal distribution, a valid assumption because before the difference between the average r's was tested the r's were transformed to z's. (The z-value computed for the test is not to be confused with the z's resulting from the Fisher r to z transformation.)

EXPECTANCY THEORY MODELS 139
A closer look at the data showed that the choice model was not as effective as expected because it continually and significantly overpre- dicted the amount of effort. The problem of overprediction might have occurred because the choice model does not fully take into account op- portunity costs or limits. It also overpredicted whenever an additional hour of effort brought only a very small gain in MFS. Thus a situation of varied relationships (i.e., not positively linear relationships) between ef- fort level and MFS turned out to be a disadvantage for the choice model.
Mitchell (1974) wrote that "before we reject Vroom's original formu- lation, we should correctly test it" (p. 1075). When the theory was tested as formulated (as a choice model), the results with the between-subjects analysis were not significantly better than for the difference model, and the results for the within-subjects analysis show the choice model to predict effort less well than the difference model. This lack of empirical support, combined with the logical consideration that the theory does not fully address the issues of opportunity costs and limited resources, in- dicates a possible need for reformulation.
One possible alternative would be to choose effort budgets rather than single effort levels. Another alternative would be to approach the allo- cation of effort in the same manner that microeconomic theory addresses the allocation of money (Ferguson, 1972). This could be done by taking the data for all the hour levels, assuming a time limit, and then filling up that time limit by allocating an hour at a time to whichever activity gave the highest marginal utility for the next additional hour. More sophisti- cated microeconomic approaches might determine a utility function for effort for each activity (usually using either a log or power function) and then mathematically solve for the optimal time allocation through various optimization techniques, s Yet another alternative would be to formally incorporate a return-on-effort (ROE) difference model (Kopelman, 1977) into the generally accepted expectancy theory framework. A final alter- native would be to use multiobjective utility theory, as described by Keeney and Raiffa (1976). These alternatives still assume a rational motivational model consistent with the principles of expectancy theory. Other alter- natives which question the premise of rationality, such as probability matching (Herrnstein, 1974), could be contrasted to this general, rational approach.
One of the primary purposes of this study was to determine which of the three models would likely be the most effective in predicting effort.
8 A variant of this procedure (Samuelson, 1976) uses the log utility function to determine what percentage of the total time spent will be allocated to each activity. The advantage of this last technique is that no assumption needs to be made concerning how much total time is available.

140 KENNEDY, FOSSUM, AND WHITE
The analysis indicated that the difference model would probably be most effective. However, there are two reasons for recommending a different strategy for future research than the sole use of the difference model. The first reason is that results were not always consistent and that some- times the choice model predicted better than the difference model. With the between-subjects analysis (Table 3), for studying as an activity the choice model predicted preferred effort better than the difference model (r: .36 > . 14).
A second reason is that data analysis not displayed in the tables showed that when the single-alternative model was tested using low effort as the single alternative it was found to predict sometimes more effectively than the difference model. For example, with studying as an activity, the single- alternative model using low effort correlated - . 2 7 (p > .01) with pre- ferred effort while the difference model correlated only . 14. Low effort correlated negatively because the more a person perceived they obtained from low effort the less they intended to put forth high effort. A general observation is that the difference model predicts better than the single- alternative models of high or low effort only when both high and low effort are at least marginally effective predictors (say, Irl greater than .08).
A research strategy that would be both effective and efficient would be to gather expectancies of respondents toward high, medium, and low effort. These data would then be used for testing the choice model, the difference model (both high minus low effort and high minus medium effort), and three single-alternative models (high, medium, and low ef- fort).
A practitioner using expectancy theory to diagnose the motivational system of an organization would find data on three effort levels more useful than data on just high effort alone. In fact, such information would allow a practitioner to emphasize lowering expectancies for medium and low effort, rather than just raising the expectancies for high effort. Such an emphasis on decreasing the expectancies for positive outcomes re- suiting from medium and low effort is very rarely encountered in the literature, but it might be as effective and maybe more achievable than increasing the expectancies for high effort. Of course making low and medium effort "nonrewarding" has many practical and ethical implica- tions which would have to be seriously considered.
Another future research issue concerns the effective use of the within- subjects and between-subjects correlation methods. Hypothesis 2 com- pared the effectiveness of the two correlation methods, and the tests (see Table 6) showed the within-subjects correlation method to be clearly su- perior to the between-subjects method, though not as much for the single- alternative model as for the other two models. The implication for re- search would be to use the within-subjects correlation method whenever
EXPECTANCY THEORY MODELS 141
possible. In addition, practitioners should remember that the ipsative orientation toward worker attitudes is important: workers must choose effort budgets for attaining personal outcomes, and all will not respond similarly to a given outcome, since valences and expectancies will likely vary between persons.
However, the interpretability of within-subjects correlations and the applicability of such results to a real work situation are not clear. If a practitioner knew through within-subjects analysis how a worker valued different options, it may not be practical to attempt to custom tailor a motivational package based on that analysis for each worker. The impli- cation seems to be that for research purposes the within-subjects corre- lation method is more effective, while for applied purposes the between- subjects correlation method is more useful.
Summary This study compared the choice, difference, and single-alternative
models of expectancy theory, using both a between- and within-subjects analysis. The subjects were 74 university students who had recorded for several weeks how they spent their time in six general activities. Using expectancy measures that referred to specific hour levels (instead of gen- eral effort levels), MFS's were generated for the choice, difference, and single-alternative models in order to predict reported and preferred effort. Contrary to the hypothesis, the difference model was generally the best predictor, but as expected the single-alternative model was the worst. Within-subjects analysis was superior to between-subjects analysis. The choice model was not as effective as expected, because it tended to over- predict, which leaves expectancy theory open to criticism, because the choice model is how the theory was originally formulated. The results indicated that future research should gather data for three levels of effort (high, medium, and low) and then compare the models to determine the most effective predictor for that particular situation.
REFERENCES Arnold, H. J., & Evans, M. G. Testing multiplicative models does not require ratio scales.
Organizational Behavior and Human Performance, 1979, 24, 41-59. Behling, O., & Starke, E S. The postulates of expectancy theory. Academy of Management
Journal, 1973, 16, 373-388. Campbell, J. E, & Pritchard, R. D. Motivation theory in industrial and organizational psy-
chology. In M. D. Dunnette (Ed.), Handbook of industrial and organizational psy- chology. Chicago: Rand McNally, 1976.
Cohen, J., & Cohen, E Applied multiple regression~correlation analysis for the behavioral sciences. New York: Wiley, 1975.
Connolly, T. Some conceptual and methodological issues in expectancy models of work performance motivation. Academy of Management Review, 1976, 1, 37-46.
142 KENNEDY, FOSSUM, AND WHITE
Connolly, T., & Vines, C. V. Some instrumentality-valence models of undergraduate college choice. Decision Sciences, 1977, 8, 311-317.
Constantinople, A. Perceived instrumentality of the college as a measure of attitudes toward college. Journal of Personality and Social Psychology, 1967, 5, 197-201.
Cronbach, L. J., & Furby, L. How should we measure "change"--Or should we? Psycho- logical Bulletin, 1970, 74, 68-80.
Dachler, H. P., & Mobley, W. H. Construct validation of an instrumentality-expectancy- task-goal model of work motivation: Some theoretical boundary conditions. Journal of Applied Psychology, 1973, 58, 397-418.
Fergusonl C. E. Microeconomic theory. Homewood, Ill.: Irwin, 1972.3rd ed. Herrnstein, R. J. Formal properties of the matching law. Journal of the Experimental Anal-
ysis of Behavior, 1974, 21, 159-164. Hollenback, J. A matrix method for expectancy research. Academy of Management Re-
view, 1979, 4, 579-587. House, R. J., Shapiro, H. J., & Wahba, M. A. Expectancy theory as a predictor of work
behavior and attitude: A re-evaluation of empirical evidence. Decision Sciences, 1974, 5, 481-506.
Keeney, R. L., & Raiffa, H. Decisions with multiple objectives: Preferences and value tradeoffs. New York: Wiley, 1976.
Kopelman, R. E. Across-individual and within-individual return on effort versions of ex- pectancy theory. Decision Sciences, 1977, 18, 651-662.
Kopelman, R. E., & Thompson, P. H. Boundary conditions for expectancy theory predic- tions of work motivation and job performance. Academy of Management Journal, 1976, 19, 237-258.
Korman, A. K., Greenhause, J. H., & Badin, I. J. Personnel attitudes and motivation. Annual Review of Psychology, 1977, 28, 75-96.
Lawler, E. E. I I I , & Porter, L. W. Antecedent attitudes of effective managerial perfor- mance. Organizational Behavior and Human Performance, 1967, 2, 122-142.
Lawler, E. E. I I I , & Suttle, J. L. Expectancy theory and job behavior. Organizational Behavior and Human Performance, 1973, 9, 482-503.
Leon, E R. Number of outcomes and accuracy of prediction in expectancy research. Or- ganizational Behavior and Human Performance, 1979, 23, 251-267.
Matsui, T., & Ikeda, H. Effectiveness of self-generated outcomes for improving prediction in expectancy theory research. Organizational Behavior and Human Performance, 1976, 17, 289-298.
Mitchell, T. R. Expectancy models of job satisfaction, occupational preference and effort: A theoretical, methodological, and empirical appraisal. Psychological Bulletin, 1974, 81, 1053-1077.
Mitchell, T. R., & Beach, L. R. A review of occupational preference and choice research using expectancy theory and decision theory. Journal of Occupational Psychology, 1979, 49, 231-248.
Mitchell, T. R., & Nebeker, D. M. Expectancy theory predictions of academic effort and performance. Journal of Applied Psychology, 1973, 57, 61-67.
Mitchell, T. R., & Pollard, W. E. Instrumentality theory predictions of academic behavior. Journal of Social Psychology, 1973, 89, 34-45.
Mobley, W. H., & Meglino, B. M. A behavioral choice model analysis of the budget allo- cation behavior of academic deans. Academy of Management Journal, 1977, 20, 564-572.
Muchinsky, P. M. A comparison of within- and across-subjects analyses of the expectancy- valence model for predicting effort. Academy of Management Journal, 1977, 20, 154-158.
EXPECTANCY THEORY MODELS 143
Nebeker, D. M., & Mitchell, T. E. Leader behavior: An expectancy theory approach. Or- ganizational Behavior and Human Performance, 1974, 11, 355-367.
Peters, L. H. Cognitive models of motivation, expectancy theory and effort: An analysis and empirical test. Organizational Behavior and Human Performance, 1977, 20, 129-148.
Samuelson, P. A. Economics. New York: McGraw-Hill, 1976. Schmidt, F. L. Implications of a measurement problem for expectancy theory research.
Organizational Behavior and Human Performance, 1973, 10, 243-251. Snedecor, G. W., & Cochran, W. G. Statistical methods. Ames: Iowa State Univ. Press,
1967. Turney, J. R. Activity outcome expectancies and intrinsic activity values as predictors of
several motivation indexes for technical-professionals. Organizational Behavior and Human Performance, 1974, 11, 65-82.
Turney, J. R., & Cohen, S. L. Influence of work content on extrinsic outcome expectancy and intrinsic pleasure predictions of work effort. Organizational Behavior and Human Performance, 1976, 17, 311-327.
Vroom, V. H. Work and motivation. New York: Wiley, 1964.
RECEIVED: December 28, 1981