Embed Size (px)
Citation preview
Page 1 of 22
Second Compliance Period (2015-2017)
Target Reduce GHG emissions to 1990 levels by 2020
80% reduction in GHG emissions below 1990 levels by 2050
Cap 394.5 million tCO2e (2015)
Carbon price $11.65 (2014) $12.21 (Q1 2015)
Greenhouse Gases covered
Carbon Dioxide (CO2), Methane (CH4), Nitrous Oxide (N2O), Sulphur Hexafluoride (SF6), Hydrofluorocarbons (HFCs), Perfluorocarbons (PFCs), Nitrogen Trifluoride and other
fluorinated GHGs
Number of Entities Covered approximately 450 entities
Sectors Covered
cement production, cogeneration, glass production, hydrogen production, iron and steel production, lead production, lime
manufacturing, nitric acid production, petroleum and natural gas systems, petroleum refining, pulp and paper manufacturing, self-
generation of electricity, stationary combustion, CO2 suppliers, first deliverers of electricity, suppliers of natural gas, suppliers of reformulated blendstock for oxygenate blending (RBOB) and
distillate fuel oil, refineries that produce liquid petroleum gas in California, facilities that process natural gas liquids to produce
liquid petroleum gas, and suppliers of liquefied natural gas
Threshold >25,000 tCO2e % Total emissions
covered 85%
Compliance tools & Flexibility
Mechanisms
Free allowances (for some sectors), auctions, offsets (8%), allowance price containment reserve, banking, limited borrowing,
three-year compliance period
Table 1: Program Overview
California The World’s Carbon Markets: A Case Study Guide to Emissions Trading Last Updated: April 2015

Page 2 of 22
Brief History & Key Dates
Year Event
2006 AB 32 authorizes use of cap and trade 2008 AB 32 Scoping Plan announces plans to include fuels in 2015 2009 Cap-and-trade program development begins 2010 Californians reject attempt to suspend AB 32 2011 Cap-and-trade rules receive final approval 2012 First allowances auction
2013 First compliance period begins: cap-and-trade program begins covering stationary sources
2014 Program links with Québec’s emissions trading system 2014 First update to California’s Climate Change Scoping Plan 2015 Second compliance period begins; expands to cover fuels
Table 2: Key Dates
Source: See generally, California Air Resources Board. Available at: arb.ca.gov
California was the world’s eight largest economy in 20141 and the second largest emitter of greenhouse gases (GHG) in the United States. 2 In 2012, California emitted 458.68 million tonnes of CO2e (tCO2e).3 Transportation constitutes the largest source of California’s emissions (36.5%), followed by industrial emissions (19.4%) and electricity generation (20.7%).4 In order to reduce the state’s emissions, the Global Warming Solutions Act, also known as Assembly Bill 32 (AB 32), was introduced and signed into law by Governor Arnold Schwarzenegger on 27 September, 2006. AB 32 requires the California Air Resources Board (ARB) to develop regulations which may include market mechanisms to reduce GHG emissions to 1990 levels by 2020.5 Included in the legislation was a requirement to develop a Climate Change Scoping Plan (to be updated every five years) towards achieving cost-effective GHG emission reductions by 2020.6
California joined the Western Climate Initiative (WCI) in 2007 — a sub-national policy collaborative of independent jurisdictions in Canada and the United States (British Columbia, Manitoba, Ontario, Québec and California) working together to reduce GHG emissions. To date, the only WCI members that have established emissions trading systems (ETS) are California and Québec. However, Ontario recently announced its intention to launch an ETS (13 April 2015).7
The initial Scoping Plan was developed by the ARB in 2008 to outline California’s emissions reduction target and included a wide range of recommended strategies , direct regulations, market-based approaches, voluntary measures and other programs.8 The first Update of the Climate Change Scoping Plan was approved by the ARB on 22 May, 2014.9 This update built upon the initial Scoping Plan with new strategies and recommendations.10 It aims to identify opportunities, define California’s priorities and activities for the next five years and develop a framework to achieve both air quality and climate goals beyond 2020. The Updated Scoping Plan focuses on actions in six main areas:11
• Energy, • Transportation, • Agriculture, • Water, • Waste Management, • Natural and Working Lands.

Page 3 of 22
AB 32 and the Climate Change Scoping Plan include the implementation of a cap-and-trade program as one of the tools to reach the 2020 emissions reductions target. On 20 October, 2011, the ARB submitted final rules for the state’s cap-and-trade program to the California Office of Administrative Law (OAL). OAL approved the rules on 13 December, 2011, and Article 5 – California Cap on Greenhouse Gas Emissions and Market-Based Compliance Mechanisms – was formally added to Sub-chapter 10 of Title 17 of the California Code of Regulations.12 Along the way, the program has had to overcome several legal challenges with regard to the use of offsets and auctioning in the cap-and-trade system:
• In 2010, the Association of Irritated Residents (AIR) filed a lawsuit against the ARB claiming that the cap-and-trade regulations were not consistent with the California Environmental Quality Act (SB 154) which requires projects (subject to the Act) to consider the potential environmental effects of state approved "projects" and feasible ways to mitigate them.13 The case led the ARB to conduct additional analysis regarding the alternatives to cap-and-trade, but in 2012 the California Court of Appeals ruled in favor of the ARB.
• On 28 March, 2012, the Citizens Climate Lobby and Our Children’s Earth filed a lawsuit against the ARB, related to the use of offsets in the program and alleging that the ARB violated the text of AB 32 when it approved four offset protocols for compliance use. On 23 February, 2015 the California Court of Appeal ruled in favor of the program, stating that the ARB had acted reasonably by creating a set of standardized offset protocols.14
• On 13 November, 2012, the day before the first auction of AB 32 allowances, the California Chamber of Commerce filed a lawsuit claiming that auctioning emissions allowances is beyond the statutory authority conferred to the ARB by AB 32 and constitutes an illegal tax.
• On 16 April, 2013, a coalition of businesses and trade groups represented by the Pacific Legal Foundation filed a lawsuit also claiming that the use of auctioning is against regulations stipulated by AB 32 and constitutes an illegal tax. The California Superior Court for Sacramento County has since issued decisions in favor of the ARB in both of these latest cases; both are currently on appeal.
The first compliance period of the California ETS started on 1 January, 2013, and covered GHG emissions from facilities such as heavy industry and first deliverers of electricity (including imports) and suppliers of CO2 who emit more than 25,000 tCO2e/year.15 On 1 January, 2014, California officially linked its cap-and-trade program to Québec’s via the WCI. All compliance units are fully fungible for compliance across either jurisdiction. The first joint auction was held on 25 November, 2014, with a clearing price of $12.10 per allowance.16 Under the linked system, compliance instruments (allowances, offsets, and early action offsets) will be recognized as mutually and equivalently acceptable in either jurisdiction.
The second compliance period began on 1 January, 2015, when the California ETS extended its scope to include fossil transportation fuels and retail sales of natural gas. Almost 85% of Californian GHG emissions are now covered by the cap-and-trade program.17
On 2 June, 2014, the US Environmental Protection Agency (EPA) proposed the Federal Clean Power Plan (CPP) 18 for existing power plants under the legal authority of section 111(d) of the Clean Air Act – following an earlier proposal under section 111(b) for new builds. The aim of the plan is to reduce emissions in the power sector by 30% by 2030 relative to 2005 levels.19 Under proposed the CPP, the EPA would establish a carbon intensity target for electricity generators in each state. State reduction targets will be based on a national formula, calculated with state-wide and regionally specific information (with fixed interim goal and a final reduction targets). The proposed CPP is based on flexibility, providing:20
• a wide timeline of up to 15 years from when guidelines are issued to fully implement all emission reduction measures by 2030;
• a choice in the nature of the goal, to use either a rate-based or a mass-based goal;

Page 4 of 22
• a choice in the nature of the plan, to use either a single or multi-state approach; and, • an array of tools that states can use to reduce emissions, depending on their particular circumstances and
policy objectives. These measures are summarized in four key “building blocks”:
1. Improving efficiency of existing fossil fuel power plants, 2. Shifting generation from high-emitting power plants to lower-emitting units, 3. Expanding use of zero-emitting generating resources, such as renewables and nuclear, 4. Increased end-use energy efficiency.
Currently, the EPA is planning to issue final rules on the CPP for new and existing power plants power plants in the summer of 2015.21 Thereafter, the EPA will propose a federal plan for meeting CPP goals which will be open for public review and comment, and finalized by 2016 along with the submissions of complete or initial compliance plans by individual states.22 The EPA will issue a final federal plan for states that do not submit their own plans.23 The due dates for compliance plans may be extended upon request, permitting a one-year extension for individual states and a two-year extension for multi-state compliance plans.24 While the CPP is still in the development stages, these regulations may have significant implications for California’s cap-and-trade program.
Summary of Key Policy Features
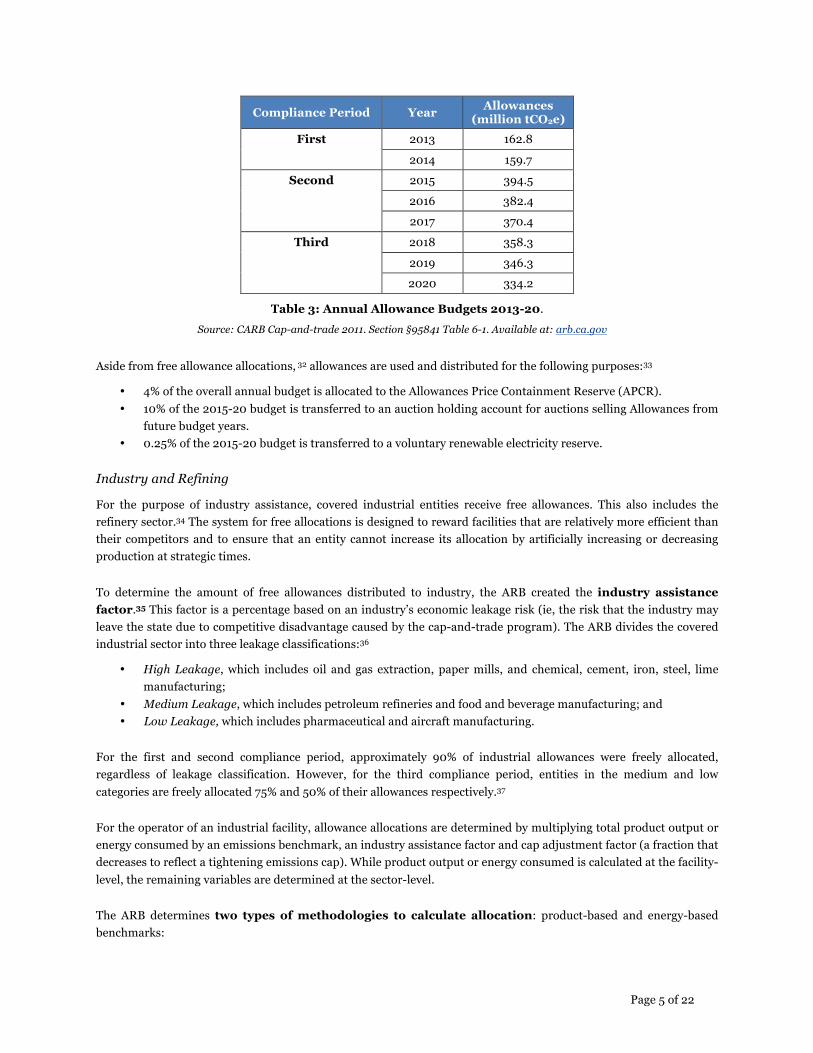
SCOPE & COVERAGE: The cap-and-trade program is composed of three compliance periods. The first compliance period (2013-14) applied to electricity generators (including imported electricity) and large industrial facilities emitting 25,000 tCO2e or more annually.25 The second compliance period started on 1 January, 2015 and runs until the end of December 2017. The scope of the program was extended to cover 85% of California emissions for this compliance period by including combustion emissions from transportation fuels and retail sales of natural gas.26 For fuel suppliers or importers, as for other regulated entities, the threshold is 25,000 tCO2e /year or more.27 The third compliance period will run from 2018 to 2020. The program applies to: carbon dioxide (CO2), methane (CH4), nitrous oxide (N2O), sulphur hexafluoride (SF6), hydrofluorocarbons (HFCs), perfluorocarbons (PFCs), nitrogen trifluoride and other fluorinated GHGs. The system covers approximately 450 entities.i
COMPLIANCE OBLIGATION: The annual compliance obligation for a covered entity is at least 30% of its emissions from the previous year.28 One year after the end of each compliance period (so in 2015, 2018 and 2021), a “true-up” occurs, whereby a covered entity must retire an allowance or offset for each tonne of CO2e emitted over the compliance period but not already accounted for in the annual compliance obligation (see section on banking and borrowing).29 If an entity is found to be non-compliant at the end of the period, it must forfeit four allowances for each allowance it did not retire.30 The partial annual compliance obligation offers a form of flexibility to participants regarding how they use their allowances and meet their compliance obligations. In the years 2015, 2018 and 2021, only a triennial compliance obligation is required (annual compliance obligations are suspended).31
ALLOWANCE DISTRIBUTION: ARB determines the annual allowance budget for covered entities between 2013 and 2020 (see Table 3). In 2013, ARB set the initial allowance budget at 162.8 million tCO2e, equal to the projected emissions for that year. From 2013-15, the allowance budget decreased by approximately 2% annually. In 2015, the allowance budget was 394.5 million tCO2e to accommodate the program’s expansion into additional sectors, but will be decreased by 12 million tCO2e every year thereafter. This corresponds to a gradually increasing percentage reduction of 0.1% each year until the end of 2015, 3% in 2016 and increasing to 3.5% in 2020.
i ARB, 2015 Overview of ARB emissions trading program, arb.ca.gov, February 2015
Page 5 of 22
Compliance Period Year Allowances (million tCO2e)
First 2013 162.8
2014 159.7
Second 2015 394.5
2016 382.4
2017 370.4
Third 2018 358.3
2019 346.3
2020 334.2
Table 3: Annual Allowance Budgets 2013-20. Source: CARB Cap-and-trade 2011. Section §95841 Table 6-1. Available at: arb.ca.gov
Aside from free allowance allocations, 32 allowances are used and distributed for the following purposes:33
• 4% of the overall annual budget is allocated to the Allowances Price Containment Reserve (APCR). • 10% of the 2015-20 budget is transferred to an auction holding account for auctions selling Allowances from
future budget years. • 0.25% of the 2015-20 budget is transferred to a voluntary renewable electricity reserve.
Industry and Refining
For the purpose of industry assistance, covered industrial entities receive free allowances. This also includes the refinery sector.34 The system for free allocations is designed to reward facilities that are relatively more efficient than their competitors and to ensure that an entity cannot increase its allocation by artificially increasing or decreasing production at strategic times.
To determine the amount of free allowances distributed to industry, the ARB created the industry assistance factor.35 This factor is a percentage based on an industry’s economic leakage risk (ie, the risk that the industry may leave the state due to competitive disadvantage caused by the cap-and-trade program). The ARB divides the covered industrial sector into three leakage classifications:36
• High Leakage, which includes oil and gas extraction, paper mills, and chemical, cement, iron, steel, lime manufacturing;
• Medium Leakage, which includes petroleum refineries and food and beverage manufacturing; and • Low Leakage, which includes pharmaceutical and aircraft manufacturing.
For the first and second compliance period, approximately 90% of industrial allowances were freely allocated, regardless of leakage classification. However, for the third compliance period, entities in the medium and low categories are freely allocated 75% and 50% of their allowances respectively.37
For the operator of an industrial facility, allowance allocations are determined by multiplying total product output or energy consumed by an emissions benchmark, an industry assistance factor and cap adjustment factor (a fraction that decreases to reflect a tightening emissions cap). While product output or energy consumed is calculated at the facility-level, the remaining variables are determined at the sector-level.
The ARB determines two types of methodologies to calculate allocation: product-based and energy-based benchmarks:

Page 6 of 22
• Product output-based methodology: the ARB calculates an emissions allowance per unit produced two years prior, and multiplies it by the emissions factor, the industry assistance factor of the year and the cap adjustment factor of the year. Moreover, an additional amount of allowances can be calculated for “true-up” period.38 True-up allowances are distributed for changes in production or when allocations were not properly accounted for in prior allocation. True-up allowances can only be calculated if the entry was covered by the ETS two years prior.
Allocated allowances = (Total of units produced two years prior *emissions factor*assistance factor of the year * cap adjustment factor) + true-up allowances
• Energy-based methodology: the ARB calculates allocation by adding historical annual arithmetic amount of fuel and steam consumed and subtracts from this the amount of electricity sold or provided for off-site uses. This amount is then multiplied by the industry assistance factor (AF) of the year and the cap adjustment factor of the year.39
Allocated allowances = (historical amount of consumed fuel * emissions factor ((EF)) + historical amount of consumed steam * EF - historical amount of electricity sold or for off-site uses * EF) * industrial
assistance factor of the year * cap adjustment factor
The regulation does not allow the number of allowances directly allocated to cause overall allowance distrubution to exceed the cap. If the calculated allowances amount exceeds available allowances, the number of allowances will be “prorated equally across all eligible industrial entities”.40
Electricity distribution– “electricity deliverers”
The point of regulation for the utility sector is at electricity deliverers. For this sector, the amount of annual available allowances for allocations is set at 97.7 million tCO2e multiplied by the cap adjustment factor for each budget year from 2013-20.41 The ARB calculates the amount of allocated allowances for each covered electricity deliverers as following:42
Allocated allowances = Annual overall available allocated allowances * cap adjustment factor * determined electricity deliverer allocation factor
Free allowances are distributed to electricity deliverers, but in return they are required to submit all those allowances into the auction pool.43 The auction proceeds received from the sale of allowances are to be used exclusively for the benefit of retail ratepayersl.44
For the electricity sector, since it is already highly regulated by the state public utilities commission, the need to account for perverse incentives in the allocation process is minimized.
Natural gas suppliers
Free allowances to natural gas suppliers are calculated using 2011 emissions levels.
Allocated allocation = 2011 amount of natural gas supplier’s emissions * cap adjustment factor
Similar to electricity deliverers, natural gas suppliers are required to submit all allowances into the auction pool.45 The allowances and auction proceeds are to be used exclusively for the benefit of retail ratepayers.46

Page 7 of 22
Legacy contract generators, university and public services facilities also receive some free allowances.47 The covered entities (fuel suppliers and importers) in the transportation sector do not receive any free allocation; rather they must purchase all allowances at auction or in the market.
AUCTION OVERVIEW: Allowances from the current budget year are auctioned every three months – the sales may also include any remaining unsold allowances from previous budget years.48 Allowances from future budget years are sold at advance auctions49 and are withdrawn from the Auction Holding Account (AHA), which holds 10% of all allowances from budget years 2015-20.50 At advance auctions, one-quarter of the allowances held in the AHA will be offered for compliance from future vintage allowances, three years subsequent to the current auction year.51
Winning bidders will pay either the clearing price52 (the lowest bidding price where the supply of allowances on offer has been exhausted) or the reserve price53 (below which no allowances will be sold), depending on which is reached first. The quarterly auctions use an internet-based auction platform, where bidders can make submissions in a single-round,54 sealed-bid format. 55
Since 1 January 2015, the auction purchase limit in both the current auctions and the advanced auctions is 25% of the total allowances offered.56
The first joint auction between California and Québec, which was held in November 2014, was preceded by a practice joint auction on 7 August 2014 to determine the capability of the program to deal with the introduction of the Canadian dollar (CAD).57 While Canadian entities are eligible to participate using both currencies, California participants are only authorized to participate using US dollars, and all exchange rates will be calculated using the Auction Exchange Rate that is set the business day prior to the auction.58 At the first official joint auction on 19 November, not all market participants were able to access and submit bids in the auction, which led to a rescheduling of the auction, to 25 November 2014.59
AUCTION PROCEEDS: Proceeds from allowance auctions are deposited into the Greenhouse Gas Reduction Fund (GGRF) to advance the objectives of AB 32, pursuant to Government Code section 16428.8.60 The process for directing investments of auction proceeds began with a three-year investment plan developed by the ARB and the Department of Finance. Annual expenditures consistent with the investment plan are implemented through the California budget process, which begins in January with the Governor's proposal and continues with the Legislature review before being finalized by the Governor in June.61

Page 8 of 22
Auction Date Proceeds ($) Auction 1 Nov-12 55,760,000
Auction 2 Feb-13 83,923,548
Auction 3 May-13 117 580 484
Auction 4 Aug-13 138,494,503
Auction 5 Nov-13 136,799,446
Auction 6 Feb-13 130,706,470
Auction 7 May-14 71,140,023
Auction 8 Aug-14 98,741,583
Joint Auction 1 Nov-14 135,983,387
joint Auction 2 Feb-15 629,516,452
Total Auction Proceeds 1,598,646,259
Table 4: Proceeds from the Sale of State-Owned Allowances Deposited in the GGRF (as of February, 2015)
Source: CARB, 2015. Annual Report to the Legislature on Investments of Cap-and-Trade Auction Proceeds (Greenhouse Gas Reduction Fund Monies) March 2015. Available at: arb.ca.gov
Chapter 830 in the Statutes of 2012 (SB 535) requires that the state must invest 25% of the GGRF into projects that benefit disadvantaged communities.62 Additionally, it stipulates that a minimum of 10% of the funds be invested directly within disadvantaged communities.63 SB 535 directs the state’s Environmental Protection Agency to identify disadvantaged communities using CalEnviroScreen, a tool developed by the office of Environmental Health Hazard Assessment.64 The Statute also stipulates that 60% of auction proceeds are permanently allocated by the California State Budget for public transit, sustainable communities, high-speed rail and affordable housing.65
For the Fiscal year spanning 2013-14, the Governor and state legislature were authorized by the Budget Act to offer a one-time loan of auction proceeds to the General Fund. In March 2014, this was amended to provide funding to the California department of Water Resources (DWR), the California Department of Food and Agriculture and additional funding to the ARB for the development of low-carbon transportation. The state budget for the Fiscal year 2014-15 appropriated $832 million in auction proceeds towards benefiting disadvantaged communities, reducing GHG emissions and providing additional economic and environmental benefits.66 The enacted budget for Fiscal Year 2014-15 allocates the following monies to the following programs:67
• $630 million towards sustainable communities and clean transportation, including high-speed rail; • $110 million towards energy efficiency and clean energy programs; and, • $92 million towards natural resources and waste diversion programs.
The proposed budget expenditure plan for 2015-2016 is as follows (the budget is is expected to be finalized by 2015 Summer):

Page 9 of 22
Figure 1: Cap-and-Trade Expenditure Plan 2015-16
Source: Edmund Brown Jr, Governor State of California ‘2015-2016 Governor’s Budget Summary Cap-and-Trade Expenditure’ Plan Available at: ebudget.ca.gov pg. 96
Figure 2 (below) shows the anticipated value of allowance allocations broken down by year and allocation type (free allocation to industry, value to investor-owned utilities and publicly-owned utilities (IOU/POUs), air pollution control fund, etc.) and also displays estimates of average allowance prices for each year.
Figure 2: Allowance Revenues Associated with Uses Through 2020.
Source: Next10 Report, “Using the Allowance Value from California's Carbon Trading System.” Available at: next10.org
80%
11%
9%Sustainable Communitiesand Clean transportation(US$ 800 million)
Energy Efficiency andClean Energy (US$ 100million)
Natural Resources andWaste Diversion (US$ 92million)
Page 10 of 22
FLEXIBILITY PROVISIONS & COST CONTAINMENT MECHANISMS: California’s cap-and-trade program contains a suite of flexibility provisions and cost containment mechanisms including a “true-up” at the end of each multi-year compliance period, allowance banking and borrowing, price collars (including a price floor and an allowance price containment reserve that acts as a soft ceiling) and the use of offsets.
Offsets
Offsets are subject to an 8% quantitative usage limit.68 That is, no more than 8% of a company’s total compliance obligation for each compliance period can be satisfied by any type of approved offset.69 Offset types include early action offsets, international sector-based offsets and ARB offset credits. Any reduction of GHG emissions from offset projects and used for compliance purposes must be real, permanent, quantifiable, verifiable, enforceable and additional.70
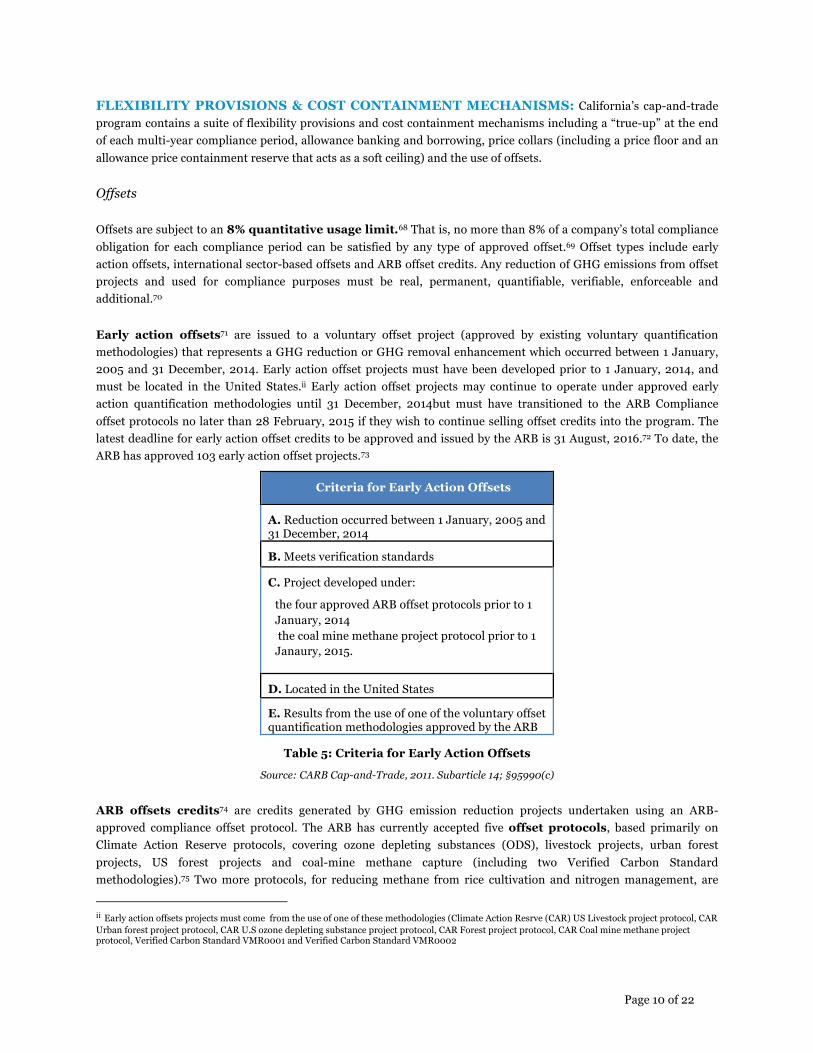
Early action offsets71 are issued to a voluntary offset project (approved by existing voluntary quantification methodologies) that represents a GHG reduction or GHG removal enhancement which occurred between 1 January, 2005 and 31 December, 2014. Early action offset projects must have been developed prior to 1 January, 2014, and must be located in the United States.ii Early action offset projects may continue to operate under approved early action quantification methodologies until 31 December, 2014but must have transitioned to the ARB Compliance offset protocols no later than 28 February, 2015 if they wish to continue selling offset credits into the program. The latest deadline for early action offset credits to be approved and issued by the ARB is 31 August, 2016.72 To date, the ARB has approved 103 early action offset projects.73
Criteria for Early Action Offsets
A. Reduction occurred between 1 January, 2005 and 31 December, 2014
B. Meets verification standards
C. Project developed under:
- the four approved ARB offset protocols prior to 1 January, 2014
- the coal mine methane project protocol prior to 1 Janaury, 2015.
D. Located in the United States
E. Results from the use of one of the voluntary offset quantification methodologies approved by the ARB
Table 5: Criteria for Early Action Offsets
Source: CARB Cap-and-Trade, 2011. Subarticle 14; §95990(c)
ARB offsets credits74 are credits generated by GHG emission reduction projects undertaken using an ARB-approved compliance offset protocol. The ARB has currently accepted five offset protocols, based primarily on Climate Action Reserve protocols, covering ozone depleting substances (ODS), livestock projects, urban forest projects, US forest projects and coal-mine methane capture (including two Verified Carbon Standard methodologies).75 Two more protocols, for reducing methane from rice cultivation and nitrogen management, are
ii Early action offsets projects must come from the use of one of these methodologies (Climate Action Resrve (CAR) US Livestock project protocol, CAR Urban forest project protocol, CAR U.S ozone depleting substance project protocol, CAR Forest project protocol, CAR Coal mine methane project protocol, Verified Carbon Standard VMR0001 and Verified Carbon Standard VMR0002

Page 11 of 22
currently under discussion. If approved, the former will be the first rice project listed in the American Carbon Registry and it will be limited to major rice growing regions in California and Mid-South (Arkansas, Missouri, Mississippi and Louisiana).76 In addition, the ARB is working on including Alaska in the forestry protocol.
In January 2015, the ARB initiated the rule-making process to develop a methodology for carbon capture and storage (CCS) projects, along with standards to ensure reductions are achieved.77 While the ARB cap-and-trade regulations currently acknowledge the potential for GHG emissions reductions via CCS, covered entities may not receive credits for CO2 sequestration as there is no established quantification methodology for such reductions. The ARB’s 2015-16 budget will allocate funds towards establishing the necessary standards and methodologies to develop this protocol.78
Non-sequestration projects are eligible for credits for a period of between seven and ten years, whereas sequestration
projects are entitled to longer crediting periods of between ten and thirty years.79 Under the current protocols, offsets
projects must be located within the United States, Canada, and Mexico,80 although there is room for more offset
protocols to be added to the program in the future, subject to ARB approval.81
Figure 3: ARB Offset credits issued February 2015 (cumulative)
Source: ARB,2015. ARB Offset credits issued. Available at: arb.ca.gov
Linked offset credits are generated through a GHG emission reduction projects issued by a linked jurisdiction, (currently just Québec). The use of these credits is included in the overall 8% offset limit.82
International sector-based offset credits83 are generated through a sector-based crediting program that reduces GHG emissions from a specific sector in a developing country or a sub-national jurisdiction, such as a state or a region. To date, the only sources of sector-based offset credits are projects under Reducing Emissions from Deforestation and Forest Degradation (REDD).84 These sector-based offset credits are limited to 2% of a covered entity’s total compliance obligation for the first and second compliance period and limited to 4% for the third compliance period.85 Currently, there is no approved sector-based offset program.86
California currently participates in the Governors’ Climate and Forests Task Force, a multi-jurisdictional collaborative effort among 22 sub-national jurisdictions from Brazil, Indonesia, Mexico, Nigeria, Peru, Spain and the United States
ODS Livestock US Forestry
Urban Forest MMC
Early Ac:on 5558153 722957 3010796 0 0
Compliance 2090920 85819 5563609 0 0
0 1,000,000 2,000,000 3,000,000 4,000,000 5,000,000 6,000,000 7,000,000 8,000,000 9,000,000 10,000,000
Num
ber o
f Credits

Page 12 of 22
(Illinois is the only other US state participating) that was established in 2009. It focuses on “developing the technical, legal, and institutional frameworks for comprehensive jurisdiction-wide programs to reduce emissions from deforestation and land use; support strategies for low-emissions rural development; and serve as pathways to and pillars of robust national and international efforts to include forests and land use in climate policy.”87 In addition, in 2010, California signed a memorandum of understanding (MOU) with the states of Acre, Brazil and Chiapas, Mexico to work towards the establishment of sectorial offset programs from REDD.88 By 2013, the three states created a REDD Offsets Working Group (ROW) in order to determine:
(1) The legal and institutional mechanisms necessary for a sub-national compliance program, such as California’s, to recognize international emission reduction credits from state-level sectorial REDD programs, such as in Chiapas and/or Acre; and,
(2) The key policy and technical elements that a sectorial REDD program should achieve in order for REDD credits to be recognized in a compliance program.89 While the inclusion of international REDD offsets are still under discussion, these restrictions mean that a maximum of 232 million tons of total offsets can be used for compliance through 2020, 81 million of which can be obtained from international sector-based programs.90
In February 2015, The Climate Action Reserve’s Mexico Ozone Depleting Substances (ODS) Project Protocol became available for public comment and is expected to be presented to the Reserve board of directors for approval by the end of April 2015.91 If approved and finalized, the Mexico ODS Project Protocol could be a potential source of international sector-based offset credits for California.
Credits Invalidation: The ARB has determined that it is the responsibility of the offset purchaser to replace invalidated offsets within six months.92 Many groups have termed this provision as “buyer liability” and have openly expressed concern over the cost of developing and issuing offsets. This is also hampering price discovery in the secondary offsets market.93
The statute of limitations for invalidation is currently eight years after issuance. However, this can be shortened if an offset project undergoes a second verification by a different verifying body within three years of issuance. In this case, the statute of limitations is shortened to three years for ODS projects, or three reporting periods for livestock, urban US forest projects or mine methane capture.94 The final regulation clarifies the grounds for invalidation and outlines three reasons for invalidation:95
• Overestimation: if an offset project’s data report contains errors that overstate the amount of GHG reductions or GHG removal enhancements by more than 5%.
• Illegality: if the project activity and implementation was not in accordance with all local, state or national environmental, health, and safety regulations during the Reporting Period for which the ARB offset credit was issued.
• Double-Counting: if the ARB finds that offset credits have been issued in other markets for the same project area during the same time period for which the project has received ARB credits.

Page 13 of 22
In the case of overestimation, the ARB will withdraw a number of credits according to the equation documented in the regulation:96
H = |T / I| * O
Where:
• H is the number of offsets to be withdrawn from holding/compliance accounts from each party that holds credits from the project.
• T is the total number of ARB offset credits from this project currently being held in holding/compliance accounts by each party that holds credits from this project.
• I is the total number of offsets issued for this offset project. • O is the amount of overstated GHG reductions and GHG removal enhancements by project (determined by ARB).
On 14 November, 2014, the ARB unveiled its final determination investigation into an ODS project at the Clean Harbors incineration facility in El Dorado, Arkansas.97 For the first time, the ARB invalidated 88,955 offset credits for reasons falling under ‘illegality’. Indeed one of the ARB criteria to issue offset credits is that the offset project activity is in “accordance with all local, state or national environmental and health and safety regulations during the Reporting Priod for which the ARB offset credit are issued”.98 In the El Dorado Clean Harbors situation, these facilities were not operating “in accordance with” the US EPA environmental rules.
Forestry reversals do not trigger invalidation.99 If reversal is unintentional but lowers a project’s actual carbon stocks below its baseline, the project will be terminated.100 If reversal is unintentional and does not drop the project below its baseline, the ARB will retire credits from the Forest Buffer account, a holding account for ARB forest offsets credits before they are issued. It is used as a general insurance mechanism against unintentional reversals for all forest offset projects. If reversal is intentional, the forest owner must replace the credits..101
Auction Price Controls
Price controls for auctioning include a floor price and an allowance price containment reserve.
The Auction Reserve Price or floor price is set at $12.10 in 2015. Initially for the 2012 auctions, the price was set at $10 and has increased annually by 5% plus the rate of inflation, calculated by the Consumer Price Index (CPI). 102
An Allowance Price Containment Reserve (APCR)103 collects a portion of allowances from auction each year and releases them if certain predetermined trigger prices are reached. Only California emitters are eligible to purchase allowances from the APCR. In the first compliance period, 1% of allowances were withheld from auction, in the second compliance period 4% of allowances are withheld, and in the third compliance period 7% will be withheld.104 Allowances from the ACPR are divided into three equal-sized tiers. In 2013, one of these tiers became available at each of the following prices: $40, $45 and $50. Since 2014, the trigger price increases by 5% annually plus inflation.105 Thus far, no allowances have been purchased from the reserve, as market prices for allowances remain far below the pre-prescribed price tiers. In response to stakeholder concerns of allowance supply shortages to the extent that the APCR is exhausted, the ARB amended the legislation to make additional allowances available, starting in 2015, in two ways:
• By transferring 10% of future years’ allowances budgets to the reserve and offering them for sale once per year at the highest price tier.106
• By making 10% of all remaining allowances from each vintage year not allocated eligible to be sold during an APCR auction.107

Page 14 of 22
2015 Tiers Price ($)
Tier 1 45.20
Tier 2 50.86
Tier 3 56.51
Table 6: 2015 Allowance Price Containment Reserve Bands
Source: CARB, 2015. Annual Allowance Price Containment Reserve Notice - California Cap-and-Trade Program Greenhouse Gas Allowance Price Containment Reserve Sales. Issued
December2, 2014. Available at: arb.ca.gov
Other flexibility mechanisms
Covered entities are allowed two credit holding accounts – compliance accounts and holding accounts.
Compliance accounts serve as a clearinghouse where allowances are transferred to the ARB for retirement. Allowances in compliance accounts cannot be sold, traded, or transferred to another account or entity. Once an allowance enters a compliance account, it can only be submitted directly to the ARB for compliance.108
Holding accounts are to be used whenever an entity is interested in trading allowances; allowances in holding accounts can be freely bought, sold or traded.109 Holding accounts are subject to two holding limits: one for allowances eligible for compliance use in the current year, and another for allowances eligible for compliance use in future years.110 Holding limits are intended to prevent individual entities (or small groups of entities) from manipulating the market by gaining too large a market share of allowances. Holding limits are controversial, however, because they disproportionately affect large emitters whose compliance obligations may be close to, or even greater than, the holding limit itself – thus forcing large emitters to keep a greater number of compliance units in their compliance accounts (where the holding limit does not apply, but then cannot be traded).
The holding limit for allowances eligible for compliance use in the current year is equal to the equation below:
HL(current year) = 0.1*Base + 0.025*(Annual Allowance Budget – Base)111
Where the “Base” equals 25 million tCO2e and the “Annual Allowance Budget” is equal to the number of allowances issued for the current budget year. Included in this holding limit are allowances that were issued for previous compliance years, purchased from the APCR (any vintage), or those that were purchased at an advance auction but are now eligible for compliance during the current compliance year.112
The holding limit for use in future years is calculated separately for each future vintage year. Its calculation is made with the same equation above. 113 The ARB has the authority to reverse transfers of compliance instruments in the event a company exceeds its holding limit.114 The oversight authority is shared between the Commodity Futures Trading Commission of the Federal Government under the Dodd-Frank Act, which covers swaps and futures markets, and the ARB, which will oversee spot and forward trading markets.
Banking and borrowing are also permitted by ARB allowing for the banking (or carrying forward) and borrowing of allowances. Banked allowances never expire,115 but the quantity of banked allowances is, however, subject to holding limits.116 Allowances can also be borrowed from future periods for compliance in the current period, but only to satisfy an excess emissions obligation.117 However, the provision for partial annual compliance may be viewed as a form of intra-period borrowing, in that when the true-up occurs at the end of a compliance period, allowances from later vintage years in the period can be submitted to comply for emissions that occurred in the earlier years of the compliance period. For example, a firm that chooses to comply with 30% of its annual emissions in 2015 — effectively
Page 15 of 22
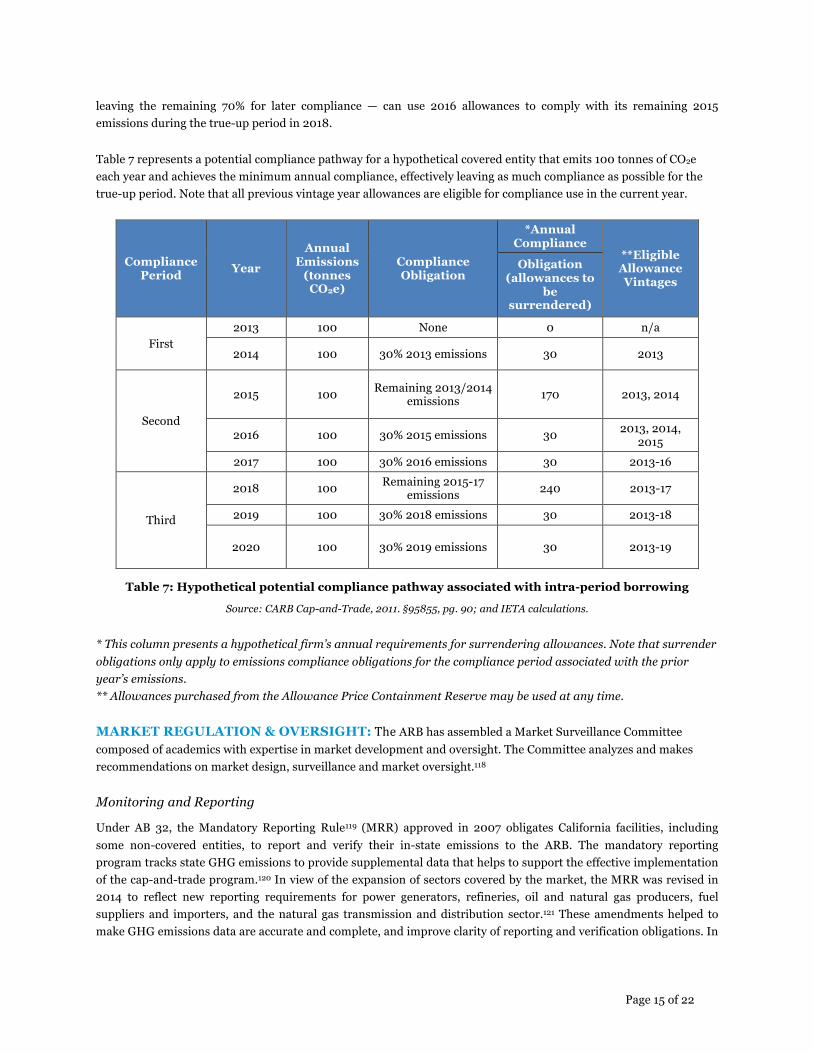
leaving the remaining 70% for later compliance — can use 2016 allowances to comply with its remaining 2015 emissions during the true-up period in 2018.
Table 7 represents a potential compliance pathway for a hypothetical covered entity that emits 100 tonnes of CO2e each year and achieves the minimum annual compliance, effectively leaving as much compliance as possible for the true-up period. Note that all previous vintage year allowances are eligible for compliance use in the current year.
Compliance Period Year
Annual Emissions
(tonnes CO2e)
Compliance Obligation
*Annual Compliance
**Eligible Allowance Vintages
Obligation (allowances to
be surrendered)
First 2013 100 None 0 n/a
2014 100 30% 2013 emissions 30 2013
Second
2015 100 Remaining 2013/2014 emissions 170 2013, 2014
2016 100 30% 2015 emissions 30 2013, 2014, 2015
2017 100 30% 2016 emissions 30 2013-16
Third
2018 100 Remaining 2015-17 emissions 240 2013-17
2019 100 30% 2018 emissions 30 2013-18
2020 100 30% 2019 emissions 30 2013-19
Table 7: Hypothetical potential compliance pathway associated with intra-period borrowing
Source: CARB Cap-and-Trade, 2011. §95855, pg. 90; and IETA calculations.
* This column presents a hypothetical firm’s annual requirements for surrendering allowances. Note that surrender obligations only apply to emissions compliance obligations for the compliance period associated with the prior year’s emissions. ** Allowances purchased from the Allowance Price Containment Reserve may be used at any time.
MARKET REGULATION & OVERSIGHT: The ARB has assembled a Market Surveillance Committee composed of academics with expertise in market development and oversight. The Committee analyzes and makes recommendations on market design, surveillance and market oversight.118
Monitoring and Reporting
Under AB 32, the Mandatory Reporting Rule119 (MRR) approved in 2007 obligates California facilities, including some non-covered entities, to report and verify their in-state emissions to the ARB. The mandatory reporting program tracks state GHG emissions to provide supplemental data that helps to support the effective implementation of the cap-and-trade program.120 In view of the expansion of sectors covered by the market, the MRR was revised in 2014 to reflect new reporting requirements for power generators, refineries, oil and natural gas producers, fuel suppliers and importers, and the natural gas transmission and distribution sector.121 These amendments helped to make GHG emissions data are accurate and complete, and improve clarity of reporting and verification obligations. In
Page 16 of 22
addition, the recent MRR program amendments integrate and provides data needed to determine the Cost of Implementation Fee Regulation (COI Fee Regulation).122
Generally, applicability thresholds for reporting are lower than those for compliance. For example, the reporting threshold for fuel suppliers is 10,000 tCO2e, lower than the 25,000 tCO2e compliance threshold.123 Additionally, the scope for reporting and compliance thresholds differs. For example, producers of bio-ethanol do not have a compliance obligation for production emissions, yet are required to report these emissions to the ARB. On 1 January 2015, the Office of Administrative Law released MRR amendments that were negotiated in September 2014.
Enforcement and penalties
The ARB prohibits any trading involving a manipulative device, fraud, attempted fraud or false or inaccurate reports. For a violation of the regulations, civil and criminal penalties as defined by the Health and Safety code apply. In the where a covered or opt-in entity fails to surrender its annual or triennial obligation, this entity is subject of the “Untimely Surrender obligation” and issued penalties as follows:124
• The Untimely surrender obligation is calculated as four times the entity’s excess emissions.
• At least three-quarters of units surrendered under this penalty must be allowances issued by either California or a linked partner (at present, just Québec.) Offsets can be used for up to one-quarter.
• The Untimely surrender obligation is due within five days of settlement of the first auction or reserve sale conducted by the ARB following the compliance deadline.
COMPLEMENTARY MEASURES: In the 2008 Scoping Plan on compliance with AB 32, the ARB outlined a number of supplementary emissions reduction policies. These include a 33% Renewable Portfolio Standard and Advanced Clean Cars Program, both of which have been adopted at the federal level. In addition, land use, housing and transportation planning to reduce regional GHG emissions have also been integrated into the Scoping Plan in compliance with Senate Bill 375’s Sustainable Communities and Climate Protection Act of 2009.
The cap-and-trade program is estimated to account for approximately 29.5%, or 23 million tCO2e, of the emissions reductions required by 2020 by AB 32.125
In May 2014, the first update to the climate change scoping plan was released, looking at the progress made on the near-term objectives of AB 32 as well as defining climate change priorities and objectives over the coming years. In February 2015, updated regulations to the Low Carbon Fuel Standard (LCFS) were received by the ARB with formal re-adoption scheduled for the summer of 2015.126 Taken together, LCFS and California’s Zero Emission Vehicle Program (ZEV)127 are projected to reduce per-capita fuel costs and GHG emissions to 30% below current levels by 2020 and by approximately 50% by 2035.128 Moreover, California has also implemented Building and Appliance Efficiency Standards, the California Solar initiative, Water Efficiency standards, Mandatory Commercial Recycling and High Speed Rail as part of their Climate Change Strategy.
In addition to climate objectives, California is also required to meet federal Clean Air Act standards, which aim to reduce emissions of criteria air pollutants, ozone precursors and particulate matter to 90% below current levels by 2030. These federal standards and reductions have been adjusted in scale and scope to improve air quality to a level that is in accordance with long-term climate targets.129

Page 17 of 22
Figure 4: Expected Emission Reductions from Sector Based Measures and Cap-and-Trade Reduction to Meet the 2020 Emissions Target
Source: CARB, 2014. first update of climate change scoping plan.Available at: arb.ca.gov page. 93
Taken together, the remaining policies are estimated to account for 75%, or 58.5 million tCO2e of the necessary emission reduction goals under AB 32.130 However, cap and trade is currently the only economy-wide provision in the scoping plan, and serves as the back-stop that guarantees California still reaches its emissions reduction target if other measures fall short.
RESULTS:
Carbon Price Evolution
Before the first joint auction between California and Québec took place in November 2014, the price per tCO2e remained close to the auction reserve price ($10.25 from 2013 to 2014 ). Since the two programs were linked, the market price has remained around $11-12 – still tracking the auction reserve price. The link to Québec has not impacted California’s market price as the state, being the larger market, is the ‘price maker’ for the two systems.
Figure 5: Auction clearing prices Source: CARB, 2015. Auction Clearing Prices. Available at: arb.ca.gov
32%
30% 6%
3%
29%
Energy
Transporta:on
High Global Warming Poten:al Waste
Cap and Trade Reduc:ons
0
2
4
6
8
10
12
14
16
USD $

Page 18 of 22
Compliance Breakdown
By the first quarter of 2015, Californian and Québecois entities have mainly used allowances (99.95%) to comply with their cap-and-trade obligations.However, since the first quarter of 2014, when no offsets were used, the share of offsets has been slowly increasing.131 The use of offsets may continue to grow in view of the inclusion of fuel producers and importers which are not allocated free allowances. It’s worth noting that, as of 2 April, more than 14 million offset credits were held in holding accounts – which can thus still be traded in the secondary market or used for compliance at a later date.
Vintage Entity Compliance Account
Entity General Account
Total Allowances held
2013 77,718,344 62,453,405 140,171,749
2014 63,403,031 110,897,576 174,300,607
2015 76,745,629 133,664,332 210,409,961
2016 0 32,783,000 32,783,000
2017 1,742,100 32,852,900 34,595,000
2018 0 10,431,500 10,431,500
2019 0 0 0
2020 0 0 0
Non-Vintage Québec Early Action Allowances (QC) 360,000 1,680,026 2,040,026
Non-Vintage Price Containment Reserve Allowances 0 0 0
Allowances Subtotal 219,969,104 384,762,739 604,731,843
US Forest Project Offset Credits (CA)+ 39,368 5,743,764 5,783,132
Urban Forest Project Offset Credits (CA) 0 0 0
Ozone Depleting Substances Offset Credits 66,784 7,655,887 7,722,671
Livestock Manure Digesters Offset Credits 0 697,223 697,223
Mine Methane Capture Offset Credits (CA) 0 278,177 278,177
Landfill Site Methane Destruction Offset Credits (QC) 0 0 0
Offset Credits Subtotal 106,752 14,375,051 14,481,803
TOTAL 220,075,856 399,137,790 619,213,646
Table 8: Holding of Allowances April 2015 Source: CARB, 2015. Linked California and Québec Cap-and-Trade Programs Compliance Instruments Agregated by Type and
Account. Released April 2 2015. Available at: mddelcc.gouv.qc.ca
Offsets
By February 2015, the ARB had issued over 17 million offset credits– (of which 54.55% were early action offset credits).132 The estimated demand for offsets from 2013 to 2020 is 174 million tCO2e133 with an ARB ex ante assessment estimating offsets to be used for 17-24% of Californian GHG emissions abatements.134 However, due to limited approved offset methodologies, a slow start to offset development and a slow start to offset issuance, the American Carbon Registry forecasted a “significant shortage of compliance offsets as compared to total potential demand for compliance offsets in all compliance periods if no additional protocols beyond the existing four are adopted by ARB”.135

Page 19 of 22
This might lead to an increase in demand for allowances and subsequently an increase in allowance prices within the linked Californian-Québec ETS.
What Distinguishes this Policy?
UNIQUE ASPECTS:
1. California’s Mandatory Reporting Rule has required businesses to report GHG emissions since 2008, meaning that the cap was set based on real emissions data rather than estimates. This helps to reduce the likelihood of over-allocation, which has occurred in other programs.
2. The ARB has taken a rigorous approach to ensure the environmental integrity of offsets that will be eligible to enter California’s program. The ARB is responsible for adopting protocols that set guidelines that individual projects must meet and that make accounting and other practices consistent across like projects. The board has approved five protocols so far: ODS, livestock digesters, urban forests, US forest projects and mine methane capture.
3. The ability for the ARB to approve sectoral crediting provides opportunities for experimenting with compliance credits for scaled-up mechanisms such as jurisdictional accounting for REDD+, which is an innovation for compliance markets.
4. The linking of the California and Québec cap-and-trade programs expands the scope of the two systems. It is the first linkage of two jurisdictions from same initiative (the Western Climate Initiative) and where the ETS design was based on the same guidelines.
CHALLENGES:
1. The text of AB 32 requires California to account for the emissions associated with the power that is imported into the state.136 The cap-and-trade program therefore regulates electricity that the state imports from its neighbors (in 2013, 32.6% of power used in California was generated out of state).137 As a result, updated regulations address the issue of resource shuffling, which is a form of carbon leakage specific to the electricity sector. Leakage occurs when state distributers improperly substitute imports from low-emitting sources for high-emitting sources to the California electricity network. As a result, higher emitting power is redirected to states not covered by a cap. The cap-and-trade regulation list 13 "safe harbors" that do not constitute resources shuffling and two broad categories that do constitute resource shuffling.138 First deliverers must report electricity deliveries to the ARB with emissions calculated under the MRR compliance obligations.139 Resource shuffling can impact the carbon price and also can undermine the efficacy of the cap-and-trade program and California’s ability to meet its emission reduction targets.
2. California continues to consider the optimal balance of free allocation and allowance auctions. This decision is ultimately a balancing act between the need to protect businesses from out-of-state competition and the need to transition to a polluter pays model where Californians see tangible benefits to their health, economy and the environment as the state invests auction revenue.
3. There are market functionality issues, such as holding limits, know-your-customer requirements and buyer liability for offsets provisions, where the ARB needs to ensure adequate protection without compromising the liquidity of the market. The ARB has also committed to monitoring the system for signs of gaming or fraudulent activity.
4. In the next years, the development of the California’s cap-and-trade system will depend on the government’s ability to find new partners to link with. The Clean Power Plan has the potential to drive some US states to develop new legislation for the implementation of an emissions trading system – which Washington State is already considering. The EPA regulation notes that if states are working alone, they have until June 2017 to have

Page 20 of 22
their plan approved. However, if states are working together — for example, by establishing or joining a regional cap-and-trade system — then they have until June 2018 to submit their plan. The Canadian province of Ontario has also announced plans to develop a linkage-ready cap-and-trade system.
LESSONS:
1. Instituting cap-and-trade regulations often requires significant political support from a wide range of environmental and business groups. California has seen a number of political and legal challenges emerge from a wide variety of groups on the left discontented by the use of market mechanisms, and offsets in particular, for compliance.
2. In the absence of overarching national legislation, which would be preferable on efficiency and leakage grounds, it remains possible to progress with action on pricing carbon and demonstrate the ability of markets to uncover emissions reductions. Many hope that California will act as a test-case for cap and trade in the United States.
Author Acknowledgements:
If you have any comments or suggestions for this case study, please do not hesitate to contact lead authors: CDC Climat Research co-authors: Lara Dahan ([email protected]) & Marion Afriat ([email protected])
EDF co-authors: Katherine Rittenhouse ([email protected]), Daniel Francis ([email protected]) & Peter Sopher ([email protected])
IETA co-authors: Katie Kouchakji ([email protected]) & Katie Sullivan ([email protected])
CDC Contact: Emilie Alberola ([email protected])
EDF Contact: Daniel Francis ([email protected])
IETA contact: Katie Sullivan ([email protected])
CDC Climat Research 47 rue de la Victoire, 75009, Paris, France
Environmental Defense Fund 18 Tremont Street, Suite 850, Boston, MA 02108 United States
IETA 350 Adelaide Street West - 3rd Floor Toronto, Ontario Canada M5V 1R8
The authors would like to thank Emilie Alberola, Ruben Lubowski, Erica Moorehouse and Gernot Wagner for very helpful comments and information for this case study. We take full responsibility for any remaining errors.
Disclaimer: The authors encourage readers to please contact the CDC Climat Research, EDF and IETA contacts with any corrections, additions, revisions, or any other comments, including any relevant citations. This will be invaluable in strengthening and updating the case studies and ensuring they are as correct and informative as possible.
REFERENCES 1 ARB, First update to the Climate Change Scoping Plan (Scoping Plan) 2014, arb.ca.gov, May 2014, 2 Energy Information Administration (EIA) 2014, California State Profile and Energy Estimates Available at: eia.gov 3 CARB, 2000 to 2012 Inventory by Scoping Plan category, summary, 24 March 2014, Available at: http://www.arb.ca.gov/cc/inventory/data/tables/ghg_inventory_scopingplan_00-12_2014-03-24.pdf 4 CARB, 2012. California Greenhouse Gas Emission Inventory. Available at: arb.ca.gov 5 California Assembly Bill No. 32 (AB32) Chapter 488 An act to add Division 25.5 (commencing with) Section 38500 to the Health and Safety Code relating to air pollution Part 3 (38505) pg89 Available at: leginfo.ca.gov 6 AB32, Part 2, 3, 4

Page 21 of 22
7 Government of Québec, 2013. Regulation Respecting a Cap-and-trade System for Greenhouse Gas Emission Allowances (C&T): Technical Overview published in 2013 (Québec Cap-and-trade Technical Overview 2013) Available at: mddep.gouv.qc.ca 8 Scoping Plan, 2014 9 Scoping Plan 2014 10 Scoping Plan 2014 11 Scoping Plan, 2014. Page 6. 12 California Air Resources Board Final Regulation Order Article 5: California Cap on Greenhouse Gas Emissions and Market Based Complaince Mechanisms to Allow for the use of Compliance Instruments Issued by Linked Jurisdictions adopted 2011 (CARB Cap-and-Trade, 2011. ) last updated Janurary 2015. Available at: arb.ca.gov 13 California Environmental Quality Act (CEQA) Statute Guidelines, 2012. Available at : resources.ca.gov 14 California Court of Appeal, Our Children’s earth foundation vs California air resources Board case, 23 February 2015, Available at: arnoldporter.com 15 CARB Cap-and-Trade, 2011. Subarticle 7 16 California Air Resources Board California Cap-and-Trade Program and Quebec Cap-and-Trade System November 2014 Joint Auction 1 Summary Results Report December 3 2014 Available at: arb.ca.gov p.1 17 California Environmental Protection Agency Air Resources Board, 2014. California greenhouse Gas emission Inventory :2000-2012. Available at: arb.ca.gov, May 2014 18 Environmental Protection Agency (EPA) 2014 Federal Register Vol. 79 No. 117 Wednesday June 18 2014 Carbon Pollution Emission Guidelines for Existing Stationary Sources: Electric Utility Generating Units Proposed Rules Proposed Rules 19 EPA Federal Register, 2014. pg. 34832 20 EPA Federal Register, 2014. pg. 34847 21 EPA Federal Register, 2014, pg. 34838 22 EPA, 2014, pg. 34854 23 EPA, 2014, pg. 34838 24 EPA, 2014, pg. 34838 25 CARB Cap-and-Trade, 2011. Subarticle 5; §95812(c)(1) 26 CARB Cap-and-Trade, 2011. Subarticle 5; §95852(a)(1) 27 California Environmental Protection Agency Air Resources Board 2015 Information for Entities That Take Delivery of Fuel Purchased into the Cap-and-Trade program beginning January 1 2015. Available at: arb.ca.gov 28 CARB Cap-and-Trade, 2011. Subarticle 7; §95855(a)(2) 29 CARB Cap-and-Trade, 2011. Subarticle 7; §95853 30 CARB Cap-and-Trade, 2011. Subarticle 6; §95857(b)3 31 CARB Cap-and-Trade, 2011. Subarticle 5; §95856(d)(3) 32 CARB Cap-and-Trade, 2011, Subarticle 8, §95870 33 CARB Cap-and-Trade, 2011, Subarticle 8, §95870 34 CARB Cap-and-Trade, 2011, Subarticle 8, §95870-(e)(2) 35 CARB, Cap-and-Trade, 2011, Subarticle 8, Table 8-1 36 CARB Cap-and-Trade, 2011. Subarticle 8; §95870 Table 8.1 37 CARB Cap-and-Trade, 2011. Subarticle 8; §95870 Table 8.1 38 CARB, Cap-andTrade, 2011, Subarticle 9, §95891(b) 39 CARB, Cap-andTrade, 2011, Subarticle 9, §95891(c) 40 CARB, Cap-andTrade, 2011, Subarticle 8, §9870(e)(3) 41 CARB, Cap-andTrade, 2011, Subarticle 8, §9870(d)(1) 42 CARB, Cap-andTrade, 2011, Subarticle 9, §9892 43 CARB Cap-and-Trade, 2011. Subarticle 9; §95892(c) 44 CARB Cap-and-Trade, 2011. Subarticle 9; §95892(d)(3) 45 CARB Cap-and-Trade, 2011. Subarticle 9; §95893(c) 46 CARB Cap-and-Trade, 2011. Subarticle 9; §95893(a) 47 CARB Cap-and-Trade, 2011. Subarticle 8; §98978 and, Subartcile 9 §95894. 48 CARB Cap-and-Trade, 2011. Subarticle 10; §95910(c)(1)(d) 49 CARB Cap-and-Trade, 2011. Subarticle 10; §95910(a)(2) 50 CARB Cap-and-Trade, 2011. Subarticle 8; §95870(b) 51 CARB Cap-and-Trade, 2011. Subarticle 10; §95910(c)(2)(c) 52 CARB Cap-and-Trade, 2011. Subarticle 10; §95910(c)(1) 53 CARB Cap-and-Trade, 2011. Subarticle 10; §95911(b)(2) 54 CARB Cap-and-Trade, 2011. Subarticle 10; §95911(a)(1) 55 CARB Cap-and-Trade, 2011. Subarticle 10; §95911(a)(2) 56 CARB Cap-and-Trade, 2011. Subarticle 10; §95911(5)(d)(5) 57 California Cap-and-Trade Program & Quebec Cap-and-Trade System Joint Auction of Greenhoudse Gas Allowances on Novermber 19th 2014. Auction Notice Issued on spetrember 19, 2014 Available at: mddelcc.gouv.qc.ca 58 CARB Cap-and-Trade, 2011. Subarticle 10; §9591(c)(3)(c) 59 California Cap-and-Trade Program & Quebec Cap-and-Trade System Joint Auction of Greenhoudse Gas Allowances on Novermber 19th 2014. Auction Notice Issued on spetrember 19, 2014 Available at: mddelcc.gouv.qc.ca 60 CARB Cap-and-Trade, 2011. Subarticle 8; §95870(b)(3). 61 Edmund Brown Jr, Governor State of California ‘2015-2016 Governor’s Budget Summary Cap-and-Trade Expenditure’ Plan. Available at: ebudget.ca.gov 62 CARB Cap-and-Trade, 2011. Subarticle 8; §95870(b)(3). 63 California Global Warming Solutions Act 2006 Senate Bill 535 Chapter 830 Section 2. 39713(b). 64 Scoping Plan, 2014. Chapter IV p. 129. 65 California Environmental Protection Agency, Air resources Board (CARB, EPA) 2015, Cap and Trade Expenditure Plan Auction Proceeds Budget Appropriations Available at: arb.ca.gov 66 CARB, EPA 2015 67 CARB, EPA 2015 68 CARB Cap- and-Trade, 2011. Subarticle 7; §95854(b) 69 CARB Cap- and-Trade, 2011. Subarticle 7; §95854(b) 70 California Health and Safety Code Section 38562(d)1 and (2) Available at: leginfo.ca.gov CARB Cap-and-Trade, 2011. Subarticle 14; §95990(c) 72 CARB Cap- and-Trade, 2011. Subarticle 14, §95990-(k) 73 ARB website, arb.ca.gov, February 2015. 74 CARB Cap-and-Trade, 2011. Subarticle13; §95970-§95988.

Page 22 of 22
75 CARB Cap-and-Trade, 2011. Subarticle13; §95973(a)(2)(C) 76 ARB website, potential new compliance offset protocol rice cultivation projects, arb.ca.gov, December 2014. 77 CDC Climat Research 2015, Personal Communication with Curt Barry – Senior Writer, Inside Washington Publishers 78 Climate Action Reserve 2015, Mexico Ozone Depleteing Substances Project Protocol. Public Comment Workshop Available at: climateactionreserve.org February 26th 2015. 79 CARB Cap-and-Trade, 2011. Subarticle13; §95972(b). 80 CARB Cap-and-Trade, 2011. Subarticle13; §95972(c). 81 CARB Cap-and-Trade, 2011. Subarticle13; §95971. 82 CARB Cap-and-Trade, 2011. Subarticle12; §95942(c) 83 CARB Cap-and-Trade, 2011. Subarticle14; §95991 84 CARB Cap-and-Trade, 2011. Subarticle14; §95993(a) 85 CARB Cap-and-Trade, 2011. Subarticle 7; §95854(c) 86 ARB, Update on the compliance offset program presentation, arb.ca.gov, July 2014 87 Governors’ Climate and Forest Task Force (GCF) (2012). “About GCF.” Available at gcftaskforce.org. 88 Memorandum of Understanding on Environmental Cooperation Between the State of Acre of the Federal Republic of Brazil, the Statre of Chiapas of the United Mexican States, and the State of California of the United States of America (2010), socioambiental.org. 89 Brunello, Tony (September 2011). “REDD Offsets Working Group.” Available at: stateredd.org. 90 Electric Power Research Institute (EPRI) (April 2011). “Overview of the California Greenhouse Gas Offsets Program.” Available at: globalclimate.epri.com. 91 Climate Action Reserve 2015. 92 CARB Cap-and-Trade, 2011. Subarticle13; §95985(h)(1)(B) and (h)(2)(A). 93 See for example, IETA comments to ARB on AB 32 Program Rules During Second Commenting Period, September 27 2011. Available at: ieta.memberclicks.net. 94 CARB Cap-and-Trade, 2011. Subarticle13; §95985(b) 95 CARB Cap-and-Trade, 2011. Subarticle13; §95985(c) 96 CARB Cap-and-Trade, 2011. Subarticle13; §95985(g) 97 CARB, Final determination Air Resources board compliance offset investigation destruction of ozone depleting substances, Available at: arb.ca.gov, November 2014. 98 CARB, Cap-and-trade, 2011, Subarticle13 ; §95985(c)(2) 99 CARB Cap-and-Trade, 2011. Subarticle13; §95985(c)(4) 100 CARB Cap-and-Trade, 2011. Subarticle13; §95983(b) 101 CARB Cap-and-Trade, 2011, Subarticle13; §95983(c) 102 CARB Cap-and-Trade, 2011. Subarticle10; §95911(b)(6) 103 CARB Cap-and-Trade, 2011. Subarticle10; §95913 104 CARB Cap-and-Trade, 2011. Subarticle 8; §95870(a) 105 CARB Cap-and-Trade, 2011. Subarticle10; §95913 106 CARB Cap-and-Trade, 2011. Subarticle10; §95870(b) 107 CARB Cap-and-Trade, 2011. Subarticle10; §95870(I) 108 CARB Cap-and-Trade, 2011. Subarticle 5; §95831(a)(4) 109 CARB Cap-and-Trade, 2011. Subarticle 5; §95831(a)(2) 110 CARB Cap-and-Trade, 2011. Subarticle 11; §95920(c) 111 CARB Cap-and-Trade, 2011. Subarticle 11; §95920(d)(1) 112 CARB Cap-and-Trade, 2011. Subarticle 11; §95920(c)(1) 113 CARB Cap-and-Trade, 2011. Subarticle 11; §95920(e) 114 CARB Cap-and-Trade, 2011. , Subarticle 11; §945921 115 CARB Cap-and-Trade, 2011. Subarticle 11; §95922(c) 116 CARB Cap-and-Trade, 2011. Subarticle 11; §95920(c) 117 CARB Cap-and-Trade, 2011. Subarticle 7; §95856(b)(A) & (b)(B) - Another exception is if an allowance is purchased from the Allowance Price Containment Reserve. 118 CARB Cap-and-Trade, 2011. Subarticle 11; §95856(b)(A) and (b)(B) 119 Mandatory Reporting of Greenhouse Gas Emissions Regulation, 2008. Available at: arb.ca.gov 120 California Air Resources Board Final Regulation Order Subchapter 10: Climate Change Amendments to the regulation for the mandatory reporting of greenhouse gas emissions (MRR) 2014 Article 2: Mandatory Greenhouse Gas Emissions Reporting Subqrticle: 1. General Requirements for Greenhouse Gas Reporting. (CARB GHG Reporting 2014) with effect from January 1st 2015. Available at:arb.ca.gov 121 CARB GHG Reporting, 2014. 122 California Code of RegulationsTitle 17 Proposed Regulation Order. Article 3: Fees for Sources of Greenhouse Gas EmissionsSection §95200 et seq. 123 CARB GHG Reporting 2014 Subarticle 1; §95101(a)(C). 124 CARB Cap-and-Trade, 2011. , Subarticle 7; §9857(b) 125 Scoping Plan 2014. Page.93 126 U.S Supreme Court denied the original adoption in 2014. 127 California Environmental Protection Agency Air resources Board 2014. Air Resources Board Preliminary Draft Staff Report SB375 Greenhouse Gas Emissions Reduction Target update Porcess. August 2014 Available at: arb.ca.gov 128 Scoping Plan,2014 129 US Environmental Protection Agency, Federal Clean Air Act 1970 Section 111(d) 130 Scoping Plan 2014. Page.93 table 131 ARB, 2015. California and Quebec Cap-and-Trade Programs Compliance Instruments Agregated by Type and Account. Released April 2 2015. 132 ARB website, arb.ca.gov, February 2015 133 The 2013-2020 offsets demand is the result of the calculateion of the limited 8% compliance obligation that can be reached by using offsets multiplied by each year emissions cap from 2013-2020. 134 ARB, 2010, Updated Economic Analysis of California’s Climate Change Scoping Plan, March 24 2010, Available at: http://www.arb.ca.gov/cc/scopingplan/economics-sp/updated-analysis/updated_sp_analysis.pdf, p.54. 135 American Carbon Registry, 2012, Compliance offset supply forecast for California’s Cap-and-Trade Program, September 2012, Available at : americancarbonregistry.org 136 CARB Cap-and-Trade, 2011. Subarticle 3; §95812(c)(1)(B) 137 California Energy Almaniac, Available at: energyalmanac.ca.gov 138 CARB Cap-and-Trade, 2011. Subarticle 7; §95852(b)2 139 MRR, 2014. Subarticle 2; §95111